class size in michigan: investigating the risk of being...
TRANSCRIPT

1
2
3
Key FindingsAuthors
The student-teacher ratio substantially understates the number of students per class in all core academic subjects in every grade level.
Many students in Michigan, which has no legal cap on class size, find themselves in especially large classes. In 1st grade, nearly 1 in 20 students has a homeroom of 40 or more students; in 7th grade and 9th grade, more than 1 in 10 students has at least one core course of that size.
Risk of large classes in Michigan is not evenly distributed across race, economic level, or urbanicity:
a. Black 9th graders are over three times as likely as their white peers to be insuch large classes;
b. At every grade level, students receiving meal subsidies are 60 to 70 percentmore likely to be in large classes than their peers not receiving subsidies;
c. Nearly one in four 9th graders in urban districts are in a class of 40 or morestudents, while only 1 in 50 students in rural districts find themselves insuch classes.
Brian Jacob, University of Michigan
Rene Crespin, University of Michigan
CJ Libassi, University of Michigan
Susan M. Dynarski, University of Michigan
Class Size in Michigan: Investigating the Risk of Being in Very Large ClassesFor the first time, we use a unique administrative dataset
to measure class size directly, rather than using the blunt
proxy of student-teacher ratio. This approach reveals that
many students in Michigan are in very large core classes.
EPI Policy Brief #5 | September 2016 page 1
IntroductionThe number of students in a classroom has long concerned parents, teachers,
and policymakers. This aspect of a student’s educational experience has
always seemed to be an important marker of school quality, and a long line
of research has confirmed this intuition.1 However, a common proxy for class
size, the student-teacher ratio (STR), leaves much to be desired. The student-
teacher ratio expresses the number of full-time equivalent teachers (FTEs)
in terms of the number of students to whom a teacher would be assigned
if all teachers were in charge of the same number of students in a school or
district. Specifically, the student-teacher ratio takes the number of students in
a school or district and divides it by the number of teachers. Though federal
statistics are careful to distinguish between class size and student-teacher
ratios,2 families, policymakers, and casual observers would not be blamed for
thinking the two are synonyms, given the frequency with which the two are
treated as interchangeable in policy discourse and academic research.3
The fundamental problem with student-teacher ratios is that they measure people and not classrooms. There are many adults in a school building with the title of teacher who nevertheless do not do the type of classroom work we imagine when attempting to measure the number of students in the typical math or reading classroom. Though their work is vital to the success of students, teachers such as reading specialists or special education teachers often work with small, specialized groups of students in an intensive way for some part of the day and do not preside over a traditional classroom setting. Thus, for the purpose of measuring the typical class size in a traditional setting for core subjects, a statistic many families or policymakers might want to know, including such teachers will artificially depress the class size we are interested in.
But this is just one drawback of the student-teacher ratio. Even if you overcome the many ambiguities about who counts as a teacher, the resulting STR is just an average class size. However, unlike most averages, the STR does not offer any other information about the distribution of class size throughout a school, district, or state. There are many questions we might ask about class sizes that could be answered if we were measuring classrooms and not people. For example: What is the maximum or minimum class size in a school? How much do classes vary in size within a district? Do students of color or students in poverty have bigger or smaller classes than their peers?
Using administrative data, we are able to examine these questions for the state of Michigan. To examine the distribution of class sizes in Michigan
EPI Policy Brief #5 | September 2016 page 2

Public Schools in the 2014-15 school year we use the extremely rich Teacher Student Data Link (TSDL) database from the Michigan Student Data System (MSDS). This student-level data provides detailed information that allows us to identify students’ courses, sections, teachers, and grade performance. Thus, we are able to measure class size directly, and need not rely just on student-teacher ratios. We also complement this data with demographic information, achievement on standardized assessments from the year prior, and school-level characteristics.4
This analysis produces several findings of interest. First, the student-teacher ratio understates the number of students in a student’s core academic courses for virtually all students. When measured directly, the overwhelming majority of students have average core class sizes that exceed Michigan’s student-teacher ratio of 18.1. In 1st grade, 95% of students are in classrooms bigger than the state STR; 98% of 7th graders and 98% of 9th grade students have average core class sizes in excess of the state STR. And, in many cases, students find themselves in core classes much larger than the statewide STR; the mean core class sizes for 1st graders in our sample is 25.8, nearly 8 students greater than the STR for Michigan. In 7th and 9th grade the student-teacher ratio understates the average student’s experience in core classes by more than 10 students, with average core class sizes of 29.9 for both grades.
Next, we find that a considerable proportion of students are exposed to especially large class sizes, which we define as those having at least 40 students. In 1st grade, nearly 1 in 20 students is in a class of 40 or more. In 7th grade and 9th grade, more than 1 in 10 students has at least one core course of that size.
Finally, we find that exposure to extremely large classes is not evenly distributed across race and income groups or regions throughout the state. In particular, traditionally underrepresented minorities face a particularly high risk of being in classes of 40 or more, with Black 9th graders over three times as likely as their white peers to be in such large classes.
Students in urban areas and low-income students are similarly disadvantaged when it comes to class size.
Unfortunately, the Michigan Department of Education recently announced its intention to discontinue collection of the transcript data that makes direct measurement of class size possible.5 Without such data, our only measure of class size is the student-teacher ratio. What's more: without continued collection of the data, it is impossible to track trends in class size over time.
Measuring Class Size Directly in the State of Michigan
In the 2013-14 school year, the most recent year for which data are available, the National Center for Education Statistics reported a pupil-teacher ratio for the state of Michigan of 18.1 to 1, about two students more than the national STR. The state first reached this 10-year high in 2011 after a steady increase throughout the recession years and has stayed at this level of STR since (see Figure 1). Given this recent uptick in STR, its shortcomings as a proxy for class size are of particular concern. Without more information, it’s impossible to know how the growth in class size is distributed. Are all classes getting larger by a small amount or are just some classes driving the growth? For example, districts may respond to a decrease in revenue by dramatically increasing the size of gym class, but holding math class sizes steady. Such a choice, which would have different educational implications than increasing every class type by a modest amount, is impossible to observe with traditional student-teacher ratio measures.
Fortunately, beginning in 2010-11, the Michigan State Department of Education began collecting classroom-level data, allowing us to examine the distribution of class sizes in Michigan Public Schools. States and school districts rarely keep data on enrollment at the class level, thus our data allow us a rare glimpse at the true dynamics of class size in the state. We also complement this data with school
EPI Policy Brief #5 | September 2016 page 3

Stud
ent-T
each
er R
atio
Fall of Academic Year
14.5
15.0
15.5
16.0
16.5
17.0
17.5
18.0
18.5
2013201220112010200920082007200620052004
Figure 1: Student Teacher Ratios Increased During the Recession
Michigan United States
Note: Teachers reported in full-time equivalents. Source: Author’s tabulations from U.S. Department of Education, National Center for Education Statistics, The NCES Common Core of Data (CCD), State Nonfi scal Public
Elementary/Secondary Education Survey Data. Includes the latest revised versions of data as of 2/1/16. http://nces.ed.gov/ccd/stnfi s.asp
characteristics, student demographic information, and achievement on standardized assessments from the prior year. Taken together, these data allow us to measure class size directly and see how those class sizes vary by student and school characteristics.
Using this information, we are able to overcome the shortcomings of the student-teacher ratio in a few ways. First, we focus only on core academic classes (English, Mathematics, Social Science, and Science), allowing us to assess the number of students in classrooms we might expect to be most central to a
student’s educational success. We are also able to remove the eff ect of non-classroom teachers, who, by being assigned to a very small number of students, artifi cially defl ate the reported student-teacher ratio. Third, we are able to examine the extremes of class size in the state. With this ability, we choose to analyze the number of students in core classes of 40 or more, an especially large class size. Finally, we are able to measure how class sizes are distributed by student and school characteristics, such as race, economic disadvantage, urbanicity, and grade level.6
EPI Policy Brief #5 | September 2016 page 4
Legend
Number of Students in Classrooms
Median25th Percentile5th Percentile 75th Percentile 95th Percentile
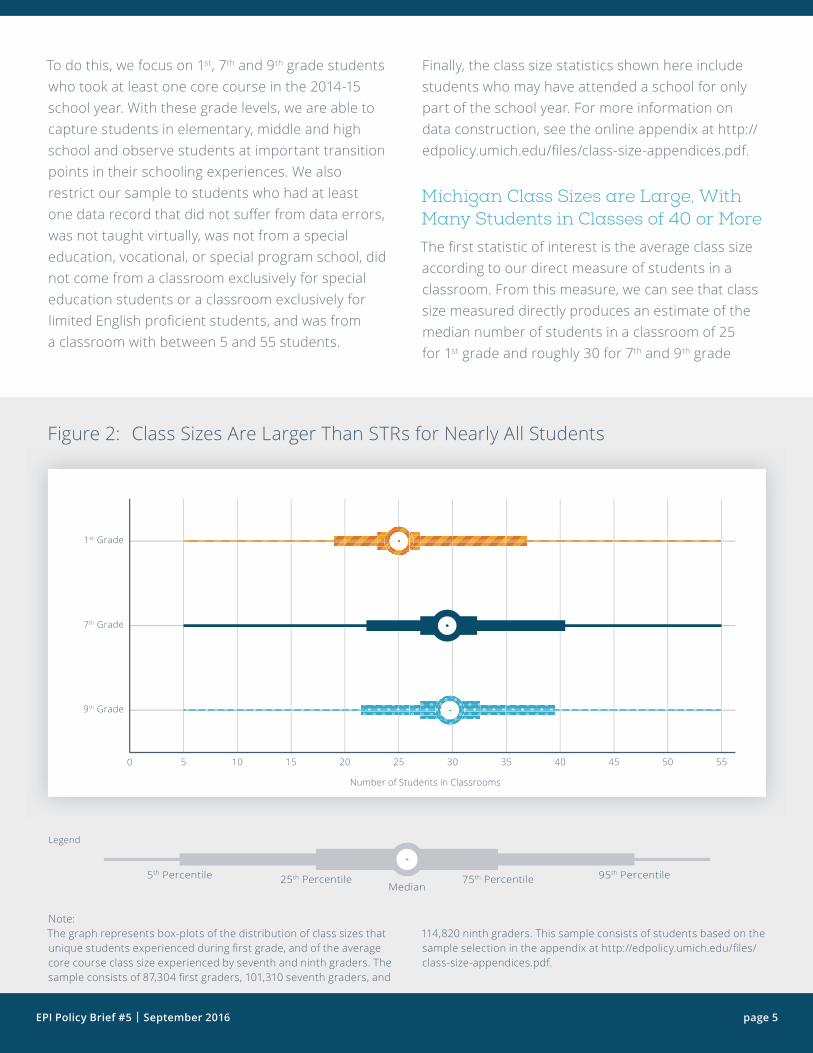
Figure 2: Class Sizes Are Larger Than STRs for Nearly All Students
Note: The graph represents box-plots of the distribution of class sizes that unique students experienced during fi rst grade, and of the average core course class size experienced by seventh and ninth graders. The sample consists of 87,304 fi rst graders, 101,310 seventh graders, and
114,820 ninth graders. This sample consists of students based on the sample selection in the appendix at http://edpolicy.umich.edu/fi les/class-size-appendices.pdf.
0 5 10 15 20 25 30 35 40 45 50 55
9th Grade
7th Grade
1st Grade
To do this, we focus on 1st, 7th and 9th grade students who took at least one core course in the 2014-15 school year. With these grade levels, we are able to capture students in elementary, middle and high school and observe students at important transition points in their schooling experiences. We also restrict our sample to students who had at least one data record that did not suff er from data errors, was not taught virtually, was not from a special education, vocational, or special program school, did not come from a classroom exclusively for special education students or a classroom exclusively for limited English profi cient students, and was from a classroom with between 5 and 55 students.
Finally, the class size statistics shown here include students who may have attended a school for only part of the school year. For more information on data construction, see the online appendix at http://edpolicy.umich.edu/fi les/class-size-appendices.pdf.
Michigan Class Sizes are Large, With Many Students in Classes of 40 or More
The fi rst statistic of interest is the average class size according to our direct measure of students in a classroom. From this measure, we can see that class size measured directly produces an estimate of the median number of students in a classroom of 25 for 1st grade and roughly 30 for 7th and 9th grade
EPI Policy Brief #5 | September 2016 page 5

Perc
ent o
f Stu
dent
s w
ith a
t Lea
st O
ne C
lass
Siz
e of
40
or M
ore
0
2
4
6
8
10
12
14
9th Grade7th Grade1st Grade
Note: The graph represents the fraction of students in each grade that have at least one core classroom with 40+ students. For fi rst graders, classroom refers to students' homeroom. For seventh and ninth graders, we check if a student has at least one large core subject classroom (English, Math, Science, and/or Social Science). See notes in Figure 2 for sample description. Standard Errors represented in error bars.
Figure 3: Many Students Are in Classes of 40 or More
(see Figure 2). In all cases, this is quite a jump from even the highest student-teacher ratio estimates of 18 for 2013-14 in Michigan. That is, STR produces a proxy for class size that only the luckiest students in Michigan will actually experience. Indeed, using our measure of class size, we fi nd than more than 95% of students at every grade level have an average core class size that exceeds the student-teacher ratio for
the state of Michigan. This disparity between the STR and our direct measure of class size confi rms that the NCES pupil-teacher ratio includes many teachers who are assigned to very few or no students.
Michigan, unlike many other states, has no legal cap on the size of classes, and, as a result, some students may experience especially large classes. To examine the risk of students fi nding themselves in one of these classes, we examine the frequency with which students have at least one core class of 40 or more students. As Figure 2 shows, the 95th percentile of the class size distribution for the state is 37 for 1st grade, 40.5 for 7th grade and 39.3 for 9th grade. In each case, we can see that a class of 40 or more is not only large in absolute terms, but also relative to class sizes throughout the state, and this is true at every grade level.
Given that the mean class size in 1st grade is so much smaller than the other grades we study, we might not be surprised to fi nd that 1st graders are the least likely to have at least one class of 40 students. As Figure 3 shows, 4.2% of this youngest group fi nd themselves in classes of 40 or more. By contrast, 10.2% and 11.6% of 7th and 9th graders, respectively, have at least one class of 40 or more students.
With the wide distribution of class sizes, one might naturally wonder what characteristics correlate with an especially high probability of a student fi nding herself in an especially large classroom. We can begin to answer this question by examining the risk of being in a large class for students based on where they go to school or what their racial or economic background is. For example, as Figure 4 shows, the chance of ending up in a classroom of 40 or more students varies considerably by the urbanicity of a student’s school. While nearly a quarter of 9th graders in urban districts are at risk of being in a class of 40 or more students, only 1 in 50 students in rural districts fi nd themselves in such classes. Similarly, 1st graders in urban schools have approximately the same risk of being in especially large classes as Michigan 7th graders statewide.
EPI Policy Brief #5 | September 2016 page 6

Figure 4: Students in Urban Schools Have a Much Higher Chance of Being in 40+ Classes
Perc
ent o
f Stu
dent
s w
ith a
t Lea
st O
ne C
lass
Siz
e of
40
or M
ore
0
5
10
15
20
25
30
9th Grade7th Grade1st Grade
Note: The graph represents the fraction of students in each grade/urbanicity that have at least one core classroom with 40+ students. For fi rst graders, classroom refers to their homeroom. For seventh and ninth graders, we check if a student has at least one large core subject classroom (English, Math, Science, and/or Social Science). See notes in Figure 2 for sample description. Standard Errors represented in error bars.
City, suburban, and rural school students make up 21.4%, 42.3%, and 36.3% of all fi rst graders in the sample; 18.1%, 47.3%, and 34.6% of all
seventh graders in the sample; and 17.7%, 48.4%, and 33.9% of all ninth graders in the sample.
While schools located in city, suburban, and rural locales make up 23.9%, 38.5%, and 37.7% of the schools serving fi rst graders in the sample; 23.2%, 30.9%, and 45.9% of the schools serving seventh graders in the sample; and 17.1%, 31.8%, and 51.1% of the schools serving ninth graders in the sample.
Suburb City Town/Rural
Students in schools in towns or rural areas are the least likely to be in large classes at every grade level, while suburban students consistently have a greater risk than students in towns and rural areas, but a lower risk than their peers at urban schools.
As noted earlier, the class size measures we calculate here include students who attended a school for
only part of the school year. As a result, schools that experience more mobility will tend to have larger class sizes than would be the case if we only included
"stable" students in our calculations. For most of the results we present in this brief, this distinction is not important. For urban schools, however, if we calculate class sizes based solely on stable students,
EPI Policy Brief #5 | September 2016 page 7

Figure 5: Students in the Highest Poverty Schools Face a Disproportionate Risk of Being in a Class of 40+
Perc
ent o
f Stu
dent
s w
ith a
t Lea
st O
ne C
lass
Siz
e of
40
or M
ore
0
5
10
15
20
25
30
9th Grade7th Grade1st Grade
Lowest Poverty Schools Highest Poverty Schools
Note: The graph represents the fraction of students in each grade/school poverty concentration that have at least one core classroom with 40+ students. We identify large classrooms as those that have 40 or more students. For fi rst graders, classroom refers to their homeroom. For seventh and ninth graders, we check if a student has at least one large core subject classroom (English, Math, Science, and/or Social Science). See notes in Figure 2 for sample description. Standard Errors represented in error bars.
The highest poverty schools are those where 75% or more of the student body receives meal subsidies, while the lowest poverty schools are those where 25% or less of the student body receives
meal subsidies. Students in the highest poverty schools make up 21%, 15%, and 10.1% of students in fi rst, seventh, and ninth grade, respectively. While students in the lowest poverty schools make up 21.3%, 24.2%, and 31.0% of students in fi rst, seventh, and ninth grade, respectively.
The highest poverty schools make up 22.4%, 23.3%, and 15.6% of the schools serving fi rst, seventh, and ninth graders in the sample, respectively. And the lowest poverty schools make up 18.5%, 14.7%, and 18.1% of the schools serving fi rst, seventh, and ninth graders in the sample, respectively.
the fraction of students in 40+ classrooms declines notably: from 10.6% to 6.7% for 1st graders, from 17.5% to 14.7% for 7th graders and from 23.0% to 18.8% for 9th graders. In contrast, the percentages for suburban and rural schools do not change much. Given that many of these "mobile" students will have spent a considerable portion of the school year in the classroom, combined with the fact that mobility itself presents a challenge for teachers and school
administrators, it is not clear whether the statistics based on stable students alone are more informative.
Another important characteristic of schools is the socioeconomic status of its students. To examine how exposure to large classes varies by the number of students experiencing economic disadvantage, we compare the lowest poverty schools, those with 25% or less of their students receiving free or reduced-
EPI Policy Brief #5 | September 2016 page 8
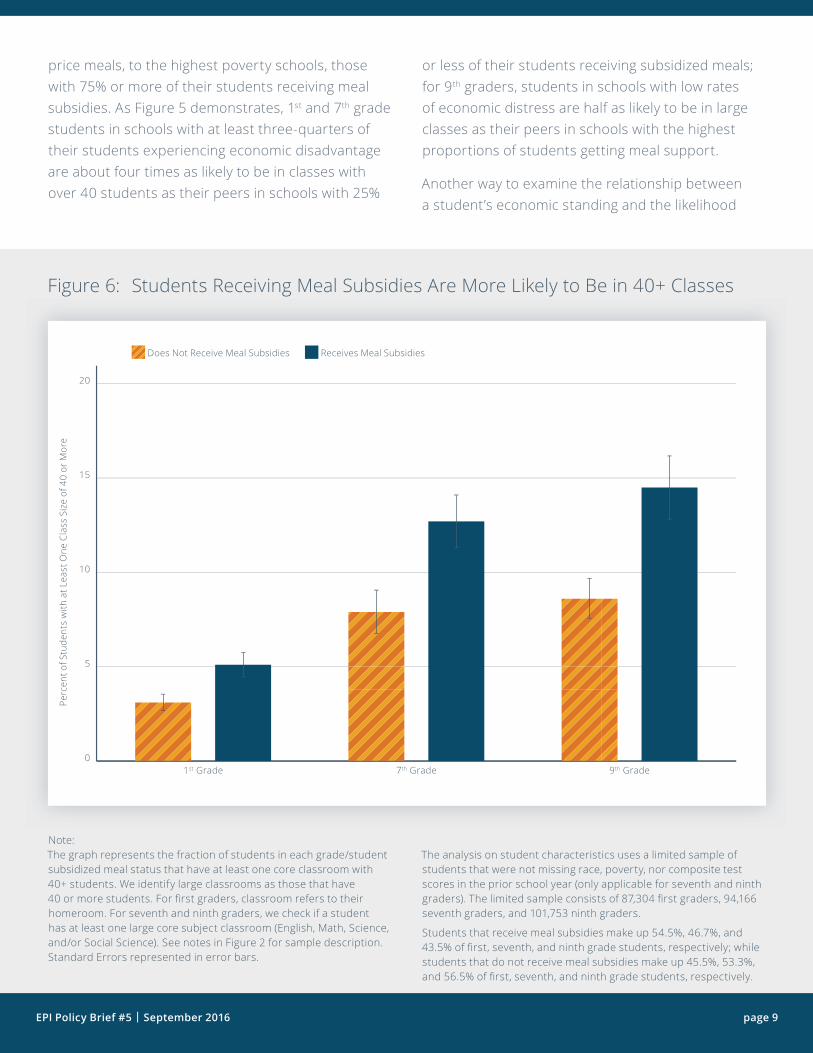
Figure 6: Students Receiving Meal Subsidies Are More Likely to Be in 40+ Classes
Perc
ent o
f Stu
dent
s w
ith a
t Lea
st O
ne C
lass
Siz
e of
40
or M
ore
0
5
10
15
20
9th Grade7th Grade1st Grade
Does Not Receive Meal Subsidies Receives Meal Subsidies
Note: The graph represents the fraction of students in each grade/student subsidized meal status that have at least one core classroom with 40+ students. We identify large classrooms as those that have 40 or more students. For fi rst graders, classroom refers to their homeroom. For seventh and ninth graders, we check if a student has at least one large core subject classroom (English, Math, Science, and/or Social Science). See notes in Figure 2 for sample description. Standard Errors represented in error bars.
The analysis on student characteristics uses a limited sample of students that were not missing race, poverty, nor composite test scores in the prior school year (only applicable for seventh and ninth graders). The limited sample consists of 87,304 fi rst graders, 94,166 seventh graders, and 101,753 ninth graders.
Students that receive meal subsidies make up 54.5%, 46.7%, and 43.5% of fi rst, seventh, and ninth grade students, respectively; while students that do not receive meal subsidies make up 45.5%, 53.3%, and 56.5% of fi rst, seventh, and ninth grade students, respectively.
price meals, to the highest poverty schools, those with 75% or more of their students receiving meal subsidies. As Figure 5 demonstrates, 1st and 7th grade students in schools with at least three-quarters of their students experiencing economic disadvantage are about four times as likely to be in classes with over 40 students as their peers in schools with 25%
or less of their students receiving subsidized meals; for 9th graders, students in schools with low rates of economic distress are half as likely to be in large classes as their peers in schools with the highest proportions of students getting meal support.
Another way to examine the relationship between a student’s economic standing and the likelihood
EPI Policy Brief #5 | September 2016 page 9

Figure 7: Black and Latino Students Are More Likely than White Students to Be in 40+ Classes
Perc
ent o
f Stu
dent
s w
ith a
t Lea
st O
ne C
lass
Siz
e of
40
or M
ore
0
5
10
15
20
25
30
9th Grade7th Grade1st Grade
White Latino Black
Note: The graph represents the fraction of students in each grade/student race group that have at least one core classroom with 40+ students. We identify large classrooms as those that have 40 or more students. For fi rst graders, classroom refers to their homeroom. For seventh and ninth graders, we check if a student has at least one large core subject classroom (English,
Math, Science, and/or Social Science). See notes in Figure 6 for sample description. Standard Errors represented in error bars.
Black, Latino, and White students make up 19.9%, 8.3%, and 66.9% of all fi rst graders in this sample; 17.0%, 6.7%, and 71.7% of all seventh graders in the sample; and 18.2%, 6%, and 71.5% of all ninth graders in the sample.
he or she will be exposed to an especially large classroom is to measure the economic level of the student directly, rather than at the school level. As Figure 6 shows, when measured in this way, the relative risk of being in a large class is not as stark as it is when assessed at the school level. Still, at every grade level, students receiving meal subsidies are several percentage points more likely to be in large classes than their peers not receiving subsidies.
In Michigan, one important predictor of being at risk of being exposed to an especially large class size is race. Figure 7 shows that at every grade level Black students are, by a considerable margin, the most likely to face class sizes in excess of 40 students. In 9th grade, a quarter of Black students are in classes of 40 or more, a rate more than twice that of Hispanic students and over 3 times the proportion of white students in such classes.
EPI Policy Brief #5 | September 2016 page 10

Perc
ent o
f Stu
dent
s w
ith a
t Lea
st O
ne C
lass
Siz
e of
40
or M
ore
0
5
10
15
20
9th Grade7th Grade
Note: The graph represents the fraction of students in each grade/student composite performance group that have at least one core classroom with 40+ students. For seventh and ninth graders, we check if a student has at least one large core subject classroom (English, Math, Science, and/or Social Science). Achievement is based on composite test scores, which were generated by combining standardized math and reading test scores taken the prior school year. The lowest achievement group represents the students that scored in the lowest quartile of the test score distribution in Michigan for their grade, while the highest achievement group represents the students that scored in the highest quartile of test scores in the state for their grade. See notes in Figure 6 for sample description. Standard Errors represented in error bars.
Each grade achievement group does not contain exactly a quarter of students in the sample because we select a specifi c set of students in the data that excludes some students that were part of the test score distribution. In the sample, the lowest and highest achievement categories make up 23.9% and 25.6% of seventh graders, respectively; and 23.3% and 25.9% of ninth graders, respectively.
Figure 8: The Lowest-Achieving Students Are Over Two Times More Likely Than Their Highest-Achieving Peers to Be in 40+ Classes
Lowest Performing Students
Highest Performing Students
More than 1 in 10 Black 1st graders enter classrooms of 40 or more students, while just 1 in 30 Hispanic students and 1 in 50 white students face classes of that size.
Student academic performance is also linked to a student’s likelihood of being in classes of 40 or more. Given the association between a student’s socioeconomic status, race, academic performance, and risk of being in a large class, it is perhaps not surprising to fi nd that students in the lowest performing quartile are much more likely than the highest performing students to be in classes of 40 or more. Of course, these associations may not be the only factors driving diff erences in the share of students facing large classes; trends in academic tracking may also play a role. Whatever the cause, though, 7th graders in the highest-performing quarter of students in the state are half as likely to be in especially large classes as their peers in the lowest-performing quartile (see Figure 8). For 9th graders, the lowest-performing group is two and a half times more likely to be in large classes than their peers in the highest-performing 25% of Michigan students.
Apart from location, socioeconomic status, race, and student achievement level, an important element of a student’s educational experience is the sector of her school. Though the diff erences between charter and traditional public schools are much-discussed, we fi nd little evidence of a systematic diff erence between the two sectors in terms of risk for students of fi nding themselves in at least one class with 40 or more students (see Figure 9). While in 1st grade, charter school students are more likely to face a large class, charter students in 7th
EPI Policy Brief #5 | September 2016 page 11

Figure 9: Charter and Traditional Public Schools Do Not Vary Much in Risk of 40+ Classes
Perc
ent o
f Stu
dent
s w
ith a
t Lea
st O
ne C
lass
Siz
e of
40
or M
ore
0
2
4
6
8
10
12
14
9th Grade7th Grade1st Grade
Charter Schools Traditional Public Schools
Note: The graph represents the fraction of students in each grade/school sector that have at least one core classroom with 40+ students. We identify large classrooms as those that have 40 or more students. For fi rst graders, classroom refers to their homeroom. For seventh and ninth graders, we check if a student has at least one large core subject classroom (English, Math, Science, and/or Social Science). In the sample, the traditional public school category includes 91.5%, 93.9%, and 94.5% of students in grades one, seven, and nine,
respectively. While the charter school category includes 8.5%, 6.1%, and 5.5% of students in grades 1, 7, and 9, respectively. See notes in Figure 2 for sample description. Standard Errors represented in error bars.
Traditional public schools make up 89.3%, 85.1%, and 87.2% of schools serving fi rst, seventh, and ninth graders in the sample, respectively; while charter schools make up 10.6%, 14.9%, and 12.8% of schools serving fi rst, seventh, and ninth graders, respectively.
and 9th grade are less likely than their peers at traditional public schools to face a class over 40.
Taken together, we can see that many factors traditionally seen as risk factors for negative student outcomes also have a strong association with an outsized chance of being in especially large classes. These factors, such as race, urbanicity, and socioeconomic status, however, are not the whole
story. First, as the fairly high rate of large classes in suburban areas suggests, it is not only the traditionally marginalized who fi nd themselves in classes of 40 or more; large classes are a statewide phenomenon, facing students of many races and in many locations. Second, these many factors are interrelated, and so a simple look at the association between any one factor and the chance of being in
EPI Policy Brief #5 | September 2016 page 12

Figure 10: School Poverty Rate Still Matters for Risk of 40+ Classes After Controlling for Urbanicity
Perc
ent o
f Stu
dent
s w
ith a
t Lea
st O
ne C
lass
Siz
e of
40
or M
ore
1st Grade 7th Grade 9th Grade
0
5
10
15
20
25
30
CitySuburbTown/Rural CitySuburbTown/Rural CitySuburbTown/Rural
Lowest Poverty Schools Highest Poverty Schools
Note: The graph represents the fraction of students in each grade/urbanicity/school poverty concentration that have at least one core classroom with 40+ students. For fi rst graders, classroom refers to their homeroom. For seventh and ninth graders,
we check if a student has at least one large core subject classroom (English, Math, Science, and/or Social Science). See notes in Figures 2, 4, and 5 for sample descriptions.
especially large classes can be misleading without accounting for the eff ect of the other factors.
Disentangling Risk Factors for Being in Especially Large Classes
Given that the student and school characteristics explored above are correlated, one might expect that, for example, part of what drives diff erences in class size for students of diff erent achievement
levels is sorting by income level. Because these correlations mean that diff erent mechanisms may be at work behind the diff erential risk of being in especially large classes that we observe, it is helpful to compare students with diff erent subsets of these characteristics to each other.
Figure 10 is an example of just such an analysis. Because we might be concerned that the rate of economic disadvantage at a school and its urbanicity
EPI Policy Brief #5 | September 2016 page 13

Figure 11: There Are Few Diff erences Within Racial Groups Between Students of Diff erent Meal Subsidy Statuses
Perc
ent o
f Stu
dent
s w
ith a
t Lea
st O
ne C
lass
Siz
e of
40
or M
ore
1st Grade 7th Grade 9th Grade
0
5
10
15
20
25
30
WhiteLatinoBlack WhiteLatinoBlack WhiteLatinoBlack
Does Not Receive Meal Subsidy Receives Meal Subsidy
Note: The graph represents the fraction of students in each grade/race group/student subsidized meal status that have at least one core classroom with 40+ students. For fi rst graders, classroom refers to their homeroom. For seventh and ninth
graders, we check if a student has at least one large core subject classroom (English, Math, Science, and/or Social Science). See notes in Figures 2, 6, and 7 for sample descriptions.
are related, we can begin to disentangle the individual associations between each characteristic and class size by examining diff erences between high- and low-poverty schools within each urban area. From this, we can see that at every grade level, students in high-poverty schools in both the city and suburbs are much more likely than their peers in low-poverty schools to be in classes of 40 or more.
Indeed, in the 22 elementary and 11 middle schools in urban areas with less than 25% of their students
receiving subsidized meals, virtually no 1st or 7th grade students are in classes of 40 or more students. The story is fairly similar in the suburbs, where 27.8% of 7th graders in high-poverty schools have at least one core class of 40 or more, while 5.5% of their peers in low-poverty schools are in especially large classes. By contrast, in rural schools, 1st and 7th graders in low-poverty schools are actually more likely than their peers in the highest poverty schools to fi nd themselves in especially large classes, though
EPI Policy Brief #5 | September 2016 page 14

Figure 12: Gaps in Risk of 40+ Classes Come From Between- Rather Than Within-School Sorting
Diff
eren
ce in
ris
k of
bei
ng in
40+
cla
ss (i
n pe
rcen
tage
poi
nts)
0
5
10
15
20
Lowest – HighestAchievement Diff.
Meal Subsidy –No Subsidy
Latino –White Diff.
Black –White Diff.
0
5
10
15
20
Lowest – HighestAchievement Diff.
Meal Subsidy –No Subsidy
Latino –White Diff.
Black –White Diff.
0
5
10
15
20
Lowest – HighestAchievement Diff.
Meal Subsidy –No Subsidy
Latino – White Diff.
Black –White Diff.
Average Diff erence Average Within School Diff erence
Note: Each bar in the graph represents the diff erence in the fraction of students that have at least one core classroom with 40+ students between the respective groups. For fi rst graders, classroom refers to their homeroom. For seventh and ninth graders, we check if a student has at least one large core subject classroom (English, Math, Science, and/or Social Science). The fi rst bar represents the average diff erence and the second bar represents the within-school diff erence. The specifi ed diff erences are between black-white, Hispanic-white, meal subsidized-not meal subsidized, and lowest-highest achievement students in the sample, by grade. See notes in Figures 2, 6, 7, and 8 for sample descriptions.
1st G
rade
7th G
rade
9th G
rade
neither group faces a particularly high risk of being in such classes.
What does this analysis tell us? If the poverty level of a school had no association with class size except through its association with urbanicity, we would expect to see students in high- and low-poverty schools fi nding themselves in classes of 40 or more at the same rate. Instead, we see quite diff erent proportions of students in especially large classes across school poverty levels, suggesting that the association between poverty and class size is about more than where high-poverty schools are located.
A similar exercise can be done for student-level characteristics. As we saw in Figure 6, students receiving free or reduced-price lunch are more likely to be in especially large classes at every grade level than their peers who are not eligible for meal subsidies. Similarly, Figure 7 showed that Black students are considerably more likely than their white and Hispanic peers to be in classes of 40 or more. Given the association between income level and race, we should also try to separate the contribution of each to a student’s risk of being in an especially large class.
To do this disentangling, we can examine the diff erence in the risk of being in a large class between subsidized meal-eligible and ineligible students of the same race. As with school level characteristics, we can learn more from this exercise if we fi rst think about what we would expect to see if either race or subsidized meal status were the more important risk factor. If it were true, for example,
EPI Policy Brief #5 | September 2016 page 15

To assess the relative influence of within- and between-school sorting by race on the risk of being in an especially large class, we can compare the difference between white and Black students in the proportion students in classes of size 40 or greater to the average difference in between white and Black students within the same school in the proportion of students in these large classes. In the case where the differential risk of being in a large class comes from how schools sort their students, we would expect to see large differences in Black and white students within the same school. Thus, the average within-school difference would be high. By contrast, if sorting across schools were the more important factor, we would expect to see a large overall difference between white and Black students, with very little within-school difference.
Figure 12 reveals this second pattern (i.e., the predominance of across-school sorting rather than within-school sorting), not only for the gap between Black and white students in their risk of being in especially large classes, but also for the gap between Hispanic and white students, between students who receive subsidized meals and those who do not, and between low-achieving and high-achieving students. In each of these cases, the within-school difference between groups is smaller (in most cases much smaller) than the overall differences between the groups. This suggests that racial and economic differences in the risk of being in a class of 40 or more has more to with where students of different races and income levels go to school than with how they are sorted once they are there. This is somewhat less true across student achievement levels, where a larger within-school difference is present. Such within-school sorting by achievement may not be surprising, though, given that schools may track students academically, with more difficult classes that are both smaller in size and disproportionately populated by high-achieving students.
that a student’s race was the only factor that truly put her at risk of being in an especially large class and that any association between a student’s meal subsidy eligibility and landing in a class of 40 or more operated through the association between race and income, then we would expect to see that students of the same race but different meal eligibility status would be in large classes at the same rate. By contrast, if meal subsidy status were more important than race as a risk factor for being in large classes, we would expect to see wide disparities across income groups, even within the same race.
Figure 11 reveals a picture of class size risk that is more consistent with the former story than the latter. Within racial groups at every grade level, the average absolute difference between meal-subsidy-eligible students and those who get no meal support is just one percentage point. The only statistically significant difference across income groups by race is among white 7th graders, where 10% of economically disadvantaged students are in at least one class of 40 or more, while 7% of their more affluent peers are in such classes.
Given the clear importance of race as a risk factor for a student finding herself in a class of 40 or more, it is worth examining the degree to which this phenomenon results from racial sorting of students within or across schools. That is, we might find that across all schools white students are more likely to end up in classes with fewer than 40 students than their Black and Hispanic peers in the same school. This would mean there was racial sorting into classes of different sizes within schools, and would have much different implications than if we found that Black and Hispanic students were more likely to go to schools with many classes of 40 or more. In this latter scenario, how students sort across schools would be a more important determinant of a student’s risk of being in a class of 40 or more than how they sort within their schools.
EPI Policy Brief #5 | September 2016 page 16

Administrative data based on transcripts in Michigan has made recognizing these disparities possible. Unfortunately, the state has recently announced its plan to discontinue this data collection, and thus direct measurement of classroom size will no longer be possible in the state after the current school year. Without legislative caps on class size, Michigan faces a special risk of districts
adjusting to budget cuts through class size increases. Active and accurate monitoring of class sizes through direct measurement of students in classrooms is necessary without such caps. With their discontinuation, it will be difficult to ensure that students, especially those who face disproportionate risk, do not end up in large classes.
ConclusionThe risk of being in especially large classes is an important outcome that is not
available to us when using the common class size proxy of student-teacher ratio. And
yet a class size of 40 or more is an outcome many parents, schools, and districts
would likely want to avoid. What’s more, the risk of being in such classes is not
evenly distributed. Black students, students attending schools in cities, and students
eligible for free or reduced-price lunch at their schools face a disproportionate risk
of being in a class of 40 or more. These disparities are particularly troubling because
numerous studies have confirmed the negative impact of large classes on test scores
and adult outcomes such as college degree completion (see endnote 1 for citations).
EPI Policy Brief #5 | September 2016 page 17

We have discovered some data anomalies relating to Figures 13 and 14, so we have temporarily removed them from the report.

We have discovered some data anomalies relating to Figures 13 and 14, so we have temporarily removed them from the report.

1. Fredriksson, P., Ockert, B., & Oosterbeek, H. (2013). “Long-term effects of class size.” Quarterly Journal of Economics, 128 (1), 249–285. Krueger, A.B. & Whitmore, D.M. (2001). “The effect of attending a small class in the early grades on college-test taking and middle school test results: Evidence from Project STAR.” Economic Journal, 111, 1–28. Joshua Angrist and Victor Lavy (1999). “Using Maimonides' Rule to Estimate the Effect of Class Size on Scholastic Achievement.” The Quarterly Journal of Economics 114 (2): 533-575. Dynarski, Susan, Hyman, Joshua and Diane Whitemore Schanzenbach (2011). “Experimental Evidence on the Effect of Childhood Investments on Postsecondary Attainment and Degree Completion.” Journal of Policy Analysis and Management 32(4): 692–717 (2013)
2. Though student-teacher ratios may be defined in many different ways, the National Center for Education Statistics (NCES) includes only those FTE who are teachers and explicitly guards against its measure being interpreted as class size, defining pupil-teacher ratio in the following way: “The ratio of pupils to teachers within an entity (i.e., state, school district, or school). The district-level pupil/teacher ratio uses the total of pupils and the total FTE number of teachers reported in the schools associated with the school district. The pupil/teacher ratio does not represent class size, but rather is a district-level measure of pupils and teachers.” Source: Glander, Mark. “Selected Statistics from the Public Elementary and Secondary Education Universe: School Year 2013-14. First Look. NCES 2015-151.” National Center for Education Statistics (2015).
3. Indeed, the academic literature relied on student-teacher ratio as a proxy for class size to such an extent that in 2001, Michael Boozer and Cecilia Rouse saw it necessary to develop a framework for understanding the nature of the bias created by the aggregation inherent to STRs. Their study concludes that failing to measure class size directly obscures
End Notes
racial/ethnic differences in class sizes and a potentially important source of the achievement gap between racial and ethnic groups. Source: Boozer, M., & Rouse, C. (2001). Intraschool variation in class size: Patterns and implications. Journal of Urban Economics, 50(1), 163-189.
4. To make the problem of calculating class size in our data more tractable and more representative of the experience of mainstream students, we restrict our sample to first, seventh, and ninth grade students who were enrolled and were recorded as taking at least one course in a Michigan school district during the 2014-15 school year and had at least one data record that met the following criteria: was in a standard homeroom (first graders) or in a standard English, math, science, or social science course (seventh and ninth graders); did not suffer from data errors; was not taught virtually; was not in a special education, vocational, or special program school; classroom was not exclusively for special education students; the classroom was not exclusively for limited English proficient students; and the classroom had between 5 and 55 students. Refer to the appendix at http://edpolicy.umich.edu/files/class-size-appendices.pdf for specific sample restrictions.
5. “New Info on Teacher-Student Data Link for 2015-16.” Michigan Association of School Administrators, Web. 10 June 2016.
6. Though 40 is a somewhat arbitrary choice for a definition of ‘especially large,’ we chose it as a figure that is indisputably large. Our findings are also broadly consistent across many definitions of a large class within several students below or above 40.
EPI Policy Brief #5 | September 2016 page 20

About the AuthorsCitation Instructions: EPI encourages the dissemination of this publication and grants full reproduction right to any part so long as proper credit is granted to EPI. Sample citation,
“Improving on Student-Teacher Ratio: A First Look at a Direct Measure of Class Size in Michigan, Education Policy Initiative Policy Brief #5.”
EPI Mission Statement
Brian Jacob is the Walter H. Annenberg Professor of Education Policy at the University of Michigan. His current research focuses on urban school reform, education accountability programs, teacher labor markets and virtual schooling.
Rene Crespin is a Research Assistant for the Education Policy Initiative.
CJ Libassi is a Research Area Specialist for the Education Policy Initiative.
Susan M. Dynarski is a professor of public policy, education, and economics at the University of Michigan. Her research interests include the effect of charter schools, higher education financing, improving community college student outcomes and the effect of early childhood interventions on adult well-being.
The central mission of the initiative is to engage in applied education policy research. The Education Policy Initiative is a program within the Ford School that brings together nationally-recognized education policy scholars focused on the generation and dissemination of policy-relevant education research. The primary goals of the initiative are to:
• Conduct rigorous research to inform education policy debates in Michigan and nationwide
• Disseminate best practices in education reform to local, state, and national policymakers, as well as to educational practitioners, parents, and students
• Train graduate students and others to conduct cutting-edge research in education
• Facilitate interactions between students and faculty from different schools and/or departments who share an interest in education reform.
EPI Policy Brief #5 | September 2016 page 21
Education Policy Initiative | Gerald R. Ford School of Public PolicyJoan and Sanford Weill Hall, Suite 5100735 South State Street, Ann Arbor, MI 48109 734-615-6978 | edpolicy.umich.edu | @edpolicyford