class xi ncert maths chapter 15 statistics
TRANSCRIPT
Class XI – NCERT – Maths Chapter 15
Statistics
Exercise 15.1
Question 1:
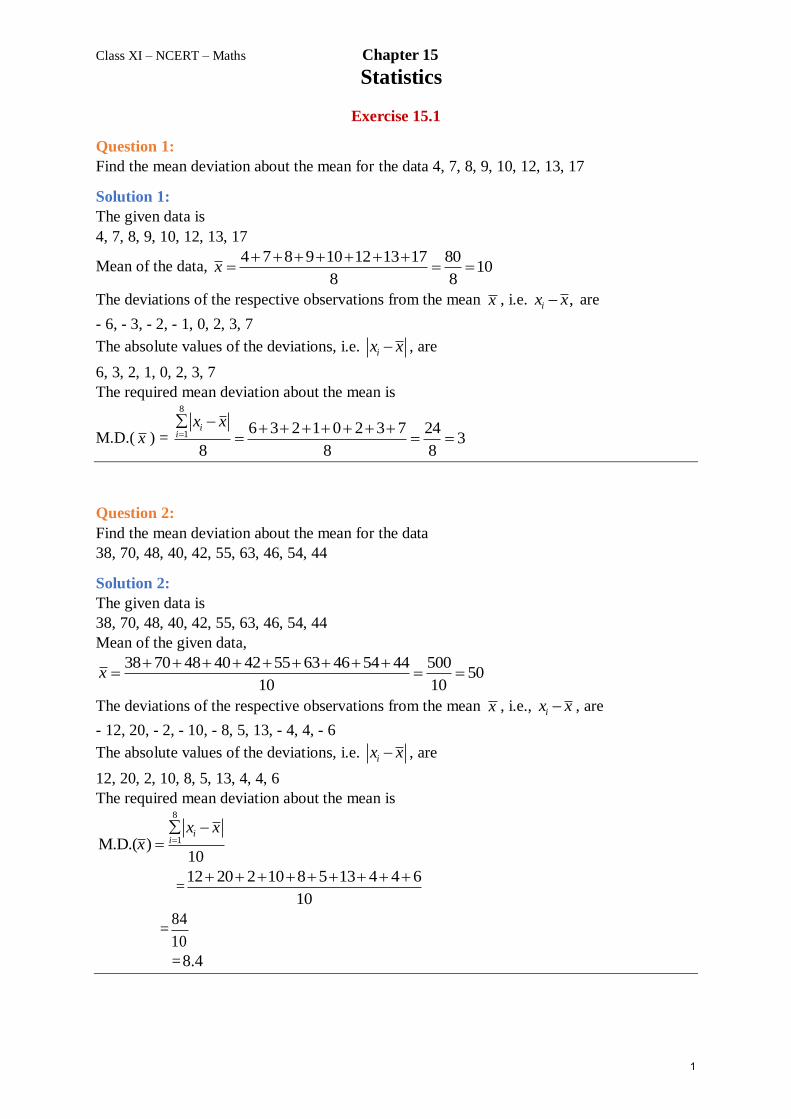
Find the mean deviation about the mean for the data 4, 7, 8, 9, 10, 12, 13, 17
Solution 1:
The given data is
4, 7, 8, 9, 10, 12, 13, 17
Mean of the data, 4 7 8 9 10 12 13 17 80
108 8
x
The deviations of the respective observations from the mean x , i.e. ,ix x are
- 6, - 3, - 2, - 1, 0, 2, 3, 7
The absolute values of the deviations, i.e. ix x , are
6, 3, 2, 1, 0, 2, 3, 7
The required mean deviation about the mean is
M.D.( x ) =
8
1 6 3 2 1 0 2 3 7 243
8 8 8
ii
x x
Question 2:
Find the mean deviation about the mean for the data
38, 70, 48, 40, 42, 55, 63, 46, 54, 44
Solution 2:
The given data is
38, 70, 48, 40, 42, 55, 63, 46, 54, 44
Mean of the given data,
38 70 48 40 42 55 63 46 54 44 50050
10 10x
The deviations of the respective observations from the mean x , i.e., ix x , are
- 12, 20, - 2, - 10, - 8, 5, 13, - 4, 4, - 6
The absolute values of the deviations, i.e. ix x , are
12, 20, 2, 10, 8, 5, 13, 4, 4, 6
The required mean deviation about the mean is 8
1M.D.( )10
ii
x xx
=12 20 2 10 8 5 13 4 4 6
10
=84
10
=8.4
1
Class XI – NCERT – Maths Chapter 15
Statistics
Question 3:
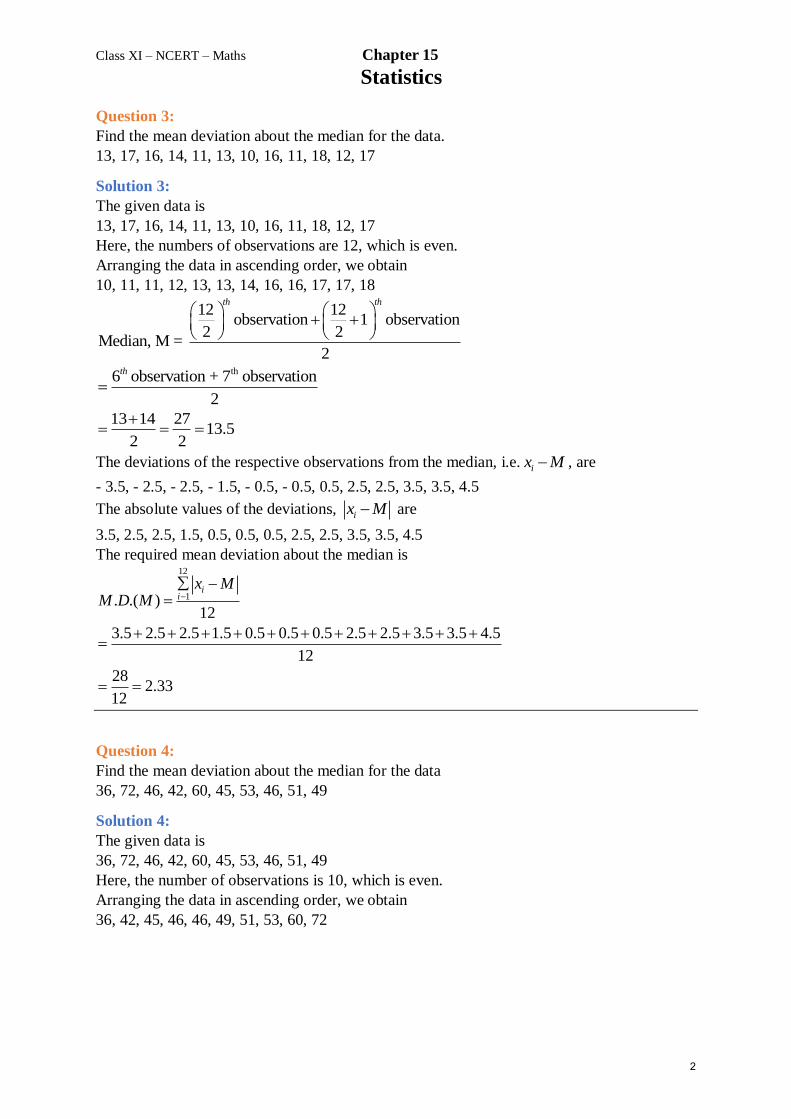
Find the mean deviation about the median for the data.
13, 17, 16, 14, 11, 13, 10, 16, 11, 18, 12, 17
Solution 3:
The given data is
13, 17, 16, 14, 11, 13, 10, 16, 11, 18, 12, 17
Here, the numbers of observations are 12, which is even.
Arranging the data in ascending order, we obtain
10, 11, 11, 12, 13, 13, 14, 16, 16, 17, 17, 18
12 12observation 1 observation
2 2Median, M =
2
th th
th6 observation + 7 observation
2
th
13 14 2713.5
2 2
The deviations of the respective observations from the median, i.e. ix M , are
- 3.5, - 2.5, - 2.5, - 1.5, - 0.5, - 0.5, 0.5, 2.5, 2.5, 3.5, 3.5, 4.5
The absolute values of the deviations, ix M are
3.5, 2.5, 2.5, 1.5, 0.5, 0.5, 0.5, 2.5, 2.5, 3.5, 3.5, 4.5
The required mean deviation about the median is 12
1. .( )12
3.5 2.5 2.5 1.5 0.5 0.5 0.5 2.5 2.5 3.5 3.5 4.5
12
282.33
12
ii
x MM D M
Question 4:
Find the mean deviation about the median for the data
36, 72, 46, 42, 60, 45, 53, 46, 51, 49
Solution 4:
The given data is
36, 72, 46, 42, 60, 45, 53, 46, 51, 49
Here, the number of observations is 10, which is even.
Arranging the data in ascending order, we obtain
36, 42, 45, 46, 46, 49, 51, 53, 60, 72
2
Class XI – NCERT – Maths Chapter 15
Statistics
th
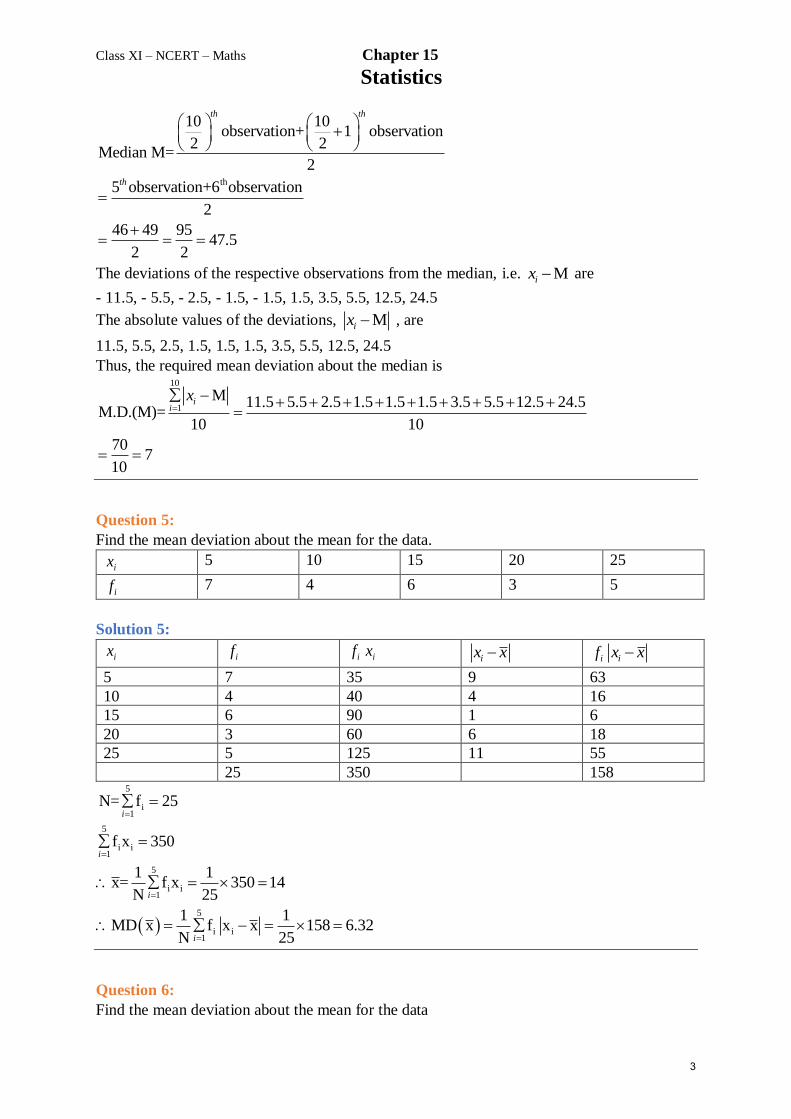
10 10observation+ 1 observation
2 2Median M=
2
5 observation+6 observation
2
46 49 9547.5
2 2
th th
th
The deviations of the respective observations from the median, i.e. Mix are
- 11.5, - 5.5, - 2.5, - 1.5, - 1.5, 1.5, 3.5, 5.5, 12.5, 24.5
The absolute values of the deviations, Mix , are
11.5, 5.5, 2.5, 1.5, 1.5, 1.5, 3.5, 5.5, 12.5, 24.5
Thus, the required mean deviation about the median is 10
1
M 11.5 5.5 2.5 1.5 1.5 1.5 3.5 5.5 12.5 24.5M.D.(M)=
10 10
707
10
ii
x
Question 5:
Find the mean deviation about the mean for the data.
ix 5 10 15 20 25
if 7 4 6 3 5
Solution 5:
ix if if ix ix x if ix x
5 7 35 9 63
10 4 40 4 16
15 6 90 1 6
20 3 60 6 18
25 5 125 11 55
25 350 158
5
i1
5
i i1
5
i i1
5
i i1
N= f 25
f x 350
1 1x= f x 350 14
N 25
1 1MD x f x x 158 6.32
N 25
i
i
i
i
Question 6:
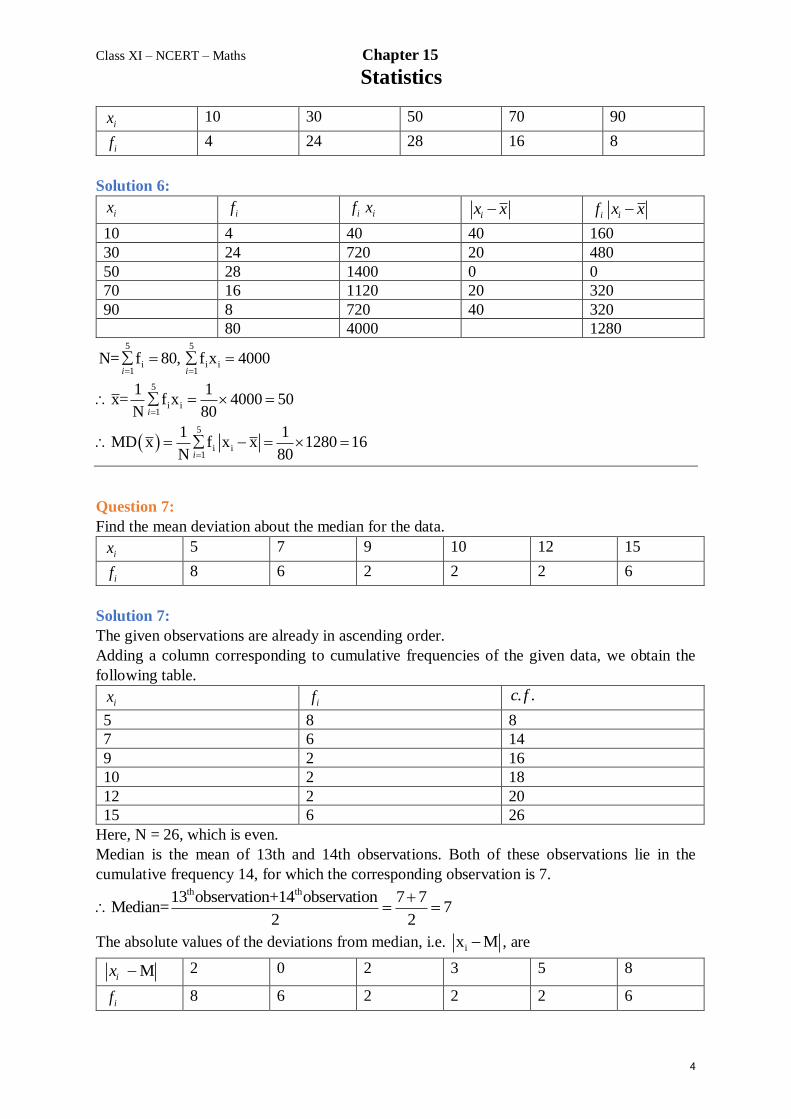
Find the mean deviation about the mean for the data
3
Class XI – NCERT – Maths Chapter 15
Statistics
ix 10 30 50 70 90
if 4 24 28 16 8
Solution 6:
ix if if ix ix x if ix x
10 4 40 40 160
30 24 720 20 480
50 28 1400 0 0
70 16 1120 20 320
90 8 720 40 320
80 4000 1280
5 5
i i i1 1
5
i i1
5
i i1
N= f 80, f x 4000
1 1x= f x 4000 50
N 80
1 1MD x f x x 1280 16
N 80
i i
i
i
Question 7:
Find the mean deviation about the median for the data.
ix 5 7 9 10 12 15
if 8 6 2 2 2 6
Solution 7:
The given observations are already in ascending order.
Adding a column corresponding to cumulative frequencies of the given data, we obtain the
following table.
ix if . .c f
5 8 8
7 6 14
9 2 16
10 2 18
12 2 20
15 6 26
Here, N = 26, which is even.
Median is the mean of 13th and 14th observations. Both of these observations lie in the
cumulative frequency 14, for which the corresponding observation is 7. th th13 observation+14 observation 7 7
Median= 72 2
The absolute values of the deviations from median, i.e. ix M , are
Mix 2 0 2 3 5 8
if 8 6 2 2 2 6
4
Class XI – NCERT – Maths Chapter 15
Statistics
if Mix 16 0 4 6 10 48
6 6
i i i1 1
f 26, f x M 84i i
and
6
i i1
1 1M.D. M f x M 84 3.23
N 26i
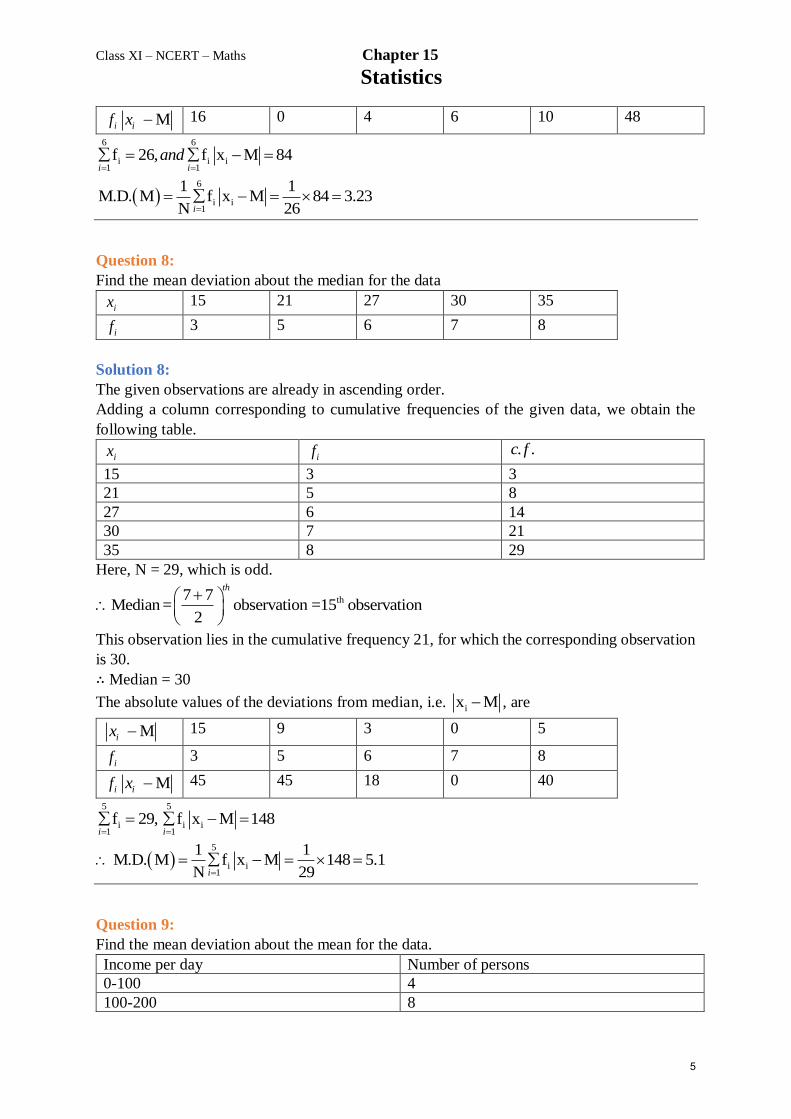
Question 8:
Find the mean deviation about the median for the data
ix 15 21 27 30 35
if 3 5 6 7 8
Solution 8:
The given observations are already in ascending order.
Adding a column corresponding to cumulative frequencies of the given data, we obtain the
following table.
ix if . .c f
15 3 3
21 5 8
27 6 14
30 7 21
35 8 29
Here, N = 29, which is odd.
th7 7Median = observation =15 observation
2
th
This observation lies in the cumulative frequency 21, for which the corresponding observation
is 30.
∴ Median = 30
The absolute values of the deviations from median, i.e. ix M , are
Mix 15 9 3 0 5
if 3 5 6 7 8
if Mix 45 45 18 0 40
5 5
i i i1 1
f 29, f x M 148i i
5
i i1
1 1M.D. M f x M 148 5.1
N 29i
Question 9:
Find the mean deviation about the mean for the data.
Income per day Number of persons
0-100 4
100-200 8
5
Class XI – NCERT – Maths Chapter 15
Statistics
200-300 9
300-400 10
400-500 7
500-600 5
600-700 4
700-800 3
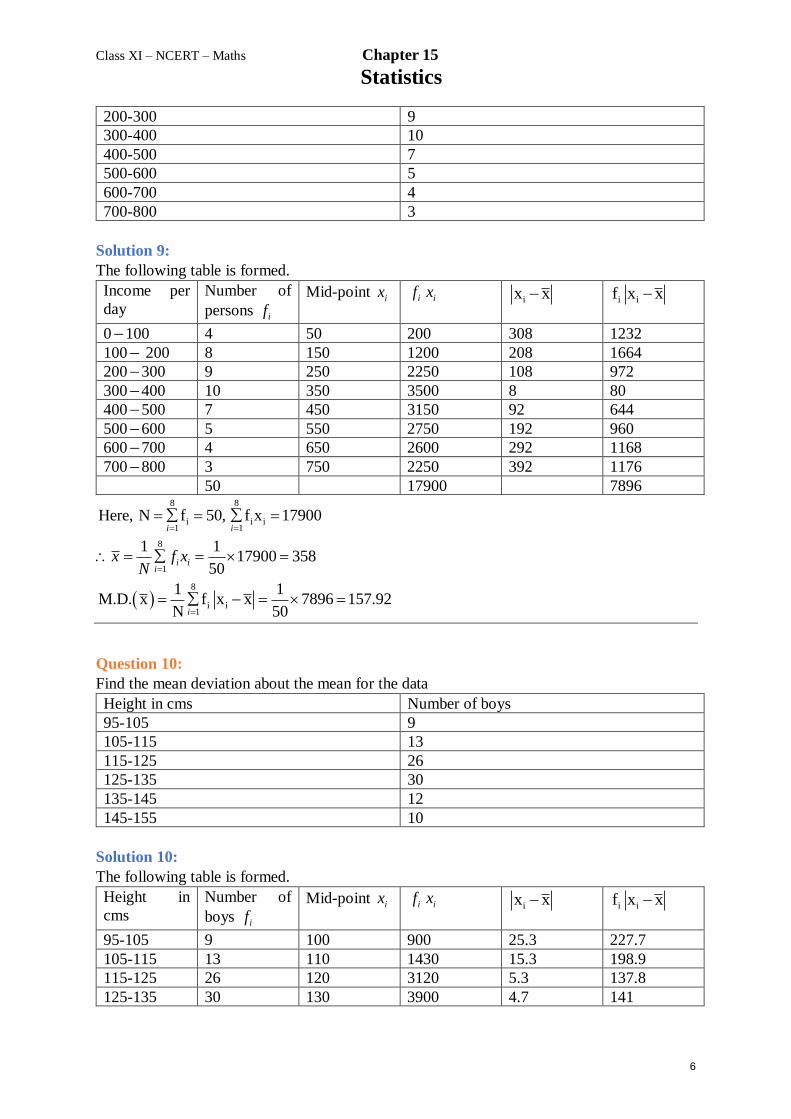
Solution 9:
The following table is formed.
Income per
day
Number of
persons if
Mid-point ix if ix ix x i if x x
0100 4 50 200 308 1232
100 200 8 150 1200 208 1664
200300 9 250 2250 108 972
300400 10 350 3500 8 80
400500 7 450 3150 92 644
500600 5 550 2750 192 960
600700 4 650 2600 292 1168
700800 3 750 2250 392 1176
50 17900 7896
8 8
i i i1 1
8
1
8
i i1
Here, N f 50, f x 17900
1 117900 358
50
1 1M.D. x f x x 7896 157.92
N 50
i i
i ii
i
x f xN
Question 10:
Find the mean deviation about the mean for the data
Height in cms Number of boys
95-105 9
105-115 13
115-125 26
125-135 30
135-145 12
145-155 10
Solution 10:
The following table is formed.
Height in
cms
Number of
boys if
Mid-point ix if ix ix x i if x x
95-105 9 100 900 25.3 227.7
105-115 13 110 1430 15.3 198.9
115-125 26 120 3120 5.3 137.8
125-135 30 130 3900 4.7 141
6
Class XI – NCERT – Maths Chapter 15
Statistics
135-145 12 140 1680 14.7 176.4
145-155 10 150 1500 24.7 247
6 6
i i i1 1
6
1
6
i i1
Here, N f 100, f x 12530
1 1x 12530 125.3
100
1 1M.D. x f x x 1128.8 11.28
N 100
i i
i ii
i
f xN
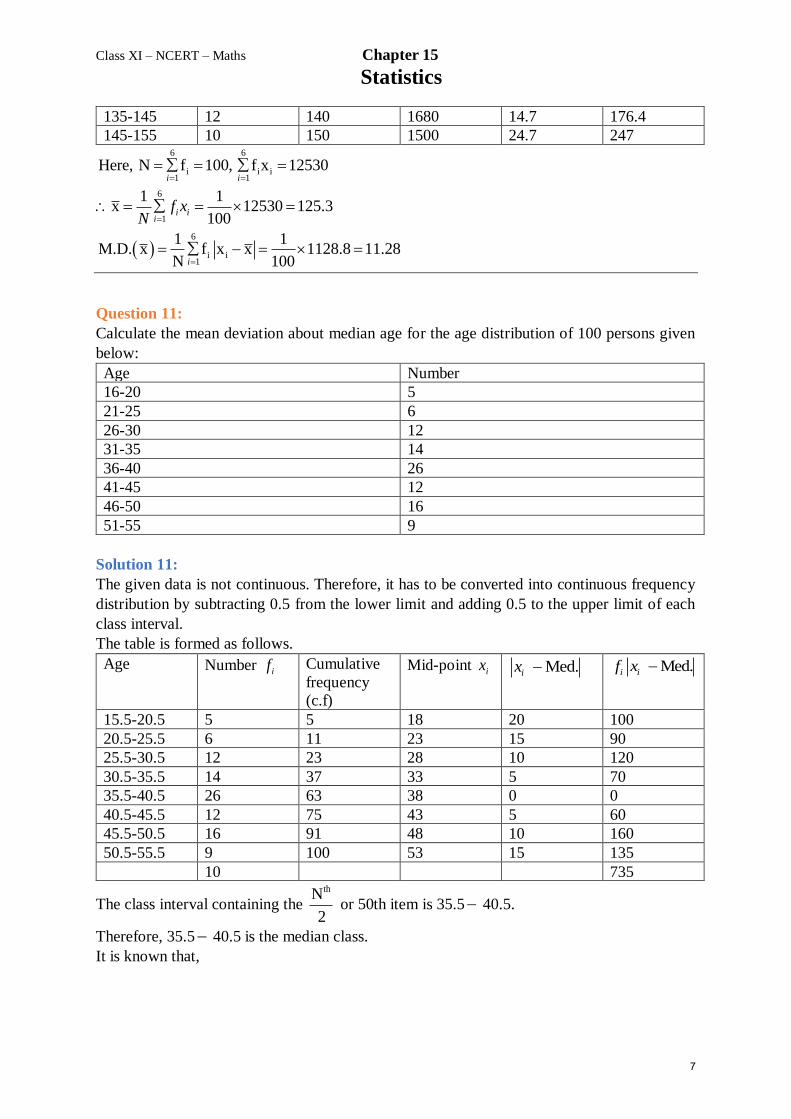
Question 11:
Calculate the mean deviation about median age for the age distribution of 100 persons given
below:
Age Number
16-20 5
21-25 6
26-30 12
31-35 14
36-40 26
41-45 12
46-50 16
51-55 9
Solution 11:
The given data is not continuous. Therefore, it has to be converted into continuous frequency
distribution by subtracting 0.5 from the lower limit and adding 0.5 to the upper limit of each
class interval.
The table is formed as follows.
Age Number if Cumulative
frequency
(c.f)
Mid-point ix Med.ix Med.i if x
15.5-20.5 5 5 18 20 100
20.5-25.5 6 11 23 15 90
25.5-30.5 12 23 28 10 120
30.5-35.5 14 37 33 5 70
35.5-40.5 26 63 38 0 0
40.5-45.5 12 75 43 5 60
45.5-50.5 16 91 48 10 160
50.5-55.5 9 100 53 15 135
10 735
The class interval containing the thN
2 or 50th item is 35.5 40.5.
Therefore, 35.5 40.5 is the median class.
It is known that,
7
Class XI – NCERT – Maths Chapter 15
Statistics
2Median
NC
l hf
Here, l = 35.5, C = 37, f = 26, h = 5, and N = 100
50 37 13 5Median 35.5 5 35.5 35.5 2.5 38
26 26
Thus, mean deviation about the median is given by,
8
i i1
1 1M.D. M f x M 735 7.35
N 100i
Exercise 15.2
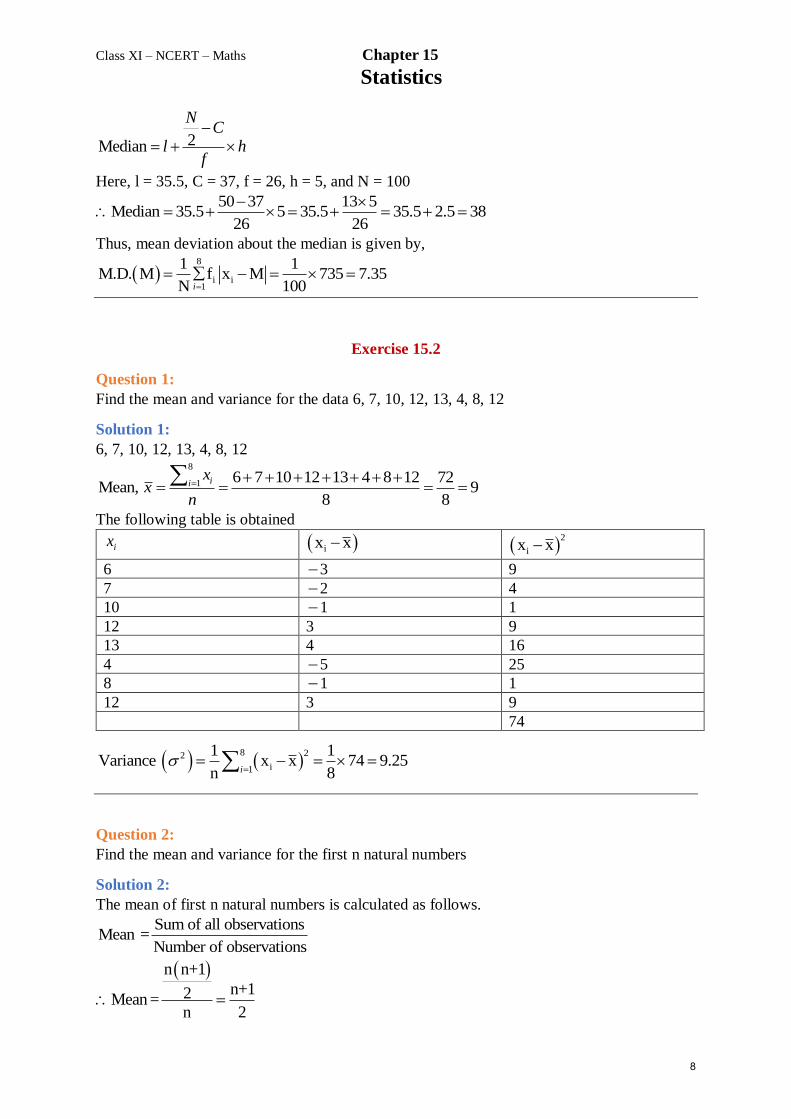
Question 1:
Find the mean and variance for the data 6, 7, 10, 12, 13, 4, 8, 12
Solution 1:
6, 7, 10, 12, 13, 4, 8, 12 8
1 6 7 10 12 13 4 8 12 72Mean, 9
8 8
iix
xn
The following table is obtained
ix ix x 2
ix x
6 3 9
7 2 4
10 1 1
12 3 9
13 4 16
4 5 25
8 1 1
12 3 9
74
8 22
i1
1 1Variance x x 74 9.25
n 8i
Question 2:
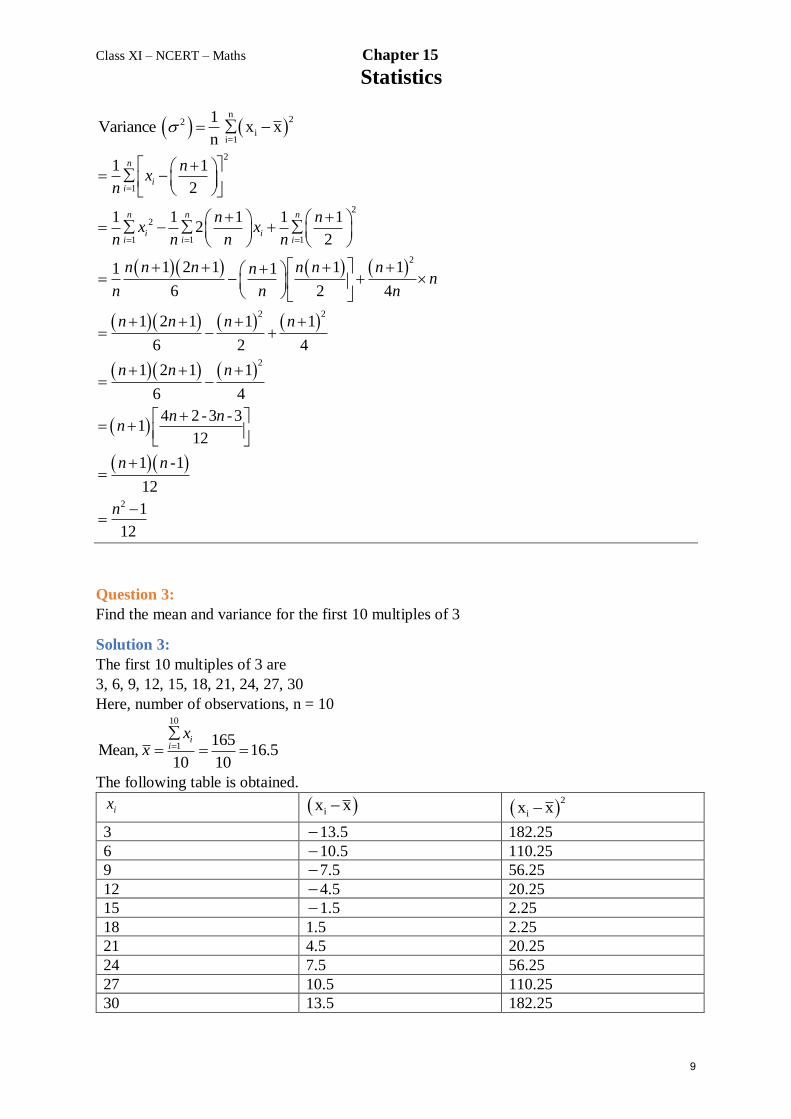
Find the mean and variance for the first n natural numbers
Solution 2:
The mean of first n natural numbers is calculated as follows.
Sum of all observationsMean =
Number of observations
n n+1
n+12Mean =n 2
8
Class XI – NCERT – Maths Chapter 15
Statistics
2 1Variance
n
n2
ii=1
x x
2
1
2
2
1 1 1
2
2 2
2
2
1 1
2
1 1 1 1 12
2
1 2 1 1 11 1
6 2 4
1 2 1 1 1
6 2 4
1 2 1 1
6 4
4 2 -3 -31
12
1 -1
12
1
12
n
ii
n n n
i ii i i
nx
n
n nx x
n n n n
n n n n n nnn
n n n
n n n n
n n n
n nn
n n
n
Question 3:
Find the mean and variance for the first 10 multiples of 3
Solution 3:
The first 10 multiples of 3 are
3, 6, 9, 12, 15, 18, 21, 24, 27, 30
Here, number of observations, n = 10 10
1 165Mean, 16.5
10 10
ii
xx
The following table is obtained.
ix ix x 2
ix x
3 13.5 182.25
6 10.5 110.25
9 7.5 56.25
12 4.5 20.25
15 1.5 2.25
18 1.5 2.25
21 4.5 20.25
24 7.5 56.25
27 10.5 110.25
30 13.5 182.25
9
Class XI – NCERT – Maths Chapter 15
Statistics
742.5
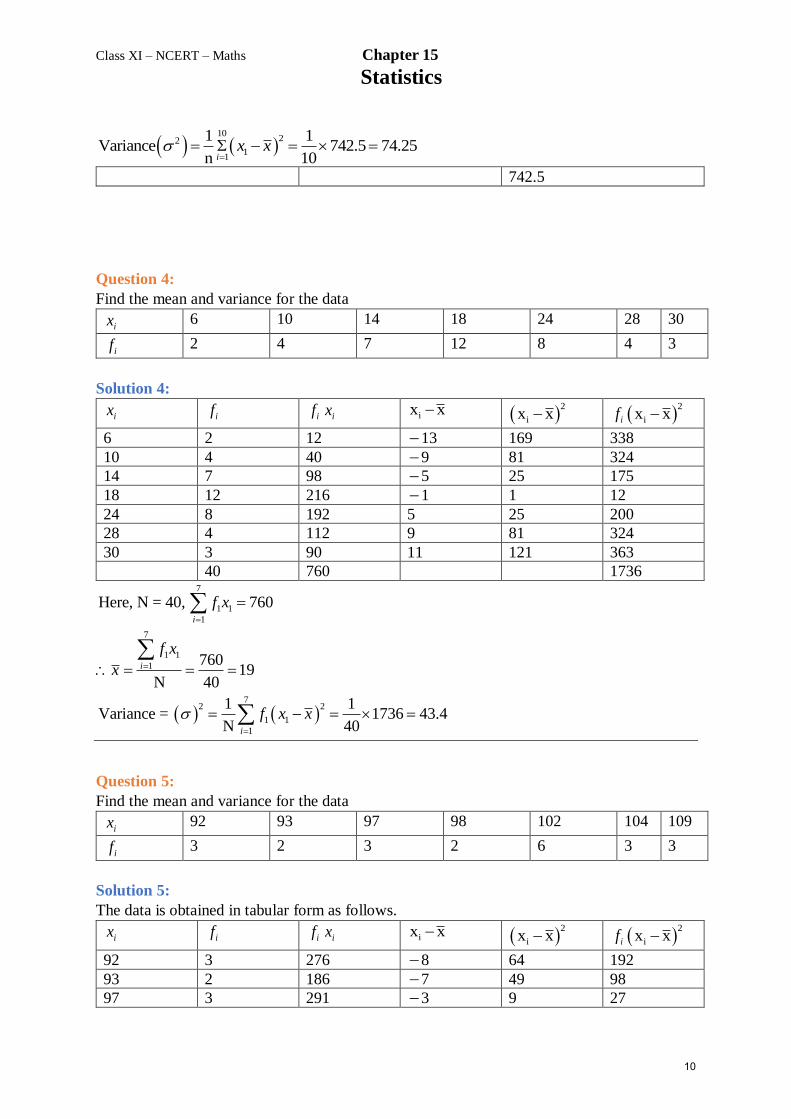
Question 4:
Find the mean and variance for the data
ix 6 10 14 18 24 28 30
if 2 4 7 12 8 4 3
Solution 4:
ix if if ix ix x 2
ix x if 2
ix x
6 2 12 13 169 338
10 4 40 9 81 324
14 7 98 5 25 175
18 12 216 1 1 12
24 8 192 5 25 200
28 4 112 9 81 324
30 3 90 11 121 363
40 760 1736
7
1 1
1
7
1 1
1
72 2
1 1
1
Here, N = 40, 760
76019
N 40
1 1Variance = 1736 43.4
N 40
i
i
i
f x
f x
x
f x x
Question 5:
Find the mean and variance for the data
ix 92 93 97 98 102 104 109
if 3 2 3 2 6 3 3
Solution 5:
The data is obtained in tabular form as follows.
ix if if ix ix x 2
ix x if 2
ix x
92 3 276 8 64 192
93 2 186 7 49 98
97 3 291 3 9 27
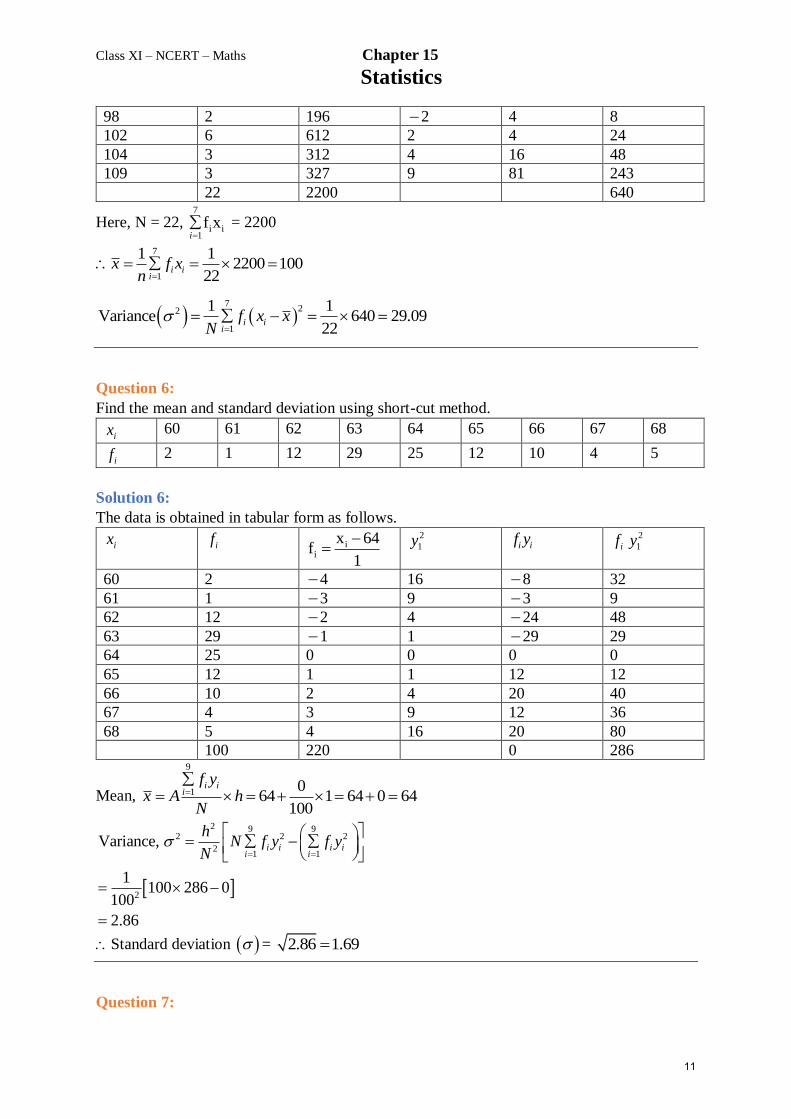
10
22
11
1 1Variance 742.5 74.25
n 10ix x
10
Class XI – NCERT – Maths Chapter 15
Statistics
98 2 196 2 4 8
102 6 612 2 4 24
104 3 312 4 16 48
109 3 327 9 81 243
22 2200 640
Here, N = 22, 7
i i1
f xi
= 2200
7
1
1 12200 100
22i i
i
x f xn
7
22
1
1 1Variance 640 29.09
22i i
i
f x xN
Question 6:
Find the mean and standard deviation using short-cut method.
ix 60 61 62 63 64 65 66 67 68
if 2 1 12 29 25 12 10 4 5
Solution 6:
The data is obtained in tabular form as follows.
ix if ii
x 64f
1
2
1y i if y if
2
1y
60 2 4 16 8 32
61 1 3 9 3 9
62 12 2 4 24 48
63 29 1 1 29 29
64 25 0 0 0 0
65 12 1 1 12 12
66 10 2 4 20 40
67 4 3 9 12 36
68 5 4 16 20 80
100 220 0 286
Mean,
9
1 064 1 64 0 64
100
i ii
f yx A h
N
2 9 92 2 2
21 1
2
Variance,
1100 286 0
100
2.86
i i i ii i
hN f y f y
N
Standard deviation = 2.86 1.69
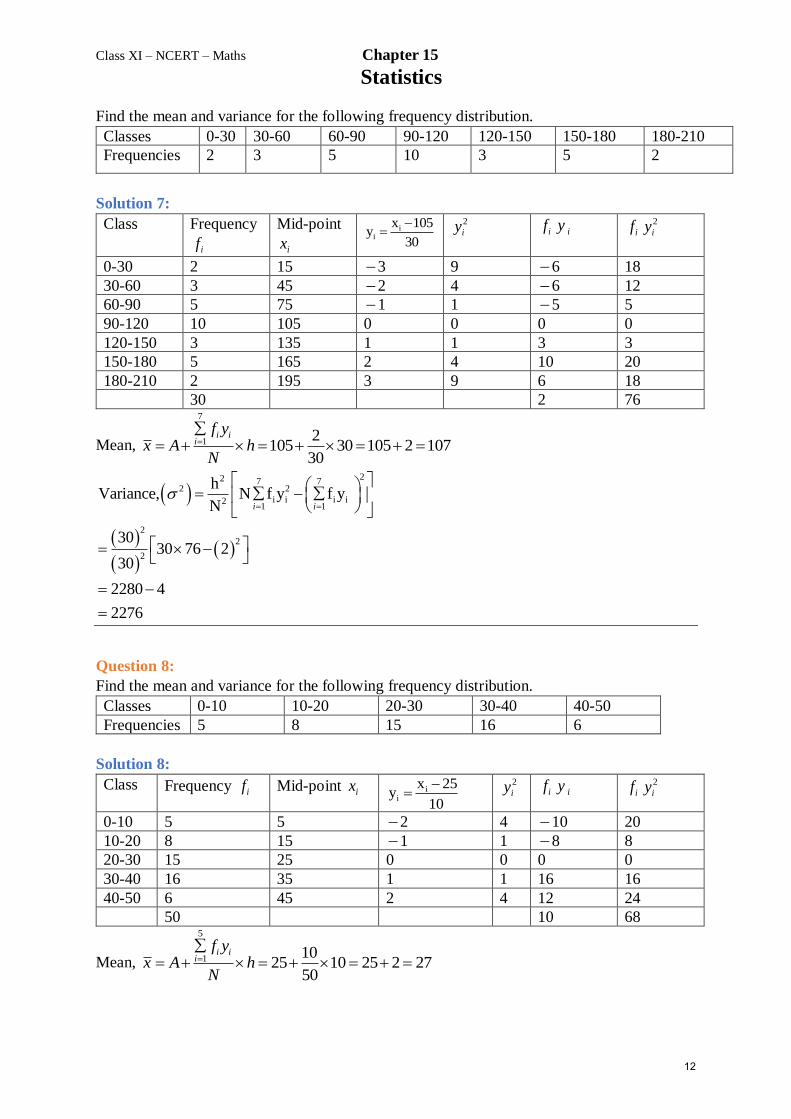
Question 7:
11
Class XI – NCERT – Maths Chapter 15
Statistics
Find the mean and variance for the following frequency distribution.
Classes 0-30 30-60 60-90 90-120 120-150 150-180 180-210
Frequencies 2 3 5 10 3 5 2
Solution 7:
Class Frequency
if
Mid-point
ix i
i
x 105y
30
2
iy if iy if
2
iy
0-30 2 15 3 9 6 18
30-60 3 45 2 4 6 12
60-90 5 75 1 1 5 5
90-120 10 105 0 0 0 0
120-150 3 135 1 1 3 3
150-180 5 165 2 4 10 20
180-210 2 195 3 9 6 18
30 2 76
Mean,
7
1 2105 30 105 2 107
30
i ii
f yx A h
N
22 7 72 2
i i i i21 1
2
2
2
hVariance, N f y f y
N
3030 76 2
30
2280 4
2276
i i
Question 8:
Find the mean and variance for the following frequency distribution.
Classes 0-10 10-20 20-30 30-40 40-50
Frequencies 5 8 15 16 6
Solution 8:
Class Frequency if Mid-point ix ii
x 25y
10
2
iy if iy if
2
iy
0-10 5 5 2 4 10 20
10-20 8 15 1 1 8 8
20-30 15 25 0 0 0 0
30-40 16 35 1 1 16 16
40-50 6 45 2 4 12 24
50 10 68
Mean,
5
1 1025 10 25 2 27
50
i ii
f yx A h
N
12
Class XI – NCERT – Maths Chapter 15
Statistics
22 5 52 2
i i i i21 1
2
2
2
hVariance, N f y f y
N
1050 68 10
50
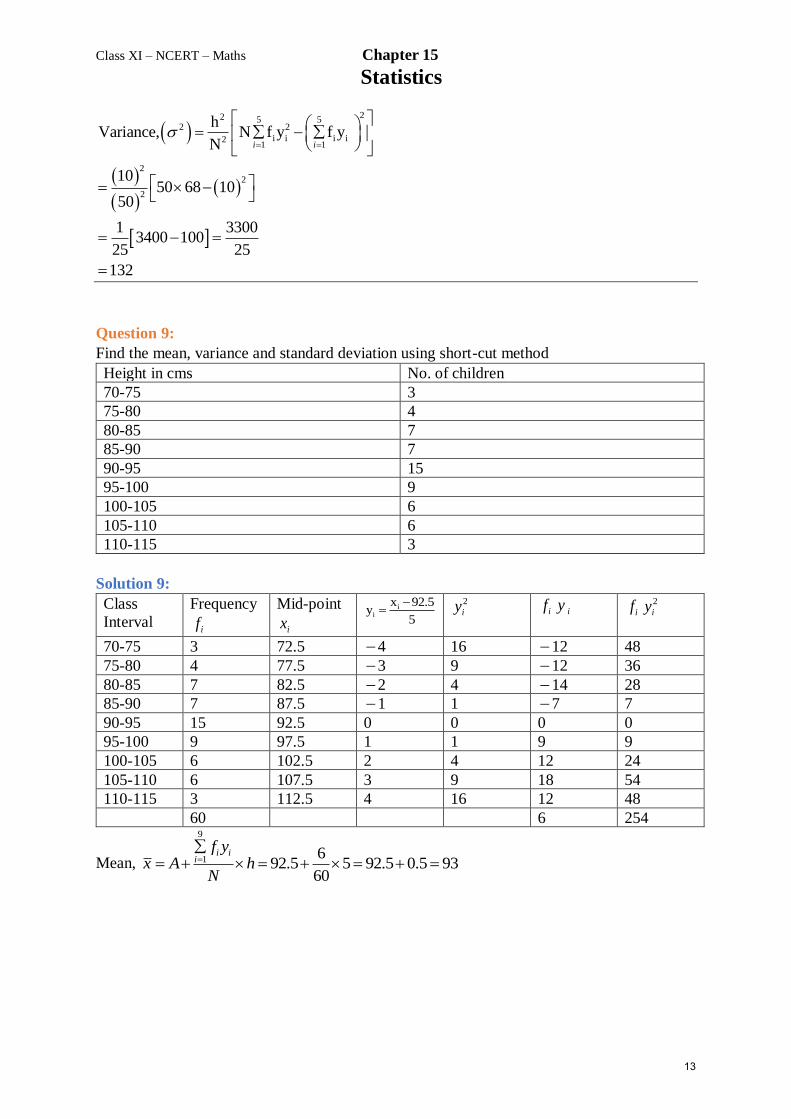
1 33003400 100
25 25
132
i i
Question 9:
Find the mean, variance and standard deviation using short-cut method
Height in cms No. of children
70-75 3
75-80 4
80-85 7
85-90 7
90-95 15
95-100 9
100-105 6
105-110 6
110-115 3
Solution 9:
Class
Interval
Frequency
if
Mid-point
ix
ii
x 92.5y
5
2
iy if iy if
2
iy
70-75 3 72.5 4 16 12 48
75-80 4 77.5 3 9 12 36
80-85 7 82.5 2 4 14 28
85-90 7 87.5 1 1 7 7
90-95 15 92.5 0 0 0 0
95-100 9 97.5 1 1 9 9
100-105 6 102.5 2 4 12 24
105-110 6 107.5 3 9 18 54
110-115 3 112.5 4 16 12 48
60 6 254
Mean,
9
1 692.5 5 92.5 0.5 93
60
i ii
f yx A h
N
13
Class XI – NCERT – Maths Chapter 15
Statistics
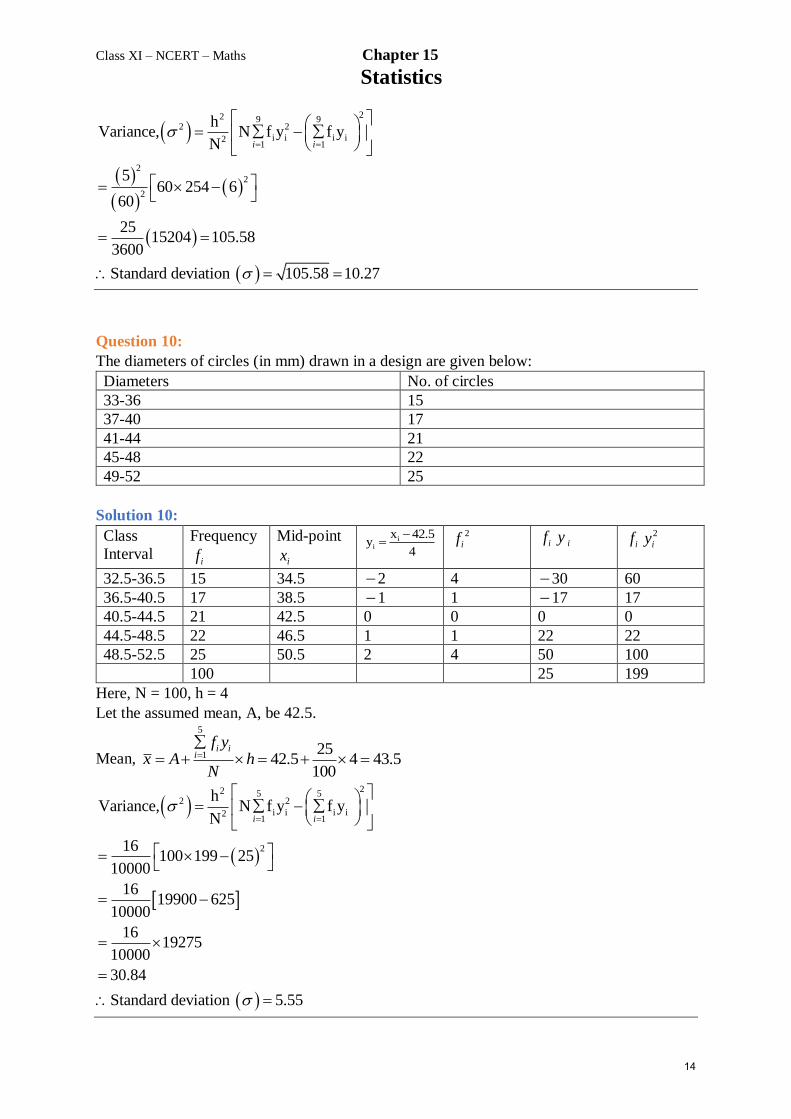
22 9 92 2
i i i i21 1
2
2
2
hVariance, N f y f y
N
560 254 6
60
2515204 105.58
3600
Standard deviation 105.58 10.27
i i
Question 10:
The diameters of circles (in mm) drawn in a design are given below:
Diameters No. of circles
33-36 15
37-40 17
41-44 21
45-48 22
49-52 25
Solution 10:
Class
Interval
Frequency
if
Mid-point
ix
ii
x 42.5y
4
2
if if iy if
2
iy
32.5-36.5 15 34.5 2 4 30 60
36.5-40.5 17 38.5 1 1 17 17
40.5-44.5 21 42.5 0 0 0 0
44.5-48.5 22 46.5 1 1 22 22
48.5-52.5 25 50.5 2 4 50 100
100 25 199
Here, N = 100, h = 4
Let the assumed mean, A, be 42.5.
Mean,
5
1 2542.5 4 43.5
100
i ii
f yx A h
N
22 5 52 2
i i i i21 1
2
hVariance, N f y f y
N
16100 199 25
10000
1619900 625
10000
i i
1619275
10000
30.84
Standard deviation 5.55
14
Class XI – NCERT – Maths Chapter 15
Statistics
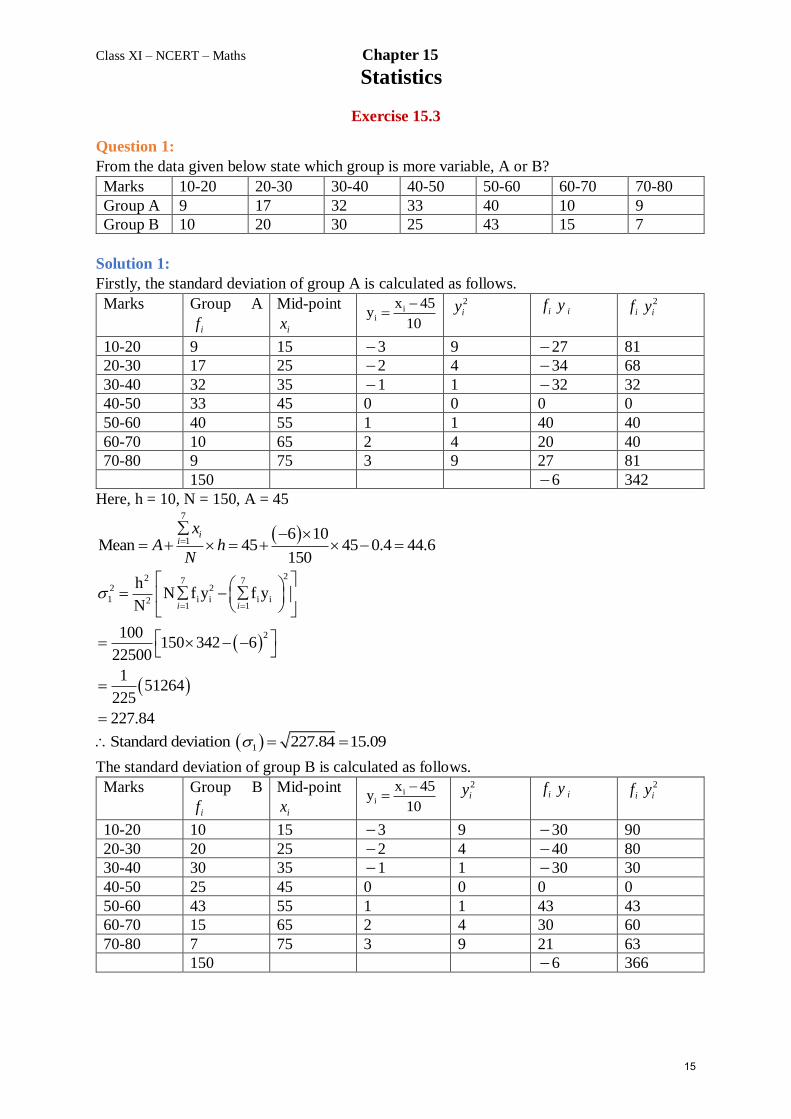
Exercise 15.3
Question 1:
From the data given below state which group is more variable, A or B?
Marks 10-20 20-30 30-40 40-50 50-60 60-70 70-80
Group A 9 17 32 33 40 10 9
Group B 10 20 30 25 43 15 7
Solution 1:
Firstly, the standard deviation of group A is calculated as follows.
Marks Group A
if
Mid-point
ix i
i
x 45y
10
2
iy if iy if
2
iy
10-20 9 15 3 9 27 81
20-30 17 25 2 4 34 68
30-40 32 35 1 1 32 32
40-50 33 45 0 0 0 0
50-60 40 55 1 1 40 40
60-70 10 65 2 4 20 40
70-80 9 75 3 9 27 81
150 6 342
Here, h = 10, N = 150, A = 45
7
16 10
Mean 45 45 0.4 44.6150
ii
xA h
N
22 7 72 2
1 i i i i21 1
2
hN f y f y
N
100150 342 6
22500
151264
225
227.84
i i
1Standard deviation 227.84 15.09
The standard deviation of group B is calculated as follows.
Marks Group B
if
Mid-point
ix i
i
x 45y
10
2
iy if iy if
2
iy
10-20 10 15 3 9 30 90
20-30 20 25 2 4 40 80
30-40 30 35 1 1 30 30
40-50 25 45 0 0 0 0
50-60 43 55 1 1 43 43
60-70 15 65 2 4 30 60
70-80 7 75 3 9 21 63
150 6 366
15
Class XI – NCERT – Maths Chapter 15
Statistics
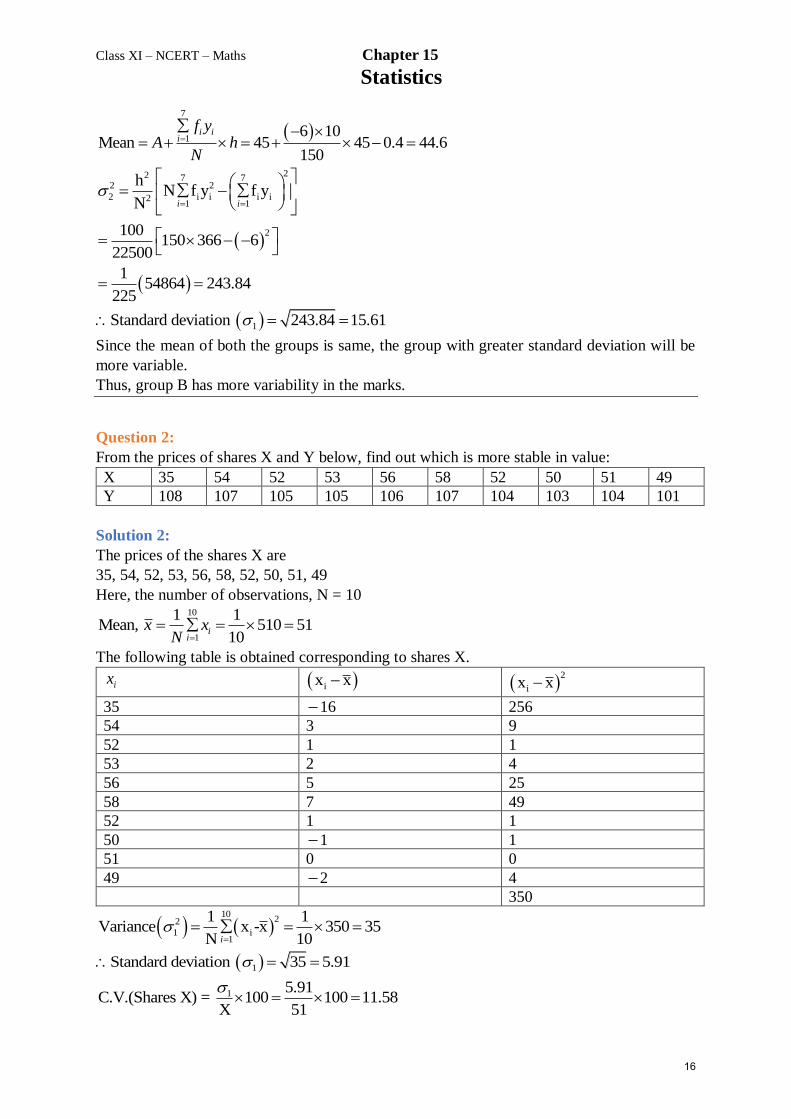
7
16 10
Mean 45 45 0.4 44.6150
i ii
f yA h
N
22 7 72 2
2 i i i i21 1
hN f y f y
N i i
2100
150 366 622500
1
154864 243.84
225
Standard deviation 243.84 15.61
Since the mean of both the groups is same, the group with greater standard deviation will be
more variable.
Thus, group B has more variability in the marks.
Question 2:
From the prices of shares X and Y below, find out which is more stable in value:
X 35 54 52 53 56 58 52 50 51 49
Y 108 107 105 105 106 107 104 103 104 101
Solution 2:
The prices of the shares X are
35, 54, 52, 53, 56, 58, 52, 50, 51, 49
Here, the number of observations, N = 10 10
1
1 1Mean, 510 51
10i
i
x xN
The following table is obtained corresponding to shares X.
ix ix x 2
ix x
35 16 256
54 3 9
52 1 1
53 2 4
56 5 25
58 7 49
52 1 1
50 1 1
51 0 0
49 2 4
350
10
22
1 i1
1 1Variance x -x 350 35
N 10i
1Standard deviation 35 5.91
1 5.91C.V.(Shares X) = 100 100 11.58
X 51
16
Class XI – NCERT – Maths Chapter 15
Statistics
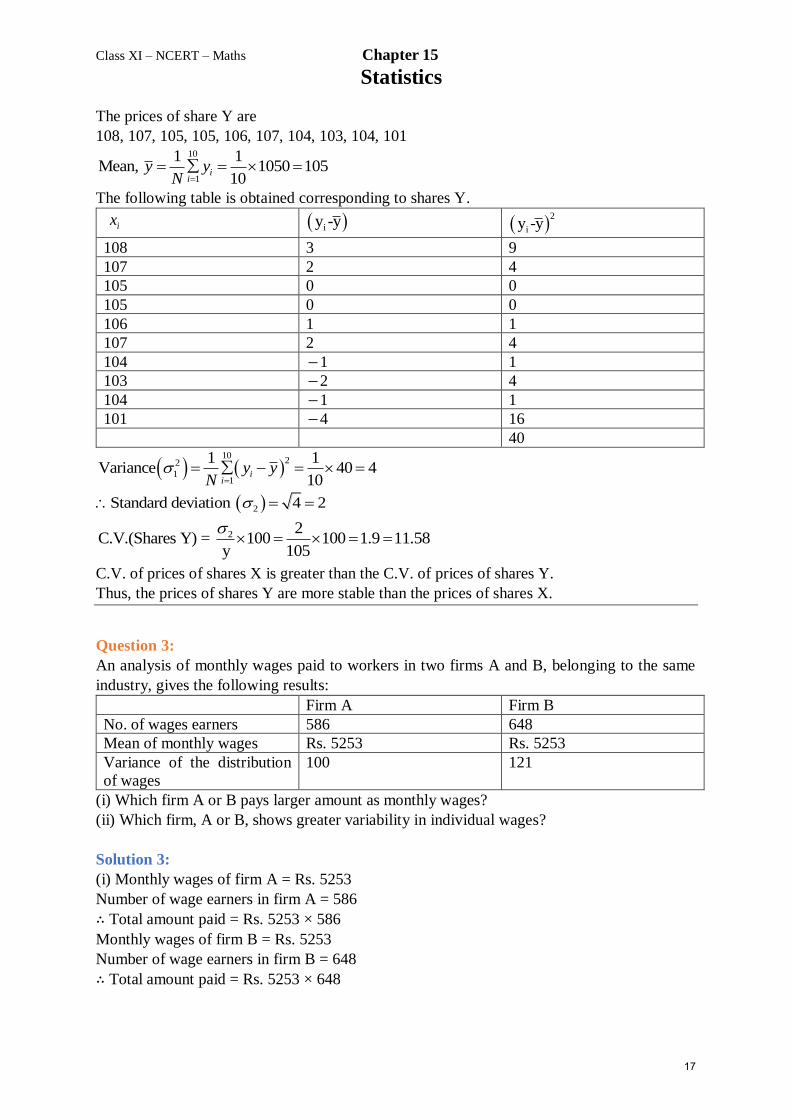
The prices of share Y are
108, 107, 105, 105, 106, 107, 104, 103, 104, 101 10
1
1 1Mean, 1050 105
10i
i
y yN
The following table is obtained corresponding to shares Y.
ix iy -y 2
iy -y
108 3 9
107 2 4
105 0 0
105 0 0
106 1 1
107 2 4
104 1 1
103 2 4
104 1 1
101 4 16
40
10
22
11
1 1Variance 40 4
10i
i
y yN
2Standard deviation 4 2
2 2C.V.(Shares Y) = 100 100 1.9 11.58
y 105
C.V. of prices of shares X is greater than the C.V. of prices of shares Y.
Thus, the prices of shares Y are more stable than the prices of shares X.
Question 3:
An analysis of monthly wages paid to workers in two firms A and B, belonging to the same
industry, gives the following results:
Firm A Firm B
No. of wages earners 586 648
Mean of monthly wages Rs. 5253 Rs. 5253
Variance of the distribution
of wages
100 121
(i) Which firm A or B pays larger amount as monthly wages?
(ii) Which firm, A or B, shows greater variability in individual wages?
Solution 3:
(i) Monthly wages of firm A = Rs. 5253
Number of wage earners in firm A = 586
∴ Total amount paid = Rs. 5253 × 586
Monthly wages of firm B = Rs. 5253
Number of wage earners in firm B = 648
∴ Total amount paid = Rs. 5253 × 648
17
Class XI – NCERT – Maths Chapter 15
Statistics
Thus, firm B pays the larger amount as monthly wages as the number of wage earners in firm
B are more than the number of wage earners in firm A.
(ii) Variance of the distribution of wages in firm A 2
1 = 100
∴ Standard deviation of the distribution of wages in firm A 1 = 100 10
Variance of the distribution of wages in firm 2
2B = 121
∴ Standard deviation of the distribution of wages in firm 2
2B 121 11
The mean of monthly wages of both the firms is same i.e., 5253. Therefore, the firm with
greater standard deviation will have more variability.
Thus, firm B has greater variability in the individual wages.
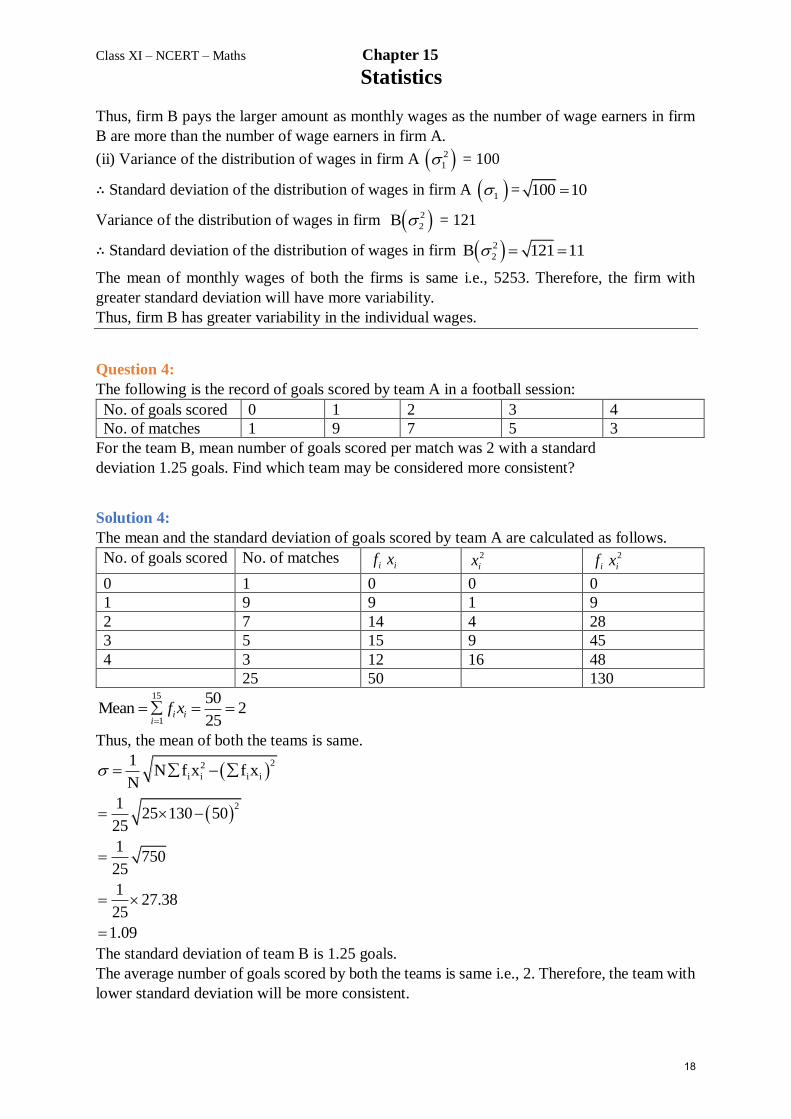
Question 4:
The following is the record of goals scored by team A in a football session:
No. of goals scored 0 1 2 3 4
No. of matches 1 9 7 5 3
For the team B, mean number of goals scored per match was 2 with a standard
deviation 1.25 goals. Find which team may be considered more consistent?
Solution 4:
The mean and the standard deviation of goals scored by team A are calculated as follows.
No. of goals scored No. of matches if ix 2
ix if2
ix
0 1 0 0 0
1 9 9 1 9
2 7 14 4 28
3 5 15 9 45
4 3 12 16 48
25 50 130 15
1
50Mean 2
25i i
i
f x
Thus, the mean of both the teams is same.
22
i i i i
1N f x f x
N
21
25 130 5025
1750
25
127.38
25
1.09
The standard deviation of team B is 1.25 goals.
The average number of goals scored by both the teams is same i.e., 2. Therefore, the team with
lower standard deviation will be more consistent.
18
Class XI – NCERT – Maths Chapter 15
Statistics
Thus, team A is more consistent than team B.
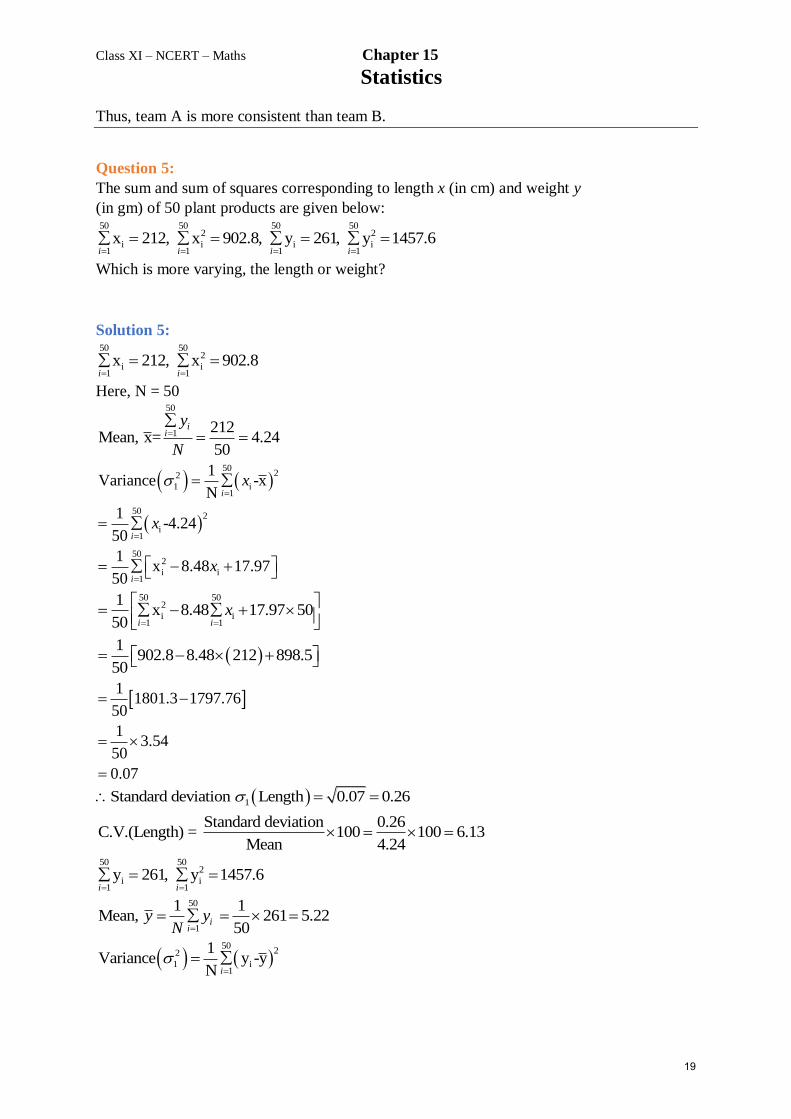
Question 5:
The sum and sum of squares corresponding to length x (in cm) and weight y
(in gm) of 50 plant products are given below: 50 50 50 50
2 2
i i i i1 1 1 1
x 212, x 902.8, y 261, y 1457.6i i i i
Which is more varying, the length or weight?
Solution 5: 50 50
2
i i1 1
x 212, x 902.8i i
Here, N = 50 50
1 212Mean, x= 4.24
50
ii
y
N
5022
1 i1
502
i1
502
i i1
1Variance -x
N
1-4.24
50
1x 8.48 17.97
50
i
i
i
x
x
x
50 502
i i1 1
1x 8.48 17.97 50
50 i i
x
1
902.8 8.48 212 898.550
1
1801.3 1797.7650
13.54
50
0.07
1Standard deviation Length 0.07 0.26
Standard deviation 0.26C.V.(Length) = 100 100 6.13
Mean 4.24
50 502
i i1 1
y 261, y 1457.6i i
50
1
1 1Mean, 261 5.22
50i
i
y yN
50
22
1 i1
1Variance y -y
N i
19
Class XI – NCERT – Maths Chapter 15
Statistics
50
2
i1
502
i i1
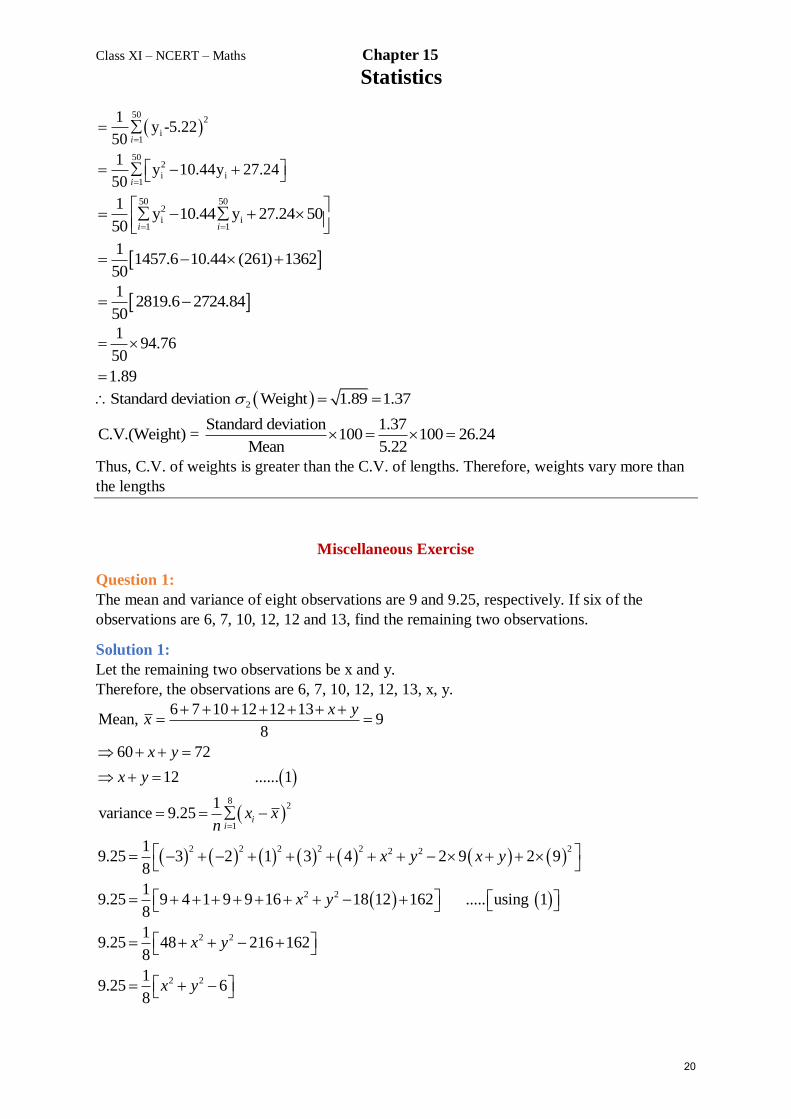
1y -5.22
50
1y 10.44y 27.24
50
i
i
50 502
i i1 1
1y 10.44 y 27.24 50
50 i i
1
1457.6 10.44 (261) 136250
1
2819.6 2724.8450
194.76
50
1.89
2Standard deviation Weight 1.89 1.37
Standard deviation 1.37C.V.(Weight) = 100 100 26.24
Mean 5.22
Thus, C.V. of weights is greater than the C.V. of lengths. Therefore, weights vary more than
the lengths
Miscellaneous Exercise
Question 1:
The mean and variance of eight observations are 9 and 9.25, respectively. If six of the
observations are 6, 7, 10, 12, 12 and 13, find the remaining two observations.
Solution 1:
Let the remaining two observations be x and y.
Therefore, the observations are 6, 7, 10, 12, 12, 13, x, y.
6 7 10 12 12 13Mean, 9
8
60 72
12 ...... 1
x yx
x y
x y
82
1
2 2 2 2 2 22 2
2 2
2 2
2 2
1variance 9.25
19.25 3 2 1 3 4 2 9 2 9
8
19.25 9 4 1 9 9 16 18 12 162 ..... using 1
8
19.25 48 216 162
8
19.25 6
8
ii
x xn
x y x y
x y
x y
x y
20
Class XI – NCERT – Maths Chapter 15
Statistics
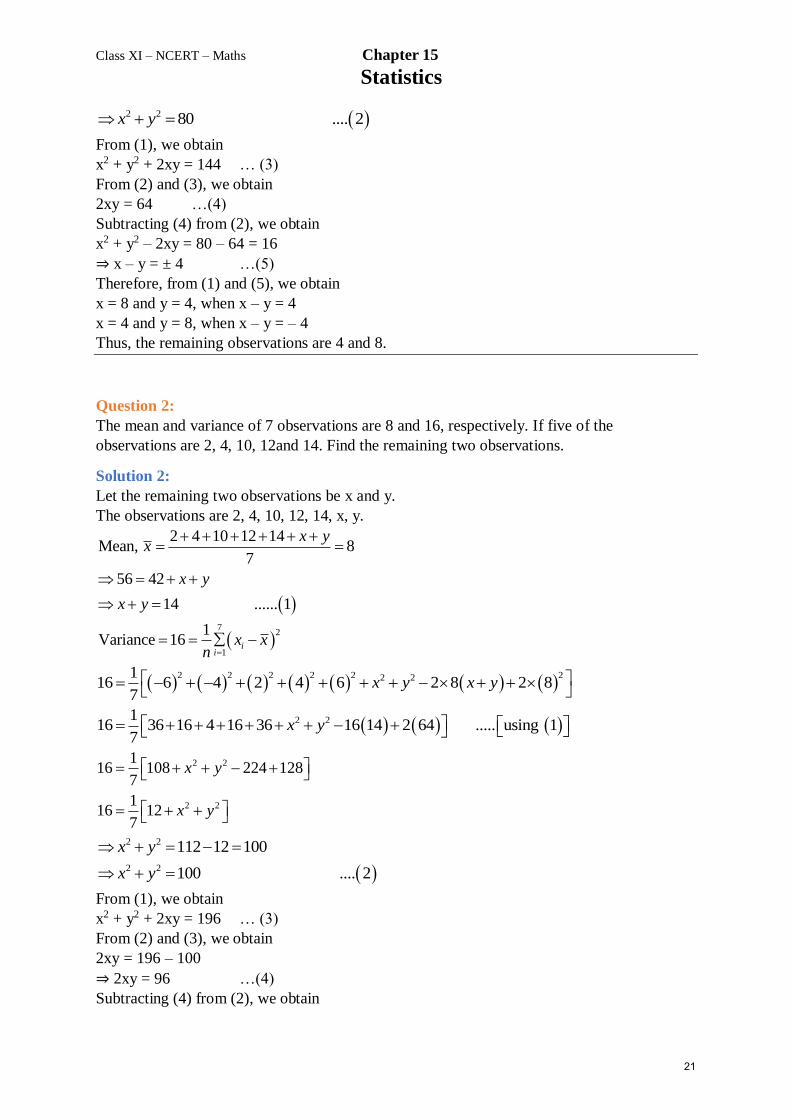
2 2 80 .... 2x y
From (1), we obtain
x2 + y2 + 2xy = 144 … (3)
From (2) and (3), we obtain
2xy = 64 …(4)
Subtracting (4) from (2), we obtain
x2 + y2 – 2xy = 80 – 64 = 16
⇒ x – y = ± 4 …(5)
Therefore, from (1) and (5), we obtain
x = 8 and y = 4, when x – y = 4
x = 4 and y = 8, when x – y = – 4
Thus, the remaining observations are 4 and 8.
Question 2:
The mean and variance of 7 observations are 8 and 16, respectively. If five of the
observations are 2, 4, 10, 12and 14. Find the remaining two observations.
Solution 2:
Let the remaining two observations be x and y.
The observations are 2, 4, 10, 12, 14, x, y.
7
2
1
2 4 10 12 14Mean, 8
7
56 42
14 ...... 1
1Variance 16 i
i
x yx
x y
x y
x xn
2 2 2 2 2 22 21
16 6 4 2 4 6 2 8 2 87
x y x y
2 2116 36 16 4 16 36 16 14 2 64 ..... using 1
7x y
2 2
2 2
116 108 224 128
7
116 12
7
x y
x y
2 2
2 2
112 12 100
100 .... 2
x y
x y
From (1), we obtain
x2 + y2 + 2xy = 196 … (3)
From (2) and (3), we obtain
2xy = 196 – 100
⇒ 2xy = 96 …(4)
Subtracting (4) from (2), we obtain
21
Class XI – NCERT – Maths Chapter 15
Statistics
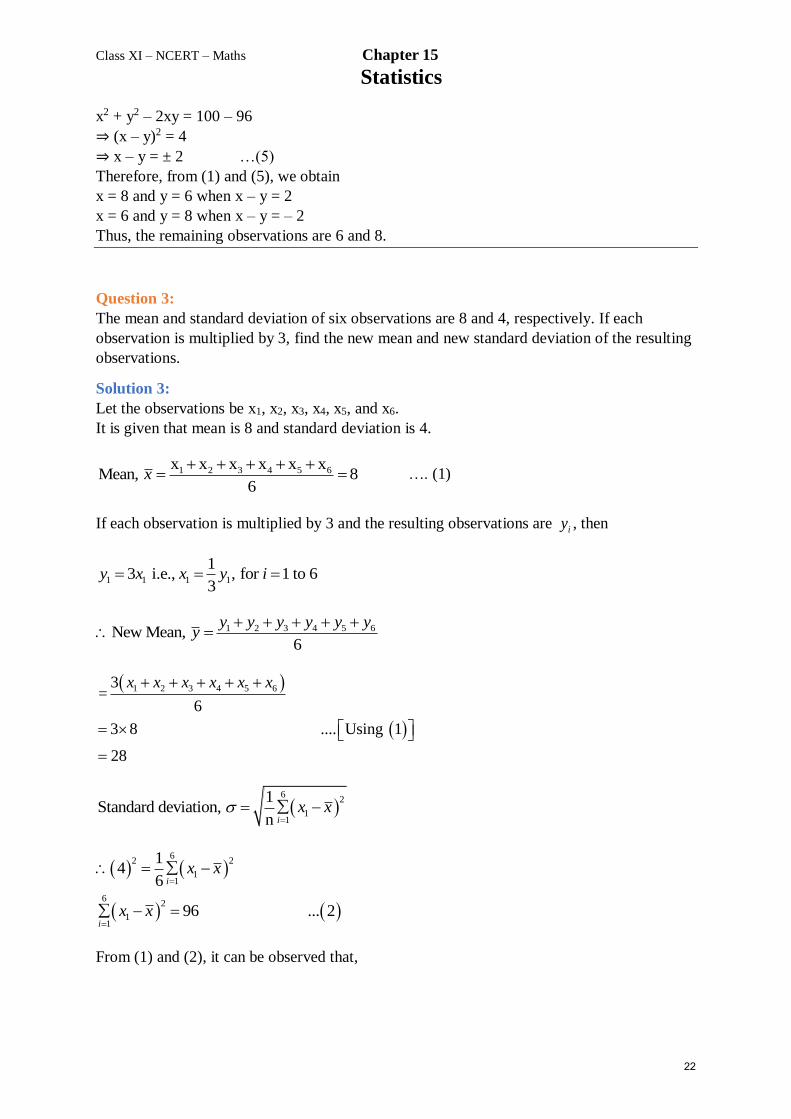
x2 + y2 – 2xy = 100 – 96
⇒ (x – y)2 = 4
⇒ x – y = ± 2 …(5)
Therefore, from (1) and (5), we obtain
x = 8 and y = 6 when x – y = 2
x = 6 and y = 8 when x – y = – 2
Thus, the remaining observations are 6 and 8.
Question 3:
The mean and standard deviation of six observations are 8 and 4, respectively. If each
observation is multiplied by 3, find the new mean and new standard deviation of the resulting
observations.
Solution 3:
Let the observations be x1, x2, x3, x4, x5, and x6.
It is given that mean is 8 and standard deviation is 4.
1 2 3 4 5 6x x x x x xMean, 8
6x
…. (1)
If each observation is multiplied by 3 and the resulting observations are iy , then
1 1 1 1
13 i.e., , for 1 to 6
3y x x y i
1 2 3 4 5 6New Mean,6
y y y y y yy
1 2 3 4 5 63=
6
3 8 .... Using 1
28
x x x x x x
6
2
11
1Standard deviation,
n i
x x
62 2
11
62
11
14
6
96 ... 2
i
i
x x
x x
From (1) and (2), it can be observed that,
22
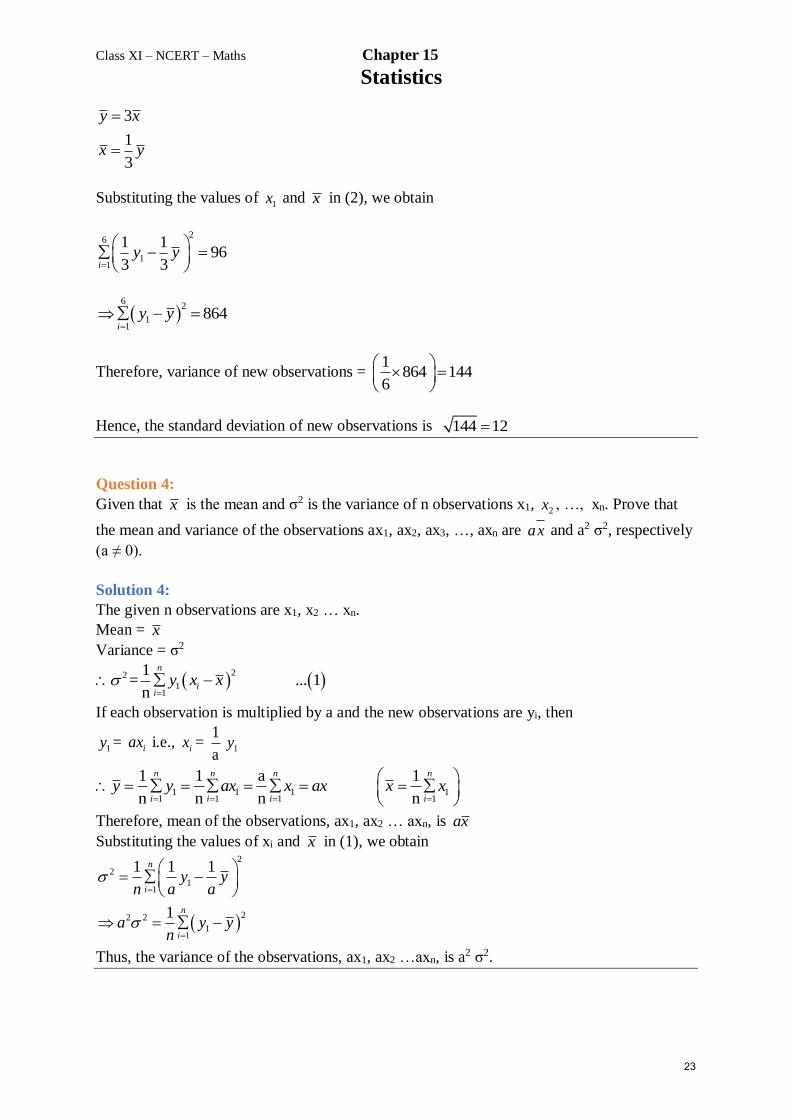
Class XI – NCERT – Maths Chapter 15
Statistics
3
1
3
y x
x y
Substituting the values of 1x and x in (2), we obtain
26
11
1 196
3 3i
y y
6
2
11
864i
y y
Therefore, variance of new observations = 1
864 1446
Hence, the standard deviation of new observations is 144 12
Question 4:
Given that x is the mean and σ2 is the variance of n observations x1, 2x , …, xn. Prove that
the mean and variance of the observations ax1, ax2, ax3, …, axn are ax and a2 σ2, respectively
(a ≠ 0).
Solution 4:
The given n observations are x1, x2 … xn.
Mean = x
Variance = σ2
22
11
1= ... 1
n
n
ii
y x x
If each observation is multiplied by a and the new observations are yi, then
1y = iax i.e., ix = 1
a1y
1 1 1 11 1 1 1
1 1 a 1
n n n n
n n n n
i i i i
y y ax x ax x x
Therefore, mean of the observations, ax1, ax2 … axn, is ax
Substituting the values of xi and x in (1), we obtain
2
2
11
22 2
11
1 1 1
1
n
i
n
i
y yn a a
a y yn
Thus, the variance of the observations, ax1, ax2 …axn, is a2 σ2.
23
Class XI – NCERT – Maths Chapter 15
Statistics
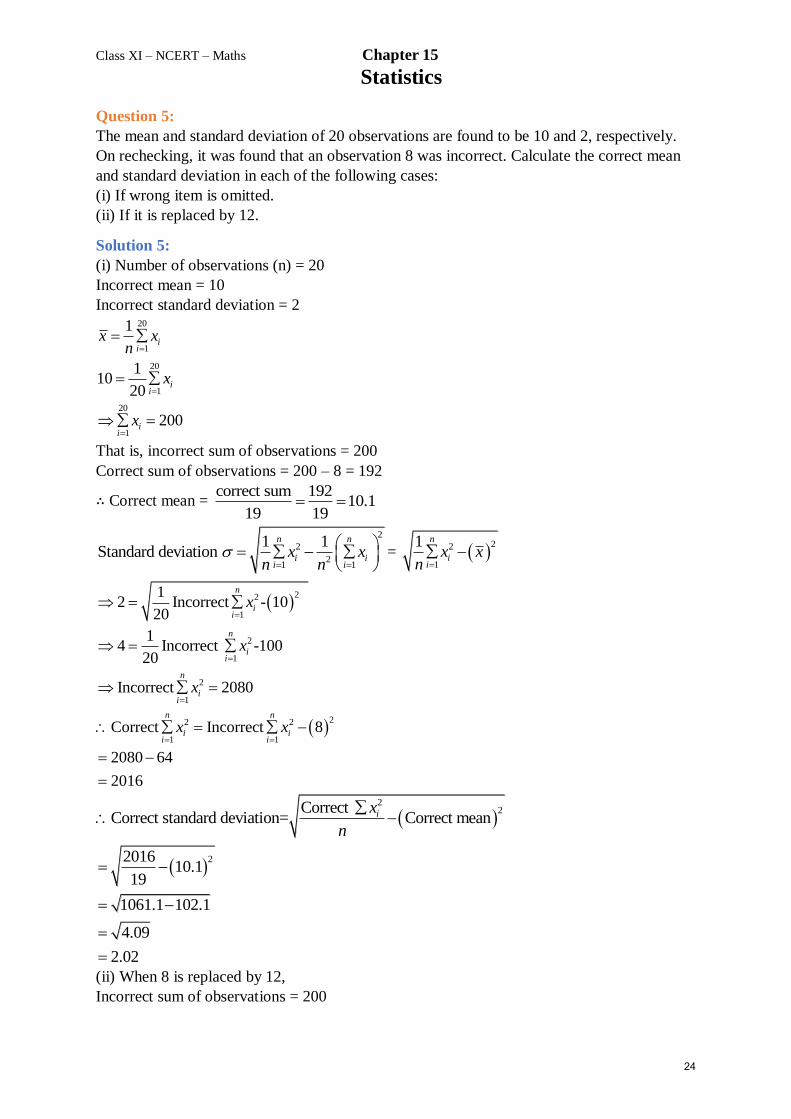
Question 5:
The mean and standard deviation of 20 observations are found to be 10 and 2, respectively.
On rechecking, it was found that an observation 8 was incorrect. Calculate the correct mean
and standard deviation in each of the following cases:
(i) If wrong item is omitted.
(ii) If it is replaced by 12.
Solution 5:
(i) Number of observations (n) = 20
Incorrect mean = 10
Incorrect standard deviation = 2 20
1
20
1
20
1
1
110
20
200
ii
ii
ii
x xn
x
x
That is, incorrect sum of observations = 200
Correct sum of observations = 200 – 8 = 192
∴ Correct mean = correct sum 192
10.119 19
2
2
21 1
1 1Standard deviation
n n
i ii i
x xn n
=
22
1
1 n
ii
x xn
22
1
2
1
2
1
12 Incorrect - 10
20
14 Incorrect -100
20
Incorrect 2080
n
ii
n
ii
n
ii
x
x
x
22 2
1 1
Correct Incorrect 8
2080 64
2016
n n
i ii i
x x
2
2Correct Correct standard deviation= Correct meanix
n
22016
10.119
1061.1 102.1
4.09
2.02
(ii) When 8 is replaced by 12,
Incorrect sum of observations = 200
24
Class XI – NCERT – Maths Chapter 15
Statistics
∴ Correct sum of observations = 200 – 8 + 12 = 204
Correct sum 204Correct mean= 10.2
20 20
2
22 2
21 1 1
1 1 1Standard deviation =
n n n
i i ii i i
x x x xn n n
2 2
1
2
1
12 Incorrect -(10)
20
14 Incorrect -100
20
n
ii
n
ii
x
x
2
1
2 22 2
1
Incorrect 2080
Correct Incorrect 8 12
n
ii
n
i ii
x
x x
= 2080 – 64 + 144
= 2160
2
2Correct Correct standard deviation Correct meanix
n
22160(10.2)
20
108 104.04
3.96
= 1.98
Question 6:
The mean and standard deviation of marks obtained by 50 students of a class in three subjects,
Mathematics, Physics and Chemistry are given below:
Subject Mathematics Physics Chemistry
Mean 42 32 40.9
Standard deviation 12 15 20
Which of the three subjects shows the highest variability in marks and which shows the
lowest?
Solution 6:
Standard deviation of Mathematics = 12
Standard deviation of Physics = 15
Standard deviation of Chemistry = 20
The coefficient of variation (C.V.) is given by Standard deviation
100Mean
25
Class XI – NCERT – Maths Chapter 15
Statistics
12C.V. (in Mathematics) 100 28.57
42
15C.V. (in Physics) 100 46.87
32
20C.V. (in Chemistry) 100 48.89
40.9
The subject with greater C.V. is more variable than others.
Therefore, the highest variability in marks is in Chemistry and the lowest variability in marks
is in Mathematics.
Question 7:
The mean and standard deviation of a group of 100 observations were found to be 20 and 3,
respectively. Later on it was found that three observations were incorrect, which were
recorded as 21, 21 and 18. Find the mean and standard deviation if the incorrect observations
are omitted.
Solution 7:
Number of observations (n) = 100
Incorrect mean 20x
Incorrect standard deviation 3
100
1
100
1
120
100
20 100 2000
ii
ii
x
x
Incorrect sum of observations = 2000
⇒ Correct sum of observations = 2000 – 21 – 21 – 18 = 2000 – 60 = 1940
26