classification and compensation study - fort worth,...
TRANSCRIPT

Copyright © 2014 by The Segal Group, Inc. All rights reserved.
Employee Briefings June 17-19, 2015
Classification and Compensation Study
City of Ft. Worth, Texas
Presented by: Ruth Ann Eledge, SPHR Vice President and Senior Consultant

2
Provide update on status of the Study
Review Key Phases of the Project
Understand Project Methodology
Review Next Steps
Purpose of Today’s Meeting
3
Job Analysis
A thorough review of all classifications A thorough review of all classifications is being completed
Job Description Questionnaires (JDQs) collected to provide accurate and up-to-date job documentation
Job Evaluation Manual (JEMs) completed by management to provide information on internal relationships between position
Employee interviews and focus groups to clarify job requirements and responsibilities
Feedback and meetings with department directors
Clarification of job relationships and groupings
Review of overtime status for all positions (Exempt vs. Non-exempt)

4
Job Analysis
A thorough review of all classifications A thorough review of all classifications is being completed
Updated classification system to be published in August
Recommendations have been reviewed by department directors
Job titles that reflect current duties
Job descriptions are being written that reflect job requirements and scope of responsibilities with an expected completion date in early July

5
Internal Equity Review through Point Factor Evaluations
A system that establishes the value of positions relative to one another
Two systems used: Exempt jobs and Non-exempt jobs
Use of key factors:
• Formal Education
• Experience
• Management/Supervision
• Human Collaboration
• Freedom to Act
• Technical Skills
• Working Conditions
• Fiscal Responsibility (for exempt positions only)

6
Market Comparison
Market Survey Benchmarks
City of Arlington, TX City of Mesquite, TX City of Austin, TX City of Nashville, TN City of Carrollton, TX City of Oklahoma City, OK City of Charlotte, NC City of Plano, TX City of Dallas, TX City of Portland, OR City of Denver, CO City of Richardson, TX City of El Paso, TX City of San Antonio, TX City of Garland, TX City of San Jose, CA City of Grand Prairie, TX City of Seattle, WA City of Irving, TX City of Tucson, AZ City of Kansas City, MO City of Tulsa, OK City of Las Vegas, NV City of Virginia Beach, VA City of Lubbock, TX Dallas County City of Memphis, TN Tarrant County
Published private sector data from multiple sources

7
Use of Public and Private Sector Data
Weighted 50% private sector/50% public sector to identify market average
Market Data collected on 134 benchmark jobs
Use of Geographic Differential (outside of Dallas Metroplex) to adjust for regional differences in cost of labor
Aged data to 10/1/15
Use of average salaries for comparison to midpoints of each structure
Positions reviewed separately for Exempt, Non-Exempt, Exempt IT, and Executive jobs
Market Comparison
8
Market Comparison
30,000
40,000
50,000
60,000
70,000
80,000
90,000
100,000
110,000
120,000
130,000
140,000
150,000
160,000
170,000
180,000
190,000
200,000
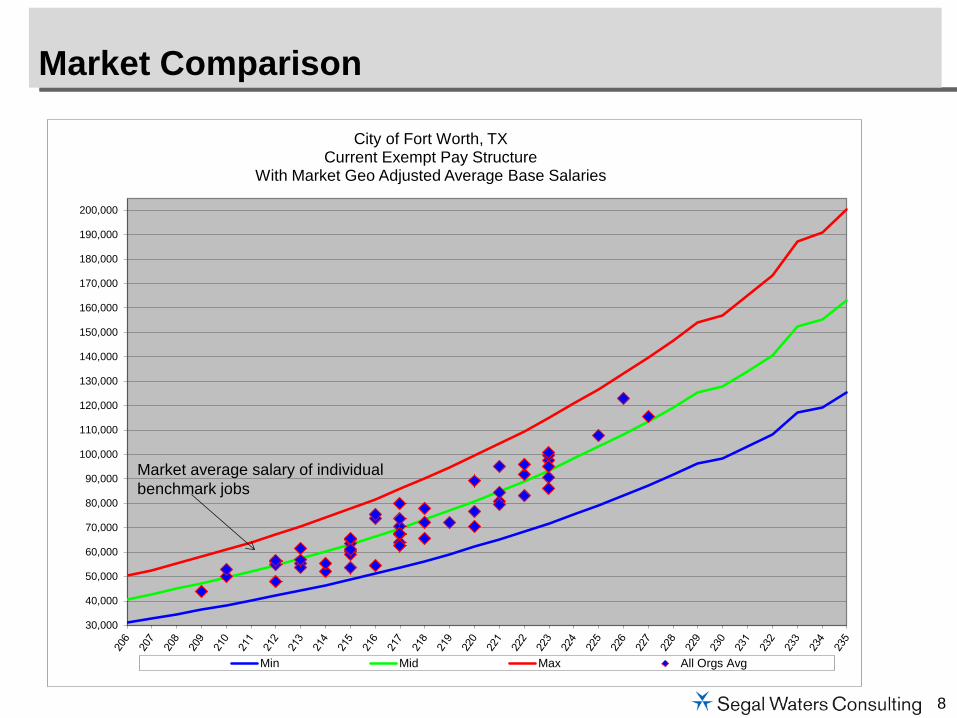
City of Fort Worth, TX Current Exempt Pay Structure
With Market Geo Adjusted Average Base Salaries
Min Mid Max All Orgs Avg
Market average salary of individual benchmark jobs

9
Market Comparison
35,000
45,000
55,000
65,000
75,000
85,000
95,000
105,000
115,000
125,000
1 2 3 4 5 6 7 8 9 10 11 12 13 14
City of Fort Worth, TX Current Exempt IT Pay Structure
With Market Geo Adjusted Average Base Salaries
Min Mid Max All Orgs Avg
Lagging market

10
Market Comparison
15,000
25,000
35,000
45,000
55,000
65,000
75,000
City of Fort Worth, TX Current Non-Exempt Pay Structure
With Market Geo Adjusted Average Base Salaries
Min Mid Max All Orgs Avg
Lagging market

11
Desired competitive position and City’s ability to pay/compete
Relationship of new structure with survey statistics targeted at market average
Strategic design of new structure- width of ranges and number of grades, number of structures
Analysis of each employee’s current pay in new structure
Structure Development
Customized Salary Structures

12
20,000
30,000
40,000
50,000
60,000
70,000
80,000
90,000
204 205 206 207 208 209 210 211 212 213 214 215 216 217
Sample: Plotting of Market Average Salaries
All Orgs Wtd Avg
Structure Development Methodology

13
Structure Development Methodology
20,000
30,000
40,000
50,000
60,000
70,000
80,000
90,000
204 205 206 207 208 209 210 211 212 213 214 215 216 217
Sample Drawing pay line with Market Average Salaries
Mid All Orgs Wtd Avg

14
Structure Development Methodology
20,000
30,000
40,000
50,000
60,000
70,000
80,000
90,000
204 205 206 207 208 209 210 211 212 213 214 215 216 217
Sample: Creating Minimums and Maximums for Ranges with Market Average
Salaries
Min Mid Max All Orgs Wtd Avg

15
30,000
40,000
50,000
60,000
70,000
80,000
90,000
100,000
110,000
120,000
130,000
140,000
150,000
604 605 606 607 608 609 610 611 612 613 614 615
City of Fort Worth, TX Proposed Exempt Pay Structure
With Market Geo Adjusted Average Base Salaries
Min Mid Max All Orgs Avg
Proposed Exempt Structure

16
Proposed Non-Exempt Structure
20,000
30,000
40,000
50,000
60,000
70,000
80,000
500 501 502 503 504 505 506 507 508 509 510 511 512
City of Fort Worth, TX Proposed Non-Exempt Pay Structure
With Market Geo Adjusted Average Base Salaries
Min Mid Max All Orgs Avg

17
Proposed IT Exempt Structure
30,000
40,000
50,000
60,000
70,000
80,000
90,000
100,000
110,000
120,000
130,000
140,000
150,000
160,000
1 2 3 4 5 6 7 8 9 10 11
City of Fort Worth, TX Proposed Exempt IT Pay Structure
With Market Geo Adjusted Average Base Salaries
Min Mid Max All Orgs Avg

18
Exempt: • 21 grades* • 60% spreads • 5% differentials
Non-exempt: • 20 grades* • 41% spreads • 5% differentials
IT Exempt: • 12 grades* • 70% spreads • 5% differentials
*currently in use
Structure Comparison
Current Structures
Exempt: • 13 grades • 60% spreads • 8-10% differentials
Non-exempt: • 13 grades • 50% spreads • 7% differentials
IT Exempt: • 9 grades • 60% spreads • 9% differentials
Proposed Structures

19
Updated classification system with documentation of job duties and requirements
Placement of jobs in grades based on sound, defensible methodology
Ranges anchored to valid market data
Review of employee pay progression in new ranges
Benefits of the Proposed Structures
20
Employee letters in late July/early August
Implementation of the new job titles, pay grades, and salary structure in August
There will be no loss in pay
Appeals Process
• Conducted in October
• Criteria will be provided at a later date
Next Steps

21
Further Questions