classification of fowl adenovirus serotypes by use of high ... · pdf filemelting-curve...
TRANSCRIPT

Published Ahead of Print 26 November 2008. 10.1128/JCM.01567-08.
2009, 47(2):311. DOI:J. Clin. Microbiol. and Amir H. NoormohammadiPenelope A. Steer, Naomi C. Kirkpatrick, Denise O'Rourke RegionMelting-Curve Analysis of the Hexon GeneSerotypes by Use of High-Resolution Classification of Fowl Adenovirus
http://jcm.asm.org/content/47/2/311Updated information and services can be found at:
These include:
REFERENCEShttp://jcm.asm.org/content/47/2/311#ref-list-1at:
This article cites 58 articles, 18 of which can be accessed free
CONTENT ALERTS more»articles cite this article),
Receive: RSS Feeds, eTOCs, free email alerts (when new
CORRECTIONS herethis page, please click
An erratum has been published regarding this article. To view
http://jcm.asm.org/site/misc/reprints.xhtmlInformation about commercial reprint orders: http://journals.asm.org/site/subscriptions/To subscribe to to another ASM Journal go to:
on March 20, 2012 by guest
http://jcm.asm
.org/D
ownloaded from
JOURNAL OF CLINICAL MICROBIOLOGY, Feb. 2009, p. 311–321 Vol. 47, No. 20095-1137/09/$08.00�0 doi:10.1128/JCM.01567-08Copyright © 2009, American Society for Microbiology. All Rights Reserved.
Classification of Fowl Adenovirus Serotypes by Use ofHigh-Resolution Melting-Curve Analysis of the Hexon
Gene Region�
Penelope A. Steer, Naomi C. Kirkpatrick, Denise O’Rourke, and Amir H. Noormohammadi*Faculty of Veterinary Science, The University of Melbourne, Werribee, Victoria 3030, Australia
Received 12 August 2008/Returned for modification 16 October 2008/Accepted 18 November 2008
Identification of fowl adenovirus (FAdV) serotypes is of importance in epidemiological studies of diseaseoutbreaks and the adoption of vaccination strategies. In this study, real-time PCR and subsequent high-resolution melting (HRM)-curve analysis of three regions of the hexon gene were developed and assessed fortheir potential in differentiating 12 FAdV reference serotypes. The results were compared to previouslydescribed PCR and restriction enzyme analyses of the hexon gene. Both HRM-curve analysis of a 191-bp regionof the hexon gene and restriction enzyme analysis failed to distinguish a number of serotypes used in this study.In addition, PCR of the region spanning nucleotides (nt) 144 to 1040 failed to amplify FAdV-5 in sufficientquantities for further analysis. However, HRM-curve analysis of the region spanning nt 301 to 890 proved asensitive and specific method of differentiating all 12 serotypes. All melt curves were highly reproducible, andreplicates of each serotype were correctly genotyped with a mean confidence value of more than 99% usingnormalized HRM curves. Sequencing analysis revealed that each profile was related to a unique sequence, withsome sequences sharing greater than 94% identity. Melting-curve profiles were found to be related mainly toGC composition and distribution throughout the amplicons, regardless of sequence identity. The resultspresented in this study show that the closed-tube method of PCR and HRM-curve analysis provides anaccurate, rapid, and robust genotyping technique for the identification of FAdV serotypes and can be used asa model for developing genotyping techniques for other pathogens.
Fowl adenoviruses (FAdVs), belonging to the Aviadenovirusgenus of the family Adenoviridae (19), have been grouped intofive species based on their molecular structure and furtherdivided into 12 serotypes, based largely on cross-neutralizationassays (18). There are several strains in each serotype. FAdVsare endemic worldwide and known to cause inclusion bodyhepatitis, quail bronchitis, hydropericardium syndrome (18,28), gizzard erosion, and pancreatic necrosis (33, 34, 43,44, 56).
Diagnosis of FAdV infections can be made from the obser-vation of gross and histopathological changes in the liver andthe use of electron microscopy (3, 11) and various serologicaltests, such as enzyme-linked immunosorbent assay (3, 18, 45),agar gel immunodiffusion, counterimmunoelectrophoresis, in-direct hemagglutination, immunofluorescence (3), and South-ern hybridization (10, 12). Identification of the serotype(s)involved is very useful for epidemiological tracing and is ofcritical importance where vaccination is to be used for thecontrol of the disease (3, 20). Typing of the virus convention-ally requires isolation in cell culture, followed by a virus neu-tralization assay (16); however, the implementation of thismethod is lengthy and labor intensive, and cross-reactivity be-tween serotypes can sometimes render results inconclusive.Tests using PCR together with DNA sequencing (22, 59)and/or restriction enzyme analysis (29, 48, 50) have recently
been used for comparatively faster FAdV typing. However,these methods are still time consuming, often require extensiveinterpretation, and can be relatively expensive to use as aroutine typing tool.
Recent research has found that the technique of combiningPCR with high-resolution melting (HRM)-curve analysis pro-vides a useful and cost-effective alternative for the direct anal-ysis of genetic variation, particularly when large numbers ofsamples are to be analyzed. HRM-curve analysis of PCR am-plicons has been shown to aid in clinical (52) and/or epidemi-ological (5, 36) investigations, by providing means for rapidand effective genotyping, variation scanning, microbial detec-tion, and species determination (13, 21, 26, 53). When meltedin the presence of a saturating intercalating fluorescent dye,such as LCGreen I or Styo 9 (17, 31, 46), and acquiring fluo-rescence data over small temperature increments, ampliconscontaining different sequences can be discriminated based onthe melting transition of the PCR product and the resultingmelt curve shape.
Commonly, amplicons of fewer than 200 bp have been usedfor detection of single nucleotide polymorphisms, mutationscanning, and genotyping (26), as slight shifts in the meltingdomain are easily detected. The use of larger amplicons hasbeen reported to reduce sensitivity and specificity of HRM-curve analysis (6, 24, 25, 60). However, some studies havereported that the melting of larger amplicons, up to 1,000 bp,may produce multiple melting domains and can be used forgenotyping (8, 21, 46, 47). The presence of more than onemelting domain, as depicted by multiple peaks in the conven-tional melt curve profile, adds further variation to the normal-ized HRM-curve profile, thus increasing the power of the
* Corresponding author. Mailing address: Faculty of Veterinary Sci-ence, The University of Melbourne, 250 Princes Highway, Werribee,Victoria 3030, Australia. Phone: 61 3 9731 2275. Fax: 61 3 9731 2366.E-mail: [email protected].
� Published ahead of print on 26 November 2008.
311
on March 20, 2012 by guest
http://jcm.asm
.org/D
ownloaded from
HRM-curve analysis technique for sequence differentiationand genotyping (21, 26, 58).
The adenovirus hexon is the major capsid protein of FAdVand contains type-, group-, and subgroup-specific antigenicdeterminants (18, 28, 35). Several reports have used PCR ofdifferent regions of the FAdV viral gene for detection, differ-entiation, and phylogenetic analysis of FAdVs (29, 48, 50, 59).The hexon loop 1 (L1) region, flanked by pedestal 1 (P1),represents the most variable region and has, when used in PCRcoupled with DNA sequencing or restriction enzyme analysis,proved most successful in identifying and differentiating someor all of the 12 FAdV serotypes (2, 29, 30, 37, 48).
The aim of the present study was to investigate the applica-tion of HRM-curve analysis of PCR amplicons of differentsizes from the hexon gene L1 and P1 region of representativestrains of the 12 FAdV serotypes, using the DNA intercalatingdye Syto 9, to establish a single closed-tube test method forFAdV serotype differentiation. Both conventional and normal-ized dissociation plots were generated, and genotyping wasapplied to differentiate the serotypes, and the results werecompared with those of existing FAdV typing methods of PCR
and restriction enzyme analysis of the hexon gene and DNAsequencing of PCR amplicons.
MATERIALS AND METHODS
Viral strains. Representative strains of the 12 known serotypes of FAdV-1 to-7, -8a, -8b, and -9 to -11) were provided by Intervet International (Boxmeer, TheNetherlands) (Table 1). Each live unattenuated FAdV strain was propagated inchicken embryo liver cells from 14-day-old specific-pathogen-free embryos(Charles River Laboratories, Australia). Cells in culture flasks (25 cm2) wereinoculated with 1 � 106 cells per ml in BioWhittaker medium 199 (CambrexBioscience Walkersville, Inc.) containing 5% calf serum (Invitrogen), to a totalvolume of 10 ml, and incubated at 37°C with 5% CO2. Medium was changedevery 1 to 2 days, until the cell monolayer became confluent (approximately 3 to4 days). Chicken embryo liver cell culture monolayer was inoculated with 495 �lmedium 199 with 1% calf serum and 5 �l of live virus, incubated for 1 h at 37°Cwith 5% CO2 and agitated every 10 to 15 min. Medium was made up to 10 ml andcell culture incubated until more than 80% cytopathic effect was observed.Propagated virus was harvested by freezing (�70°C)/thawing the culture twice,removing the infected medium, and centrifuging at 1,000 � g for 5 min toseparate cell debris. The supernatant was stored in aliquots at �70°C.
Additionally, an Australian field strain (FI-W888-05) isolated from the liver ofa 30-day-old broiler, was propagated as described above and the serotype estab-lished as ICTV serotype 8b by Intervet International (Boxmeer, The Nether-lands). The commercially available Australian FAdV-8b vaccine strain (IntervetPty Ltd.) was reconstituted according to the manufacturer’s instructions and usedfor DNA extraction.
Extraction of viral DNA. Viral DNA was extracted from virus propagated incultures and from Australian FAdV vaccine. A 10-�l volume of each virussample was solubilized in 300 �l of RLT lysis buffer (Qiagen, Valencia, CA)containing 3 �l of �-mercaptoethanol (1.12 g/ml) and incubated at 4°C overnight.A volume of 15 �l of Qiaex II suspension (Qiagen) and 300 �l of 70% ethanolwas combined and then added to the sample mixture. This mixture was loadedinto a multispin MSK-100 column (Axygen, Inc., Hayward, CA) and placed in awash tube. Columns were centrifuged for 30 s at 13,500 � g in a microcentrifuge,and the flowthrough was discarded. The matrix was washed once with 600 �lbuffer RW1 (Qiagen) and twice with 500 �l buffer RPE (Qiagen). For each wash,columns were centrifuged for 30 s at 13,500 � g and the flowthrough wasdiscarded, and then the columns were centrifuged for 90 s at 19,000 � g to drythe matrix. The matrix was overlaid with 30 �l of diethyl pyrocarbonate-treatedwater and incubated at room temperature for 1 min, and DNA was eluted bycentrifugation of the column for 60 s at 13,500 � g. The DNA elution step wasrepeated to obtain a final elution volume of 60 �l. The elutions containingextracted viral DNA were used immediately or stored at �20°C prior to usein PCR.
Real-time PCR for amplification of three regions of FAdV hexon gene. Threesets of forward and reverse degenerate oligonucleotide primers (Table 2) bindingto the conserved P1 region of the FAdV hexon gene were used to amplifydifferent regions of P1 and L1 (Fig. 1). The HEX-S forward and reverse primerswere designed by comparison of the published hexon gene nucleotide sequencesof all 12 FAdV serotypes (National Center for Biotechnology Information,GenBank [4], sequence accession numbers AF339914, AF508946, AF508948,AF508951, AF508952, AF508954, AF508955, AF508956, AF508958, AF508959,AF339920, and AF339925) to amplify a region of P1 containing as small as 2-bp
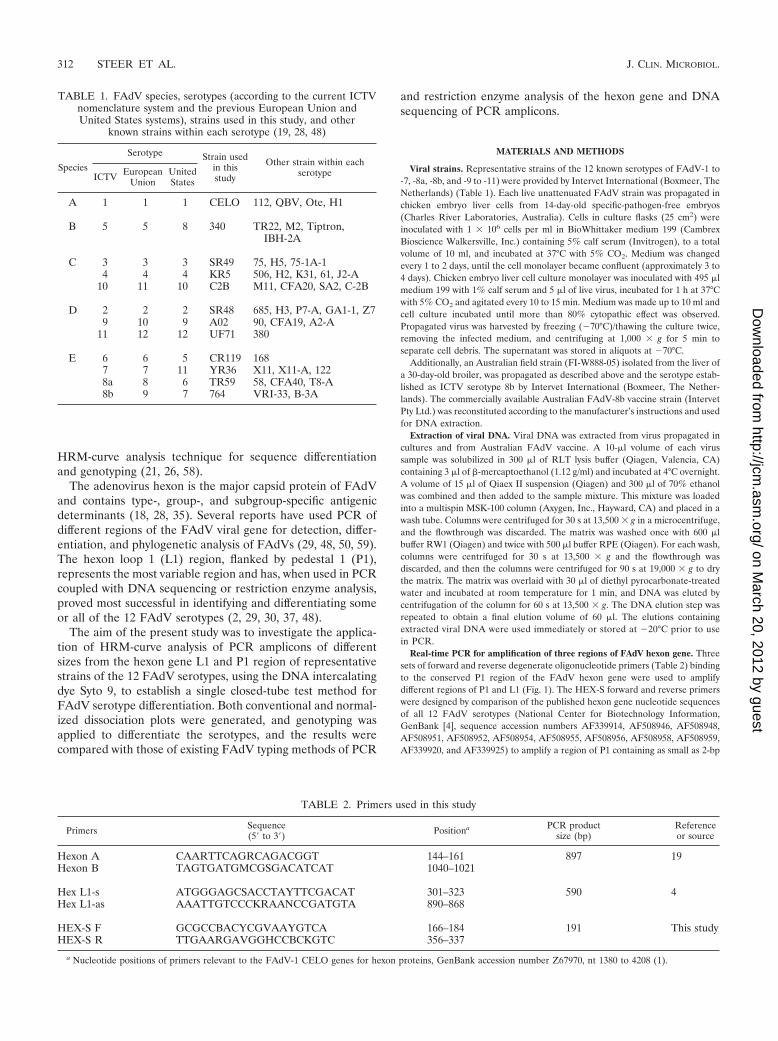
TABLE 1. FAdV species, serotypes (according to the current ICTVnomenclature system and the previous European Union andUnited States systems), strains used in this study, and other
known strains within each serotype (19, 28, 48)
Species
Serotype Strain usedin thisstudy
Other strain within eachserotypeICTV European
UnionUnitedStates
A 1 1 1 CELO 112, QBV, Ote, H1
B 5 5 8 340 TR22, M2, Tiptron,IBH-2A
C 3 3 3 SR49 75, H5, 75-1A-14 4 4 KR5 506, H2, K31, 61, J2-A
10 11 10 C2B M11, CFA20, SA2, C-2B
D 2 2 2 SR48 685, H3, P7-A, GA1-1, Z79 10 9 A02 90, CFA19, A2-A
11 12 12 UF71 380
E 6 6 5 CR119 1687 7 11 YR36 X11, X11-A, 1228a 8 6 TR59 58, CFA40, T8-A8b 9 7 764 VRI-33, B-3A
TABLE 2. Primers used in this study
Primers Sequence(5� to 3�) Positiona PCR product
size (bp)Referenceor source
Hexon A CAARTTCAGRCAGACGGT 144–161 897 19Hexon B TAGTGATGMCGSGACATCAT 1040–1021
Hex L1-s ATGGGAGCSACCTAYTTCGACAT 301–323 590 4Hex L1-as AAATTGTCCCKRAANCCGATGTA 890–868
HEX-S F GCGCCBACYCGVAAYGTCA 166–184 191 This studyHEX-S R TTGAARGAVGGHCCBCKGTC 356–337
a Nucleotide positions of primers relevant to the FAdV-1 CELO genes for hexon proteins, GenBank accession number Z67970, nt 1380 to 4208 (1).
312 STEER ET AL. J. CLIN. MICROBIOL.
on March 20, 2012 by guest
http://jcm.asm
.org/D
ownloaded from

changes between serotypes. All primers were manufactured by InvitrogenPty Ltd.
Amplification of target sequences was carried out using a Rotor-Gene 6000thermal cycler (Corbett Life Science Pty Ltd). A 25-�l reaction mixture consistedof 4 �l of deoxynucleoside triphosphates at 1.25 mM, 2 �l of each primer at 25�M, 5 �l of 5� GoTaq Green Flexi reaction buffer (Promega), 2 �l of 5 �M Syto9 green fluorescent nucleic acid stain (Invitrogen), 1.25 U of GoTaq Flexi DNApolymerase, 2 �l of extracted viral DNA, and 1, 2, and 3 �l of 25 mM MgCl2 forHexon A/B, Hex L1, and HEX-S PCR, respectively.
The reaction mixtures were subjected to 94°C for 2 min, and then, for theHexon A/B and Hex L1 primer sets, 40 cycles of 94°C for 20 s, 62°C (56°C for HexL1 primer set) for 20 s, and 72°C for 30 s, and for the HEX-S primer set, 50 cyclesof 94°C for 15 s, 60°C for 15 s, and 72°C for 20 s. Optical measurements in greenchannel (excitation at 470 nm and detection at 510 nm) were recorded during theextension step. After completion of PCR cycles, a final extension of 72°C for 2min was performed.
The PCR products were analyzed by electrophoresis in 1.5% agarose gelsstained with GelRed (Biotium, Hayward, CA), and visualized by UV transillu-mination.
Restriction enzyme analysis. Restriction enzyme analysis of Hexon A/B PCRproducts was performed as described previously (29), with some modifications.Briefly, 4 �l of PCR product from each reference serotype (except for FAdV-5,which yielded very low-level or no amplification with Hexon A/B primers) weredigested for 3 h with 10 U of each restriction enzyme (New England BioLabs) ina total volume of 20 �l. Restriction fragments were separated in 2% agarose gelstained with GelRed and visualized by UV transillumination.
HRM-curve acquisition and analysis. HRM-curve analysis was performed onthe Rotor-Gene 6000 using identical volumes of PCR products subjected to atemperature increasing from 80 to 94°C at intervals (ramps) of 0.1°C/s or0.15°C/s. HRM-curve analysis was performed using Rotor-Gene 6000 1.7.87software and the HRM algorithm provided. All amplicons were tested in tripli-cate to detect variations induced by technical errors.
The conventional melt curves were generated automatically and contained oneor more peaks, depending on the amplicon tested. To generate the normalizedHRM curves, normalization regions were applied to the curves as follows:HEX-S, 84.97 to 85.47 and 90.48 to 91.00; Hex L1, 84.50 to 85.00 and 90.50 to91.00; and Hexon A/B, 81.00 to 81.40 and 90.50 to 90.90. Genotypes were definedby selecting a representative sample from each serotype. The software thenauto-called the genotype of each sample and provided confidence percentages(C%) as an integrity check. A confidence threshold was not applied to theanalysis in order to view the genotype and C% assigned to each sample replicate.Profiles giving a C% of less than 95% to any of the existing profiles wereconsidered distinctly different profiles. The means of the C% of the samplereplicates correctly assigned to a representative genotype, together with thestandard error (SE), were calculated using Microsoft Office Excel (2003).
DNA sequence analysis. Amplicons were gel purified using the QIAquick gelpurification kit (Qiagen) according to the manufacturer’s instructions, eluted in30 �l of buffer E, and then subjected to automated sequencing (BigDye Termi-nator version 3.1, Applied Biosystems) in both directions using the same primersused for PCR. The sequences in the approximately 590-bp region (amplified byprimers Hex L1-s and Hex L1-as) were analyzed using ClustalW and DNAdist in
BioManager (Australian National Genomic Information Service, Sydney Bioin-formatics) and BioEdit Sequence Alignment Editor (version 6.0.9.0).
Nucleotide sequence accession number. GenBank accession numbers wereassigned to the nucleotide sequences of the FAdV reference strains as fol-lows: FAdV-1 CELO, EU979367; FAdV-2 SR48, EU979368; FAdV-3 SR49,EU979369; FAdV-4 KR5, EU979370; FAdV-5 340, EU979371; FAdV-6 CR119,EU979372; FAdV-7 YR36, EU979373; FAdV-8a TR59, EU979374; FAdV-8b764, EU979375; FAdV-9 A02, EU979376; FAdV-10 C2B, EU979377; andFAdV-11 UF71, EU979378.
RESULTS
PCR amplification of different regions of the hexon genefrom FAdV reference serotypes. Three sets of forward andreverse oligonucleotide primers, HEX-S, Hex L1, and HexonA/B, were used to amplify approximately 191-bp, 590-bp, and897-bp fragments of the hexon gene from the FAdV referenceserotypes, respectively (Fig. 1).
The three primer sets all generated detectable amplicons(by agarose gel electrophoresis) from each of the 12 refer-ence serotypes, with the exception of FAdV-5, whichshowed low-level or no amplification with the Hexon A/Bprimer set (Fig. 2).
The amplification of FAdV-5 with Hexon A/B primers didnot vary with repeated PCRs performed on different days usingdifferent quantities of DNA as templates, DNA extracted fromdifferent samples of propagated virus, or primers manufac-tured on different dates (data not shown). Examination of thenucleotide sequence of the FAdV-5 strain 340 hexon gene,GenBank accession number AF508952 (30), revealed no mis-match with the primers used.
Restriction enzyme analysis of Hexon A/B PCR productsfailed to classify some FAdV reference serotypes. The regionbetween nucleotides (nt) 144 and 1040 (amplified by primersHexon A and B) of the FAdV reference serotypes used in thisstudy were subjected to restriction enzyme analysis using themethod described previously (29). Serotypes 1, 3, 6, 7, 8a, and9 were differentiated by successive use of the restriction endo-nucleases BsiWI, StyI, and MluI. An additional enzyme (BglI)was used to differentiate serotypes 4 and 10. Table 3 shows thedifferent restriction enzyme digestion patterns exhibited, de-noted by profiles A to J.
FAdV serotypes 2 and 11 showed identical restriction pat-
FIG. 1. Schematic presentation of Pl and L1 regions of the FAdV-1 CELO hexon gene and the primers used in this study. The base-pairnumbering of the primer positions is based on the FAdV-1 CELO genes for hexon proteins, GenBank accession number Z67970, nt 1380to 4208 (1).
VOL. 47, 2009 HRM-CURVE ANALYSIS FOR FAdV TYPING 313
on March 20, 2012 by guest
http://jcm.asm
.org/D
ownloaded from
terns (as indicated by profile B in Table 3), even when digestedwith a fourth enzyme, Tth111I (also known as AspI), as rec-ommended (29). Digestion with the enzyme ScaI was not re-quired to differentiate any strains.
Due to low-level or no amplification by the Hexon A/Bprimers, FAdV-5 was not included in the restriction enzymeanalysis.
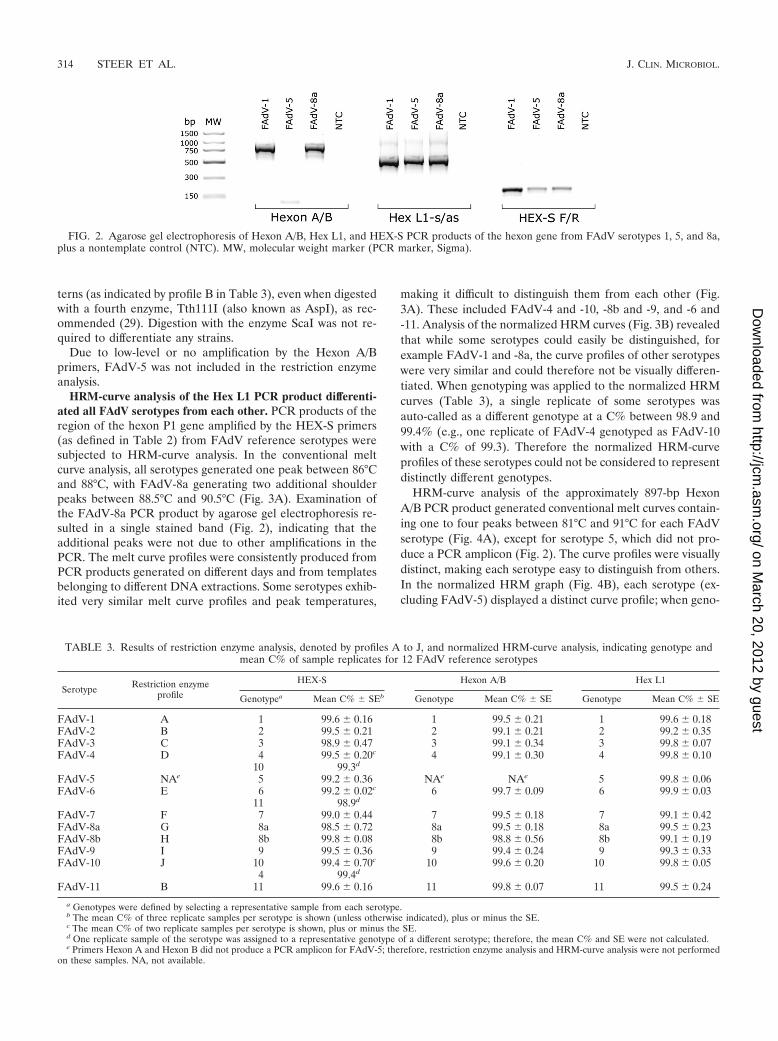
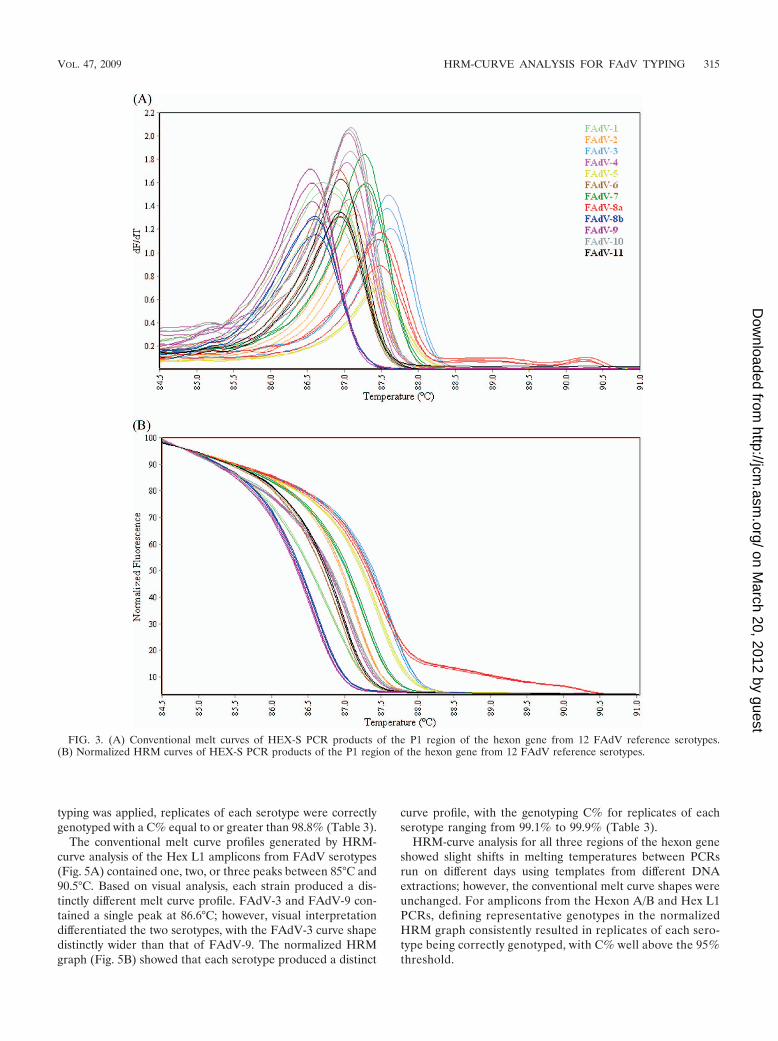
HRM-curve analysis of the Hex L1 PCR product differenti-ated all FAdV serotypes from each other. PCR products of theregion of the hexon P1 gene amplified by the HEX-S primers(as defined in Table 2) from FAdV reference serotypes weresubjected to HRM-curve analysis. In the conventional meltcurve analysis, all serotypes generated one peak between 86°Cand 88°C, with FAdV-8a generating two additional shoulderpeaks between 88.5°C and 90.5°C (Fig. 3A). Examination ofthe FAdV-8a PCR product by agarose gel electrophoresis re-sulted in a single stained band (Fig. 2), indicating that theadditional peaks were not due to other amplifications in thePCR. The melt curve profiles were consistently produced fromPCR products generated on different days and from templatesbelonging to different DNA extractions. Some serotypes exhib-ited very similar melt curve profiles and peak temperatures,
making it difficult to distinguish them from each other (Fig.3A). These included FAdV-4 and -10, -8b and -9, and -6 and-11. Analysis of the normalized HRM curves (Fig. 3B) revealedthat while some serotypes could easily be distinguished, forexample FAdV-1 and -8a, the curve profiles of other serotypeswere very similar and could therefore not be visually differen-tiated. When genotyping was applied to the normalized HRMcurves (Table 3), a single replicate of some serotypes wasauto-called as a different genotype at a C% between 98.9 and99.4% (e.g., one replicate of FAdV-4 genotyped as FAdV-10with a C% of 99.3). Therefore the normalized HRM-curveprofiles of these serotypes could not be considered to representdistinctly different genotypes.
HRM-curve analysis of the approximately 897-bp HexonA/B PCR product generated conventional melt curves contain-ing one to four peaks between 81°C and 91°C for each FAdVserotype (Fig. 4A), except for serotype 5, which did not pro-duce a PCR amplicon (Fig. 2). The curve profiles were visuallydistinct, making each serotype easy to distinguish from others.In the normalized HRM graph (Fig. 4B), each serotype (ex-cluding FAdV-5) displayed a distinct curve profile; when geno-
FIG. 2. Agarose gel electrophoresis of Hexon A/B, Hex L1, and HEX-S PCR products of the hexon gene from FAdV serotypes 1, 5, and 8a,plus a nontemplate control (NTC). MW, molecular weight marker (PCR marker, Sigma).
TABLE 3. Results of restriction enzyme analysis, denoted by profiles A to J, and normalized HRM-curve analysis, indicating genotype andmean C% of sample replicates for 12 FAdV reference serotypes
Serotype Restriction enzymeprofile
HEX-S Hexon A/B Hex L1
Genotypea Mean C% � SEb Genotype Mean C% � SE Genotype Mean C% � SE
FAdV-1 A 1 99.6 � 0.16 1 99.5 � 0.21 1 99.6 � 0.18FAdV-2 B 2 99.5 � 0.21 2 99.1 � 0.21 2 99.2 � 0.35FAdV-3 C 3 98.9 � 0.47 3 99.1 � 0.34 3 99.8 � 0.07FAdV-4 D 4 99.5 � 0.20c 4 99.1 � 0.30 4 99.8 � 0.10
10 99.3d
FAdV-5 NAe 5 99.2 � 0.36 NAe NAe 5 99.8 � 0.06FAdV-6 E 6 99.2 � 0.02c 6 99.7 � 0.09 6 99.9 � 0.03
11 98.9d
FAdV-7 F 7 99.0 � 0.44 7 99.5 � 0.18 7 99.1 � 0.42FAdV-8a G 8a 98.5 � 0.72 8a 99.5 � 0.18 8a 99.5 � 0.23FAdV-8b H 8b 99.8 � 0.08 8b 98.8 � 0.56 8b 99.1 � 0.19FAdV-9 I 9 99.5 � 0.36 9 99.4 � 0.24 9 99.3 � 0.33FAdV-10 J 10 99.4 � 0.70c 10 99.6 � 0.20 10 99.8 � 0.05
4 99.4d
FAdV-11 B 11 99.6 � 0.16 11 99.8 � 0.07 11 99.5 � 0.24
a Genotypes were defined by selecting a representative sample from each serotype.b The mean C% of three replicate samples per serotype is shown (unless otherwise indicated), plus or minus the SE.c The mean C% of two replicate samples per serotype is shown, plus or minus the SE.d One replicate sample of the serotype was assigned to a representative genotype of a different serotype; therefore, the mean C% and SE were not calculated.e Primers Hexon A and Hexon B did not produce a PCR amplicon for FAdV-5; therefore, restriction enzyme analysis and HRM-curve analysis were not performed
on these samples. NA, not available.
314 STEER ET AL. J. CLIN. MICROBIOL.
on March 20, 2012 by guest
http://jcm.asm
.org/D
ownloaded from
typing was applied, replicates of each serotype were correctlygenotyped with a C% equal to or greater than 98.8% (Table 3).
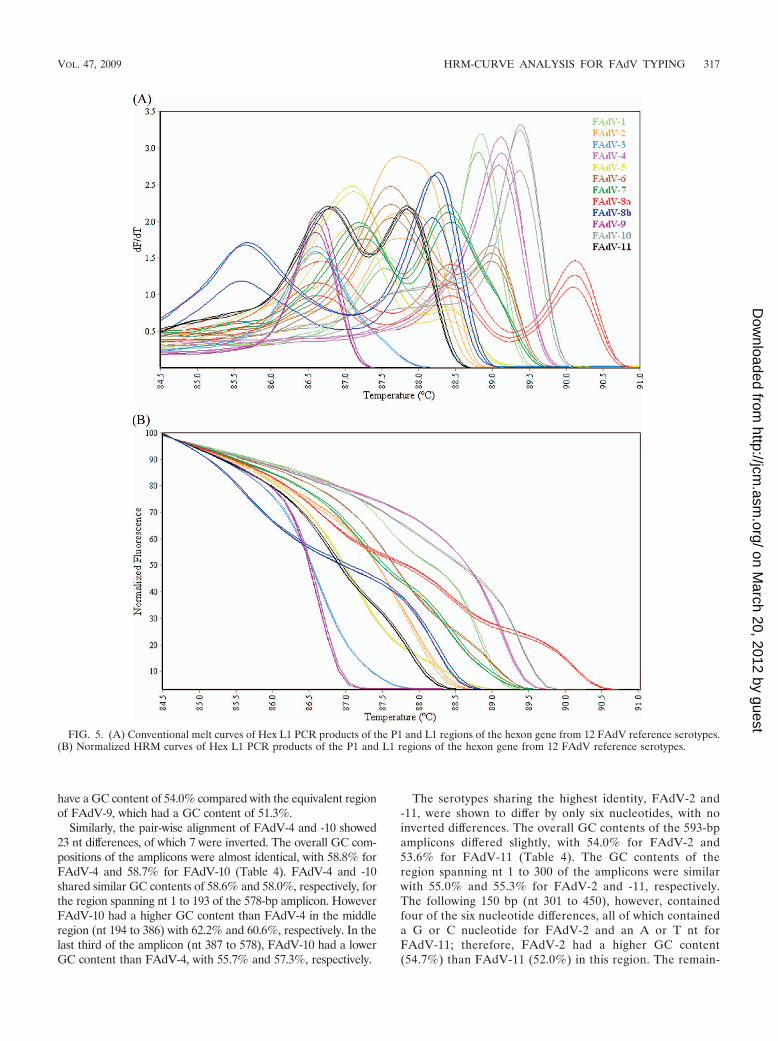
The conventional melt curve profiles generated by HRM-curve analysis of the Hex L1 amplicons from FAdV serotypes(Fig. 5A) contained one, two, or three peaks between 85°C and90.5°C. Based on visual analysis, each strain produced a dis-tinctly different melt curve profile. FAdV-3 and FAdV-9 con-tained a single peak at 86.6°C; however, visual interpretationdifferentiated the two serotypes, with the FAdV-3 curve shapedistinctly wider than that of FAdV-9. The normalized HRMgraph (Fig. 5B) showed that each serotype produced a distinct
curve profile, with the genotyping C% for replicates of eachserotype ranging from 99.1% to 99.9% (Table 3).
HRM-curve analysis for all three regions of the hexon geneshowed slight shifts in melting temperatures between PCRsrun on different days using templates from different DNAextractions; however, the conventional melt curve shapes wereunchanged. For amplicons from the Hexon A/B and Hex L1PCRs, defining representative genotypes in the normalizedHRM graph consistently resulted in replicates of each sero-type being correctly genotyped, with C% well above the 95%threshold.
FIG. 3. (A) Conventional melt curves of HEX-S PCR products of the P1 region of the hexon gene from 12 FAdV reference serotypes.(B) Normalized HRM curves of HEX-S PCR products of the P1 region of the hexon gene from 12 FAdV reference serotypes.
VOL. 47, 2009 HRM-CURVE ANALYSIS FOR FAdV TYPING 315
on March 20, 2012 by guest
http://jcm.asm
.org/D
ownloaded from
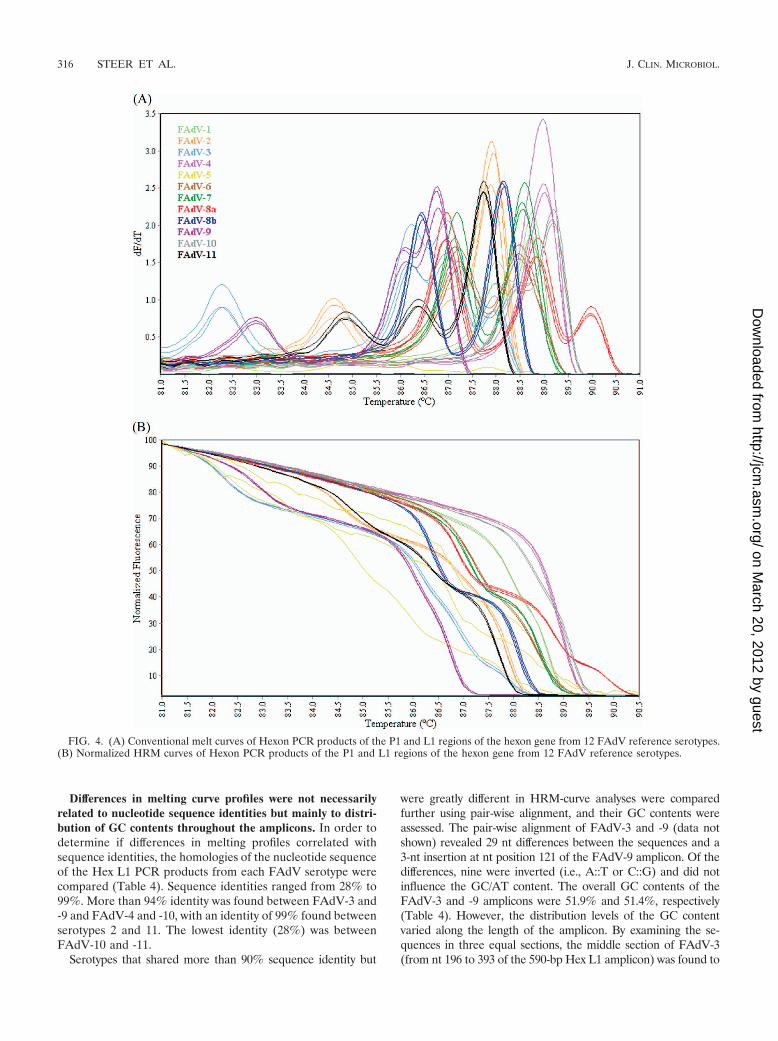
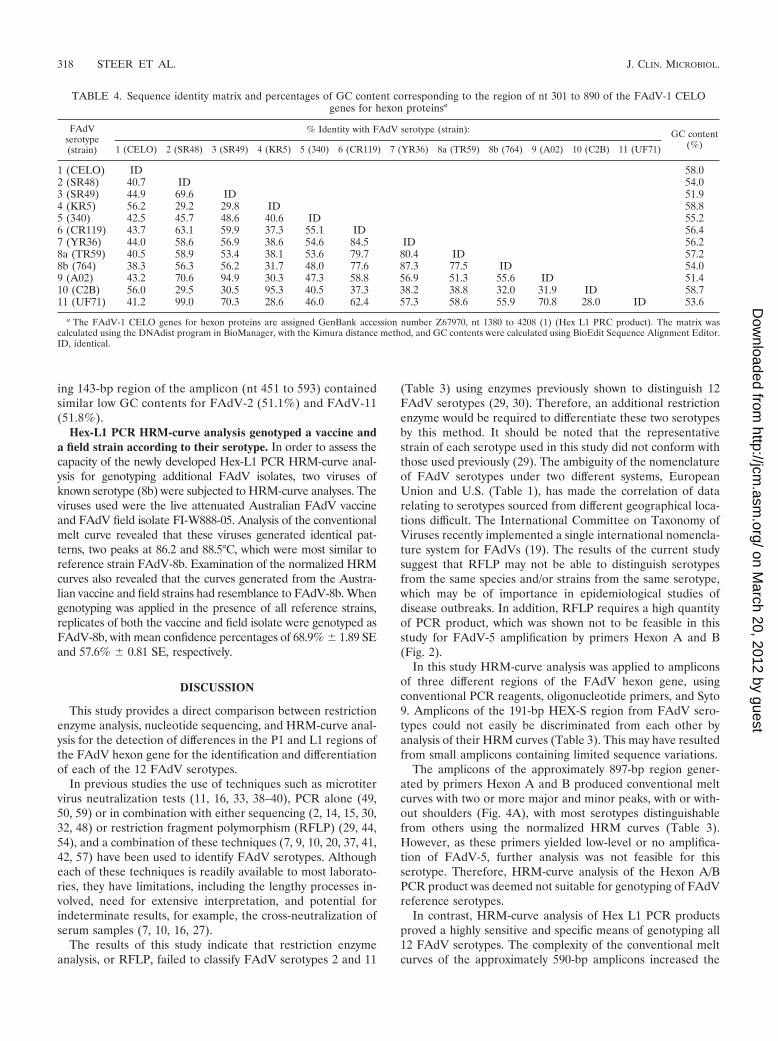
Differences in melting curve profiles were not necessarilyrelated to nucleotide sequence identities but mainly to distri-bution of GC contents throughout the amplicons. In order todetermine if differences in melting profiles correlated withsequence identities, the homologies of the nucleotide sequenceof the Hex L1 PCR products from each FAdV serotype werecompared (Table 4). Sequence identities ranged from 28% to99%. More than 94% identity was found between FAdV-3 and-9 and FAdV-4 and -10, with an identity of 99% found betweenserotypes 2 and 11. The lowest identity (28%) was betweenFAdV-10 and -11.
Serotypes that shared more than 90% sequence identity but
were greatly different in HRM-curve analyses were comparedfurther using pair-wise alignment, and their GC contents wereassessed. The pair-wise alignment of FAdV-3 and -9 (data notshown) revealed 29 nt differences between the sequences and a3-nt insertion at nt position 121 of the FAdV-9 amplicon. Of thedifferences, nine were inverted (i.e., A::T or C::G) and did notinfluence the GC/AT content. The overall GC contents of theFAdV-3 and -9 amplicons were 51.9% and 51.4%, respectively(Table 4). However, the distribution levels of the GC contentvaried along the length of the amplicon. By examining the se-quences in three equal sections, the middle section of FAdV-3(from nt 196 to 393 of the 590-bp Hex L1 amplicon) was found to
FIG. 4. (A) Conventional melt curves of Hexon PCR products of the P1 and L1 regions of the hexon gene from 12 FAdV reference serotypes.(B) Normalized HRM curves of Hexon PCR products of the P1 and L1 regions of the hexon gene from 12 FAdV reference serotypes.
316 STEER ET AL. J. CLIN. MICROBIOL.
on March 20, 2012 by guest
http://jcm.asm
.org/D
ownloaded from
have a GC content of 54.0% compared with the equivalent regionof FAdV-9, which had a GC content of 51.3%.
Similarly, the pair-wise alignment of FAdV-4 and -10 showed23 nt differences, of which 7 were inverted. The overall GC com-positions of the amplicons were almost identical, with 58.8% forFAdV-4 and 58.7% for FAdV-10 (Table 4). FAdV-4 and -10shared similar GC contents of 58.6% and 58.0%, respectively, forthe region spanning nt 1 to 193 of the 578-bp amplicon. HoweverFAdV-10 had a higher GC content than FAdV-4 in the middleregion (nt 194 to 386) with 62.2% and 60.6%, respectively. In thelast third of the amplicon (nt 387 to 578), FAdV-10 had a lowerGC content than FAdV-4, with 55.7% and 57.3%, respectively.
The serotypes sharing the highest identity, FAdV-2 and-11, were shown to differ by only six nucleotides, with noinverted differences. The overall GC contents of the 593-bpamplicons differed slightly, with 54.0% for FAdV-2 and53.6% for FAdV-11 (Table 4). The GC contents of theregion spanning nt 1 to 300 of the amplicons were similarwith 55.0% and 55.3% for FAdV-2 and -11, respectively.The following 150 bp (nt 301 to 450), however, containedfour of the six nucleotide differences, all of which containeda G or C nucleotide for FAdV-2 and an A or T nt forFAdV-11; therefore, FAdV-2 had a higher GC content(54.7%) than FAdV-11 (52.0%) in this region. The remain-
FIG. 5. (A) Conventional melt curves of Hex L1 PCR products of the P1 and L1 regions of the hexon gene from 12 FAdV reference serotypes.(B) Normalized HRM curves of Hex L1 PCR products of the P1 and L1 regions of the hexon gene from 12 FAdV reference serotypes.
VOL. 47, 2009 HRM-CURVE ANALYSIS FOR FAdV TYPING 317
on March 20, 2012 by guest
http://jcm.asm
.org/D
ownloaded from
ing 143-bp region of the amplicon (nt 451 to 593) containedsimilar low GC contents for FAdV-2 (51.1%) and FAdV-11(51.8%).
Hex-L1 PCR HRM-curve analysis genotyped a vaccine anda field strain according to their serotype. In order to assess thecapacity of the newly developed Hex-L1 PCR HRM-curve anal-ysis for genotyping additional FAdV isolates, two viruses ofknown serotype (8b) were subjected to HRM-curve analyses. Theviruses used were the live attenuated Australian FAdV vaccineand FAdV field isolate FI-W888-05. Analysis of the conventionalmelt curve revealed that these viruses generated identical pat-terns, two peaks at 86.2 and 88.5°C, which were most similar toreference strain FAdV-8b. Examination of the normalized HRMcurves also revealed that the curves generated from the Austra-lian vaccine and field strains had resemblance to FAdV-8b. Whengenotyping was applied in the presence of all reference strains,replicates of both the vaccine and field isolate were genotyped asFAdV-8b, with mean confidence percentages of 68.9% � 1.89 SEand 57.6% � 0.81 SE, respectively.
DISCUSSION
This study provides a direct comparison between restrictionenzyme analysis, nucleotide sequencing, and HRM-curve anal-ysis for the detection of differences in the P1 and L1 regions ofthe FAdV hexon gene for the identification and differentiationof each of the 12 FAdV serotypes.
In previous studies the use of techniques such as microtitervirus neutralization tests (11, 16, 33, 38–40), PCR alone (49,50, 59) or in combination with either sequencing (2, 14, 15, 30,32, 48) or restriction fragment polymorphism (RFLP) (29, 44,54), and a combination of these techniques (7, 9, 10, 20, 37, 41,42, 57) have been used to identify FAdV serotypes. Althougheach of these techniques is readily available to most laborato-ries, they have limitations, including the lengthy processes in-volved, need for extensive interpretation, and potential forindeterminate results, for example, the cross-neutralization ofserum samples (7, 10, 16, 27).
The results of this study indicate that restriction enzymeanalysis, or RFLP, failed to classify FAdV serotypes 2 and 11
(Table 3) using enzymes previously shown to distinguish 12FAdV serotypes (29, 30). Therefore, an additional restrictionenzyme would be required to differentiate these two serotypesby this method. It should be noted that the representativestrain of each serotype used in this study did not conform withthose used previously (29). The ambiguity of the nomenclatureof FAdV serotypes under two different systems, EuropeanUnion and U.S. (Table 1), has made the correlation of datarelating to serotypes sourced from different geographical loca-tions difficult. The International Committee on Taxonomy ofViruses recently implemented a single international nomencla-ture system for FAdVs (19). The results of the current studysuggest that RFLP may not be able to distinguish serotypesfrom the same species and/or strains from the same serotype,which may be of importance in epidemiological studies ofdisease outbreaks. In addition, RFLP requires a high quantityof PCR product, which was shown not to be feasible in thisstudy for FAdV-5 amplification by primers Hexon A and B(Fig. 2).
In this study HRM-curve analysis was applied to ampliconsof three different regions of the FAdV hexon gene, usingconventional PCR reagents, oligonucleotide primers, and Syto9. Amplicons of the 191-bp HEX-S region from FAdV sero-types could not easily be discriminated from each other byanalysis of their HRM curves (Table 3). This may have resultedfrom small amplicons containing limited sequence variations.
The amplicons of the approximately 897-bp region gener-ated by primers Hexon A and B produced conventional meltcurves with two or more major and minor peaks, with or with-out shoulders (Fig. 4A), with most serotypes distinguishablefrom others using the normalized HRM curves (Table 3).However, as these primers yielded low-level or no amplifica-tion of FAdV-5, further analysis was not feasible for thisserotype. Therefore, HRM-curve analysis of the Hexon A/BPCR product was deemed not suitable for genotyping of FAdVreference serotypes.
In contrast, HRM-curve analysis of Hex L1 PCR productsproved a highly sensitive and specific means of genotyping all12 FAdV serotypes. The complexity of the conventional meltcurves of the approximately 590-bp amplicons increased the
TABLE 4. Sequence identity matrix and percentages of GC content corresponding to the region of nt 301 to 890 of the FAdV-1 CELOgenes for hexon proteinsa
FAdVserotype(strain)
% Identity with FAdV serotype (strain): GC content(%)1 (CELO) 2 (SR48) 3 (SR49) 4 (KR5) 5 (340) 6 (CR119) 7 (YR36) 8a (TR59) 8b (764) 9 (A02) 10 (C2B) 11 (UF71)
1 (CELO) ID 58.02 (SR48) 40.7 ID 54.03 (SR49) 44.9 69.6 ID 51.94 (KR5) 56.2 29.2 29.8 ID 58.85 (340) 42.5 45.7 48.6 40.6 ID 55.26 (CR119) 43.7 63.1 59.9 37.3 55.1 ID 56.47 (YR36) 44.0 58.6 56.9 38.6 54.6 84.5 ID 56.28a (TR59) 40.5 58.9 53.4 38.1 53.6 79.7 80.4 ID 57.28b (764) 38.3 56.3 56.2 31.7 48.0 77.6 87.3 77.5 ID 54.09 (A02) 43.2 70.6 94.9 30.3 47.3 58.8 56.9 51.3 55.6 ID 51.410 (C2B) 56.0 29.5 30.5 95.3 40.5 37.3 38.2 38.8 32.0 31.9 ID 58.711 (UF71) 41.2 99.0 70.3 28.6 46.0 62.4 57.3 58.6 55.9 70.8 28.0 ID 53.6
a The FAdV-1 CELO genes for hexon proteins are assigned GenBank accession number Z67970, nt 1380 to 4208 (1) (Hex L1 PRC product). The matrix wascalculated using the DNAdist program in BioManager, with the Kimura distance method, and GC contents were calculated using BioEdit Sequence Alignment Editor.ID, identical.
318 STEER ET AL. J. CLIN. MICROBIOL.
on March 20, 2012 by guest
http://jcm.asm
.org/D
ownloaded from
power of the normalized HRM-curve analysis to differentiateserotypes. All serotypes generated one or more major peaksand were visually distinct from each other in conventional meltcurve profiles (Fig. 5A), and replicates of each serotype werecorrectly genotyped using the normalized HRM curves withC% of more than 99% (Table 3). Even where two serotypesexhibited a single major peak with an identical melting tem-perature (FAdV-3 and -9 in Fig. 5A), in the normalized HRMgraph these serotypes could be clearly differentiated (Fig. 5B)and replicates were correctly genotyped with more than 99%confidence (Table 3). The capacity of the newly developed HexL1 PCR HRM-curve analysis to genotype nonreference strainswas also demonstrated by correctly genotyping two furtherstrains (an Australian FAdV vaccine and a field strain) accord-ing to their known serotypes in the presence of all 12 referencestrains. Even though the design of the Hex L1 primers wasbased on the GenBank sequences of 27 different FAdV strains(48), further proof of the universality of these primers wouldbecome evident if they were utilized in further research involv-ing a number of other FAdV strains.
In this study, FAdV-2 and -11 sequences shared 99.0% iden-tity in the region amplified by the Hex L1 primers (Table 4) butnevertheless produced different conventional melt curve pro-files (Fig. 5A), and replicates in the normalized HRM graphwere correctly genotyped with close to 100% confidence (Ta-ble 3). This demonstrates the sensitivity of the technique de-veloped here and its capacity for detecting very small sequencevariations.
The melting profile of a PCR product is dependent uponlength, sequence, GC content, and heterozygosity (17, 51, 53).The GC composition of a DNA fragment is not necessarily agood predictor of the melting temperature; however, the actualDNA melting analysis can detect finer-scale differences in se-quences, such as localized domains of different GC composi-tion (31). It has been suggested that melting domains areusually 50- to 300-bp in length; therefore, amplicons up to800-bp may have multiple melting domains (58). Thus, it canbe assumed that multiple and/or shoulder peaks in the con-ventional melt curve profile of amplicons of the L1 region ofthe hexon gene of some FAdV serotypes, as seen in Fig. 5A,may be due to the presence of multiple melting domains dif-fering in GC content. For example, the melting temperaturesof the three peaks for FAdV-8a, 86.7°C, 88.5°C, and 90.2°C(Fig. 5A), may be attributable to the different GC composi-tions of each third of the amplified sequence (51.5%, 57.3%,and 62.8%, respectively). Interestingly, the peak with the low-est melting temperature closely matches that of FAdV-3 and-9, which have overall GC contents (51.8% and 51.4%, respec-tively) close to that of the FAdV-8a region (51.5%) from nt 399to 596. Even where sequence differences were small and local-ized, as seen between FAdV-2 and -11, the conventional meltcurve profiles (Fig. 5A) were distinctly different as a result ofcontrasting GC compositions within a confined region of eachamplicon. This supports the notion that the composition anddistribution of GC nucleotides in an amplicon directly influ-ences the shape and complexity of the conventional melt curve,and in turn, the power of the normalized HRM curve as a toolfor genotyping.
The melt curve profiles generated in this study were highlyreproducible and in agreement with those predicted by the
web-based DNA melting simulation program POLAND(Heinrich-Heine University in Dusseldorf, Germany, Insti-tute of Biophysics [http://www.biophys.uni-duesseldorf.de/local/POLAND/poland.html]) (55) (results not shown), aprogram that has been used to aid in the design of primers toamplify a region of DNA that will result in certain melting-curve characteristics (8, 23). This also confirmed that the com-plex melting profile of PCR amplicons was solely the result ofDNA dissociation (47). The variability between differentstrains within each FAdV serotype could potentially be as-sessed using sequences from the GenBank database in thePOLAND program. The Hex L1 nucleotide sequences fromsome FAdVs with known serotype identities were obtainedfrom GenBank (AF508957, FAdV-8 strain 58; DQ323986,FAdV-9 isolate Stanford; U26221, FAdV serotype 10; andAF339925, FAdV-12 strain 380) and analyzed using POLANDas part of this study. The resultant melt curve shapes werehighly similar, with regard to the number, height, and temper-ature of the peaks, to the respective reference strains used inthis study (results not shown). Combining this technique withHRM-curve analysis could therefore provide serotype identi-fication and potentially strain identification in laboratories thatcan perform HRM-curve analysis but do not have access to thereference strains of FAdV serotypes. However, as genotypingis performed using the normalized HRM data and furtherevaluated by the resultant confidence percentages in theRotorGene software, the use of the POLAND program toassess and compare sequences from GenBank is limited tovisual comparisons of conventional melt curve shapes and istherefore not definitive.
This study presents for the first time a robust genotypingtechnique based on the closed-tube method of real-time PCRand HRM-curve analysis for FAdVs. The method is an accu-rate, rapid, and cost-effective alternative to existing serotypeidentification methods, and it can be used as a model fordeveloping genotyping techniques for other pathogens. In ad-dition, during this study, the basis for differences in melt curveprofiles resulting from reference FAdVs were elucidated.
ACKNOWLEDGMENTS
This work was supported by the Chicken Meat Program from theRural Industries Research and Development Corporation (RIRDC)of the Australian government.
We thank Intervet International (Boxmeer, Netherlands) for pro-viding the FAdV reference serotypes and Tom Grimes for his assis-tance and input.
REFERENCES
1. Akopian, T. A., K. K. Doronin, V. A. Karpov, and B. S. Naroditsky. 1996.Sequence of the avian adenovirus FAV 1 (CELO) DNA encoding the hexon-associated protein pVI and hexon. Arch. Virol. 141:1759–1765.
2. Alvarado, I. R., P. Villegas, J. El-Attrache, E. Jensen, G. Rosales, F. Perozo,and L. B. Purvis. 2007. Genetic characterization, pathogenicity, and protec-tion studies with an avian adenovirus isolate associated with inclusion bodyhepatitis. Avian Dis. 51:27–32.
3. Balamurugan, V., and J. M. Kataria. 2004. The hydropericardium syndromein poultry–a current scenario. Vet. Res. Commun. 28:127–148.
4. Benson, D. A., I. Karsch-Mizrachi, D. J. Lipman, J. Ostell, and D. L.Wheeler. 2008. GenBank. Nucleic Acids Res. 36:D25–D30.
5. Cheng, J. C., C. L. Huang, C. C. Lin, C. C. Chen, Y. C. Chang, S. S.Chang, and C. P. Tseng. 2006. Rapid detection and identification ofclinically important bacteria by high-resolution melting analysis afterbroad-range ribosomal RNA real-time PCR. Clin. Chem. 52:1997–2004.
6. Chou, L. S., E. Lyon, and C. T. Wittwer. 2005. A comparison of high-resolution melting analysis with denaturing high-performance liquid
VOL. 47, 2009 HRM-CURVE ANALYSIS FOR FAdV TYPING 319
on March 20, 2012 by guest
http://jcm.asm
.org/D
ownloaded from
chromatography for mutation scanning: cystic fibrosis transmembraneconductance regulator gene as a model. Am. J. Clin. Pathol. 124:330–338.
7. Dahiya, S., R. N. Srivastava, M. Hess, and B. R. Gulati. 2002. Fowl adeno-virus serotype 4 associated with outbreaks of infectious hydropericardium inHaryana, India. Avian Dis. 46:230–233.
8. Do, H., M. Krypuy, P. L. Mitchell, S. B. Fox, and A. Dobrovic. 2008. Highresolution melting analysis for rapid and sensitive EGFR and KRAS muta-tion detection in formalin fixed paraffin embedded biopsies. BMC Cancer8:142.
9. El-Attrache, J., and P. Villegas. 2001. Genomic identification and charac-terization of avian adenoviruses associated with inclusion body hepatitis.Avian Dis. 45:780–787.
10. Erny, K., J. Pallister, and M. Sheppard. 1995. Immunological and mo-lecular comparison of fowl adenovirus serotypes 4 and 10. Arch. Virol.140:491–501.
11. Ganesh, K., R. Raghavan, R. N. Gowda, M. L. Satyanarayana, and V. V.Suryanarayana. 2002. Purification and characterization of the aetiologicalagent of hydropericardium hepatitis syndrome from infected liver tissues ofbroiler chickens. Trop. Anim. Health Prod. 34:7–17.
12. Ganesh, K., V. V. Suryanarayana, and R. Raghavan. 2002. Detection of fowladenovirus associated with hydropericardium hepatitis syndrome by a poly-merase chain reaction. Vet. Res. Commun. 26:73–80.
13. Giglio, S., P. T. Monis, and C. P. Saint. 2005. Legionella confirmation usingreal-time PCR and SYTO9 is an alternative to current methodology. Appl.Environ. Microbiol. 71:8944–8948.
14. Gomis, S., A. R. Goodhope, A. D. Ojkic, and P. Willson. 2006. Inclusion bodyhepatitis as a primary disease in broilers in Saskatchewan, Canada. AvianDis. 50:550–555.
15. Grgic, H., C. Philippe, D. Ojkic, and E. Nagy. 2006. Study of vertical trans-mission of fowl adenoviruses. Can. J. Vet. Res. 70:230–233.
16. Grimes, T. M., and D. J. King. 1977. Serotyping avian adenoviruses by amicroneutralization procedure. Am. J. Vet. Res. 38:317–321.
17. Herrmann, M. G., J. D. Durtschi, L. K. Bromley, C. T. Wittwer, and K. V.Voelkerding. 2006. Amplicon DNA melting analysis for mutation scanningand genotyping: cross-platform comparison of instruments and dyes. Clin.Chem. 52:494–503.
18. Hess, M. 2000. Detection and differentiation of avian adenoviruses: a review.Avian Pathol. 29:195–206.
19. ICTVdB Management. 2006. 00.001. Adenoviridae. In C. Buchen-Osmond(ed.), ICTVdB–the universal virus database, version 3. Columbia University,New York, NY.
20. Jadhao, S. J., J. N. Deepak, J. M. Kataria, R. S. Kataria, A. K. Tiwari, R.Somvanshi, P. Sangamithra, and K. C. Verma. 2003. Characterisation offowl adenoviruses from chickens affected with infectious hydropericardiumduring 1994–1998 in India. Indian J. Exp. Biol. 41:321–327.
21. Jeffery, N., R. B. Gasser, P. A. Steer, and A. H. Noormohammadi. 2007.Classification of Mycoplasma synoviae strains using single-strand conforma-tion polymorphism and high-resolution melting-curve analysis of the vlhAgene single-copy region. Microbiology 153:2679–2688.
22. Jiang, P., D. Ojkic, T. Tuboly, P. Huber, and E. Nagy. 1999. Application ofthe polymerase chain reaction to detect fowl adenoviruses. Can. J. Vet. Res.63:124–128.
23. Krypuy, M., A. A. Ahmed, D. Etemadmoghadam, S. J. Hyland, A. DeFa-zio, S. B. Fox, J. D. Brenton, D. D. Bowtell, and A. Dobrovic. 2007. Highresolution melting for mutation scanning of TP53 exons 5–8. BMC Can-cer 7:168.
24. Krypuy, M., G. M. Newnham, D. M. Thomas, M. Conron, and A. Dobrovic.2006. High resolution melting analysis for the rapid and sensitive detectionof mutations in clinical samples: KRAS codon 12 and 13 mutations innon-small cell lung cancer. BMC Cancer 6:295.
25. Liew, M., R. Pryor, R. Palais, C. Meadows, M. Erali, E. Lyon, and C.Wittwer. 2004. Genotyping of single-nucleotide polymorphisms by high-res-olution melting of small amplicons. Clin. Chem. 50:1156–1164.
26. Lin, J. H., C. P. Tseng, Y. J. Chen, C. Y. Lin, S. S. Chang, H. S. Wu, and J. C.Cheng. 2008. Rapid differentiation of influenza A virus subtypes and geneticscreening for virus variants by high-resolution melting analysis. J. Clin. Mi-crobiol. 46:1090–1097.
27. Mazaheri, A., C. Prusas, M. Vob, and M. Hess. 1998. Some strains ofserotype 4 fowl adenoviruses cause inclusion body hepatitis and hydroperi-cardium. Avian Pathol. 27:269.
28. McFerran, J. B., and B. M. Adair. 2003. Adenovirus infections: group Iadenovirus infections, p. 213–227. In Y. M. Saif, H. J. Barnes, J. R. Glisson,A. M. Fadly, L. R. McDougald, and D. E. Swayne (ed.), 11th ed. Diseases ofPoultry, Iowa State University Press, Ames.
29. Meulemans, G., M. Boschmans, T. P. van den Berg, and M. Decaesstecker.2001. Polymerase chain reaction combined with restriction enzyme analysisfor detection and differentiation of fowl adenovirus. Avian Pathol. 30:655–660.
30. Meulemans, G., B. Couvreur, M. Decaesstecker, M. Boschmans, and T. P.van den Berg. 2004. Phylogenetic analysis of fowl adenoviruses. AvianPathol. 33:164–170.
31. Monis, P. T., S. Giglio, and C. P. Saint. 2005. Comparison of SYTO9 and
SYBR Green I for real-time polymerase chain reaction and investigation ofthe effect of dye concentration on amplification and DNA melting curveanalysis. Anal. Biochem. 340:24–34.
32. Moscoso, H., J. J. Bruzual, H. Sellers, and C. L. Hofacre. 2007. FTA liverimpressions as DNA template for detecting and genotyping fowl adenovirus.Avian Dis. 51:118–121.
33. Muroga, N., S. Taharaguchi, H. Ohta, K. Yamazaki, and K. Takase. 2006.Pathogenicity of fowl adenovirus isolated from gizzard erosions to immuno-suppressed chickens. J. Vet. Med. Sci. 68:289–291.
34. Nakamura, K., H. Tanaka, M. Mase, T. Imada, and M. Yamada. 2002.Pancreatic necrosis and ventricular erosion in adenovirus-associated hydro-pericardium syndrome of broilers. Vet. Pathol. 39:403–406.
35. Norrby, E. 1969. The relationship between the soluble antigens and thevirion of adenovirus type 3. IV. Immunological complexity of soluble com-ponents. Virology. 37:565–576.
36. Odell, I. D., J. L. Cloud, M. Seipp, and C. T. Wittwer. 2005. Rapid speciesidentification within the Mycobacterium chelonae-abscessus group by high-resolution melting analysis of hsp65 PCR products. Am. J. Clin. Pathol.123:96–101.
37. Ojkic, D., E. Martin, J. Swinton, J. P. Vaillancourt, M. Boulianne, and S.Gomis. 2008. Genotyping of Canadian isolates of fowl adenoviruses. AvianPathol. 37:95–100.
38. Okuda, Y., M. Ono, I. Shibata, and S. Sato. 2004. Pathogenicity of serotype8 fowl adenovirus isolated from gizzard erosions of slaughtered broiler chick-ens. J. Vet. Med. Sci. 66:1561–1566.
39. Okuda, Y., M. Ono, S. Yazawa, Y. Imai, I. Shibata, and S. Sato. 2001.Pathogenicity of serotype 1 fowl adenovirus in commercial broiler chickens.Avian Dis. 45:819–827.
40. Okuda, Y., M. Ono, S. Yazawa, I. Shibata, and S. Sato. 2001. Experi-mental infection of specific-pathogen-free chickens with serotype-1 fowladenovirus isolated from a broiler chicken with gizzard erosions. AvianDis. 45:19–25.
41. Ono, M., Y. Okuda, I. Shibata, S. Sato, and K. Okada. 2004. Pathogenicityby parenteral injection of fowl adenovirus isolated from gizzard erosion andresistance to reinfection in adenoviral gizzard erosion in chickens. Vet.Pathol. 41:483–489.
42. Ono, M., Y. Okuda, I. Shibata, S. Sato, and K. Okada. 2007. Reproductionof adenoviral gizzard erosion by the horizontal transmission of fowl adeno-virus serotype 1. J. Vet. Med. Sci. 69:1005–1008.
43. Ono, M., Y. Okuda, S. Yazawa, Y. Imai, I. Shibata, S. Sato, and K. Okada.2003. Adenoviral gizzard erosion in commercial broiler chickens. Vet.Pathol. 40:294–303.
44. Ono, M., Y. Okuda, S. Yazawa, I. Shibata, N. Tanimura, K. Kimura, M.Haritani, M. Mase, and S. Sato. 2001. Epizootic outbreaks of gizzarderosion associated with adenovirus infection in chickens. Avian Dis. 45:268–275.
45. Philippe, C., H. Grgic, D. Ojkic, and E. Nagy. 2007. Serologic monitoring ofa broiler breeder flock previously affected by inclusion body hepatitis andtesting of the progeny for vertical transmission of fowl adenoviruses. Can. J.Vet. Res. 71:98–102.
46. Price, E. P., H. Smith, F. Huygens, and P. M. Giffard. 2007. High-resolutionDNA melt curve analysis of the clustered, regularly interspaced short-palin-dromic-repeat locus of Campylobacter jejuni. Appl. Environ. Microbiol. 73:3431–3436.
47. Rasmussen, J. P., C. P. Saint, and P. T. Monis. 2007. Use of DNA meltingsimulation software for in silico diagnostic assay design: targeting regionswith complex melting curves and confirmation by real-time PCR using in-tercalating dyes. BMC Bioinformatics 8:107.
48. Raue, R., H. Gerlach, and H. Muller. 2005. Phylogenetic analysis of thehexon loop 1 region of an adenovirus from psittacine birds supports theexistence of a new psittacine adenovirus (PsAdV). Arch. Virol. 150:1933–1943.
49. Raue, R., H. M. Hafez, and M. Hess. 2002. A fiber gene-based polymerasechain reaction for specific detection of pigeon adenovirus. Avian Pathol.31:95–99.
50. Raue, R., and M. Hess. 1998. Hexon based PCRs combined with restrictionenzyme analysis for rapid detection and differentiation of fowl adenovirusesand egg drop syndrome virus. J. Virol. Methods 73:211–217.
51. Reed, G. H., J. O. Kent, and C. T. Wittwer. 2007. High-resolution DNAmelting analysis for simple and efficient molecular diagnostics. Pharmaco-genomics 8:597–608.
52. Reed, G. H., and C. T. Wittwer. 2004. Sensitivity and specificity of single-nucleotide polymorphism scanning by high-resolution melting analysis. Clin.Chem. 50:1748–1754.
53. Robinson, B. S., P. T. Monis, and P. J. Dobson. 2006. Rapid, sensitive, anddiscriminating identification of Naegleria spp. by real-time PCR and melting-curve analysis. Appl. Environ. Microbiol. 72:5857–5863.
54. Singh, A., M. S. Oberoi, G. S. Grewal, H. M. Hafez, and M. Hess. 2002. Theuse of PCR combined with restriction enzyme analysis to characterize fowladenovirus field isolates from northern India. Vet. Res. Commun. 26:577–585.
55. Steger, G. 1994. Thermal denaturation of double-stranded nucleic acids:
320 STEER ET AL. J. CLIN. MICROBIOL.
on March 20, 2012 by guest
http://jcm.asm
.org/D
ownloaded from
prediction of temperatures critical for gradient gel electrophoresis and poly-merase chain reaction. Nucleic Acids Res. 22:2760–2768.
56. Taharaguchi, S., H. Ito, H. Ohta, and K. Takase. 2006. Characterization ofmonoclonal antibodies against fowl adenovirus serotype 1 (FAV1) isolatedfrom gizzard erosion. Avian Dis. 50:331–335.
57. Toro, H., C. Prusas, R. Raue, L. Cerda, C. Geisse, C. Gonzalez, and M. Hess.1999. Characterization of fowl adenoviruses from outbreaks of inclusionbody hepatitis/hydropericardium syndrome in Chile. Avian Dis. 43:262–270.
58. Wittwer, C. T., G. H. Reed, C. N. Gundry, J. G. Vandersteen, and R. J. Pryor.2003. High-resolution genotyping by amplicon melting analysis usingLCGreen. Clin. Chem. 49:853–860.
59. Xie, Z., A. A. Fadl, T. Girshick, and M. I. Khan. 1999. Detection of avianadenovirus by polymerase chain reaction. Avian Dis. 43:98–105.
60. Zhou, L., L. Wang, R. Palais, R. Pryor, and C. T. Wittwer. 2005. High-resolution DNA melting analysis for simultaneous mutation scanning andgenotyping in solution. Clin. Chem. 51:1770–1777.
VOL. 47, 2009 HRM-CURVE ANALYSIS FOR FAdV TYPING 321
on March 20, 2012 by guest
http://jcm.asm
.org/D
ownloaded from
JOURNAL OF CLINICAL MICROBIOLOGY, May 2009, p. 1616 Vol. 47, No. 50095-1137/09/$08.00�0 doi:10.1128/JCM.00557-09
ERRATUM
Classification of Fowl Adenovirus Serotypes by Use of High-ResolutionMelting-Curve Analysis of the Hexon Gene Region
Penelope A. Steer, Naomi C. Kirkpatrick, Denise O’Rourke, and Amir H. NoormohammadiFaculty of Veterinary Science, The University of Melbourne, Werribee, Victoria 3030, Australia
Volume 47, no. 2, p. 311–321, 2009. Page 312, Table 1, column 6, row 2: “Tiptron” should read “Tipton.”Page 312, Table 1: The first row of values corresponding to species C in columns 2 to 6 (“3,” “3,” “3,” “SR49,” and “75, H5,
75-1A-1,” respectively) should appear instead as the second row of values corresponding to species D.
1616
on March 20, 2012 by guest
http://jcm.asm
.org/D
ownloaded from