classification of polyolefins from building and construction waste using nir hyperspectral imaging...
TRANSCRIPT
Ch
SD
a
ARRA
KHPDRP
1
altfbmws
tppospmtosft
0d
Resources, Conservation and Recycling 61 (2012) 52– 58
Contents lists available at SciVerse ScienceDirect
Resources, Conservation and Recycling
journa l h o me pag e: www.elsev ier .com/ locate / resconrec
lassification of polyolefins from building and construction waste using NIRyperspectral imaging system
ilvia Serranti ∗, Aldo Gargiulo, Giuseppe Bonifaziepartment of Chemical Engineering Materials and Environment, Sapienza – Università di Roma, Via Eudossiana 18, 00184 Rome, Italy
r t i c l e i n f o
rticle history:eceived 2 August 2011eceived in revised form 4 January 2012ccepted 12 January 2012
eywords:yperspectral imaging
a b s t r a c t
This work was carried out to develop a hyperspectral imaging system in the near infrared (NIR) range(1000–1700 nm) to classify polyolefin particles from complex waste streams in order to improve theirrecovery, producing high purity polypropylene (PP) and polyethylene (PE) granulates, according to mar-ket requirements. In particular, hyperspectral images were acquired for polyolefins coming from building& construction waste (B&CW), divided into 9 different density fractions, ranging from <0.88 g/cm3 up to0.96 g/cm3 and in different color classes. Spectral data were analyzed using principal component analysis
olyolefinsensityecyclingrincipal component analysis
(PCA) to reduce the high dimensionality of data and for selecting some effective wavelengths. Resultsshowed that it was possible to recognize PP and PE waste particles and to define the “real cut den-sity” between PP and PE from B&CW, to be utilized in the recycling process based on magnetic densityseparation (MDS). The results revealed the potentiality of NIR hyperspectral imaging as an objectiveand non-destructive method for classification and quality control purposes in the recycling chain of
polyolefins.. Introduction
Polyolefins (PO) recovery from plastic solid waste is considered great opportunity but also a big challenge because, despite theirarge consumption, they are the least recycled plastic materials dueo the difficulties faced in their separation (Bonifazi et al., 2009). Inact, there are many PO-rich complex wastes, such as waste fromuilding and construction (B&CW), electric and electronic equip-ent (WEEE), automotive shredder residue (ASR) or householdaste (HW) that, at present, are not well exploited as a source of
econdary pure PO.In recycling technologies of plastics from post-consumer waste,
he capability to separate different polymers is one of the keyoints in order to obtain pure secondary raw materials for theroduction of new high quality products. In this paper the usef NIR hyperspectral imaging (HSI) has been applied to the clas-ification of PO coming from B&CW for quality control of theroducts resulting from an innovative recycling process, based onagnetic density separation (MDS) (Bakker et al., 2009). In par-
icular, such an approach is under development in the frameworkf a European FP7 Project: “Magnetic Sorting and Ultrasound Sen-
or Technologies for Production of High Purity Secondary Polyolefinsrom Waste (W2Plastics)” in which on-line quality control logics forhe feed of the process, i.e. complex plastic waste streams, and∗ Corresponding author. Tel.: +39 0644585360; fax: +39 0644585618.E-mail address: [email protected] (S. Serranti).
921-3449/$ – see front matter © 2012 Elsevier B.V. All rights reserved.oi:10.1016/j.resconrec.2012.01.007
© 2012 Elsevier B.V. All rights reserved.
for the final products resulting from the sorting process, shouldbe developed and implemented (Di Maio et al., 2010).
Polyolefins are the largest group of thermoplastics, the termpolyolefins means “oil-like” and refers to the oil feel that thesematerials have (Graham Solomons, 2001). They consist only of car-bon and hydrogen atoms and they are non-aromatic. The two mostimportant and common PO are polyethylene (PE) and polypropy-lene (PP), very popular due to their low cost and wide range ofapplications.
PE is probably the most diffused plastic in the world. It is a veryversatile material that makes grocery bags, shampoo bottles, chil-dren toys, and even bullet proof vests. Although its wide applicationfield, PE has a very simple structure, the simplest of all commer-cial polymers, consisting of long chains of the monomer ethylene.A molecule of PE is thus a long chain of carbon atoms, with twohydrogen atoms attached to each carbon: [CH2 CH2]n. This type ofPE is called linear PE, or HDPE (high density polyethylene), becausethe carbon chain does not have any branches. Sometimes some ofthe carbons, instead of having hydrogen attached to them, havelong chains of PE. This is called branched PE, or LDPE (low densitypolyethylene). Because of these short and long chains branching,chains do not pack into the crystal structure. Therefore LDPE has alower density and less strong intermolecular forces than HDPE.
PP is a rather versatile polymer, serving both as plastic and as a
fiber. It is used to make things like dishwasher-safe food contain-ers. As a fiber, PP is used for its characteristics (easiness to make itcolorful and water absorption resistance) to make indoor–outdoorcarpeting. Structurally it is a vinyl polymer with a linear structure
ervati
bact
tcıata(blvct
merSaleodmcsliulf
trampvaoflaccbp
sam1oicxpbsa
cF
standards for the recognition of the unknown waste PO particlesbased on their spectral signatures (Serranti et al., 2011).
S. Serranti et al. / Resources, Cons
ased on CnH2n. PP is similar to PE only that on every other carbontom in the backbone chain has a methyl group attached to it. Mostommercial PP has an intermediate level of crystallinity betweenhat of LDPE and HDPE.
Separation of PO is not a goal easy to reach with conventionalechnologies based on sink and float strategies, due to their verylose density (Di Maio et al., 2011): ıHDPE = 0.940–0.960 g/cm3,LDPE = 0.910–0.935 g/cm3, ıPP = 0.880–0.915 g/cm3. Currentlyvailable techniques, based on the difference in flotation proper-ies in water, can be used to separate lighter types of plastic, suchs PO, from the heavier types, such as polyethylene terephthalatePET) and polyvinyl chloride (PVC). The resulting PO mixture cane utilized to produce only low-quality recycled objects as they
oose their physical and mechanical properties characterizing theirgin polymers. To produce high-purity granulates from theseoncentrates, the mixture must be sorted very accurately, to obtainwo pure separate products: PP and PE.
Among the different techniques under study or available in thearket, MDS appears to be a valid solution for PO recycling (Bakker
t al., 2009). MDS uses a strongly dilute mixture of water and fer-ous oxide (nanometer sized ferrite particles) in a magnetic field.uch liquids derive their separation density from a combination of
magnetic field and gravity. The separation is realized achieving aower apparent density than water by the combination of a gradi-nt magnetic field and a magnetic liquid. An intriguing proprietyf MDS liquids is that they have different separation densities inifferent layers of the fluid, according to different intensity of theagnetic field. In principle, this effect can be used to separate a
omplex mixture into many different materials in a single processtep, using one of the same liquid. Other important advantages,inked to MDS liquids (composed by 99% water and 1% iron oxide),s that: (i) they are environmentally harmless, in fact they can besed without the economic and environmental problems of organic
iquids and (ii) they are very cheap to use, even if not fully recoveredrom the product materials.
Independently from the adopted separation strategy, the needo operate a full quality control of the plastic waste streams rep-esents a key issue of great importance for both plastic recyclingnd compounder industries. Therefore, a fast on-line assessment toonitor the plastic waste feed streams and to characterize the com-
osition of the different PO products, is fundamental to increase thealue of secondary PO. In this perspective an HSI based architecturellows to fulfill both the “required” control goals, that is: a continu-us monitoring (on-line control) of the fed and processed wasteow streams and an important decrease of the analytical costsnd a contemporary increase of the speed of the analytical pro-essing of the samples. Furthermore the proposed approach couldontribute to perform a big step forward, in terms of new possi-le logics-separation technologies implementation, in the field oflastic recycling and more specifically for PO recovery.
HSI is based on the utilization of an integrated hardware andoftware architecture able to digitally capture and handle spectra,s an image sequence, as they result along a pre-defined align-ent on a surface sample properly energized (Hyvarinen et al.,
998; Geladi et al., 2007). Spatial and spectral information can bebtained at the same time from sample object of investigation. Thenformation are thus contained in a 3D dataset (i.e. the hypercube),haracterized by two dimensions related to spatial information (i.e.
and y) and one related to spectral information (i.e. z). Differenthysical–chemical attributes of the samples (i.e. PO particles) cane thus collected and analyzed according to different energizingources characteristics (i.e. wavelengths) and spectral resolution
nd sensitivity of the device/s.In these last years HSI has rapidly emerged and fast-grown espe-ially in food inspection (e.g. Gowen et al., 2007; Sun, 2010; Deliore et al., 2010), in pharmaceutical sector (Gowen et al., 2008;
on and Recycling 61 (2012) 52– 58 53
Fortunato de Carvalho Rocha et al., 2011), in medicine (Jolivot et al.,2011; Liu et al., 2007), in artworks (Kubik, 2007) and in polymer sci-ence (Gosselin et al., 2011). Studies have been also carried out insolid waste sectors: waste paper recovery (Tatzer et al., 2005), glassrecycling (Bonifazi and Serranti, 2006a), fluff characterization fromASR (Bonifazi and Serranti, 2006b), bottom ash from municipal solidwaste incinerators (Bonifazi and Serranti, 2007), compost productsquality control (Serranti et al., 2009), polymers (Leitner et al., 2003)and polyolefins (Serranti et al., 2010, 2011) identification.
The studies based on the application of HSI techniques to mate-rial and/or products classification and inspection are increasingevery day, demonstrating as such a technique represents a verysmart and promising analytical tool for the development of fast,reliable and low cost quality control strategies.
2. Materials and methods
2.1. Samples
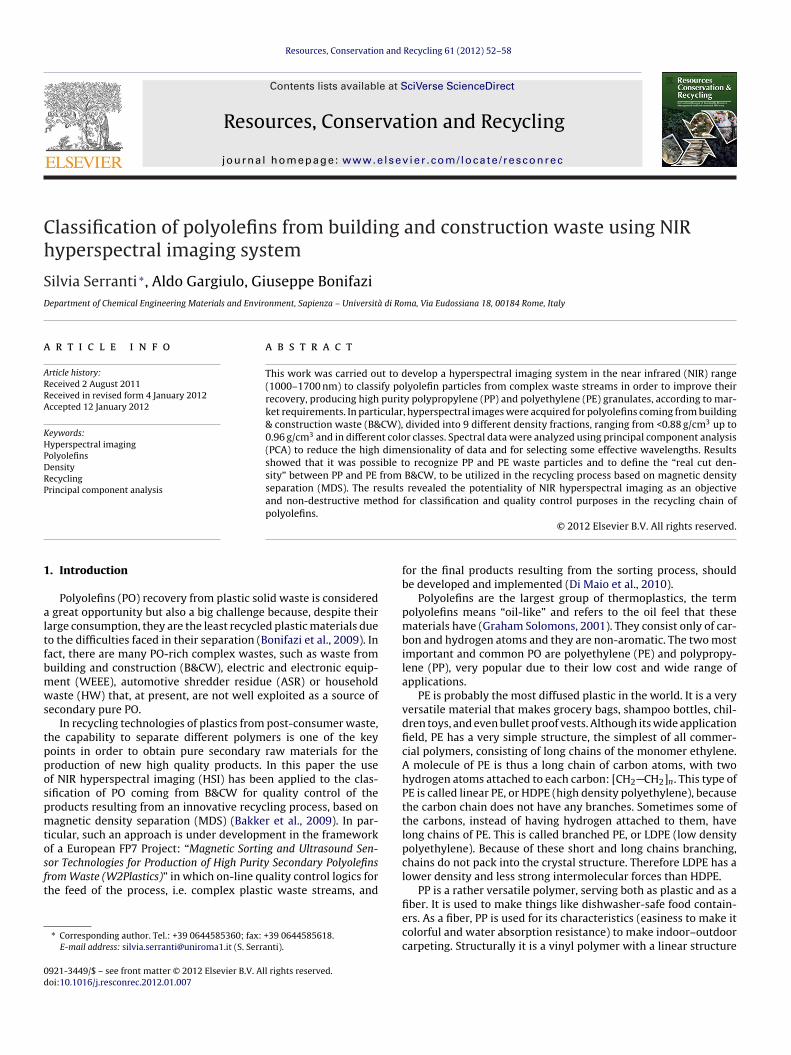
A mixed PO sample from B&CW (Fig. 1) has been collected ina recycling facility located in France. The sample is constituted byshredded particles ranging in size from 5 to 20 mm, representingthe float fraction (density < 1 g/cm3) of a sink-float preprocessingstep, i.e. mainly PO, as the other polymers are characterized bydensity greater than that of water (1 g/cm3). The sample has beenthen classified in 9 different density fractions in laboratory, byseveral sink-float separation stages (using the static bath methodat various cut densities in water and water–ethanol mixtures, atroom temperature). The selected density intervals are typical of PPand PE, ranging from <0.88 g/cm3 up to 0.96 g/cm3 (Table 1). Plasticparticles of different colors have been selected from the 9 densityclasses, identifying 9 main colors (Fig. 2): transparent, white, pink,red, orange, grey, blue, green and yellow. Black particles have notbeen taken into account at this stage of the research due to theirweak reflectance characteristics. 18 particles have been selectedfor each density class, 2 for each of the 9 dominant colors, for atotal of 162 particles.
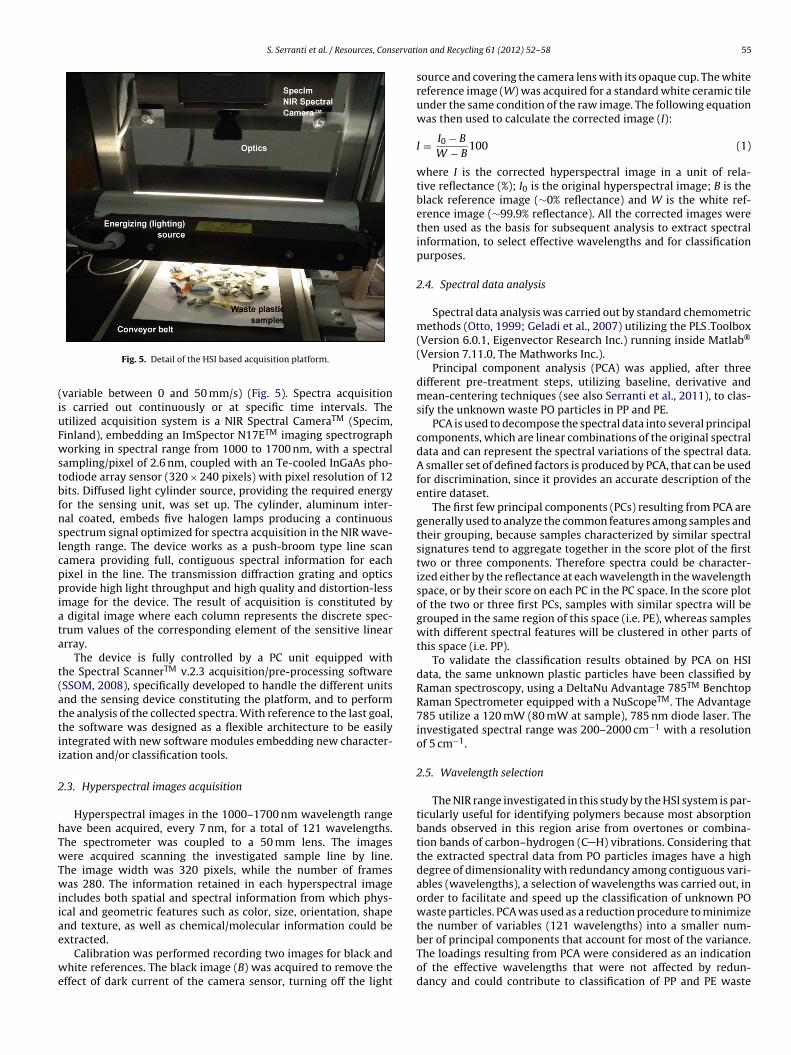
Virgin PP and PE samples (Fig. 3) have been utilized as reference
Fig. 1. Source sample of polyolefins from building and construction waste.
54 S. Serranti et al. / Resources, Conservation and Recycling 61 (2012) 52– 58
Table 1Density classes and related weights of the analyzed PO mixed sample coming from B&C waste.
Density class (g/cm3) <0.88 0.88–0.89 0.89–0.90 0.90–0.91 0.91–0.92 0.92–0.93 0.93–0.94 0.94–0.95 0.95–0.96Weight (g) 58.13 85.79 103.06 131.00 62.05 79.00 136.70 83.07 106.02
F0
2
paawstf
••
ig. 2. Example of 9 selected polyolefin particles of different colors from 0.89 to.90 g/cm3 density class.
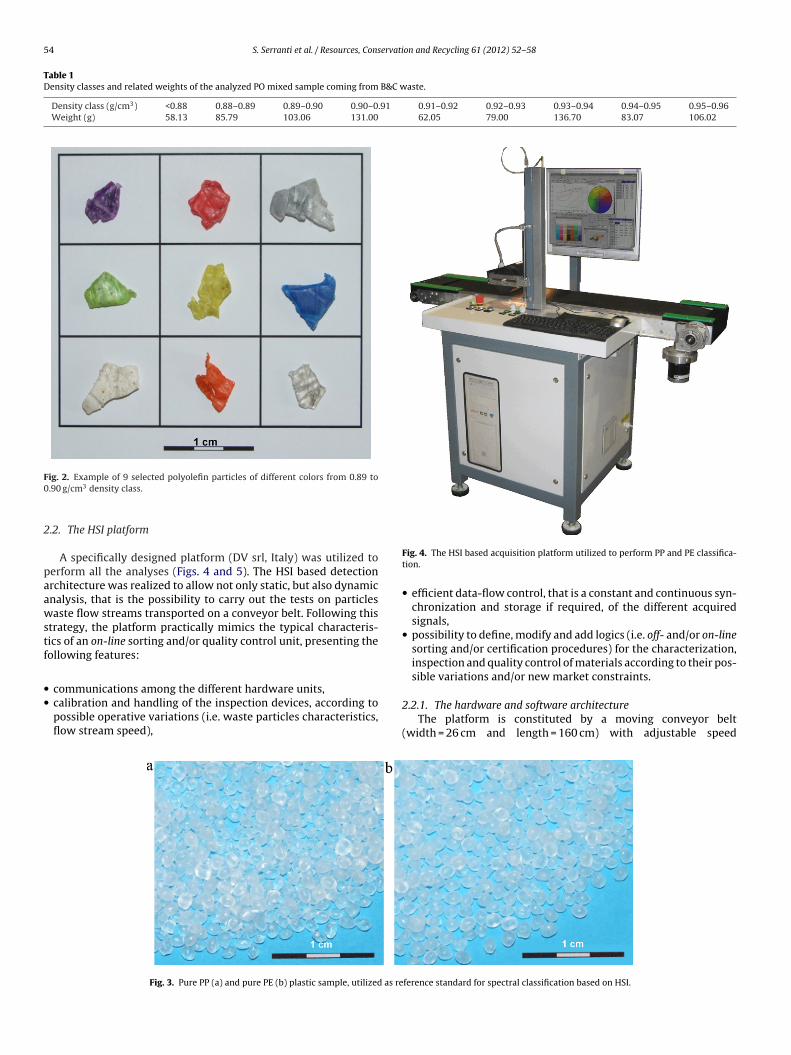
.2. The HSI platform
A specifically designed platform (DV srl, Italy) was utilized toerform all the analyses (Figs. 4 and 5). The HSI based detectionrchitecture was realized to allow not only static, but also dynamicnalysis, that is the possibility to carry out the tests on particlesaste flow streams transported on a conveyor belt. Following this
trategy, the platform practically mimics the typical characteris-ics of an on-line sorting and/or quality control unit, presenting theollowing features:
communications among the different hardware units,
calibration and handling of the inspection devices, according topossible operative variations (i.e. waste particles characteristics,flow stream speed),Fig. 3. Pure PP (a) and pure PE (b) plastic sample, utilized as re
Fig. 4. The HSI based acquisition platform utilized to perform PP and PE classifica-tion.
• efficient data-flow control, that is a constant and continuous syn-chronization and storage if required, of the different acquiredsignals,
• possibility to define, modify and add logics (i.e. off- and/or on-linesorting and/or certification procedures) for the characterization,inspection and quality control of materials according to their pos-sible variations and/or new market constraints.
2.2.1. The hardware and software architectureThe platform is constituted by a moving conveyor belt
(width = 26 cm and length = 160 cm) with adjustable speed
ference standard for spectral classification based on HSI.
S. Serranti et al. / Resources, Conservati
(iuFwstbfnslcppiata
t(attii
2
hTwTwiiae
we
Fig. 5. Detail of the HSI based acquisition platform.
variable between 0 and 50 mm/s) (Fig. 5). Spectra acquisitions carried out continuously or at specific time intervals. Thetilized acquisition system is a NIR Spectral CameraTM (Specim,inland), embedding an ImSpector N17ETM imaging spectrographorking in spectral range from 1000 to 1700 nm, with a spectral
ampling/pixel of 2.6 nm, coupled with an Te-cooled InGaAs pho-odiode array sensor (320 × 240 pixels) with pixel resolution of 12its. Diffused light cylinder source, providing the required energyor the sensing unit, was set up. The cylinder, aluminum inter-al coated, embeds five halogen lamps producing a continuouspectrum signal optimized for spectra acquisition in the NIR wave-ength range. The device works as a push-broom type line scanamera providing full, contiguous spectral information for eachixel in the line. The transmission diffraction grating and opticsrovide high light throughput and high quality and distortion-less
mage for the device. The result of acquisition is constituted by digital image where each column represents the discrete spec-rum values of the corresponding element of the sensitive linearrray.
The device is fully controlled by a PC unit equipped withhe Spectral ScannerTM v.2.3 acquisition/pre-processing softwareSSOM, 2008), specifically developed to handle the different unitsnd the sensing device constituting the platform, and to performhe analysis of the collected spectra. With reference to the last goal,he software was designed as a flexible architecture to be easilyntegrated with new software modules embedding new character-zation and/or classification tools.
.3. Hyperspectral images acquisition
Hyperspectral images in the 1000–1700 nm wavelength rangeave been acquired, every 7 nm, for a total of 121 wavelengths.he spectrometer was coupled to a 50 mm lens. The imagesere acquired scanning the investigated sample line by line.
he image width was 320 pixels, while the number of framesas 280. The information retained in each hyperspectral image
ncludes both spatial and spectral information from which phys-cal and geometric features such as color, size, orientation, shapend texture, as well as chemical/molecular information could be
xtracted.Calibration was performed recording two images for black andhite references. The black image (B) was acquired to remove the
ffect of dark current of the camera sensor, turning off the light
on and Recycling 61 (2012) 52– 58 55
source and covering the camera lens with its opaque cup. The whitereference image (W) was acquired for a standard white ceramic tileunder the same condition of the raw image. The following equationwas then used to calculate the corrected image (I):
I = I0 − B
W − B100 (1)
where I is the corrected hyperspectral image in a unit of rela-tive reflectance (%); I0 is the original hyperspectral image; B is theblack reference image (∼0% reflectance) and W is the white ref-erence image (∼99.9% reflectance). All the corrected images werethen used as the basis for subsequent analysis to extract spectralinformation, to select effective wavelengths and for classificationpurposes.
2.4. Spectral data analysis
Spectral data analysis was carried out by standard chemometricmethods (Otto, 1999; Geladi et al., 2007) utilizing the PLS Toolbox(Version 6.0.1, Eigenvector Research Inc.) running inside Matlab®
(Version 7.11.0, The Mathworks Inc.).Principal component analysis (PCA) was applied, after three
different pre-treatment steps, utilizing baseline, derivative andmean-centering techniques (see also Serranti et al., 2011), to clas-sify the unknown waste PO particles in PP and PE.
PCA is used to decompose the spectral data into several principalcomponents, which are linear combinations of the original spectraldata and can represent the spectral variations of the spectral data.A smaller set of defined factors is produced by PCA, that can be usedfor discrimination, since it provides an accurate description of theentire dataset.
The first few principal components (PCs) resulting from PCA aregenerally used to analyze the common features among samples andtheir grouping, because samples characterized by similar spectralsignatures tend to aggregate together in the score plot of the firsttwo or three components. Therefore spectra could be character-ized either by the reflectance at each wavelength in the wavelengthspace, or by their score on each PC in the PC space. In the score plotof the two or three first PCs, samples with similar spectra will begrouped in the same region of this space (i.e. PE), whereas sampleswith different spectral features will be clustered in other parts ofthis space (i.e. PP).
To validate the classification results obtained by PCA on HSIdata, the same unknown plastic particles have been classified byRaman spectroscopy, using a DeltaNu Advantage 785TM BenchtopRaman Spectrometer equipped with a NuScopeTM. The Advantage785 utilize a 120 mW (80 mW at sample), 785 nm diode laser. Theinvestigated spectral range was 200–2000 cm−1 with a resolutionof 5 cm−1.
2.5. Wavelength selection
The NIR range investigated in this study by the HSI system is par-ticularly useful for identifying polymers because most absorptionbands observed in this region arise from overtones or combina-tion bands of carbon–hydrogen (C H) vibrations. Considering thatthe extracted spectral data from PO particles images have a highdegree of dimensionality with redundancy among contiguous vari-ables (wavelengths), a selection of wavelengths was carried out, inorder to facilitate and speed up the classification of unknown POwaste particles. PCA was used as a reduction procedure to minimizethe number of variables (121 wavelengths) into a smaller num-
ber of principal components that account for most of the variance.The loadings resulting from PCA were considered as an indicationof the effective wavelengths that were not affected by redun-dancy and could contribute to classification of PP and PE waste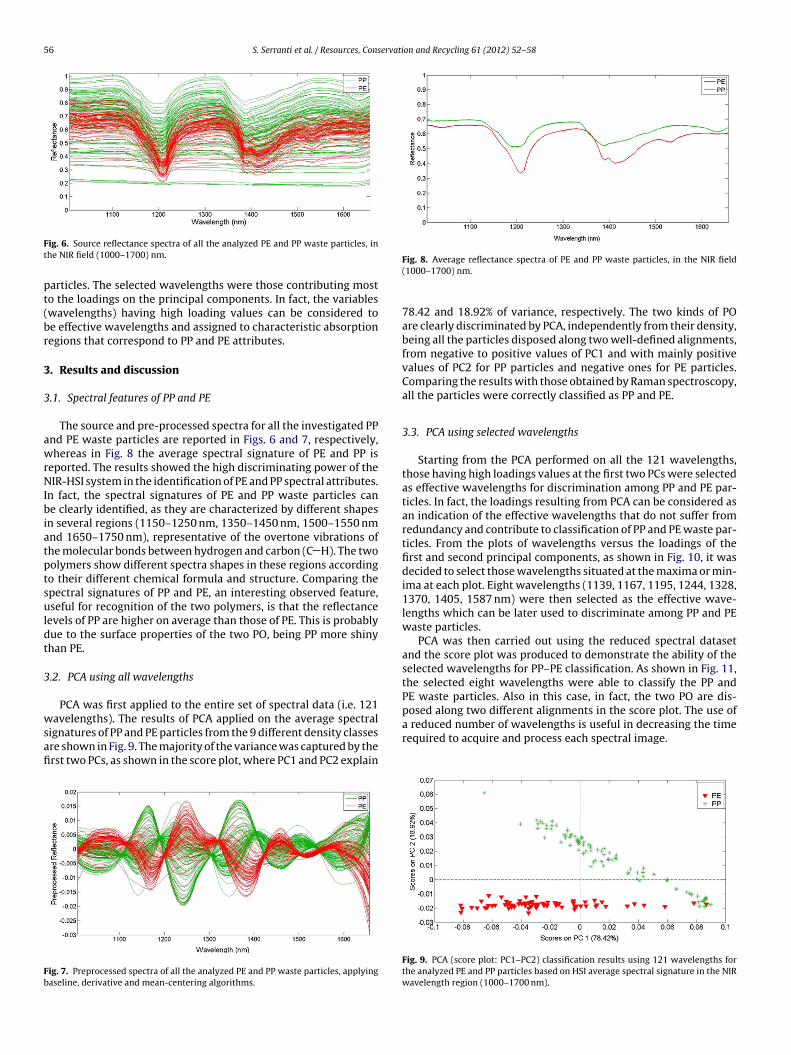
56 S. Serranti et al. / Resources, Conservation and Recycling 61 (2012) 52– 58
Ft
pt(br
3
3
awrNIbiatptsuldt
3
wsafi
Fb
ig. 6. Source reflectance spectra of all the analyzed PE and PP waste particles, inhe NIR field (1000–1700) nm.
articles. The selected wavelengths were those contributing mosto the loadings on the principal components. In fact, the variableswavelengths) having high loading values can be considered toe effective wavelengths and assigned to characteristic absorptionegions that correspond to PP and PE attributes.
. Results and discussion
.1. Spectral features of PP and PE
The source and pre-processed spectra for all the investigated PPnd PE waste particles are reported in Figs. 6 and 7, respectively,hereas in Fig. 8 the average spectral signature of PE and PP is
eported. The results showed the high discriminating power of theIR-HSI system in the identification of PE and PP spectral attributes.
n fact, the spectral signatures of PE and PP waste particles cane clearly identified, as they are characterized by different shapes
n several regions (1150–1250 nm, 1350–1450 nm, 1500–1550 nmnd 1650–1750 nm), representative of the overtone vibrations ofhe molecular bonds between hydrogen and carbon (C H). The twoolymers show different spectra shapes in these regions accordingo their different chemical formula and structure. Comparing thepectral signatures of PP and PE, an interesting observed feature,seful for recognition of the two polymers, is that the reflectance
evels of PP are higher on average than those of PE. This is probablyue to the surface properties of the two PO, being PP more shinyhan PE.
.2. PCA using all wavelengths
PCA was first applied to the entire set of spectral data (i.e. 121
avelengths). The results of PCA applied on the average spectralignatures of PP and PE particles from the 9 different density classesre shown in Fig. 9. The majority of the variance was captured by therst two PCs, as shown in the score plot, where PC1 and PC2 explain
ig. 7. Preprocessed spectra of all the analyzed PE and PP waste particles, applyingaseline, derivative and mean-centering algorithms.
Fig. 8. Average reflectance spectra of PE and PP waste particles, in the NIR field(1000–1700) nm.
78.42 and 18.92% of variance, respectively. The two kinds of POare clearly discriminated by PCA, independently from their density,being all the particles disposed along two well-defined alignments,from negative to positive values of PC1 and with mainly positivevalues of PC2 for PP particles and negative ones for PE particles.Comparing the results with those obtained by Raman spectroscopy,all the particles were correctly classified as PP and PE.
3.3. PCA using selected wavelengths
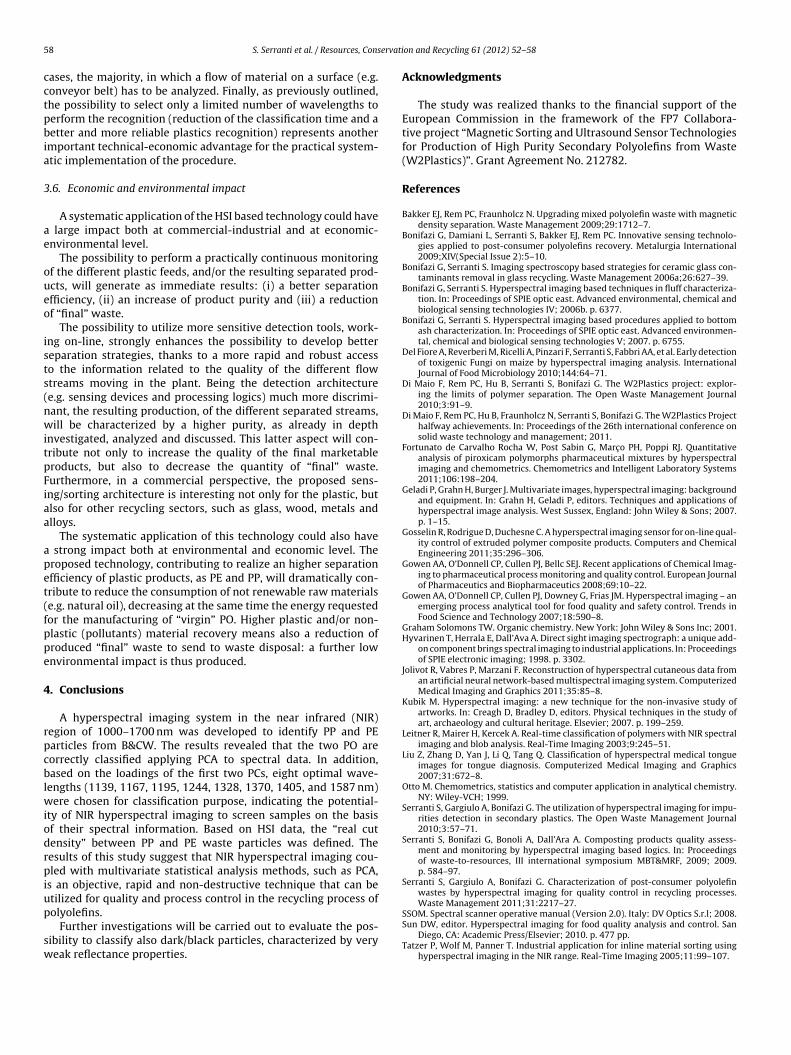
Starting from the PCA performed on all the 121 wavelengths,those having high loadings values at the first two PCs were selectedas effective wavelengths for discrimination among PP and PE par-ticles. In fact, the loadings resulting from PCA can be considered asan indication of the effective wavelengths that do not suffer fromredundancy and contribute to classification of PP and PE waste par-ticles. From the plots of wavelengths versus the loadings of thefirst and second principal components, as shown in Fig. 10, it wasdecided to select those wavelengths situated at the maxima or min-ima at each plot. Eight wavelengths (1139, 1167, 1195, 1244, 1328,1370, 1405, 1587 nm) were then selected as the effective wave-lengths which can be later used to discriminate among PP and PEwaste particles.
PCA was then carried out using the reduced spectral datasetand the score plot was produced to demonstrate the ability of theselected wavelengths for PP–PE classification. As shown in Fig. 11,the selected eight wavelengths were able to classify the PP andPE waste particles. Also in this case, in fact, the two PO are dis-posed along two different alignments in the score plot. The use of
a reduced number of wavelengths is useful in decreasing the timerequired to acquire and process each spectral image.Fig. 9. PCA (score plot: PC1–PC2) classification results using 121 wavelengths forthe analyzed PE and PP particles based on HSI average spectral signature in the NIRwavelength region (1000–1700 nm).
S. Serranti et al. / Resources, Conservation and Recycling 61 (2012) 52– 58 57
Fc
3
peP0sbt
uut
Pmpmbit
3a
crDo(
Fwaw
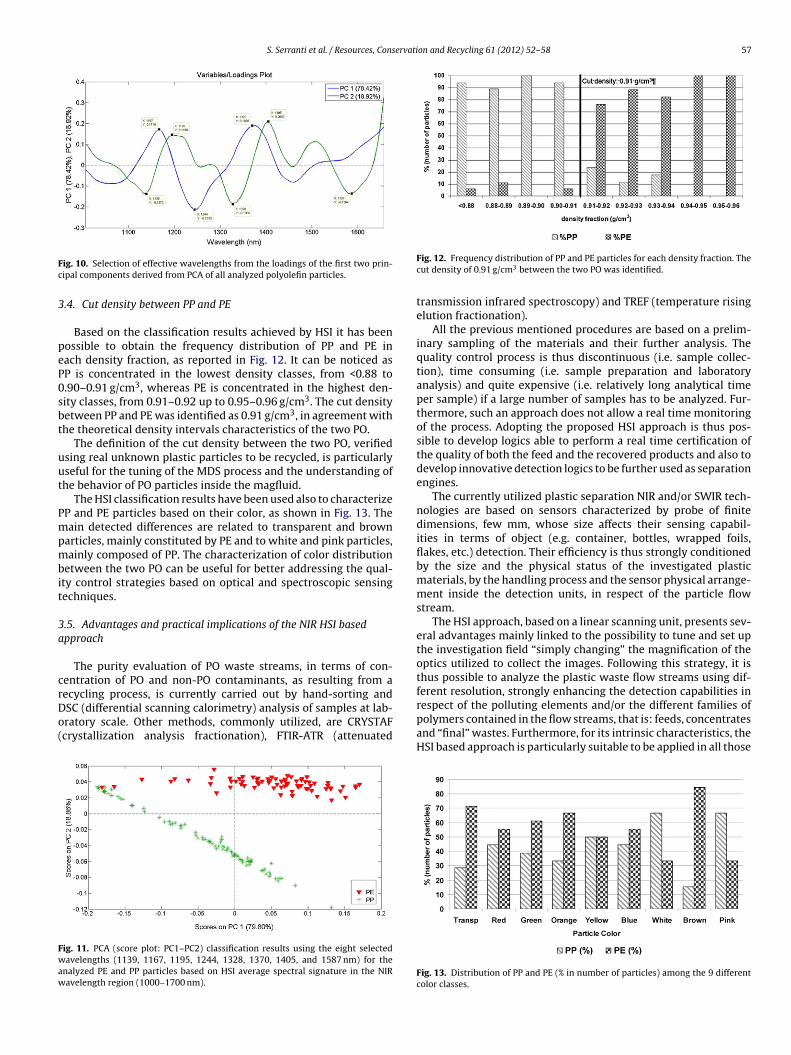
ig. 10. Selection of effective wavelengths from the loadings of the first two prin-ipal components derived from PCA of all analyzed polyolefin particles.
.4. Cut density between PP and PE
Based on the classification results achieved by HSI it has beenossible to obtain the frequency distribution of PP and PE inach density fraction, as reported in Fig. 12. It can be noticed asP is concentrated in the lowest density classes, from <0.88 to.90–0.91 g/cm3, whereas PE is concentrated in the highest den-ity classes, from 0.91–0.92 up to 0.95–0.96 g/cm3. The cut densityetween PP and PE was identified as 0.91 g/cm3, in agreement withhe theoretical density intervals characteristics of the two PO.
The definition of the cut density between the two PO, verifiedsing real unknown plastic particles to be recycled, is particularlyseful for the tuning of the MDS process and the understanding ofhe behavior of PO particles inside the magfluid.
The HSI classification results have been used also to characterizeP and PE particles based on their color, as shown in Fig. 13. Theain detected differences are related to transparent and brown
articles, mainly constituted by PE and to white and pink particles,ainly composed of PP. The characterization of color distribution
etween the two PO can be useful for better addressing the qual-ty control strategies based on optical and spectroscopic sensingechniques.
.5. Advantages and practical implications of the NIR HSI basedpproach
The purity evaluation of PO waste streams, in terms of con-entration of PO and non-PO contaminants, as resulting from a
ecycling process, is currently carried out by hand-sorting andSC (differential scanning calorimetry) analysis of samples at lab-ratory scale. Other methods, commonly utilized, are CRYSTAFcrystallization analysis fractionation), FTIR-ATR (attenuatedig. 11. PCA (score plot: PC1–PC2) classification results using the eight selectedavelengths (1139, 1167, 1195, 1244, 1328, 1370, 1405, and 1587 nm) for the
nalyzed PE and PP particles based on HSI average spectral signature in the NIRavelength region (1000–1700 nm).
Fig. 12. Frequency distribution of PP and PE particles for each density fraction. Thecut density of 0.91 g/cm3 between the two PO was identified.
transmission infrared spectroscopy) and TREF (temperature risingelution fractionation).
All the previous mentioned procedures are based on a prelim-inary sampling of the materials and their further analysis. Thequality control process is thus discontinuous (i.e. sample collec-tion), time consuming (i.e. sample preparation and laboratoryanalysis) and quite expensive (i.e. relatively long analytical timeper sample) if a large number of samples has to be analyzed. Fur-thermore, such an approach does not allow a real time monitoringof the process. Adopting the proposed HSI approach is thus pos-sible to develop logics able to perform a real time certification ofthe quality of both the feed and the recovered products and also todevelop innovative detection logics to be further used as separationengines.
The currently utilized plastic separation NIR and/or SWIR tech-nologies are based on sensors characterized by probe of finitedimensions, few mm, whose size affects their sensing capabil-ities in terms of object (e.g. container, bottles, wrapped foils,flakes, etc.) detection. Their efficiency is thus strongly conditionedby the size and the physical status of the investigated plasticmaterials, by the handling process and the sensor physical arrange-ment inside the detection units, in respect of the particle flowstream.
The HSI approach, based on a linear scanning unit, presents sev-eral advantages mainly linked to the possibility to tune and set upthe investigation field “simply changing” the magnification of theoptics utilized to collect the images. Following this strategy, it isthus possible to analyze the plastic waste flow streams using dif-ferent resolution, strongly enhancing the detection capabilities in
respect of the polluting elements and/or the different families ofpolymers contained in the flow streams, that is: feeds, concentratesand “final” wastes. Furthermore, for its intrinsic characteristics, theHSI based approach is particularly suitable to be applied in all thoseFig. 13. Distribution of PP and PE (% in number of particles) among the 9 differentcolor classes.
5 ervati
cctpbia
3
ae
oueo
ists(nwitpFiaa
apet(fppe
4
rpcblwiodrpiup
sw
8 S. Serranti et al. / Resources, Cons
ases, the majority, in which a flow of material on a surface (e.g.onveyor belt) has to be analyzed. Finally, as previously outlined,he possibility to select only a limited number of wavelengths toerform the recognition (reduction of the classification time and aetter and more reliable plastics recognition) represents another
mportant technical-economic advantage for the practical system-tic implementation of the procedure.
.6. Economic and environmental impact
A systematic application of the HSI based technology could have large impact both at commercial-industrial and at economic-nvironmental level.
The possibility to perform a practically continuous monitoringf the different plastic feeds, and/or the resulting separated prod-cts, will generate as immediate results: (i) a better separationfficiency, (ii) an increase of product purity and (iii) a reductionf “final” waste.
The possibility to utilize more sensitive detection tools, work-ng on-line, strongly enhances the possibility to develop bettereparation strategies, thanks to a more rapid and robust accesso the information related to the quality of the different flowtreams moving in the plant. Being the detection architecturee.g. sensing devices and processing logics) much more discrimi-ant, the resulting production, of the different separated streams,ill be characterized by a higher purity, as already in depth
nvestigated, analyzed and discussed. This latter aspect will con-ribute not only to increase the quality of the final marketableroducts, but also to decrease the quantity of “final” waste.urthermore, in a commercial perspective, the proposed sens-ng/sorting architecture is interesting not only for the plastic, butlso for other recycling sectors, such as glass, wood, metals andlloys.
The systematic application of this technology could also have strong impact both at environmental and economic level. Theroposed technology, contributing to realize an higher separationfficiency of plastic products, as PE and PP, will dramatically con-ribute to reduce the consumption of not renewable raw materialse.g. natural oil), decreasing at the same time the energy requestedor the manufacturing of “virgin” PO. Higher plastic and/or non-lastic (pollutants) material recovery means also a reduction ofroduced “final” waste to send to waste disposal: a further lownvironmental impact is thus produced.
. Conclusions
A hyperspectral imaging system in the near infrared (NIR)egion of 1000–1700 nm was developed to identify PP and PEarticles from B&CW. The results revealed that the two PO areorrectly classified applying PCA to spectral data. In addition,ased on the loadings of the first two PCs, eight optimal wave-
engths (1139, 1167, 1195, 1244, 1328, 1370, 1405, and 1587 nm)ere chosen for classification purpose, indicating the potential-
ty of NIR hyperspectral imaging to screen samples on the basisf their spectral information. Based on HSI data, the “real cutensity” between PP and PE waste particles was defined. Theesults of this study suggest that NIR hyperspectral imaging cou-led with multivariate statistical analysis methods, such as PCA,
s an objective, rapid and non-destructive technique that can betilized for quality and process control in the recycling process of
olyolefins.Further investigations will be carried out to evaluate the pos-ibility to classify also dark/black particles, characterized by veryeak reflectance properties.
on and Recycling 61 (2012) 52– 58
Acknowledgments
The study was realized thanks to the financial support of theEuropean Commission in the framework of the FP7 Collabora-tive project “Magnetic Sorting and Ultrasound Sensor Technologiesfor Production of High Purity Secondary Polyolefins from Waste(W2Plastics)”. Grant Agreement No. 212782.
References
Bakker EJ, Rem PC, Fraunholcz N. Upgrading mixed polyolefin waste with magneticdensity separation. Waste Management 2009;29:1712–7.
Bonifazi G, Damiani L, Serranti S, Bakker EJ, Rem PC. Innovative sensing technolo-gies applied to post-consumer polyolefins recovery. Metalurgia International2009;XIV(Special Issue 2):5–10.
Bonifazi G, Serranti S. Imaging spectroscopy based strategies for ceramic glass con-taminants removal in glass recycling. Waste Management 2006a;26:627–39.
Bonifazi G, Serranti S. Hyperspectral imaging based techniques in fluff characteriza-tion. In: Proceedings of SPIE optic east. Advanced environmental, chemical andbiological sensing technologies IV; 2006b. p. 6377.
Bonifazi G, Serranti S. Hyperspectral imaging based procedures applied to bottomash characterization. In: Proceedings of SPIE optic east. Advanced environmen-tal, chemical and biological sensing technologies V; 2007. p. 6755.
Del Fiore A, Reverberi M, Ricelli A, Pinzari F, Serranti S, Fabbri AA, et al. Early detectionof toxigenic Fungi on maize by hyperspectral imaging analysis. InternationalJournal of Food Microbiology 2010;144:64–71.
Di Maio F, Rem PC, Hu B, Serranti S, Bonifazi G. The W2Plastics project: explor-ing the limits of polymer separation. The Open Waste Management Journal2010;3:91–9.
Di Maio F, Rem PC, Hu B, Fraunholcz N, Serranti S, Bonifazi G. The W2Plastics Projecthalfway achievements. In: Proceedings of the 26th international conference onsolid waste technology and management; 2011.
Fortunato de Carvalho Rocha W, Post Sabin G, Marc o PH, Poppi RJ. Quantitativeanalysis of piroxicam polymorphs pharmaceutical mixtures by hyperspectralimaging and chemometrics. Chemometrics and Intelligent Laboratory Systems2011;106:198–204.
Geladi P, Grahn H, Burger J. Multivariate images, hyperspectral imaging: backgroundand equipment. In: Grahn H, Geladi P, editors. Techniques and applications ofhyperspectral image analysis. West Sussex, England: John Wiley & Sons; 2007.p. 1–15.
Gosselin R, Rodrigue D, Duchesne C. A hyperspectral imaging sensor for on-line qual-ity control of extruded polymer composite products. Computers and ChemicalEngineering 2011;35:296–306.
Gowen AA, O’Donnell CP, Cullen PJ, Bellc SEJ. Recent applications of Chemical Imag-ing to pharmaceutical process monitoring and quality control. European Journalof Pharmaceutics and Biopharmaceutics 2008;69:10–22.
Gowen AA, O’Donnell CP, Cullen PJ, Downey G, Frias JM. Hyperspectral imaging – anemerging process analytical tool for food quality and safety control. Trends inFood Science and Technology 2007;18:590–8.
Graham Solomons TW. Organic chemistry. New York: John Wiley & Sons Inc; 2001.Hyvarinen T, Herrala E, Dall’Ava A. Direct sight imaging spectrograph: a unique add-
on component brings spectral imaging to industrial applications. In: Proceedingsof SPIE electronic imaging; 1998. p. 3302.
Jolivot R, Vabres P, Marzani F. Reconstruction of hyperspectral cutaneous data froman artificial neural network-based multispectral imaging system. ComputerizedMedical Imaging and Graphics 2011;35:85–8.
Kubik M. Hyperspectral imaging: a new technique for the non-invasive study ofartworks. In: Creagh D, Bradley D, editors. Physical techniques in the study ofart, archaeology and cultural heritage. Elsevier; 2007. p. 199–259.
Leitner R, Mairer H, Kercek A. Real-time classification of polymers with NIR spectralimaging and blob analysis. Real-Time Imaging 2003;9:245–51.
Liu Z, Zhang D, Yan J, Li Q, Tang Q. Classification of hyperspectral medical tongueimages for tongue diagnosis. Computerized Medical Imaging and Graphics2007;31:672–8.
Otto M. Chemometrics, statistics and computer application in analytical chemistry.NY: Wiley-VCH; 1999.
Serranti S, Gargiulo A, Bonifazi G. The utilization of hyperspectral imaging for impu-rities detection in secondary plastics. The Open Waste Management Journal2010;3:57–71.
Serranti S, Bonifazi G, Bonoli A, Dall’Ara A. Composting products quality assess-ment and monitoring by hyperspectral imaging based logics. In: Proceedingsof waste-to-resources, III international symposium MBT&MRF, 2009; 2009.p. 584–97.
Serranti S, Gargiulo A, Bonifazi G. Characterization of post-consumer polyolefinwastes by hyperspectral imaging for quality control in recycling processes.Waste Management 2011;31:2217–27.
SSOM. Spectral scanner operative manual (Version 2.0). Italy: DV Optics S.r.l; 2008.Sun DW, editor. Hyperspectral imaging for food quality analysis and control. San
Diego, CA: Academic Press/Elsevier; 2010. p. 477 pp.Tatzer P, Wolf M, Panner T. Industrial application for inline material sorting using
hyperspectral imaging in the NIR range. Real-Time Imaging 2005;11:99–107.