classification of recycled sands and their applications as
TRANSCRIPT

Classification of Recycled Sands and their Applications as Fine Aggregates for Concrete and Bituminous Mixtures
Klassifizierung von Recycling - Brechsanden und ihre Anwendungen für Beton und für Straßenbaustoffe
Dissertation
Zur Erlangung des akademischen Grades eines Doktor-Ingenieurs (Dr.-Ing.)
den Fachbereich Bauingenieurwesen der Universität Kassel
vorlegt von
Mahmoud Solyman , M.Sc. aus Ägypten
Gutachter: Prof. Dr.-Ing. habil. M. Schmidt Prof. Dr.-Ing. Arnd I. Urban
2005

Erster Gutachter: Prof. Dr.-Ing. habil. M. Schmidt Zweiter Gutachter: Prof. Dr.-Ing. Arnd I. Urban Hiermit versichere ich, dass ich die vorliegende Dissertation selbständig und ohne unerlaubte
Hilfe angefertigt und andere als die in der Dissertation angegebenen Hilfsmittel nicht benutzt
habe. Alle Stellen, die wörtlich oder sinngemäß aus veröffentlichen oder unveröffentlichten
Schriften entnommen sind, habe ich als solche kenntlich gemacht. Kein Teil dieser Arbeit ist in
einem anderen Promotions- oder Habilitationsverfahren verwendet worden.
Kassel, den 10. Jun. 2005 Mahmoud Solyman, M.Sc.

Acknowledgment
I
ACKNOWLEDGMENT First, praise and thanks be to Almighty Allah for his limitless help and guidance and peace be upon his prophet. I wish to express my deepest gratitude to my main PhD supervisor professor M. Schmidt and professor Arnold I Uban at Kassel university for their valuable advice, comments and continuous encouragement which helped greatly in completion of this work. I would like to thank professor A. Müller at Weimar university for giving me the opportunity to measure the particle shape of the recycled sands in here laboratory using a computer-aided particle analysis system. I’m greatly indebted to professor M. AL-Taher at Zagazig university for his valuable guidance in part of the bituminous mixtures with recycled sands. Dr. B. Middendorf and Mr. P. Machner. I want to thank them and all the members of the structural materials of Kassel university and the staff of the laboratory for their kind assistance in accomplishing this work . I wish to thank Mr. H. Kurkowski, at remex company of building materials recycling for his help to attain different recycled sands for this work. To Mr. Thomas Teichmann at Kassel university, I owe a warm thank you for your generous efforts during performing this work. Finally, and in no sense the least, my hearted thanks to my parents and my wife for their continuous support and assistance. Kassel, August 2005 Mahmoud Solyman
Abstract
II
ABSTRACT As a result of the drive towards waste-poor world and reserving the non-renewable materials, recycling the construction and demolition materials become very essential. Now reuse of the recycled concrete aggregate more than 4 mm in producing new concrete is allowed but with natural sand a fine aggregate while. While the sand portion that represent about 30% to 60% of the crushed demolition materials is disposed off. Due to intensive building activities in the last decades, these amounts of the recycled aggregates are expected to considerably increase after the year 2000. Reuse of the recycled concrete sand as well as the recycled sands from construction and demolition materials in a high-grade applications was the target of this thesis. in all previous studies, the recycled sand was used together with recycled coarse aggregates, which means that replacement the natural sand by recycled sand arises the amount of the recycled aggregate in concrete from about 60 vol.% or 70 vol.% to 100% vol.% of the aggregates that may cause excess influences on the concrete. None of the studies being already published dealt with the alternative solution: using the recycled sand together with natural coarse aggregates. This is the new and unique approach of the presented scientific study in addition to investigation of the reuse of the recycled sands in bituminous mixtures. To perform this research, recycled concrete sand was produced in the laboratory while nine recycled sands produced from construction and demolitions materials and two sands from natural crushed limestone were delivered from three plants. Ten concrete mix designs representing the concrete exposition classes XC1, XC2, XF3 and XF4 according to European standard EN 206 were produced with partial and full replacement of natural sand by the different recycled sands. Bituminous mixtures achieving the requirements of base courses according to Germany standards and both base and binder courses according to Egyptian standards were produced with basalt and limestone coarse aggregate and six of the recycled sands as a substitution to the natural sands. The mechanical properties and durability of concrete produced with the different recycled sands were investigated and analyzed. Also the volumetric analysis and Marshall test were performed hot bituminous mixtures produced with the recycled sands. Depending on analysis of the laboratory tests results for the recycled sands, concrete and bituminous mixtures, it can be concluded that the specification limits for natural aggregate

Abstract
III
were not exceeded by any of recycled sands and the two natural limestone sands. The recycled sands can be characterized according to their composition and water absorption.. It is possible to replace the natural sand by the different recycled sands in concrete up to C35/45 concrete class without technical problems especially for the recycled concrete sands. The compressive strength of concrete produced by recycled sands can be optimised by adjustment the proportioning of concrete mixtures. The main aspect of the influence of the recycled sands on properties of the bituminous mixtures was that all the recycled sands decreased the voids in mineral aggregates which may not offer an enough space for the effective bitumen and the required air voids in the mix. Using of the different recycled sands in the hot bituminous mixtures up to 21% of total aggregate mass is possible in both base and binder courses. According to the effect of replacement the natural sand by the different recycled sands on the concrete compressive strength and durability, the recycled sands were classified into three groups. For the asphalt concrete mixes all the investigated recycled sands can be used in mixes for base and binder courses up to 21% of the total aggregate mass while only it was suggested to limit the amount of RC7 ( crushed bricks sand) to about 10% until further investigation on the stiffness of bituminous mixtures produced with this sand.

Notations and Abbreviations
X
NOTATIONS AND ABBREVIATIONS Latin Upper case letters
AASHTO American Association of State Highways and Transportation
ASTM American Society for Technics and Materials
AV Air Voids in Compacted Bituminous Mixtures (vol.% of Mix Volume)
BA Bitumen Absorption
BS Basalt Sand
CDF Capillary Suction of De-icing Chemicals and Freeze-Thaw-Test
CF Capillary Suction and Freeze-Thaw-Test
CPA Computer-aided Particle Analysis System
DAfStb The German Committee for Reinforced Concrete (In German: Der Deutsche Ausschuss für Stahlbeton)
DIN Standard in German
E Static Modulus of Elasticity of Concrete
Edyn Dynamical Modulus of Elasticity of Concrete
EN European Standards (In German: Euroepische Norm)
L/W Length to Width Ratio
MF Marshall Flow
MS Marshall Stability
MWD Mortar Water Demand
Pen Penetration
P-Sum Sum of the Percentage Passing of the Nine Standard Sieves from 0.25 mm to 63 mm
RAP Reclaimed Asphalt Pavement

Notations and Abbreviations
- XI -
RC Recycled
RCP Reclaimed Concrete Pavement
RILEM-TC International Union of Laboratories and Experts in Construction Materials, Systems and Structures- Technical Committee
RS Recycled Sand
S Spherically Value of Aggregate Particle
SEM Scanning Electron Microscope
Spec Specification
Va Volume of Air Voids
Vab Volume of Absorbed Bitumen
Vag Volume of Mineral Aggregate
Vcm Bulk Volume of Compacted Bituminous Mixtures
Veb Volume of Effective Bitumen
Vma Volume of Voids in Mineral Aggregate
VMA Voids in Mineral Aggregate in Compacted Bituminous Mixtures (vol.% of Mix Volume)
XRD X-Ray-Diffraction
WA Water Absorption of Sand

Notations and Abbreviations
- XII -
Latin lower case letters
abs Absorbed
av Average
d Diameter of Marshall Specimen
eff Effective
fc Compressive Strength of Concrete, Cube-Specimen
fcm Compressive Strength of Concrete, Cylinder-Specimen
fsp Splitting-Tensile strength
k Constant Factor for Calculation of the Dynamical Modulus of Elasticity, Equation 3-1
loc Location
m Mass
r.h. Relative Humidity
t Thickness of Marshall Specimen
v Wave Velocity for Calculation of the dynamical Modulus of Elasticity, Equation 3-1
vol Volume
w/c Water to Cement Ratio
Greek lower case letters
φ Diameter of Concrete Cylinder
ρ Concrete Density
µ Poisson ratio

Notations and Abbreviations
- XIII -

Chapter 1: Introduction
1
1- INTRODUCTION 1-1 General For many years peoples have been trying to keep the environmental clean and mention the natural balance of life. The scientific studies provide us the information and methods to achieve these objectives and the recycling of waste and by product materials represent the main role in these studies [1-4]. As a result of reconstruction of existing buildings and pavements, wars and natural disasters such as earthquakes the amount of construction and demolition materials are increasing every year. At the same time approval of additional facilities for waste disposal or treatment are become more difficult to obtain. Furthermore increasing restrictive environmental regulations have made waste disposal more difficult and expensive. Also the available natural aggregate in some countries decreases and may be become insufficient for the construction projects in these countries in the future [5]. So, the reuse of construction and demolition materials in construction has benefits not only in reducing the amount of materials requiring disposal but also can provide construction materials with significant saving of the original materials. According to the third Building Waste Monitoring Report [6], there is an increase in the recorded amount of building waste in the sectors of the building debris, road scarification and building site waste. It has arisen in Germany by 11.5 million tons, from 77.1 million tons in the period 1997/1998 to 88.6 million tons in the period 1999/2000. According to Rahlwes and Schmidt [7, 8], for concrete only, the annual crushed concrete quantity in west Germany only is about 30 million tones and in the European Union is approximately 130 million ton. Due to intensive building activities in the last decades, these amounts are expected to considerably increase after the year 2000 as shown in Figure (1-1). Processing the construction and demolition materials produce a considerable amount of crushed sand (0-2 mm or 0-4 mm) in addition to the recycled coarse aggregate. The investigations showed that the part of sand 0-2 mm is about 20 % to 40% and the part 0-4 mm is between 30 and 60% of the crushed building debris depending on the crushing type and the crushed materials [9]. This illustrates that the expected amounts of crushed sands from construction and demolition materials will considerably increase in the next decades. The properties of recycled coarse aggregate with a grain size above 4 mm and its reuse in concrete production and pavements construction have been evaluated and described in many

Chapter 1: Introduction
2
previous studies. However the reuse of sand from recycled materials as a fine aggregate has not received much attention up to now and most of the recycled sands are still disposed off.
0
40
80
120
160
200
240
280
1880 1900 1920 1940 1960 1980 2000 2020 2040Year
Qua
ntity
, Mili
on to
ns
.
Concrete production
Demolished quantity
Crushed sand
Figure (1-1): Development of concrete production with the estimated demolished quantity and the recycled sand in West Germany [7, 8]
1-2 Problem statement As mentioned before, most of the amount of recycled concrete sand is not reused. The recycled sands from other demolition materials such as bricks and lime-sand bricks up to now are more or less totally disposed off. The behavior of these sands as a fine aggregate in concrete is not yet investigated. In previous investigations of concrete produced with recycled concrete aggregates, it is always recommended to use the recycled coarse aggregate together with natural sand and it is assumed that using the recycled concrete sand affect the properties of fresh and hardened concrete negatively in large extent. From one side, this is related to the fact that the recycled concrete sand contains a high amount of old cement mortar, which increases the sand porosity and water absorption and may decrease the concrete strength and durability. On the other side, in all previous studies, the recycled sand was used together with recycled coarse aggregates, which means that replacement the natural sand by recycled sand arises the amount of the recycled aggregate in concrete from about 60% or 70% to 100% that may cause excess influences on the concrete. None of the studies being already published dealt with the alternative solution: using the recycled sand together with natural coarse aggregates. This is the new and unique approach of the presented scientific study in addition

Chapter 1: Introduction
3
to investigation of the reuse of the recycled sands in bituminous mixtures. To evaluate the reuse of the different recycled sands in high-grade applications such as concrete and bituminous mixtures, the following points were investigated in this research work:
1- Effect of the recycled concrete sand on the properties of concrete produced with recycled sand and natural coarse aggregate,
2- Effect of a wide variety of different recycled sands on the concrete properties and 3- Influence of different recycled sands on the properties of the asphalt concrete mixtures
as alternative, which may be not affected by some of negative characteristics of the recycled sands.
1-3 Objectives of the study The main aim of this research work is characterizing and classifying the recycled sands produced from different construction and demolition materials and to examine properties of concrete and bituminous mixtures produced with each recycled sand as a full or partial replacement of the natural sand. The results will be used to find suitable applications for each group of sands with regard to the concrete exposition classes of the European standards EN 206. To achieve the main aim, the following objectives were performed:
1- Characterization of the different recycled sands by measuring their physical and chemical characteristics using the several methods,
2- Investigation of the properties of fresh and hardened concrete mixes being produced with the different recycled sands, which represent 4 concrete exposition classes (XC1, XC4, XF3 and XF4) according to European standard for concrete EN 206,
3- Investigation of the properties of hot bituminous mixtures produced with the different recycled sands,
4- Adjustment of the existing relations between the different properties of concrete produced with natural aggregate to be used for concrete with recycled sands,
5- Correlation the properties of concrete and the bituminous mixtures to the recycled sand characteristics,
6- Classifying the recycled sands into groups and determining the allowable amount of the recycled sand of each group that can be used in the different concrete exposition class.

Chapter 1: Introduction
4
1-4 Organization of the study In addition to the introduction of this work chapter 1, there are nine chapters. The previous studies related to the recycled sands characteristics, the properties of concrete and asphalt concrete produced with recycled sands and the special problems of concrete with recycled aggregates are evaluated and summarized in chapter 2. The experimental program including the investigated parameters as well as the proportioning of concrete and the bituminous mixtures are presented in chapter 3. Chapter 4 includes the measured properties of the materials used beside the recycled sands such as the natural aggregates, cement and bitumen that were used to produce concrete and asphalt concrete mixes. The different recycled sands are characterized in chapter 5 by measuring their physical, mechanical and chemical characteristics. Effect of using the different recycled sands on the properties of fresh and hardened concrete with recycled sands are investigated in chapter 6 while this effect on the bituminous mixtures properties are analyzed in chapter 7. Chapter 8 contains the relations between the different properties of concrete produced with recycled sands and correlation of the concrete properties to the recycled sand characteristics. Classification of the different recycled sands is presented in the last section of chapter eight. The summary, conclusions and recommendation of the study are presented in chapter 9.

Chapter 2: Literature Review
5
2- LITERATURE REVIEW
2-1 General Recycling of demolition and construction materials is not a recent strategy but it was known in the first few years after the second world war. In this period, the mineral materials, especially the bricks, were processed to be used in concrete production and the researches works about the use of the bricks as concrete aggregates rapidly increased [10, 11]. Due to the interest in keeping the environment clean and to reserve the natural aggregates, the concentration on the recycling technology started at the end of the seventeenth years of the last century and continued until now [12].
The German committee for reinforced concrete DAfStb (Der Deutsche Ausschuss für Stahlbeton) initiated at 1996 the research program "Building material cycle in massive structures" (Baustoffkreislauf im Massivbau) to investigate utilization ways for using building rubbles in concrete [13]. In this research program, the demolition methods, processing of construction and demolition materials and characterisation of the produced recycled aggregates were examined. Furthermore, determination of the allowable quantities of recycled aggregates to be reused and the required adjustments concerning the design of the structures according to the standard DIN 1045 were determined. The main results of this research program will be presented in the next sections with the results of the other research works. Historically, because of the large volume of materials required for their construction, pavements have favourable structures for the recycling of a wide range of waste materials. Otherwise, the maintenance and reconstruction of pavements are one of the main productions of waste materials. Waste from road construction represents one quarter to one third of the total amount of construction waste [14]. However, it clearly has a high potential for the reuse in new road constructions, to benefit from its original appropriate properties. Initially the recycling was limited to the reuse of materials removed from previous pavement structures such as: Reclaimed Asphalt Pavement (RAP), Reclaimed Concrete Pavement (RCP) and various base courses materials. Recently, various other materials, not originating from pavements have come into use. Since 1990 the reuse of the demolished concrete pavements

Chapter 2: Literature Review
6
were intensive investigated [15-17]. Until now the produced aggregates from the old pavements are used in the base courses. In the following, the existing specifications and guidelines for the recycled aggregates as well as the previous studies related to the characteristics of the recycled sands and the properties of concrete and bituminous mixtures produced with these sands will be reviewed.
2-2 Guidelines for concrete with recycled aggregates 2-2-1 Guidelines of DAfStb “ Concrete with recycled aggregates” This guidelines was established in 1998 and consists of two parts, the first part for concrete technology while the second part is about the recycled coarse and fine aggregates [18]. According to this guideline the amounts of the recycled concrete coarse aggregates and recycled concrete sand in Table (2-1) can be used for the defined applications without changes in the design criteria. It should be noted that the recycled concrete sand, up to 7% of the total aggregate volume, is allowed to be used in the internal building elements. The requirements of the recycled aggregates to be used in these amounts are found in part 2 of this guideline. In the reviewed DAfStb in 2004, the use recycled sand in concrete has been removed [19].
Table (2-1): Maximum allowable recycled aggregates, percentage from the total aggregates
Application
Concrete class
Recycled concrete coarse aggregate > 2 mm vol.%
Recycled concrete sand ≤ 2 mm vol.%
up to B25 35 Internal building elements B35 25
7
Concrete for exterior elements Concrete against water Concrete with high frost resistance
Concrete with high resistance against low chemical attack
20
0

Chapter 2: Literature Review
7
2-2-2 The standard DIN 4226 - 100 “Recycled aggregates” The recycled aggregates are classified into four types in the standard DIN 4226-100 “Recycled aggregates” [20]. These classes depend on the composition of the original materials. Table (2-2) shows the composition of every class. As listed in another Table in DIN 4226-100, the minimum particle density of type 1 and type 2 must be 2000 kg/m³ compared to 1800 and 1500 for type 3 and Type 4 respectively. The tolerance of particle density were
limited to ±150 kg/m³ for the first three types with no limits for type 4. The other
requirement is that the water absorption after 10 minutes must not exceed 10, 15 and 20 m.% for Type 1, Type 2 and Type 3 respectively. Table (2-2): Composition of the original materials
Composition, m.% Components
Typ 1 Typ 2 Typ 3 Typ 4
Concrete and natural aggregates ≥90 ≥70 ≤20
Clinker and not porosity bricks ≥80
Lime-sand brick ≤10 ≤30
≤5
≥80
Other mineral Components 1) ≤2 ≤3 ≤5
Asphalt ≤1 ≤1 ≤1 ≤20
Foreign Components ²) ≤0.2 ≤0.5 ≤0.5 ≤1
¹)as porosity bricks, light concrete pore concrete and mortar. ²) as class, ceramic, plastic, rubber and wood. Roos [21] summarized the Guidelines for the recycled aggregates in different countries, Table (2-3) presents some of the information related to the amount of the recycled aggregates in general and especially the recycled sands, which is allowed to be used for the different applications. The reuse of recycled sands < 2 mm is limited to low values and is allowed with restrictive limits such as achieving the requirements of the natural sand. Furthermore most of the allowed recycled aggregates are from crushed concrete only.
2-3 Characteristics of the recycled sands
2-3-1 Strength
The strength of the recycled coarse aggregates can be characterized using the tests of pavement materials, as Los Angeles test, or those for light concrete aggregates. No tests were

Chapter 2: Literature Review
8
found for characterising the strength of the recycled sands. According to Ravindrajah no significant relations were found between the strength of the recycled coarse aggregates and the mechanical properties of the produced concrete [22].
Table (2- 3): Applications of the recycled aggregates in different countries
Country Applications
Allowable recycled
materials, vol.%
Using of recycled sand
< 4 mm
Allowable concrete
class
Allowable amount of other
materials
Germany
not for pre-stressed concrete
and strong chemical attack
0 - 42 only crushed
concrete
max. 7 vol. % < 2 mm
up to B35 < 0.2 m.%
wood, plastic materials
Switzerland for pre-stressed
only with special tests
0 - 100 depending on
the use allowed
all according to concrete
building specification
< 0.3 m.% wood, plastic
materials
Netherlands only in passive and moderator environment
20 only crushed
concrete
up to 20% allowed
up to strength 40 N/mm²
up to 1 m.% bitumen
up to 0.15 m.% organic materials
Denmark.
only in passive and moderator environment
0 - 100 for particles > 4
mm allowed
according to aggregates up to 21 N/mm²
strength
-
Japan only in
subordinated elements
0 -100 only crushed
concrete allowed
according to aggregates up
strength se C30/37
up to 10 kg/m³ gypsum
up to 2 Kg/m³ asphalt
Belgium only in not aggressive
environment 0 - 100
only when achieving the specifications
of natural aggregates
according to aggregates up
to strength C30/37
< 1 m.% non mineral
components
USA
concrete, reinforcement and
pre-stressed concrete
0 - 100 only crushed
concrete allowed
all according to ACI 318-
95 no information
Europa as in EC2 [23] 0 - 100 for
particles > 4 mm
only when achieving the specifications
of natural aggregates
according to aggregates up
to strength C50/60
up to 0.5% organic
components
Chapter 2: Literature Review
9
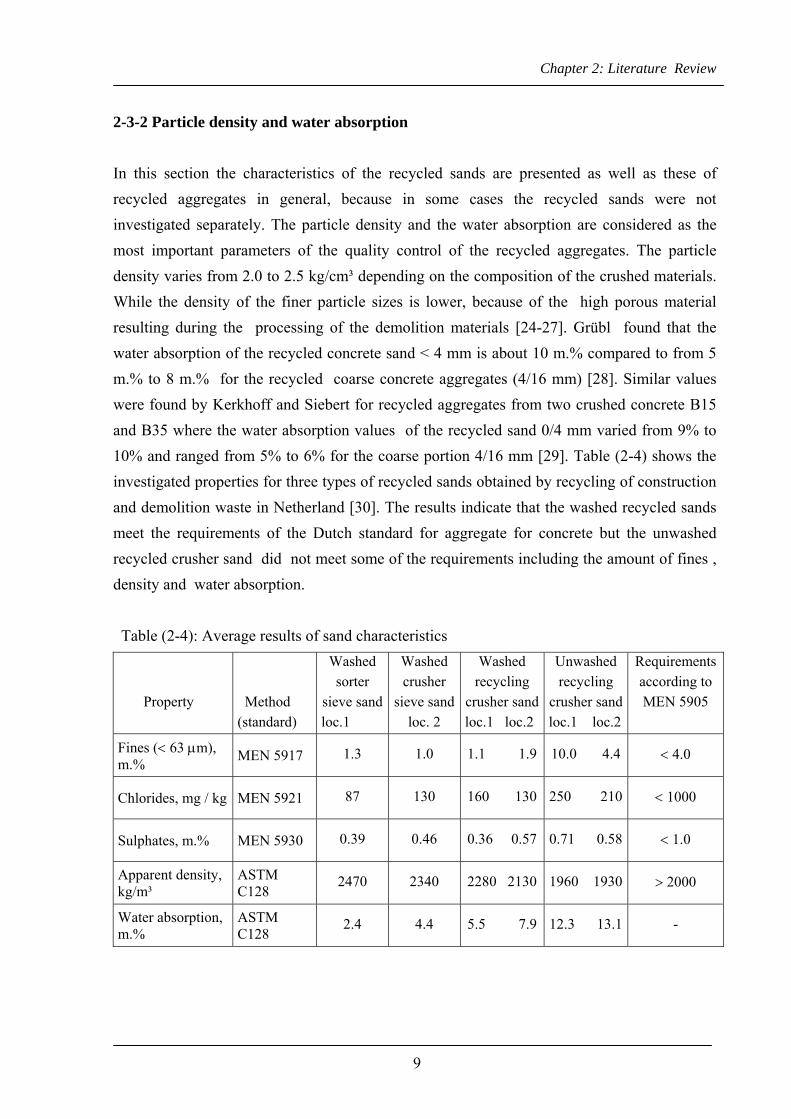
2-3-2 Particle density and water absorption In this section the characteristics of the recycled sands are presented as well as these of recycled aggregates in general, because in some cases the recycled sands were not investigated separately. The particle density and the water absorption are considered as the most important parameters of the quality control of the recycled aggregates. The particle density varies from 2.0 to 2.5 kg/cm³ depending on the composition of the crushed materials. While the density of the finer particle sizes is lower, because of the high porous material resulting during the processing of the demolition materials [24-27]. Grübl found that the water absorption of the recycled concrete sand < 4 mm is about 10 m.% compared to from 5 m.% to 8 m.% for the recycled coarse concrete aggregates (4/16 mm) [28]. Similar values were found by Kerkhoff and Siebert for recycled aggregates from two crushed concrete B15 and B35 where the water absorption values of the recycled sand 0/4 mm varied from 9% to 10% and ranged from 5% to 6% for the coarse portion 4/16 mm [29]. Table (2-4) shows the investigated properties for three types of recycled sands obtained by recycling of construction and demolition waste in Netherland [30]. The results indicate that the washed recycled sands meet the requirements of the Dutch standard for aggregate for concrete but the unwashed recycled crusher sand did not meet some of the requirements including the amount of fines , density and water absorption. Table (2-4): Average results of sand characteristics Property
Method (standard)
Washed sorter
sieve sandloc.1
Washed crusher
sieve sand loc. 2
Washed recycling
crusher sandloc.1 loc.2
Unwashed recycling
crusher sand loc.1 loc.2
Requirements according to MEN 5905
Fines (< 63 µm), m.% MEN 5917 1.3 1.0 1.1 1.9 10.0 4.4 < 4.0
Chlorides, mg / kg MEN 5921 87 130 160 130 250 210 < 1000
Sulphates, m.% MEN 5930 0.39 0.46 0.36 0.57 0.71 0.58 < 1.0
Apparent density, kg/m³
ASTM C128
2470 2340 2280 2130 1960 1930 > 2000
Water absorption, m.%
ASTM C128
2.4 4.4 5.5 7.9 12.3 13.1 -

Chapter 2: Literature Review
10
2-3-3 Particle shape and surface textures The recycled aggregates have in general more rough surface area compared to the natural aggregates, while the particle shape depends on the processing methods of the demolished materials [31, 32]. There is a lack of available data on the quantitative difference between natural sand and recycled sands with respect to the surface textures and the particle shape. 2-3-4 Frost and frost de-icing salt resistance Recycled concrete coarse aggregates generally don’t pass the freeze-thaw test specified in DIN 4226-3, but the values vary strongly depending on the original materials [ 33-35]. 2-3-5 Chloride and Sulphate The chloride and sulphate contents were used to control the quality of the recycled aggregates as in the standard DIN 4226-100, where the chloride and sulphate content must be less than 0.04 m.% and 1 m.% respectively. These two parameters depend in a large extent on the contamination of the recycled aggregates. The recycled concrete from old pavements and parking areas always contain more chloride and sulphate amounts as listed in the state of the art by Hansen [36]. The sulphate content depends in large extent on presence of gypsum in the demolished materials. Nicolay investigated seven recycled concrete sands and mixtures of these sands and found that the chloride contents values vary from 0.012 to 0.023 m.% while no sulphate was found in any of these sands [37].
2-4 Applications for the recycled sands. The maximum allowable values for reuse of the recycled concrete sands in Germany and other countries were presented in Tables (2-1) and (2-3) while in the following permissible applications for the recycled concrete sand as well as the other recycled sands is reviewed. Dora [38] listed the following fields for reuse of recycled concrete sand: 1- Noise protection barriers, 2- Frost protection course, 3- Hydraulic bound base course,

Chapter 2: Literature Review
11
4- Plaster sand and 5- Shoulder stabilisation. The recycled bricks sand can be used up to 20 m.% in producing new bricks [39]. According to Müller [40], the crushed bricks sand can be used for wall building mortar Class IIa. This in addition to other applications such as base courses for sport fields. The crushed lime-sand bricks can be used up to 50 m.% in producing new lime-sand bricks as found by Eden [41]. The difficulty to separate the lime-sand bricks from the cement mortar when it comes from demolished walls decrease the chances for reusing this material until now.
2-5 Properties of concrete with the recycled sands 2-5-1 Fresh concrete properties Producing concrete with recycled concrete sands needs higher quantities of water or superplasticizer to achieve the required workability, because of its rough surface as well as it draws further water from the concrete [29]. In this investigation superplastizer ranging from 1.1 to 2.5 m.% from the cement weight were used to replace the natural sand by recycled concrete sand up to 100%. Kenai [42] increased the w/c ratio and consequently the water quantity at replacement of the natural coarse and fine aggregates by recycled aggregates to achieve 70 cm slump as shown in Figures (2-1). It is noticed that the total replacement of the natural sand by recycled sand considerably increased the required water content at 100% recycled coarse aggregates although 1% admixture was used for this mix only (100 m.% recycled coarse aggregate and 100 m.% recycled sand). The analysis of concrete mixes produced by the recycled sands, which was presented in Table (2-4) shows that the replacement of river sand by recycled sand does not affect the workability of the concrete in an adverse way and the bleeding characteristics were found to be improved. Full replacement of river sand by washed sorter sieve sand or washed crusher sieve sand results in limited reduction in concrete strength.

Chapter 2: Literature Review
12
200210220230240250260270280
0 25 50 75 100
Recycled aggreagtes, m.%
Wat
er, l
/m³
.
Coarse
fines
coarse andfines
Figures (2-1): Quantity of water needed for a constant slump of 70 mm [42] 2-5-2 Mechanical properties of hardened concrete 2-5-2-1 Strength The influence of recycled aggregates and recycled sands on the strength of concrete was examined in many previous studies. Dilmann found out that the low strength of the recycled aggregates decreased the strength of the produced concrete [43]. Other authors [28, 36, 44, 45] investigated the relation between the strength of the original concrete and the produced concrete and established that the strength of the new concrete with recycled aggregates may be higher or lower than the strength of the old concerte. The investigation of Lukas [46] illustrated that using the recycled sands in concrete reduced the concrete strength. Kerkhoff and Siebel [29] found out that although the compressive strength and splitting-tensile strength of concrete with 100% recycled concrete coarse aggregates and different quantities of recycled sand were in the range of the reference mix with natural sand, no significant relation could be determined between the recycled sand amount in concrete as well as the strength of the old concrete and the strength of the new concrete. Kenai [42] investigated the mechanical properties of concrete with recycled coarse and fine aggregates and found a reduction in compressive strength after 28 days in the order of 10 to 20% for concrete with recycled coarse aggregates, 10 to 30% for concrete with fine recycled aggregates and up to 35% for concrete with both coarse and fine aggregates. This reduction in compressive strength could be mainly due to the adhering old mortar on the recycled aggregates which affects cement hydration as also found by other researchers [47, 48].

Chapter 2: Literature Review
13
2-5-2-2 Shrinkage and modulus of elasticity The modulus of elasticity of concrete with recycled aggregates was 15 to 50% lower than that of normal concrete according to Hansen [36], using higher amounts of the recycled sands increased the reduction in the modulus of elasticity. He related that to the cement mortar in the old concrete and the lower modulus of elasticity of the recycled aggregates. In compare to concrete with recycled concrete aggregates and natural sand, using 100% recycled sands decreased the modulus of elasticity by about 35% [29]. The time dependent deformation of concrete with recycled aggregates and especially with recycled sands increases, because the higher shrinkage of the cement paste in the new concrete reduces the modulus of elasticity, which increase the concrete deformation. It was concluded by Kekhoff and Siebel [29] that the shrinkage and creep of concrete were considerably increased by the use of crushed concrete coarse aggregates and particularly the crushed sand. They observed that after 2.5 years the shrinkage of concrete with 10% recycled aggregates was about 60% to 100% higher than the values for reference concrete, without recycled aggregates, and the creep was up to 350% higher. 2-5-3 Durability of concrete The durability of concrete with recycled aggregates was investigated as an important parameter for evaluation the concrete performance. In the following , a review of the results related to carbonation of concrete as well as the resistance of concrete to frost with and without de-icing salt is presented. 2-5-3-1 Concrete carbonation According to the previous research works, using the recycled aggregates and consequently the recycled sands in concrete affected the carbonation of concrete in varied values. No significant effect on both carbonation and gas permeability was found at using the recycled concrete sands up to 100% in producing new concrete [29]. Some laboratory studies found an increase in carbonation depth by 5% to 10% at using the recycled aggregates [49, 50] while other authors found higher increase up to 100% higher in the carbonation depth in compare to concrete with natural aggregates [36].

Chapter 2: Literature Review
14
2-5-3-2 Frost and frost de-icing salt resistance According to Grübl [28] all investigated concretes with recycled aggregates achieved the required frost resistance. Also the resistance to frost with de-icing salt was sufficient for concrete with up to 100% recycled concrete aggregates if air entrained agents are used. Kerkhoff and Siebel [29] concluded that the frost resistance of concrete was adequate although the used recycled coarse aggregates did not achieve the frost requirements.
2-6 Properties of bituminous mixtures with recycled sands Different waste materials has a potential for use as an aggregate in base and sub-base layers, in both asphalt pavements and Portland cement concrete pavements. In recent years there are many studies related to the reuse of building rubbles in the upper layers such as asphalt base courses and binder courses as well as the wearing surface course. There is a limited numbers of studies on the reuse of demolition and construction materials in bituminous mixtures mixes for any of the asphalt layers. Khalaf [51] investigated the properties of bituminous mixtures mix produced with crushed brick as a coarse aggregates. The results of this investigation yield the following conclusions:
1- The use of recycled crushed bricks as a coarse aggregate in bituminous mixes is a feasibly option,
2- Bituminous mixtures produced with bricks performed better under load than that produced with granite aggregates,
3- There is no changes required to the design or mixing procedures of the bituminous mixtures and
4- The rate of flow or deformation under the load of hot bituminous mixtures produced with granite was faster than the mix with bricks.
Abeyasinghe [52] evaluated the performance of bituminous mixtures produced with recycled concrete coarse and fine aggregates as a replacement to the granite and natural sand. The investigation had identified several promising results for using the recycled concrete aggregate in bituminous mixtures where its light weight and large particle sizes enhancing the mix stiffness. On the other hand and as expected the results showed that the absorbed bitumen is increased because of the high porosity of the recycled materials.

Chapter 2: Literature Review
15
Using the foundry sand in bituminous mixtures was investigated by many authors [53, 54]. The foundry sand is a by-product of the casting industry that results from the modelling and core making process. Javed [53] found that when as much as 15 % of the foundry sand is blended with the natural sand, the performance of the bituminous mixtures is not very different from that using natural aggregate. The study that conducted on bituminous mixtures with recycled concrete coarse aggregate and foundry sands illustrated that using the recycled concrete coarse aggregate with natural sand increased the mix stability and stiffness [54]. The fine grading exhibited by the recycled foundry sand will tend to occupy more voids in the mix due to its small particles. Accordingly, a detrimental effect on the stability was significant from the particles interlocking. However the recycled foundry sand increased the bitumen required in asphalt production. A research project consisted of 301 bituminous mixtures produced with natural aggregate, 10% and 20% crushed concrete was performed to evaluate the use of the recycled concrete aggregate in the bituminous mixtures [55]. The results of this project indicated that there is more dust in the crushed concrete than in the natural sand and the material itself is finer than the natural sand. This increased the mix stiffness. Compaction breaks down the concrete easily creating more dust and lower voids. The bottom ash and fly ash were used also in the bituminous mixtures as a fine materials and mineral filler respectively. The effect of using these waste materials on properties of bituminous mixtures was reviewed because some of their properties are similar to these of the recycled sands such as their higher water absorption and lower density compared with natural sand. Bottom ash is a waste material from coal burning power plants while the fly ash precipitated from the stacks of pulverized coal-fired boilers at electrical power generating plants. Laboratory studies [56, 57] have also been conducted to evaluate the feasibility of using bottom ashes as a partial or full replacement of natural aggregates in hot bituminous mixtures and develop guidelines for their use.. The properties of hot bituminous mixtures containing bottom ash are dependent on ash content generally, as the ash content increased, the optimum binder content is increased, the mix density decreased and air voids and voids in mineral aggregates are increased. The mix containing bottom ash is susceptible to rutting. However, the mix highly resistance to moisture induced damage (stripping). Wet bottom ash can be improve the skid resistance of hot bituminous mixtures wearing courses. The wearing surface constructed from bituminous mixtures produced with 50% and 75% from this ash obtained a satisfactory performance [58, 59].

Chapter 2: Literature Review
16

Chapter 3: Experimental Program
17
3 – EXPERIMENTAL PROGRAM
3-1 Identification of the obtained sands To achieve the main objective, classification of mineral recycled sands, 12 sand types with different combinations of original materials were obtained from four sources. These sources included laboratory, Baureka company (Plant A), Remex company (Plant B) and Ready Mix company (Plant C). The collected recycled sands were produced by crushing of various building materials such as concrete, bricks and lime-sand bricks as well as asphalt concrete. Figure (3-1) shows the natural sand and some of the investigated recycled sands. Each of the other recycled sands RC 3, RC 6, RC 8 and RC 9 is similar to one of the presented recycled sands in the figure. The recycled crushed concrete aggregate, as a reference, was obtained in the laboratory by casting concrete cubes 15 × 15 × 15 cm using natural aggregates. The concrete mix consists of 320 kg/m³ cement, 30% sand 0-2 mm and 70% coarse aggregates 2-16 mm. The water/cement ratio (w/c) was 0.58. This mix design is typical for concrete exposition class XC4 according to European standard for concrete EN 206. After casting, the concrete was left in the forms for 24 hours and then stored under water until 7 days age and in a climate chamber at 20° C and 65% r.h. until crushing. These cubes were crushed by a jaw crusher after 2 months and then divided by 4 mm sieve into recycled concrete sand 0-4 mm (RC 1) and recycled coarse aggregate 4-16 mm. The source and description of the investigated recycled sands as well as the natural sand are presented in Table (3-1). The different properties of these are presented and discussed in details in chapter 5.
Figure (3-1): Natural sand and some of the investigated recycled sands
RC1
RC2RC9
RC4
RC5
RC7
NS

Chapter 3: Experimental Program
18
Table (3-1): Identification of recycled and natural sands
Source Sand Composition Symbol
Laboratory Reference recycled sand from crushed concrete
100% concrete (B 35 with CEM I 32.5) produced in the laboratory RC 1
011205 pre-sieved crushed 1) concrete and asphalt concrete sand, quality controlled
70% concrete + 30% asphalt concrete RC 2
011220 pre-sieved from frost protection materials 100% pre-sieved building debris RC 3 Plant A
011222 Crushed building debris sand 100 % building debris RC 4
Crushed concrete sand 80% concrete + 20% bricks RC 5
Crushed pre-sieved building debris sand 100% pre- sieved building debris RC 6
Crushed bricks sand , sorted 95% bricks + 5% mortar RC 7
Crushed bricks sand, masonry works 60% bricks + 40% mortar RC 8
Crushed lime-sand bricks sand RP I, sorted 100% lime-sand bricks RC 9
Plant B
Crushed lime-sand bricks sand RP III, masonry works
70 % lime-sand bricks + 30% mortar RC 10
Crushed limestone sand (dry crushing) Limestone LQ 1
Plant C Crushed limestone sand (wet impact crushing) Limestone LQ 2
Kassel Region Natural siliceous sand 100% Siliceous sand NS 1) The established numbers for RC2, RC3 and RC4 are code numbers defined by plant A
3-2 Aggregate mixtures 3-2-1 Aggregate mixtures for concrete Aggregates of gradations AB16 and AB32 according to European standard EN 206 were selected for the concrete mixes. To achieve these gradations 30% natural sand 0-2 mm was blended with 70% natural coarse aggregate 2-16 mm for AB16 and 2-32 mm for AB32. The natural sand then was replaced by different recycled sands in varied amounts ranged from

Chapter 3: Experimental Program
19
0 to 100 vol.% while the coarse aggregate was replaced by recycled concrete coarse aggregate with the all recycled sands. Table (3-2) shows the used amounts of the recycled aggregates with respect to fine, coarse and total aggregates. The amounts of the recycled sands as a volume percentage of total aggregates were kept constant for all applications (0, 9, 15, 21 and 30 vol.% of total aggregates). Table (3-2): Recycled to natural aggregates proportions for concrete mixes
Fine aggregate (30%) Coarse aggregate (70%) Aggregate mixture Recycled 1) Natural 1) Recycled 2) Natural 2)
Total recycled 3) aggregate, vol.%
M0/0 4) - 100 - 100 0
M30/ 0 30 70 - 100 9
M50/ 0 50 50 - 100 15
M70/ 0 70 30 - 100 21
M100/ 0 100 - - 100 30
M0/5 0 - 100 50 50 35
M30/5 0 30 70 50 50 44
M50/5 0 50 50 50 50 50
M70/50 70 30 50 50 56
M0/100 - 100 100 - 70
M30/100 30 70 100 - 79
M50/100 50 50 100 - 85
M70/100 70 30 100 - 91
1) vol.% of total sand 2) vol.% of coarse aggregate 3) vol.% of total aggregate 4) MS/C indicate the substitution level of natural sand and coarse aggregate by recycled aggregates
3-2-2 Aggregate mixtures for the bituminous mixtures Different aggregate sizes from 0 to 16 mm were combined to give gradations within the limits of 0/16 binder courses and 0/16 base courses according to the German standards for pavements ZTV Asphalt-StB 01 [60]. These gradations meet also the requirements of the gradation 4-C for base courses and binder courses according to the Egyptian standards for roads and bridges [61]. The coarse aggregate for hot asphalt mixes was basalt 2-16 mm or limestone 2-16 mm. The aggregate combinations for hot asphalt mixes with basalt and limestone coarse aggregates were presented in table (3-3). The resulted aggregate gradations are shown in Figures (3-2) and (3-3). As in Table (3-3), the sand portion 0-2 mm was natural

Chapter 3: Experimental Program
20
siliceous sand for mixes with limestone coarse aggregate to simulate the local materials in Egypt. For mixes with basalt coarse aggregate, the sand portion was consists of crushed basalt 0-2 mm and natural siliceous sand in ratio 1.5 : 1 to meet the requirement of 0/16 binder courses (crushed to natural sand > 1 : 1). The natural sand was replaced by the different recycled sands as in Table (3-4). While the recycled sands were used instead of the crushed basalt sand in mixes with basalt coarse aggregate to keep the ratio between crushed and natural sand constant. The recycled sand contents with respect to the total aggregate were kept constant for mixes with basalt and limestone coarse aggregates. Table (3-3): Aggregate combinations for hot asphalt mixes
Basalt asphalt mix Limestone asphalt mix
Nr Stone type Size, mm m.% Nr Stone type Size, mm m.%
1 Basalt 11-16 17 1 Limestone 8-16 30
2 Basalt 8-11 15 2 Limestone 2-8 32.5
3 Basalt 5-8 15 3 Natural sand 0-2 30
4 Basalt 2-5 11 4 Limestone dust <0.09 7.5
5 Basalt 0-2 21
6 Natural sand 0-2 14
7 Limestone dust < 0.09 7
0102030405060708090
100
0,01 0,1 1 10 100Sieve opening, mm
Sie
ve p
assi
ng, m
.%
.
Basalt mix Limestone mix
Figure (3-2): Mix gradations of basalt and limestone mixes and the limits of base courses according to Germany standard ZTV Asphalt-StB 01 [60]

Chapter 3: Experimental Program
21
0
20
40
60
80
100
0,01 0,1 1 10 100Sieve opening, mm
Siev
e pa
ssin
g, m
.%
.
Basalt mix limestone mix
Figure (3-3): Mix gradations of basalt and limestone mixes with the limits of 4-C binder and base courses according to the Egyptian standards [61] Table (3-4): Aggregate mixtures for hot asphalt mixes
Fine aggreagte Coarse aggregate Aggreagte mixture
Coarse aggregate type
Recycled 1) Natural 1) Recycled Natural Total recycled 2) aggregate, m.%
A.M0/0 3) - 100 - 100 0
A.M30/ 0 30 70 - 100 9
A.M50/ 0 50 50 - 100 15
A.M70/ 0
Limestone
70 30 - 100 21
A.M0/0 - 100 - 100 0
A.M43/ 0 43 74 - 100 9
A.M71/ 0 71 57 - 100 15
A.M100/ 0
Basalt
100 0 - 100 21 1) m.% of natural sand 2) m.% of total aggregate 3) MS/C indicate the substitution level of natural sand and natural coarse aggregate by recycled
aggregates respectively
3-3 Proportioning of concrete Ten mix designs were selected to cover 4 concrete exposition classes of the European standards for concrete EN 206 with different cement contents and aggregate gradations as shown in Table (3-5). The aggregates of all mixes consists of 30% sand 0-2 mm and 70% coarse aggregate 2-16 mm or 2-32 mm, which means that the percentages of sands and consequently the recycled sands were kept constant in all concrete mixes. This make the

Chapter 3: Experimental Program
22
comparison between the different mixes depends only on the change in mix design parameters such as cement content, w/c ratio and gradation of aggregates. Table (3-5): Mix designs of concrete mixes
3-4 Proportioning of the bituminous mixtures At the design of asphalt mixes, only the different aggregates were blended to give mix gradation within the specification limits of the required application such as wearing surface, binder and base courses. While the other mix conditions such as asphalt content and air voids content are determined practically in the laboratory for the available materials using one of the asphalt mix design methods. Marshall method of mix design according to ASTM D1559-82 [62 ] was used in this research to determine the optimum binder content and the properties of asphalt mix at this binder content for each mix. The aggregates were blended in this study to give mix gradation suitable for base course according to Germany specifications and base or wearing surface of some highway classes according to Egyptian specifications as shown in Figures (3-2) and (3-3). 3-5 Tests and measurements for The recycled sands 3-5-1 Measured properties for the recycled sands The following properties were measured for all recycled sands and in certain cases for natural sand:
Mix Class Cement, kg/m³
w/c ratio
Air pores, vol.%
Aggregate composition Gradation
Mix 1 XC1 300 0.66 2%
Mix 2 320 0.58 2%
Mix 3 340 0.58 2%
Mix 4
XC4
360 0.58 2%
Mix 5 XF3 350 0.53 2%
Mix 6 XF4 360 0.48 2%
30 % sand 0-2 35 % aggregate 2-8 35 % aggregate 8-16
AB16
Mix 7 XC1 280 0.66 2%
Mix 8 300 0.58 2%
Mix 9 320 0.58 2%
Mix 10
XC4
340 0.58 2%
30 % sand 0-2 20 % aggregate 2-8 15 % aggregate 8-16 35 % aggregate 16-32
AB32
Chapter 3: Experimental Program
23
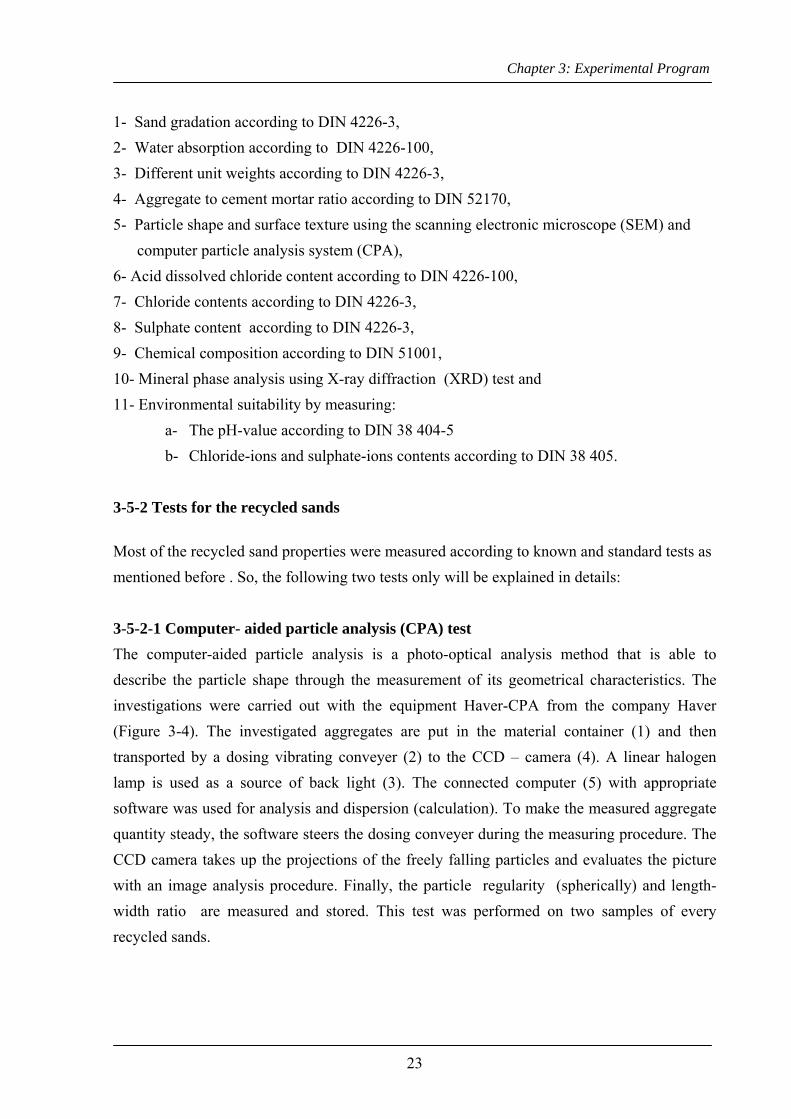
1- Sand gradation according to DIN 4226-3, 2- Water absorption according to DIN 4226-100, 3- Different unit weights according to DIN 4226-3, 4- Aggregate to cement mortar ratio according to DIN 52170, 5- Particle shape and surface texture using the scanning electronic microscope (SEM) and
computer particle analysis system (CPA), 6- Acid dissolved chloride content according to DIN 4226-100, 7- Chloride contents according to DIN 4226-3, 8- Sulphate content according to DIN 4226-3, 9- Chemical composition according to DIN 51001, 10- Mineral phase analysis using X-ray diffraction (XRD) test and 11- Environmental suitability by measuring:
a- The pH-value according to DIN 38 404-5 b- Chloride-ions and sulphate-ions contents according to DIN 38 405.
3-5-2 Tests for the recycled sands Most of the recycled sand properties were measured according to known and standard tests as mentioned before . So, the following two tests only will be explained in details: 3-5-2-1 Computer- aided particle analysis (CPA) test The computer-aided particle analysis is a photo-optical analysis method that is able to describe the particle shape through the measurement of its geometrical characteristics. The investigations were carried out with the equipment Haver-CPA from the company Haver (Figure 3-4). The investigated aggregates are put in the material container (1) and then transported by a dosing vibrating conveyer (2) to the CCD – camera (4). A linear halogen lamp is used as a source of back light (3). The connected computer (5) with appropriate software was used for analysis and dispersion (calculation). To make the measured aggregate quantity steady, the software steers the dosing conveyer during the measuring procedure. The CCD camera takes up the projections of the freely falling particles and evaluates the picture with an image analysis procedure. Finally, the particle regularity (spherically) and length-width ratio are measured and stored. This test was performed on two samples of every recycled sands.

Chapter 3: Experimental Program
24
Figure (3-4): Scheme and photo of the CPA apparatus- university of Weimar 3-5-2-2 X- rays (radiographic) phase analysis test The radiographic phase analysis can clearly identify the crystalline materials qualitatively. So, it was used in this study to investigate the different phases of which the recycled sands consisted such as Quartz, Lime and Gypsum. The theoretical basis of this method is the diffraction and / or reflection of X-rays on the crystal lattices. The diffractions depend on the space between the network levels of the phase, which are different for every phase. SO, the phase can be identified according to its X-ray diffractions. To perform this test, the sample is dried at 110°C and ground to about 40 µm particle size to become a powder. This powder is put in a one mm thick layer on a round sample container, which, is supported in the measurement circle of the diffractometer device and then the measurement starts. A diffractometer of type PW 1710 with computer control was used. The phase’s evaluation was accomplished with the aid of JCPDS-database from an appropriate software.
3-6 Tests and measurements for cement mortar Cement mortar was produced with the natural sand and the different recycled sands as a full replacement to the natural sand. Investigation of reuse of the recycled sands in cement mortar is not one of the objectives of this research but the measured properties of the cement mortar were used to characterize some properties of the recycled sands indirectly. These properties included the following:

Chapter 3: Experimental Program
25
1- Spread of cement mortar according to DIN 18555-2, 2- Water demand for cement mortar with recycled sands to achieve spread values equal
to that of natural sand, the spread values were measured according to DIN 18555-2, 3- Compressive strength of cement mortar to characterize the recycled sand strength
indirectly according to DIN 18555-3
3-7 Tests and Measurements for concrete mixes
3-7-1 Producing and treatment of concrete samples
The recycled sand was pre wetted by mixing it with an amount of water 0,4 % less than its water absorption and then covered with a plastic sheet for 10 minutes in the mixer. The added water represents the difference in water absorption of recycled and natural sand. The natural fine and coarse aggregates and the cement were dry premixed with the recycled sand for 2 minutes and then the mixing water was added and all components were further mixed for 4 minutes. For concrete mixes with recycled coarse aggregate, the total recycled aggregates (fine
and coarse) were pre wetted as in the mixes with only recycled sands. Cylinders of φ 150 mm
and height 300 mm were produced for shrinkage test and cubic specimens 20 × 20 × 20 cm were produced for carbonisation test while the other properties such as compressive strength
and splitting tensile strength were performed on cubic specimens 15 × 15 × 15 cm. After mixing, the moulds were filled with concrete and put onto the vibrating table for about 2 minutes to compact the concrete and then covered with plastic sheets to avoid water evaporation. Demoulding was realised after 24 hours and the specimens were cured under water at 20°C till 7 days age. Specimens for the shrinkage test were left in climatic chamber at a temperature of 20°C and a relative humidity 60%. From 7 days age, all specimens were kept in climatic chamber till the test started. 3-7-2 Measured properties for concrete The properties of fresh concrete and the mechanical properties of hardened concrete as well as the concrete durability were investigated for the different mixes produced with natural and recycled aggregates. The measurements included the following:
1- Workability of fresh concrete by measuring the spread after 10 minutes of mixing (a10),

Chapter 3: Experimental Program
26
2- Stiffening of fresh concrete by measuring the spread values at 10, 30 and 60 minutes after mixing with water,
3- Compressive strength, 4- Splitting tensile strength, 5- Concrete density, 6- Shrinkage, 7- Dynamical modulus of elasticity, 8- Carbonation, 9- Frost resistance (CF-Test) and 10- Frost de-icing salt resistance (CDF – Test).
3-7-3 Tests for concrete
3-7-3-1 Concrete consistency The concrete spread test according to DIN 1048 T1 was used to investigate the consistency and
the stiffening of the fresh concrete. A horizontal and inflexible table of 70 × 70 cm dimensions, conical mould and ruler were used to carry out this test. The concrete is mixed and covered with plastic sheet for 10 minutes from water addition. At the same time the upper surface of the table and the internal surface of the mould are wetted and the mould is hold at the centre of the table. After that, the mould is filled with concrete without compaction. Then, the cone is pulled vertically. The table with concrete is raised to a specific height and leaved to fall freely 15 times. The concrete spreads on the table in approximately round shape with a diameter depending on its consistency. The average of the spread concrete diameters is recorded as Spread value (a10). The spread values were measured again at 30 and 60 minutes to investigate the stiffening rate of the fresh concrete. 3-7-3-2 Dynamical modulus of elasticity (Edyn) An ultrasonic device of type BP-7 from Wekob Company measured the dynamical modulus of elasticity. The device measures the time (t) required for the wave to pass the concrete specimen from one side to the other. The wave speed (v) is calculated from this time and the specimen length. Then, the Ed value is derived from the following equation:
Edyn = k × v2 × ρ (3-1)
k = (1+ µ) × (1-2 µ) / (1- µ) where: k = constant factor v = wave speed ρ = concrete density µ = Poisson ratio

Chapter 3: Experimental Program
27
The value of µ was considered 0.2 for the investigated concrete and so the constant factor k
was 0.9. Two concrete cubes 15 cm × 15 cm × 15 cm at 28 day age were used for measuring the dynamical modulus of elasticity of every mix. and the measurements were repeated five times at the centres of the vertical sides in both length and width directions. The average value of the measured dynamical modulus of elasticity in both directions for the two cubes was calculated and registered for the investigated mix. 3-7-3-4 Concrete shrinkage The shrinkage is the volume decrease of concrete due to water evaporation and the water demand of the cement for hydration. Cylindrical specimens of 15 cm diameter and 30 cm height were used for shrinkage measurements. The specimens were removed from the mould after 24 hours from cast and coated with plastic sheets and then were stored in the climate chamber until 3 days age. After that, the upper and lower side surface were levelled and smoothed mechanically. Two steel rings with small bins were attached to the specimens at the centres of the upper and lower surface to be supports for the specimen. Then, the plastic sheets were removed, the original specimen length was measured and the first measurement for length change was recorded at 3 days age. The measurements were performed at different intervals which, increased as the age increased. 3-7-3-3 Frost and frost de-icing salt resistance (CDF and CF-test) The concrete frost resistance with and without de-icing salt were tested according to Setzer and Hartmann [63, 64]. This procedure leads to measure the amount of scaling per unit area
after 28 freezing and thawing cycles. Concrete prisms of 15 cm × 15 cm base and height ranges from 10 to 12 cm were produced, cured and stored in climate chamber until 28 days age as the other specimens but in the last 3 or 4 days of this period the specimens were cut to give a base
of 10 ×15 cm dimensions and the their lateral surfaces were sealed with aluminium foil. At 28 days age, the specimens were placed in the test container to saturate the test liquid by capillary suction for 7 days and were exposed to freezing and thawing cycles for 14 days. The absorbed water at the end of saturation stage was measured while the scaling was recorded after 6, 14 and 28 cycles for each specimen. The average value and the standard deviation were calculated for every mix. The test liquid was distilled water for CF test and sodium chloride solution (3% sodium chloride and 97 % water) for CDF test. The CDF test was performed on the XF4 concrete class while the CF test was used for XF3 concrete class.
3-8 Tests and measurements for the bituminous mixtures

Chapter 3: Experimental Program
28
3-8-1 Measured properties for the bituminous mixtures The asphalt specimens were prepared according to Marshall mix design procedure (ASTM D1559). The following measurements were conducted on these specimens: 1- Mix density, 2- Maximum (Theoretical) mix density, 3- Air voids content, 4- Voids in mineral aggregates, 5- Marshall stability, 6- Marshall flow, 7- Marshall Stiffness and 8- loss of stability after 1, 24 and 48 hours. 3-8-2 Tests for the bituminous mixtures The asphalt specimens were tested according to Marshall mix design procedure, ASTM D1559 except Loss of stability, which was investigated according to ASTM D1075-81 [62]. These tests are described in details in the referred standards and in the following the outline of each test is presented 3-8-2-1 Marshall test Marshall test is designed to investigate the suitability of asphalt concrete mix for a specific course or layer of asphalt pavement. It is used for hot asphalt concrete mixes with aggregate of maximum size not more than 25 mm. The outline of this method with the values of Mix1 (reference mix) in this research as an example are presented in the following:
1- The selected aggregates (coarse aggregates of different sizes, sand and mineral filler) are blended in a suitable proportion to achieve the required mix gradation, Table (3-6),
2- For each test specimen, a weight of 1300 g is collected from the different aggregate sizes according to the proportions in the first step,
3- About 6 sets of test specimens are prepared for each mix design with various binder contents with increment of 0.5 , it was from 4% to 6.5 % or from 4.5% to 7% in this research. Each set consists of 3 specimens where the average value of the different measured properties are calculated,
4- Density and voids analysis are performed for each specimen before placing it in Marshall machine and the average values at each binder content are recorded then the stability and flow (deformation) values are measured using Marshall machine, Table (3-7),
5- The maximum density is measured for each specimen using the Picnometer method. This density represent the density of the asphalt concrete mix without any air voids,

Chapter 3: Experimental Program
29
6- The relations between the binder content and the measured properties are plotted, these five properties of hot asphalt mixes are known as Marshall properties,
7- From the plotted curves, the binder contents at maximum density and maximum stability and median of air voids limits were determined as x1, x2 and x3. For base course the air voids limits are from 1% to 3% and the median value is 2% while for binder layer it is from 3% to 5% with median value equal to 4%,
8- The optimum value of binder content (OBC) is the mean of the previous three values and
9- The different properties are determined again from the curves at the optimum binder content and the values of air voids (AV), voids in mineral aggregates (VMA) and flow are compared to the limits in specifications to determine if this mix design is suitable or not.
Table (3-6): Aggregate proportions and densities of Mix1
Nr. Stone type and size % By mass of aggregates
Mass for 1300 g test specimen, g
Particle bulk density, g/cm³
1 Basalt 11 – 16 mm 17 221
2 Basalt 8 – 11 mm 15 195
3 Basalt 5 – 8 mm 15 195
4 Basalt 2 – 5 mm 11 143
5 Basalt sand 0 -2 mm 21 273
6 Natural sand 0 – 2 mm 14 182
2.985
7 Limestone filler < 0.09 mm 7 91 2.606
Total 100 1300 2.800
Gbam 1) 2.912
1) Mean density of aggregate mixture
Table (3-7): Density, voids analysis , Marshall stability and flow of Mix 1

Chapter 3: Experimental Program
30
Pbc 1) Mix density, g/cm³ AV, vol. % VMA, vol.% Stability, KN Flow, mm
4.0 2,542 6.63 16.20 9.399 2.48
4.5 2,583 4.30 15.29 10.668 2.88
5.0 2,597 2.95 15.28 8.902 3.73
5.5 2,590 2.39 15.95 7.641 5.90
6.0 2,580 1.94 16.72 6.889 7.94
6.5 2,564 1.73 17.67 6.105 10.56 1) Pbc : Bitumen content, mass percentage of total mix
3-8-2-2 Loss of stability test This test is used to investigate the effect of water action on stability of asphalt mixes. The test was conducted according to ASTM D1075-81 [62] and in the follwing an outline of the procdure: 1- The different aggregate sizes are mixed according to the aggregate proportions, Table (3-6), 2- The bitumen is added to the aggregate with value equal to the optimum binder content
derived from Marshall design method, 3- The bitumen and aggregates are mixed and compacted in a mould according to Marshall
method, 4- Six test specimens are prepared for each mix and is submerged simultaneously in a water
bath at constant temperature 60 ± 1 ° C, 5- Two of the specimens are taken out the water bath after 0.5 , 24 and 48 hours and
transferred to other water bath mentioned at at 25 ± 1 and then the stability and flow are measured for them using Marshall machine,
6- The average values of stability and flow at the different immersion times are calculated, 7- The loss of stability at immersion time t is calculated using this form,
MS (t) Loss of stability = 100 - × 100 MS (o)
where MS (t) = Marshall stability at immersion time t, MS (o) = Original Marshall stability.

Chapter 4: Materials Properties
31
4 – MATERIALS PROPERTIES The investigated concrete mixes in this study consist of natural fine and coarse aggregates, recycled fine and coarse aggregates, Portland cement, water and superplastisizer as an admixture. The bituminous mixtures were composed of crushed basalt or limestone as a coarse portion, basalt sand, siliceous sand and recycled sands as a fine portion, limestone dust as a mineral filler and asphalt cement of 50-70 and 70-100 penetration grade as a binder material. The used materials, without the recycled sands, and their properties are described in the following:
4-1 Concrete materials 4-1-1 Coarse aggregate Siliceous natural aggregates with sizes 2-8, 8-16 and 16-32 mm from Kassel region were used in concrete production.. The recycled coarse aggregates were obtained from concrete cubes that were produced and crushed in the laboratory. The gradations of these materials according to the standard DIN 4226.3 (Table 4-1), water absorption after 10 minutes and bulk density (Table 4-2) and harmful contents of recycled aggregate (Table 4-3) were measured. Table (4-1): Gradations of natural and recycled coarse aggregates
Percentage passing Stone type
Size, mm 0.063 0.125 0.25 0.5 1 2 4 8 16 32 2 - 8 0.2 0.2 0.3 0.3 0.4 1.4 34 97.6 100 100 8 - 16 0.1 0.1 0.1 0.1 0.1 0.2 1 12 97.2 100 Natural
aggregate 16- 32 0.1 0.3 0.5 0.6 0.6 0.7 0.8 2.5 19.8 98 Recycled concrete 4 - 16 0.1 0.1 0.1 0.1 0.2 0.2 1.7 50.1 99.2 100
4-1-2 Fine aggregate Siliceous sand 0-2 mm from Kassel region was used for both concrete and bituminous mixturesmixes. The measured bulk density and water absorption of this sand according to DIN 4226-3 are 2.62 g/cm³ and 0.4 % respectively

Chapter 4: Materials Properties
32
Table (4-2): Water absorption and density Table (4-3): Harmful materials in the of coarse aggregates recycled coarse aggregate
1) According to DIN 38 404-5 2) According to DIN 4226-3
.4-1-3 Cement Portland cement CEM Ι 32.5 R was used as a binder material for all concrete mixes. Table (4-4) presents the cement properties while its chemical composition is shown in table (4-5). Table (4-4): Cement properties Table (4-5): Chemical analysis of cement
4-1-4 Water and superplasticizer Drinking water was used in all mixes. Polycarboxylatether superplasticizer FM 794 was used as admixture in some mixes to achieve adequate consistency.
Stone type
Size, mm
Water absorption, m.%
Density,g/cm³
2 - 8 0.3 2.62 8 - 16 0.3 2.62 Siliceous
aggregate 16- 32 0.3 2.62 4 - 8 4.07 2.38 Recycled
concrete 8 - 16 3.98 2.38
Harmful materials 4 - 8 8 – 16
pH – ratio 1) 12.55 12.5
Chloride, m.% 2) 0.002 0.001
Sulphate, SO3, m.% 2) 0.36 0.36
Property Data
Water demand, m. % 25.5
Stiffening start, min 170
Stiffening end, min 230
Na2O – equivalent 0.67
Fineness according to Baliane, cm²/g
2890
1 day compr. strength, N/mm² 13.6
2 day compr. strength, N/mm² 23.8
7 day compr. strength, N/mm² 40.3
28 day compr. strength, N/mm² 49.8
Component Amount, m.%
Insoluble mat. 0.24
SiO2 18.02
Al2O3 5.85
Fe2O3 4.47
Mn2O3 0.68
CaO 63.18
MgO 1.05
SO3 2.85
K2O 0.82
Na2O 0.07
Glv. 2.7
CO2 1.85
Cl 0.01
Na2O equiv. 0.61
Total 99.7
Chapter 4: Materials Properties
33
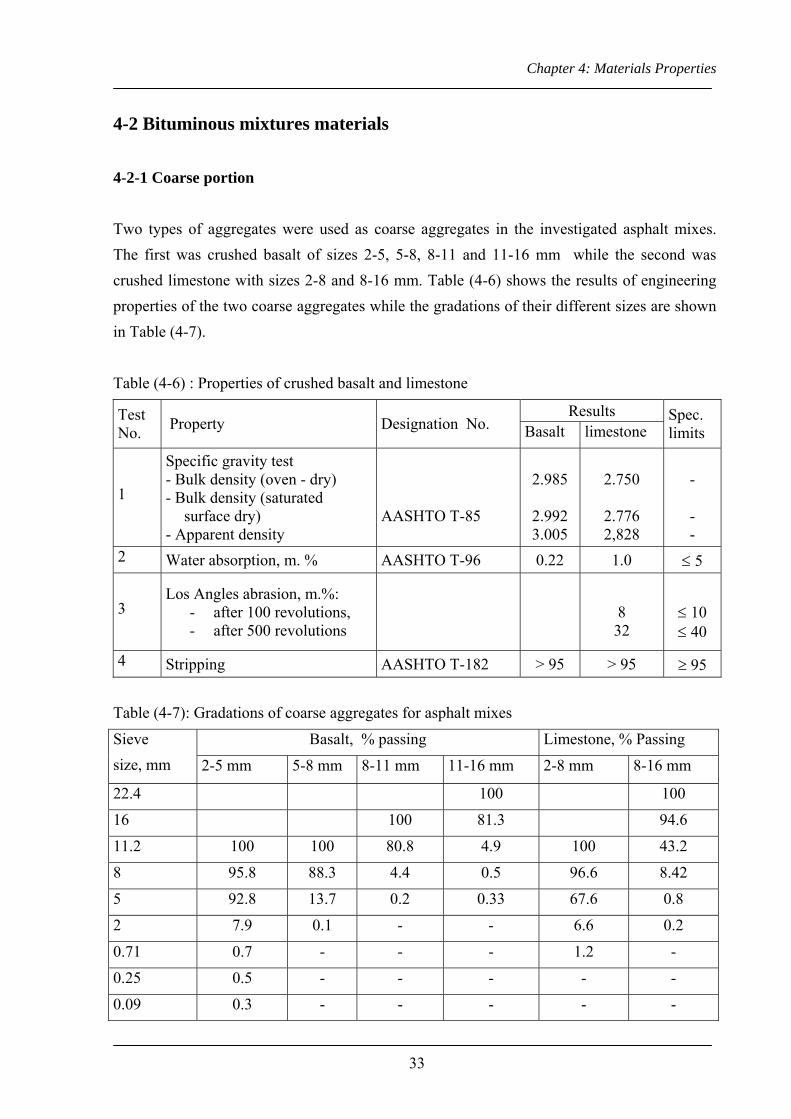
4-2 Bituminous mixtures materials 4-2-1 Coarse portion Two types of aggregates were used as coarse aggregates in the investigated asphalt mixes. The first was crushed basalt of sizes 2-5, 5-8, 8-11 and 11-16 mm while the second was crushed limestone with sizes 2-8 and 8-16 mm. Table (4-6) shows the results of engineering properties of the two coarse aggregates while the gradations of their different sizes are shown in Table (4-7). Table (4-6) : Properties of crushed basalt and limestone
Results Test No. Property Designation No. Basalt limestone
Spec. limits
1
Specific gravity test - Bulk density (oven - dry) - Bulk density (saturated
surface dry) - Apparent density
AASHTO T-85
2.985
2.992 3.005
2.750
2.776 2,828
- - -
2 Water absorption, m. % AASHTO T-96 0.22 1.0 ≤ 5
3 Los Angles abrasion, m.%:
- after 100 revolutions, - after 500 revolutions
8 32
≤ 10 ≤ 40
4 Stripping AASHTO T-182 > 95 > 95 ≥ 95 Table (4-7): Gradations of coarse aggregates for asphalt mixes
Basalt, % passing Limestone, % Passing Sieve size, mm 2-5 mm 5-8 mm 8-11 mm 11-16 mm 2-8 mm 8-16 mm
22.4 100 100
16 100 81.3 94.6
11.2 100 100 80.8 4.9 100 43.2
8 95.8 88.3 4.4 0.5 96.6 8.42
5 92.8 13.7 0.2 0.33 67.6 0.8
2 7.9 0.1 - - 6.6 0.2
0.71 0.7 - - - 1.2 -
0.25 0.5 - - - - -
0.09 0.3 - - - - -
Chapter 4: Materials Properties
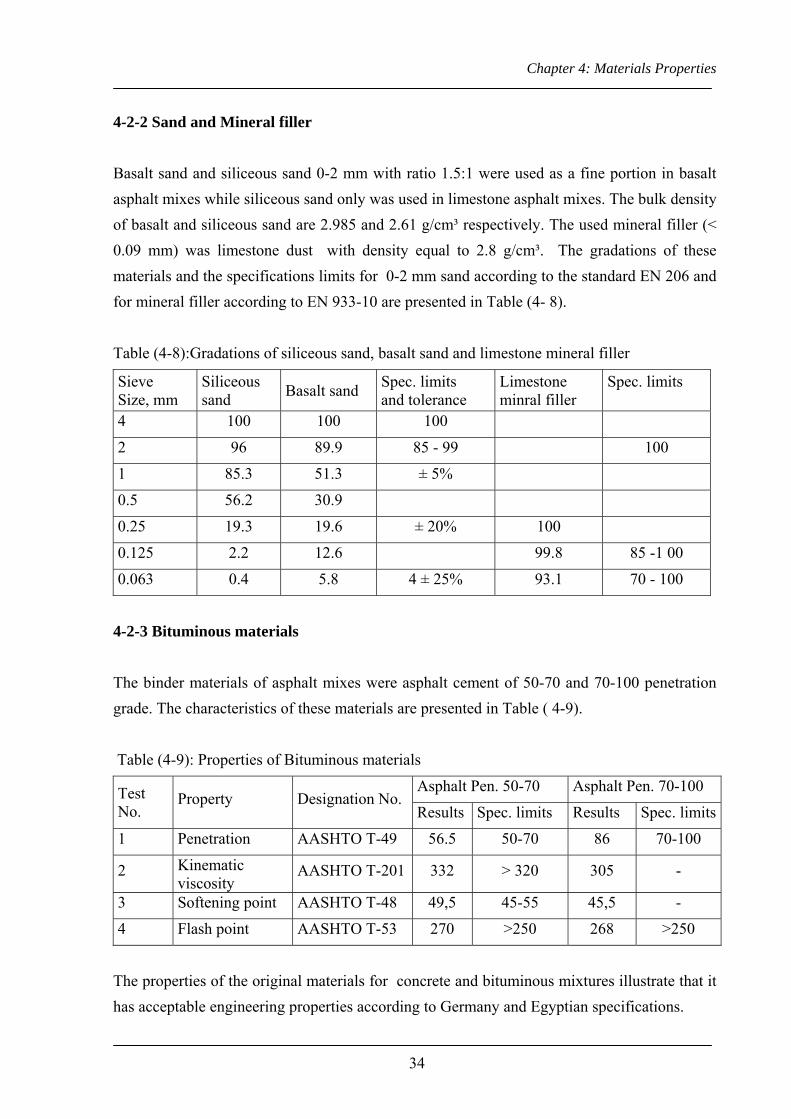
34
4-2-2 Sand and Mineral filler Basalt sand and siliceous sand 0-2 mm with ratio 1.5:1 were used as a fine portion in basalt asphalt mixes while siliceous sand only was used in limestone asphalt mixes. The bulk density of basalt and siliceous sand are 2.985 and 2.61 g/cm³ respectively. The used mineral filler (< 0.09 mm) was limestone dust with density equal to 2.8 g/cm³. The gradations of these materials and the specifications limits for 0-2 mm sand according to the standard EN 206 and for mineral filler according to EN 933-10 are presented in Table (4- 8). Table (4-8):Gradations of siliceous sand, basalt sand and limestone mineral filler
Sieve Size, mm
Siliceous sand Basalt sand Spec. limits
and tolerance Limestone minral filler
Spec. limits
4 100 100 100
2 96 89.9 85 - 99 100
1 85.3 51.3 ± 5%
0.5 56.2 30.9
0.25 19.3 19.6 ± 20% 100
0.125 2.2 12.6 99.8 85 -1 00
0.063 0.4 5.8 4 ± 25% 93.1 70 - 100
4-2-3 Bituminous materials The binder materials of asphalt mixes were asphalt cement of 50-70 and 70-100 penetration grade. The characteristics of these materials are presented in Table ( 4-9). Table (4-9): Properties of Bituminous materials
Asphalt Pen. 50-70 Asphalt Pen. 70-100 Test No.
Property Designation No. Results Spec. limits Results Spec. limits
1 Penetration AASHTO T-49 56.5 50-70 86 70-100
2 Kinematic viscosity
AASHTO T-201 332 > 320 305 -
3 Softening point AASHTO T-48 49,5 45-55 45,5 -
4 Flash point AASHTO T-53 270 >250 268 >250
The properties of the original materials for concrete and bituminous mixtures illustrate that it has acceptable engineering properties according to Germany and Egyptian specifications.

Chapter 5: Characterisation Of The Recycled Sands
35
5- CHARACTERISATION OF THE RECYCLED SANDS The used recycled sands in this research were produced from various materials and collected from different sources, see Table (3-1). To characterise these materials the technical properties of recycled sands (RC 1 to RC 10) and crushed natural limestone sands (LQ 1 and LQ 2) as well as natural siliceous sand (NS) were investigated. These properties included the physical and chemical properties as well as the phases composition and the environmental aspects. The investigated properties were used to:
1- Compare these properties to the standard specification, 2- Determine the variation of each property, 3- Explain the changes in concrete and asphalt concrete characteristics that produced
with these recycled sands and 4- correlate the concrete and asphalt concrete properties to the recycled sand
characteristics.
5-1 Physical properties 5-1-1 Composition of the original materials The recycled material can be effectively classified by determination of its constituents from the original materials such as concrete, brick, asphalt etc. The constituents and its amount shares control to a wide extent the characteristics of coarse aggregates, that may also be appropriately for the recycled fine aggregate. But the recycled sand composition can not be determined manually as in case of the coarse aggregate and there is no method to cover this point. So, the main original materials of the recycled sands in this study were determined by the sources of these material and/or by investigating the composition of the coarse aggregate 5-8 mm manually and use the results as an indication for the sand fraction. The only exception is RC 1, which was produced from 100 % crushed well defined concrete. The original materials of the investigated recycled sands demonstrate that most of the building materials usually used in constructions were represented, see Table (3-1).

Chapter 5: Characterisation Of The Recycled Sands
36
The aggregate to binder materials ratio or the composition of the different recycled sands in forms of burning loss weight, aggregate and binder materials were measured according to the standard DIN 52170, Table (5-1). The binder materials represent the amount of cement and lime in the recycled sand. It was found that the natural aggregates represented from 72.2 to 88.86 m. % of the different recycled sands. Table (5-1): Mix proportions of the recycled sands
RC1 RC2 RC3 RC4 RC5 RC7 RC8 RC9 RC10
Burning mass, % 7.86 9.78 6.67 8.96 7.43 4.13 5.12 4.60 5.10
Aggregate, m.% 76.86 75.31 86.25 79.79 72.25 88.06 79.52 81.18 77.18
Binder materials, % 15.28 14.91 7.08 11.25 20.32 7.81 15.38 14.22 17.72
5-1-2 Sand gradations Gradations of the recycled sands in comparison to the natural sand gradation are shown in Figures (5-1) and (5-2). The gradation results indicate that only the two recycled sand produced from lime-sand bricks (RC 9 and RC 10) are compatible with 0-2 mm sand according to the standard EN 206 while the other sands are considered 0-4 mm sand. The gradation curves indicate that all recycled sands are coarser than the natural sand in general but finer than it at particle sizes < 0.063 mm and 0.125 mm. The gradations of the recycled sands are well graded and better than that of the natural sand, which may decrease the voids content in its matrix especially that the recycled sands contain higher amounts of the fine particles 0.063 mm and 0.125 mm. It must be noticed that in addition to the gradation, the voids content in the aggregate matrix is affected also by the particle shape and surface texture. Three values were suggested to quantitatively characterize the recycled sand gradation. These values are the percentages passing from the sieves 0.063 mm and 0.125 mm and the summation of percentages passing the sieves 0.25, 0.5, 1.0, 2.0 and 4.0 mm (P-Sum) as presented in Table (5-2).

Chapter 5: Characterisation Of The Recycled Sands
37
0102030405060708090
100Si
eve
pass
ing,
vol
.% .
N.S
RC 1
RC 2
RC 3
RC 4
LQ 1
LQ 2
0.063 0.125 0.25 0.5 1.0 2.0 4.0 8.0 Sieve opening, mm
Figure (5-1): Gradations of natural sand and recycled sands from Plants A and C
0102030405060708090
100
Siev
e pa
ssin
g, v
ol.%
.
N.S
RC 5
RC 6
RC 7
RC 8
RC 9
RC 10
0.063 0.125 0.25 0.5 1.0 2.0 4.0 8.0Sieve opening, mm
Figure (5-2): Gradations of natural sand and recycled sands from Plant B

Chapter 5: Characterisation Of The Recycled Sands
38
Table (5-2): Characterization values of sand gradation
Sand type Passing sieve 0.063 mm, vol.%
Passing sieve 0.125 mm, vol.% P-Sum
N.S 0.4 2.2 354.2
RC 1 2.2 7.0 233.3
RC 2 1.8 4.1 228.9
RC 3 1.2 3.6 224.5
RC 4 4.0 8.9 273.3
RC 5 2.6 7.0 269.4
RC 6 1.5 5.0 257.5
RC 7 8.0 17.0 271.0
RC 8 2.0 9.0 277.0
RC 9 1.0 4.5 297.0
RC 10 1.0 4.0 302.5
LQ 1 1.0 3.0 285.4
LQ 2 1.5 6.3 256.0
5-1-3 Water absorption 5-1-3-1 Direct characterization The water absorption is an important property for recycled sand characterization because of the large difference between the natural aggregates and recycled aggregates in general and recycled sand especially because it has a higher amounts of particles being suspicious of water. On the other hand, it has a considerable effect on the characteristics of concrete and asphalt concrete produced with recycled aggregates. Figure (5-3) shows the water absorption values of recycled sands according to the standard ASTM C-28 after 24 hours and according to DIN 4226-100 after 10 minutes as a direct tests. The values after 10 minutes varied from 3.8 % to 11.5 m.% for the recycled sands compared to 0.4 m.% for natural sand and 2.1 to 3.3 for the crushed limestone sands. This illustrate the enormous difference of water absorption of recycled sands compared to natural sand although the two tests are performed after removing the fine portion less than 0.125 mm from the sand samples. The relatively low water absorption of the pre-sieved sands (RC 3 and RC 6) may be because it has negligible amounts of cement paste and gypsum or due to unrealistic tests result as will be discussed in the next section 5-1-1-2.

Chapter 5: Characterisation Of The Recycled Sands
39
02468
10121416
N.SRC 1RC 2RC 3RC 4RC 5RC 6RC 7RC 8RC 9
RC 10 LQ 1LQ 2
Sand type
Wat
er a
bsor
ptio
n, m
.% .
10 minutes water absorption 24 hours water absorption
Figure (5-3): Water absorption of sands after 10 minutes and 24 hours 5-1-3-2 Indirect characterization In most of the previous studies and also in this study, the water absorption value was used to determine the required additional water for pre-wetting of the recycled aggregates to avoid the change of the w/c ratio of the concrete mix as far as possible. For this reason, the water absorption must be accurate as possible but the results of the two direct tests may be unreal in case of recycled sand. This inaccuracy can be related to the following:
1- The test is performed on the sample without the particles size less than 0.125 mm, which are high absorptive particles,
2- The difficulty to achieve exactly the condition “saturated particle with dry surface” in the German procedure DIN 4226-100) because there is no measurable value to determine it for the sand and
3- Missing some of light weight and fine materials from the sample when it is taken out of the Pycnometer in ASTM procedure that gives unreal sample dry weight.
Otherwise, the results of concrete workability as in chapter 6 indicate that the pre-wetting water was not sufficient for some recycled sands such as RC 3 and RC 6 that may be related to the unreal water absorption values. The above mentioned reasons voice the need for other procedures to characterize the water absorption of recycled sand or the required additional water for pre-wetting.

Chapter 5: Characterisation Of The Recycled Sands
40
The following steps were performed to design a new procedure for water absorption characterization of recycled sand:
1- Cement mortar with standard sand was produced according to specification EN 196-3 with the following proportions
1350 g standard sand 450 g cement (CEM I 32.5 R) 225 ml water (w/c = 0.5) 2- The spread of this standard mortar was measured (it was 14.2 cm) according to the
standard DIN 18555-2 3- Approximately 2 kg of the different recycled sands were obtained from the samples
using the standard procedure of DIN 4226-3 4- It was dried in a suiTable pan at a temperature of 110 ± 5°C to constant weight 5- Cement mortars with the same mix proportion were produced with the recycle sand.
The spread was measured; 6- The water content of mortar was changed till achieving the standard mortar spread 7- When attaining the standard mortar spread needs many trails, the test can be stopped
after recording at least two values before and after the required spread. The relations between the water content and the spread were plotted and then, the water content at 14.2 cm is interpolated.
The results of this stage, as in Figure (5-4), illustrate the considerable difference among the standard sand, natural sand and the recycled sands and also between the different types of recycled sands. This initially means that the mortar water content can be used to characterize the water absorption of recycled sands. But before verification these results the effect of recycled sand amount and the cement source was investigated as the following

Chapter 5: Characterisation Of The Recycled Sands
41
0
100
200
300
400
500
N.SRC 1
RC 2RC 3
RC 4RC 5
RC 6RC 7
RC 8RC 9
RC 10 LQ 1LQ 2
Sand type
Mor
tar w
ater
dem
and,
ml
.
Figure (5-4): Water demand of cement mortar with recycled sands a- Effect of cement source The steps from 5 to 7 in the previous stage were repeated for mortar with three recycled sands and Portland cement CEM Ι 32.5 R from four different plants. It is noticed that the cement source has approximately no effect on the mortar water demand as in Table (5-3). Table (5-3): Effect of cement source on consistency of mortar with recycled sand
Mortar water content at 14.2 cm spread, ml
RC 1 RC 7 RC 9
Cement from plant A, chapter 4-1 305.0 399.0 391.8
Cement from plant B 302.0 396.0 390.0
Cement from plant C 301.5 396.0 389.0
Cement from plant D 305.3 399.5 392.5
b- Effect of recycled sand content The mortar water content was calculated for the three recycled sands RC1, RC7 and RC9 with 0.0 %, 30%, 50%, 70% and 100% natural sand replacement. The relations in Figure (5-5) indicate that the mortar water demand is directly proportioned to the recycled sand content. This means that there is no need to carry out the test if the recycled sand content is changed but in this case the mortar water content can be calculated depending on the percentages of recycled and natural sand. It is an indirect property of the recycled sand which changes only if the sand characteristics itself are varied.

Chapter 5: Characterisation Of The Recycled Sands
42
150
200
250
300
350
400
450
500
0 20 40 60 80 100 120
Recycled sand content, vol.% of total sand
Mor
tar w
ater
dem
and,
ml
.RC 1
RC 7
RC 9
Figure (5-5): Effect of recycled sand content on the mortar water demand at 14.2 cm spread Figure (5-6) shows the values of 10 minutes water absorption versus the mortar water demand for the investigated recycled sands and mixtures from recycled and natural sands with cement from different sources. The following equation was derived from these values: WA =0,063 MWD –14 with regression value R² = 0.83 (5-1) where WA =water absorption of recycled sand, m.% MWD= mortar water demand, ml The relation was determined again but without the results of pre-sieved sands RC 3 and RC 6, which may have unreal water absorption .The regression value of the new equation (5-2) was improved WA = 0.059 MWD – 12.4 with regression value R² = 0.90 (5-2) To verify using the mortar water content as characterization parameter of recycled sand, the water absorption was calculated from equation (5-2) and then the different recycled sands were pre-wetted with additional water determined on both the calculated and direct measured water absorption basis. The spread and hardening of concrete mixes produced with these sands were investigated. A low variation in consistency of concrete was observed when the calculated water absorption values using equation 5-2 were used as will be presented in

Chapter 5: Characterisation Of The Recycled Sands
43
section 6-1-2. This means that the calculated water absorption overcome most of the water demand of the recycled sand.
R2 = 0.90
150
200
250
300
350
400
450
500
0 2 4 6 8 10 12 14Water absorption, m. %
Mor
tar w
ater
dem
and,
ml
.
Figure (5-6): Relation between water absorption of recycled sands and and the mortar water demand for 14.2 cm spread It can be concluded that the mortar water demand not only describes the water absorption of the recycled sand but also reflects the effect of its gradation, particle shape and surface texture on the concrete or mortar consistency. So, it can be used to obtain more accurate water absorption of the recycled sand in a more definitive procedure. It can also be considered as one of the recycled sand properties that can be used to characterize and classify the recycled sands. 5-1-4 Particle density The particle density is another characteristic for characterization and classification of the recycled sands. Three values of the particle density were determined for the recycled sand particles. It included the particle bulk density on a saturated-surface dry and oven dry basis and the apparent particle density. The bulk density is the characteristic value that generally used for calculation of the volume occupied by the aggregate in various mixtures containing it including cement concrete and asphalt concrete that are proportioned and analyzed on an absolute volume basis. Bulk density is also used in the computation of voids in aggregate that is one of design criteria of asphalt mix. While the apparent density pertains to the relative density of the solid material making up the constituent particles not including the pore space within the particles that is accessible to water. This value is not widely used in construction

Chapter 5: Characterisation Of The Recycled Sands
44
aggregate technology but it can be used here as an indicator for the composition of the recycled sands. The difference between the Bulk and the apparent density may characterize the porosity of recycled sands. Table (5-4) illustrates the considerable difference in bulk density of the natural and the recycled sands as well as in between the different recycled sands that is related to the variation of external pores due to the amount of adherent cement paste. Conversely, the variation in values of apparent density is relatively low for all recycled sands other than brick sand RC 7 that refers to a low difference in the internal structural pores of the particles. This may explain the relatively low effect of using recycled sands from building materials on concrete compressive strength or asphalt concrete stability where filling the external pores with cement paste or bitumen eliminate their effect on the strength. Table (5- 4): The bulk and apparent particle density of sands
Particle bulk density g/cm³ Sand oven-dry Sat.-surface dry
Particle apparent density, g/cm³
N.S 2,62 2,635 2,640
RC 1 2,355 2,483 2,559
RC 2 2,320 2,356 2,339
RC 3 2,461 2,476 2,515
RC 4 2,002 2,162 2,222
RC 5 2,282 2,343 2,392
RC 6 2,410 2,467 2,513
RC 7 1,992 2,116 2,179
RC 8 1,996 2,107 2,164
RC 9 2,109 2,229 2,293
RC 10 2,101 2,222 2,286
LQ 1 2,585 2,550 2,569
LQ 2 2,520 2,502 2,529
5-1-5 Particle shape and surface texture It is not known in what extent the particle shape and surface texture of sand affect the behavior of concrete produced with it but these two properties has a visible effect on the asphalt mix characteristics. So, the specifications of concrete include no standard test or limits for sand particle shape and surface texture as in case of coarse aggregate. The particle shape of the recycled sand were determined using a computer-aided particle analysis system (CPA)

Chapter 5: Characterisation Of The Recycled Sands
45
while the surface texture and the particle shape were investigated by an scanning electron microscope (SEM). 5-1-5-1 Particle shape using computer-aided particle analysis system (CPA) The length-width ratio (L/W) and the spherically (S) values were selected from the outputs of CPA to characterize the particle shape. The L/W value represents the ratio between the maximum length of the particle and its width that is defined as the maximum distance perpendicular to the length. The spherically is the ratio between the actual perimeter of the particle cross section and the perimeter of a circle having the same area of the particle cross section. The L/W may affect the degradation resistance strength of sand and consequently the concrete strength. However, the spherical value that shed light upon the number of angles along the particle perimeter has extreme effect on the particle surface area , water absorption and concrete workability. The average L/W and S values were calculated as follows : (5-3) (5-4) where (L/W) av. = average L/W value of the recycled sand L/W = length-width ratio of the class V = class volume as percentage from the total volume S av. = average spherically value of the recycled sand S = spherically of the class The results of equations (5-3) and (5-4) are shown in Figure (5-7). It is noticed that the difference in L/W value between recycled and natural sand is relatively low . Otherwise, the variation in S values of recycled sands as well as between recycled and natural sand is relatively high. The brick sand RC 8 and building debris sand RC 4 has the higher S value while the lower values was achieved by pre-sieved recycled sand RC 6. Figure (5- 8) shows that increasing S value of recycled sand in general increases the water absorption. This means that some of the recycled aggregate properties can be improved by improving the production technology. The water absorption is good correlated to S value up to 1.27 S value or 8%
Σ L/W X V (L/W)av.= 100
Σ S X V S av. = 100

Chapter 5: Characterisation Of The Recycled Sands
46
water absorption but after this point the rate of change of each factor may be affected by other properties. Limits for the S value can be determined if more correlations with concrete properties but at least it can be considered one of the characterization parameters of the recycled sand.
0,8
1,0
1,2
1,4
1,6
1,8
N.SRC 1
RC 2RC 3
RC 4RC 5
RC 6RC 7
RC 8RC 9
RC 10 LQ 1LQ 2
Sand type
L/W
ratio
and
S v
alue
, -
.
L/W raio S-value
Figure (5-7): Length-width ratio and spherical value of natural and recycled sand
0,8
1,0
1,2
1,4
1,6
1,8
0 2 4 6 8 10 12 14
Water absorption, m.%
S va
lue,
-
Figure (5-8): Effect of particle spherically value on the water absorption of sand 5-1-5-2 Surface texture of sand using the scanning electron microscope (SEM) The Scanning Electron Microscope photos were used to compare the surface texture of recycled sand to each other and to the natural sand as shown in Figure (5-9). These photos

Chapter 5: Characterisation Of The Recycled Sands
47
b- RC 1 (photo width = 0.145 mm)
c- RC 2 (photo width = 0.145 mm) d- RC 3 (photo width = 0.145 mm)
e- RC 4 ((photo width = 0.145 mm)
f- RC 6 ((photo width = 0.145 mm)
g- RC 7 (photo width =0.145 mm) h- RC 9 (photo width =0.145 mm)
Figure (5-9): Surface texture and particle shape of natural and recycled sands
a- NS (photo width = 0.145 mm)

Chapter 5: Characterisation Of The Recycled Sands
48
illustrate the difference in surface texture of the recycled and natural sands. This may be the cause of the decrease in concrete workability in spite of addition of water in an amount equal to the water absorption of recycled material. The sands from the pre-sieved building debris RC 3 and RC 6 has a relatively smooth surface and small amount of cement paste which participates in decreasing their water absorption. In fact, it is not practically to use the SEM or CPA system to characterize the particle shape and surface texture of recycled sand specially in construction purposes because these tests need more time and technology. So, there is a need to develop other practically test to quantify the particle shape and surface texture of the recycled sand.
5-2 Chemical properties 5-2-1 Water dissolved chloride Because of its harmful effect on the reinforcement of concrete structures, the water dissolved chloride content of the recycled sands was measured according to the standard DIN 4226-3. Each material is divided into three sizes 0/0.125, 0.125/2 and 2/4 mm and the test was performed on each size while the chloride content of 0/4 mm sand was calculated from the chloride content and the relative weight of each size. As shown in Figure (5-10 ), the chloride content of all recycled sands was low and within the specification limits for reinforced concrete (< 0.04 m. %). The results indicate also that the maximum chloride content was found in the building debris sand RC 4. The low chloride content is related to the fact that mineral building materials represent the main share of the investigated recycled sands while the recycled aggregate from old pavement structures can be richer in chlorides. 5-2-2 Acid dissolved chloride In recycled aggregate, especially containing cement paste, the chloride can be hold in the matrix so that it is not completely dissolved by water. For this reason the acid dissolved chloride of the recycled sands were investigated according to the standard DIN 4226-100. The acid dissolved chloride content does not exceed the specification limits for any of the investigated sands as shown in Figure (5-10). The brick recycled sand RC 9 showed the maximum chloride content while the sands from sand-lime bricks and the pre-sieved materials has very low values. It is noticed also that the difference between acid and water dissolved

Chapter 5: Characterisation Of The Recycled Sands
49
chloride is relatively high for brick sand also. This mean that the water dissolved chloride can used to control and characterize the recycled sand if the amount of brick and pavement demolition material are limited.
0,00
0,01
0,02
0,03
0,04
0,05
RC 1RC 2
RC 3RC 4
RC 5RC 6
RC 7RC 8
RC 9RC 10 LQ 1
Sand type
Chl
orid
e co
nten
t, m
.%
.
Acid dissolved cholride Water dissolved chloride
Maximum Chloride content
Figure (5-10): Acid and water dissolved chloride of the recycled sands 5-2-2 Sulphate content Gypsum materials and the cement are the main sources of sulphate in recycled building materials. The ettringite phase that may be found in old concrete can also increase the sulphate content of the recycled aggregate. In addition to the normal use of gypsum as a plaster or for decoration, recently, gypsum bound plates and screeds are widely used in construction. Due to the high water absorption and volume changes of gypsum, it may have a large effect on the properties of fresh and hardened concrete and may be on the asphalt concrete also. The specification limits restrict the maximum sulphate in form of SO3 in aggregate to 1% of the total mass. The sulphate content test according to the standard DIN 4226-3 was carried on the same three sizes of recycled sand mentioned above. Figure (5-11) illustrates that the allowable limit of sulphate was not exceeded by any of the recycled sands as total. In most of the investigated sands the sulphate content of the fine portion 0/0.125 mm was higher than that of the coarser sized particles so this can be removed or eliminated in some cases to adjust this property.

Chapter 5: Characterisation Of The Recycled Sands
50
0
0,1
0,2
0,3
0,4
0,5
RC 1RC 2
RC 3RC 4
RC 5RC 6
RC 7RC 8
RC 9RC 10 LQ 1
LQ 2
Sand type
SO3
cont
ent,
m %
.
Figure (5-11): The sulphate content (SO3) in the recycled sands 5-2-3 Chemical composition of the recycled sand as mentioned before the amounts of the original materials that constitute the used recycled sands are not accurate so, their chemical composition were investigated for a more quantitative description. The dissolved alkali and the burning loss were measured according to the standard DIN 51001 and the results are shown in Table (5-5). From these results, it can be concluded that:
1- In most chemical components of the investigated sands, considerable differences in burning loss were found between the recycled sands (RC1 to RC10) and the crushed limestone sands LQ 1 and LQ 2,
2- The quartz SiO2 is considered the main constituent of the recycled sands where it ranged from 60.1 to 81.1 m.% of sand while it represents only 23.7% and 28.3 m.% for the crushed limestone sands LQ 1 and LQ 2,
3- The sulphate, in form of SO3 , is relatively low for sands contains old concrete while the other material are approximately free from it and
4- LQ 1 and LQ 1 has a higher amounts of CaO which refer to considerable quantity of limestone . Also, it has a higher MgO content and burning loss than the other recycled sands
5- The values of dissolved alkali materials (Na2O and K2O) are very low for all investigated sands.
Table (5-5): Chemical analysis of the recycled sands 1) Water dissolved Na2O and K2O
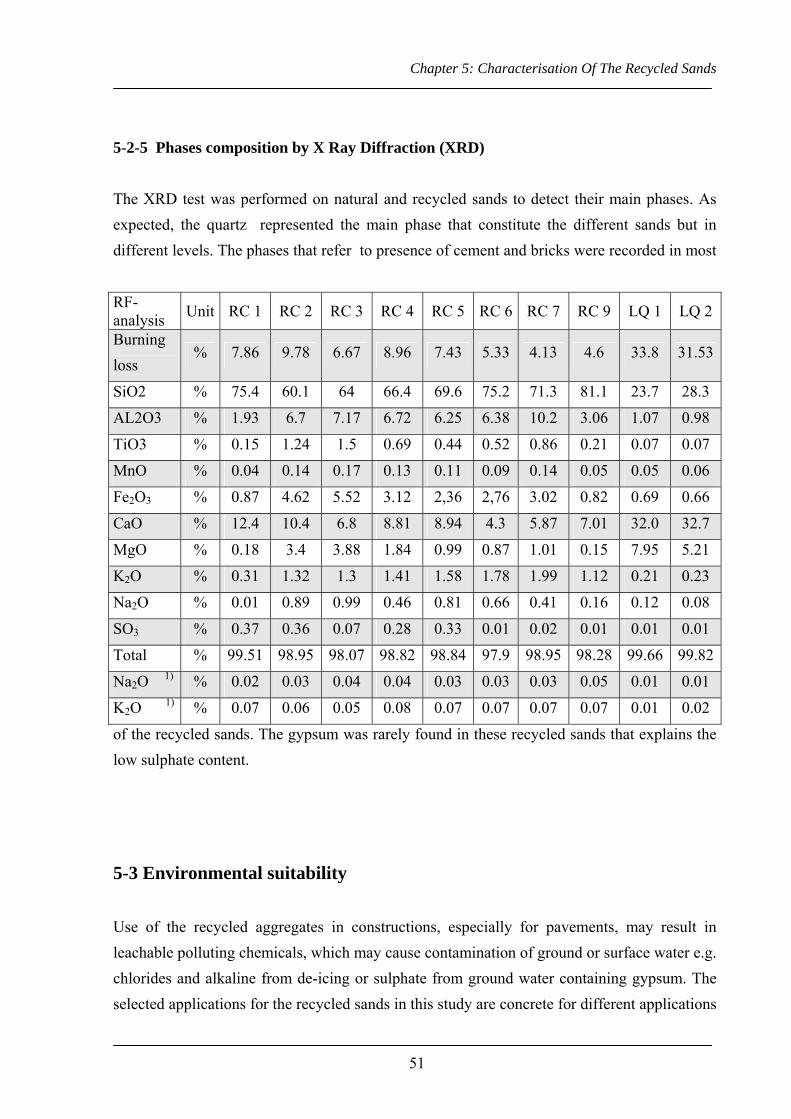
Chapter 5: Characterisation Of The Recycled Sands
51
5-2-5 Phases composition by X Ray Diffraction (XRD) The XRD test was performed on natural and recycled sands to detect their main phases. As expected, the quartz represented the main phase that constitute the different sands but in different levels. The phases that refer to presence of cement and bricks were recorded in most
of the recycled sands. The gypsum was rarely found in these recycled sands that explains the low sulphate content.
5-3 Environmental suitability Use of the recycled aggregates in constructions, especially for pavements, may result in leachable polluting chemicals, which may cause contamination of ground or surface water e.g. chlorides and alkaline from de-icing or sulphate from ground water containing gypsum. The selected applications for the recycled sands in this study are concrete for different applications
RF- analysis Unit RC 1 RC 2 RC 3 RC 4 RC 5 RC 6 RC 7 RC 9 LQ 1 LQ 2
Burning loss
% 7.86 9.78 6.67 8.96 7.43 5.33 4.13 4.6 33.8 31.53
SiO2 % 75.4 60.1 64 66.4 69.6 75.2 71.3 81.1 23.7 28.3
AL2O3 % 1.93 6.7 7.17 6.72 6.25 6.38 10.2 3.06 1.07 0.98
TiO3 % 0.15 1.24 1.5 0.69 0.44 0.52 0.86 0.21 0.07 0.07
MnO % 0.04 0.14 0.17 0.13 0.11 0.09 0.14 0.05 0.05 0.06
Fe2O3 % 0.87 4.62 5.52 3.12 2,36 2,76 3.02 0.82 0.69 0.66
CaO % 12.4 10.4 6.8 8.81 8.94 4.3 5.87 7.01 32.0 32.7
MgO % 0.18 3.4 3.88 1.84 0.99 0.87 1.01 0.15 7.95 5.21
K2O % 0.31 1.32 1.3 1.41 1.58 1.78 1.99 1.12 0.21 0.23
Na2O % 0.01 0.89 0.99 0.46 0.81 0.66 0.41 0.16 0.12 0.08
SO3 % 0.37 0.36 0.07 0.28 0.33 0.01 0.02 0.01 0.01 0.01
Total % 99.51 98.95 98.07 98.82 98.84 97.9 98.95 98.28 99.66 99.82
Na2O 1) % 0.02 0.03 0.04 0.04 0.03 0.03 0.03 0.05 0.01 0.01
K2O 1) % 0.07 0.06 0.05 0.08 0.07 0.07 0.07 0.07 0.01 0.02

Chapter 5: Characterisation Of The Recycled Sands
52
and asphalt concrete for base and binder courses. These applications decrease the probability of leaching of these materials because it will be in a bounded state but the leaching of the used recycled sands were examined to ensure the safety. The leach test according to the standard DIN 38414-4 was carried out on the different recycled sands. Three properties were examined: the pH-Value and the amounts of chloride- and sulphate-ions. The results indicate that the specification limits were not exceeded for any property by all recycled sands; Figures (5-12) and (5-13). The pH-values are relatively high for all recycled sands while the chloride-ions content are considered low. A high variation in sulphate-ions was noticed where the values ranged from 12.8 mg/l in LQ 1 to 437.8 mg/l in building debris sand RC 4.
02468
101214
RC1RC2
RC3RC4
RC5RC7
RC8RC9
RC10RC11
RC12 LQ1LQ2
Sand type
pH -
valu
e
Maximum value =13.5
Figure (5-12): pH values of the different recycled sands
0
100
200
300
400
500
600
700
RC1Rc 2
RC 3RC 4
RC 5Rc 6
RC 7RC 8
RC 9RC 10 LQ 1
LQ2
Cl i
ons o
r SO 4
ions
, mg/ Cl ions
SO4 ions
Max. SO4 ions
Max. Cl ions

Chapter 5: Characterisation Of The Recycled Sands
53
Figure (5-13): Chloride and sulphate (SO4) ions values of the different recycled sands

Chapter 6: Properties Of Concrete With Recycled Sands
55
6- PROPERTIES OFCONCRETE WITH RECYCLED SANDS The properties of fresh and hardened concrete mixes produced with different types of recycled sands were investigated. These mixes represent four concrete exposition classes according to the standard EN 206, with different mix conditions. Each mix was produced by replacement of 0.0, 30, 50, 70 and 100 vol.% of natural sand by recycled sand as in Table (3-2). The test results were used to study the effect of the following parameters on the properties of concrete produced with recycled sand: - origin and properties of the recycled sand (recycled sand type) - amount of recycled sand - cement content - gradation of the aggregate mixture
6-1 Consistency of fresh concrete Concrete consistency was investigated by measuring the spread value according to the standard DIN 1048-1 after 10 minutes from water addition into the mixes (a10). For each mix design, one mix was produced without recycled sand and its spread was used as reference value. 6-1-1 Effect of recycled sand type on concrete consistency Mix1, as a concrete for exposition classes XC1, was produced with the highest w/c ratio of all mixes (0.66) and cement content equal to 300 kg/m³. The effect of the recycled sand type on the concrete consistency was investigated by measuring the a10 values at a replacement of 30% of the natural sand by the different recycled sands, the values at the other recycled sand amounts will be shown in the next section. In this mix, the required spread values for soft consistency (a10 = 42-48 cm) were achieved by all recycled sands other than RC 4, Figure (6-1). It is noticed that the variation in a10 values of the different recycled sands was relatively low with respect to the other mixes where the values ranged from 41 to 46 cm. This may be because the high amount of water (196 l/m³) can overcome some of the differences in the recycled sand properties that affect the concrete consistency such as the particle shape and surface texture.

Chapter 6: Properties Of Concrete With Recycled Sands
56
32343638404244464850
N.SRC 1
RC 2RC 3
RC 4RC 5
RC 6RC 7
RC 8RC 9
RC 10 LQ 1LQ 2
Sand type
Spre
ad(a
10),
cm
Figure (6-1): Effect of sand type on the concrete consistency of Mix1 with 30 vol.% recycled sand. Figure (6-2) shows the a10 values of Mix2 (concrete exposition class XC4) with 30 vol.% of different recycled sands. The a10 values ranged from 88% to about 100% of the reference concrete. This decrease in consistency, in spite of pre-wetting , may be due to the particle shape and surface texture, further soaking of water by recycled sands during producing and testing of concrete or inaccurate results of the water absorption for some materials, which lead to a lack of pre-wetting water. According to these results the recycled sands can be classified into three groups. The first group includes RC 1, RC 5, LQ 1 and LQ 2, which had the highest spread values ranging from 42 to 44 cm. So, it can be considered that these materials act approximately like natural sand. This because LQ 1 and LQ 2 are crushed natural limestone and they contain a higher amount of fine materials. The second group, which has moderate spread values ranging from 38 to 40 cm included RC 7, RC 8, RC 9 and RC 10. These materials were produced from light weight porous materials, bricks and lime-sand bricks but they were well sorted materials. The lowest consistency were achieved by RC 2, RC 3, RC 4 and RC 6 which constitute the third group. These sands were produced from mixtures of different materials, see Table (3-1). RC 3 and RC 6 are from pre-sieved building debris and RC 2 contains about 30% asphalt concrete . While RC 4 is building debris sand.

Chapter 6: Properties Of Concrete With Recycled Sands
57
32343638404244464850
N.SRC 1
RC 2RC 3
RC 4RC 5
RC 6RC 7
RC 8RC 9
RC 10 LQ 1LQ 2
Sand type
Spre
ad (a
10),
cm
Figure (6-2): Effect of sand type on the concrete consistency of Mix2 The recycled sands were also investigated to be used as a fine material in concrete that should have a high resistance to frost and de-icing salt attack (Mix6). Because this concrete can be used in pavement construction, the plastic consistency (a10 = 34-41cm) for concrete was considered a target. The results as shown in Figure (6-3) indicate that the concrete produced by natural and the all recycled sands achieved the plastic consistency. The observed difference in a10 values between concrete by natural sand and recycled sands as well as in between the various recycled sands are relatively low. The a10 values of concrete with recycled sands ranged from 95 to 98,6 % of the reference concrete.
32343638404244464850
N.SRC 1
RC 2RC 3
RC 4RC 5
RC 6RC 7
RC 8RC 9
RC 10 LQ 1LQ 2
Sand type
Spre
ad (a
10),
cm
Figure (6-3): Effect of sand type on the concrete consistency of Mix6
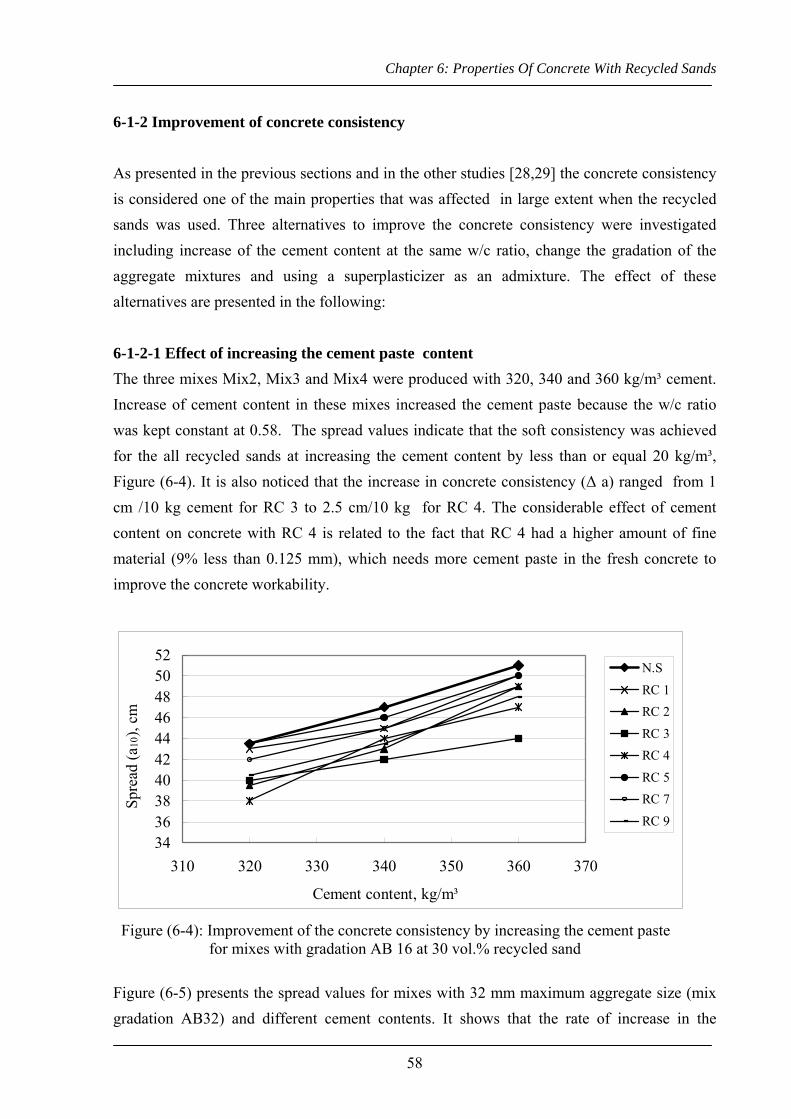
Chapter 6: Properties Of Concrete With Recycled Sands
58
6-1-2 Improvement of concrete consistency As presented in the previous sections and in the other studies [28,29] the concrete consistency is considered one of the main properties that was affected in large extent when the recycled sands was used. Three alternatives to improve the concrete consistency were investigated including increase of the cement content at the same w/c ratio, change the gradation of the aggregate mixtures and using a superplasticizer as an admixture. The effect of these alternatives are presented in the following: 6-1-2-1 Effect of increasing the cement paste content The three mixes Mix2, Mix3 and Mix4 were produced with 320, 340 and 360 kg/m³ cement. Increase of cement content in these mixes increased the cement paste because the w/c ratio was kept constant at 0.58. The spread values indicate that the soft consistency was achieved for the all recycled sands at increasing the cement content by less than or equal 20 kg/m³, Figure (6-4). It is also noticed that the increase in concrete consistency (∆ a) ranged from 1 cm /10 kg cement for RC 3 to 2.5 cm/10 kg for RC 4. The considerable effect of cement content on concrete with RC 4 is related to the fact that RC 4 had a higher amount of fine material (9% less than 0.125 mm), which needs more cement paste in the fresh concrete to improve the concrete workability.
34363840424446485052
310 320 330 340 350 360 370
Cement content, kg/m³
Spre
ad (a
10),
cm
N.S
RC 1RC 2
RC 3RC 4
RC 5RC 7
RC 9
Figure (6-4): Improvement of the concrete consistency by increasing the cement paste for mixes with gradation AB 16 at 30 vol.% recycled sand Figure (6-5) presents the spread values for mixes with 32 mm maximum aggregate size (mix gradation AB32) and different cement contents. It shows that the rate of increase in the

Chapter 6: Properties Of Concrete With Recycled Sands
59
concrete spread of these mixes is higher than that of gradation AB16. This may be because of the lower surface area of the coarser portion in the mixes at gradation AB32. The required additional cement and water to achieve the spread value of the mix with natural sand or the minimum value of the soft consistency (42 cm) is less than 20 kg/m³ for all recycled sands. It is also noticed that the difference in spread values between the various sands is limited to 3 cm at 320 kg/m³ cement content.
32343638404244464850525456
290 300 310 320 330 340 350Cement content, kg/m3
Spre
ad (a
10),
cm
N.SRC 1RC 2RC 3RC 4RC 5RC 7RC 9
Figure (6-5): Improvement of the concrete consistency by increasing the cement content for mixes with gradation AB 32 at 30 vol. % recycled sand 6-1-2-2 Effect of increasing the maximum aggregate size on concrete consistency The mixes that represent the concrete exposition classes XC1 and XC4 were produced both with 16 mm and 32 mm maximum aggregate size. In Mix7 XC1 with gradation AB32 ) the first trail was with 300 kg/m³ cement as in Mix1 (AB16) but the a10 values were very high and the concrete was in a liquid state so, the cement content was reduced to 280 kg/m³ while the other conditions were kept constant. In this case the consistency was very soft (spread > 48 cm) for recycled concrete sand RC 5 and natural crushed limestone sand LQ 1 while the other sands achieved the soft consistency. This means that the spread values highly increased as the maximum aggregate size was increased in XC1. Figure (6-6) shows that the effect of sand type on the consistency of concrete mixes with AB32 gradation was approximately the same like with 16 mm which means that the sand type and consequently its properties has a main rule in the attained consistency. The results indicate also that, in spite of reducing the cement matrix in Mix7, it has higher spread values than these of Mix1 for all recycled sands. This may be because increasing the maximum aggregate size decreases the surface area of the

Chapter 6: Properties Of Concrete With Recycled Sands
60
aggregate and consequently decrease the required cement paste to achieve the required consistency.
32
36
40
44
48
52
56
N.SRC 1
RC 2RC 3
RC 4RC 5
RC 6RC 7
RC 8RC 9
LQ 1
Sand type
Spre
ad (a
10),
cm
Mix 1 (Gradation AB 16 mm) Mix 7 (Gradation AB 32 mm)
Figure (6-6): Effect of sand type on the concrete consistency of Mix1 and Mix7 6-1-2-3 Effect of superplasticizer on the concrete consistency Superplasticizer was used in some cases to achieve the required consistency. It was used as alternative to attain the required consistency without any changes in the mix conditions such as the w/c ratio, cement content and mix gradation. As an example, using superplasticizer in order of 0.75 m.% of cement achieved the soft consistency of Mix2 with 50% recycled sand which has low spread values, Figure (6-7). In all the experimental program, the required superplastizer did not exceed 1% (m.% of cement) for any of the recycled sands in all concrete mixes. Linear relations were derived between the amount of superplasticizer and the concrete consistency for all recycled sands, Figure (6-8) shows three of these relations. The relations indicate that the highest effect of superplasticizer was found in concrete with brick sand RC 7, which was affected in lower manner with increasing the cement content or increasing the maximum aggregate size as mentioned before. This may be because RC 7 has the highest amount of fine material (< 0.125 mm) on which superplasticizer is of special effectiveness due to its non agglomeration potential

Chapter 6: Properties Of Concrete With Recycled Sands
61
30323436384042444648
RC 3 RC 4 RC 5 RC 7 RC 8 RC 9 RC 11Sand type
Spea
d (a
10),
cmwithout superplasticizer With superplasticizer
Figure (6-7): Effect of superplasticizer addition on the concrete consistency of Mix2
34
38
42
46
50
54
58
0,00 0,25 0,50 0,75 1,00 1,25Superplasticizer content, m.% of cement
Spre
ad (a
10),
cm
RC 2
RC 7
RC 9
Figure (6-8): Relationships between the Superplasticizer content and the spread values of Mix2 6-1-3 Effect of the recycled sand content on concrete consistency
The amount of recycled sand was increased from 30% to 50, 70 and 100 vol.% in all mixes for all recycled sands to evaluate the consistency of concrete with higher amounts of recycled sand or to determine the maximum possible amount of sand that can be used for the different concretes mixes. The results of XC1 mixes show that the spread values reduced, at 100 % recycled sand, from 14% for RC 5 to about 25% for RC 3, RC 4 and RC 7, Figure (6-9). It was also found that for this water-rich concrete the reduction in spread was obviously the highest at 30% recycled sand and then it decreased as the recycled sand amount increased.

Chapter 6: Properties Of Concrete With Recycled Sands
62
This may be because using the recycled sand in a considerable amount increases the friction between the aggregate particles which decrease the consistency but the excess amounts may have no direct contact with the original particles and so it has lower effect on the consistency.
32
36
40
44
48
52
0 10 20 30 40 50 60 70 80 90 100
Recycled sand, vol.% of total sand
Spre
ad (a
10),
cm
RC 1RC 2RC 3RC 4RC 5RC 6RC 7RC 9
Figure (6-9): Effect of amount of recycled sand on the concrete consistency of Mix1 Figures (6-10 ) and (6-11) show the spread values of mixes 3 and 9 which have the best mix design of the two gradations AB16 and AB32 respectively . These values present that the maximum reduction in spread was 20 % in Mix3 at 100% RC 4 and RC 7 and was 20% in Mix9 at 100% RC 7. This means that the reduction in spread values at using the recycled sands in concrete can be limited by adjustment the concrete mix design.
32
36
40
44
48
52
0 10 20 30 40 50 60 70 80 90 100Recycled sand content, vol. % of total sand
Spre
ad (a
10),
cm
RC 1
RC 2
RC 3
RC 4
RC 5
RC 7
RC 9
Figure (6-10): Effect of amount of recycled sand on the concrete consistency of Mix3

Chapter 6: Properties Of Concrete With Recycled Sands
63
3234363840424446485052
0 10 20 30 40 50 60 70 80 90 100
Recycled sand content, vol.% of total sand
Spre
ad (a
10),
cm
RC 1
RC 2
RC 3
RC 4
RC 5
RC 7
RC 9
Figure (6-11): Effect of amount of recycled sand on the concrete consistency of Mix9 It can be concluded that using up 100 % of recycled sand reduced the spread of concrete from 15% to 25% for all mixes with all recycled sands in case of using natural coarse aggregates > 4 mm. At higher w/c ratios, due to the higher water content and the higher viscosity of the cement paste the reduction in spread values tend to decrease as the recycled sand amount increased while at the suitable mix design the relation are approximately linear.
6-2 Stiffening of fresh concrete To evaluate the stiffening of concrete mixes with recycled sands, the consistency of fresh concrete was measured in the same manner for a10 after 10 minutes but at 30 and 60 minutes. A sufficient amount of fresh concrete for the three measurements of consistency a10, a30 and a60 was produced and stored in the mixer and covered with plastic sheet until the measurement of the consistency at the definite times. Before testing the concrete was mixed again for 30 second. Figure (6-12) shows the stiffening of Mix1 with natural sand and 30% of the different recycled sands. The spread values decreased for natural and the different recycled sands in similar relations. The relations between the time and the spread values were approximately linear for the natural sand, RC 1 and RC 5 while for the other recycled sands the spread decreased degressively. These may be because the recycled sands absorbed some of the mixing water in the early age of the fresh concrete, which increase the reduction in the spread values. Similar results were found for the other concrete mixes with different amounts of the recycled sands. It can be concluded that although the recycled sands has a big effect on the concrete consistency, it has no considerable effect on the stiffening of the fresh concrete.

Chapter 6: Properties Of Concrete With Recycled Sands
64
32343638404244464850
0 10 20 30 40 50 60 70
Time after water addition, min
Spre
ad (a
10),
cmNSRC 1RC 2RC 3RC 4RC 5RC 6RC 7RC 9LQ 1
Figure (6-12): Stiffness of Mix1 with natural and 30% of the different recycled sands
6-3 Concrete strength In solids, there exists a fundamental inverse relationship between porosity and strength. Consequently, in concrete as multiphase materials, the porosity of each component of the structure can effect the strength. The higher porosity is one of the main aspects of the recycled aggregates so, it can affect the concrete strength. In addition, increasing the w/c ratio to attain the required consistency of concrete with recycled aggregate may also reduce the concrete strength. So, The effect of using recycled sands on compressive and splitting-tensile strength was investigated. 6-3-1 Compressive strength The compressive strength values of Mix2 (XC4, cement content 320 kg/m³) are shown in Figure (6-13). It presents that using 30%, 50% , 70% and 100% of the recycled concrete sand RC 1 decreased the compressive strength by only 0.0 %, 2 %, 4 % and 6.5 % respectively. Also using RC 5 (recycled concrete sand from plant B) has a relatively low effect on the compressive strength. These results are promising for using recycled sand combined with natural coarse aggregate. It is noticed that at low sand replacement (30 vol.%), the compressive strength of concrete produced with lower density sand (RC 4, RC 7 and RC 9) is lower than that of higher density sands which means that the porosity of sand plays a role in determining the strength. But at 50% and 70% recycled sand, the difference in compressive strength values other than concrete sands is relatively low. This because of the non mineral

Chapter 6: Properties Of Concrete With Recycled Sands
65
material such as asphalt in RC 2 and RC 3 which reduce it with higher rates so that its compressive strength become similar to that of low density sands.
3032343638404244464850
0 10 20 30 40 50 60 70 80 90 100Recycled sand content, vol.% of total sand
Com
pres
sive
stre
ngth
, N/m
m²
. RC 1RC 2RC 3RC 4RC 5RC 6RC 7RC 9
Figure (6-13): Effect of amount of recycled sand on the concrete compressive strength of Mix2 Figure (6-14) presents a comparison between recycled sands produced from pure bricks or lime-sand bricks (RC 7 and RC 9) and those produced from bricks or lime-sand brick from masonry walls (RC 8 and RC 10). It was found that the compressive strength values of RC 8 and RC 10 are higher than those of RC 7 and RC 10 and approximately similar to the recycled concrete sand RC 5. This improvement can be related to that RC 8 and RC 10 contains about 35% crushed cement mortar which means that mixing the low density sands such as crushed bricks sands with crushed cement mortar sand or crushed concrete sand (ratio about 2:1) improves its strength. In the next sections the results of RC 8 and RC 10 will not be presented because in all cases their results were better than RC 7 and RC 9. The decrease in compressive strength due to using crushed limestone sands LQ1 and LQ2 is negligible. Using up to 100% of these two sands reduced the compressive strength by 1.6% and 3.2% only. This low decrease is related to the fact that there is no big differences in the physical properties between these two sands and the natural sand. In the following sections the compressive strength values of LQ1 and LQ2 in the other mixes will not be presented further because the decrease did not exceed that of Mix2.

Chapter 6: Properties Of Concrete With Recycled Sands
66
3234363840424446
0 10 20 30 40 50 60 70 80
Recycled sand content, vol.% of total sand
Com
pres
sive
stre
ngth
, N/m
m²
.RC 7
RC 8
RC 9
RC 10
Figure (6-14): Effect of mixing brick and lime-sand brick sands with crushed cement mortar on compressive strength of Mix2 As mentioned before the superplasticizer was used in order of 0.75 m.% of cement to improve the concrete consistency of Mix2. The effect on the compressive strength was investigated, Figure (6-15). Using the superplasticizer in concrete with recycled sands slightly increased the compressive strength. The increase in compressive strength ranged from 1% to 11%. The only significant effect was for RC 7, due to the improved workability and the better compaction.
05
101520253035404550
RC 2 RC 3 RC 4 RC 5 RC 6 RC 7 RC 9Sand type
Com
pres
sive
stre
ngth
, N/m
m²
.
without superplasticizer wih superplasticizer
Figure (6-15): Effect of superplasticizer addition to the concrete on the compressive strength of Mix2 In Mix1, which had the highest w/c ratio of 0.66 and cement paste of 295 l/m³, the variation in the compressive strength of concrete with different recycled sands were relatively low as

Chapter 6: Properties Of Concrete With Recycled Sands
67
shown in Figure (6-16). The maximum differences in compressive strength values were limited to 2.2, 4.8, 7 and 10 N/mm² at 30%, 50%, 70% and 100% recycled sand respectively. As in other mixes the recycled concrete sands RC 1 and RC 5 achieved the highest compressive strength values while the lowest values were registered by the recycled sands of plant A (RC 2, RC 3 and RC 4). It is also noticed that the decrease in compressive strength in this mix due to using the recycled sand is slightly higher than that of Mix2. The low variation between the various recycled sands can be related to the higher w/c ratio which overcome the shortage in pre-wetting water of some sands with low effect on the effective w/c ratio. Figure (6-17) shows that the recycled sand type has a considerable effect on the rate of the reduction in compressive strength values of Mix5 (w/c ratio = 0.53 and cement content = 350 kg/m³). The compressive strength of mixes with RC 2, RC 4 and RC 9 decreased with higher rates than the mixes with the other recycled sands. But the reduction in the compressive strength of Mix5 was similar to that of Mix2 (w/c ratio = 0.58 and cement content = 320 kg/m³) . This means that increasing the cement content and decreasing the w/c ratio in Mix5 did not limited the reduction in compressive strength at using the recycled sands instead of the natural sand.
24262830323436384042
0 10 20 30 40 50 60 70 80 90 100Recycled sand content, vol.%
Com
pr. s
treng
th, N
/mm
² RC 1RC 2RC 3RC 4RC 5RC 6RC 7RC 9
Figure (6-16): Effect of type and amount of recycled sand on the compressive strength of Mix1

Chapter 6: Properties Of Concrete With Recycled Sands
68
32343638404244464850525456
0 10 20 30 40 50 60 70 80 90 100
Recyclerd sand content, vol. %
Com
pr. s
treng
th, N
/mm
²RC 1RC 2RC 3RC 4RC 5RC 6RC 7RC 9
Figure (6-17): Effect of type and amount of recycled sand on the compressive
strength of Mix5 In Mix6 (XC4), the reduction in compressive strength due to using the recycled sands is relatively high for all sands other than the concrete crushed sand RC 1, Figure (6-18). The reduction ranged from 29.2% for RC 4 to 7% for RC 1 at using 70% recycled sand. Because of the high reduction in compressive strength of this mix, the compressive strength values were measured at 100% recycled sand for only three sands, which has the highest and lowest compressive strength. This excess in the reduction in compressive strength in comparison to the other mixes can be related to the low cement paste of this mix with respect to the high amount of the fine material of the recycled sands. The relation between the reduction in compressive strength will be discussed in detail in chapter 8 and will be correlated to the mix design and the recycled sand characteristics. Other than the high decrease in compressive strength , there is no difference between Mix6 and the other mixes which represent XC1 , XC4 and XF3, where RC 1 achieved the best values and RC 4 had the lowest value and the relationships between the compressive strength and the recycled sand content were linear or tended to decrease as the recycled sand amount increased.
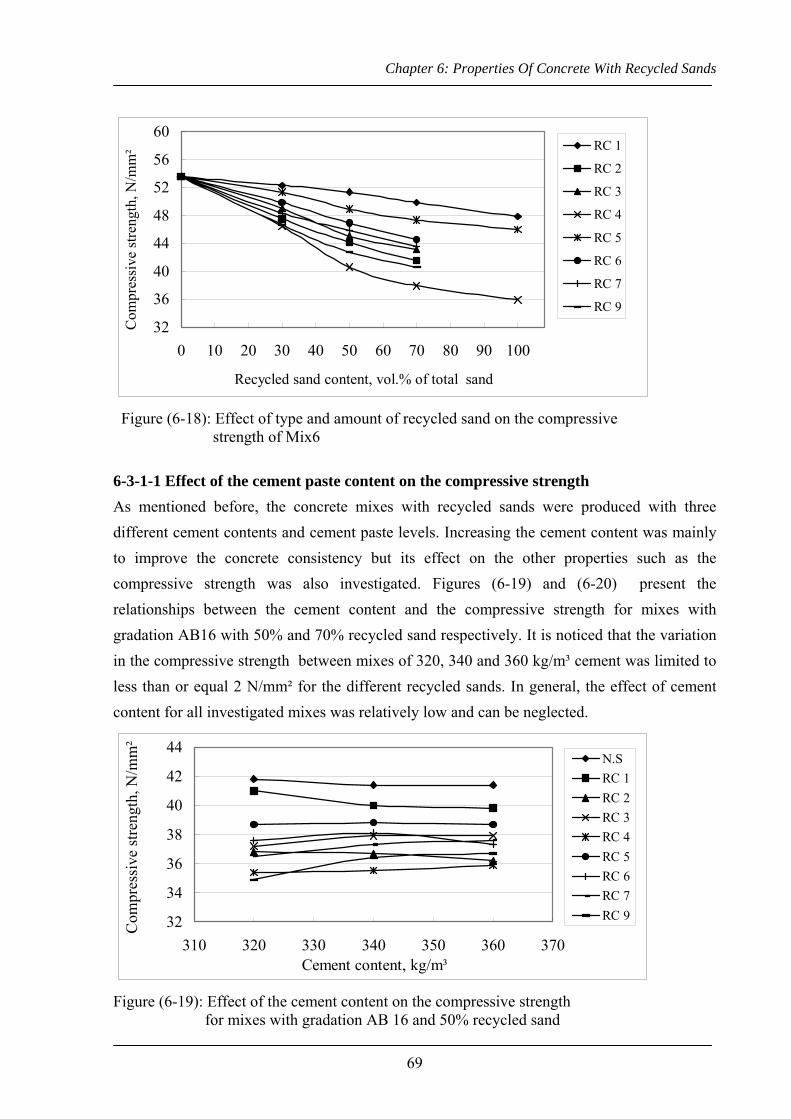
Chapter 6: Properties Of Concrete With Recycled Sands
69
32
36
40
44
48
52
56
60
0 10 20 30 40 50 60 70 80 90 100
Recycled sand content, vol.% of total sand
Com
pres
sive
stre
ngth
, N/m
m²
. RC 1
RC 2
RC 3
RC 4
RC 5
RC 6
RC 7
RC 9
Figure (6-18): Effect of type and amount of recycled sand on the compressive strength of Mix6 6-3-1-1 Effect of the cement paste content on the compressive strength As mentioned before, the concrete mixes with recycled sands were produced with three different cement contents and cement paste levels. Increasing the cement content was mainly to improve the concrete consistency but its effect on the other properties such as the compressive strength was also investigated. Figures (6-19) and (6-20) present the relationships between the cement content and the compressive strength for mixes with gradation AB16 with 50% and 70% recycled sand respectively. It is noticed that the variation in the compressive strength between mixes of 320, 340 and 360 kg/m³ cement was limited to less than or equal 2 N/mm² for the different recycled sands. In general, the effect of cement content for all investigated mixes was relatively low and can be neglected.
32
34
36
38
40
42
44
310 320 330 340 350 360 370Cement content, kg/m³
Com
pres
sive
stre
ngth
, N/m
m²
.
N.SRC 1RC 2RC 3RC 4RC 5RC 6RC 7RC 9
Figure (6-19): Effect of the cement content on the compressive strength for mixes with gradation AB 16 and 50% recycled sand

Chapter 6: Properties Of Concrete With Recycled Sands
70
Figure (6-20): Effect of the cement content on the compressive strength for mixes with gradation AB16 and 70% recycled sand Similar results were found for the effect of the cement content on the concrete mixes with gradation AB 32 where increasing the cement content slightly improves the compressive strength, Figure (6-21), but always less than 2 N/mm2 with the exception of RC4. The results indicate also that the building debris RC 4 needs more cement to act as the other recycled sands. This is because it has the highest amount of the fine material (17 % < 0.125 mm) and so it needs more cement to encapsulate this fine material in a strong cement matrix.
28303234363840424446
290 300 310 320 330 340 350
Cement content, kg/m³
Com
pres
sive
stre
ngth
, N/m
m²
.
N.S
RC 1
RC 3
RC 4
RC 5
RC 6
RC 7
RC 9
Figure (6-21): Effect of the cement content on the compressive strength for mixes with gradation AB 32 and 50% recycled sand
303234363840424446
310 320 330 340 350 360 370
Cement content, kg/m³
Com
pres
sive
stre
ngth
, N/m
m² .
N.SRC 1RC 2RC 3RC 4RC 5RC 6RC 7RC 9

Chapter 6: Properties Of Concrete With Recycled Sands
71
6-3-1-2 Effect of maximum aggregate size on compressive strength Increasing the maximum aggregate size of the natural coarse aggregate from 16 mm to 32 mm was an effective alternative to improve the concrete consistency for all recycled sands. Without additional costs, even in case of reducing the cement content in mixes with AB 32. The comparison between the different mixes with mix gradations AB 16 and AB 32 at 50% recycled sand will be discussed in the following. In mixes of concrete class XC1, the reduction in compressive strength at using gradation AB32 ranged from 0.3 to 2.3 N/mm² although this mix was produced with 20 kg/m³ cement less than the mix of gradation AB16, Figure (6-22). That means that the influence of the maximum aggregate size on the compressive strength of this mix was negligible. In concrete class XC4, the effect of the mix gradation was investigated at 320 and 340 kg/m³ cement content.. At using 320 kg/m³, the decrease in compressive strength was from 0.7 to 4 N/mm² for the different recycled sands compared to 3 N/mm² for the natural sand. While using 340 kg/m³ cement, which can be considered the suitable amount for XC4 with the investigated recycled sands, decreased the reduction in the compressive strength for both natural and recycled sands as shown in Figure (6-23). Where it ranged from 1.6 to 2.8 N/mm² for recycled sands and 1.6 N/mm² for the natural sands. This indicates that using the recycled sands in mixes with higher maximum aggregate size can be preferred because it enhance the consistency without any significant measurable effect on the compressive strength.
28
30
32
34
36
38
40
42
N.S. RC1 RC 2 RC 3 RC 4 RC 5 RC 6 RC 7 RC 9
Sand type
Com
pres
sive
stre
ngth
, N/m
m²
.
AB 16 (Mix 1) AB 32 (Mix 7)
Figure (6-22): Effect of maximum aggregate size on the compressive strength for concrete class XC1 with 50% recycled sand

Chapter 6: Properties Of Concrete With Recycled Sands
72
303234363840424446
N.S. RC1 RC 2 RC 3 RC 4 RC 5 RC 6 RC 7 RC 9Sand type
Com
pres
sive
stre
ngth
, N/m
m²
. .
AB 16 (Mix 3) AB 32 (Mix 10)
Figure (6-23): Effect of maximum aggregate size on the compressive strength for concrete class XC4 with 340 kg/m³ cement and 50% recycled sand It can be concluded that the recycled sand types or its properties has a considerable effect on the concrete compressive strength but the differences between the various recycled sands or between the natural and recycled sands are relatively low at changing the cement content and the maximum aggregate size. 6-3-2 Splitting-tensile strength The splitting-tensile strength as one of the tensile strength properties was measured for all investigated mixes with up to 100% recycled sands in parallel to the compressive strength, just to find correlation factors and to prove the correlations given for concrete with natural aggregate in the standard DIN 1045-2. Figure (6-24) shows the effect of sand type and amount on the splitting-tensile strength values of Mix1. It is noticed that the differences in the splitting-tensile strength between the various recycled sands were relatively low where at 70% recycled sands the reduction was in range of 0.3 N/mm² for RC1 to 0.6 N/mm² for RC 4. As in compressive strength results, the crushed concrete recycled sands RC1 and RC5 achieved the lowest decrease and RC4 occurred the highest effect on the splitting-tensile strength.

Chapter 6: Properties Of Concrete With Recycled Sands
73
2,4
2,6
2,8
3,0
3,2
3,4
3,6
0 10 20 30 40 50 60 70 80 90 100Reccyled sand content, vol.% of total sand
Split
ting-
tens
ile st
reng
th, N
/mm
² .
RC 1RC 2RC 3RC 4RC 5RC 6RC 7RC 9
Figure (6-24): Effect of type and amount of recycled sand on the splitting- tensile strength of Mix1 On the other side, the values of splitting–tensile strength of Mix6, which had the lowest w/c ratio (0.48), versus the recycled sand amounts are presented in Figure (6-25). In this Mix, RC5 (crushed concrete) behaved like the natural sand while all RC-sands containing low strength particles (building debris RC4, brick RC7, lime-sand bricks RC9 and the pre-sieved sand RC2) showed the most significant reduction in tensile strength. Some of the studies and DIN EN 206 derived relationships between the compressive and the three types of the tensile strength for normal concrete and concrete with concrete recycled aggregates [65-68]. So, the values of splitting tensile strength of the other mixes will not be presented and it will be tried to find a similar relationships for concrete with the various recycled sands between the splitting-tensile strength and the compressive strength to compare it with the normal concrete or modifying the existed relation for normal concrete to be used for concrete with recycled sands, see chapter 8.

Chapter 6: Properties Of Concrete With Recycled Sands
74
2,42,62,83,03,23,43,63,84,0
0 10 20 30 40 50 60 70 80 90 100
Recycled sand content, vol.% of total sand
Split
ting-
tens
ile st
reng
th, N
/mm
² .
RC 1
RC 2RC 3
RC 4RC 5
RC 6RC 7
RC 9
Figure (6-25): Effect of type and amount of recycled sand on the Splitting-tensile strength of Mix6
6-4 Modulus of elasticity of concrete The modulus of elasticity of concrete is a measure for its deformation behaviour under internal and external loads. It is needed for computing the design of structural elements. The dynamic elastic modulus was measured for concrete mixes with different recycled sands at 28 day age. Figure (6-26) shows the elastic modulus values of Mix1 with different recycled sand contents. It is noticed that the elastic modulus decreases as the amount of the recycled sand increases in an approximately linear relations. The maximum reduction in the elastic modulus was 24% at full replacement of natural sand building debris sand RC 4. while using up to 100% concrete crushed sand RC 5 decreased the elastic modulus by only about 14%. The reduction due to the use of the other recycled sands was found in between the two values. In Mix3, which represents the concrete class XC4, the effect of the recycled sand type is similar to that of Mix1, see Figure (6-27). In this Mix using 100% recycled sand reduced the elastic modulus with values ranging from 17% for RC 5 to 25% for RC 4. The other sands can be divided to two groups, the fist group includes the pre-sieved sands RC 3 and RC 6 with 19% loss in the elastic modulus values at using 100% recycled sand and the second group consists of RC 1, RC 7 and RC 9, which decreased the elastic modulus with about 21%. It is noticed that the crushed concrete sand that produced in the laboratory didn’t achieve the best elastic modulus values or came with RC 5 in one group as the best recycled sands as in the other concrete properties. The main difference between RC 1 and RC 5 is that RC 1 is coarser

Chapter 6: Properties Of Concrete With Recycled Sands
75
(D-sum of RC 1 equal to 642.5 in compare to 686.5 for RC 5) and its particle shape is more irregular (the average l/w ratio of RC 1 and RC 5 are 1,41 and 1,32 respectively) which leads to increase the voids in the matrix and then decrease the elastic modulus of the concrete
26
28
30
32
34
36
38
40
42
44
0 20 40 60 80 100
Recycled sand content, vol.% of total sand
Dyn
mic
al m
odul
us o
f ela
stic
ity,
. K
N/m
m²
.
RC 1
RC 2
RC 3
RC 4
RC 5
RC 6
RC 7
RC 9
Figure (6-26): Effect of amount of recycled sand on the concrete dynamic modulus of elasticity of Mix1
26283032343638404244
0 20 40 60 80 100
Recycled sand content, vol.% of total sand
Dyn
amic
al m
odul
us o
f ela
stic
ity, .
KN
/mm
² .
RC 1RC 2RC 3RC 4RC 5RC 6RC 7RC 9
Figure (6-27): Effect of amount of recycled sand on the concrete dynamic modulus of elasticity of Mix3
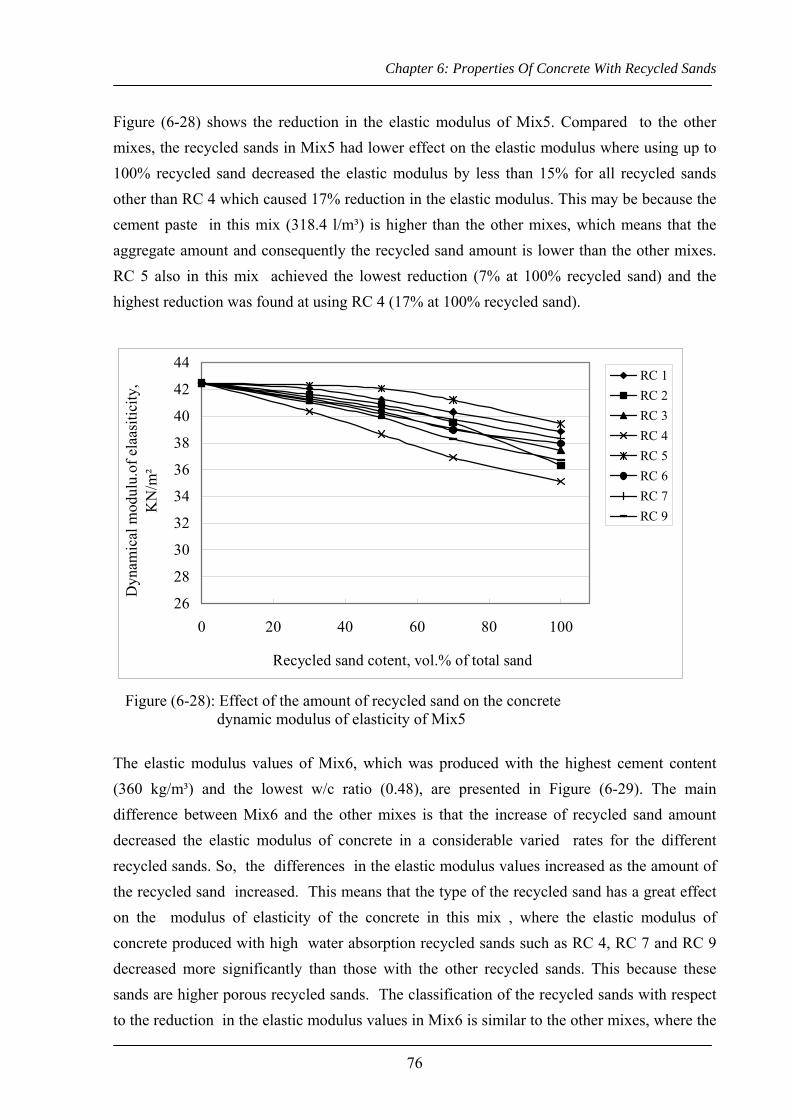
Chapter 6: Properties Of Concrete With Recycled Sands
76
Figure (6-28) shows the reduction in the elastic modulus of Mix5. Compared to the other mixes, the recycled sands in Mix5 had lower effect on the elastic modulus where using up to 100% recycled sand decreased the elastic modulus by less than 15% for all recycled sands other than RC 4 which caused 17% reduction in the elastic modulus. This may be because the cement paste in this mix (318.4 l/m³) is higher than the other mixes, which means that the aggregate amount and consequently the recycled sand amount is lower than the other mixes. RC 5 also in this mix achieved the lowest reduction (7% at 100% recycled sand) and the highest reduction was found at using RC 4 (17% at 100% recycled sand).
26
28
30
32
34
36
38
40
42
44
0 20 40 60 80 100
Recycled sand cotent, vol.% of total sand
Dyn
amic
al m
odul
u.of
ela
asiti
city
, .
KN
/m²
.
RC 1RC 2RC 3RC 4RC 5RC 6RC 7RC 9
Figure (6-28): Effect of the amount of recycled sand on the concrete dynamic modulus of elasticity of Mix5 The elastic modulus values of Mix6, which was produced with the highest cement content (360 kg/m³) and the lowest w/c ratio (0.48), are presented in Figure (6-29). The main difference between Mix6 and the other mixes is that the increase of recycled sand amount decreased the elastic modulus of concrete in a considerable varied rates for the different recycled sands. So, the differences in the elastic modulus values increased as the amount of the recycled sand increased. This means that the type of the recycled sand has a great effect on the modulus of elasticity of the concrete in this mix , where the elastic modulus of concrete produced with high water absorption recycled sands such as RC 4, RC 7 and RC 9 decreased more significantly than those with the other recycled sands. This because these sands are higher porous recycled sands. The classification of the recycled sands with respect to the reduction in the elastic modulus values in Mix6 is similar to the other mixes, where the

Chapter 6: Properties Of Concrete With Recycled Sands
77
minimum reduction was achieved by RC 5 (10% at 100 % recycled sand) and the maximum decrease was found at using RC 4 (24%). The recycled sands can be divided into two groups. The first group includes RC 1, RC 3, RC 5 and RC 6 with maximum of 15% decrease in the elastic modulus values at using 100% recycled sand. While at using the recycled sands of the second group RC 2, RC 7 and RC 9, the elastic modulus was reduced by up to 25%.
26283032343638404244
0 20 40 60 80 100
Recycled sand content, vol.% of total sand
Dyn
amic
al m
odul
us o
f ela
stic
ity,
. K
N/m
m²
.
RC 1RC 2RC 3RC 4RC 5RC 6RC 7RC 9
Figure (6-29): Effect of amount of recycled sand on the concrete dynamic modulus of
elasticity of Mix6 The elastic modulus values of Mix9 produced with the same mix proportions of Mix3 but with mix gradation AB32 instead of AB16 showed modulus of elasticity values between
40×103 N/mm2 for concrete with pure natural sand to 29×103 N/mm2 for 100% RC 4 sand.
The other values were arranged in the same order like those of Mix3, see appendix A . It can be concluded that the use of AB32 mix gradation has no significant effect on the elastic modulus of concrete.
6-5 Drying Shrinkage of concrete The strains due to drying shrinkage of concrete is assumed to be related mainly to the evaporation of adsorbed water from the cement paste. The loss of adsorbed water occurs when the saturated cement paste exposed to surrounding humidity below the saturation. In practice, moisture movements in hydrated cement paste, which essentially control the drying shrinkage in concrete are influenced by numerous simultaneously interacting factors. The materials

Chapter 6: Properties Of Concrete With Recycled Sands
78
properties and mix proportions are the main factors, which may be affected by using the recycled aggregate in general and specially recycled sands. This factor includes the elastic modulus of aggregate, which influences in large extent the elastic modulus of concrete, the gradation, the maximum aggregate size, particle shape, surface texture of aggregate, cement content and water content. The investigation of the recycled sands in this study indicated that it has properties different from those of the natural sand such as particle shape, water absorption and gradation as previously described in chapter 5 and it has also a noticeable effect on mix proportions such as cement content and water content. So it is important to investigate the shrinkage of concrete produced with recycled sands. The drying shrinkage of Mix1 and Mix3 that represent the concrete exposition classes XC1 and XC4 was measured along one year age of concrete. With a replacement of 70% of the natural sand by recycled sands it is noticed that the recycled sand type had a much more considerable effect on the concrete shrinkage, see Figure (6-30). Most of the differences in the shrinkage values between the different sands appeared within the first 3 months. At 91 day age about 65% of the one year shrinkage values were registered. At one year age, the shrinkage increased up to about 66% for the concrete with 70% recycled building debris sand RC 4. Two groups were clearly to be defined depending on concrete shrinkage: group 1 consisting of the crushed concrete sands RC 1 and RC 5 with a maximum increase of less than 15% and the second one consisting of RC3, RC 7, RC 9 and RC 4 with a shrinkage values being up to 40% higher than with 100% natural sand. These differences are related to the strength and the water absorption of the sands. The drying shrinkage was measured also in Mix3 which represent XC4 concrete exposition class at 30%, 50% and 70% substitution of natural sand by recycled sands The shrinkage values at 30% and 50% recycled sand are presented in Appendix A. While Figure (6-31) presents the values at 70% recycled sand for one year age. In Mix3 also increasing the substitution of natural sand with the different recycled sands from 50% to 70% increased the maximum shrinkage value from 23% to 41.2%, which ensure the similarity in shrinkage values and changing trend in both Mix1 and Mix3 at the different recycled sand amounts.

Chapter 6: Properties Of Concrete With Recycled Sands
79
-1,0
-0,8
-0,6
-0,4
-0,2
0,00 91 182 273 364
Concrete age, daySh
rinka
ge, m
m/m
. N.S
RC 1
RC 3
RC 4
RC 5
RC 7
RC 9
Figure (6-30): The drying shrinkage of Mix1 at substitution 70% of the natural sand by different recycled sands
-1,0
-0,8
-0,6
-0,4
-0,2
0,00 91 182 273 364
Concrete age, day
Shrin
kage
in m
m/m
:
N.S
RC 1
RC 3
RC 4
RC 5
RC 7
RC 9
Figure (6-31): The drying shrinkage of Mix3 at substitution 70% of the natural sand by different recycled sands Figure (6-32) illustrates the influence of the recycled sand content on the shrinkage values of Mix1 for different recycled sands at on year age. It shows that the shrinkage value increased as the amount of the recycled sand increased in approximately linear rates for recycled concrete sands RC 1 and RC 5 where using up to 70% from these sands caused increase in the shrinkage value less than 15% . For the other recycled sands RC3, RC4, RC7 and RC9, the

Chapter 6: Properties Of Concrete With Recycled Sands
80
shrinkage value increased linearly up to 50% recycled sand content and then increased with higher rates. The increase in the shrinkage values for these sands was less than 45% at 70% recycled sand content. The effect of the recycled sand content on the shrinkage value of Mix3 is shown in Appendix A, which was not different from Mix1.
-1,0
-0,9
-0,8
-0,7
-0,6
-0,5
-0,40 10 20 30 40 50 60 70 80
Recycled sand content, vol.% of total sand
Shrin
kage
, mm
/m .
RC 1
RC 3
RC 4
RC 5
RC 7
RC 9
Figure (6-32): Effect of recycled sand content on the shrinkage of Mix1 at one year age It can be concluded that the measured shrinkage values for all the investigated mixes with the different recycled sands were lass than 0,8 mm/m or 800x10-6 , which lies within the shrinkage strain rang of ordinary concrete 400x10-6 to 1000x10-6
[69] prepared with different aggregates, cement and w/c-ratios. This may be because the recycled sands were used with coarse aggregate and not together with recycled coarse materials like in most other research projects.
6-6 Concrete durability The durability of Portland cement concrete is defined as its ability to resist weathering action, chemical attack, abrasion or any other process of deterioration. EN 206-1 classifies the possible attacks and determines concrete exposition classes for every attack as the following:
- Corrosion of reinforcement through concrete carbonation with and without chloride influence (classes XC, XD and XS),
- Frost attack with and without de icing salt (classes XF), - Chemical attack (classes XA) and - Wear or abrasion due to normal using (classes XM).

Chapter 6: Properties Of Concrete With Recycled Sands
81
For each concrete class, EN 206 together with national standards like DIN 1045-1 for Germany defines also the design criteria (min compressive strength, min. cement content and max. w/c ratio etc) to be able to resist the expected attack or in other words to be durable. The structure of concrete is not absolutely dense. Especially the cement paste, which contains pores of different sizes. These pores allow the penetration of gases, water and chemical solutions into concrete by diffusion and capillary suction. The amounts and sizes of these pores depend on the w/c ratio and the packing density of the fine materials < 0.125 mm and < 0.25 mm. Due to the importance of durability and the expected effects of recycled sands on it, it was investigated for concrete with the recycled sands. The carbonation test was performed on Mix1 and Mix3 (exposition classes XC1 and XC4). The frost resistance test (CF-test) and frost with de-icing salt (CDF-test) were applied to the mixes of the exposition classes XF3 and XF4 respectively. In the following the results of these tests will be discussed: 6- 6-1 Carbonation of concrete In carbonation of concrete, the calcium hydroxide (Ca (OH)2) set free during the hydration of cement reacts with CO2 existing in air . In this reactions under release of water calcium carbonate (Ca CO3) forms, thus being practically limestone again. The carbonate formation may increase the density of concrete, however it decreases the pH value due to consume of the calcium hydroxide, which increase the possibility of steel corrosion. The carbonation process depends on the structural density and the moisture state of concrete. These two properties are affected by using the recycled aggregate, because the recycled aggregate is somewhat less dense than natural aggregate. On the other hand the hardened cement paste may become somewhat denser due to the “internal treatment” by the water added and soaked by the recycled aggregate during the pre-wetting. So, the carbonation of concrete produced with recycled sands was investigated in Mix1, Mix3 and Mix9. These mixes were produced with a replacement of 30%, 50% and 70% of the natural sand by the different recycled sands but in the following only some of the carbonation results will be discussed: Figure (6-33) shows the carbonation depths of Mix1, which represents XC1, for one year at 70% recycled sand. It indicates that the highest carbonation depth was found for concrete with RC 9 (recycled sand from lime-sand brick). This can be related to the low density or high porosity of this recycled sand which may enable CO2 to path easier into the concrete mix. The difference between RC 9 and the natural sand ranged from 0.75 mm at 30 day age to 1 mm at one year age, which means that the effect of the recycled sand on the concrete carbonation occurs mainly in the early age of concrete. For the other recycled sands, the

Chapter 6: Properties Of Concrete With Recycled Sands
82
increase in carbonation depths was 0.5 cm or less at one year age. These results present that the recycled sands as a replacement of natural sand in concrete had no significant effect on concrete carbonation of Mix1. The carbonation depths at 30% and 50% recycled sand illustrated that the amount of recycled sand had approximately no effect on concrete carbonation Appendix A.
012345678
0 91 182 273 364
Age, day
Car
bona
tion
dept
h, m
m .
NSRC 1RC 4RC 5RC 6RC 7RC 9
Figure (6-33): Carbonation of concrete Mix1 with natural and different recycled sands at 70 % natural sand replacement In Mix3, which represents XC4 with 16 mm maximum aggregate size the carbonation depths ranged from 5 to 6 mm at one year age, Figure (6-34). Compared to Mix1, the carbonation depths in Mix3 were one mm lower. That is related to the fact that the w/c ratio in Mix1 (0.66) is higher than that of Mix3 (0.58), which increase the porosity in Mix1. As in Mix1, the differences in carbonation depths between the varied sands reached 1 mm at 30 day age and stilled approximately constant after that. It is noticed that in Mix3 also the highest carbonation depths were registered for RC 9. The effect of the amount of recycled sand on the carbonation depth of Mix3 is illustrated in Figure (6-35). Replacements up to 70% of natural sand arose the carbonation depth by 0.5 cm or 10% for all recycled sands other than RC 9.

Chapter 6: Properties Of Concrete With Recycled Sands
83
012345678
0 91 182 273 364
Age, day
Car
bona
tion
dept
h, m
m . NS
RC 1RC 4RC 5RC 6RC 7RC 9
Figure (6-34): Carbonation of concrete Mix3 with natural and different recycled sands at 70 % natural sand replacement
012345678
0 10 20 30 40 50 60 70 80
Recycled sand content, vol.% of total sand
Car
bona
tion
dept
h, m
m . RC 1
RC 4
RC 5
RC 6
RC 7
RC 9
Figure (6-35). Effect of recycled sand content on the carbonation depth of Mix3 at 365 days concrete age in 20° C and 65% r.h. The measured carbonation depths in Mix9 (mix gradation AB32) with the different recycled sands show that the maximum aggregate size of concrete had no effect on concrete carbonation. Appendix A. 6-6-2 Frost resistance As the water in moist concrete freezes, it produces osmotic and hydraulic pressures in the capillary pores of the cement paste and - if applying - the aggregate. If the pressure exceeds

Chapter 6: Properties Of Concrete With Recycled Sands
84
the tensile strength of the paste or aggregate, the cavity will dilate and rupture. The accumulative effect of successive freeze-thaw cycles and disruption of paste and aggregate eventually cause significant expansion and deterioration of the concrete. Deterioration is visible in form of cracking and scaling. Hydraulic pressures are caused by the 9% expansion of water upon freezing, in which growing ice crystals displace unfrozen water and hydraulic pressures result as freezing progress. Osmotic pressures develop from differential concentrations of alkali solutions in the cement paste. As ice develops, it creates an adjacent high alkali solution. Through the mechanism of osmosis, draws water from lower alkali solutions in the pore. This osmotic transfer of water continues until equilibrium in the fluids alkali concentration is achieved. Osmotic pressure is consider a minor factor, if present at all, in aggregate frost action, whereas it may be dominant in certain cement pastes. Osmotic pressures are considered to be a major factor in salt scaling. Also frost damages of concrete are related to the macroscopic stresses due to different temperature deformation as well as the difference in temperature expansion coefficients of hardened cement paste and ice. the requirements of the concrete exposition classes from XF1 to XF4 are determined in the standard EN 206-1 to resist the frost attack with and without de-icing salt in different water saturation conditions. The two classes XF3 and XF4 which represent high saturation condition (the worst case) without de-icing salt (XF3) and with de-icing salt (XF4) were selected for investigation at using the different recycled sands. 6-5-2-1 Frost de-icing salt resistance The frost de-icing salt resistance of concrete was investigated for Mix6 according to RILEM technical comitte TC 117-FDC by Setzer and Hartmann, [64]. This procedure is known as CDF test (Capillary suction of Deicing chemicals and Freeze-thaw test). The amount of weight loss (scaling) per unit surface area after 28 well defined freezing and thawing cycles in the presence of decing salt is measured and recorded as the frost de-icing salt resistance. The used test liquid was a solution of 3 m.% of sodium chloride and 97 m. % demineralised water. Firstly to separate the effect of substitution of natural sand by the different recycled sand, no air-entraining admixture were used. In such a case the test gives just the relation between different concretes no absolute values. Figure (6-36) shows the weight loss for concrete at a replacement of 30% by the different recycled sands. The weight loss of concrete with natural and all the recycled sands exceeded as expected the maximum limit of 1500 g/m². Although only 30% of the natural sand had been replaced, the sand type had a considerable effect on the frost-deicing resistance where the weight loss values ranged from 1637 g/m² to 3728,5

Chapter 6: Properties Of Concrete With Recycled Sands
85
g/m². It is also noticed that besides RC9, RC 10 (from lime - sand brick) and LQ2 (contains lime sand), the recycled sands surprisingly improved the frost de-icing resistance. It is known that the frost resistance of concrete is affected in large extent by its porosity, the presence of water within it and the environmental conditions, so the effect of recycled aggregate on the frost de-icing resistance of concrete take place in two different directions. Where the recycled aggregate increase the amount of water within the concrete due to pre-wetting water which decrease the resistance and on the other hand due to its irregular shape it can increase the amount and size of the pores in the concrete which improve the frost de-icing resistance especially when no air-entraining admixtures are used. For the recycled sands RC 1 to RC 7 the improvement in frost de-icing resistance due to “internal curing” may have been more important than disadvantages caused by the higher porosity of the particles. For the three sands that contain limestone significantly the highest scaling was measured. During the capillary suction period (7 days ), the weight of the specimen increased due to absorption of test solution. The average weight change of the specimens was measured as shown in Figure (6-37). It indicates that the weight changes of concrete with all recycled sands were less than that of natural sand. It is also noticed the wide variation in the weight change values for the different recycled sands where it ranged from 0.13 m.% (RC 7) to 0.64 m.% (RC4), which illustrate the effect of the recycled sand type or its properties on the structure of concrete matrix.
0500
1000150020002500300035004000
NS RC 1 RC 2 RC 3 RC 4 RC 5 RC 6 RC 7 RC 9 RC10
LQ 2
Sand type
Mas
s los
s, g/
m²
Figure (6- 36): Effect of sand type on weight loss after 28 cycle of freeze thaw of Mix6 without air-entraining admixture

Chapter 6: Properties Of Concrete With Recycled Sands
86
0,0
0,2
0,4
0,6
0,8
1,0
1,2
1,4
NS RC 1 RC 2 RC 3 RC 4 RC 5 RC 6 RC 7 RC 9 RC10
LQ 2
Sand type
Mas
s cha
nge,
m.%
.
Figure (6- 37): Effect of sand type on weight change after 28 cycle of freeze thaw of Mix6 without air-entraining admixture To investigate the actual possibility of using the recycled sands in concrete exposed to frost de-icing attack, Mix6 was reproduced with air-entraining admixture in accordance with the standard EN 204 / DIN 1045-2. To achieve 5% air voids in fresh concrete as required for XF4 concrete class in DIN EN 206 and a10 = 44 cm spread, air- entraining admixture and superplasticizer were used in amounts presented in Table (6-1). It is noticed that the amounts of both air-entraining admixture and superplasticizer increased as the water absorption of recycled sand increased. Table (6- 1): Amounts of air-entraining and superplasticizer of Mix6
Sand type Air- entraining, m.% of cement
Superplacticizer, m.% of cement
NS 0,03 0,7
RC 5 0,04 1.0
RC 7 0,05 1,3
RC 9 0,05 1,3
The weight loss values at using the air-entraining admixture decreased in a large extent for concrete with natural sand and all the recycled sands, Figure (6-38). At a replacement of 30% and 50% of natural sand by the different recycled sands, the weight loss values were still less than the maximum limit (1500 g/m²). It may be not exceed the maximum limit at even replacement 100% of natural sand by the recycled sands RC 1, RC 5 and RC 7. The highest

Chapter 6: Properties Of Concrete With Recycled Sands
87
weight loss occurred in concrete with RC 9 where 50% of this sand increased the weight loss to 988,6 g/m². As shown in Figure (6-39), the weight changes in suction stage and the differences in weight changes (solution suction) between the different sands were low and negligible due to the pores produced by the air entraining agent which reduce the capillary action.
0
200
400
600
800
1000
1200
0 10 20 30 40 50 60 70Recycled sand content, vol.% of total sand
Mas
s los
s, g/
m²
.
RC 1RC 5RC 7RC 9
Figure (6-38): Effect of sand type on weight loss after 28 cycle of freeze thaw for Mix6 using air-entraining admixture
0,0
0,2
0,4
0,6
0,8
1,0
1,2
1,4
0 10 20 30 40 50 60 70
Reycled sand content, vol.% of total sand
Mas
s cah
nge,
m.%
.
RC 1RC 5RC 7RC 9
Figure (6-39): Effect of sand type and content on weight change after 28 cycle of freeze thaw for Mix6 using air-entraining admixture

Chapter 6: Properties Of Concrete With Recycled Sands
88
6-6-2-2 Frost resistance without de-icing salt To the frost resistance was investigated for Mix5, which represent the concrete exposition class XF3. As shown in Figure (6-40), the recycled sands had a considerable effect on the frost resistance. A replacement of 70% increased the weight loss from 60% to 143% with respect to the reference mix with natural sand, but the weight loss was still relatively small with absolute values of up to 60 g/m2. Depending on the frost resistance of the concrete, the recycled sands may be classified into 2 groups, the first one includes the recycled sands from crushed concrete RC 1 and RC 5, which caused the lowest change in frost resistance as in most other investigated concrete properties while in the second group (RC 3, RC 4, RC 7 and RC 9), the weight loss was approximately doubled or even higher.
010203040506070
N.S RC 1 RC 3 RC 4 RC 5 RC 7 RC 9Sand type
Mas
s los
s, g/
m²
.
Figure (6-40): Effect of sand type on weight loss after 28 cycle of freeze thaw for Mix5 at using 70% recycled sand Figure (6-41) shows that with up to 30% recycled sand the frost resistance was not affected or even marginally improved by using the recycled sands. Increase of the recycled sand content than 30% increased the weight loss linearly with higher rates.

Chapter 6: Properties Of Concrete With Recycled Sands
89
0
10
20
30
40
50
60
70
0 10 20 30 40 50 60 70 80 90 100
Recycled sand content, vol. % of total sand
Mas
s los
s, g/
m²
.RC 1RC 3RC 4RC 5RC 7RC 9
Figure (6-41): Effect of sand type and content on weight loss after 28 cycle of freezing thawing and for Mix5 The average change in the specimens weight during the seven days suction stage was measured, Figure (6-42). It can be noticed that there is a general relation between the amount of water absorbed and the weight loss due to the freezing and thawing.
0,40,50,60,70,80,91,01,11,2
0 10 20 30 40 50 60 70 80 90 100
Recycled sand content, vol.% of total sand
Mas
s cha
nge,
m.%
.
RC 1RC 3RC 4RC 5RC 7RC 9
Figure (6-44): Effect of sand type and content on weight change after 28 cycle of freeze thaw for Mix5

Chapter 6: Properties Of Concrete With Recycled Sands
90
6-7 Effect of recycled sands on properties of concrete produced with recycled concrete as coarse aggregate.
For the objective mentioned in chapter one, the main part of this research was performed using concrete or asphalt concrete produced with natural coarse aggregates and recycled sands as a partial or full substitution of natural sand. To determine in which extent the results obtained will be affected if a recycled coarse aggregate is used, Mix3, which represent the concrete exposition class XC4 was produced again with 0 %, 30%, 50% and 70% recycled sands but with a replacement of 50% and 100% of the natural coarse aggregate by recycled concrete aggregate. No mixes were produced with 100% recycled sands because of the expected high effect on the concrete properties. Another objective of this part of investigation is to evaluate the behaviour of some recycled sands which were not used before with or without recycled coarse aggregate such as the pre-sieved sands RC 3 and RC 6 and recycled sand from crushed lime-sand brick RC 9. Only one type of recycled coarse aggregate was used. It was produced by casting concrete cubes and crushing it in the laboratory. 6-7-1 Compressive strength Figure (6-43) illustrates that a replacement of 70% of the natural sand by RC 1 reduced the compressive strength from 41.4 N/mm² to 39.3 N/mm² at using original coarse aggregate. The same amount of RC 1 led to a decrease in compressive strength from 38.4 to 35.2 and from 36.3 to 31.8 N/mm² at using 50% and 100% recycled coarse aggregate respectively. This means that the effect of the same amount of RC 1 on the compressive strength significantly increased when recycled coarse aggregate was used. To explain this effect, a reduction in compressive strength of 5 N/mm² is assumed to be accepted as a maximum deviation from the reference mix. The highest amount of recycled sands that can be used in concrete was calculated depending on the previous assumption. It was found that up to 100% of RC 1 can be used together with natural coarse aggregate while only 50% of RC 1 will keep the strength within the limit at using 50% recycled coarse aggregate. If 100 % recycled coarse aggregate is used, only natural sand should be used to do not exceed the determined limit of reduction. This may be the cause of the recommendation to avoid the use of recycled sand in recycled aggregate concrete because in most previous researches (35, 36, 40 etc.) the effect of recycled sands was investigated at 100% recycled coarse aggregate.

Chapter 6: Properties Of Concrete With Recycled Sands
91
262830323436384042
0 10 20 30 40 50 60 70 80 90 100Recycled sand content, vol.% of total sand
Com
pres
sive
stre
ngth
, N/m
m² .
0% RC-C.A
50% RC-C.A100% RC-
Figure (6-43): Compressive strength of Mix3 with RC 1 and with recycled concrete coarse aggregate Figure (6-44) presents the compressive strength values for concretes with RC 9 while those of the other recycled sands are presented in Appendix A. The reduction in concrete compressive strength due to using RC9 is similar for 0% , 50% and 100% recycled concrete coarse aggregate. A replacement of 70% of the natural sand by RC 9 resulted in a approximately 8 N/mm² reduction in compressive strength. This may be because of the large difference in strength between RC 9 and both the natural aggregates and the recycled concrete coarse aggregate so that it controls the failure of concrete under the comparison force. The high reduction in compressive strength at using RC 9 will limit the amount of this recycling sand that can be allowed to be use in concrete with recycled coarse aggregate to about 30%.
26
30
34
38
42
0 10 20 30 40 50 60 70 80 90 100Recycled sand content, vol.% of total sand
Com
pres
sive
stre
ngth
, N/m
m² .
0% RC- C.A
50% RC- C.A
100% RC-
Figure (6-44): Compressive strength of Mix3 with RC 9 and recycled concrete coarse aggregate

Chapter 6: Properties Of Concrete With Recycled Sands
92
6-7-2 Dynamical modulus of elasticity The dynamical modulus of elasticity was measured for Mix3 with recycled sands and recycled concrete coarse aggregate. The modulus of elasticity decreased digressively when the amount of RC 1 was increased as shown in Figure (6-45). It is noticed that the effect of replacement of the natural sand by RC 1 on the dynamical modulus of elasticity was significantly higher than the effect of replacement the natural coarse aggregate by the recycled concrete coarse aggregate. This may be because in all conditions the modulus of elasticity of coarse aggregates (recycled or natural) is higher than the modulus of elasticity of the cement matrix. So the modulus of elasticity of cement matrix, which is affected by using the recycled sands controls the reduction in the modulus of elasticity of the concrete matrix.
26
28
30
32
34
36
38
40
42
0 10 20 30 40 50 60 70 80 90 100
Recycled sand content, vol.% of total sand
Dyn
. mod
ulus
of e
last
icity
,10
³ N/m
m²
0% RC-C.A50% RC C.A100% RC C.A
Figure (6-45): Dynamical modulus of elasticity of Mix3 with RC 1 and recycled concrete coarse aggregate For concrete with other recycled sands RC 3, RC 5, RC 7 and RC 9 similar trends were found with slight difference in the reduction values. Figure (6-46) shows the modulus of elasticity of concretes with RC 9 which also caused the highest reduction in concrete modulus of elasticity. The values of the other recycled sands are documented in Appendix A. Replacement 70% of natural sand with RC 9 at 100% recycled coarse aggregate reduced 30% of the modulus of elasticity while the minimum reduction was 25% at using RC 5.

Chapter 6: Properties Of Concrete With Recycled Sands
93
2628
303234
3638
4042
0 10 20 30 40 50 60 70 80 90 100
Recycled sand content, vol. % of total sand
Dyn
. mod
ulus
of e
last
icity
,10
³ N/m
m²
0% RC-C.A50% RC C.A100% RC C.A
Figure (6-46): Dynamical modulus of elasticity of Mix3 with RC 9 and recycled concrete coarse aggregate 6-7-3 Carbonation As a measure for the durability of Mix3, the carbonation depth was investigated. The carbonation depth at 365 day age increased from 5 mm to 5.5 mm when substituting 70% of the natural sand by RC 1 and using natural coarse aggregate while it increased from 5.5 to 6.5 mm and from 6 to 7 mm at using 50% and 100% recycled coarse aggregate, Figure (6-47). The relations between the recycled sand content and the carbonation depth are approximately similar for all the investigated recycled sands and can be considered linear relations with low difference in the values. The maximum of carbonation depth (about 8 mm) at one year age was measured in concrete with 70% of RC 9 and 100% recycled coarse aggregate, see Figure (6-48).

Chapter 6: Properties Of Concrete With Recycled Sands
94
0
1
2
3
4
5
6
7
8
0 10 20 30 40 50 60 70 80 90 100
Recycled sand content, vol.% of total sand
Car
bona
tion
dept
h, m
m .
0% C.A50% C.A100% C.A
Figure (6-47): Carbonation depth of Mix3 with RC 1 and recycled concrete coarse aggregate at 365 day age
0
1
2
3
4
5
6
7
8
0 10 20 30 40 50 60 70 80 90 100
Recycled sand content, vol.% of total sand
Car
bona
tion
dept
h, m
m .
.
0% C.A50% C.A100% C.A
Figure (6-48): Carbonation depth of Mix3 with RC 9 and recycled concrete coarse aggregate at 365 day age

Chapter 7: Hot Bituminous Mixtures With recycled Sands
95
7- HOT BITUMINOUS MIXTURES WITH RECYCLED SANDS 7-1 General The possibility of using the different recycled sands in bituminous mixtures was examined in this research work The results of Marshall design performed on the bituminous mixtures having the different recycled sands are presented and analyzed in this chapter. Six recycled sands were selected for partial or full replacement of the natural sand in the bituminous mixtures, these sands included RC 1, RC 2, RC 3, RC 5, RC 7 and RC 9, which represent the different building materials, see Table (3-1). The amounts of the recycled sands ranged from 0% to 21% by mass of the total aggregates, which represent 0% to 100% by mass of basalt sand in basalt mixes and 0% to 70% of natural sand in limestone mixes as in Table (3-3). The effect of the parameters presented in Table (7-1) on the properties of the bituminous mixtures listed in section 3-5-4-1 was investigated. Table (7-1): The investigated parameters for hot bituminous mixtures with recycled sands
Parameter The variables of each parameter Number of variables
Recycled sand type RC 1, RC 2, RC 3, RC 5, RC 7 and RC 9 6
Recycled sand content 0.0% 9%, 15% and 21% 4
Type of coarse aggregate Basalt and limestone 2
Mixing temperature 135°C, 150°C and 165°C 3
Type of binder (Bitumen grade) Bit. 70/100 and Bit. 50/70 2
As a measurement of durability or resistance to field conditions, the loss of stability test (section 3-5-4-2) under water action is conducted on bituminous mixtures produced with the different recycled sands. The results of this test is presented and analyzed also in this chapter. Before going in results analysis of Bituminous mixtures with natural and recycled sands, some differences in the concept of mix design between the concrete (cement concrete) and bituminous mixtures should be illustrated. The first one is that the proportional of the different components in concrete are volumetric while in bituminous mixtures the mass proportional is used although the used materials are of different densities. Also the replacement of natural sand with recycled sands in this research was by mass. Secondly, in concrete the binder content (cement), w/c ratio and air voids are defined and then the amount of aggregates is

Chapter 7: Hot Bituminous Mixtures With recycled Sands
96
calculated while in bituminous mixtures the different components of aggregates are blended by mass to achieve the required aggregate gradation and then the optimum binder content (bitumen) is determined for this aggregate mixture in the laboratory using the design method (Marshall method in this research). There are different chemical reactions between the materials of the concrete such as hydration of cement and alkali-reaction which produce new components with new properties while there no chemical reactions in bituminous mixtures where the bitumen bonds the different aggregate components together. For the same aggregate gradation, more aggregate sizes are used for bituminous mixtures than these for concrete while 6 sizes were used to produce 0/16 bituminous mixtures (0/0.09 , 0/2, 2/5, 5/8, 8/11 and 11/16) in compare to 3 sizes for 0/16 concrete (0/2, 2/8 and 8/16 mm). This increases the control on the mix gradation and the other aggregate properties of bituminous mixtures. The aggregates in hot bituminous mixtures are heated at more than 150°C and filtered before mixing with bitumen, which is considered a treatment of the recycled aggregates and removes some of the impurities. Although the proportion of aggregates in bituminous mixtures is in mass, the volumetric proportional is calculated to check some volumetric properties such as the air voids in the mix It will be used also to explain the effect of using the recycled sands on the mix properties. Figure (7-1) shows how the weights and volumes of the different components take place in the bituminous mixtures
eff. bitumen
abs. bitumen
Mineral aggregate
Bitumen
Air Va
VebVma
Vcm
Va
Vab
Figure (7-1): Representation of weights and volumes in a compacted asphalt specimen

Chapter 7: Hot Bituminous Mixtures With recycled Sands
97
where Va = Volume of air voids Veb = Volume of effective bitumen Vab = Volume of absorbed bitumen Vma = Volume of voids in mineral aggregate = Va + Veb Vag = Volume of mineral aggregate (by bulk density of aggregate particles) Vcm = Bulk volume of compacted bituminous mixtures = Vag + Vma From this representation the weight of the specimen equal to the weights of aggregate and bitumen while the volume equal the volume of aggregate, effective bitumen and air where the volume of the absorbed bitumen don’t take place in the total volume of the mix. On basis of Vcm = 100 units (cm³ for example ) the volumes of air and voids in mineral aggregates become: AV = Air voids (Vol. % of mix) VMA = Voids in mineral aggregate (vol. % of Mix) These properties are two of the Marshall properties of bituminous mixtures and are used as a design criteria. The effect of type and amount of the recycled sands on the properties of bituminous mixtures were investigated for mixes produced with basalt as natural aggregates, bitumen 70/100 as binder and mixing temperature equal to 135°C, which denoted as basalt bituminous mixtures and then the influence of the other variables in Table (7-1) was studied.
7-2 Effect of recycled sand type and amount on the bituminous mixtures properties at different binder contents
The results derived from Marshall test were plotted in diagrams show the relations between the binder contents and the properties of Bituminous mixtures. Figures (B-1) to (B-36) in Appendix E present the Marshall curves of the investigated hot Bituminous mixtures. At the first, these diagrams were used in this section to investigate the behaviour of bituminous mixtures produced with the different recycled sands and different binder contents then it will be used to determine the values of OBC and the mix properties at this values, which will be discussed in section 7-3.

Chapter 7: Hot Bituminous Mixtures With recycled Sands
98
The following sub sections present the effect of type and amount of the recycled sands on the properties of the bituminous mixtures for basalt bituminous mixtures and mixes with the other variables in Table (7-1). 7-2-1 Basalt bituminous mixtures Figure (7-2) shows the relation between the binder contents and Marshall properties of basalt mixes with 0.0 %, 9% and 21% RC 1. It shows that replacement the basalt sand by RC1 reduced the mix density at all values of binder content, Figure (7-2-a). The values of reduction in mix density or the quantitative differences in the other mix properties are not the objective of this section (7-2) because the mixes were produced with a wide range of binder contents to investigate the behaviour of the bituminous mixtures with recycled sands while the quantitative effect will evaluated at the optimum binder content of each mix (section 7-3) to be correlated to the recycled sands characteristics and to be used in classifying these sands. This can be considered an advantage of using the recycled sands or the recycled aggregates in general because producing lighter bituminous mixtures has a major cost implications on most of the process of manufacturing asphalt for road construction. The saving would be in the cost of mixing, transporting and laying. The reduction in mix density is the resultant of the differences in sand density, gradation, particle shape and surface textures of basalt sand and RC 1. The influence of sand gradation, particle shape and surface textures on mix density is deduced from their effect on the voids in mineral aggregates (VMA), which is one of Marshall properties. The lower density of RC 1 relative to the basalt sand (2.299 and 2.985 g/cm³) considerably reduced the mix density. It is noticed also that increasing the amount of RC 1 increased the binder content that achieved the maximum mix density. This because increasing the amount of RC 1 increased the absorbed asphalt and then increased the required binder content to offer a sufficient effective bitumen for suiTable workability and compaction. The absorbed bitumen as a mass percentage from the aggregate weights was measured for the basalt aggregate mixtures with basalt sand and with 9% and 21% of the different recycled sands , Figure (7-3). Replacement the basalt sand by RC1 increased the mix stability at all values of binder content as shown in Figure (7-2-b). Using 9% and 21% of RC 1 increased the stability at 4.5 binder content by 12.3 and 17.7 %. The stability is dependent upon both internal friction and cohesion of the mix. The internal friction is a combination of the frictional and interlocking resistances of aggregate in the mix and depends on particle shape, surface textures gradation of aggregates and quantity of bitumen. Using RC 1 may increased the internal friction

Chapter 7: Hot Bituminous Mixtures With recycled Sands
99
because of the high porosity and roughness of the surface as well as it decreased the values of VMA, which increases the area of particle contact. Also using RC 1 decreased the effective asphalt in the mix which increased the stability. The values of stability illustrate also that the maximum stability were achieved at the same binder content for the different amounts of RC Mix2bituminous mixtures1. The flow values are the ultimate deformation of the specimen under the failure load. The flow values versus the binder contents are potted in Figure (7-2-d). It illustrates that the increase in flow is lower for bituminous mixtures with RC 1 (9% and 21%) than that with basalt sand. This means that the RC 1 bituminous mixtures deforms in a slower rate under the load. This is because of the higher porosity, roughness and irregular shape of RC 1 as well as the higher aggregate volume with respect to the effective asphalt in the mix.
2,402,442,482,522,562,602,64
3 4 5 6 7Binder content, m.%
Mix
den
sity
, g/c
m³
. NS9 % RC121% RC1
7-2-a
6789
10111213
3 4 5 6 7Binder content, m.%
Stab
ility
, KN
NS9 % RC121% RC1
7-2-b Figure (7-2): Effect of amount of RC 1 on Marshall properties of basalt asphalt mixes with different binder contents

Chapter 7: Hot Bituminous Mixtures With recycled Sands
100
0
2
4
6
8
10
3 4 5 6 7Binder content, m.%
AV
, vol
.%
.NS9 % RC121% RC1
7-2-c
0
4
8
12
3 4 5 6 7Binder content, m.%
Flow
, mm
.
NS9 % RC121% RC1
7-2-d
12
14
16
18
3 4 5 6 7Binder content, m.%
VM
A, v
ol.%
NS9 % RC121% RC1
7-2-e Figure (7-2) cont.: Effect of amount of RC 1 on Marshall properties of basalt bituminous mixtures with different binder contents

Chapter 7: Hot Bituminous Mixtures With recycled Sands
101
0,0
0,5
1,0
1,5
2,0
2,5
3,0
BS RC1 RC2 RC3 RC5 RC7 RC9Sand type
Abs
orbe
d bi
tum
em, m
.% .
of
agg
rega
te
.Basalt sand 9% RC-sand 21 RC-sand
Figure (7-3): The absorbed bitumen as mass percentage of aggregate for basalt mixtures
with basalt sand and with 9% and 21% of the different recycled sands The relations between the binder content and both air voids (AV) and the voids in mineral aggregates (VMA) are discussed together because they are related to each other and depend on the same properties. Figure (7-2-c and e) shows that increasing the amount of RC1 increased the values of AV and decreased the VMA values. The differences in AV values were not significant at 9% RC 1 and were about 2% for the mix with 21% RC 1 until the binder content reached 5.5% where the differences can be neglected while the VMA values decreased at all binder contents other than 4% and 4.5 of mix with 21% RC 1. To explain all these results, the volumetric proportion of the three mixes according to the representations in Figure (7-1) were calculated. As mentioned before, the basalt sand was replaced by equal weight of RC 1 which means that the volume of sand in the mix increased because the density of RC1 is lower than that of basalt sand. The increase in sand volume may increase the volume of compacted mix with the same value keeping the VMA constant or it , as a fine aggregate takes place between the coarse aggregate reducing the VMA and keeping the volume of the mix constant or this increase is divided between the two cases. Figure (7-4) shows that the aggregate as a volume percentage of the mix increased as the amount of RC1 increased which means that the increase in sand volume occupied a part of the VMA , which explain the reduction in VMA values at using the recycled sand RC 1 while replacement the basalt sand by RC 1 increased the absorbed Bitumen and consequently reduced the effective Bitumen at the same binder content, see Figure (7-5). If the increase in aggregate volume equal to the decrease in the volume effective asphalt the values of AV will not changed as approximately in the comparison of Basalt sand and 9% RC 1 or 21 % RC 1 for binder content equal or more than 5.5%. For 21% RC 1 at binder content from 4% to 5 %, the

Chapter 7: Hot Bituminous Mixtures With recycled Sands
102
effective bitumen values are relatively low, which decreased the workability of bituminous mixtures and increased the AV values. It can be concluded that replacement the basalt sand by equal weight of RC 1 decreased the values of VMA and the effective bitumen in the mix keeping the AV values approximately similar if the suitable volumes of effective bitumen. In the specification, the minimum values of VMA are determined for the different maximum aggregate size of the aggregate gradation to offer an enough voids for the effective bitumen and for the required AV in the mix which are important for the stability and durability of the mix.
80
82
84
86
88
90
92
3 4 5 6 7
Binder content, m.%
Agg
rega
te in
the
mix
, vol
.%
.
BS9% RC121 RC1
Figure (7-4): Effect of amount of recycled sand on the aggregate volume of basalt mixes with RC 1
6
8
10
12
14
16
18
3 4 5 6 7Binder content, m.%
Effe
ctiv
e bi
tum
en, v
ol.%
. BS9% RC121 RC1
Figure (7-5): Effect of amount of recycled sand on the volume of effective bitumen of basalt mixes with RC 1

Chapter 7: Hot Bituminous Mixtures With recycled Sands
103
In Marshall properties the stability and flow values are measured to represent the load and deformation at failure. These values were used with the dimensions of the specimen to describe the relation between the stress and strain of the Bituminous mixtures with values similar to the modulus of elasticity of concrete. The derived relation by Brown and Cooper [70] is defined as Marshall stiffness and calculated using the following equation: Stability Flow Stability MS = = d × t d Flow × t where : MS = Marshall mix stiffness d = Specimen diameter t = Specimen thikness As shown in Figure (7-6), the values of Marshall stiffness for basalt mixes with RC1 increased considerably as the amount of RC 1 in the mix increased all binder contents. This is due to the reduction in the effective bitumen and increasing the aggregate volume in the mix at replacement the basalt sand by RC 1 as well as the higher roughness and irregularity of RC 1.
0
20
40
60
80
100
3,0 4,0 5,0 6,0 7,0Binder content, m.%
Mar
shal
l stif
fnes
s, N
/mm
² .
NS
9 % RC1
21% RC1
Figure (7-6): The relations between the stiffness of basalt bituminous mixtures and the binder contents for mixes with basalt sand and RC 1
d
t
Flow

Chapter 7: Hot Bituminous Mixtures With recycled Sands
104
The previous relations between the binder content and the different properties of the bituminous mixtures were derived for basalt mixes with the other recycled sands RC 2, RC 3, RC 5, RC 7 and RC 9. The influence of these sands on the mix density, mix stability and air voids, which are used to calculate the optimum binder content, were presented here while all other properties are presented in Appendix B. Figure (7-7) shows that replacing the basalt sand by RC2 had negligible influence on the binder content that achieved the maximum density while the values of density decreased due to the difference in the densities of basalt sand and RC 2. Also using RC 2 approximately did not affect the stability values or the binder content that achieved the maximum stability. The considerable effect of using RC 2 was found for the values of AV where increasing the amounts of RC 2 in the mix decreased the AV values. The differences in AV values between basalt sand, 9% RC 2 and 21% RC 2 reduced at the higher binder contents. These results can be related to that the recycled sand RC 2 is consists of about 70% concrete and 30% bituminous mixtures, which means that this sand contains an amount of bitumen from the original bituminous mixtures mix as well as an amount of natural aggregate without considerable change in its characteristics. The old bitumen attains some of its characteristics in the new mix and increase the effective bitumen or substitute a part the absorbed bitumen by the recycled concrete. Also the part of recycled sand from bituminous mixtures in this sand decreased the differences in surface textures and particle shape between it and the basalt sand, which eliminated the influence on the properties of bituminous mixtures where the S-value of RC 2 is 1.16 in compare to 1.21 and 1.18 for RC 1 and basalt sand respectively . The values of the other properties illustrated that replacement the basalt sand with RC 2 increased the flow values (21% RC2 increased the flow values by about 0.5 cm to 1 cm ) and considerably reduced VMA values. The differences in Marshall stiffness was not significant for binder content more than 5 %. The relations between the binder content and properties of bituminous mixtures with RC 3 are presented in Figure (7-8). The recycled sand RC 3 has the highest density and lowest water absorption of the different recycled sands and consequently the lowest absorbed bitumen as in Figure (7-3). The relatively high density of RC 3 decreased the reduction in the mix density in compare to the mix with the other recycled sands while the low bitumen absorbed led to that the optimum density was achieved at the same binder content (5%) for basalt sand, 9% and 21% RC 3. On the other hand, the stability values reduced especially at replacement all the basalt sand with RC3 (21% RC 3) because of the low porosity and roughness of RC 3, which decreased the internal friction of the aggregate mixture. Using RC 3 also reduced the AV values by about 1% at the binder contents up to 5% because of the increase in sand volume in the mix, which decreased the VMA values and consequently the AV values.

Chapter 7: Hot Bituminous Mixtures With recycled Sands
105
2,40
2,44
2,48
2,52
2,56
2,60
2,64
3 4 5 6 7Binder content (m. %)
Mix
den
sity
, g/c
m³
. NS9 % RC221% RC2
7-7-a
56789
1011
3 4 5 6 7Binder content, m.%
Stab
ility
, KN
.
NS9 % RC221% RC2
7-7-b
0
2
4
6
8
10
3 4 5 6 7Binder content, m.%
AV
, vol
.%
.
NS9 % RC221% RC2
7-7-c Figure (7-7): Effect of amount of RC 2 on Marshall properties of basalt asphalt mixes with different binder contents

Chapter 7: Hot Bituminous Mixtures With recycled Sands
106
2,402,442,482,522,562,602,64
3 4 5 6 7Binder content, m.%
Mix
den
sity
, g/c
m³
. NS9 % RC321% RC3
7-8-a
5
6
7
8
9
10
11
3 4 5 6 7Binder content, m.%
Stab
ility
, KN
.
NS9 % RC321% RC3
7-8-b
0
2
4
6
8
10
3 4 5 6 7Binder content, m.%
AV
, vol
.%
.
NS9 % RC321% RC3
Figure (7-8): Effect of amount of RC 3 on Marshall properties of basalt asphalt mixes with different binder contents
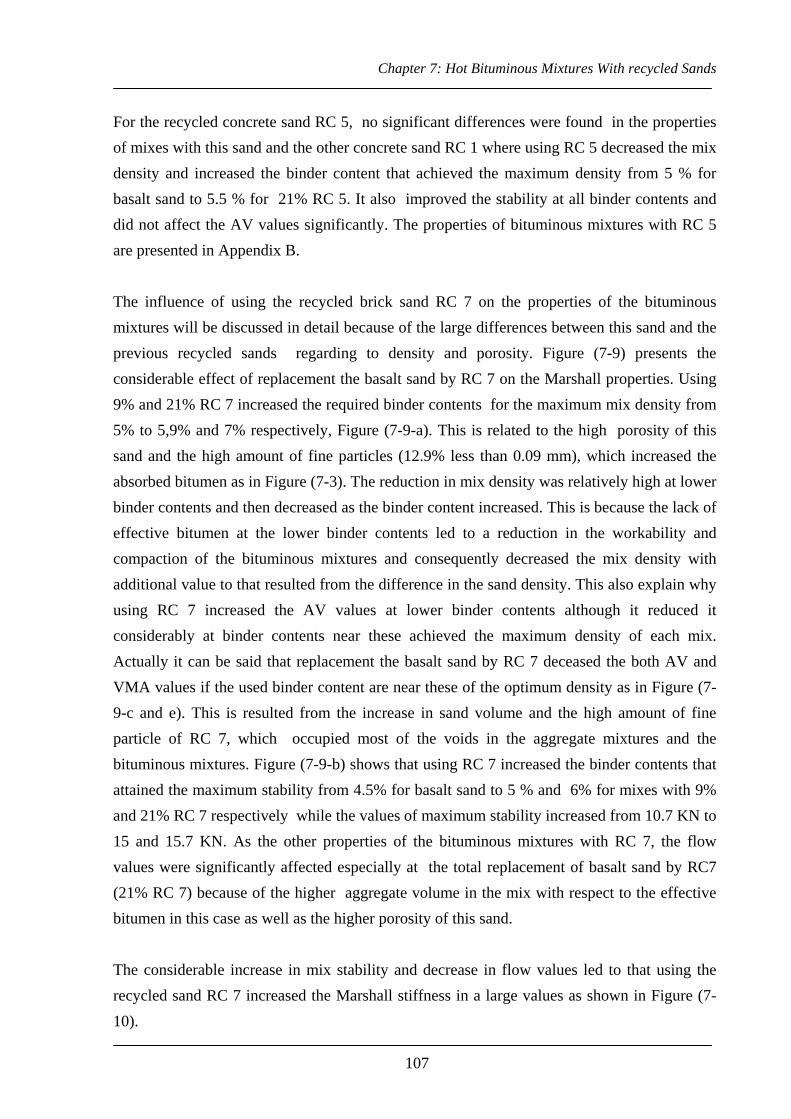
Chapter 7: Hot Bituminous Mixtures With recycled Sands
107
For the recycled concrete sand RC 5, no significant differences were found in the properties of mixes with this sand and the other concrete sand RC 1 where using RC 5 decreased the mix density and increased the binder content that achieved the maximum density from 5 % for basalt sand to 5.5 % for 21% RC 5. It also improved the stability at all binder contents and did not affect the AV values significantly. The properties of bituminous mixtures with RC 5 are presented in Appendix B. The influence of using the recycled brick sand RC 7 on the properties of the bituminous mixtures will be discussed in detail because of the large differences between this sand and the previous recycled sands regarding to density and porosity. Figure (7-9) presents the considerable effect of replacement the basalt sand by RC 7 on the Marshall properties. Using 9% and 21% RC 7 increased the required binder contents for the maximum mix density from 5% to 5,9% and 7% respectively, Figure (7-9-a). This is related to the high porosity of this sand and the high amount of fine particles (12.9% less than 0.09 mm), which increased the absorbed bitumen as in Figure (7-3). The reduction in mix density was relatively high at lower binder contents and then decreased as the binder content increased. This is because the lack of effective bitumen at the lower binder contents led to a reduction in the workability and compaction of the bituminous mixtures and consequently decreased the mix density with additional value to that resulted from the difference in the sand density. This also explain why using RC 7 increased the AV values at lower binder contents although it reduced it considerably at binder contents near these achieved the maximum density of each mix. Actually it can be said that replacement the basalt sand by RC 7 deceased the both AV and VMA values if the used binder content are near these of the optimum density as in Figure (7-9-c and e). This is resulted from the increase in sand volume and the high amount of fine particle of RC 7, which occupied most of the voids in the aggregate mixtures and the bituminous mixtures. Figure (7-9-b) shows that using RC 7 increased the binder contents that attained the maximum stability from 4.5% for basalt sand to 5 % and 6% for mixes with 9% and 21% RC 7 respectively while the values of maximum stability increased from 10.7 KN to 15 and 15.7 KN. As the other properties of the bituminous mixtures with RC 7, the flow values were significantly affected especially at the total replacement of basalt sand by RC7 (21% RC 7) because of the higher aggregate volume in the mix with respect to the effective bitumen in this case as well as the higher porosity of this sand. The considerable increase in mix stability and decrease in flow values led to that using the recycled sand RC 7 increased the Marshall stiffness in a large values as shown in Figure (7-10).

Chapter 7: Hot Bituminous Mixtures With recycled Sands
108
2,262,302,342,382,422,462,502,542,582,62
3 4 5 6 7 8Binder content (m.%)
Mix
den
sity
, g/c
m³
. NS9 % RC721% RC7
7-9-a
68
1012141618
3 4 5 6 7 8Binder content, m.%
Stab
ility
, KN
.
NS9 % RC721% RC7
7-9-b
02468
1012
3 4 5 6 7 8Binder content, m.%
AV
, vol
.%
NS9 % RC721% RC7
7-9-c Figure (7-9): Effect of amount of RC 7 on Marshall properties of basalt asphalt mixes with different binder contents

Chapter 7: Hot Bituminous Mixtures With recycled Sands
109
02468
1012
3 4 5 6 7 8Binder content, m.%
Flow
, mm
.
NS9 % RC721% RC7
7-9-d
12131415161718
3 4 5 6 7 8Binder content, m.%
VM
A, v
ol. %
.
NS9 % RC721% RC7
7-9-e Figure (7-9) cont.: Effect of amount of RC 7 on Marshall properties of basalt bituminous mixtures with different binder contents
020406080
100120140
3 4 5 6 7 8Binder content, m.%
Mar
shal
l stif
fnes
s, N
/mm
² .
NS
9 % RC7
21% RC7
Figure (7-10): The relations between the stiffness of basalt bituminous mixtures and
the binder contents for mixes with basalt sand and RC 7

Chapter 7: Hot Bituminous Mixtures With recycled Sands
110
Because the density and water absorption of RC 9 (crushed lime-sand brick) are similar to these of RC 7, replacement the basalt sand by RC 9 also caused similar influence on the bituminous mixtures properties, Appendix B. 7-2-2 Effect of the coarse aggregate type on the bituminous mixtures properties In this section the influence of type and amount of the recycled sand on the properties of bituminous mixtures is discussed for mixes produced with limestone coarse aggregate. The aggregate combination in the limestone mixes is consists of 30 m.% limestone 8/16 mm, 32.5 m.% limestone 2/8 mm, 30 m.% natural sand 0/2 mm and 7.5 m.% limestone mineral filler, Table (3-5). The recycled sands were used in these mixes in values of 9, 15 and 21 m.% of the total aggregate as a substitution to equal mass of the natural sand. The values of Marshall properties of limestone mixes with RC 1 were plotted in Figure (7-11). Generally with RC 1 he properties of limestone mixes were similar to these of basalt mixes regarding to the general influences or trends with variation in the gained or missed values. The maximum density was attained at binder contents ranged from 4.5% for natural sand (NS) to 5% for 21% RC 1 with 0.5 % increase, which is equal to the increase due to using RC1 in basalt mixes. This may because the difference in absorbed bitumen between RC1 and NS is approximately equal to that between RC 1 and BS. It is noticed also that replacement NS by RC 1 decreased the mix density but in lower values where using 21% RC 1 in limestone mixes reduced the maximum density from 2.460 g/cm³ to 2.442 g/cm³ in compare to from 2.596 to 2.502 in basalt mixes, Figure (7-11-a). This because of The lower variation in the sand density between RC1 and NS with respect to the difference between RC1 and BS. In general the lower variation in density and strength values between the different recycled sands and NS in compare to these between the recycled sands and BS may deceases the effect of using the recycled sands on the homogenously of the mix and consequently the mix properties. Figure (7-11-b) illustrates that using RC 1 increased the mix stability in values similar or more that that gained in basalt mixes because of the higher porosity and irregularity of RC 1 compared to the natural sand in limestone mixes. The increase in stability eliminated as the amount of RC 1 or the binder content increased.

Chapter 7: Hot Bituminous Mixtures With recycled Sands
111
The increase in AV values and the reduction in VMA values were relatively low for the same reasons of the lower change in mix density of limestone mixes with RC 1 while no significant differences were found in the flow values and Marshall stiffness at using RC 1 with basalt or limestone aggregate as shown in Figure (7-11) and (7-12).
2,34
2,38
2,42
2,46
2,50
3 4 5 6 7Binder content, m.%
Mix
den
sity
, g/c
m³
. NS9 % RC115 % RC1 21% RC1
7-11-a
7-11-b Figure (7-11): Effect of amount of RC 1 on Marshall properties of limestone bituminous mixtures with different binder contents
2
4
68
10
12
14
3 4 5 6 7Binder content (m.%)
Stab
ility
, KN
.
NS9 % RC115 % RC1 21% RC1
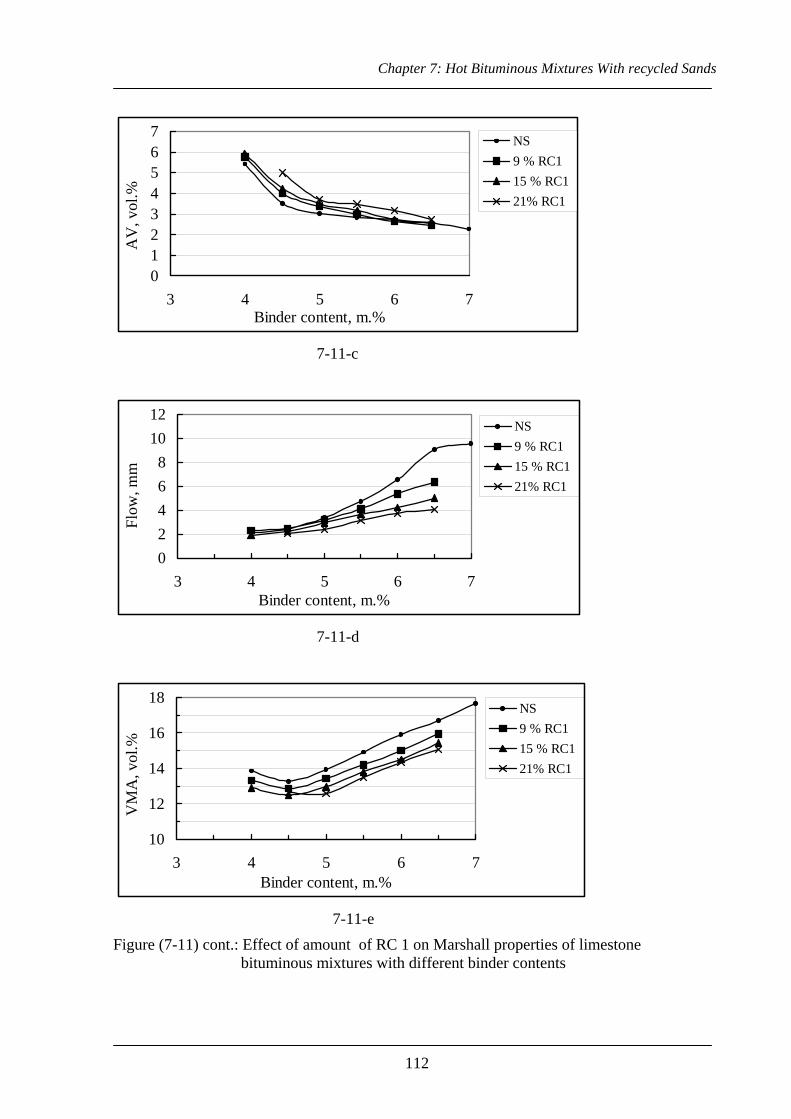
Chapter 7: Hot Bituminous Mixtures With recycled Sands
112
01234567
3 4 5 6 7Binder content, m.%
AV
, vol
.% .
NS9 % RC115 % RC1 21% RC1
7-11-c
02468
1012
3 4 5 6 7Binder content, m.%
Flow
, mm
.
NS9 % RC115 % RC1 21% RC1
7-11-d
10
12
14
16
18
3 4 5 6 7Binder content, m.%
VM
A, v
ol.%
.
NS9 % RC115 % RC1 21% RC1
7-11-e Figure (7-11) cont.: Effect of amount of RC 1 on Marshall properties of limestone bituminous mixtures with different binder contents

Chapter 7: Hot Bituminous Mixtures With recycled Sands
113
0
20
40
60
80
100
3,0 4,0 5,0 6,0 7,0Binder content, m.%
Mar
shal
l stif
fnes
s, N
/mm
² . NS9 % RC115 % RC1 21% RC1
Figure (7-12): The relations between the stiffness of limestone bituminous mixtures and
the binder contents for mixes with basalt sand and RC 7 For the other recycled sands, it can be summarized that the influence of using the recycled sands on behaviour of limestone mixes was similar to basalt mixes with two general differences. The first one was that a replacement of the natural sand by the different recycled sands in limestone mixes changed the mix properties in lower rates than in basalt mixes and the second difference was that the values of mix stability were improved at using all recycled sands in limestone mixes while in basalt mixes these values was not affected for RC 2 and slightly decreased for RC 3. The effect of using the other recycled sands RC 2, RC 5, RC 7 and RC 9 on the behaviour of the limestone mixes are presented in Appendix B while their quantitative influence on OBC values and the mix properties at OBC will discussed in section 7-3. 7-2-3 Effect of mixing temperature Increasing the mixing temperature of the bituminous mixtures may decreases OBC because it improves the workability and compaction of the mix. Because the recycled aggregates in general and especially the recycled sand are highly absorptive aggregates, which may increase the values of OBC extremely. Basalt mixes with 21% RC 9 were produced again with mixing temperatures 150°C and 165°C. The lime-sand brick recycled sand RC 9 was selected for investigation the effect of mixing temperature on properties of bituminous mixtures because it has the highest value of absorbed bitumen as in Figure (7-3) and consequently the highest OBC. Figure (7-13) shows that the binder content at maximum mix density decreased from 6.5% at 135°C mixing temperature to 6% at 150°C and 165°C which lead to reducing OBC. At the same time the stability and flow values increased. AS
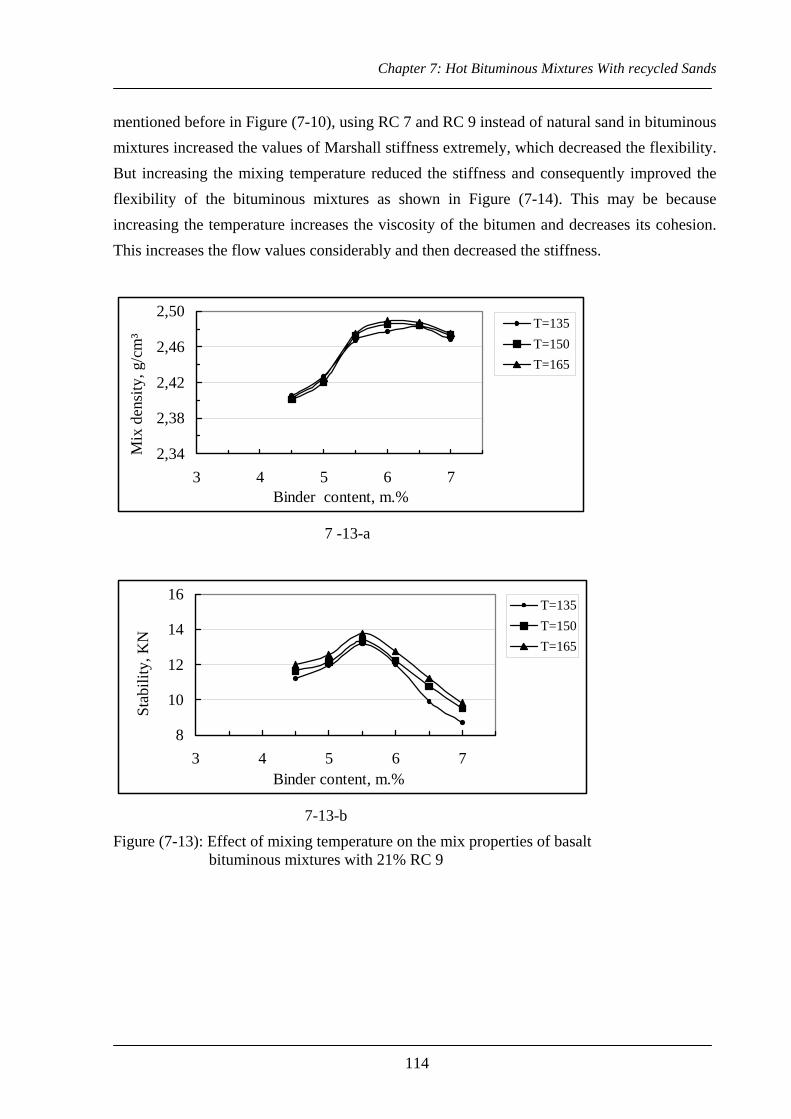
Chapter 7: Hot Bituminous Mixtures With recycled Sands
114
mentioned before in Figure (7-10), using RC 7 and RC 9 instead of natural sand in bituminous mixtures increased the values of Marshall stiffness extremely, which decreased the flexibility. But increasing the mixing temperature reduced the stiffness and consequently improved the flexibility of the bituminous mixtures as shown in Figure (7-14). This may be because increasing the temperature increases the viscosity of the bitumen and decreases its cohesion. This increases the flow values considerably and then decreased the stiffness.
2,34
2,38
2,42
2,46
2,50
3 4 5 6 7Binder content, m.%
Mix
den
sity
, g/c
m³
. T=135T=150T=165
7 -13-a
8
10
12
14
16
3 4 5 6 7Binder content, m.%
Stab
ility
, KN
.
T=135T=150T=165
7-13-b Figure (7-13): Effect of mixing temperature on the mix properties of basalt bituminous mixtures with 21% RC 9
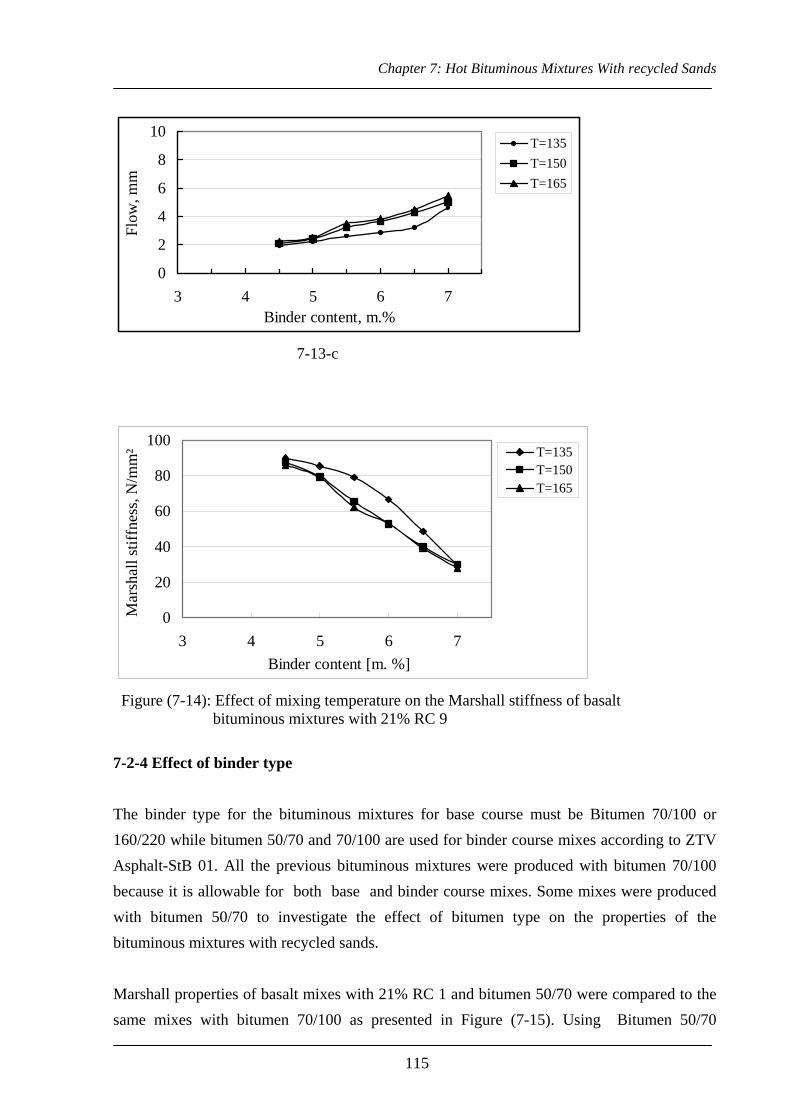
Chapter 7: Hot Bituminous Mixtures With recycled Sands
115
0
2
4
6
8
10
3 4 5 6 7Binder content, m.%
Flow
, mm
T=135T=150T=165
7-13-c
0
20
40
60
80
100
3 4 5 6 7Binder content [m. %]
Mar
shal
l stif
fnes
s, N
/mm
² . T=135T=150T=165
Figure (7-14): Effect of mixing temperature on the Marshall stiffness of basalt bituminous mixtures with 21% RC 9 7-2-4 Effect of binder type The binder type for the bituminous mixtures for base course must be Bitumen 70/100 or 160/220 while bitumen 50/70 and 70/100 are used for binder course mixes according to ZTV Asphalt-StB 01. All the previous bituminous mixtures were produced with bitumen 70/100 because it is allowable for both base and binder course mixes. Some mixes were produced with bitumen 50/70 to investigate the effect of bitumen type on the properties of the bituminous mixtures with recycled sands. Marshall properties of basalt mixes with 21% RC 1 and bitumen 50/70 were compared to the same mixes with bitumen 70/100 as presented in Figure (7-15). Using Bitumen 50/70
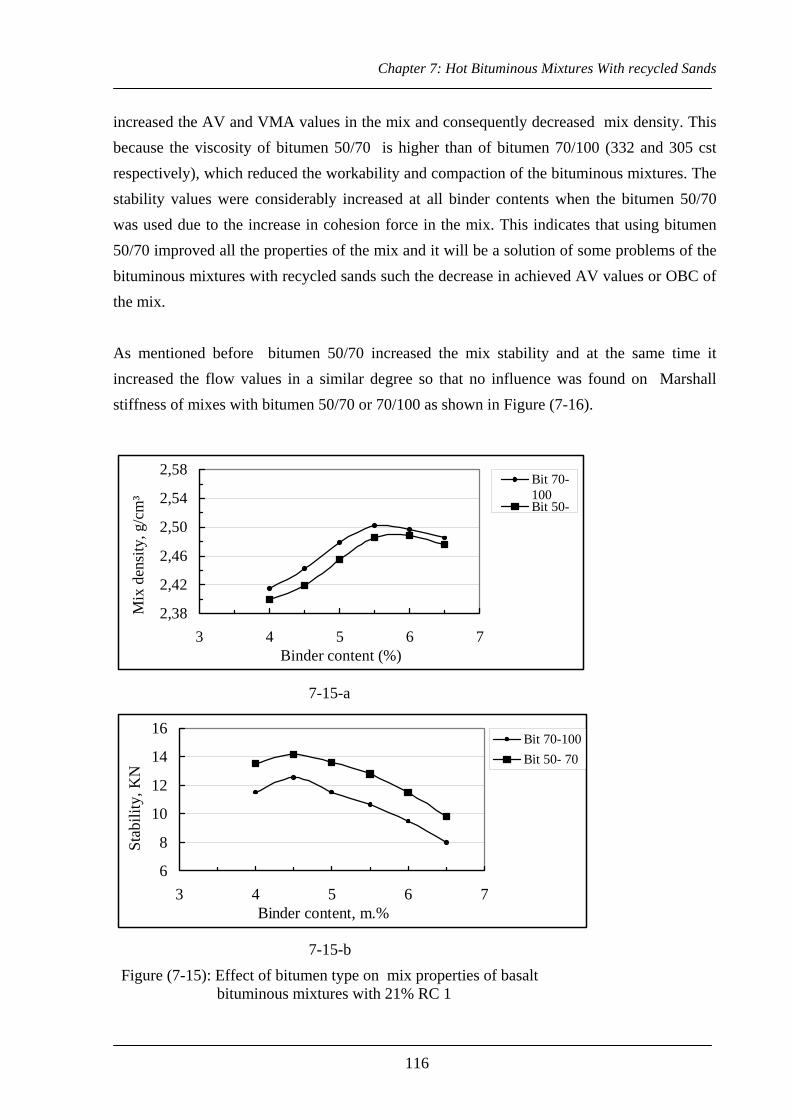
Chapter 7: Hot Bituminous Mixtures With recycled Sands
116
increased the AV and VMA values in the mix and consequently decreased mix density. This because the viscosity of bitumen 50/70 is higher than of bitumen 70/100 (332 and 305 cst respectively), which reduced the workability and compaction of the bituminous mixtures. The stability values were considerably increased at all binder contents when the bitumen 50/70 was used due to the increase in cohesion force in the mix. This indicates that using bitumen 50/70 improved all the properties of the mix and it will be a solution of some problems of the bituminous mixtures with recycled sands such the decrease in achieved AV values or OBC of the mix. As mentioned before bitumen 50/70 increased the mix stability and at the same time it increased the flow values in a similar degree so that no influence was found on Marshall stiffness of mixes with bitumen 50/70 or 70/100 as shown in Figure (7-16).
2,38
2,42
2,46
2,50
2,54
2,58
3 4 5 6 7Binder content (%)
Mix
den
sity
, g/c
m³
. Bit 70-100Bit 50-
7-15-a
6
8
10
12
14
16
3 4 5 6 7Binder content, m.%
Stab
ility
, KN
.
Bit 70-100Bit 50- 70
7-15-b Figure (7-15): Effect of bitumen type on mix properties of basalt bituminous mixtures with 21% RC 1

Chapter 7: Hot Bituminous Mixtures With recycled Sands
117
0
2
4
6
8
10
12
3 4 5 6 7Binder content, m.%
AV
, vol
.%
.Bit 70-100Bit 50- 70
7-15-c
0
2
4
6
8
3 4 5 6 7Binder content, m.%
Flow
, mm
.
Bit 70-100Bit 50- 70
7-15-d
12
14
16
18
3 4 5 6 7Binder content, m.%
VM
A, v
ol.%
.
Bit 70-100Bit 50- 70
7-15-e Figure (7-15): Effect of bitumen type on mix properties of basalt asphalt mixes with 21% RC 1

Chapter 7: Hot Bituminous Mixtures With recycled Sands
118
0
20
40
60
80
100
120
3 4 5 6 7Binder content, m.%
Mar
shal
l stif
fnes
s, N
/mm
² .
Bit 70-100Bit 50-
Figure (7-14): Effect of Bitumen type on Marshall stiffness of basalt mixes
by 21% RC1 7-3 Optimum binder content (OBC) for bituminous mixtures with recycled
sands The OBC was calculated for each mix from Marshall curves as the average of the binder contents at maximum density, maximum stability and the required AV in the mix as explained in section 3-5-4-2. The binder contents at 2% AV were used in OBC calculations of base course where the range in the specification is from 1% to 3%. The binder content at 4% AV was considered for binder course to be in the range of AV values of this course. The effect of recycled sand type and amount on the OBC values for both base course and binder course with basalt and limestone bituminous mixtures is presented in the following: 7-3-1 Base courses Figure (7-16) presents the OBC values for basalt mixes with the different recycled sands. The total replacement of basalt sand by the recycled sands RC 2, RC 3 and RC 5 (21% RC-sand) slightly decreased the OBC values from 5.2 % to 4.8 % for RC2 and RC3 and to 5% for RC 5 while it increased the OBC values to 5,5%, 6,5 % and 6,0 % for the recycled sands RC 1, RC 7 and RC 9 respectively. As mentioned in section 7-2, the all recycled sands reduced the VMA values and consequently the required bitumen to fill it and at the same time increased the absorbed bitumen, which should increase the amount of bitumen . The resultant of the two effects guides the end change in the OBC values. As in Figure (7-3), the absorbed bitumen at using the first three sands RC 2, RC 3 and RC 5 were considerably lass than the other sands. This because RC 2 has old bitumen and the three sands has the lowest water

Chapter 7: Hot Bituminous Mixtures With recycled Sands
119
absorption values (porosity) of recycled sands Also for the recycled sands that arose the OBC , the increases in the OBC values were less than the absorbed bitumen and then the effective bitumen reduced for all recycled sands. The decrease in the OBC values is not preferred in all cases because it affects many properties of the bituminous mixtures such as the durability and flexibility. For that minimum values for VMA and binder content are defined in the specification for the different pavement layers. To avoid this problem, the decrease in effective bitumen at using the recycled sands, the following suggestions should be considered in the design and control of the bituminous mixtures with recycled sands:
1- The different used aggregates should be combined by volume not by mass and the specification limits for the mix gradation must be adjusted to be in volume also as in concrete.
2- The limits of the required binder content should be defined according the effective bitumen not the total bitumen.
3
4
5
6
7
0 2 4 6 8 10 12 14 16 18 20 22 24Recycled sand content, m.% of total aggregates
OB
C, m
.% .
RC 1RC 2RC 3RC 5RC 7RC 9
Figure (7-16): The OBC values of basalt bituminous mixtures with different types and amounts of the recycled sands for base course. In the limestone bituminous mixtures, the change in the OBC values were equal to or less than this occurred in the basalt mixes as shown in Figure (7-17). Using up 21% RC 2 as a replacement of natural sand reduced the OBC from 5.4 % % to 5% with the same reduction in basalt mixes (from 5.2% to 4.8%) while the maximum increase was found for RC7 where 21% RC 7 increased the OBC from 5.4% to 6.4% in compare to from 5.2 % to 6.5% in basalt mixes. The lower changes in OBC values in limestone mixes were because in these mixes the increase in absorbed bitumen was approximately equal to in basalt mixes (Figure

Chapter 7: Hot Bituminous Mixtures With recycled Sands
120
B-37 appendix B) while the decrease in effective bitumen values were more than these in basalt mixes for most recycled sands.
3
4
5
6
7
0 2 4 6 8 10 12 14 16 18 20 22 24Recycled sand amount, m.% of total aggregates
OB
C, m
.%
RC 1RC 2RC 3RC 5RC 7RC 9
Figure (7-17): The OBC values of limestone mixes with different types and amounts of the recycled sands for base course. 7-3-2 Binder courses The influence of recycled sand type sand amount on the OBC values for binder course with basalt and limestone mixes were presented in Figures (7-18) and (7-19). It is noticed that the OBC values were within the limits of binder content of base course mix (4%-6%) for all recycled sands other than 21% RC 7, which slightly exceeded the upper limits but this can be accepted because it resulted from the increase in absorbed bitumen and then has not the harmful effect of increasing the binder content in normal bituminous mixtures such as bleeding of asphalt in higher temperature. In compare to the base course mix, The OBC values were lower in all mixes of binder course while the increases in OBC at increasing the recycled sand amounts were higher for binder course mixes ( for example, using 21% RC 7 increased the OBC from 4.7% to 6.3% in binder course in compare to from 5.2% to 6.5% in base course). These two variation are related to the binder contents at the required AV in binder course (4% AV) and in base course (2% AV), see Figure 7-9-c of RC 7 as an example. In this Figure, using 21% RC 7 instead of basalt sand increased the binder content at 4% AV from 4.6% to 5.9% at 4% AV in compare to from 6% to only 6.5% at 2% AV. This may because 4% AV was achieved doubtless at lower binder contents where the effective bitumen may not enough for suiTable workability and compaction at using the recycled sands and then the required bitumen to fill the voids between the particles until 4% AV increased. In fact the increase in OBC values at using the recycled sands in binder course can be considered an

Chapter 7: Hot Bituminous Mixtures With recycled Sands
121
advantage because it increases the effective bitumen in the mix and then improves the other mix properties.
Figure (7-18): The OBC values of basalt bituminous mixtures with different types and amounts of the recycled sands for binder course.
Figure (7-19): The OBC values of limestone bituminous mixtures with different types and amounts of the recycled sands for binder course. It can be concluded that the replacement of the natural sands with the different recycled sands up to 21% of total aggregate changed the OBC in relatively lower values for the recycled sands RC 1, RC 2, RC 3 and RC 5 (the differences ranged from –0.4% to + 0.3% in all cases) while the OBC increased significantly at using the crushed bricks sands RC 7 and RC 9 but it did not exceed the existed limits except at using 21% RC 7. The reduction in OBC values are
3
4
5
6
7
0 2 4 6 8 10 12 14 16 18 20 22 24Recycled sand content, m.% of total aggregates
OB
C, m
.%
.
RC 1RC 2RC 3RC 5RC 7RC 9
3
4
5
6
7
0 2 4 6 8 10 12 14 16 18 20 22 24Recycled sand amount, m.% of total aggregates
OB
C, m
.% .
RC 1RC 2RC 3RC 5RC 7RC 9

Chapter 7: Hot Bituminous Mixtures With recycled Sands
122
not preferred because it resulted from the decrease in effective bitumen. So much attention must be given to the mix gradation, VMA values and the effective bitumen content in the bituminous mixtures with recycled sands.
7-4 Properties of bituminous mixtures at the optimum binder content The OBC values were calculated and analyzed for the different Bituminous mixtures in the previous section then the mix properties at these OBC values were determined from Marshall curves for the investigated mixes. Table (B-1) in appendix B presents the properties of the base course mixes . The effect of recycled sand type and amount on the mix stability, flow, AV, VMA and Marshall stiffness is investigated in the following : 7-4-1 Mix stability Figures (7-20) and (7-21) show that the replacement of the natural sand with the different recycled sands up to 21% of the total aggregate increased the mix stability in values ranged from1% to 61% in basalt mixes and from about 15% to 66% in limestone mixes. The only exception was that RC 3 in basalt mixes reduced 18% of the reference mix stability because it has the lowest porosity and roughness of sands but in all cases the stability values significantly exceeded the requirement of ZTV Asphalt-STB 01 for base course mixes (4 KN). It is noticed that the replacement of the natural sand with RC 7 achieved the highest increase in stability due to the large difference in density of the two sands, which result in increasing the aggregate volume in the mix and consequently the internal friction as well as that. RC 7 contains 12.9% less than 0.09 mm, which result in a relatively dense mix. Although there are no upper limits for the stability and the higher stability means higher resistance to the failure of the pavement under loads but the extreme increase at using RC 7 may be used as a restriction for using a higher amount of this sand if it has a negative effect on the durability and flexibility of the mix as will be discussed. The stability values illustrates that the strength of the recycled sands may have no significant influence on the mix stability because the strength of basalt sand is doubtless more than the different recycled sands while the difference in gradation, particle shape and surface textures may control the changes in the mix stability

Chapter 7: Hot Bituminous Mixtures With recycled Sands
123
2
4
6
8
10
12
14
16
0 2 4 6 8 10 12 14 16 18 20 22 24Recycled sand content, m.% of total aggregates
Stab
ility
, KN
.RC 1RC 2RC 3RC 5RC 7RC 9
Figure (7-19): Effect of recycled sand type and amount on the stability of basalt bituminous mixtures for base course.
2
4
6
8
10
12
14
16
0 2 4 6 8 10 12 14 16 18 20 22 24Recycled sand content, m.% of total aggregates
Stab
ility
, KN
.
RC 1RC 2RC 3RC 5RC 7RC 9
Figure (7-20): Effect of recycled sand type and amount on the stability of
limestone bituminous mixtures for base 7-4-2 Air voids content (AV) and Voids in mineral aggregate (VMA) According to the previous specification, the AV values in base course mixes must be in the range from 1% to 3%. In basalt bituminous mixtures, the AV values at OBC were within the limits for the investigated recycled sands up to 21% of the total aggregate, Figure (7-21). The recycled concrete sands RC 1 and RC 5 had approximately no influence on the AV values while the other recycled sands decreased these values especially at total replacement of basalt

Chapter 7: Hot Bituminous Mixtures With recycled Sands
124
sand with the recycled sand. This because the concrete crushed sands RC 1 and RC 5 has a more irregular shape and coarser gradation .
0
1
2
3
4
5
0 2 4 6 8 10 12 14 16 18 20 22 24
Recycled sand content, m.% of total aggregates
AV
, vol
.%
.
RC 1RC 2RC 3RC 5RC 7RC 9
Figure (7-21): Effect of recycled sand type and amount on air void content in the basalt bituminous mixtures for base course In compare to the basalt mixes, the recycled sands had a higher effect on the AV values in limestone mixes as shown in Figure (7-22). In fact the differences between both the limestone and basalt mixes not only related to the differences between the basalt or limestone coarse aggregates but mainly reflex the difference between replacement the crushed basalt sand (basalt mixes) and the natural siliceous sand by the recycled sands. This explain why the influence of recycled sands on AV values was higher in limestone mixes in compare to the basalt mixes while the stability an against result was found in the stability values. However the difference in sand density between the basalt and recycled sands is higher, which increase the variation in aggregate volume with respect to the effective bitumen and consequently the change in mix stability while the main differences between the natural sand and the recycled sands were in the particle shape (natural and crushed) and the sand gradation especially the fine particles (1.4 < 0,09 mm in natural sand in compare up to 12.9% for the recycled sands) where these two characteristics affect the AV values significantly. The upper limit was exceeded only at using 21% RC 1 but this can be adjusted by increasing the amount of the mineral filler (< 0.09 mm) in the mixture especially that the AV in the reference mix was near the maximum allowable value.

Chapter 7: Hot Bituminous Mixtures With recycled Sands
125
0
1
2
3
4
5
0 2 4 6 8 10 12 14 16 18 20 22 24Recyled sand content, m.% of total aggregates
AV
, vol
.%
.RC 1RC 2RC 3RC 5RC 7RC 9
Figure (7-22): Effect of recycled sand type and amount on air void content in the limestone bituminous mixtures for base course Similar results were found in the VMA values where increasing the recycled sand increasing the amount of the recycled sands decreased the VMA values in rates depend on the density and gradation of the sand , Figure (B-37) in appendix B. 7-4-3 Flow and Marshall stiffness. Replacing the natural sand by the recycled sands decreased the flow values in both basalt and limestone mixes other than RC2 which slightly increased it by only 6.5% at 21% recycled sand. But all values lied within the limits of the specification (2-5 mm). The recycled sand RC 2 contains an amount of the old bitumen where part of this bitumen returned its original characteristics but the other part fill the voids as a sand but it may act as a pores in the mix and decreased its deformation resistance. The flow values were used with the stability and specimen thickness in calculation of Marshall stiffness that is presented here while the flow values is found in Table (B-1) in Appendix B. Figures (7-23) and (7-24) show the Marshall stiffness values for basalt and limestone mixes. It is noticed that using RC 7 arose the stiffness in higher rate in basalt mixes because this sand increased the stability at the same time decreased the flow values for the reasons mentioned before. If this increase in mix stiffness can not be adjusted by changing the aggregate proportional , the amount of RC 7 must be limited especially when it is used as a substitution to basalt sand. The other recycled sands can be divided in two groups, the first one consists of RC 2 and RC 3, which slightly decreased the stiffness and the second group (RC 1, RC 5 and RC 9) increased the stiffness by about 50% at 21% recycled sand. In the limestone mixes, the stiffness increased as the amount of

Chapter 7: Hot Bituminous Mixtures With recycled Sands
126
the different recycled sands increased with lower differences between the different recycled sands. The recycled sand RC 7 achieved stiffness values similar to these of RC 1, RC 5 and RC 9 so that it can be classified in the second group these sands while the recycled sands RC 2 and RC 3 still constitute the first group with lower influence on the mix stiffness. It can be said that, in compare to the other mix properties, the mix stiffness values were influenced considerably at replacing the natural sand by the recycled sands especially the crushed brick sand. It may be not enough to define a minimum value for the stability and a limit for the flow value in the specifications for bituminous mixtures with recycled sands and there a need to investigate the relation between the mix performance and its elasticity using Marshall stiffness values or any direct test to characterize the elasticity.
0
20
40
60
80
100
120
0 2 4 6 8 10 12 14 16 18 20 22 24Recycled sand content, m.% of total aggregate
Mar
shal
l st
iffne
ss, N
/mm
² . RC 1
RC 2RC 3RC 5RC 7RC 9
Figure (7-23): Mix stiffness of basalt Bituminous mixtures for base course produced with the different types and amounts of the recycled sands

Chapter 7: Hot Bituminous Mixtures With recycled Sands
127
0
20
40
60
80
100
120
0 2 4 6 8 10 12 14 16 18 20 22 24Recycled sand content, m.% of total aggregate
Mar
shal
l stif
fnes
s, N
/mm
² . RC 1
RC 2RC 3RC 5RC 7RC 9
Figure (7-24): Mix stiffness of limestone Bituminous mixtures for base course
produced with the different types and amounts of the recycled sands 7-5 Effect of water action on cohesion of the bituminous mixtures with
recycled sands The stability of basalt Bituminous mixtures produced with 9% of different recycled sands were measured after immersion in water for 0.5, 24 and 48 hours according to the procedure in section 3-5-4-2-1 . The stability after 0.5 hour represent the original stability as in Marshall procedure while the values after 24 and 48 hours were used to investigate the water resistance of the bituminous mixtures. Normally, the loss of stability is measured after 24 hours as in the procedure but it was measured after 48 hours for bituminous mixtures with recycled sands because higher water absorption of these sands in compare to the natural sand. Figure (7-25) shows that the stability reduced as the immersion time increased for mixes with both basalt and the different recycled sands in values ranged from 5% for basalt sand to about 11% for RC3 and RC9 after 48 hours immersion in water by 60 °c but the values still more than the minimum value in the specification (4 KN). The lost in stability was higher in the first 24 hours than after that. This may be because the capability of aggregate to absorb more water after 24 hours becomes very low. Although the stability values of bituminous mixtures with the different recycled sands are much higher the minimum value but for more safety much attention should be given to the drainage system of pavement constructed with recycled sand and using this sands as investigated here in binder course or base course.

Chapter 7: Hot Bituminous Mixtures With recycled Sands
128
4
6
8
10
12
14
0 10 20 30 40 50 60Immersion time, hour
Sta
bilit
y, K
N .
BS RC1RC2RC3RC5RC7RC9
Figure (7-25): Stability values of basalt bituminous mixtures produced with basalt sand and the different recycled sand after 7- 6 Predicting properties of the ituminous mixtures produced with recycled
sands depending on sand characteristics Many characteristics of the recycled sands were measured as mentioned in chapter 5 while the properties of basalt and limestone bituminous mixtures produced with some of these sands were presented in this chapter. The mix properties were correlated to the recycled sand characteristics to define which one can be used for characterization of sand and predicting the mix properties. It was found that the density and water absorption of the recycled sands can be correlated to the mix properties with more accuracy. This because the density describes the original material of the sand and its porosity while the water absorption is affected by the porosity, shape, surface texture of the particles as well as the gradation of sand where all these parameters influence the mix properties. In the following sub sections the relations between water absorption of the recycled sands and properties of the bituminous mixtures are discussed. The properties of mixes produced with 21% recycled sand were used in deriving the relations. 7-6-1 Absorbed bitumen The relation between water absorption and absorbed bitumen of recycled sands were presented in Figure (7-26) where the following relation was derived BA = 0.13 WA + 0.13

Chapter 7: Hot Bituminous Mixtures With recycled Sands
129
where BA = Bitumen absorption WA = Water absorption Many relations were found in previous studies between both water and bitumen absorption of different natural aggregates and bitumen types [71, 72] where all the existed relations are linear also. It is noticed that the absorbed bitumen is about 14% of the water absorption because not all the water permeable pores can absorb bitumen. 7-6-2 Mix density A Replacement of the natural sands by recycled sands affects the mix density through the differences in the sand density as well as the particle shape and surface texture. The variations in these sand characteristics can be represented by the differences in the water absorption of the recycled sands. For that direct relations were found between the mix density and water absorption of the used recycled sands as shown in Figure (7-27). These two forms were found for both basalt and limestone mixes: Mix density = 2.61 – 0.014 WA for basalt mixes Mix density = 2.49 – 0.011 WA for limestone nixes The mix density as well as the absorbed bitumen has no limits for the bituminous mixtures but the derived relations presented the direct relations between these properties and water absorption of the recycled sands and they can be used to calculate the increase in cost for the additional bitumen and the save in producing and transportation of bituminous mixtures with recycled sands.

Chapter 7: Hot Bituminous Mixtures With recycled Sands
130
y = 0.13x + 0.13R2 = 0.92
0,0
0,5
1,0
1,5
2,0
2,5
3,0
0 2 4 6 8 10 12 14 16 18Water absorption, m.%
Abs
orbe
d bi
tum
en, m
.% .
Figure (7-26): The relation between the absorbed bitumen and water absorption of the recycled sands
R2 = 0.91
R2 = 0.91
2,302,342,382,422,462,502,542,582,62
0 2 4 6 8 10 12 14 16Water absorption, m.%
Mix
den
sity
, g/c
m³
.
Baslat mixes Limestone mixes
Figure (7-27): The relation between the density of basalt and limestone mixes and water absorption of the recycled sands 7-6-3 Mix stability, flow and Marshall stiffness It was found that increase of water absorption of the recycled sand increased the stability and decreased the flow values in linear relations as the previous properties. The plotted relations with the derived equations were presented in Figures (B-38) and (B-39) while the values Marshall stiffness, which calculated using these two properties, was plotted against the water absorption, Figure (7-28). It presents the sensitivity to the water absorption of the recycled sands especially at using these sand as a substitution to basalt sand (basalt mixes). These two forms can be used to predict the Marshall stiffness:

Chapter 7: Hot Bituminous Mixtures With recycled Sands
131
MS = 7.8 WA - 8.7 (Basalt mixes) MS = 1.9 WA +24.3 (Limestone mixes)
R2 = 0.90
R2 = 0.61
0
20
40
60
80
100
120
0 2 4 6 8 10 12 14 16Water absorption, m.%
Mar
shal
l stif
fnes
s, N
/mm
² . Baslat mixes Limestone mixes
Figure (7-28): The relation between Marshall stiffness of basalt and limestone mixes and water
7-7 Classification of the recycled sands with respect to their reuse in the in the Bituminous mixtures for base courses
Using the different recycled sands in bituminous mixtures improved the mix stability and achieved the requirements of the different mix properties where most properties such as stability, flow, AV and OBC has defined limits for each applications. The only exceptions was that using 21% of RC 1 in limestone mixes produced mix with AV content slightly exceeded the upper limit as shown in Figure (7-22) and the OBC values was less than the lower limit for mixes with RC 2. But this can not be used as a restriction to use 21% of these two sands because in limestone mixes the AV was relatively high in the reference mix with natural sand (2.9% AV while the max. value is 3%) and increasing the amount of mineral filler can reduce the AV in the reference mix and consequently with 21% RC 1. For RC 2 that achieved OBC lower than the minimum value, it contains an amount of old bitumen which return its original properties and increase the actual binder content in the mix. As well as the reference mixes were produced with OBC equal to the minimum value or only 0.2 upper it. This means that the reference mixes need some adjustment in the aggregate proportion to produce voids in aggregate (VMA) sufficient for the binder content and the required AV. The extreme increase in Marshall stiffness in mixes with brick recycled sands RC7 should be

Chapter 7: Hot Bituminous Mixtures With recycled Sands
132
considered in determination the allowable value from this sand, Figure (7-23) although there are no limits for this property in the specifications. It can be suggested that until further investigation of bituminous mixtures with RC 7, the maximum amount must be not exceed 9% of the aggregate mass where the performance of the mix in this case is similar to the mixes with 21% of the other recycled sands. From the previous analysis it can be concluded that the recycled sands can be classified into two groups with respect to their reuse in asphalt concrete. The first one includes the recycled sands from crushed concrete, bituminous mixtures, pre- sieved building demolition and lime-sand brick in any combination. Up to 21% of the total aggregate can be used from these sands. The crushed brick only lies in the second group with 10% maximum allowable value for reuse in Bituminous mixtures for base course.

Chapter 8: Classification Of The Recycled Sands
133
8 – CLASSIFICATION OF THE RECYCLED SANDS ACCORDING TO THEIR EFFECT ON CONCRETE
The recycled sands were evaluated in this research as in chapter 5 and the properties of concrete produced with it were investigated and analysed in chapter 6. In this section, some of the concrete properties will be correlated to each other and to the recycled sand characteristics. The derived relations will be used to classify the different recycled sand depending on its characteristics and its effect on the properties of concrete.
8-1 The relations between concrete properties Concrete is classified according to its compressive strength where some other properties such as splitting-tensile strength and modulus of elasticity are directly related to it. The compressive strength, Splitting-tensile strength and dynamical modulus of elasticity were measured for concrete with the recycled sands. The relations between these concrete properties were investigated as the following: 8-1-1 The relation between splitting-tensile strength and compressive strength Bonzel [73] collected many equations from different studies for the relations between the splitting-tensile strength (fsp) and the compressive strength (fcm for cylinder specimens or fc for cube specimens).These relations are for ordinary concrete with natural aggregates: fsp = 0.396 fcm 0.73 Akazawa fsp = 0.339 fcm 0.735 F.Cameiro et al
fsp = 2.172 fcm 0.604 S.K.Chopra fsp = 0.628 fcm 0.73 B.R.Sen et al
Roos (21) investigated concrete with recycled coarse aggregate from crushed concrete with natural sand or recycled sand and found this relation: fsp = 0.468 fcm 0.53 (8-1)
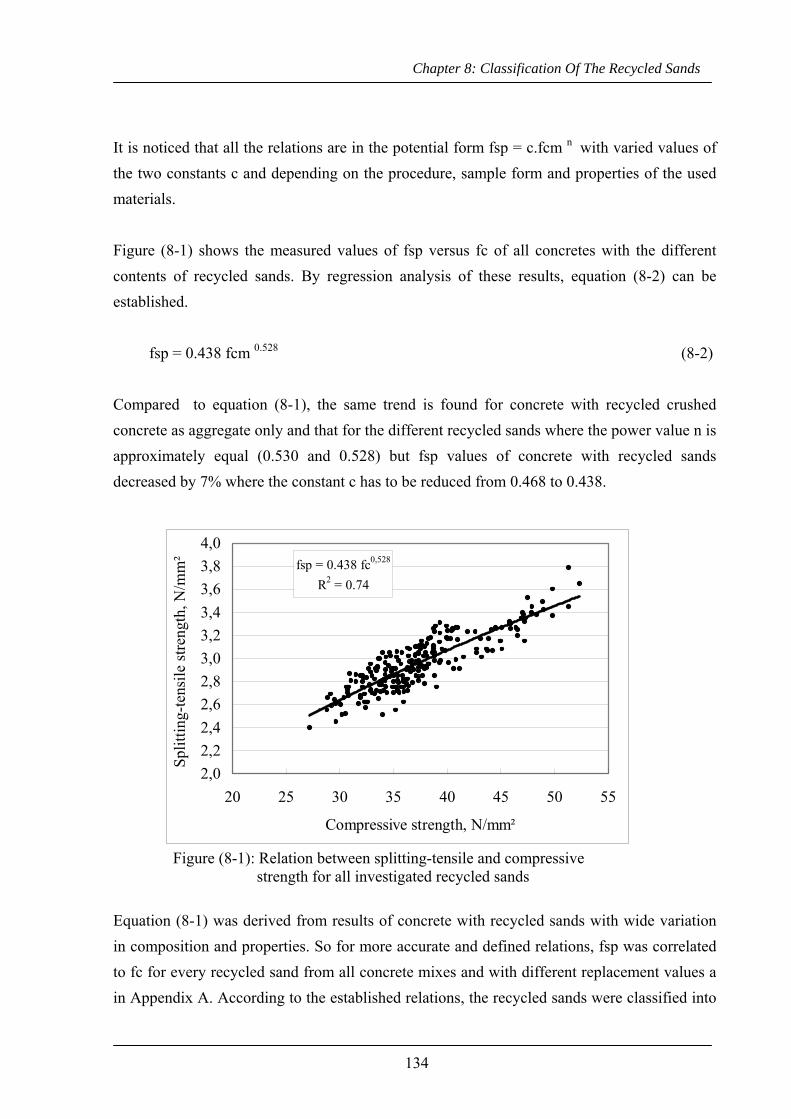
Chapter 8: Classification Of The Recycled Sands
134
It is noticed that all the relations are in the potential form fsp = c.fcm n with varied values of the two constants c and depending on the procedure, sample form and properties of the used materials. Figure (8-1) shows the measured values of fsp versus fc of all concretes with the different contents of recycled sands. By regression analysis of these results, equation (8-2) can be established. fsp = 0.438 fcm 0.528 (8-2) Compared to equation (8-1), the same trend is found for concrete with recycled crushed concrete as aggregate only and that for the different recycled sands where the power value n is approximately equal (0.530 and 0.528) but fsp values of concrete with recycled sands decreased by 7% where the constant c has to be reduced from 0.468 to 0.438.
Figure (8-1): Relation between splitting-tensile and compressive strength for all investigated recycled sands Equation (8-1) was derived from results of concrete with recycled sands with wide variation in composition and properties. So for more accurate and defined relations, fsp was correlated to fc for every recycled sand from all concrete mixes and with different replacement values a in Appendix A. According to the established relations, the recycled sands were classified into
fsp = 0.438 fc0,528
R2 = 0.74
2,02,22,42,62,83,03,23,43,63,84,0
20 25 30 35 40 45 50 55
Compressive strength, N/mm²
Split
ting-
tens
ile st
reng
th, N
/mm
² .
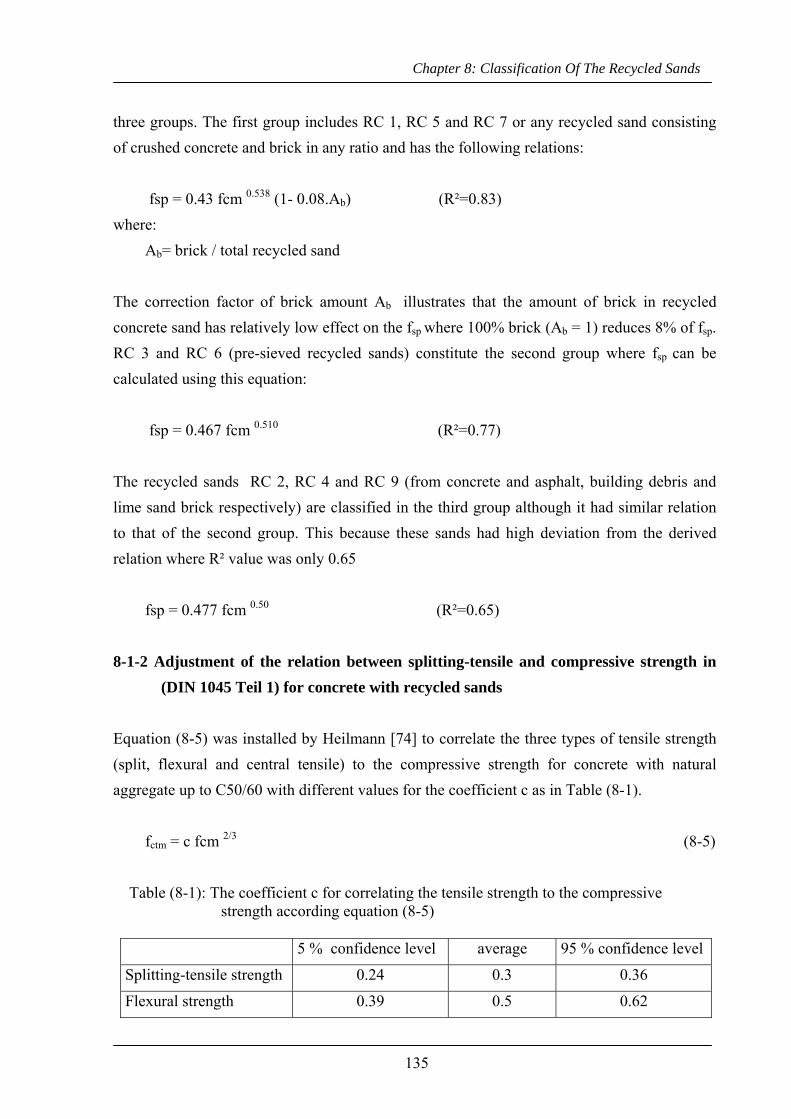
Chapter 8: Classification Of The Recycled Sands
135
three groups. The first group includes RC 1, RC 5 and RC 7 or any recycled sand consisting of crushed concrete and brick in any ratio and has the following relations: fsp = 0.43 fcm 0.538 (1- 0.08.Ab) (R²=0.83) where: Ab= brick / total recycled sand The correction factor of brick amount Ab illustrates that the amount of brick in recycled concrete sand has relatively low effect on the fsp where 100% brick (Ab = 1) reduces 8% of fsp. RC 3 and RC 6 (pre-sieved recycled sands) constitute the second group where fsp can be calculated using this equation: fsp = 0.467 fcm 0.510 (R²=0.77) The recycled sands RC 2, RC 4 and RC 9 (from concrete and asphalt, building debris and lime sand brick respectively) are classified in the third group although it had similar relation to that of the second group. This because these sands had high deviation from the derived relation where R² value was only 0.65 fsp = 0.477 fcm 0.50 (R²=0.65) 8-1-2 Adjustment of the relation between splitting-tensile and compressive strength in
(DIN 1045 Teil 1) for concrete with recycled sands Equation (8-5) was installed by Heilmann [74] to correlate the three types of tensile strength (split, flexural and central tensile) to the compressive strength for concrete with natural aggregate up to C50/60 with different values for the coefficient c as in Table (8-1). fctm = c fcm 2/3 (8-5)
Table (8-1): The coefficient c for correlating the tensile strength to the compressive strength according equation (8-5)
5 % confidence level average 95 % confidence level
Splitting-tensile strength 0.24 0.3 0.36
Flexural strength 0.39 0.5 0.62

Chapter 8: Classification Of The Recycled Sands
136
Direct tensile strength 0.19 0.27 0.32
This equation is established in DIN 1045 Teil 1 for tensile strength (fctm) in the form fctm = 0.3.fck
2/3 while Mehta (74) established these equation for the mean value of tensile strength fctm = 1.4 . (fck/fcko )2/3 where fcko equal 10 N/mm² exactly fits the form used in DIN 1045. Increasing c from 0.27 by Heilman to 0.3 in DIN 1045 covers the difference between fck
and fcm. Equation (8-5) was used also by Roos [21] for concrete with recycled old concrete with c = 0.29 and other coefficient depend on the concrete density. It is noticed that all these equation used constant value for the coefficient n equal 2/3. So, this equation will be adjusted for concrete with recycled sand by calculating the coefficient c (min. average, and max.). The comparison using this form is easier because only the difference in the coefficient c will be analysed while in the previous form fsp=c.fcm
n in most cases the coefficients c and n are changed in opposite t manner ( c increases while n decreases). Figure (8-3) shows the relation between the splitting-tensile and the compressive strength for all mixes with minimum, average and maximum valued of the coefficient c. The values of c ranged from 0,28 to 0,34 with average value 0,31 which approximately similar to average value according to Heilmann or DIN 1045. It is noticed that all fsp values for fcm more than 35 N/mm² are less than the average. So this form can be used for concrete up C30/37 and then the coefficient caver is decreased to 0,29 instead of 0,31 or other form is derived for concrete from C37/45. For reference mixes produced with natural sand in this work the values of c ranged from 0.295 to 0.331 with average value 0.313. This means that the correlation form between the splitting-tensile and the compressive strength of Din 1045 can be used also for concrete with recycled sands with some attention on the coefficient c for concrete classes from C37/45 to C50/60 where the coefficient c must be decrease to 0.28 instead of 0.3 in the form of Din 1045.

Chapter 8: Classification Of The Recycled Sands
137
2,02,42,83,23,64,04,44,8
20 25 30 35 40 45 50 55 60
Compressive strength, N/mm²
Split
-tens
ile st
reng
th, N
/mm
² .
fsp=0,34.fcm
fsp=0,31.fcm
fsp=0,28.fcm
2/3
2/3
2/3
Figure (8-3): The relation between the splitting-tensile and compressive strength for
all recycled sands with the values of the coefficient c of equation (8-5) 8-1-3 The relation between the modulus of elasticity and compressive strength As in the literature and specifications, the modulus of elasticity of ordinary concrete is related to its compressive strength. In DIN 1045 the following form is used to estimate the modulus of elasticity: E = 9500 (fcm)1/3 (8-7) While this equation was established in CEB-FIB model code [69]: E = 2.15 . 104 (fcm/10)1/3 (8-8) These two forms are established for static modulus of elasticity (Estat) with low difference in the coefficient of (fcm)1/3 . Other similar forms are used for light concrete and concrete with recycled old concrete by introducing correction factors depending on the concrete density. The modulus of elasticity for concrete with recycled sand measured in this investigation was the dynamic modulus (Edyn) which is generally about 20% to 40% higher than the static modulus of elasticity of high-, medium- and low-strength concrete [69]. So the relation between Edyn and fcm was investigated. The static modulus of elasticity of the reference mixes was calculated using equation (8-7) and compared to the measured dynamic modulus of elasticity, Figure (8-5). It indicates that

Chapter 8: Classification Of The Recycled Sands
138
the relation between Edyn and fcm are approximately parallel to that of Estat and fcm with an 30% average increase. The values of Edyn versus fcm for concrete with all recycled sands are presented in Figure (8-6) and can be represented by the following relation: Edyn = 5400.(fcm)0,551 (8.9)
Edyn = 10.7 fcm0.378
R2 = 0.89
DIN 1045:Estat = 9.5 fcm0.333
20
25
30
35
40
45
50
55
20 25 30 35 40 45 50 55
Compressive strength, N/mm²
Mod
ulus
of e
last
icity
, KN
/mm
² .
Figure (8-5): Static and dynamic modulus of elasticity versus compressive strength
RC: Edyn = 5.4 fcm0.551
R2 = 0.84
NS: Edyn = 10.7 fcm0,378
20
25
30
35
40
45
50
55
20 25 30 35 40 45 50 55Compressive strength, N/mm²
Dyn
amic
al m
odul
us o
f ela
stic
ity. K
N/m
m²
.
Figure (8-6): Relation between the dynamic modulus of elasticity and the compressive strength for natural and recycled sands It is noticed that compared to the reference mixes the power value of the variable fcm increased while the its coefficient decreased which means that Edyn of concrete with recycled

Chapter 8: Classification Of The Recycled Sands
139
sand was relatively low at lower compressive strength but increased in higher rate than that of NS as the compressive strength increased This because of he fact that the concrete density is used as a parameter in estimation Edyn (Chapter 5) and the change in this density for concrete with recycled sand is higher than for concrete with NS at the same change in compressive strength. In Appendix B, the relation between Edyn and fcm for every recycled sand is presented. As in the relation between splitting-tensile and compressive strength, the adjustment of the coefficient in eq. (8-7) to be used for concrete with recycled sand was investigated. For the concrete with recycled sands, the min and max coefficient of (fcm)1/3 were 10500 and 13000 with average value equal to 11750 as shown in Figure (8-8) while the coefficient for reference mixes ranged from 11900 and 12900 with average value 12500. It is noticed that the recycled sand has a considerable effect on the modulus of elasticity where the min and average coefficients decreased by 12% and 6% respectively. It was found also that until fcm equal to 30N/mm² the Edyn values were less than the averages. So much attention must be given to the modulus of elasticity for concrete with recycled sand especially for concrete with compressive strength less than 30 N/mm². Figure (8-9) shows the min and max coefficient for every recycled sand if eq. (8-7) is used, a wide range for the coefficient was found for all recycled sand. This because the decrease in compressive strength was associated with decreasing in the density in most cases which increase the reduction in modulus of elasticity.
20
25
30
35
40
45
50
55
20 25 30 35 40 45 50 55 60
Compressive strength, N/mm²
Dyn
amic
al m
odul
us o
f ela
stic
ity,
. K
N/m
m²
Edyn =13000
Edyn =11750
Edyn =10500
1/3
1/3
1/3
Figure (8-8): The relation between dynamic modulus of elasticity and compressive strength for all recycled sands with minimum and maximum coefficients of (fcm)1/3

Chapter 8: Classification Of The Recycled Sands
140
It can be concluded that the dynamic modulus of elasticity can be sufficiently correlated to the compressive strength for concrete with recycled sand but with relations different from that of natural sand. So, it is preferred to use the relation for concrete with recycled sand established in, equation (8-9).
6000700080009000
10000110001200013000140001500016000
N.S RC 1 RC 2 RC 3 RC 4 RC 5 RC 6 RC 7 RC 9
Sand type
Coe
ffci
ent
C
C min C max
Figure (8-9): Minimum and maximum coefficient of the variable (fcm)1/3 of Equation 8.7 for natural and recycled sands 8-2 Prediction of compressive strength The compressive strength is an important concrete property where it is used to characterize the concrete and to estimate some other properties as explained in section 8-1. In concrete with natural aggregate, the compressive strength is correlated to the w/c ratio as in the so called Walz-curves [75]. So firstly, the relation between the compressive strength and the w/c ratio was investigated for every recycled sand at the different rates of natural sand replacement. It was found that for every recycled sand, the compressive strength is sufficiently correlated to the w/c ratio with relations similar to Walz curves. Figure (8-10) shows the compressive strength versus the w/c ratio for NS, 50% RC 1 and 100% RC 1 as an example of those relations. To separate the effect of the recycled sand on the compressive strength the following general form was suggested to predict it:

Chapter 8: Classification Of The Recycled Sands
141
(fc )RS = (fc)NS – R (8-10) where (fc )RS: predicted compressive strength for concrete with recycled sand, (fc)NS : measured compressive strength for concrete with local virgin aggregate, R: predicted reduction in compressive strength due to RC-Sands
20
25
30
35
40
45
50
55
60
0,4 0,45 0,5 0,55 0,6 0,65 0,7 0,75 0,8 0,85 0,9
Water/cement ratio
Com
pres
sive
stre
ngth
, N/m
m²
.
NS 50% RC 1100% RC 1 Polynomisch (NS)Polynomisch (50% RC 1) Polynomisch (100% RC 1)
NS: R²=0,9650% RC 1: R²=0,95100% RC 1: R²=0,94
Figure (8-10): Compressive strength versus water/cement ratio for natural sand and RC1 For every job or site, a concrete mix will be produced using the local aggregate and cement and its compressive strength will be measured as (fc)NS and the value of R will be estimated according to (8-10). In this case the change in fc due to the differences in the virgin materials will be avoided. So, the R-value will be correlated to the concrete and recycled sand characteristics instead of the compressive strength. R-value is estimated as the difference in fc of concrete with natural sand and recycled sand. Figure (8-11) shows the relation between R and the w/c ratio for RC 1 .

Chapter 8: Classification Of The Recycled Sands
142
30% RC 1: R = 97.6 (w/c)2 - 112.5 (w/c) + 32.9R2 = 0.98
0
2
4
6
8
10
12
0,40 0,45 0,50 0,55 0,60 0,65 0,70 0,75 0,80
Water/cement ratio
Red
uctio
n in
com
pres
sive
. st
reng
th, N
/mm
²
30% RC 150% RC 175% RC 1100% RC1
Figure (8-11): The reduction in compressive strength versus water/cement ratio for concrete with RC 1 It is noticed that the reduction in compressive strength (R-value) was relatively high at the lowest w/c ratio (0.48) and decreased as the w/c ratio increased up to w/c from 0.56 to 0.60 (depending on the recycled sand content) and then increased again. This means that the reduction in compressive strength can be steered by the w/c ratio. The higher reduction in compressive strength at w/c ratios equal to 0.48 and 0.66 can be related many factors. The first factor is that at the same recycled sand content (30% for example) the amount of recycled sand was higher at w/c ratios equal to 0,48 and to 0,66 because the aggregate content in the reference mix was higher than at w/c ratios equal to 0.53 and 0.58 as shown in Figure (8-12). The second factor is that the cement lime contents at w/c ratios equal to 0.48 and 0.66 were lower than at the other w/c ratios due to the decrease in water amount at w/c ratio equal to 0.48 and the decrease in cement content at w/c ratio equal to 0.66. This decrease in cement lime content, especially for concrete with recycled sands, may lead to decrease of concrete workability and consequently the compaction degree and increase of concrete porosity in the cement matrix. It is known that the amount of cement lime must be sufficiently high to cover the surface area of the particles and fill the hollow spaces between it to attain the best consistency of fresh concrete and to minimize the air void content in the hardened concrete. Compared to natural sand, the recycled sand has a more irregular shape and rough surface texture which decreases the workability and increases the hollow space in the cement matrix. Figure (5-9) illustrates the considerable difference in particle shape and surface texture of natural sand and the different recycled s ands using REM. The increase of the void content
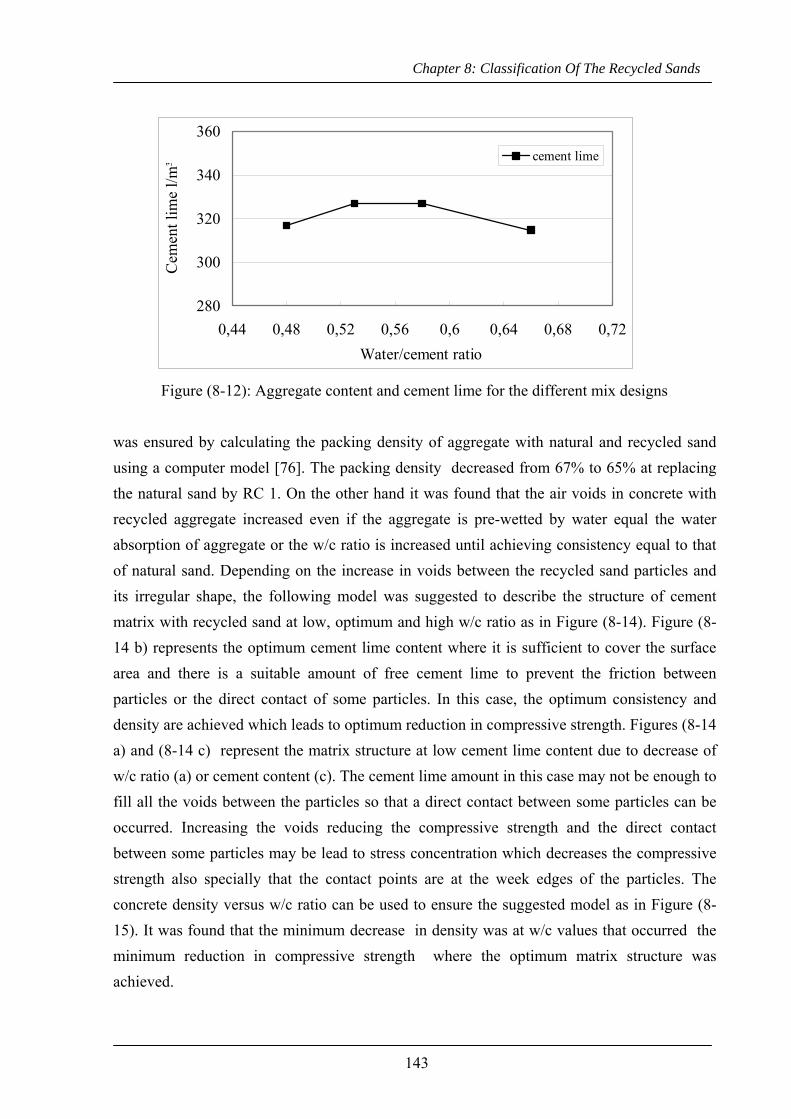
Chapter 8: Classification Of The Recycled Sands
143
280
300
320
340
360
0,44 0,48 0,52 0,56 0,6 0,64 0,68 0,72Water/cement ratio
Cem
ent l
ime
l/m³ cement lime
Figure (8-12): Aggregate content and cement lime for the different mix designs was ensured by calculating the packing density of aggregate with natural and recycled sand using a computer model [76]. The packing density decreased from 67% to 65% at replacing the natural sand by RC 1. On the other hand it was found that the air voids in concrete with recycled aggregate increased even if the aggregate is pre-wetted by water equal the water absorption of aggregate or the w/c ratio is increased until achieving consistency equal to that of natural sand. Depending on the increase in voids between the recycled sand particles and its irregular shape, the following model was suggested to describe the structure of cement matrix with recycled sand at low, optimum and high w/c ratio as in Figure (8-14). Figure (8-14 b) represents the optimum cement lime content where it is sufficient to cover the surface area and there is a suitable amount of free cement lime to prevent the friction between particles or the direct contact of some particles. In this case, the optimum consistency and density are achieved which leads to optimum reduction in compressive strength. Figures (8-14 a) and (8-14 c) represent the matrix structure at low cement lime content due to decrease of w/c ratio (a) or cement content (c). The cement lime amount in this case may not be enough to fill all the voids between the particles so that a direct contact between some particles can be occurred. Increasing the voids reducing the compressive strength and the direct contact between some particles may be lead to stress concentration which decreases the compressive strength also specially that the contact points are at the week edges of the particles. The concrete density versus w/c ratio can be used to ensure the suggested model as in Figure (8-15). It was found that the minimum decrease in density was at w/c values that occurred the minimum reduction in compressive strength where the optimum matrix structure was achieved.

Chapter 8: Classification Of The Recycled Sands
144
a b c Figure (8-14) : Matrix structure at low, optimum and high w/c ratio or cement lime
2,26
2,28
2,30
2,32
2,34
0,4 0,44 0,48 0,52 0,56 0,6 0,64 0,68 0,72
Water/cement ratio
Con
cret
e de
nsity
, kg/
dm³
. NS
RC 1
Figure (8-15): The relation between concrete density and w/c ratio for natural sand and RC 1 By return to Figure (8-11), there are four curves to correlate the R-value to w/c ratio at 30%, 50%, 75% and 100% recycled sand content but these relations seems to be widely parallel. So, the equation derived for 30% RC 1 will be used with addition correction factor depending on the recycled sand content. This correction factor was derived from the change in R-value at increasing the recycled sand content from 30% to 50%, 75% and 100% as presented in Figure (8-16). After addition the correction factor, the predicted R-value versus w/c ratio and recycled sand content is presented in Figure (8-17) while this form can be used to calculate it for w/c ratio from 0.48 to 0.66 : R = 97.5 (w/c)² - 112.5 (w/c) + 5,3As + 31.3 (8-11) where w/c : water to cement ratio from 0.48 to 0.66 ( w/c ratios beyond these values were not
investigated)

Chapter 8: Classification Of The Recycled Sands
145
As : recycled sand volume / total sand volume
y = 5.3x - 1,7R2 = 0.99
y = 2.1x2 + 2.5x - 0.9R2 = 0.9995
0,00,51,01,52,02,53,03,54,0
0 0,2 0,4 0,6 0,8 1
Recycled sand/total sand (As), -
Cor
rect
ion
valu
e, N
/mm
² .
Figure (8-16): The change in reduction of compressive strength (R-value) depending on the recycled sand content
Figure (8-17): The relation between the reduction in compressive strength and both w/c ratio and recycled sand content As

Chapter 8: Classification Of The Recycled Sands
146
The previous relation was derived for RC 1 but a relation was found between RC 1, RC 5 and RC 7 which consists of concrete sand and brick sand in different values. The brick content (Ab
) in these sands were 0, 20 and 95% respectively. So other factor is added to equation 8.11 to adjust it to be used for recycled sand which consists mainly of crushed concrete and brick in any ratio, equation (8-12). R = 97.5 (w/c)² - 112.5 (w/c) + 5,3 As –2,6 Ab
2+ 6,7 Ab + 31,3 (8.-12) Where, Ab: brick volume /total sand volume Because the correction factors were calculated depending on the average values of the different mixes for the same sand type and content of recycled sand , the compressive strength was calculated for all mixes (eq. 8.10 and 8.12) and plotted against the measured compressive strength as shown in Figure (8-18).
20
25
30
35
40
45
50
55
20 25 30 35 40 45 50 55Calculated compressive strength, N/mm²
Mea
sure
d co
mpr
essi
ve st
reng
th,
N/m
m²
Figure (8-18): Measured compressive strength versus the calculated compressive strength Similar relations were established for all the other recycled sands showing the same trend but with different optimum w/c and R-values because of the variation in the strength of the different recycled sands and may be in the particle shape.
8-3 The relation between concrete compressive strength and recycled sand characteristics
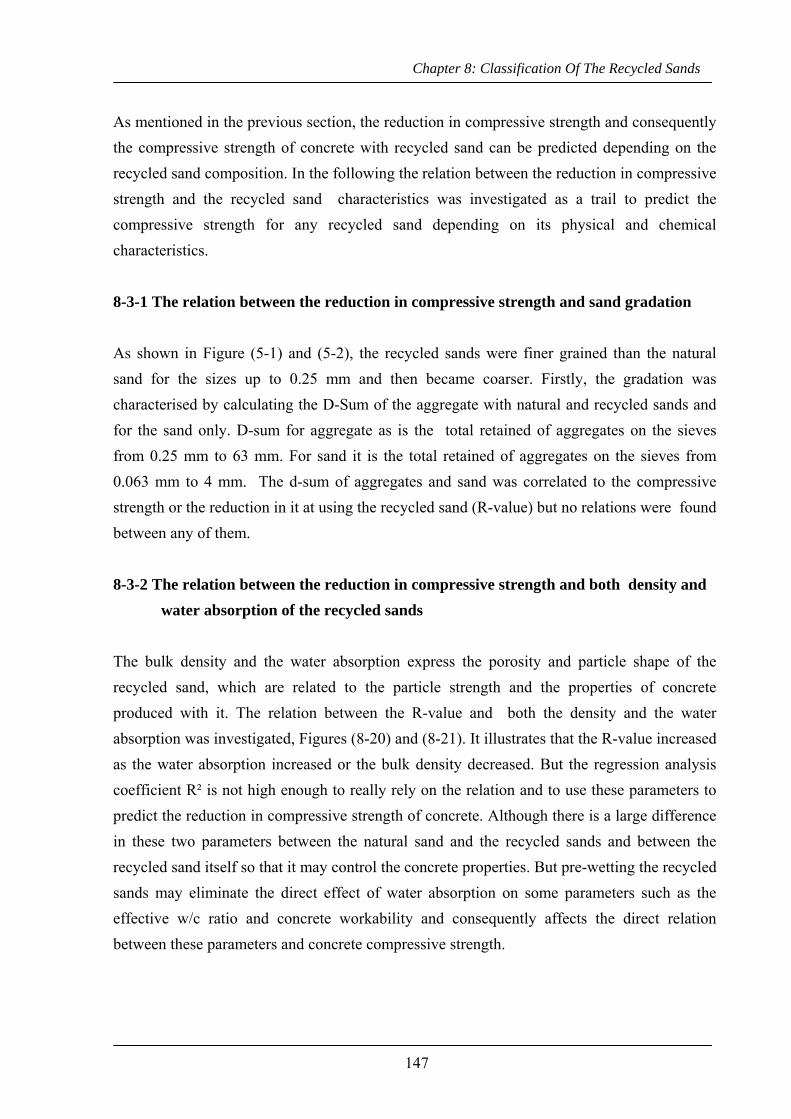
Chapter 8: Classification Of The Recycled Sands
147
As mentioned in the previous section, the reduction in compressive strength and consequently the compressive strength of concrete with recycled sand can be predicted depending on the recycled sand composition. In the following the relation between the reduction in compressive strength and the recycled sand characteristics was investigated as a trail to predict the compressive strength for any recycled sand depending on its physical and chemical characteristics. 8-3-1 The relation between the reduction in compressive strength and sand gradation As shown in Figure (5-1) and (5-2), the recycled sands were finer grained than the natural sand for the sizes up to 0.25 mm and then became coarser. Firstly, the gradation was characterised by calculating the D-Sum of the aggregate with natural and recycled sands and for the sand only. D-sum for aggregate as is the total retained of aggregates on the sieves from 0.25 mm to 63 mm. For sand it is the total retained of aggregates on the sieves from 0.063 mm to 4 mm. The d-sum of aggregates and sand was correlated to the compressive strength or the reduction in it at using the recycled sand (R-value) but no relations were found between any of them. 8-3-2 The relation between the reduction in compressive strength and both density and
water absorption of the recycled sands The bulk density and the water absorption express the porosity and particle shape of the recycled sand, which are related to the particle strength and the properties of concrete produced with it. The relation between the R-value and both the density and the water absorption was investigated, Figures (8-20) and (8-21). It illustrates that the R-value increased as the water absorption increased or the bulk density decreased. But the regression analysis coefficient R² is not high enough to really rely on the relation and to use these parameters to predict the reduction in compressive strength of concrete. Although there is a large difference in these two parameters between the natural sand and the recycled sands and between the recycled sand itself so that it may control the concrete properties. But pre-wetting the recycled sands may eliminate the direct effect of water absorption on some parameters such as the effective w/c ratio and concrete workability and consequently affects the direct relation between these parameters and concrete compressive strength.
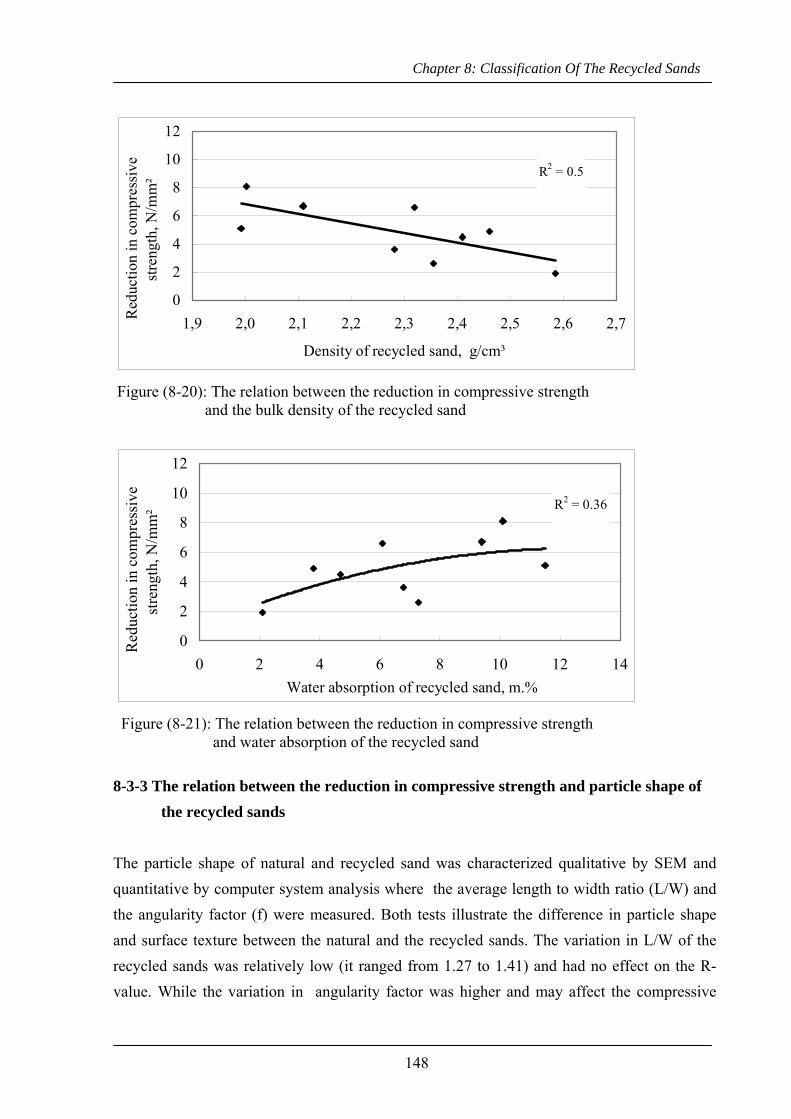
Chapter 8: Classification Of The Recycled Sands
148
R2 = 0.5
0
2
4
6
8
10
12
1,9 2,0 2,1 2,2 2,3 2,4 2,5 2,6 2,7
Density of recycled sand, g/cm³
Red
uctio
n in
com
pres
sive
.
stre
ngth
, N/m
m²
Figure (8-20): The relation between the reduction in compressive strength and the bulk density of the recycled sand
R2 = 0.36
0
2
4
6
8
10
12
0 2 4 6 8 10 12 14Water absorption of recycled sand, m.%
Red
uctio
n in
com
pres
sive
.
stre
ngth
, N/m
m²
Figure (8-21): The relation between the reduction in compressive strength and water absorption of the recycled sand 8-3-3 The relation between the reduction in compressive strength and particle shape of
the recycled sands The particle shape of natural and recycled sand was characterized qualitative by SEM and quantitative by computer system analysis where the average length to width ratio (L/W) and the angularity factor (f) were measured. Both tests illustrate the difference in particle shape and surface texture between the natural and the recycled sands. The variation in L/W of the recycled sands was relatively low (it ranged from 1.27 to 1.41) and had no effect on the R-value. While the variation in angularity factor was higher and may affect the compressive
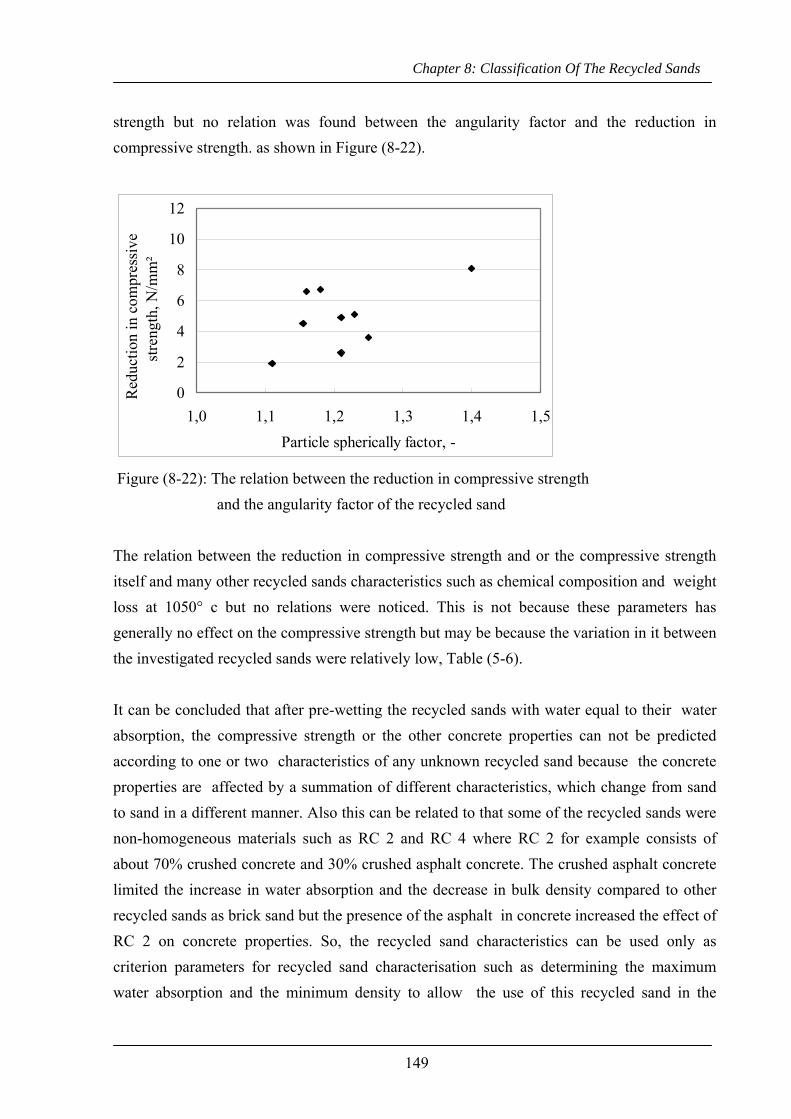
Chapter 8: Classification Of The Recycled Sands
149
strength but no relation was found between the angularity factor and the reduction in compressive strength. as shown in Figure (8-22).
0
2
4
6
8
10
12
1,0 1,1 1,2 1,3 1,4 1,5Particle spherically factor, -
Red
uctio
n in
com
pres
sive
.
stre
ngth
, N/m
m²
Figure (8-22): The relation between the reduction in compressive strength and the angularity factor of the recycled sand The relation between the reduction in compressive strength and or the compressive strength itself and many other recycled sands characteristics such as chemical composition and weight loss at 1050° c but no relations were noticed. This is not because these parameters has generally no effect on the compressive strength but may be because the variation in it between the investigated recycled sands were relatively low, Table (5-6). It can be concluded that after pre-wetting the recycled sands with water equal to their water absorption, the compressive strength or the other concrete properties can not be predicted according to one or two characteristics of any unknown recycled sand because the concrete properties are affected by a summation of different characteristics, which change from sand to sand in a different manner. Also this can be related to that some of the recycled sands were non-homogeneous materials such as RC 2 and RC 4 where RC 2 for example consists of about 70% crushed concrete and 30% crushed asphalt concrete. The crushed asphalt concrete limited the increase in water absorption and the decrease in bulk density compared to other recycled sands as brick sand but the presence of the asphalt in concrete increased the effect of RC 2 on concrete properties. So, the recycled sand characteristics can be used only as criterion parameters for recycled sand characterisation such as determining the maximum water absorption and the minimum density to allow the use of this recycled sand in the

Chapter 8: Classification Of The Recycled Sands
150
different applications. Nevertheless the concrete properties are related the composition of the recycled sand such as crushed concrete, bricks and lime-sand brick.
8-4 Maximum allowable amount of the recycled sands for the different concrete exposition classes
As mentioned in chapter 6, all investigated concrete properties are directly related to the kind and share of the recycled sand in the aggregate mixtures. The relations between the concrete properties and the amount of the recycled sand will be used here to determine the maximum allowable amount of the recycled sands. This is depending on the different concrete properties, different types of the recycled sand and the varied concrete composition due to the exposition classes according to EN 206 as shown in Table (3-4). This variation leads to different allowable shares of recycled sand for the same sand and the same mix design. The reduction in concrete compressive strength will be used to determine the maximum allowable share of the recycled sand because of the following:
1- The ordinary concrete is classified according to its compressive strength, 2- Some other properties such as splitting-tensile strength and modulus of elasticity of
concrete with recycled sands are directly related to its compressive strength in relations similar to those of concrete with natural sand, section 8-1,
3- The properties of concrete with recycled sands did not exceed the limits for the properties that have specification limits such as the freeze – thaw resistance, which means no special restrictions on the permitted amount of the recycled sand.
Then the standard limits of the other concrete properties will be used to adjust the maximum allowable share of the recycled sands that is derived depending on the reduction in compressive strength. Two different levels of accepted reduction in compressive strength are suggested, 10 % and 20% respectively 10% reduction means that the concrete class (C25/30, C30/37 …etc.) will not be changed by replacing the defined amount of natural sand by the individual recycled sand while 20% reduction means that the concrete has to be classified one strength class lower than the comparative concrete with 100% of natural sand. Figure (8-23) as an example shows the amounts of the different recycled sands that achieved 90% and 80% of the compressive strength of reference concrete with natural sand in Mix 1, which represented concrete

Chapter 8: Classification Of The Recycled Sands
151
according to exposition class XC1 with aggregate gradation AB16. The maximum allowable values of all recycled sands are summarized in Tables (8-2) and (8-3). For XC 1 and XC 4, ranges for the maximum allowable amount of recycled sands were established because different mix designs were used for these two concretes by using different aggregate gradations (AB16 and AB 32) and varied cement contents as in Table (3-4).
24262830323436384042
0 10 20 30 40 50 60 70 80 90 100Recycled sand content, vol.% of total sand
Com
pres
sive
stre
ngth
, N/m
m²
.
RC 1RC 2RC 3RC 4RC 5RC 6RC 7RC 9
10% reduction
20% reduction
Figure (8-23): The amounts of the different recycled sands at 10% and 20% reduction in compressive strength of Mix 1 Table (8-2): The maximum allowable amounts of the recycled sands at 10% reduction in compressive strength
Maximum amounts of the recycled sand, vol. % of total sand Sand type
XC 1 1) XC4 1) XF3 1) XF4 1)
RC 1 70 - 80 90 - 100 90 94
RC 2 33 - 42 36 - 45 32 27
RC 3 40 - 55 50 - 60 62 35
RC 4 40 - 50 28 - 42 30 25
RC 5 50 - 70 70 - 100 100 60
RC 6 42 - 55 50 - 62 70 42
RC 7 40 - 62 40 - 58 60 30
RC 9 31 - 45 26 – 45 42 25
LQ 1 100 100 not investigated
LQ 2 100 100 not investigated 1): Ranged according to w/c ratio, cement content and the gradation of aggregates, see Table (3-4)

Chapter 8: Classification Of The Recycled Sands
152
Table (8-3): The maximum allowable amounts of the recycled sands at 20% reduction in the compressive strength
Maximum amounts of the recycled sand, vol. % of total sand Sand type
XC 1 XC4 XF3 XF4
RC 1 100 100 100 100
RC 2 75 - 80 78 - 100 70 60
RC 3 95 - 100 100 100 70
RC 4 65 - 78 60 - 95 50 42
RC 5 100 100 100 100
RC 6 100 100 100 80
RC 7 100 90 - 100 100 75
RC 9 70 70 - 100 80 50
LQ 1 100 100 not investigated
LQ 2 100 100 not investigated
In the previous Tables, the recycled sand amount was given as a volume percentage of the total sand content, which was kept at 30% by mass of the total aggregate in all concretes. This means that these values can be used only if the sand is less than or about 30% of the total aggregate. To avoid this additional restriction factor, the maximum amounts of the recycled sands were estimated again as a volume percentage of the total aggregate and for more safety the lower range values of XC1 and XC 4 were used with approximating the values to the nearest lower integral number (for example exact value 11.8, established value 11 not 12). The maximum allowable amounts of the different recycled sands, according to the assumptions are presented again in Tables (8-4) and (8-5).

Chapter 8: Classification Of The Recycled Sands
153
Table (8-4): The maximum allowable amounts of the recycled sands at 10% reduction In the compressive strength
Maximum amounts of the recycled sand, vol. % of total aggregate Sand type
XC 1 XC4 XF3 XF4
RC 1 21 27 27 27
RC 2 10 11 10 8
RC 3 12 15 18 10
RC 4 12 8 9 7
RC 5 15 21 30 18
RC 6 12 15 21 12
RC 7 12 12 18 9
RC 9 9 8 12 7
LQ 1 30 30 not investigated
LQ 2 30 30 not investigated
Table (8-5): The maximum allowable amounts of the recycled sands at 20% reduction in the compressive strength
Maximum amounts of the recycled sand, vol. % of total aggregate Sand type
XC 1 XC4 XF3 XF4
RC 1 30 30 30 30
RC 2 22 23 21 18
RC 3 28 30 30 21
RC 4 20 18 15 12
RC 5 30 30 30 30
RC 6 30 30 30 24
RC 7 30 27 30 22
RC 9 21 21 24 15
LQ 1 30 30 not investigated
LQ 2 30 30 not investigated

Chapter 8: Classification Of The Recycled Sands
154
8-5 Classification of the recycled sands According to the maximum amount of the recycled sands that can be used in concrete, Tables 8-4 and 8-5, the recycled sands are classified into three groups. Table (8-6) presents the recycled sands of each group and the maximum amounts of the recycled sands for the different concrete exposition classes at a permitted reduction in compressive strength of 10% and 20% . In the first group GΙ, up to 100% of the natural sand can be replaced by the concrete crushed sands RC 1 and RC 5 and the crushed natural sands LQ 1 and LQ 2. This group is denoted as “ full replacement of natural sand is possible”. For the recycled sands of GΙΙ, an average amount of natural sand in the range from 30% to 70% can be replaced by these sands at 10% reduction in compressive strength while the full replacement is achieved only at reduction in compressive strength less than or equal 20%. It is denoted as “ Partial replacement of natural sand is preferred”. The recycled sands of the third group GΙΙΙ can be used in valuable amount for concrete exposition classes XC1 – XC4 only at a reduction in compressive strength less than or equal 20%. These sands are described as “ not recommended to be reused in concrete”. Table (8-6): Classification of the recycled sands and the maximum allowable amount of each
group with respect to the concrete compressive strength max. amount of RC-sand vol. % of
sand for R-value < 10% max. amount of RC-sand vol. % of
sand for R-value < 20% group sand
XC 1 – XC 4 XF3 & XF4 XC 1 – XC 4 XF3 & XF4
G Ι
RC1 RC5 LQ1 LQ2
70 - 100 1) 60 - 100 100 100
G ΙΙ
RC3 RC6 RC 7
40 - 60 30 - 70 90 - 100 70 - 100
G ΙΙΙ
RC2 RC4 RC9
25 - 50 25- 40 65 - 100 40 - 70
1): Ranged according to w/c ratio, cement content and the gradation of aggregates, see Table (3-4)

Chapter 8: Classification Of The Recycled Sands
155
This classification was reviewed with regard to the other properties of concrete. For the splitting-tensile strength and the modulus of elasticity, it was found that the relations between the compressive strength and these two properties were similar to that of concrete with natural aggregate, see section 8-1. So the classification according to the compressive strength represents these properties as well. For the other properties of concrete, two sands from each group were selected for further investigations such as shrinkage, carbonation and freeze-thaw with and without deicing salt. For shrinkage as in Figure (6- 38 ), the recycled sands RC 1 and RC 5 which represent G Ι achieved the lowest shrinkage rate while RC 4 , which represent G ΙΙΙ, with RC 9 caused the highest shrinkage rate. The only exception is that RC9 from G ΙΙΙ achieved an average shrinkage rate as the recycled sands RC 3 and RC 7 of G ΙΙ. With respect to carbonation values as a durability measure for the concrete exposition classes XC1- XC 4, generally the carbonation depth was not considerably increased by a replacement the natural sand by the recycled sands, see Figures (6-41) and (6-42). The highest increase was found by concrete with RC 9 from G ΙΙΙ where it arose the carbonation depth by only one mm at one year age or in percentages ranged from 16% to 20% in the different mixes while all the other recycled sands increased it in values less than or equal 10% . In Mix 3, which represents XC 4, the carbonation depths for some recycled sands were equal or less than that of natural sand. This leads to the result that the carbonation of concrete with recycled sands did not change the classification of the recycled sands based on the compressive strength. The frost de-icing salt test (CDF-test)) was performed as a durability test for concrete exposition class XF 4 and the results indicated that the weight loss did not exceed the limit (1500 g/m²) for all investigated recycled sands as in Figure (6-45). With respect to the classification, the weight loss of RC 9 from G ΙΙΙ was significantly higher than that of the other recycled sands from G Ι and G ΙΙ, which ensure the recommendation that the recycled sands of GΙΙΙ are not recommended to reuse in concrete especially in concrete supposed to the attack by freeze-thaw and deicing salt although the amount of RC 9 in Table (8-6) can be used without exceeding the limit of weight loss. The recycled sands from G Ι and G ΙΙ achieved low and approximately similar weight loss. For Mix 5 of concrete exposition class XF 3, the freeze- thaw test (CF-test)without deicing salt was used to investigate the concrete durability. Because there is no limit in the specification for the weight loss in this test, the results are used only to check the classification in Table (8-6). The weight loss values indicate that the recycled RC 1 and RC 5 sands from G Ι achieved the lowest weight loss while the average and highest values were

Chapter 8: Classification Of The Recycled Sands
156
found agian for the recycled sands from G ΙΙΙ and G ΙΙ respectively, see Figure (6- 47). Although the weight loss values of the recycled sands from G ΙΙΙ is lower than these of G ΙΙ , it can not be used to change the classification in Table (8-6) or to increase the amount of these sands in concrete because these sands are not recommended to be reused in concrete depending on their effect on the other properties of concrete. It can be concluded that the recycled sands can be classified according to the concrete compressive strength as in Table (8-6) and the amounts in the Table can be used as the maximum allowable recycled sand for the different concrete exposition classes with the recommendation that the recycled sands of G ΙΙΙ are not recommended to be reused in concrete especially that supposed to freeze-thaw attack.

Chapter 9: Summary, Conclusions And Recommendations
157
9- SUMMARY, CONCLUSIONS AND RECOMMENDATIONS
9-1 Background and objective of the research In the last two decades, as a result of the drive towards waste-poor world and reserving the non-renewable materials, recycling the construction and demolition materials become very essential. The previous studies concentrated on evaluation of the reuse of recycled concrete aggregate more than 4 mm with natural sand and in a low – grade applications in most cases. While the sand portion that represent about 30% to 60% of the crushed demolition materials is disposed off. Not only the recycled concrete sand but also recycled sands from different construction and demolition materials were established as the target of this research. The investigated reuse of these sands were with natural coarse aggregates and in high-grade applications included four concrete exposition classes as well as hot bituminous mixtures as. In addition to bituminous mixtures, two of the selected concrete exposition classes (XF3 and XF4) are suitable for pavements construction. The objective of this work is characterisation of the different recycled sands and classification of them according to their influence on properties of concrete and bituminous mixtures. 9-2 Work program To accomplish this research, recycled concrete sand was produced in the laboratory while nine recycled sands produced from construction and demolitions materials and two sands from natural crushed limestone were delivered from three plants. The physical and chemical characteristics of these sands as well as their environmental suitability were measured. Ten concrete mix designs representing the concrete exposition classes XC1, XC2, XF3 and XF4 according to European standard EN 206 were produced with partial and full replacement of natural sand by the different recycled sands. In these mix designs, the two mix gradations AB16 and AB32 were used with cement contents ranged from 280 to 360 kg/m³ and w/c ratio from 0.48 to 0.66. The amounts of the recycled sands were 0.0%, 9%, 15%, 21% and 30 vol.% of total aggregate. Different properties of the fresh and hardened concrete with recycled sands were analysed.. The durability of concrete according to the application of each

Chapter 9: Summary, Conclusions And Recommendations
158
mix was also evaluated. A model was suggested to describe how the recycled sands affect the behaviour of concrete. Bituminous mixtures achieving the requirements of base and binder courses were produced with basalt and limestone coarse aggregate and six of the recycled sands as a substitution to the natural sands. The recycled sand contents were kept constant in both basalt and limestone mixes at 0.0 %. 9%, 15% and 21 m.% of total aggregate mass. Marshall properties of the bituminous mixtures and the effect of water action on them were investigated. According to the specifications limits for concrete and bituminous mixtures mixes and the effect of recycled sands on their performance, the maximum allowable amounts from the different recycled sands in the different applications were determined and used to classify these sands in three groups for concrete.
9-3 Conclusions The laboratory tests results for ten recycled sands and two crushed limestone sands as well as the results of 511 concrete mixes and 35 bituminous mixtures were used in this investigation. Depending on analysis of these results, the following conclusions can be extracted: 9-3-1 Characterisation of the recycled sands - The specification limits for natural aggregate were not exceeded by any of recycled sands
and the two natural limestone sands, - The variations in the physical characteristics of the recycled sands such as the water
absorption, density, particle shape and surface textures were significant and more than these in their chemical compositions,
- The recycled sands can be characterized significantly according to their composition and water absorption,
- The existed tests for water absorption of natural sand give inaccurate and not actually results for the recycled sands. The following form was derived to predict the water absorption from the water demand (MWD) of standard mortar produced with the recycled sand to achieve a spread value equal to that of the natural sand:
WA = 0.059 MWD – 12.4 R² = 0.90

Chapter 9: Summary, Conclusions And Recommendations
159
- Processing of the recycled sands significantly affect their quality however elimination the
binder materials and the angularity of the particles improves the quality. - 9-3-2 Concrete properties - It is possible to replace the natural sand by the different recycled sands in concrete up to
C35/45 without technical problems especially for the recycled concrete sands. - Although the recycled sands were pre-wetted with additional water equal to their water
absorption for 10 minutes before mixing, the concrete consistency decreased considerably at replacement natural sand with the different recycled sands.
- The natural sand can be totally replacement by the natural limestone sands LQ1 and LQ2 as well as the recycled concrete sands RC1 and RC5 without changing the concrete class.
- The other recycled sands reduced the compressive strength in varied values ranged from 13% to about 35% depending on the recycled sand type and the mix design.
- The compressive strength of concrete produced by recycled sands can be optimised by adjustment the concrete mix design.
- The splitting- tensile strength of concrete with recycled sands can be derived from the compressive strength using the relation presented in DIN 1045-1 (fsp = 0.3 fcm 2/3
).
- The dynamical modulus of elasticity for concrete produced by recycled sands can be derived from the compressive strength using this form: Edyn = 54000 fcm0.551
.
- The shrinkage of concrete after one year for all recycled sands increased by values ranged from 18% to about 40% but the values were the range of normal concrete.
- The concrete durability as an important parameter for evaluation the influence of using the recycled sands shows that no significant effect on the carbonation depth after one year. The decrease in the frost de-icing salt resistance for all recycled sands is not considerable for all recycled sands other than RC9.
9-3-3 Properties of the bituminous mixtures - Use of the different recycled sands in the hot asphalt mixtures up to 21% of total
aggregate mass is possible in both base and binder courses. - Using the recycled sands decreased the mix density in considerable values and increased
the binder content required to achieve the maximum value. Producing lighter asphalt may be saving the cost more that the increase I the required bitumen

Chapter 9: Summary, Conclusions And Recommendations
160
- Using the recycled sands increase the mix stability for all recycled sands or keep it constant.
- The main aspect of the influence of the recycled sand on the mix properties is that all the recycled sands decreased the voids in mineral aggregates which may not offer an enough space for the effective bitumen and the required air voids in the mix.
- Due to the reduction in the VMA values and increasing the aggregate volume in the mix the stability increases and the flow values decreases at the same time which increase the mix stiffness significantly
- The values of the optimum binder content (OBC) increases as the water absorption of the recycled sands increase.
- As measure to durability and the water action resistance the stability values after immersion in water at 60°C for 48 hours showed that the loss in stability were from 6% to 11% in compared to 5% for reference mix.
- Using bitumen 50/70 instead of Bitumen 70/1000 improved all the mix properties. 9-3-4 Classification of the recycled sands According to the effect of replacement the natural sand by the different recycled sands on the concrete compressive strength and durability, the recycled sands are classified into three groups as shown in table (8- ). For the bituminous mixtures mixes all the investigated recycled sands can be used in mixes for base and binder courses up to 21% of the total aggregate mass while only it is suggested to limit the amount of RC7 to about 10% until further investigation of the stiffness
9-4 Recommendations In general the quality of the recycled aggregates can be difficult to control or to clearly define if the aggregate production is to based on a general reception of urban building waste from a variety of sources and especially for the recycled sands. It is difficult to determine the composition of the recycled sands after crushing it and no of the measured properties can be used alone o characterise it specially for using it in concrete. For that the buildings should be considered as a geological resource, where different parts of the building structures are suited for different recycling process and some parts are completely unsuitable for further processing. Prior to demolition concrete structures should be surveyed in order to ascertain their best future use.

Chapter 9: Summary, Conclusions And Recommendations
161
Producing recycled sands with lower angularity and smoother surface textures may eliminated a considerable value from the negative effect of the recycled sands on concrete properties, which need more attention and development in the processing technology. Development a new tests for water absorption, density and strength of the recycled sands are needed. The proportion of aggregates in bituminous mixtures design should be by volume as in concrete not by mass at using the recycled sands with development the existed standard limits for the mix gradation. The influence of effective bitumen in the bituminous mixtures on the durability and flexibility of bituminous mixtures need further investigation. and the minimum value of binder content should be increased. The effect of the extreme increase of the Marshall stiffness of the bituminous mixtures at its durability and flexibility should be investigated at using the recycled sands.

Chapter 9: Summary, Conclusions And Recommendations
162

Chapter10: References
163
10- REFERENCES
[1] Collins, R.J. and Ciesielski, S.K.: Highway construction use of wastes and by-
products. Utilization of waste materials in civil engineering construction. ASCE
Journal of Material in Civil Engineering, Vol. 2, Nr. 65, 1992, pp 140-152.
[2] Hensen, T.C., : Recycling of Demolished Concrete and Masonry. RILEM report
6, F & FN Spon, London 1992.
[3] Tavakoli, M. and Soroushia, P.: Strengths of recycled aggregates concrete made
using field-demolished concrete as aggregate. ACI Material Journal, Vol. 2, Nr.
93, 1996, pp 182-190.
[4] Khaloo, A.R.: Properties of concrete using crushed clinker brick as coarse
aggregates. ACI Material Journal, Vol. 2, Nr. 91, 1994, pp 401-407.
[5] Labib, A. M. : Study of the characteristics of the available materials for the
flexible pavement in Egypt. master thesis, Zagazig University , 1990.
[6] Arbeitsgemeinschaft Kreislaufwirtschaftsträger Bau, 3. Monitoring – Bericht
Bauabfälle. Berlin / Düsseldorf / Duisberg, 31 Oktober 2003.
[7] Schmidt, M.: Technische ökologische und wirtschaftliche Einflüsse auf die
derzeitigen und zukünftigen Mengen an rezyklierten Baustoffen: Gutachten im
Auftrag des Bundesverbandes Baustoffe – Steine und Erden In.
Bundesverbandes Baustoffe – Steine und Erden e.V.: Der Bedarf am
mineralischen Baustoffen. Frankfurt/Main, 2000, S. 75-191.
[8] Rahlwes, K.: Recycling von Stahlbeton- und Stahlbetonverbundkonstruktion –
Ansätze zu einer umweltökonomischen Bewertung: In. Deutscher Beton-Verein
e. V. (Hrsg.). Vorträge auf dem Deutschen Betontag 1991 von 25. bis 27. April
1991 in Berlin, Wiesbaden 1992, S. 215-247.

Chapter10: References
164
[9] Budelmann , H. and Dora B.: Eigenschaften von Recyclingbeton, Deutsche
Forschung Gemeinschaft, Sonderforschungsbereich 385 : Baustoffrecycling.
(DFG-SFB 385, Universität Magdeburg. Forderperiode 1995/1996 Teilprojekt
C1
[10] Charisius, K., Drechsel, W., Hummel, A.: Ziegelsplittbeton. DAfStb-Heft, Nr.
110, Beuth-Verlag, Berlin, 1952.
[11] Wedler, B. ; Hummel, A.: Trümmerverwertung und Ausbau von Brandruinen.
Ernst &Sohn: Berlin, 1946.
[12] Nixon, P.J.: Recycled Concrete as an aggregate for concrete - a review.
Matériaux et constructions, Paris, Vol. 11, Nr. 65, 1978, S. 371-378.
[13] Kerkhoff, B.; Siebel, E.: Eigenschaften von Beton mit rezyklierten
Gesteinskörnungen. In Beton 2001, S.47.
[14] Sherwood, P.T.: Alternative materials in road construction: A guide to use of
waste, recycled materials and by products. Thomas Telford, 1995.
[15] Franke, H.-J.: Recycling von Betondecken im Autobahnbau (I). Straße und
Autobahn, Nr. 10, 1993, S. 615–621.
[16]
Franke, H.-J.: Recycling von Betondecken im Autobahnbau. Beton, 1994, S. 29–
34
[17] Sommer, H.: Beton aus Altbeton. Zement und Beton, 1990, Nr. 4, S. 46
[18] DAfStb-Richtlinie: Beton mit rezykliertem Zuschlag, Berlin: Beuth-Verlag,
August 1998.
[19] DAfStb-Richtlinie: Beton nach DIN EN 206-1 und DIN 1045-2 mit rezyklierten
Gesteinkörnungen, Berlin: Beuth-Verlag, Dezember 2004.

Chapter10: References
165
[20] DIN 4226-100, Gesteinskörnungen für Beton und Mörtel. Teil 100: Rezyklierte
Gesteinskörnungen, Berlin: Beuth, Februar 2002.
[21] Roos, F.: Ein Beitrag zur Bemessung von Beton mit Zuschlag aus rezyklierter
Gesteinskörnung nach DIN 1045-1. genehmigte Dissertation, Technische
Universität München, 2001.
[22] Ravindrajah, R.S. Loo, Y.H., Tam, C.T.: Strength evaluation of recycled –
aggregate concrete by in-site tests. Matériaux et Constructions, Nr. 21, 1988
S.289–295
[23] Eurocode 2, Planunug von Stahlbeton- und Spannbetontragwerken. Deutsche
Fassung ENV 1992-1-1, 1991 Hrsg, CEN. Juni 1992.
[24] Dahms, J., Brune, G.: Wasseraufnahme und Rohdichte von Betonbruch. Beton
Nr. 8, 1996, S. 480-486.
[25] Friedl, L., Schießl, P.: Bewertung der bei der Aufbereitung von Altbeton
anfallenden Granulate hinsichtlich der Eignung als Betonzuschlag. BMBF-
Forschungsvorhaben, Lst. f. Baustoffkunde und Werkstoffprüfung der TU
München, Eigenverlag, 1999, Bericht Nr. F3188.
[26] Buyle-Bodin, F., Hadjieva-Zaharieva, R.: Influence of industrially produced
recycled aggregates on flow properties of concrete. Materials and Structures,
Vol. 35 (September-October), 2002, S. 504-509.
[27] Kobayashi, S., Kawano, H.: Properties and usage of recycled aggregate
concrete. Proceedings of 2nd int. RILEM Symposium „Reuse of Demolition
Waste“. Chapman and Hall, Vol. 2, 1988, S. 547-556.
[28] Breitenbücher, R., Buchnik, J., Eibel, J., Grübel, P., Kohler, G., u. a.: Umweltge-
rechter Rückbau und Wiederverwertung mineralischer Baustoffe,
Sachstandsbericht. Deutscher Ausschuss für Stahlbeton, H. 462, Beuth- Verlag
Berlin, 1996.

Chapter10: References
166
[29] Kerkhoff, B., Siebel, E., Eigenschaften von Beton mit rezyklierten
Gesteinkörnungen. Beton [1/2001], Teil 2, S. 47-50.
[30] G Van der Wegen; R Haverkort: Recycled construction demolition wastes as a
fine aggregate for concrete, Sustainable construction : use of recycled concrete
aggregates, proceedings of the international symposium organized by the
university of Dundee, London, UK, 1998.
[31] Budnik, J., Grübl. P., Hora, M.: Beton aus Recyclingzuschlägen.
Umweltgerechter Rückbau und Wiederverwertung mineralischer Baustoffe.
DAfStb-Heft, Beuth-Verlag, Berlin, Nr. 462, 1996, S. 141-168.
[32] Feix, R.: Untersuchung über die möglichen Veränderungen spezifischer
Gesteins-eigenschaften von Splitten durch verschiedene Zerkleinerungssysteme.
Forschungs-bericht Nr. 9.33, Lst. f. Baustoffkunde und Werkstoffprüfung der
TU München, Eigenverlag, 1978.
[33] Gluth, K.-H.: Verwitterungsbeständigkeit von Recycling-Baustoffen;
Informationen über Straßenbau- und Straßenverkehrsforschung. Straße und
Autobahn, Nr. 9, 1993, S. 555
[34] Krass, K.: Bautechnische und ökologische Aspekte des Beton-Recyclings.
Betonwerk und Fertigteiltechnik, Nr. 1, 1994, S. 103-108
[35] Springenschmid, R., Fleischer, W.: Zur Technologie der Wiederverwendung von
altem Straßenbeton. Straße und Autobahn, Nr. 12, 1993, S. 715-718.
[36] Hansen, T.C.: Recycled aggregates and recycled aggregate concrete – second
state-of-the-art-report developments 1945-1985. Matériaux et Constructions,
Vol. 19, Nr. 111, 1986, S. 201–246.
[37] Nicolay, Jörg, Schulz, Ralf-Reiner: Transportbeton mit Recyclingsand. Wiss. Z.
Hochsch. Arbeit. Bauwes. – Weimar 40, 1994, 5/6/7.
Chapter10: References
167
[38] Dora, B.: Hydraulisch erhärtende Baustoffe aus Betonbrechsand
Phasenveränderungen durch Temperaturbehandlung. Dr.-Ing Dissertation,
Fachbereich für Bauingenieurwesen der Technischen Universität Carlo
Wihlemina zu Braunschweig.
[39] Schubert, P.: Umweltverträgliche Verwertung vom Mauerwerk – Baureststoffen.
Institut für Bauforschung, RWTH Aachen, 1997
[40] Müller, Ch., Dora, B.: Wiederverwertung von Brechsand aus Bauschutt,
Schriftenreihe des deutschen Ausschusses für Stahlbeton, Heft 506, Berlin,
Beuth –Verlag, 2000
[41] Eden, W.: Widerverwertung von Kalksandsteinen aus Abbruch von Bauwerken
bzw. fehlerhaften Steinen aus dem Produktionsprozess, Bundesverband
Kalksandsteinindustrie e.V. Forschungsbereicht Nr. 80, Hannover, 1994.
[42] Kenai, S., Dbieb, F., Azzouz, L.: Mechanical properties and durability of
concrete made with coarse and fine recycled aggregates. Proceedings the
international conference held at the university of Dundee, Scotland, UK,
September 2002.
[43] Dillmann, R., Beton mit rezyklierten Zuschlägen, Beton [2/1999], S. 86-91
[44] Eickschen, E., Siebel, E.: Verwendung von Betonbrechsand als Zuschlag für
Betonfahrbahndecken. Straße und Autobahn 9/98, S. 494-505
[45] Deisel, M.: Recycling von Hochbaurestmassen – Herstellung von
Recyclingbeton aus Hochbaurestsoffen, Zement und Beton. 1993, Nr. 1, S. 19-
19.
[46] Lukas, W.: Konzept für die Herstellung von Recycling-Beton aus
Baurestmassen- Zuschlägen. Betonwerk + Fertigteil- Technik, Nr. 10, 1994, S
68-75.

Chapter10: References
168
[47] Amjad, M., Tazeen, A., Farruch, G. and Devendras, R.: Variation in strength of
concrete on addition of demolition waste. The Indian Journal, 1998, P. 395 –
399.
[48] Dessy, P., and Nironi, I.,: The mechanical and physical performance of building
components made with recycled aggregates. Congress proceeding R’99, Vol. 3,
Geneva Switzerland, 1999, pp 209 – 213.
[49] Ryu, J.S.: An experimental study on the effect of recycled aggregate on concrete
properties. Magazine of Concrete Research, Vol. 54, 2002, S. 7-12.
[50] Sagoe-Crentsil, K.K., Brown, T., Tayler, A.H.: Durability and performance
characteristics of recycled aggregate concrete. Proceedings of the 9th
international conference on durability of Materials and Components,
Brisbane, Australien, 2002,
[51] Khalaf, F.M.: Recycling of clay bricks as aggregates in asphalt concrete. RILEM
Report 6, E & FN Spon, London 1992.
[52] Abeyasinghe, M.C.L., Khalaf, F.M.: Recycling of concrete as aggregate in
bituminous mixes. Concrete Communication conference, 2001.
[53] Javed, S., Lovell, C.W. and Wood, L. E.: Waste foundry sand in asphalt
concrete, Transportation Research Record, No. 1437, Washington, D.C., 1994,
pp 27 –34.
[54] Javed, S., Lovell, C.W.: Use of waste foundry sand in high construction, In
proceedings of 44th Highway geology symposium, Tampa, Florida, May 1993.
[55] Recycled concrete in asphalt mix. http://www.dot.state.oh.us/testlab/In-House-
Research/Asphalt%20using%20recycled%20concrete

Chapter10: References
169
[56] Majidzadeh, K.: Users manual-power plant bottom ash in black base and
bituminous surface: state-of-the art report FHWA report No. FHWA-RD-77-
148, September 1979
[57] Majidzadeh, K.: Executive summary-plant bottom ash in black base and
bituminous surfacing, FHWA report No. FHWA-RD-79-72, September 1979.
[58] Moulton, L.K., Seals, R.K. and Anderson, D.A.: Bottom Ash: An engineering
Material, journal of soil mechanics and foundations division, American society
of civil engineers, vol.98, No. SM4, April 1972, pp 311 – 325.
[59] Lignite slag paves the way, Industrial and engineering chemistry, Vol. 51, No. 7,
July 1959, pp 37A – 38A.
[60] Forschungsgesellschaft für Straßen- und Verkehrswesen, Arbeitsgruppe
Asphaltstraßen: Zusätzliche Technische Vertragsbedingungen und Richtlinien
für den Bau von Fahrbahndecken aus Asphalt (ZTV Asphalt - Stb 01, Ausgabe
2001), Bonn, März 2001.
[61] The standard specifications for highways and bridges, Road and Bridges
Authority, Cairo, Egypt, 1989.
[62] 1985 Annual book of ASTM standards, 04.02 Roads and Pavements, Publication
Code Number(PCN). 01- 040285 –07, Philadelphia, USA
[63] Setzer, M., Hartmann, V.: Verbesserung der Frost-Tausalz-
Wiedersrtandsprüfung, CDF – Test – Prüfvorschrift. Betonwerk +
Fertigteiltechnik, Nr. 9, 1991, S. 73-82.
[64] Setzer, M., Hartmann, V.: CDF-Test-Prüfvorschrift. Betonwerk +
Fertigteiltechnik, Nr. 9, 1991, S. 83-86.

Chapter10: References
170
[65] Ramesh, C.K., and Chopra, S.K.: Determination of tensile strength of concrete
and mortar by split test, The Indian Concrete Journal, No. 34, Vol. 9,1960, pp
354 – 357.
[66] Sen, B.R., and Desayi, P.: Determination of tensile strength of concrete by
splitting a cube along its diagonal plane, The Indian Concrete Journal, No. 36
Vol. 7, 1962, pp 249 – 252.
[67] Efsen, A., and Glarbo, O.: Tensile strength of concrete determined by cylinder
splitting test. Betonog jerbeton, Nr. 8, H. 1, Copenhagen, 1956, pp 33-39.
[68] Vinayaka, M. R.:The relation between crushing strength and tensile splitting
strength of concrete. C.B.J., 29th Session, Hyderabad, 1959.
[69] Mehta, P. K, and Monteiro, P. J. M.: Concrete (Structure, Properties, and
Materials). Second edition, Prentice Hall, Englewood cliffs, NJ 07632.
[70] Brown, S. F., and Cooper, K.E.: The mechanical properties of bituminous
materials for road bases and base course. Proceedings AAPT, vol. 53, 1984 pp
415-437.
[71] Farley, F. M.: Mechanism of absorption of bituminous materials by aggregate.
Proceedings of the Association of Asphalt Paving Technologists, vol. 13, 1942,
pp 41-51.
[72] Lee, D.: The relation between physical and chemical properties of aggregates
and their asphalt absorption. Proceedings of the Association of Asphalt Paving
Technologists, Vol. 38, 1969, pp 242-275.
[73] Bonzel, J.: Über die Spaltzugfestigkeit des Betons. Betontechnische Berichte
1964, Beton – Verlag GmbH, Düsseldorf, 1965, pp 59-96.

Chapter10: References
171
[74] Heilmann, H. G.: Beziehungen zwischen Zug- und Druckfestigkeit des Betons.
Beton, Heft 2, 1969, S. 68-70.
[75] Ebling, K., Knopp, W., Pickardt, R.: Beton-Herstellung nach Norm. Hrsg.
Bundesverband der Deutschen Zementindustrie, Köln, Düssledorf, 2001.
[76] Geisenhanslüke, C.: Computergestützte Modellierung und Berechnung zur Ermittlung der Packungsdichte von Schüttgütern. unpublished, Kassel. University, 2002.

Appendix A
Appendix A
Figure (A-1): Marshall Properties of mix 1 with natural sand
A-1
2,52
2,54
2,56
2,58
2,60
2,62
3 4 5 6 7Binder content, m.%
Mix
den
sity
, g/c
m³
.
456789
101112
3 4 5 6 7Binder content, m.%
Stab
ility
, KN
.
012345678
3 4 5 6 7Binder content, m.%
AV
, vol
.%
0
2
4
6
8
10
12
3 4 5 6 7Binder content, m.%
Flow
, mm
14,014,515,015,516,016,517,017,518,0
3 4 5 6 7Binder content, m.%
VM
A, v
ol.%

Appendix A
Figure (A-2): Marshall Properties of mix 1 with 9 m.% RC 1
A-2
2,48
2,50
2,52
2,54
2,56
2,58
3 4 5 6 7Binder content, m.%
Mix
den
sity,
g/c
m³
.
456789
10111213
3 4 5 6 7Binder content, m.%
Stab
ility
, KN
.
0
1
2
3
4
5
6
7
3 4 5 6 7Binder content, m.%
AV
, vol
.%
0123456789
10
3 4 5 6 7Binder content, m.%
Flow
, mm
14,014,515,015,516,016,517,017,518,0
3 4 5 6 7Binder content, m.%
VM
A, v
ol.%
Appendix A
2 62 11

Figure (A-3): Marshall Properties of mix 1 with 9 m.% RC 3
A-3
2,52
2,54
2,56
2,58
2,60
2,62
3 4 5 6 7Binder content, m.%
Mix
den
sity
, g/c
m³
.
4567
89
10
11
3 4 5 6 7Binder content, m.%
Stab
ility
, KN
.
0
1
2
3
4
5
6
3 4 5 6 7Binder content, m.%
AV
, vol
.%
0
2
4
6
8
10
12
3 4 5 6 7Binder content, m.%
Flow
, mm
13,013,514,014,515,015,516,016,517,0
3 4 5 6 7Binder content, m.%
VM
A, v
ol.%
Appendix A
2,58 13

Figure (A-4): Marshall Properties of mix 1 with 9 m.% RC 5
A-4
2,48
2,50
2,52
2,54
2,56
2,58
3 4 5 6 7Binder content, m.%
Mix
den
sity
, g/c
m³
.
456789
10111213
3 4 5 6 7Binder content, m.%
Stab
ility
, KN
.
012345678
3 4 5 6 7Binder content, m.%
AV
, vol
.%
0123456789
10
3 4 5 6 7Binder content, m.%
Flow
, mm
13,013,514,014,515,015,516,016,517,0
3 4 5 6 7Binder content, m.%
VM
A, v
ol.%
Appendix A
52
541516

Figure (A-5): Marshall Properties of mix 1 with 9 m.% RC 7
A-5
42
44
46
48
50
52
3 4 5 6 7Binder content, m.%
89
101112131415
3 4 5 6 7Binder content, m.%
Stab
ility
, KN
.
012345678
3 4 5 6 7Binder content, m.%
0112233445
3 4 5 6 7Binder content, m.%
Flow
, mm
13,013,514,014,515,015,516,016,517,0
3 4 5 6 7Binder content, m.%
Appendix A
2 52
2,54
2,56
m³
. 11
12
.

Figure (A-6): Marshall Properties of mix 1 with 9 m.% RC 9
A-5
2,44
2,46
2,48
2,50
2,52
3 4 5 6 7Binder content, m.%
Mix
den
sity
, g/c
m³
6
7
8
9
10
3 4 5 6 7Binder content, m.%
Stab
ility
, KN
.
0123456789
3 4 5 6 7Binder content, m.%
AV
, vol
.%
0
1
2
3
4
5
6
3 4 5 6 7Binder content, m.%
Flow
, mm
13,013,514,014,515,015,516,016,517,0
3 4 5 6 7Binder content, m.%
VM
A, v
ol.%
Appendix A
2,48
2,50
2,52
g/cm
³ .
101112
13
KN
.

Figure (A-7): Marshall Properties of mix 1 with 21 m.% RC 1
A-7
2,40
2,42
2,44
2,46
2,48
3 4 5 6 7Binder content, m.%
Mix
den
sity
, g/c
6789
10
3 4 5 6 7Binder content, m.%
Stab
ility
, KN
0123456789
3 4 5 6 7Binder content, m.%
AV
, vol
.%
01122334455
3 4 5 6 7Binder content, m.%
Flow
, mm
13,013,514,014,515,015,516,016,517,0
3 4 5 6 7Binder content, m.%
VM
A, v
ol.%
Appendix A
2,50
2,52
2,54
ty, g
/cm
³ .
8
10
12
y, K
N .

Figure (A-8): Marshall Properties of mix 1 with 21 m.% RC 2
A-8
2,44
2,46
2,48
,
3 4 5 6 7Binder content, m.%
Mix
den
sity
,
4
6
8
3 4 5 6 7Binder content, m.%
Stab
ility
, K01122334455
3 4 5 6 7Binder content, m.%
AV
, vol
.%
0
2
4
6
8
10
12
3 4 5 6 7Binder content, m.%
Flow
, mm
11,011,512,012,513,013,514,014,515,015,516,0
3 4 5 6 7Binder content, m.%
VM
A, v
ol.%
Appendix A
2,50
2,52
2,54
2,56
nsity
, g/c
m³
.
7
8
9
bilit
y, K
N .

Figure (A-9): Marshall Properties of mix 1 with 21 m.% RC 3
A-9
2,46
2,48
2,50
3 4 5 6 7Binder content, m.%
Mix
den
si
5
6
3 4 5 6 7Binder content, m.%
Stab
ilit
0
1
2
3
4
5
6
7
3 4 5 6 7Binder content, m.%
AV
, vol
.%
0
2
4
6
8
10
12
3 4 5 6 7Binder content, m.%
Flow
, mm
11,011,512,012,513,013,514,014,515,015,516,0
3 4 5 6 7Binder content, m.%
VM
A, v
ol.%
Appendix A
2,50
2,52
2,54
2,56
dens
ity, g
/cm
³ .
8
10
12
14
Stab
ility
, KN
.

Figure (A-10): Marshall Properties of mix 1 with 21 m.% RC 5
A-10
2,46
2,48
3 4 5 6 7Binder content, m.%
Mix
de
6
8
3 4 5 6 7Binder content, m.%
Stab
0
1
2
3
4
5
6
7
3 4 5 6 7Binder content, m.%
AV
, vol
.%
0
1
2
3
4
5
6
3 4 5 6 7Binder content, m.%
Flow
, mm
12,0
12,5
13,0
13,5
14,0
14,5
15,0
3 4 5 6 7Binder content, m.%
VM
A, v
ol.%
Appendix A
2,28
2,32
2,36
2,40
2,44
Mix
den
sity
, g/c
m³
.
8
10
12
14
16
Stab
ility
, KN
.
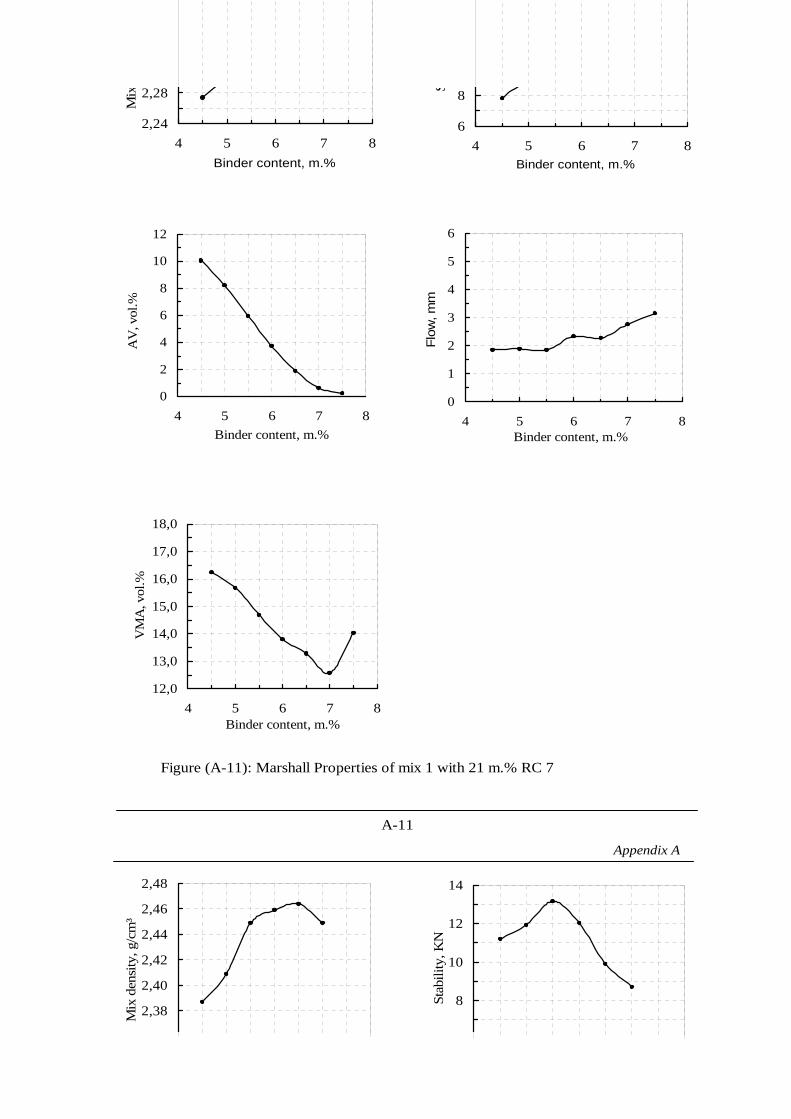
Figure (A-11): Marshall Properties of mix 1 with 21 m.% RC 7
A-11
2,24
2,28
4 5 6 7 8Binder content, m.%
Mix
6
8
4 5 6 7 8Binder content, m.%
S
0
2
4
6
8
10
12
4 5 6 7 8Binder content, m.%
AV
, vol
.%
0
1
2
3
4
5
6
4 5 6 7 8Binder content, m.%
Flow
, mm
12,0
13,0
14,0
15,0
16,0
17,0
18,0
4 5 6 7 8Binder content, m.%
VM
A, v
ol.%
Appendix A
2,38
2,40
2,42
2,44
2,46
2,48
Mix
den
sity
, g/c
m³
.
8
10
12
14
Stab
ility
, KN
.

Figure (A-12): Marshall Properties of mix 1 with 21 m.% RC 9
A-12
2,364 5 6 7 8
Binder content, m.%M
64 5 6 7 8
Binder content, m.%
0
2
4
6
8
10
12
4 5 6 7 8Binder content, m.%
AV
, vol
.%
0
1
2
3
4
5
6
4 5 6 7 8Binder content, m.%
Flow
, mm
12,0
13,0
14,0
15,0
16,0
17,0
4 5 6 7 8Binder content, m.%
VM
A, v
ol.%
Appendix A
2,48
2,50
2,52
2,54
2,56
2,58
Mix
den
sity
, g/c
m³
.
6
7
8
9
10
11
12
Stab
ility
, KN
.

Figure (A-13): Marshall Properties of mix 1 with 9 m.% RC 2
A-13
2,483 4 5 6 7
Binder content, m.%
63 4 5 6 7
Binder content, m.%
012345678
3 4 5 6 7Binder content, m.%
AV
, vol
.%
0
2
4
6
8
10
12
3 4 5 6 7Binder content, m.%
Flow
, mm
12,0
13,0
14,0
15,0
16,0
17,0
3 4 5 6 7Binder content, m.%
VM
A, v
ol.%

Appendix A
Table (A-1): Properties of The bituminous mixtures the OBC for base course with recycled sands
1) mass % of total aggregate 2) mass % of total mix 3) volume % of total mix 4) BM = Basalt Mixes
A-14
Mix no.
Mix conditions Sand type
RC-sand amount
m.% 1)
OBC,
m.% 2)
Densityg/cm³
StabilityKN
AV 3)
vol. % Flow (mm)
VMA 3)
vol. % MS, N/mm²
1 BS 0.0 5.3 2.577 9.3 2.7 3.7 14.75 39.58
2 9 5.2 2.594 8.4 2.75 4.6 15.5 28.8
3 RC1
21 5.5 2.502 10.637 2.87 2.92 13.83 57.4
4 9 5.1 2.56 8.7 2.4 4.9 14.1 27.96
5 RC2
21 4.8 2.519 9.4 1.95 4.1 11.8 33.6
6 9 4.9 2.579 9 2.3 3.5 13.8 40.5
7 RC3
21 4.8 2.539 7.6 2 3.7 12.56 32.3
8 9 5.2 2.551 9.7 2.6 3.75 14.3 40.7
9 RC5
21 5 2.493 11.029 2.65 3.03 12.54 57.3
10 9 5.5 2.525 12.498 2.14 2.63 13.75 74.8
11 RC7
21 6.5 2.405 14.97 1.91 2.28 13.28 103.4
12 9 5.3 2.533 10.4 2,82 3.7 14,2 44.3
13
4) BM, T=135 °C & Bitumen 70/100
RC9 21 6 2,459 11.9 1,85 2.9 12,74 64.6
14 9 5.5 2.545 12.23 2.74 4.58 15.26 42
15
BM, T=135 °C & Bitumen 50/70 RC1
21 5.6 2.49 12.50 3 3.7 14.50 53.2
16 BM, T=150 °C & Bitumen. 70/100
RC9 21 5.9 2,464 12.48 1,95 3.55 12,4 55.36
17 BM, T=165 °C & Bitumen 70/100 RC9 21 5,8 2,467 13 2,15 3.75 12,3 54.59

Appendix A
Table (A-1) cont.: Properties of the bituminous mixtures at the OBC for base course with recycled sands
1) mass % of total aggregate 2) mass % of total mix 3) volume % of total mix 4) LM = Limestone Mixes
A-15
Mix no.
Mix conditions Sand type
RC-sand amount
m.% 1)
OBC, m.% 2)
Density g/cm³
StabilityKN
AV 3)
vol. % Flow mm
VMA 3)
vol. % MS, N/mm²
18 NS 0.0 5.4 2.442 6.2 2.9 4.3 14.6 22.71
19 9 5.5 2.429 7.581 2.98 4.1 14.19 21.12
20 15 5.6 2.419 8.7 3 3.74 14 36.63
21
RC1
21 5.7 2.407 9 3.2 3.35 13.8 42.31
22 9 5.2 2.436 7.38 2.6 4.5 13.2 25.83
23 15 5.1 2.432 8 2.38 4,9 12.44 25.2
24
RC2
21 5 2.429 8.853 2.12 4.58 11.49 30.44
25 9 5.4 2.,431 6.67 2.9 4.3 14.3 24.43
26
RC3 15 5.5 2.442 6.957 2.89 4.32 14.15 25.36
27 9 5.3 2.432 8.3 2.95 3.75 13.7 34.86
28 15 5.4 2.431 9.7 2.7 3.6 13.15 42.43
29
RC5
21 5.4 2.398 9.5 2.75 3.57 12.6 41.91
30 9 5.7 2.402 9 2.4 3.4 13.3 41.69
31 15 6.1 2.371 9.5 2 3.55 12.7 42.14
32
RC7
21 6.4 2.343 10.3 1.63 3.44 12 47.15
33 9 5.5 2.418 7.708 2.49 3.87 13.28 31.37
34 15 5.5 2.398 9.312 2.51 3.34 12.47 43.91
35
T=135 °C & Bitumen 70/100, LM 1)
RC9 21 5.7 2.385 10.10 2.37 3.3 12 48.2