claude resources inc. (crj.to) july 2015 corporate presentation
TRANSCRIPT
Corporate Presentation
July 2015
2
Cautionary Note Regarding Forward-Looking Information This document contains certain forward-looking statements relating but not limited to the Company’s expectations, intentions, plans and beliefs. Forward-looking information can often be identified by forward-looking words such as “anticipate”, “believe”, “expect”, “goal”, “plan”, “intent”, “estimate”, “may” and “will” or similar words suggesting future outcomes or other expectations, beliefs, plans, objectives, assumptions, intentions or statements about future events or performance. Forward-looking information may include reserve and resource estimates, estimates of future production, unit costs, costs of capital projects and timing of commencement of operations, and is based on current expectations that involve a number of business risks and uncertainties. Factors that could cause actual results to differ materially from any forward-looking statement include, but are not limited to, failure to establish estimated resources and reserves, the grade and recovery of mined ore varying from estimates, capital and operating costs varying significantly from estimates, delays in obtaining or failures to obtain required governmental, environmental or other project approvals, inflation, changes in exchange rates, fluctuations in commodity prices, delays in the development of projects and other factors. Forward-looking statements are subject to risks, uncertainties and other factors that could cause actual results to differ materially from expected results. Potential shareholders and prospective investors should be aware that these statements are subject to known and unknown risks, uncertainties and other factors that could cause actual results to differ materially from those suggested by the forward-looking statements. Shareholders are cautioned not to place undue reliance on forward-looking information. By its nature, forward-looking information involves numerous assumptions, inherent risks and uncertainties, both general and specific, that contribute to the possibility that the predictions, forecasts, projections and various future events will not occur. Claude Resources undertakes no obligation to update publicly or otherwise revise any forward-looking information whether as a result of new information, future events or other such factors which affect this information, except as required by law. Cautionary Note to U.S. Investors Concerning Resource Estimate The resource estimates in this document were prepared in accordance with National Instrument 43-101, adopted by the Canadian Securities Administrators. The requirements of National Instrument 43-101 differ significantly from the requirements of the United States Securities and Exchange Commission (the “SEC”). In this document, we use the terms “measured”, “indicated” and “inferred” resources. Although these terms are recognized and required in Canada, the SEC does not recognize them. The SEC permits U.S. mining companies, in their filings with the SEC, to disclose only those mineral deposits that constitute “reserves”. Under United States standards, mineralization may not be classified as a reserve unless the determination has been made that the mineralization could be economically and legally extracted at the time the determination is made. United States investors should not assume that all or any portion of a measured or indicated resource will ever be converted into “reserves”. Further, “inferred resources” have a great amount of uncertainty as to their existence and whether they can be mined economically or legally, and United States investors should not assume that “inferred resources” exist or can be legally or economically mined, or that they will ever be upgraded to a higher category.
Cautionary Statement
3 3
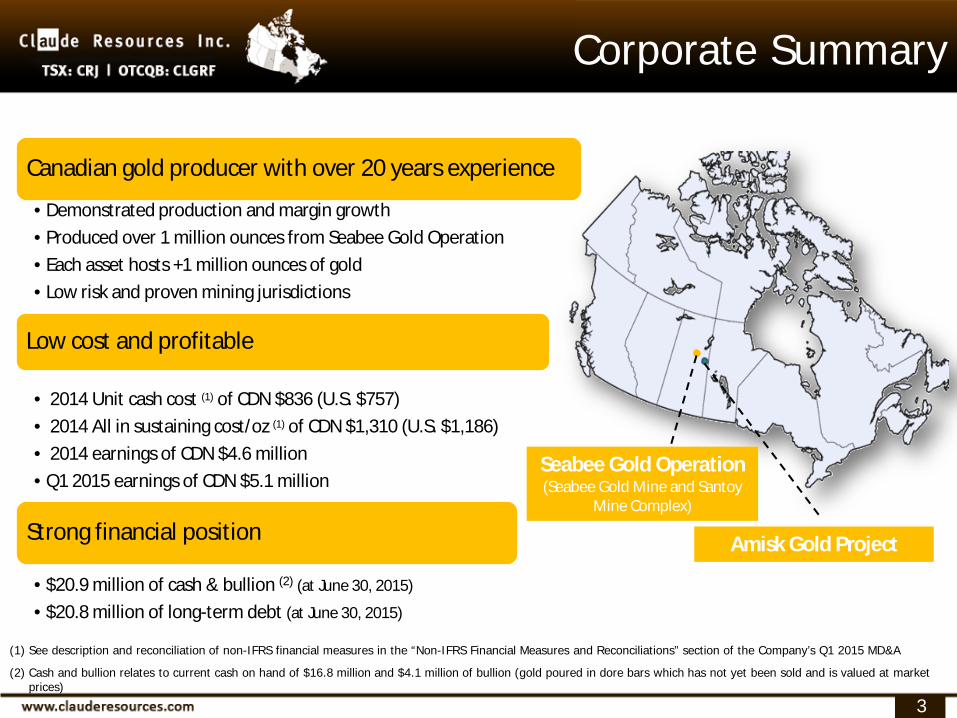
Corporate Summary
Canadian gold producer with over 20 years experience
• Demonstrated production and margin growth • Produced over 1 million ounces from Seabee Gold Operation • Each asset hosts +1 million ounces of gold • Low risk and proven mining jurisdictions
Low cost and profitable
• 2014 Unit cash cost (1) of CDN $836 (U.S. $757) • 2014 All in sustaining cost/oz (1) of CDN $1,310 (U.S. $1,186) • 2014 earnings of CDN $4.6 million • Q1 2015 earnings of CDN $5.1 million
Strong financial position
• $20.9 million of cash & bullion (2) (at June 30, 2015)
• $20.8 million of long-term debt (at June 30, 2015)
Seabee Gold Operation (Seabee Gold Mine and Santoy
Mine Complex)
Amisk Gold Project
(1) See description and reconciliation of non-IFRS financial measures in the “Non-IFRS Financial Measures and Reconciliations” section of the Company’s Q1 2015 MD&A
(2) Cash and bullion relates to current cash on hand of $16.8 million and $4.1 million of bullion (gold poured in dore bars which has not yet been sold and is valued at market prices)
4 4
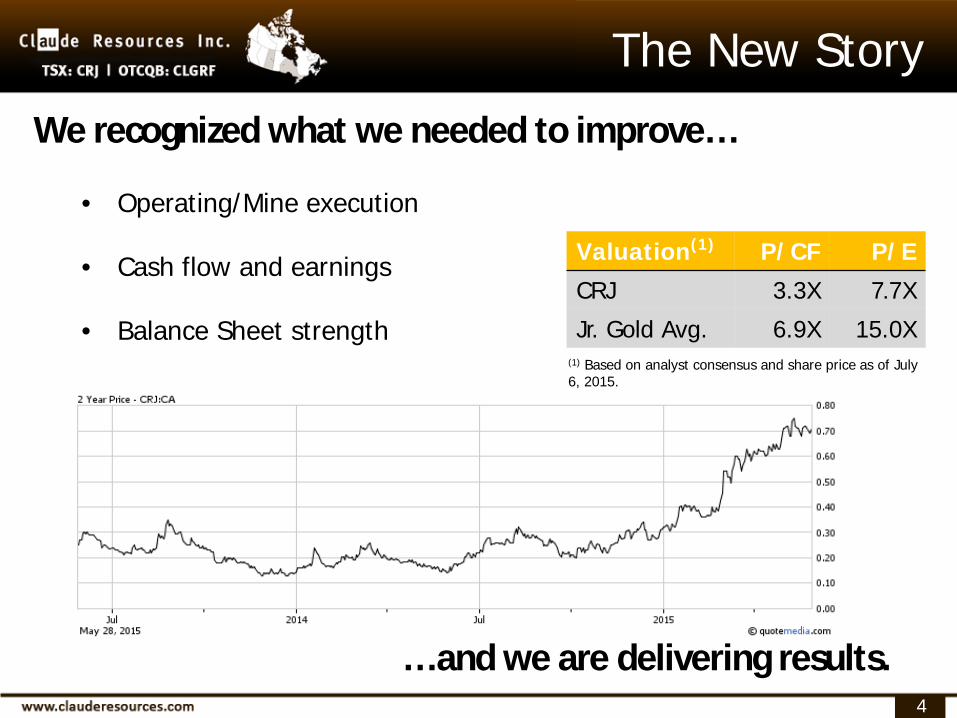
• Operating/Mine execution
• Cash flow and earnings
• Balance Sheet strength
The New Story
… and we are delivering results.
We recognized what we needed to improve…
Valuation(1) P/CF P/E
CRJ 3.3X 7.7X
Jr. Gold Avg. 6.9X 15.0X (1) Based on analyst consensus and share price as of July 6, 2015.
5
Q2 Production
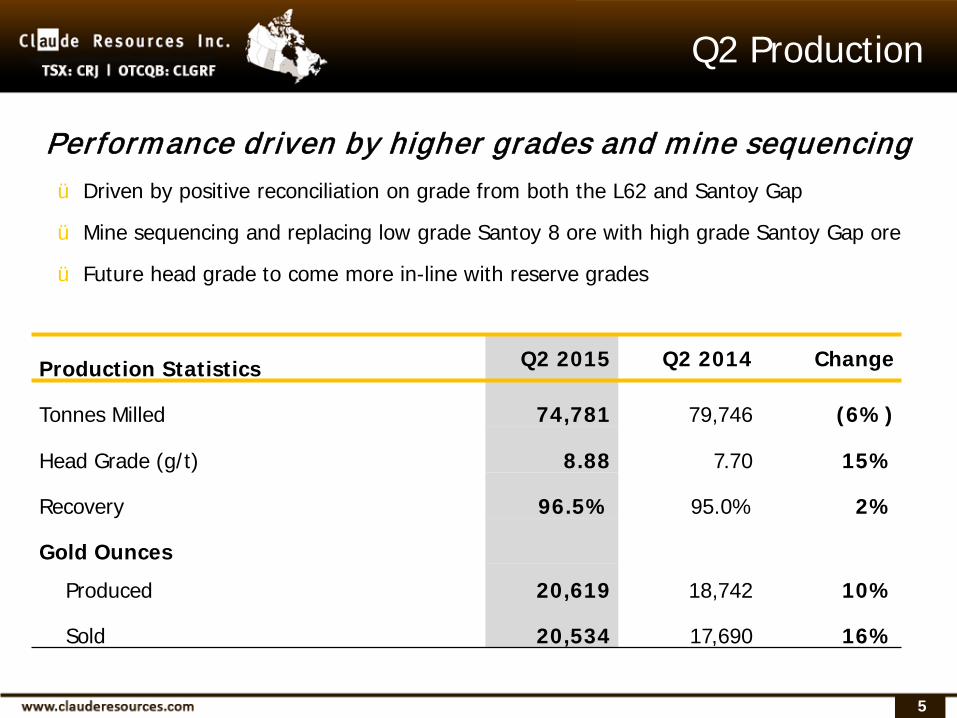
Performance driven by higher grades and mine sequencing
ü Driven by positive reconciliation on grade from both the L62 and Santoy Gap
ü Mine sequencing and replacing low grade Santoy 8 ore with high grade Santoy Gap ore
ü Future head grade to come more in-line with reserve grades
Production Statistics Q2 2015 Q2 2014 Change
Tonnes Milled 74,781 79,746 (6%)
Head Grade (g/t) 8.88 7.70 15%
Recovery 96.5% 95.0% 2%
Gold Ounces
Produced 20,619 18,742 10%
Sold 20,534 17,690 16%
6
Overall Operational Improvements
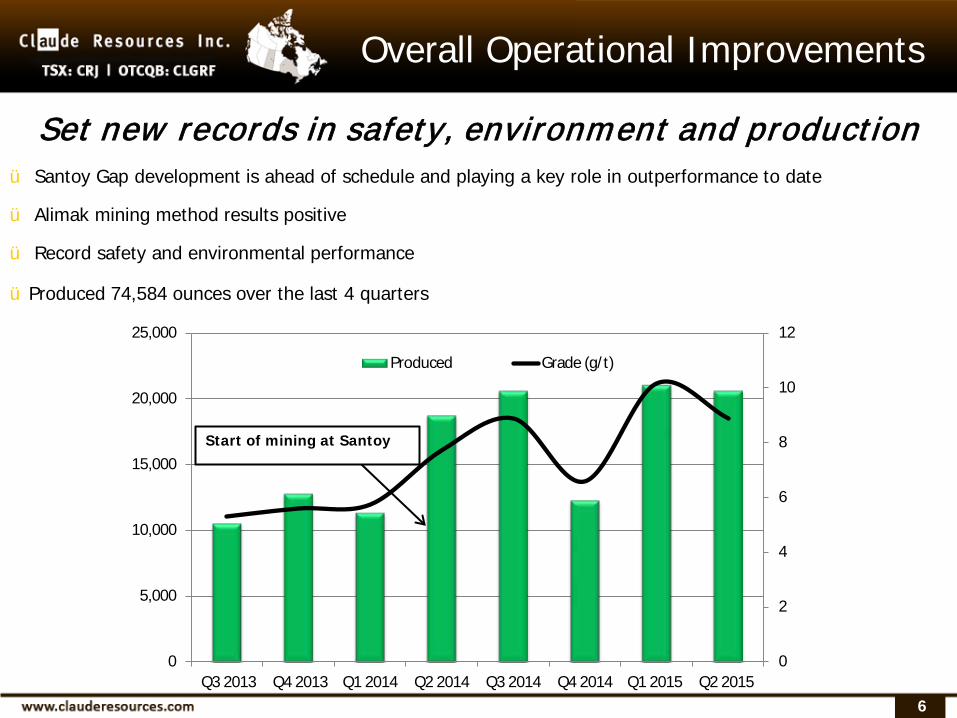
Set new records in safety, environment and production
ü Santoy Gap development is ahead of schedule and playing a key role in outperformance to date
ü Alimak mining method results positive
ü Record safety and environmental performance
ü Produced 74,584 ounces over the last 4 quarters
0
2
4
6
8
10
12
0
5,000
10,000
15,000
20,000
25,000
Q3 2013 Q4 2013 Q1 2014 Q2 2014 Q3 2014 Q4 2014 Q1 2015 Q2 2015
Produced Grade (g/t)
Start of mining at Santoy
7 7
Q1 Financial Results
(1) See description and reconciliation of non-IFRS financial measures in the “Non-IFRS Financial Measures and Reconciliations” section of the Company’s Q1 2015 MD&A.
(2) Cash flow from operations before net changes in non-cash operating working capital.
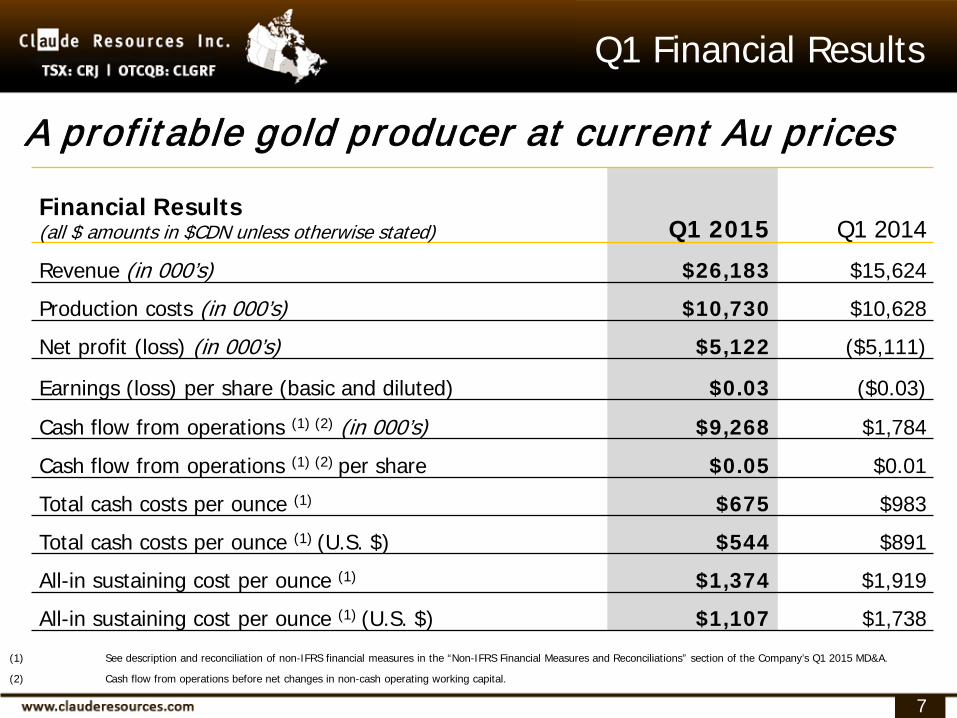
Financial Results (all $ amounts in $CDN unless otherwise stated) Q1 2015 Q1 2014
Revenue (in 000’s) $26,183 $15,624
Production costs (in 000’s) $10,730 $10,628
Net profit (loss) (in 000’s) $5,122 ($5,111)
Earnings (loss) per share (basic and diluted) $0.03 ($0.03)
Cash flow from operations (1) (2) (in 000’s) $9,268 $1,784
Cash flow from operations (1) (2) per share $0.05 $0.01
Total cash costs per ounce (1) $675 $983
Total cash costs per ounce (1) (U.S. $) $544 $891
All-in sustaining cost per ounce (1) $1,374 $1,919
All-in sustaining cost per ounce (1) (U.S. $) $1,107 $1,738
A profitable gold producer at current Au prices
8 8
Stronger Balance Sheet
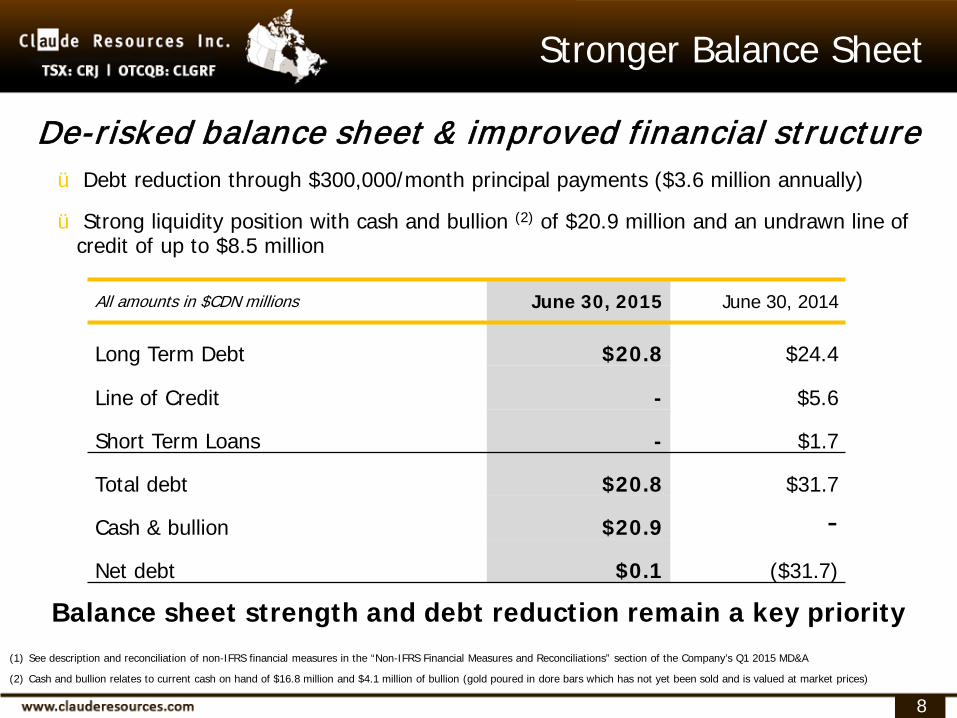
De-risked balance sheet & improved financial structure ü Debt reduction through $300,000/month principal payments ($3.6 million annually)
ü Strong liquidity position with cash and bullion (2) of $20.9 million and an undrawn line of credit of up to $8.5 million
Balance sheet strength and debt reduction remain a key priority
All amounts in $CDN millions June 30, 2015 June 30, 2014
Long Term Debt $20.8 $24.4
Line of Credit - $5.6
Short Term Loans - $1.7
Total debt $20.8 $31.7
Cash & bullion $20.9 - Net debt $0.1 ($31.7)
(1) See description and reconciliation of non-IFRS financial measures in the “Non-IFRS Financial Measures and Reconciliations” section of the Company’s Q1 2015 MD&A
(2) Cash and bullion relates to current cash on hand of $16.8 million and $4.1 million of bullion (gold poured in dore bars which has not yet been sold and is valued at market prices)

9 9
Compelling Valuation
$760 $780 $800 $820 $840 $860 $880 $900 $920 $940 $960 $980
*KGI RIC SAS WDO CRJ Average Median
CDN$ Unit Cash Cost/Oz (2014)
$836
600
800
1,000
1,200
1,400
1,600
1,800
2,000
Q1 '13 Q2 '13 Q3 '13 Q4 '13 Q1 '14 Q2 '14 Q3' 14 Q4 '14 Q1 '15 2015E FY
AISC (CDN$/oz) (1)
Current CDN Au $ - $1,480
0
2
4
6
8
10
12
♦TGZ
CRJ
AR
PRU
OGC
LSG
DPM
♦P
KGI
AUQ
RIC
P/CF
P/CF 2015 P/CF 2016
Source: Bloomberg, Cormark (1) See description and reconciliation of non-IFRS financial measures in the “Non-IFRS Financial Measures and Reconciliations” section of the Company’s Q1 2015 MD&A.
$2,800
5.68 5.86 5.11
7.32 6.8 to 7.3
0 1 2 3 4 5 6 7 8 9
-
10,000
20,000
30,000
40,000
50,000
60,000
70,000
80,000
2011A 2012A 2013A 2014A 2015E
Growing Production (Annually) Production Grade
10
(1) See footnotes located on page 17
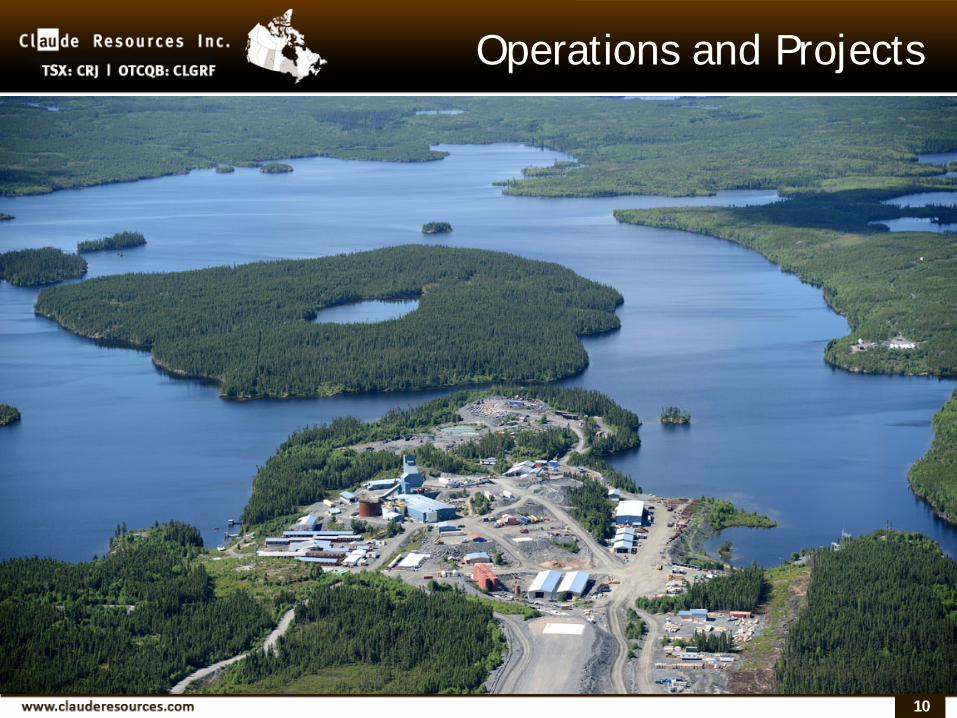
Operations and Projects
11
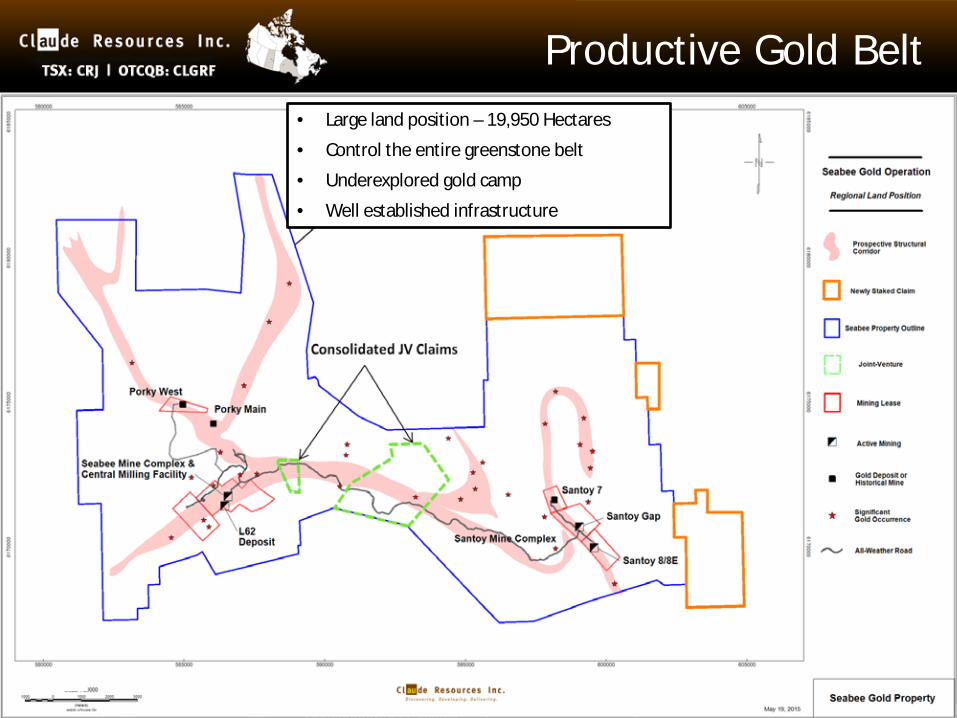
Productive Gold Belt
Seabee Property: 17,200 Hectares
• Large land position – 19,950 Hectares
• Control the entire greenstone belt
• Underexplored gold camp
• Well established infrastructure
12
Key Drivers: Santoy Gap
• 2,000 ounces per vertical metre (Seabee: ~ 1,000 oz/vertical metre)
• Higher reserve grade with opportunity to increase
• Decreased production risk with the addition of multiple long-hole mining fronts
• Opportunity to displace low margin ounces with high margin ounces and optimize
mine plan for improved cash flow
• Time to production from discovery = 2.5 years
• System remains open at depth
What makes Santoy Gap so special?
Higher Grade + Wider Veins = More Ounces Per Vertical Metre
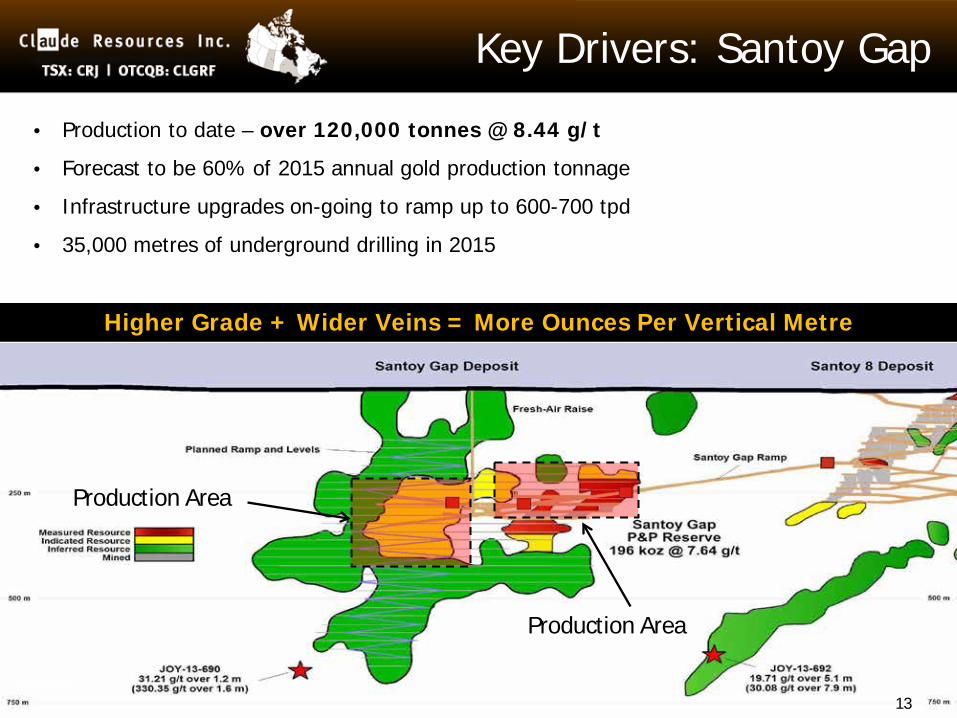
Key Drivers: Santoy Gap
• Production to date – over 120,000 tonnes @ 8.44 g/t
• Forecast to be 60% of 2015 annual gold production tonnage
• Infrastructure upgrades on-going to ramp up to 600-700 tpd
• 35,000 metres of underground drilling in 2015
Production Area
Production Area
Higher Grade + Wider Veins = More Ounces Per Vertical Metre
13
14
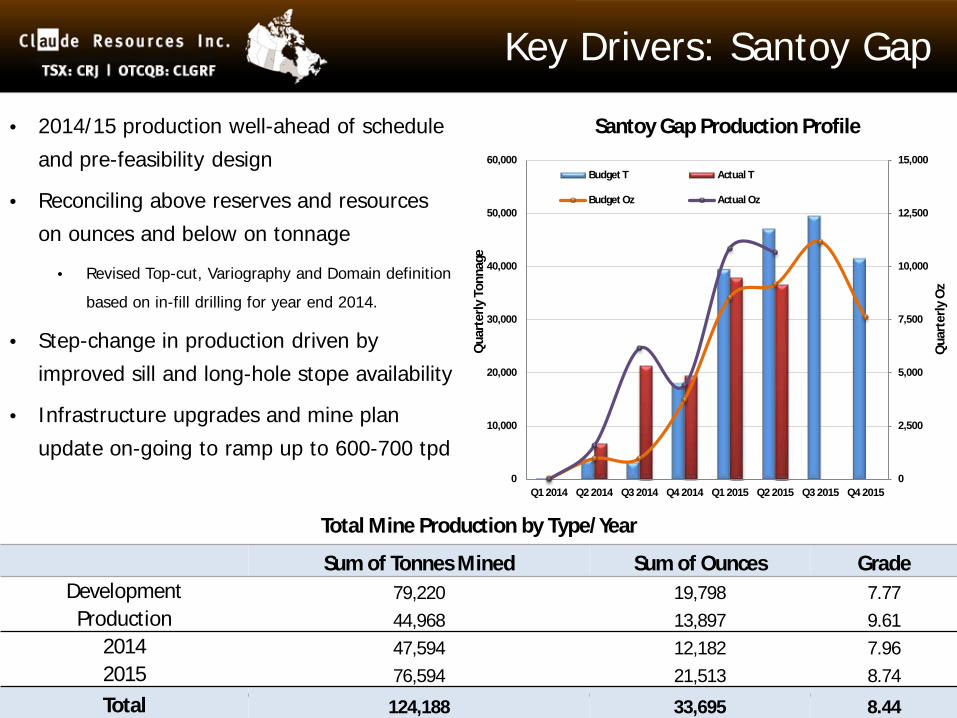
Key Drivers: Santoy Gap
Total Mine Production by Type/Year
Sum of Tonnes Mined Sum of Ounces Grade Development 79,220 19,798 7.77
Production 44,968 13,897 9.61 2014 47,594 12,182 7.96 2015 76,594 21,513 8.74
Total 124,188 33,695 8.44
• 2014/15 production well-ahead of schedule
and pre-feasibility design
• Reconciling above reserves and resources
on ounces and below on tonnage
• Revised Top-cut, Variography and Domain definition
based on in-fill drilling for year end 2014.
• Step-change in production driven by
improved sill and long-hole stope availability
• Infrastructure upgrades and mine plan
update on-going to ramp up to 600-700 tpd 0
2,500
5,000
7,500
10,000
12,500
15,000
0
10,000
20,000
30,000
40,000
50,000
60,000
Q1 2014 Q2 2014 Q3 2014 Q4 2014 Q1 2015 Q2 2015 Q3 2015 Q4 2015
Qua
rter
ly O
z
Qua
rter
ly T
onna
ge
Santoy Gap Production Profile
Budget T Actual T
Budget Oz Actual Oz
15
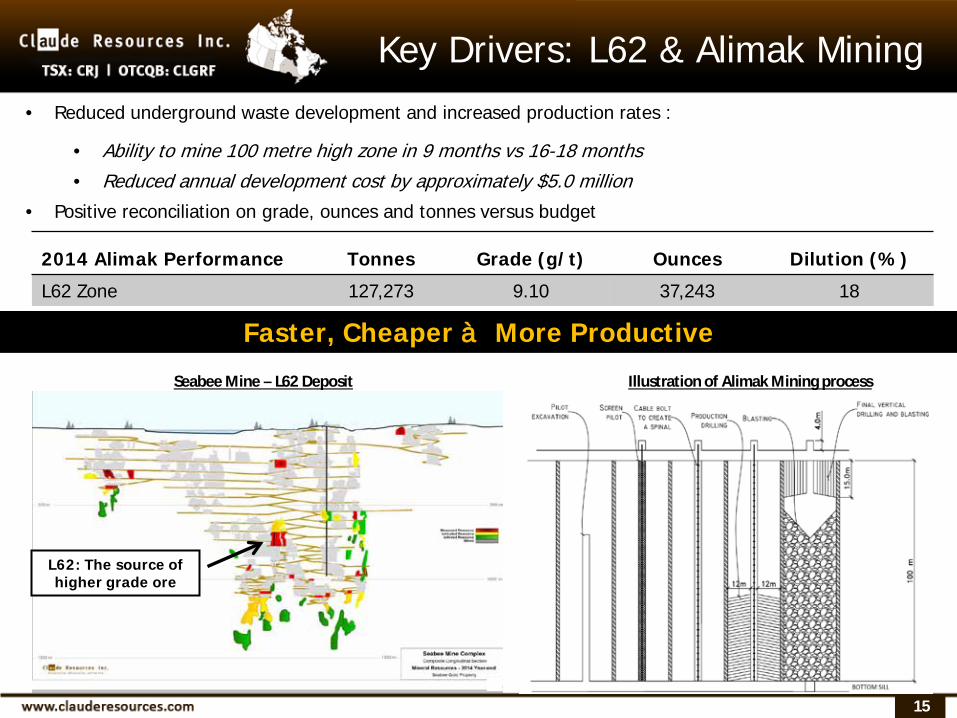
Key Drivers: L62 & Alimak Mining
Illustration of Alimak Mining process
• Reduced underground waste development and increased production rates :
• Ability to mine 100 metre high zone in 9 months vs 16-18 months • Reduced annual development cost by approximately $5.0 million
• Positive reconciliation on grade, ounces and tonnes versus budget
Faster, Cheaper à More Productive
L62: The source of higher grade ore
Seabee Mine – L62 Deposit
2014 Alimak Performance Tonnes Grade (g/t) Ounces Dilution (%)
L62 Zone 127,273 9.10 37,243 18

16
Focused on delivering higher margin ore to the mill • Change in mining method at Santoy Gap (Transverse vs. Long-hole) increased grade and reduced dilution
• Santoy Gap mineral reserve grade increased by 35% to 7.64 g/t from 5.68 g/t
• The 45% increase in Inferred ounces was driven by the significant expansion of the Santoy 8 ore body
• A significant 2015 underground drilling program of ~65,000 metres is expected to drive mineral reserve and mineral resource growth
Sustainable Grades and Resources
* See 2014 Annual MD&A for footnotes to the Mineral Resource Statement.
Seabee Gold Operation Mineral Reserves and Mineral Resources* (as of November 30, 2014)
P&P Reserves 2014 2013 Change
Grade 7.03 5.70 23%
Ounces 299,000 422,900 -29%
M&I Resources
Grade 5.98 6.91 -13%
Ounces 125,200 175,200 -29%
Inferred Resources
Grade 7.96 7.21 10%
Ounces 847,300 582,900 45%

17
Prospective Gold Camp
SYSTEM REMAINS OPEN AT DEPTH
Excellent opportunity for resource expansion at Santoy Mine Complex • 2014 underground drilling demonstrated economic grades and widths
• SUG-14-038 – 26.77 g/t over 8.7 m
• Major step-out holes among the highest gram-metre product to date in the camp
• JOY-13-690 – 330.35 g/t over 1.6 m JOY-13-692 – 30.08 g/t over 7.9 m
• Budgeted ~35,000 metres of underground drilling in 2015
2015 Drill Target Area
2.5 km Strike Length
18
A profitable gold miner
ü Increased production & margins by prioritizing Santoy Gap development &
changing mining method at L62 deposit
ü Set new annual gold production record of 62,984 ozs in 2014 (2013: 43,850)
ü New quarterly gold production record in Q1 2015 of 21,067
ü Decreased 2014 all-in sustaining unit costs by 29% from 2013
ü Lowered 2014 capital expenditures by 28% from 2013
ü Increased cash flow & earnings to drive further debt reduction & a stronger
balance sheet
Our strategies are delivering results
19
2015 Outlook
üGold production of 68,000 to 72,000 ounces (increased from 60,000 to 65,000 ozs)
ü Unit cash costs – CDN $785 to $850 per ounce (includes NSR)
ü All in sustaining costs – CDN $1,175 to $1,275 per ounce
ü Expected to FCF in 2015 @ CDN $1,300 Au/oz (U.S. $1,040 Au/oz*)
üOur performance & profitability is sustainable
Our focus will remain on cost containment, margins and production grow th
*Assuming U.S./CDN exchange rate of $0.80
20
(1) See footnotes located on page 17
TSX: CRJ OTCQB: CLGRF
200, 219 Robin Cres. Saskatoon, Saskatchewan, S7L 6M8 Canada P. 306.668.7505 F. 306.668.7500 E: [email protected]
21 21
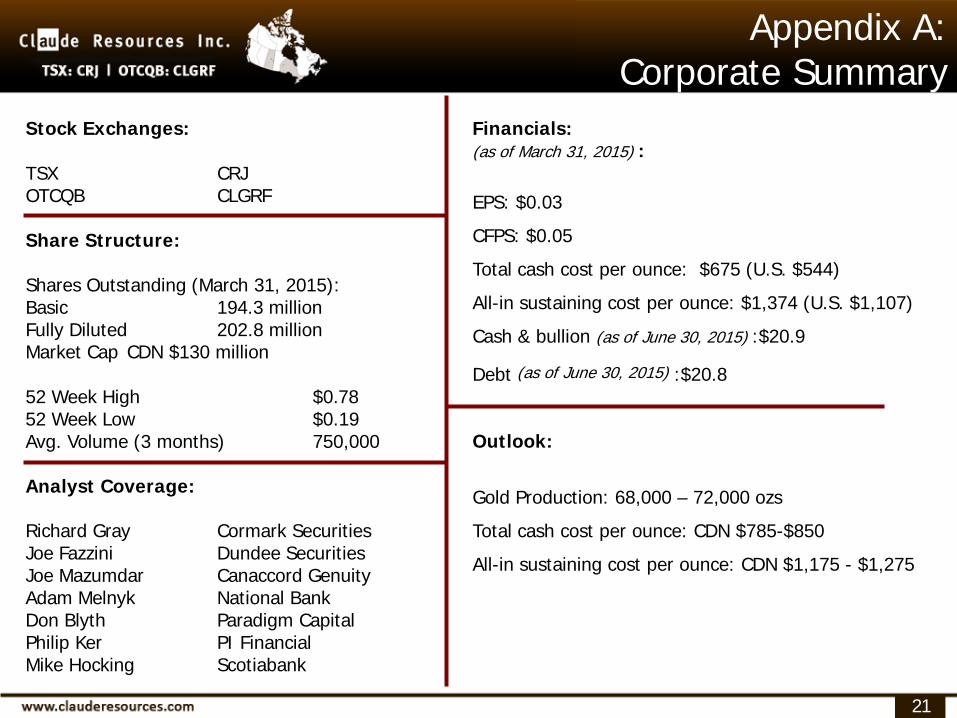
Appendix A: Corporate Summary
21
Stock Exchanges: TSX CRJ OTCQB CLGRF Share Structure: Shares Outstanding (March 31, 2015): Basic 194.3 million Fully Diluted 202.8 million Market Cap CDN $130 million 52 Week High $0.78 52 Week Low $0.19 Avg. Volume (3 months) 750,000 Analyst Coverage: Richard Gray Cormark Securities Joe Fazzini Dundee Securities Joe Mazumdar Canaccord Genuity Adam Melnyk National Bank Don Blyth Paradigm Capital Philip Ker PI Financial Mike Hocking Scotiabank
Financials: (as of March 31, 2015) : EPS: $0.03
CFPS: $0.05
Total cash cost per ounce: $675 (U.S. $544)
All-in sustaining cost per ounce: $1,374 (U.S. $1,107)
Cash & bullion (as of June 30, 2015) :$20.9
Debt (as of June 30, 2015) :$20.8 Outlook:
Gold Production: 68,000 – 72,000 ozs
Total cash cost per ounce: CDN $785-$850
All-in sustaining cost per ounce: CDN $1,175 - $1,275
22 22
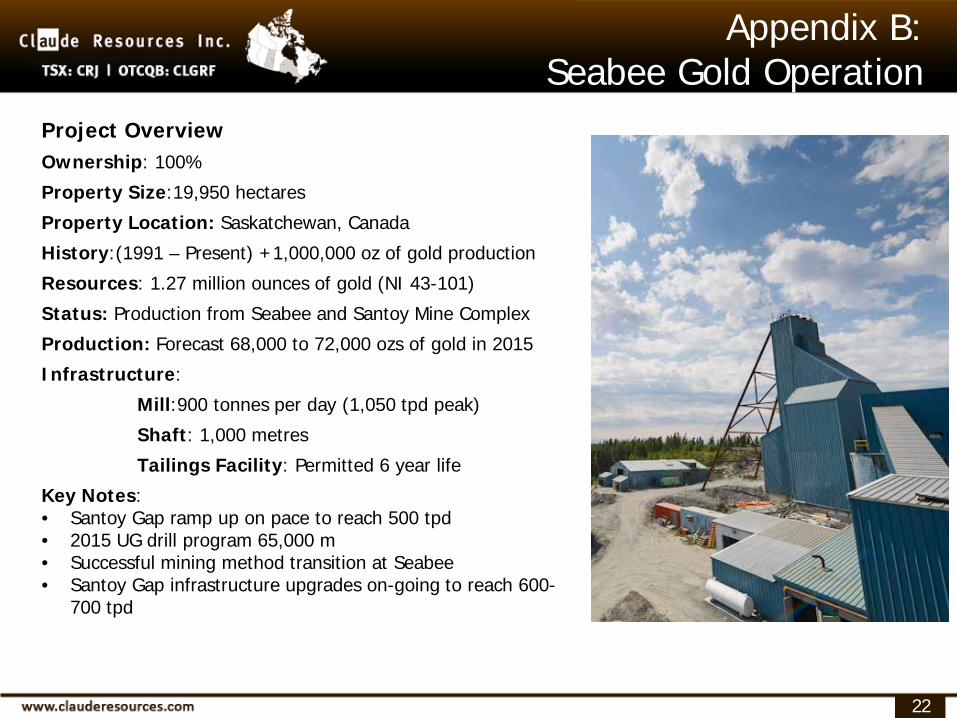
Project Overview Ownership: 100%
Property Size:19,950 hectares
Property Location: Saskatchewan, Canada
History:(1991 – Present) +1,000,000 oz of gold production
Resources: 1.27 million ounces of gold (NI 43-101)
Status: Production from Seabee and Santoy Mine Complex
Production: Forecast 68,000 to 72,000 ozs of gold in 2015 Infrastructure:
Mill:900 tonnes per day (1,050 tpd peak)
Shaft: 1,000 metres
Tailings Facility: Permitted 6 year life
Key Notes: • Santoy Gap ramp up on pace to reach 500 tpd • 2015 UG drill program 65,000 m • Successful mining method transition at Seabee • Santoy Gap infrastructure upgrades on-going to reach 600-
700 tpd
Appendix B: Seabee Gold Operation
23
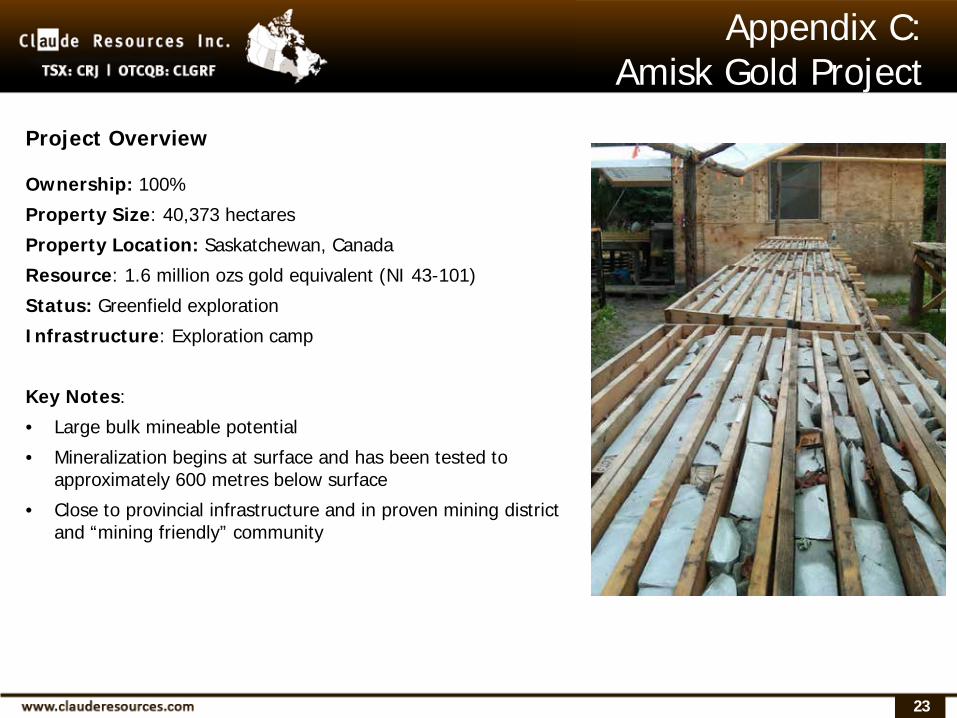
Appendix C: Amisk Gold Project
Project Overview
Ownership: 100%
Property Size: 40,373 hectares
Property Location: Saskatchewan, Canada
Resource: 1.6 million ozs gold equivalent (NI 43-101)
Status: Greenfield exploration
Infrastructure: Exploration camp
Key Notes:
• Large bulk mineable potential
• Mineralization begins at surface and has been tested to approximately 600 metres below surface
• Close to provincial infrastructure and in proven mining district and “mining friendly” community

24
Appendix D: Executive Team
Brian Skanderbeg, P.Geo.
President & CEO
Mr. Skanderbeg joined the Corporation in April 2007. He was appointed as President & CEO in November 2014. Prior to his current position, he was the Sr. VP and COO. He previously worked for Goldcorp, Inco Ltd. and Helio Resources, holding positions in both exploration and operations. He holds a B. Sc. from the University of Manitoba, an M.Sc. from Rhodes University, South Africa and brings extensive experience in gold systems and include operational management, cost and asset optimization as well as strategic analysis.
Rick Johnson, CPA, CA
Chief Financial Officer Vice President Finance
Mr. Johnson joined Claude Resources in 1996. He was appointed to his present position in 2004, having previously served as Company Controller. Mr. Johnson holds a Bachelor of Commerce degree from the University of Saskatchewan and is a member of CPA Canada.

25
Appendix E: Board of Directors
Brian Booth, P.Geo.
Chair Currently serves as the President and Chief Executive Officer of Pembrook Mining Corp. Previous work experience includes Inco Ltd. and Lake Shore Gold Corp. Over 30 years of experience in mineral exploration. Joined the Board of Directors in 2012.
Rita Mirwald, C.M.
Director Held a number of senior positions with Cameco Corporation, including that of Senior Vice President Corporate Services. Joined the Board of Directors in 2011.
Patrick Downey, P.Eng
Director Has over 25 years of international experience in the resource industry. Most recently, Mr. Downey was the President and CEO of Elgin Mining Inc., which was acquired by Mandalay Resources Inc. He has held numerous senior engineering positions at several large scale gold mining operations. He holds a B.Sc (Hon.) degree in Engineering from Queen's University in Belfast, Ireland. Joined the Board of Directors in January 2015.
Arnold Klassen, CA, CPA (Illinois)
Director Has over 35 years of experience in accounting, audit and tax, with over 30 years of experience in the Mining Industry. Mr. Klassen is currently President of AKMJK Consulting Ltd. and prior to that was the Vice President of Finance for Dynatec Corporation from 1988 to 2007. Mr. Klassen spent seven years with KPMG prior to becoming Vice President of Finance with the Tonto Group of Companies from 1984 to 1998. Joined the Board of Directors in April 2015.
Brian Skanderbeg, P.Geo.
President & CEO
Mr. Skanderbeg joined the Corporation in April 2007. He was appointed as President & CEO in November 2014. Prior to his current position, he was the Sr. VP and COO. He previously worked for Goldcorp, Inco Ltd. and Helio Resources, holding positions in both exploration and operations. He holds a B. Sc. from the University of Manitoba, an M.Sc. from Rhodes University, South Africa and brings extensive experience in gold systems including operational management, cost and asset optimization as well as strategic analysis.