clean air act, section 110 - us epa · clean air act, section 110 federal implementation plan for...
TRANSCRIPT


Clean Air Act, Section 110Federal Implementation Plan forInterstate Ozone Transport Rulemaking
Small Business Regulatory Enforcement Fairness ActOutreach MeetingApril 14, 1998
United States Environmental Protection AgencyOffice of Management and BudgetSmall Business Administration

CLEAN AIR ACT OF 1990TITLE I...ATTAINMENT/MAINTENANCE OF NATIONAL
AMBIENT AIR QUALITY STANDARDS
TITLE II...MOBILE SOURCES
TITLE III...AIR TOXICS
TITLE IV...ACID DEPOSITION CONTROL
TITLE V...PERMITS
TITLE VI...STRATOSPHERIC OZONE/GLOBAL CLIMATE PROT.
TITLE VII...ENFORCEMENT
TITLE VIII...MISCELLANEOUS PROVISIONS
TITLE IX...CLEAN AIR RESEARCH
TITLE X...DISADVANTAGED BUSINESS CONCERNS
TITLE XI...EMPLOYMENT TRANSITION ASSISTANCE

Ozone-Related Health Effects of Concern
Difficulty in breathing, shortness of breathAggravated/prolonged coughing and chest painIncreased aggravation of asthma, susceptibility to respiratory infection resulting in increased hospital admissions and emergency room visitsRepeated exposures could result in chronic inflammation and irreversible structural changes in the lungs, that can lead to premature aging of the lungs and illness such as bronchitis and emphysemaGrowing evidence suggests association with premature death
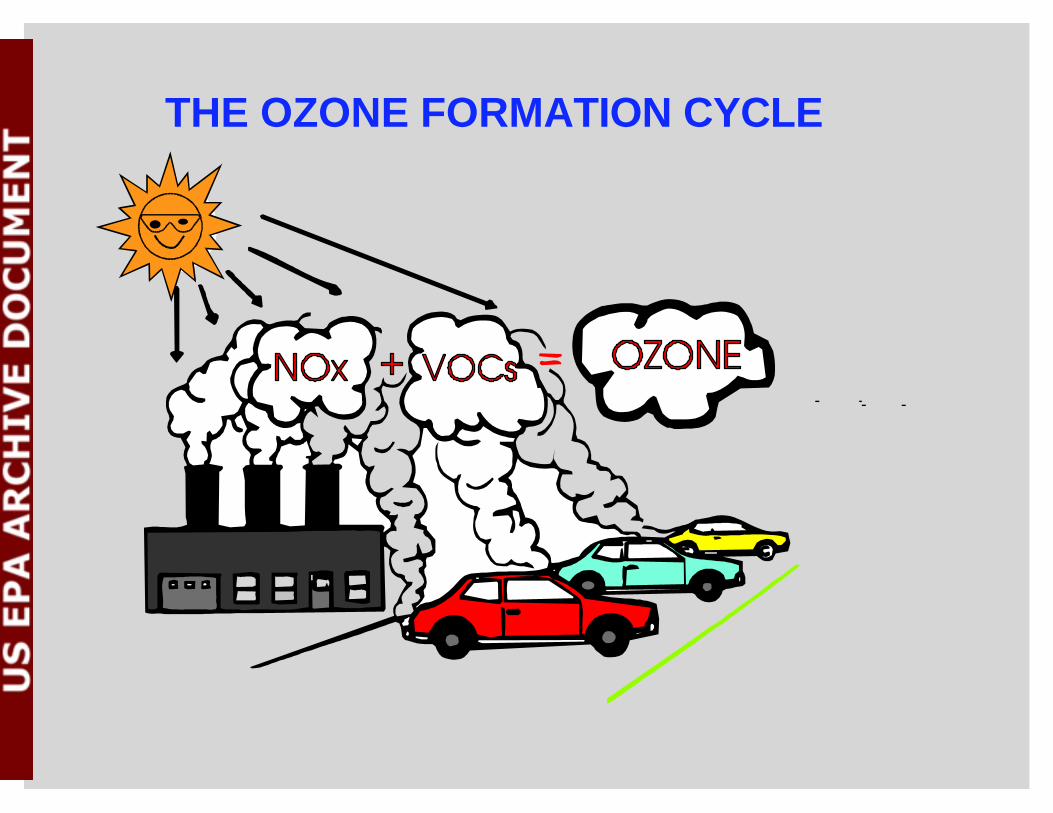
THE OZONE FORMATION CYCLE

NOx EMISSIONS...EXAMPLES
FUEL COMBUSTION
MOTOR VEHICLES
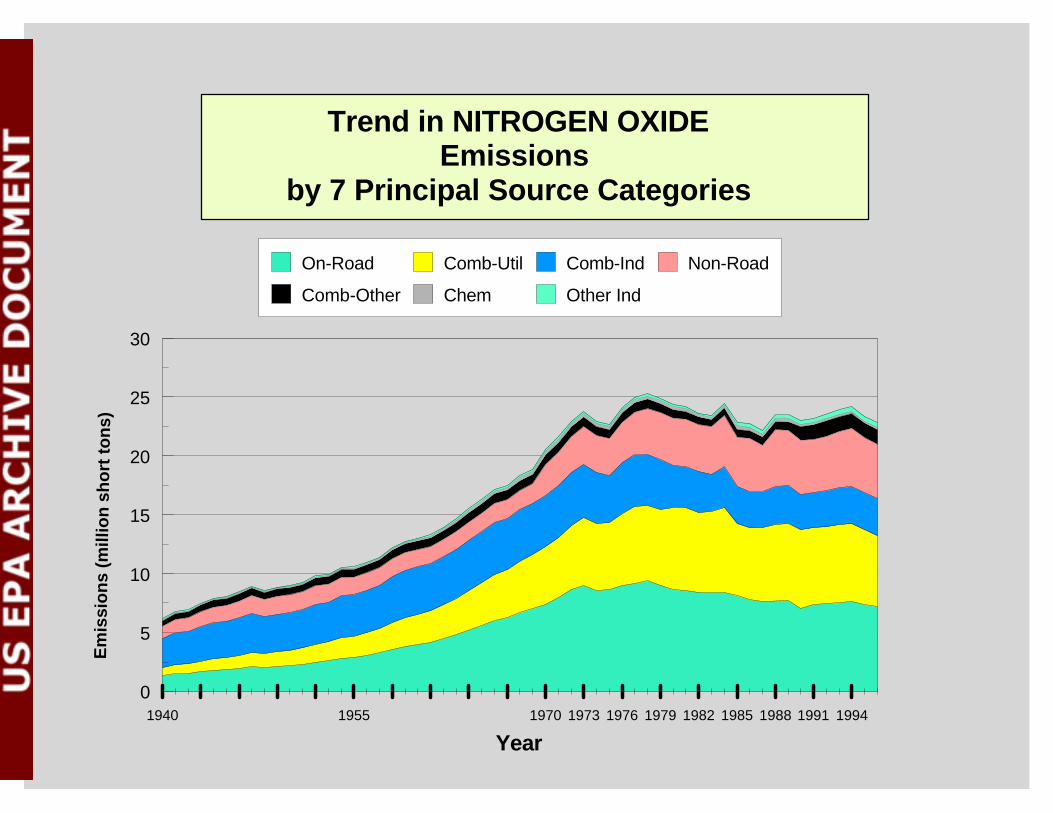
Trend in NITROGEN OXIDE Emissions
by 7 Principal Source Categories
1940 1955 1970 1973 1976 1979 1982 1985 1988 1991 1994
0
5
10
15
20
25
30
Year
Em
issi
on
s (m
illio
n s
ho
rt t
on
s)
On-Road Comb-Util Comb-Ind Non-Road
Comb-Other Chem Other Ind
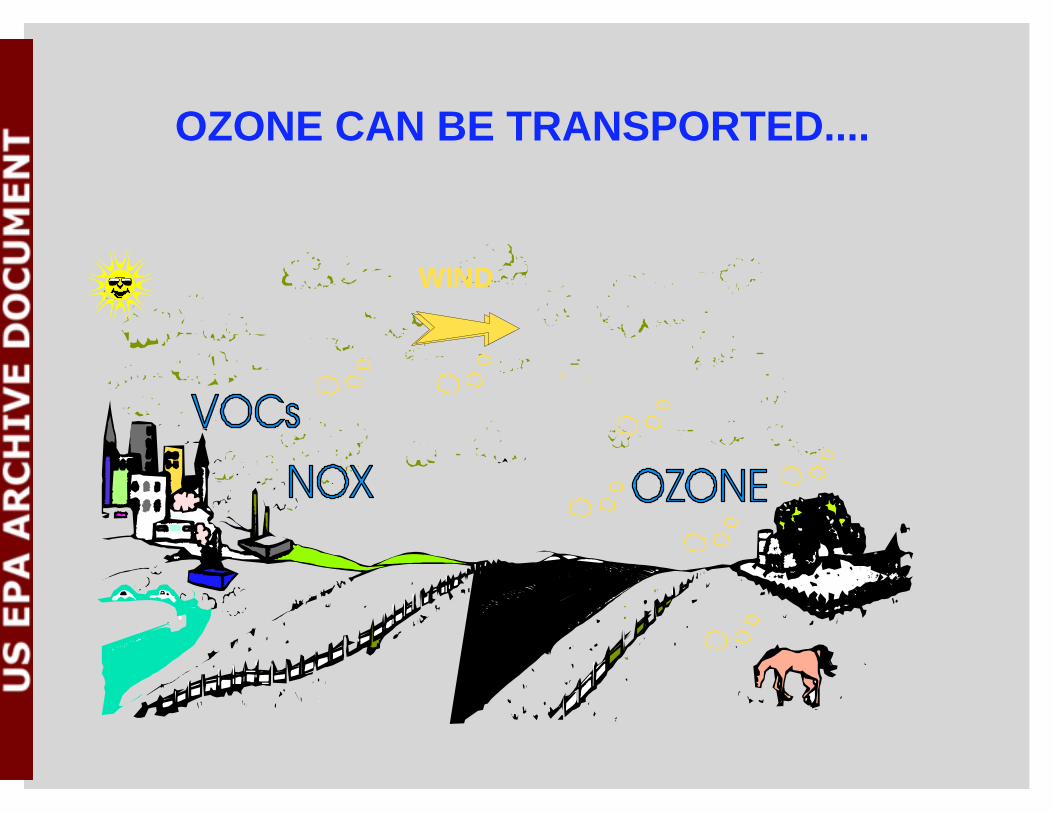
OZONE CAN BE TRANSPORTED....
WIND

MAJOR TRANSPORT PATTERNSFOR BALTIMORE/WASHINGTON, DC
Arrows indicate the major transport wind directions for key episode days in Baltimore/Washington D.C.
Ozone concentrations along the inflow boundaries of the modeling domain are highest daily maximum observedvalues for the key episode days.
Regional Ozone Issue ... Transportexample...
125 ppb
115 ppb
150 ppb
1-hr Ozonestandardis 120 ppb

NJ
1-Hour Ozone Problem Areas
NEW YORK
CHICAGO
LOS ANGELES
PHILADELPHIA
HOUSTON
DALLAS
SAN DIEGO
BALTIMORE
WASHINGTON
MILWAUKEE
BOSTON-WORCESTER
ST LOUIS
EL PASO
PITTSBURGH
CINCINNATI
LOUISVILLE
BIRMINGHAM
SACRAMENTO METRO
BATON ROUGE
SAN JOAQUIN VALLEY
PROVIDENCE
BEAUMONT
MUSKEGON
PORTLAND
PORTSMOUTH
SANTA BARBARA
SPRINGFIELD
LANCASTER
POUGHKEEPSIE
GREATER CONNECTICUT
Extreme
MANITOWOC CO
PHOENIX
SE DESERT MODIFIED AQMA
VENTURA
ATLANTA
KENT & QUEEN ANNE'S COS., MD
DOOR CO
SUNLAND PARK (MAR)
Extreme & SevereSerious
Moderate
Marginal
Classifications
Transitional & Incomplete
Data Areas Not Included

Ozone Transport Region (OTR) & Commission
Established by US Congress to provide a forum for addressing regional ozone nonattainment issues in NE.
Consists of 12 northeastern states plus DC. USEPA is a non-voting member.
Purpose is to:to assess interstate transport of ozone/precursors
in OTR, andrecommend strategies for controlling the interstate
transport of pollution

Agreed to by eleven NE States and DCEmission decreases at boilers above 250 mmBtu/hrEmissions cap at electric utility generating facilities 15 megawatts (MW) or greater
Control levels (boilers above 250 mmBtu) in 2003:For most States, either 0.15 lbs/mmBtu or a 75% reduction from 1990 NOx levelsIn certain areas, either 0.20 lbs/mmBtu rate or a 55% reduction
OTC NOx Memorandum of Understanding

Ozone Transport Assessment Group (OTAG)
37 Statesand DC

To identify and recommend reductions in transported ozone and its precursors which, in combination with other measures, will enable attainment and maintenance of the national ambient ozone standard.
OTAG Goal
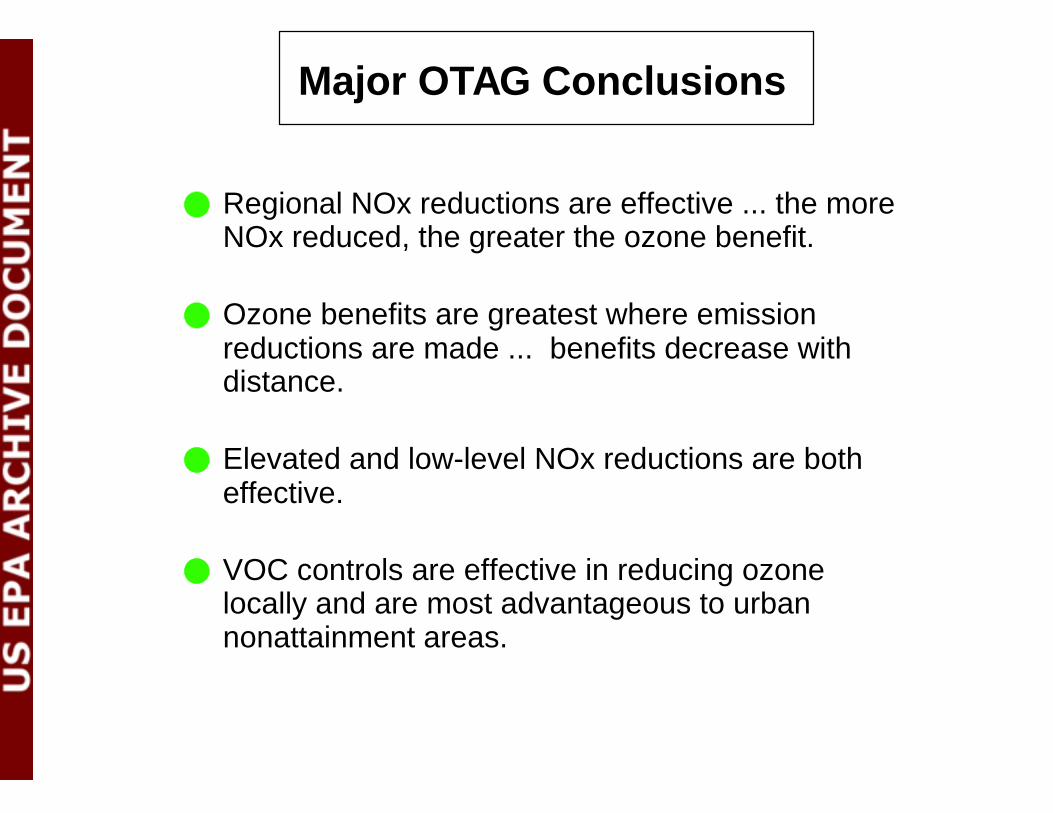
Regional NOx reductions are effective ... the more NOx reduced, the greater the ozone benefit.
Ozone benefits are greatest where emission reductions are made ... benefits decrease with distance.
Elevated and low-level NOx reductions are both effective.
VOC controls are effective in reducing ozone locally and are most advantageous to urban nonattainment areas.
Major OTAG Conclusions

OTAG control recommendations
Utility controls: up to 0.15 lb/mmBtu or 85% reduction on large sources
Non-utilities: up to 70% reduction on large
National Measures....AIM coatings, consumer & commercial products, autobody refinishing, reformulated gasoline, small engine standards, heavy duty highway 2g standard, heavy duty nonroad diesel standard, and locomotive standard with rebuild.
National Low Emission Vehicle
Vehicle Emission Inspection and Maintenance Controls

November 7, 1997 ... EPA Proposal
Makes finding of significant contribution to nonattainment in downwind States.
Assigns NOx emissions budgets for each State.
Suggests additional controls for large point sources.
Permits States to choose what NOx measures to adopt to meet the State-wide emission budget.
Requires 22 States & D.C. to revise their State air plans to mitigate transport in eastern half of US ...

22 States and DC received EPA's SIP call
SIP callStates in
white

Apply reasonable, cost-effective controls
Continue to develop new federal programs to reduce emissions from cars and other mobile sources
Budgets include projected growth through 2007
EPA used the upper range of the Ozone Transport Assessment Group's recommendation for point sources:
For large utilities, 0.15 lb. NOx/mmBtu ( about 85% decrease from 1990 levels)
For other large point sources, about 70% decrease
How is EPA developing NOx budgets?

Propose NOx SIP call ...... November 7, 1997
Publish a supplemental proposal in Spring of 1998
Receive public comments
Finalize SIP call ...... September 1998
State SIPs due to EPA ...... September 1999
Compliance with stationary source emission limits ....... September 2002
What is the timing?
Moving to Federal
Implementation Plans

The Administrator is required to promulgate a FIP within 2 years of:
(1) finding that a State has failed to make a required submittal, (2) finding that a submittal is not complete, or (3) disapproving a SIP submittal.
In What Instances Would a FIP Be Required?
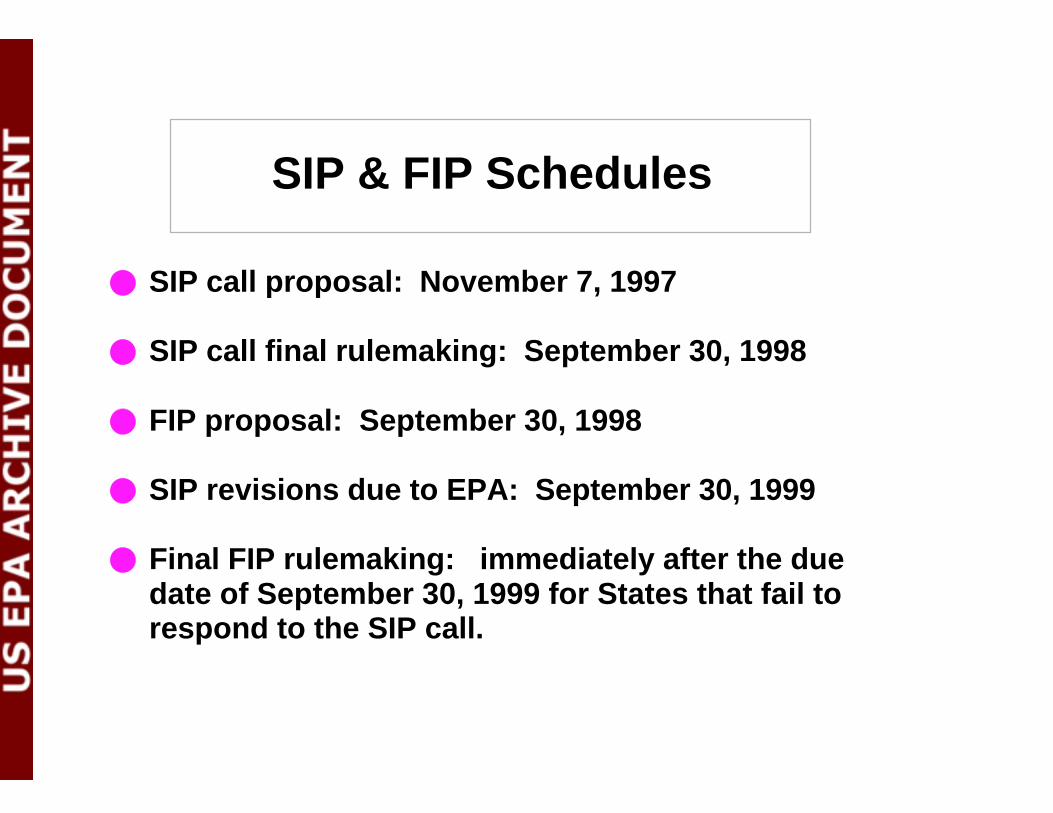
SIP call proposal: November 7, 1997
SIP call final rulemaking: September 30, 1998
FIP proposal: September 30, 1998
SIP revisions due to EPA: September 30, 1999
Final FIP rulemaking: immediately after the due date of September 30, 1999 for States that fail to respond to the SIP call.
SIP & FIP Schedules

What's included in the FIP?
The FIP would set an emissions budget for each affected State at the same level as the final SIP call.
EPA's expects to focus controls more on the larger stationary sources due to administrative feasibility.
EPA plans to establish in any FIP an interstate emissions trading program.

Assuming that, in general, SBREFA "small entities" are also small emitters of NOx emissions.
Should EPA set an emissions cutoff in the FIP, exempting small emitters?
What levels should EPA consider?
Options That Might Reduce Impacts of a FIP

EPA intends to include in a FIP an emissions trading program for all large boilers and gas turbines .
Is a trading program the right approach for this group of sources?
How should EPA develop a trading program so that it would best ensure reducing costs?
Alternatively, is setting requirements on a source-by-source basis better?
Options That Might Reduce Impacts of a FIP (continued)
How should point sources outside the trading program be handled (e.g., process heaters or cement plants)?
Should EPA exempt sources where the cost-effectiveness of contol exceeds a certain level? On a per source category basis or averaged over several source categories?
What level of cost-effectiveness could EPA consider; levels similar to the trading program or similar to other controls adopted by regulatory agencies?
Options That Might Reduce Impacts of a FIP (continued)

Similarly for point sources outside the trading program, should EPA propose to control only sources that can achieve a moderate to high level of emissions reduction?
What minimum level of reductions is appropriate?
Should reduction levels be similar to those achieved under the trading program?
Should EPA consider the overall level of reductions applied to a variety of source categories or on a per source category basis?
Options That Might Reduce Impacts of a FIP (continued)