clean - california iso details/attachments/835... · web viewupdate various sections to implement...
TRANSCRIPT
Business Practice Manual for
Managing Full Network Model
Version 78
Last Revised: October 30, 2014May 29, 2015
CAISO Business Practice Manual BPM for Managing Full Network Model
Approval HistoryApproval Date: October 1, 2009
Effective Date: October 1, 2009
BPM Owner: Benik Der-Gevorgian
BPM Owner’s Title: Director, Market Services
Revision History
Version Date Description
1 03-23-2009Go-Live Release.
Updated sections 2.1, 2.2, 4.2.6 (IBAA) and 5.
2 10-14-2009Updated Exhibit 5.1 – Effective 10-14-09 – PRR #46
Updated Section 5.1.2 – Effective 10-14-09 – PRR #73
3 08-10-2010 Update Section 4.2.3.7 (PDR) – Effective 08-10-2010 – PRR #166
4 12-20-2010 Update MSL Market Schedule Limits, on Section 2.1.1.2, Section 3.1.4, and Section 4.2.4.3, Exhibit 4-13 - PRR - 356
5 January 3, 2013
Update language to Section 2.1.1.2, 4.1.2, 4.2.4.3, 4.2.4.4, 4.2.4.5, 4.2.7, 5.1, and Deletion of Exhibit A-3 – PRR - 637
6 9-26-2014
Update Section 4.2.2.1 for Load Distribution Factor Release – Effective 10-1-2014 – PRR #766
Update various sections to implement FNM expansion initiative and fix broken links and outdated information – Effective 10-15-
2014 – PRR #758
7 10-30-2014Update Sections 4.2.3.2.1 Footnote 29, 5.1.7, 5.2.4, and 5.3.2
for Outage Management System Replacement – Effective 2-27-2015 – PRR #771
8 5-29-2015Update WECC Model Update address in Section 5.1.2 and the length of the FNM Model Life Cycle in Exhibit 5-1 – Effective 6-
1-2015 – PRR #
Version 7 Last Revised: October 30, 2014May 29, 2015 Page 1
CAISO Business Practice Manual BPM for Managing Full Network Model
TABLE OF CONTENTS1. Introduction ...........................................................................................................................7
1.1 Purpose of California ISO Business Practice Manuals .................................................7
1.2 Purpose of this Business Practice Manual ....................................................................7
1.3 References ....................................................................................................................9
2. Full Network Model Overview ............................................................................................102.1 Full Network Model Overview – IFM and RTM ...........................................................10
2.1.1 Overview of Constraint Enforcement in the IFM/RTM System ........................14
2.1.1.1 Facilities that Lack Sufficient Telemetry and Visibility .......................15
2.1.1.2 Intertie Constraints ............................................................................16
2.1.1.3 Management of Use Limited Resources ...........................................16
2.1.1.4 Management of Transmission Outages ............................................17
2.1.1.5 Lessons from Market Results ............................................................17
2.2 Full Network Model Overview – CRR System .............................................................18
2.3 Access to the CRR Full Network Model ......................................................................20
3. Full Network Model for IFM & RTM ...................................................................................213.1 FNM Transmission System Representation ................................................................21
3.1.1 Participating Transmission Owners .................................................................22
3.1.2 New Participating Transmission Owners (New PTOs) ....................................22
3.1.3 Metered Sub-Systems .....................................................................................23
3.1.4 External Systems .............................................................................................24
3.1.5 Other Balancing Authority Areas .....................................................................26
3.1.6 Utility Distribution Company (UDC) .................................................................27
3.2 FNM Market Representation .......................................................................................27
3.3 Use of Full Network Model ..........................................................................................28
3.3.1 IFM/RTM Market Analysis Engine ...................................................................31
3.3.1.1 Security Constrained Unit Commitment Solution ..............................31
3.3.1.2 Network Analysis AC Solution ...........................................................32
3.3.1.3 Reference Bus ...................................................................................33
4. FNM Components & Development for the IFM & RTM ....................................................354.1 FNM Development ......................................................................................................35
4.1.1 Physical Model .................................................................................................38
4.1.2 Market Model ...................................................................................................38
Version 7 Last Revised: October 30, 2014May 29, 2015 Page 2
CAISO Business Practice Manual BPM for Managing Full Network Model
4.1.3 FNM Data Types ..............................................................................................39
4.2 FNM Market Components ...........................................................................................41
4.2.1 Nodes & Buses ................................................................................................41
4.2.1.1 Network Node (CNode) .....................................................................43
4.2.1.2 Price Location (PNode) .....................................................................43
4.2.2 Load Model ......................................................................................................45
4.2.2.1 Load Aggregation and Load Distribution Factors ..............................45
4.2.2.2 Custom Load Aggregation .................................................................47
4.2.2.3 Reactive Distribution Factors ............................................................47
4.2.3 Resource Models .............................................................................................48
4.2.3.1 Individual Generating Unit .................................................................48
4.2.3.1.1 Generator With POR at Station ........................................49
4.2.3.1.2 Generating Unit with Auxiliary Load with POR at the Station ...............................................................................49
4.2.3.1.3 Generator with Pumping Capability ..................................52
4.2.3.1.4 Generating Unit with POR at Generator Tie .....................52
4.2.3.2 Generation Aggregation ....................................................................53
4.2.3.2.1 Combined Cycle Generating Unit .....................................55
4.2.3.3 Distributed Generation ......................................................................56
4.2.3.4 Generation Distribution Factors .........................................................56
4.2.3.5 System Resources ............................................................................57
4.2.3.6 Participating Load ..............................................................................58
4.2.3.7 Aggregated Participating Loads and Proxy Demand Resources ......59
4.2.3.8 Point of Receipt .................................................................................60
4.2.4 Modeling Transmission Related Market Attributes ..........................................63
4.2.4.1 Intertie Scheduling Constraints .........................................................63
4.2.4.2 ETC/TOR Contracts ..........................................................................64
4.2.4.3 Modeling for New Participating Transmission Owners and External Systems 65
4.2.4.4 Dynamic Transfers ............................................................................66
4.2.4.5 Remedial Action Schemes ................................................................67
4.2.5 Groupings & Zone Definitions ..........................................................................68
4.2.5.1 Transmission Interface Constraints ...................................................68
4.2.5.2 Utility Distribution Company ..............................................................69
Version 7 Last Revised: October 30, 2014May 29, 2015 Page 3
CAISO Business Practice Manual BPM for Managing Full Network Model
4.2.5.3 Aggregated Price Locations (APL) ....................................................70
4.2.5.4 Trading Hubs .....................................................................................70
4.2.5.5 Metered Sub-Systems .......................................................................71
4.2.5.6 RUC Zones ........................................................................................72
4.2.6 Integrated Balancing Authority Areas (IBAAs) .................................................72
4.2.6.1 Background .......................................................................................73
4.2.6.2 Modeling Approach ...........................................................................74
4.2.6.3 CAISO Process for Establishing or Modifying IBAAs ........................76
4.2.6.4 IBAA and Congestion Revenue Rights (CRRs) ................................77
4.2.7 Nomogram Constraints ....................................................................................78
4.2.7.1 Nomogram Constraints in General ....................................................78
4.2.7.1.1 Data Modeling for Nomograms Relating AC Interface MW Flows .................................................................................79
4.2.8 Contingency Management ...............................................................................80
5. Maintenance of FNM for IFM & RTM .................................................................................825.1 FNM Update Process Flow .........................................................................................82
5.1.1 FNM Work Scope ............................................................................................84
5.1.2 FNM Data Gathering ........................................................................................85
5.1.3 Finalize FNM Scope and Update & Test FNM .................................................86
5.1.4 Test Bid Preparation and Market Simulation ...................................................86
5.1.5 Production Promotion and Timing ...................................................................87
5.1.6 Updates of FNM and Time Frame ...................................................................87
5.1.7 Notification to CAISO of New Equipment Release, Re-rated equipment, or Existing Equipment Removal ...........................................................................87
5.2 Data Bases Supporting the FNM Update Process ......................................................89
5.2.1 Resource Interconnection Management System (RIMS) Data Base ..............89
5.2.2 Participating Generator Interconnection (PGI) Data Base ...............................90
5.2.3 CAISO Register ...............................................................................................91
5.2.4 Outage System ................................................................................................93
5.2.5 Master File .......................................................................................................93
5.2.6 SMDM Process ................................................................................................93
5.3 Market Participant Data Requirements .......................................................................94
5.3.1 Power System Components ............................................................................94
5.3.1.1 Loads .................................................................................................95
Version 7 Last Revised: October 30, 2014May 29, 2015 Page 4
CAISO Business Practice Manual BPM for Managing Full Network Model
5.3.1.2 Generating Units ...............................................................................95
5.3.1.3 Transmission Elements .....................................................................96
5.3.2 Generator and Transmission Outages and Derates ........................................96
5.3.3 Real-Time Telemetry .......................................................................................97
5.4 Data Update and Submittal for Market Applications ...................................................97
5.4.1 Generation RDT ...............................................................................................97
5.4.2 System Resource RDT ....................................................................................97
Appendix to Business Practice Manual for Managing Full Network Model .........................98Implementation of Sacramento Municipal Utilities District and Turlock Irrigation District
Balancing Authority Areas as Integrated Balancing Authority Areas ...................98
1. Introduction ..........................................................................................................98
2. Modeling Approach ..............................................................................................98
3. IBAA Pricing and Settlement Approach .............................................................100
1. Introduction ...........................................................................................................................71.1 Purpose of California ISO Business Practice Manuals .................................................7
1.2 Purpose of this Business Practice Manual ....................................................................7
1.3 References ....................................................................................................................9
2. Full Network Model Overview ............................................................................................102.1 Full Network Model Overview – IFM and RTM ...........................................................10
2.1.1 Overview of Constraint Enforcement in the IFM/RTM System ........................15
2.1.1.1 Facilities that Lack Sufficient Telemetry and Visibility .......................16
2.1.1.2 Intertie Constraints ............................................................................16
2.1.1.3 Management of Use Limited Resources ...........................................17
2.1.1.4 Management of Transmission Outages ............................................18
2.1.1.5 Lessons from Market Results ............................................................18
2.2 Full Network Model Overview – CRR System .............................................................18
2.3 Access to the CRR Full Network Model ......................................................................21
3. Full Network Model for IFM & RTM ...................................................................................223.1 FNM Transmission System Representation ................................................................22
3.1.1 Participating Transmission Owners .................................................................23
3.1.2 New Participating Transmission Owners (New PTOs) ....................................23
3.1.3 Metered Sub-Systems .....................................................................................23
3.1.4 External Systems .............................................................................................25
Version 7 Last Revised: October 30, 2014May 29, 2015 Page 5
CAISO Business Practice Manual BPM for Managing Full Network Model
3.1.5 Other Balancing Authority Areas .....................................................................27
3.1.6 Utility Distribution Company (UDC) .................................................................28
3.2 FNM Market Representation .......................................................................................28
3.3 Use of Full Network Model ..........................................................................................29
3.3.1 IFM/RTM Market Analysis Engine ...................................................................32
3.3.1.1 Security Constrained Unit Commitment Solution ..............................32
3.3.1.2 Network Analysis AC Solution ...........................................................33
3.3.1.3 Reference Bus ...................................................................................34
4. FNM Components & Development for the IFM & RTM ....................................................364.1 FNM Development ......................................................................................................36
4.1.1 Physical Model .................................................................................................40
4.1.2 Market Model ...................................................................................................40
4.1.3 FNM Data Types ..............................................................................................41
4.2 FNM Market Components ...........................................................................................43
4.2.1 Nodes & Buses ................................................................................................43
4.2.1.1 Network Node (CNode) .....................................................................45
4.2.1.2 Price Location (PNode) .....................................................................45
4.2.2 Load Model ......................................................................................................47
4.2.2.1 Load Aggregation and Load Distribution Factors ..............................47
4.2.2.2 Custom Load Aggregation .................................................................49
4.2.2.3 Reactive Distribution Factors ............................................................49
4.2.3 Resource Models .............................................................................................50
4.2.3.1 Individual Generating Unit .................................................................50
4.2.3.1.1 Generator With POR at Station ........................................51
4.2.3.1.2 Generating Unit with Auxiliary Load with POR at the Station ...............................................................................51
4.2.3.1.3 Generator with Pumping Capability ..................................54
4.2.3.1.4 Generating Unit with POR at Generator Tie .....................54
4.2.3.2 Generation Aggregation ....................................................................55
4.2.3.2.1 Combined Cycle Generating Unit .....................................57
4.2.3.3 Distributed Generation ......................................................................58
4.2.3.4 Generation Distribution Factors .........................................................58
4.2.3.5 System Resources ............................................................................59
Version 7 Last Revised: October 30, 2014May 29, 2015 Page 6
CAISO Business Practice Manual BPM for Managing Full Network Model
4.2.3.6 Participating Load ..............................................................................60
4.2.3.7 Aggregated Participating Loads and Proxy Demand Resources ......61
4.2.3.8 Point of Receipt .................................................................................62
4.2.4 Modeling Transmission Related Market Attributes ..........................................65
4.2.4.1 Intertie Scheduling Constraints .........................................................65
4.2.4.2 ETC/TOR Contracts ..........................................................................66
4.2.4.3 Modeling for New Participating Transmission Owners and External Systems 67
4.2.4.4 Dynamic Transfers ............................................................................68
4.2.4.5 Remedial Action Schemes ................................................................69
4.2.5 Groupings & Zone Definitions ..........................................................................70
4.2.5.1 Transmission Interface Constraints ...................................................70
4.2.5.2 Utility Distribution Company ..............................................................71
4.2.5.3 Aggregated Price Locations (APL) ....................................................72
4.2.5.4 Trading Hubs .....................................................................................72
4.2.5.5 Metered Sub-Systems .......................................................................73
4.2.5.6 RUC Zones ........................................................................................74
4.2.6 Integrated Balancing Authority Areas (IBAAs) .................................................74
4.2.6.1 Background .......................................................................................75
4.2.6.2 Modeling Approach ...........................................................................76
4.2.6.3 CAISO Process for Establishing or Modifying IBAAs ........................78
4.2.6.4 IBAA and Congestion Revenue Rights (CRRs) ................................79
4.2.7 Nomogram Constraints ....................................................................................80
4.2.7.1 Nomogram Constraints in General ....................................................80
4.2.7.1.1 Data Modeling for Nomograms Relating AC Interface MW Flows .................................................................................81
4.2.8 Contingency Management ...............................................................................82
5. Maintenance of FNM for IFM & RTM .................................................................................845.1 FNM Update Process Flow .........................................................................................84
5.1.1 FNM Work Scope ............................................................................................86
5.1.2 FNM Data Gathering ........................................................................................87
5.1.3 Finalize FNM Scope and Update & Test FNM .................................................88
5.1.4 Test Bid Preparation and Market Simulation ...................................................88
5.1.5 Production Promotion and Timing ...................................................................89
Version 7 Last Revised: October 30, 2014May 29, 2015 Page 7
CAISO Business Practice Manual BPM for Managing Full Network Model
5.1.6 Updates of FNM and Time Frame ...................................................................89
5.1.7 Notification to CAISO of New Equipment Release, Re-rated equipment, or Existing Equipment Removal ...........................................................................89
5.2 Data Bases Supporting the FNM Update Process ......................................................91
5.2.1 Resource Interconnection Management System (RIMS) Data Base ..............91
5.2.2 Participating Generator Interconnection (PGI) Data Base ...............................92
5.2.3 CAISO Register ...............................................................................................93
5.2.4 Outage System ................................................................................................95
5.2.5 Master File .......................................................................................................95
5.2.6 SMDM Process ................................................................................................95
5.3 Market Participant Data Requirements .......................................................................96
5.3.1 Power System Components ............................................................................96
5.3.1.1 Loads .................................................................................................97
5.3.1.2 Generating Units ...............................................................................97
5.3.1.3 Transmission Elements .....................................................................98
5.3.2 Generator and Transmission Outages and Derates ........................................98
5.3.3 Real-Time Telemetry .......................................................................................99
5.4 Data Update and Submittal for Market Applications ...................................................99
5.4.1 Generation RDT ...............................................................................................99
5.4.2 System Resource RDT ....................................................................................99
Appendix to Business Practice Manual for Managing Full Network Model .......................100Implementation of Sacramento Municipal Utilities District and Turlock Irrigation District
Balancing Authority Areas as Integrated Balancing Authority Areas .................100
1. Introduction ........................................................................................................100
2. Modeling Approach ............................................................................................100
3. IBAA Pricing and Settlement Approach .............................................................102
Version 7 Last Revised: October 30, 2014May 29, 2015 Page 8
CAISO Business Practice Manual BPM for Managing Full Network Model
List of Exhibits:
Exhibit 1-1: CAISO BPMs ..............................................................................................................7
Exhibit 2-1: Comparison of the FNM and EMS Models ...............................................................13
Exhibit 3-1: Market Analysis Engine ............................................................................................29
Exhibit 4-1: FNM Development ....................................................................................................35
Exhibit 4-2: Full Network Model Components .............................................................................41
Exhibit 4-3: Node/Breaker Conversion to Bus/Branch Model Format .........................................42
Exhibit 4-4: Examples of Dominant CNodes in Detailed Node/Breaker Model ...........................45
Exhibit 4-5: Generating Unit with POR at Station .......................................................................49
Exhibit 4-6: Net Metered Generating Station with Auxiliary Load ................................................50
Exhibit 4-7: Generating Unit Market POR Different from Generator Terminal ............................53
Exhibit 4-8: Generation Aggregation ...........................................................................................54
Exhibit 4-9: Combined Cycle Generating Unit .............................................................................55
Exhibit 4-10: Detailed Physical Model of Aggregated Market Participant ....................................62
Exhibit 4-11: Commercial Model of Aggregated Market Resource ..............................................62
Exhibit 4-12: Price Location and Aggregation Relationships .......................................................70
Exhibit 4-13: AC Interface MW Flow vs. Interface MW Flow Constraint ......................................80
Exhibit 5-1: FNM Update Process Flow and Timeline ................................................................83
Exhibit 5-2: FNM Data Bases .....................................................................................................89
Exhibit A-1: Definition of System Resource Aggregations for SMUD-TID IBAA ..........................99
Exhibit A-2: Scheduling Points for SMUD-TID IBAA .................................................................100
Exhibit 1-1: CAISO BPMs ..............................................................................................................7
Exhibit 2-1: Comparison of the FNM and EMS Models ...............................................................14
Exhibit 3-1: Market Analysis Engine ............................................................................................30
Exhibit 4-1: FNM Development ....................................................................................................36
Exhibit 4-2: Full Network Model Components .............................................................................43
Exhibit 4-3: Node/Breaker Conversion to Bus/Branch Model Format .........................................44
Exhibit 4-4: Examples of Dominant CNodes in Detailed Node/Breaker Model ...........................47
Exhibit 4-5: Generating Unit with POR at Station .......................................................................51
Exhibit 4-6: Net Metered Generating Station with Auxiliary Load ................................................52
Exhibit 4-7: Generating Unit Market POR Different from Generator Terminal ............................55
Exhibit 4-8: Generation Aggregation ...........................................................................................56
Version 7 Last Revised: October 30, 2014May 29, 2015 Page 9
CAISO Business Practice Manual BPM for Managing Full Network Model
Exhibit 4-9: Combined Cycle Generating Unit .............................................................................57
Exhibit 4-10: Detailed Physical Model of Aggregated Market Participant ....................................63
Exhibit 4-11: Commercial Model of Aggregated Market Resource ..............................................64
Exhibit 4-14: Price Location and Aggregation Relationships .......................................................72
Exhibit 4-15: AC Interface MW Flow vs. Interface MW Flow Constraint ......................................82
Exhibit 5-2: FNM Data Bases .....................................................................................................91
Exhibit A-1: Definition of System Resource Aggregations for SMUD-TID IBAA ........................101
Exhibit A-2: Scheduling Points for SMUD-TID IBAA .................................................................102
Version 7 Last Revised: October 30, 2014May 29, 2015 Page 10
CAISO Business Practice Manual BPM for Managing Full Network Model
1. IntroductionWelcome to CAISO BPM for Managing Full Network Model. In this Introduction you will find the following information:
The purpose of CAISO BPMs
What you can expect from this CAISO BPM
Other CAISO BPMs or documents that provide related or additional information
1.1 Purpose of California ISO Business Practice ManualsThe Business Practice Manuals (BPMs) developed by CAISO are intended to contain implementation detail, consistent with and supported by the CAISO Tariff, including: instructions, rules, procedures, examples, and guidelines for the administration, operation, planning, and accounting requirements of CAISO and the markets. Exhibit 1-1 lists CAISO BPMs.
Exhibit 1-1: CAISO BPMs
CAISO BPM Library
1.2 Purpose of this Business Practice ManualThis BPM for Managing Full Network Model explains how the Full Network Model and its associated processes are used to support market operations and describes the process Market Participants follow in providing data used to support the model and in gaining access to FNM model data. Note that the BPM for Market Operations describes how the Full Network Model is used in Market operations activities, including the calculation of Locational Marginal Prices (LMPs).
The provisions of this BPM are intended to be consistent with the CAISO Tariff. If the provisions of this BPM nevertheless conflict with the CAISO Tariff, the CAISO is bound to operate in accordance with the CAISO Tariff. Any provision of the CAISO Tariff that may have been summarized or repeated in this BPM is only to aid understanding. Even though every effort will be made by CAISO to update the information contained in this BPM and to notify Market Participants of changes, it is the responsibility of each Market Participant to ensure that he or she is using the most recent version of this BPM and to comply with all applicable provision of the CAISO Tariff.
Version 7 Last Revised: October 30, 2014 May 29, 2015 Page 11
CAISO Business Practice Manual BPM for Managing Full Network Model
A reference in this BPM to the CAISO Tariff, a given agreement, any other BPM or instrument, is intended to refer to the CAISO Tariff, that agreement, BPM or instrument as modified, amended, supplemented or restated.
The captions and headings in this BPM are intended solely to facilitate reference and not to have any bearing on the meaning of any of the terms and conditions of this BPM.
Version 7 Last Revised: October 30, 2014 May 29, 2015 Page 12
CAISO Business Practice Manual BPM for Managing Full Network Model
1.3 ReferencesNote to Reader: The definition of acronyms and words beginning with capitalized letters are given in the BPM for Definitions & Acronyms.
Other reference information related to this BPM includes:
[1] California ISO Tariff
<http://www.caiso.com/rules/Pages/Regulatory/Default.aspx>
[2] CAISO BPM, BPM for Market Operations
<http://bpmcm.caiso.com/Pages/BPMDetails.aspx?BPM=Market Operations>
[3] CAISO BPM, BPM for Market Instruments
<http://bpmcm.caiso.com/Pages/BPMDetails.aspx?BPM=Market Instruments>
[4] CAISO BPM, BPM for CRRs
<http://bpmcm.caiso.com/Pages/BPMDetails.aspx?BPM=Congestion Revenue Rights>
[5] CAISO BPM, BPM for Definitions and Acronyms
<http://bpmcm.caiso.com/Pages/BPMDetails.aspx?BPM=Definitions and Acronyms>
[6] CAISO White Paper, CAISO Control Area Footprint, December 1, 20051
1 The December 1, 2005 CAISO Control Area Footprint includes a Pseudo Tie (a.k.a. remote tie) pilot project that may or may not be available in the future. See Section 4.2.4.5 for a description of a Pseudo Tie Pilot.
Version 7 Last Revised: October 30, 2014 May 29, 2015 Page 13
CAISO Business Practice Manual BPM for Managing Full Network Model
2. Full Network Model OverviewWelcome to the Full Network Model Overview section of the BPM for Managing Full Network Model. In this section, you find the following information:
What is included in the Full Network Model (FNM)
How the FNM is developed
How the FNM is used for Market operations
How the FNM relates to the models used for CAISO reliability analysis
2.1 Full Network Model Overview – IFM and RTMThe operation of the CAISO’s Markets, which includes the determination and mitigation of transmission congestion and the calculation of LMPs, requires a network model that provides a detailed and accurate representation of the power system included in the CAISO Markets. To support these model requirements for CAISO Market operations, Section 27.5 of the CAISO Tariff calls for the implementation of a Full Network Model. In this context, the FNM is a model that meets the needs of the Integrated Forward Market, the Real Time Market, and the CRR Auction and Allocation processes. These Markets and processes operate at different times, have different purposes and use slightly different model data and assumptions. As a result, the FNM used to support each Market is tailored to the market or process as described in the remaining sections of this BPM.
The FNM includes a combination of physical network data and commercial data required to support each of these Markets. The FNM used in each of these Markets includes a representation of the following elements:
CAISO Balancing Authority Area physical transmission system reflecting planned transmission outages appropriate for each market
CAISO Balancing Authority Area Generation and Pumped Storage resources reflecting planned Generation Outages appropriate for each market
CAISO Balancing Authority Area Loads
Balancing Authority Areas that are embedded or adjacent to the CAISO Balancing Authority Area
Version 7 Last Revised: October 30, 2014 May 29, 2015 Page 14
CAISO Business Practice Manual BPM for Managing Full Network Model
Resources external to the CAISO Balancing Authority Area
Resources that use a Dynamic Schedule or utilize a Pseudo Tie
Groupings of Generation or Loads to reflect commercial arrangements
Aggregation of Generation or Load pricing nodes for bidding and settlements purposes
CAISO manages Energy and Ancillary Services (AS) to maintain the source/Demand balance of the electric system within reliability constraints for the Day-Ahead Market (DAM) and Real-Time Market (RTM). As further described below, the FNM is used to enforce all appropriate network and resource constraints and reflect transmission losses in developing the following:
Day Ahead Market (DAM) Schedules
DAM AS and RUC Awards
DAM LMPs
Hour-Ahead Scheduling Process (HASP) and Fifteen Minute Market (FMM) Intertie Schedules
Short-Term Unit Commitment (STUC) and Real-Time Unit Commitment (RTUC) Awards
Dispatch Instructions
Real Time LMPs
For more detail on the operation of these Markets, see the CASIO Market Operations BPM. CAISO’s reliability role is performed by the CAISO Systems Operations Department within the overall Western Electricity Coordinating Council (WECC) and North American Electric Reliability Council (NERC) framework.
The Balancing Authority Area Operations responsibilities are performed using the CAISO Energy Management System (EMS). Although the EMS is a computer system that primarily supports the reliability related CAISO functions, it also provides needed inputs to the CAISO Market Operation Systems on a continuous basis. The CAISO Market Operation Systems and, in particular, the DAM and the RTM system applications provide the means for managing the CAISO Markets while ensuring system reliability.
To facilitate the real time monitoring and operation of the CAISO Balancing Authority Area, the EMS requires a model of the physical power system network as well as real-time information on the status of power system components represented in the model. The network model and real-
Version 7 Last Revised: October 30, 2014 May 29, 2015 Page 15
CAISO Business Practice Manual BPM for Managing Full Network Model
time data are used to support applications that determine the operational state of the system at all times. The network model is also used for real time and off-line steady state studies to analyze the impact that single event (n-1) and critical multiple event (n-2) contingencies have on the power system and to develop plans to mitigate the impact of such outages should they occur.
The EMS detailed physical network model is used in the state estimator and other reliability applications which run on the CAISO's EMS used for Real-Time operations and for monitoring grid reliability. The EMS model includes representation of the interconnected power system of the CAISO Controlled Grid and certain parts of the WECC region. The market FNM includes the CAISO Balancing Authority Area and CAISO Controlled Grid, Integrated Balancing Authority Area representations, and the New Participating TO area and external resources and loads, as well as conditions on transmission facilities in other balancing authority areas.
In contrast to the EMS model, the IFM/RTM System requires both an accurate model of the physical power system network and real-time data and an accurate commercial network model that includes commercial parameters such as constraints, attributes, and commercial agreements2. This combined physical and commercial model, known as the FNM, is used for DAM and RTM clearing, Congestion Management, intertie transfers, loss determination, Energy and AS scheduling and Dispatch, and LMP calculations. The physical portion of the market FNM is "extracted" from the EMS model since the EMS model has the majority of the facility representations needed for market purposes. This provides efficiency by not requiring the CAISO to maintain duplicate, parallel models. Further, it assures that the EMS model and the market model will always be in sync with one another and have a consistent system representation. Commercial components are then added to the EMS model to produce the market FNM.
The ability to monitor conditions throughout the network through the use of the FNM allows the IFM/RTM System to enforce constraints that enable the CAISO to manage congestion and create feasible schedules. It is important that the information provided to the IFM/RTM System be sufficiently accurate for Congestion Management purposes and to provide operators sufficient information on potential constraints. As described in further detail below, there are several types of situations in which it is not appropriate for the IFM/RTM Systems to enforce all constraints that are included in the FNM. For example, for grid facilities where there is not sufficient visibility to ensure the accuracy required for Congestion Management through the IFM/RTM System, the constraints will not be enforced by the market software. In these cases the operators will examine all available information, including State Estimator solutions and available telemetry, to operate the system. For such circumstances the operators will follow the
2 The terms "attributes and commercial agreements" refer to the commercial perspectives of the market FNM that the physical network model does not represent, such as the contract agreements on delivery capacity of the transmission lines, loss determination and point of delivery.
Version 7 Last Revised: October 30, 2014 May 29, 2015 Page 16
Comparison of The FNM and EMS Models
Commercial Dat
a
Full Network Mod
el
EMS Model
State Estimator Based
Upon Real Time Data
State Estimator Data Common to EMS and
FNM
Control Area Model of Physical
Topology Common to EMS Model and
FNM
WECC External NetworkCommon to EMS Model and
FNM
CAISO Business Practice Manual BPM for Managing Full Network Model
relevant CAISO operating procedures where applicable. CAISO operating procedures define constraints other than thermal limits of individual network branches, and state the conditions in which the constraints are valid, including variation by season, time of day, temperature, wind speed, existence of outages, market time horizon, etc.
The CAISO Operating Procedure 1210 provides a process through which on any given day the ISO staff reviews the results of power flow analyses run for the next Trading Day (within the DAM process), for one day past the next Trading Day (D+2), and for two days out past the next Trading day (D+3). This process is intended to allow the ISO to validate the market model, including any changes to topology or ratings due to planned or forced outages, and evaluate the feasibility and reliability implications of market commitments and schedules. This process also allows the ISO to consider any of the factors described in Section 2.1.1 that may require changes to the enforcement status of certain constraints or contingencies.
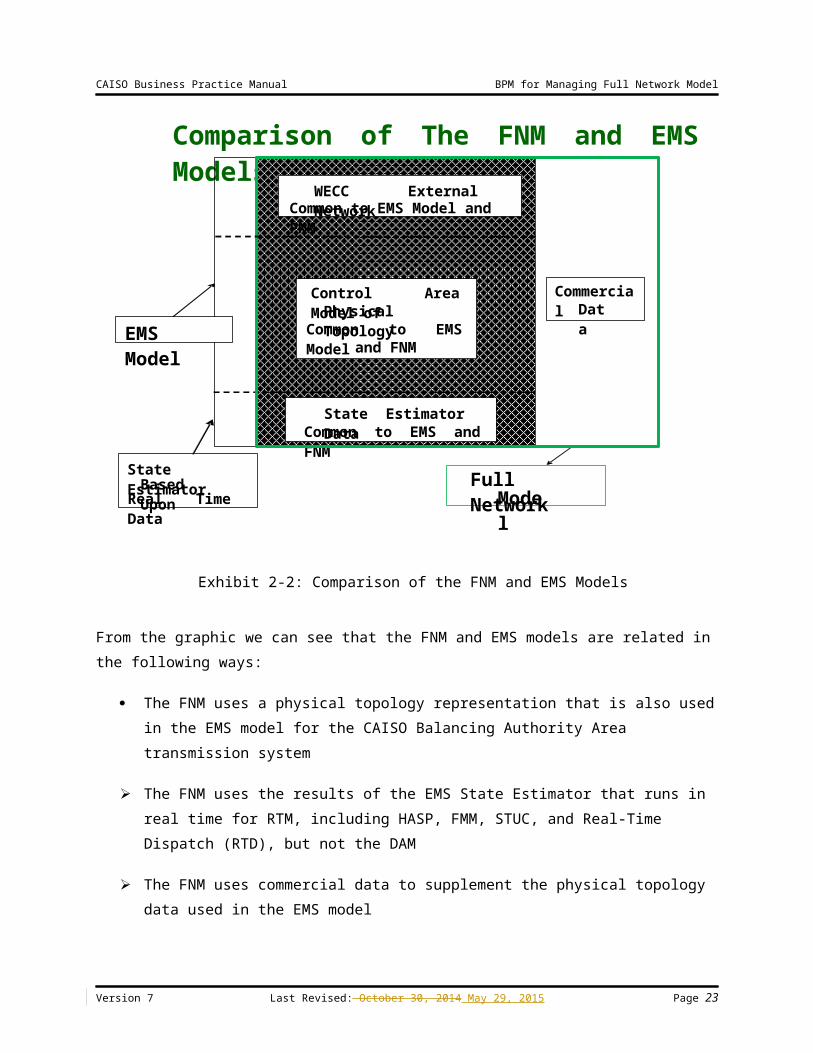
Exhibit 2-1 graphically represents the components of the FNM as they relate to the EMS model.
Exhibit 2-2: Comparison of the FNM and EMS Models
Version 7 Last Revised: October 30, 2014 May 29, 2015 Page 17
CAISO Business Practice Manual BPM for Managing Full Network Model
From the graphic we can see that the FNM and EMS models are related in the following ways:
The FNM uses a physical topology representation that is also used in the EMS model for the CAISO Balancing Authority Area transmission system
The FNM uses the results of the EMS State Estimator that runs in real time for RTM, including HASP, FMM, STUC, and Real-Time Dispatch (RTD), but not the DAM
The FNM uses commercial data to supplement the physical topology data used in the EMS model
The FNM uses the external network physical model used by the EMS model, except where there are EMS-only elements
The FNM may use a commercial model for portions of the network that is external to the CAISO Balancing Authority Area, which differs from the EMS reliability model, as needed for modeling market resources and flows.
The details of the FNM and the associated processes for the DAM and RTM markets are described starting in Section 3.
2.1.1 Overview of Constraint Enforcement in the IFM/RTM System
Throughout the operations of the CAISO Markets there are several instances in which the enforcement of certain constraints could force a CAISO Market process to a solution that is not consistent with good utility operating practice. There are also instances where congestion that would appear and cause constraints to bind in the markets ultimately does not materialize in real-time. In some of these instances, the enforcement of certain constraints in the Day-Ahead Market would result in the unnecessary market commitment and scheduling of use-limited resources whose use could have been avoided by waiting to determine if the conditions causing the constraint to bind actually materialize in real time, or by managing such constraints through real-time operating procedures. In still other instances, the CAISO’s visibility via telemetry to certain constraint flows is not sufficient for the CAISO Market to reliably clear the market based on the enforcement of such constraints.
Given sufficiently complete and accurate information the CAISO Market processes are able to consider system conditions throughout the network through the use of the FNM, and through the Day-Ahead Market and Real-Time Market optimizations the CAISO can then enforce constraints to manage congestion and create feasible schedules. For grid facilities where there is not sufficient visibility to ensure the accuracy required for managing congestion through the market systems, as a default approach, the CAISO will not enforce the constraints in the markets because doing so would lead to prices and dispatches that are not accurate reflections of
Version 7 Last Revised: October 30, 2014 May 29, 2015 Page 18
CAISO Business Practice Manual BPM for Managing Full Network Model
realistic flows. The operators will then have to manage any congestion and operate the system based on available real-time information including State Estimator solutions and available telemetry.
If real-time conditions are such that a constraint that was not being enforced by default becomes a real operational concern, the CAISO operators can then enforce the constraint in the real-time dispatch to provide dispatch relief through the Real-Time Market. In such instances CAISO operators may decide to turn on and begin enforcing a constraint using its normal rating, or may utilize an adjusted rating based on observed differences between flows over the constraint as indicated by the market power flow models versus flows observed in real time via telemetry. Similarly, there may be a constraint that is enforced in the market, becomes binding and limits market schedules, and then in real time has actual flows that are well within the line limit. Based on good utility practice the CAISO operators may decide to adjust the rating on the facility that is used in the markets to compensate for a systematic discrepancy between the market power flow and the actual real-time flow, in preference to turning off the constraint entirely and ceasing to enforce it.
The following sections describe specific categories of grid constraints and contingencies generally not enforced in one or more of the CAISO Market processes.
2.1.1.1 Facilities that Lack Sufficient Telemetry and Visibility
Certain transmission facilities lack sufficient telemetry to provide accurate data for market dispatch and pricing purposes. Regular enforcement of constraints on these facilities in the market optimizations may lead to spurious congestion or infeasible schedules. The CAISO therefore generally does not enforce constraints on the facilities where there is not sufficient telemetry and visibility. This applies to many facilities below 115 kV and to a small number of facilities at 115kV, but does not apply to any of the facilities above 115 kV. In cases where there is limited telemetry and visibility on facilities, the CAISO will evaluate whether the model flows sufficiently reflect actual conditions on these facilities and will also continue to monitor them in real-time for overloads. If a real-time overload arises on one of these constraints that requires an operational response, the constraint can be turned on in the RTM so that it is managed through the markets. The CAISO Operating Procedures list the set of below-115 kV constraints that it will enforce regularly in the markets, as well as the limited set of 115 kV constraints it will not enforce regularly in the markets.
Version 7 Last Revised: October 30, 2014 May 29, 2015 Page 19
CAISO Business Practice Manual BPM for Managing Full Network Model
2.1.1.2 Intertie Constraints
Each intertie between the CAISO and an adjacent Balancing Authority Area has both a flow limit and a scheduling limit. Scheduling limits have been agreed to by the CAISO and the neighboring Balancing Authority. The CAISO Markets are operated on a flow-based congestion management design, whereas the joint scheduling practices with neighboring Balancing Authorities continue to be based on enforcement of the scheduling limits, in the form of intertie constraints (ITC) as discussed in section 4.2.4.1.
The CAISO may enforce a physical flow constraint limit at each internal and Intertie location in the IFM taking into account the total power flow contributions, which include internal schedules and import/export schedules, which can be physical or virtual, and the CAISO’s estimates of unscheduled flow at the Interties. The physical flow constraint limit at each Intertie is less than or equal to the Transmission Constraints, including Nomograms and Contingencies, affecting the Intertie. At each Intertie the scheduling and physical flow constraint limits may differ. In the RUC and RTM processes, the same physical flow constraint limit is applied and internal schedules and import/export schedules, which can only be physical, are considered along with the CAISO’s estimates of unscheduled flow at the Interties.
The CAISO will not enforce physical flow constraints at Interties for which the CAISO (1) is subject to contractual arrangements that provide for the management of unscheduled flows using other procedures; (2) has determined it cannot enforce the power flow constraints due to modeling inaccuracies, including inaccuracies in available data; or (3) has otherwise determined that enforcing the power flow constraints could result in adverse reliability impacts. For example, the CAISO does not enforce the physical flow constraints for the California-Oregon Intertie (COI) as Day-Ahead or Real-Time Market limits. Because COI is a qualified path under the Western Electric Coordinating Council’s unscheduled flow mitigation procedure and as the path operator with contractual obligations under the COI Path Operator’s Agreement (POA) for COI (and the Pacific AC Intertie (PACI), which is the major portion of COI that is within the CAISO’s Market area), this regional procedure allows the CAISO to manage the total (scheduled and unscheduled) flow in Real-Time operations. Therefore, the CAISO enforces the actual physical flow limits of COI’s underlying system, and enforces the COI path rating as a scheduling limit, in the Day-Ahead and Real-Time Markets, rather than COI’s overall flow limit when a regional procedure is in place.
2.1.1.3 Management of Use Limited Resources
Enforcement of certain constraints and contingencies in the DAM may result in the start-up of one or more use-limited resources, such as combustion turbines (CTs) and hydro facilities located in the area of the affected constraints, in anticipation that the contingency or other event
Version 7 Last Revised: October 30, 2014 May 29, 2015 Page 20
CAISO Business Practice Manual BPM for Managing Full Network Model
causing the constraint to bind would occur in real time. If such constraints – and particularly the contingencies – are regularly enforced in the DAM, the markets may commit the associated use-limited resources in anticipation of a real-time need, when often the contingency would not occur or the constraint would not be binding in real time and the limited run-hours of the use-limited resources would be used needlessly. The CAISO, therefore, does not enforce such constraints and contingencies in the Day-Ahead Market, but will enforce them in the RTM and utilize operating procedures if necessary to commit and dispatch the use-limited resources only when needed.
Similarly, the enforcement of constraints in the DAM in certain locations may result in a situation where the associated use-limited resources do not clear the Pre-IFM Market Power Mitigation run and as a result are not available for commitment in the Integrated Forward Market. At the same time, in such instances the constraints may bind in the IFM leading to extremely high prices due to the unavailability of the resources that did not clear the MPM run. As in the previous case, this is another situation in which anomalous results – extreme LMPs in this case – are caused by enforcing constraints in the DAM that are best managed through the use of use-limited resources when they are binding in real time. The CAISO therefore enforces these constraints in the RTM but not the DAM.
2.1.1.4 Management of Transmission Outages
Planned transmission outages present another situation where there is a need for the CAISO to exercise judgment as to whether to enforce a contingency-based constraint. In some situations the planned outage work may create temporary conditions that cannot be resolved by re-dispatch through the market, but rather require special procedures that are typically part of the planned outage work. Such special procedures may include returning equipment to service in within a specified time frame to relieve a constraint in the event a contingency occurs, or special load dropping procedures related to the planned transmission work. In other situations, the CAISO may determine that alternative constraints should be applied instead of the originally defines ones for the duration of the planned outage work. The CAISO evaluates such planned outages on a case-by-case basis to determine whether closely related contingency constraints would lead to unrealistic or overly constrained outcomes if enforced in the market, and manages such constraints through the RTM and/or the special outage-related procedures.
2.1.1.5 Lessons from Market Results
Market solutions may demonstrate that enforcement of certain constraints repeatedly produces inaccurate results either because they frequently indicate congestion in the markets that is not materializing in real time (i.e., false positives), or because they tend not to register congestion in the markets but become congested in real time (i.e., false negatives). For the false positive cases, CAISO engineering staff compares actual flow data against the flows implied by market
Version 7 Last Revised: October 30, 2014 May 29, 2015 Page 21
CAISO Business Practice Manual BPM for Managing Full Network Model
schedules and assesses whether modeling improvements can reduce the observed discrepancies. If this is not possible the CAISO may stop enforcing such constraints in the markets while continuing to monitor their associated real-time flows, so that if unscheduled congestion becomes an issue the CAISO can resume enforcing the constraints in the markets. For the false negative cases, CAISO engineering staff assesses the possibility of improving the model, but in these cases if improvements cannot be found the CAISO continues to enforce the constraints in the markets to avoid exacerbating potential schedule infeasibilities. In either situations, the CAISO may utilize an adjustment to a constraint limit as a preferable third alternative to either turning the constraint completely off or enforcing it at its normal limit.
2.2 Full Network Model Overview – CRR SystemThis section provides an overview of how the FNM is prepared to support the CAISO CRR Allocation and Auction processes. These processes and the FNM used in these processes are more fully described in the BPM for Congestion Revenue Rights.
Congestion Revenue Rights (CRRs) are financial instruments that enable holders of such instruments to manage variability in Congestion costs that occur under Congestion Management protocol that is based on locational marginal pricing. CRRs, which can be either obligations or options, are acquired by qualified entities primarily, but not solely, for the purpose of offsetting costs associated with IFM Congestion costs that occur in the Day-Ahead Market. Only CRR Obligations can be acquired through the CRR Allocation and CRR Auction processes. CRR Options are not available through the CRR Allocation and CRR Auction processes and are only available to Merchant Transmission upgrades.
CRRs Obligations can be acquired as either Point-to-Point (PTP) CRRs or Multi-Point (MPT) CRRs. A PTP CRR is a CRR Obligation defined from a single CRR Source to a single CRR Sink. An MPT CRR is defined by more than one CRR Source and/or more than one CRR Sink. An MPT CRR distributes the total MW value over the multiple CRR Sources and/or multiple CRR Sinks so that the total MW assigned to all CRR Sources equals the total MW assigned to all CRR Sinks.
The CAISO performs CRR Allocation and CRR Auction Processes on a periodic basis, currently annually and monthly. Both the CRR Allocation and CRR Auction require an FNM for the Simultaneous Feasibility Test (SFT) to help ensure revenue adequacy. The SFT is the central optimization engine within each CRR Allocation Process and CRR Auction Process that determines which CRRs will be awarded to the market participants that nominate and/or bid for them. To ensure consistency between released CRRs and the IFM and RTM, the network model for the CRR processes is fundamentally based on the same FNM that is used in the IFM and RTM processes. As described in Section 36.4 of the CAISO tariff, when the CAISO conducts its CRR Allocation and CRR Auction, the CAISO shall use the most up-to-date DC
Version 7 Last Revised: October 30, 2014 May 29, 2015 Page 22
CAISO Business Practice Manual BPM for Managing Full Network Model
FNM which is based on the AC FNM used in the Day-Ahead Market. Perfect consistency between the CRR FNM and the FNM for the IFM/RTM System, however, is not possible for several reasons. First and foremost, the FNM for the IFM/RTM System is subject to updating on a daily or even hourly basis to reflect changes in system conditions, including planned and forced outages or derates of network facilities. In contrast, the CRR FNM is a fixed snapshot of grid conditions that is intended to reflect typical grid conditions for the time period for which CRRs are being released. Second, the CRR FNM must be constructed and provided to market participants well in advance of the market time period for which the released CRRs will be applicable, which may be over a year in the future. For example, the CRRs released during the annual CRR release process conducted in late summer and fall of one year are applicable to the entire following calendar year. Thus, in building the CRR FNM the CAISO must try to predict grid conditions for the future time period, and must model a typical set of conditions for the CRR FNM that represent, in an average sense, the much more variable grid conditions that will be reflected in the FNM for the IFM/RTM Processes.
The lack of perfect consistency between the CRR FNM and the FNM for the IFM/RTM Processes is a product of the different purposes for which these two models are used. At the highest level, the FNM for the IFM/RTM Processes serves both operational and financial objectives, whereas the CRR FNM serves primarily a financial objective. The FNM for the IFM/RTM Processes is used to create feasible schedules and dispatch instructions for each trading interval in the spot markets and to determine locational marginal prices that are aligned with those schedules and dispatches. In contrast, the CRR FNM is used to release CRRs to market participants that will – on average over the course of each month – pay or charge their holders an amount of money equal to the monthly total of the IFM congestion costs corresponding to the hourly energy schedules that match the specifications of each CRR. The accuracy with which the monthly payments and charges to all CRR holders match the total monthly IFM congestion costs is known as revenue adequacy. If less money is collected in IFM congestion costs over a month than is paid on net to all CRR holders, there is a situation of revenue inadequacy; the opposite is a situation of revenue surplus, which is an indicator that more CRRs could have been released to market participants without increasing the risk of revenue inadequacy.
Thus, the CAISO must specify the CRR FNM in the face of the uncertainties described above, to best achieve the objective of releasing as many CRRs as possible to the market while maximizing the likelihood that the released CRRs will be revenue adequate.
The FNM that is received by the CRR system from the FNM application, in preparation for the periodic CRR Allocation and CRR Auction Processes, is an AC FNM in a CRR-defined bus-branch format (Power Technologies Inc. software PSS/E version 26 format). The bus number and bus name in this FNM preserves the same bus number and bus name as used in the
Version 7 Last Revised: October 30, 2014 May 29, 2015 Page 23
CAISO Business Practice Manual BPM for Managing Full Network Model
source bus-branch base case model described in Section 4.2, to the extent possible considering changes in topology that can result from changes in breaker status.
In the CRR SFT process, the AC version of the FNM is converted to a DC network model. In a DC model, only MW values are calculated in contrast to AC models which analyze and calculate both MW and MVAR quantities. In a DC model for example, all transmission line and transformer reactances are taken into account whereas all resistances are set to zero and all bus voltage values are set to 1.0 per-unit. Thus, a linearized network solution technique (commonly referred to as a DC solution) is applied to the network model for use in the CRR system. A linearized network solution is used for CRR analysis because CRRs are intended to manage Congestion costs. A DC solution provides for the required linear analysis, instead of non-linear analysis as used in the AC FNM. The manner in which the FNM data is processed further in the CRR system to achieve a DC solution, and how this is used in the CRR SFT processes is described in the BPM for Congestion Revenue Rights.
The components of the FNM that are input into the CRR Allocation and Auction process are:
Power flow model
Commercial data.
2.3 Access to the CRR Full Network ModelTariff Section 6.5.1.4 provides that the CAISO will provide its CRR FNM as it is used in the CRR Allocation and Auction processes, to Market Participants and non-Market Participants that satisfy the applicable requirements. The CRR FNM will contain information related to the conduct of the CRR Allocation and Auction as well as representative data that apply to the conduct of the CAISO Markets in general.
In accordance with Tariff Section 6.5.1.4, the requirements to obtain the CRR FNM are as follows:
Market Participants who are WECC members:
The Market Participant must execute the CAISO's Non-Disclosure Agreement (NDA) and each of its employees and consultants who will have access to the model must sign the non-disclosure statement attached as an exhibit to the Market Participant’s NDA. The form of the NDA in current use will be available on the CAISO’s Website.
Market Participants who are not WECC members:
Version 7 Last Revised: October 30, 2014 May 29, 2015 Page 24
CAISO Business Practice Manual BPM for Managing Full Network Model
The Market Participant must execute the CAISO's NDA, and each of its employees and consultants who will have access to the model must sign the non-disclosure statement attached as an exhibit to the Market Participant’s NDA, as just described. The Market Participant must also submit a fully executed Non-member Confidentiality Agreement to the WECC. A copy of the Non-member Confidentiality Agreement can be obtained on the WECC website.
Non-Market Participants who are WECC members:
The non-Market Participant must reasonably demonstrate a legitimate business interest in the CAISO’s Markets. The non-Market Participant must also execute the CAISO's NDA, and each of its employees and consultants who will have access to the model must sign the non-disclosure statement attached as an exhibit to the non-Market Participant’s NDA, as just described.
Non-Market Participants who are not WECC members:
The non-Market Participant must reasonably demonstrate a legitimate business or governmental interest in the CAISO’s Markets. The non-Market Participant must execute the CAISO's NDA, and each of its employees and consultants who will have access to the model must sign the non-disclosure statement attached as an exhibit to the non-Market Participant’s NDA, as just described. The Market Participant must also submit a fully executed Non-member Confidentiality Agreement to the WECC, which can be obtained on the WECC website.
3. Full Network Model for IFM & RTM3.1 FNM Transmission System RepresentationThe CAISO Controlled Grid is part of the WECC region of the NERC. The FNM represents a portion of WECC including the AC transmission system (with lines operating at voltage levels from 55kV to 500kV) and the HVDC transmission systems that affect the CAISO Controlled Grid.
The model essentially represents the transmission network and interconnections and is comprised of the following:
CAISO Balancing Authority Area encompassing the networks of the three major investor owned utilities, referred to as Participating Transmission Owners (PTOs)
Version 7 Last Revised: October 30, 2014 May 29, 2015 Page 25
CAISO Business Practice Manual BPM for Managing Full Network Model
Networks of New Participating Transmission Owners (New PTOs)
Metered Sub-Systems (MSS) that are part of the CAISO operational area
Non-CAISO Balancing Authority Areas that are embedded within or adjacent to the CAISO Balancing Authority Area
External Balancing Authority Areas and external transmission systems to the extent necessary to improve the accuracy of the CAISO Market solutions for purposes of reliable operations and support the commercial requirements of the CAISO Markets
Utility entities also referred to as Utility Distribution Companies (UDCs)3
HVDC lines such as from the Northwest to Sylmar, which support Schedules into the CAISO Balancing Authority Area.
A brief description of each of these transmission entities is provided in the following sections.
3.1.1 Participating Transmission Owners
PTOs’ facilities primarily consist of the transmission systems of the three California investor owned utilities namely, Pacific Gas and Electric Company (PG&E), Southern California Edison Company (SCE), and San Diego Gas & Electric Company (SDG&E). PTOs also include New PTOs that are described in Section 3.1.2 below. Grandfathered agreements, such as the Existing Transmission Contracts (ETCs) and Transmission Ownership Rights (TORs), are some of the commercial arrangements that need to be represented in the FNM.
3.1.2 New Participating Transmission Owners (New PTOs)
The New PTOs are the physical power transmission network segments that are under CAISO operational control through the New Southern Participation Transmission Owner agreement effective January 1, 2003 and transmission contract transfers in the LADWP Balancing Authority Area by the City of Pasadena to CAISO for operational control effective January 1, 2005. Most of these New PTO transmission contract rights belong to the southern California cities of Banning, Azusa, Anaheim, Riverside, Vernon, and Pasadena are located outside the California geographic region. The New PTOs have transmission contract rights on each segment of the transmission network per direction. The New PTO contractual network also includes the
3 The concept of "Utility" also sometimes referred to as Utility Distribution Company (UDC) is referenced here for the purposes of accurately determining losses and then reflecting them in the calculation and allocation of Unaccounted For Energy (UFE). A Utility/UDC is usually an ISO metered entity who has signed a UDCA agreement, and installed a CAISO Revenue Ceritfied Meter at its service territory for UFE treatment. Examples of this would include IOUs, municipalities, and certain grid connected load. This load is modeled at the grid connection point (or the Point of Delivery-consistent with the Tariff definitions) and metered separately.
Version 7 Last Revised: October 30, 2014 May 29, 2015 Page 26
CAISO Business Practice Manual BPM for Managing Full Network Model
Southern Transmission System (STS) that includes a portion of the 500kV DC interface between Adelanto and InterMountain Power Plant (IPP) substations. These systems are described in more detail in Section 4.2.4.3. Modeling of DC lines is described in more detail in Section 4.2.5.1.
3.1.3 Metered Sub-Systems
The following excerpt from the CAISO Tariff (Section 27.5.2) describes the handling of MSSs:
“The FNM includes a full model of MSS transmission networks used for power flow calculations and congestion management in the CAISO Markets Processes. Network constraints (i.e. circuit ratings, thermal rating, etc.) within the MSS or at boundaries, shall be monitored but not enforced in the CAISO’s FNM. If overloads are observed in the forward markets are internal to the MSS or at the MSS boundaries and are attributable to MSS operations, the CAISO shall communicate such events to the Scheduling Coordinator for the MSS and coordinate any manual re-dispatch required in Real-Time. If, independent of the CAISO, the Scheduling Coordinator for the MSS is unable to resolve Congestion internal to the MSS or at the MSS boundaries in Real-Time, the CAISO will use Exceptional Dispatch Instructions on Resources that have been Bid into the FMM and RTM to resolve Congestion. The costs of such Exceptional Dispatch will be allocated pursuant to the provisions specified in Section 11.5.6. Consistent with Section 4.9, the CAISO and MSS Operator shall develop specific procedures for each MSS to determine how network constraints will be handled.”4
MSSs have power transmission networks that represent either a parallel loop or radial tie to the CAISO network. MSSs exist in both Northern and Southern California. Some of the MSSs operate under an aggregate MSS commercial arrangement.
For the purpose of supporting the IFM and RTM, all network constraints within MSSs are monitored but not enforced. To implement these exclusions, these contracts are grouped into what is referred to as the exception list. Network constraints that are monitored but not enforced are constraints that are included in the congestion management processes for analysis purposes but do not result in any action to resolve congestion on these constraints in the IFM/RTM. The exception list is a component of the supplemental data management applications of the CAISO FNM described in more detail in Section 3.2. The "exception list" is a list of network constraints that are to be only monitored for violations of capacity limits, but not enforced if violations occur, in the SCUC and Network Applications executions for IFM and RTM. They are classified as such and stored as components of the Supplemental Market Data 4 Specific procedures have not been developed at this time for coordination of congestion management, except for
the congestion management within the CAISO Controlled Grid. As such procedures are developed, they will included in future versions of this BPM unless it is determined based upon - a case-by-case review that they are confidential.
Version 7 Last Revised: October 30, 2014 May 29, 2015 Page 27
CAISO Business Practice Manual BPM for Managing Full Network Model
Management Applications for that purpose. This exclusion allows the MSS to manage congestion on its grid while allowing the CAISO to use a network model that has sufficient accuracy to allow it to meets its market operations responsibilities.
There is however, a potential complication posed by loop flows, especially when the MSS system has more than one interconnection point that forms a loop with the CAISO Controlled Grid. In this case even if the net interchange Power with CAISO is 0 MW, the nodal prices within their system can be different due to the loop flow at the different points of the interface, which may impact MSS settlements.
3.1.4 External Systems
As provided in Tariff Section 27.5.1, the FNM is a representation of the CAISO Balancing Authority Area that enables the CAISO to conduct power flow analyses to identify transmission constraints for the optimization of the CAISO Markets. External Balancing Authority Areas and external transmission systems are modeled to the extent necessary to 1) improve the accuracy of the CAISO Market solutions for purposes of reliable operations and 2) support the commercial requirements of the CAISO Markets. External connections are retained between Intertie branches within Transmission Interfaces. Other external loops are modeled, when the CAISO has determined that such modeling allows the CAISO to increase the accuracy of the congestion management process. The CAISO Markets’ optimizations also factor in forecasted unscheduled flow at the Interties.
Initially for the FNM, and consistent with WECC scheduling requirements, power transfers into the CAISO Balancing Authority Area are modeled as boundary injections at Interties, except for New PTO networks, Integrated Balancing Authority Areas and other areas where external loops are modeled. The CAISO detailed model, which is extracted from an EMS model, includes these boundary nodes. The FNM includes the boundary nodes in node-breaker format (See section 4.2.1 for a discussion of node-breaker models). A closed-loop representation of the power system external to CAISO is used to increase the accuracy of the congestion management process. The inter-area interchanges are scheduled as transactions across the prescribed Intertie Transmission Interfaces, as the end result of running the CAISO markets. Scheduling Coordinators submit bids, including self-schedules, which are among the inputs to the market optimization process. The market optimization process is a multi-step process described in the BPM for Market Operations.
Concerning Intertie scheduling, first the Total Transfer Capability (TTC) limit for an Intertie is predetermined and defined. This is dynamically adjusted as described in Appendix L of the CAISO Tariff, to what is referred to as Available Transfer Capability (ATC) based on actual or expected operating conditions of the Balancing Authority Area.
Version 7 Last Revised: October 30, 2014 May 29, 2015 Page 28
CAISO Business Practice Manual BPM for Managing Full Network Model
Second, Energy and AS capacity are bid by a number of Scheduling Coordinators at Scheduling Points on the Interties as export or import, which form the Interchange between Balancing Authority Areas. Then in the IFM/RTM all the schedules on each Intertie are optimized together to compete for capacity subject to its ATC limit. The enforcement of intertie limits when external loops are modeled is discussed further in section 4.2.4.3. Related intertie constraints (ITC) on market schedules are discussed in section 4.2.4.1.
Unscheduled flow is managed by enforcing both physical flow limits and scheduling limits on the Interties in the Day-Ahead and Real-Time timeframes.
For the closed-loop representation, imports and exports are scheduled at the prescribed Interties, i.e., they are represented as pseudo-injections at the boundary nodes. In cases where multiple Intertie branches comprise a single Transmission Interface, external connections are modeled between the branches within the Transmission Interface.5 In addition, external connections are retained between intertie Transmission Interfaces where the CAISO has determined that doing so increases the accuracy of the congestion management process.6 In the RTM, unscheduled loop flow on the Interties is calculated from the State Estimator solution, as the difference between actual and scheduled flows. This ensures that the effects of loop flow within the CAISO Balancing Authority Area are recognized and that RTM will maintain total intertie flows within branch and Transmission Interface limits.
The modeling of these external loops in IFM and the use of the State Estimator solution in RTM result in increased accuracy of the congestion management process. The loops are needed to:
More accurately represent loop flows in CAISO system Achieve the needed accuracy in calculating post contingency flows in the contingency
analysis More accurately represent the impact of congestion on LMPs Ensure feasibility of forward schedules
For IFM and RTM, the inter-area Interchange is scheduled at the prescribed Intertie Scheduling Points. In addition, the CAISO performs loop-flow calculations to supplement market scheduling data, to create a forecast of unscheduled flow between sources and sinks in Balancing Authority Areas that are both external to the CAISO Markets, as a starting point for optimizing market
5 Transmission Interfaces that consist of multiple intertie branches, other than at the boundary of New PTO networks and Embedded and Adjacent Control Areas, include Hassayampa to Palo Verde (the external end of the PALOVRDE branch group), Coachella Valley to Ramon (IID-SCE_BG), La Rosita to Tijuana (CFE_BG), Malin substation (PACI_BG), N. Gila substation (N.GILABK4_BG), Pacific DC Intertie (NOB_BG), Silver Peak (SILVERPK_BG), and Summit substation (SUMMIT_BG).
6 Initially, these external connections extended from Palo Verde to Westwing, and Westwing to Moenkopi via Yavapai – . As discussed in section 4.2.4.3, the modeling of external loops has been extended further to increase the accuracy of the congestion management process.
Version 7 Last Revised: October 30, 2014 May 29, 2015 Page 29
CAISO Business Practice Manual BPM for Managing Full Network Model
schedules within the ATC available to the CAISO Markets. Section 3.1.10 of the BPM for Market Operations provides further detail of these calculations.
RTM may add additional Intertie fixed injections to model unscheduled loop flows. The RTM calculation, in each run, is for a set of injections at Scheduling Points and other locations to compensate for the difference between market flows, calculated from the SCED run 10 minutes ago, and actual flows obtained from the CAISO EMS State Estimator (SE) solution on the boundary branches of the market area and other specified transmission interfaces. Once the injections that are needed to match boundary conditions are calculated, the difference between these injections and the scheduled values for the Scheduling Points can be treated as a “compensating injection”. These compensating injections are assumed to stay constant for all Dispatch Intervals within the time horizon of each RTM market run.
The solution obtained using these approaches reflect not only the impact of the Scheduling Points but also the impact of loop flows and inadvertent Energy. The solution distinguishes between the portion of flows in the region due to the scheduling at the Scheduling Points and the portion of the flows due to the compensating injections, by applying shift factors to determine the contribution of the market Schedules to each network constraint. The CAISO manages the portion of the flow associated with the Scheduling Points and not the entire flow, by monitoring and enforcing limits based on the market’s portion of the capacity of these branches.
3.1.5 Other Balancing Authority Areas
The design of the CAISO market recognizes that the CAISO Balancing Authority Area is interconnected with several other Balancing Authority Areas in the Western Electricity Coordinating Council (WECC) interconnected system. Having an accurate network model within the CAISO Balancing Authority Area and in neighboring Balancing Authority Areas whose networks are closely interrelated with the CAISO’s and therefore affects physical flows within the CAISO Balancing Authority Area, is essential for the CAISO market to achieve their objectives.
In addition to External Balancing Authority Areas, another category of Balancing Authority Area used in the design of CAISO market is the Integrated Balancing Authority Area (IBAA). IBAAs can include both (a) Balancing Authority Areas that are totally surrounded by the CAISO Balancing Authority Area, or more generally, Balancing Authority Areas that have direct interconnections exclusively with the CAISO Balancing Authority Area, and no other Balancing Authority Area, and (b) Balancing Authority Areas that are tightly interconnected with the CAISO Balancing Authority Area, but that also have direct interconnections with other Balancing Authority Areas, possibly including other IBAAs.
Version 7 Last Revised: October 30, 2014 May 29, 2015 Page 30
CAISO Business Practice Manual BPM for Managing Full Network Model
The radial model is not sufficiently accurate for IBAAs. IBAAs cannot be ignored in the FNM because their transmission network is embedded and/or runs in parallel with major parts of the CAISO network, thus having significant impact on the operation of the grid. Loop flow through the IBAAs is significant and has a large impact on the optimal resource scheduling and LMPs. Furthermore, the contingency analysis requires an accurate model for IBAAs, otherwise its results would be erroneous and useless. For these reasons, IBAAs must be modeled accurately in the FNM, which presents several challenges, not only in the IFM/RTM System, but also in the coordination of scheduling information between the IBAAs and the CAISO.
A more complete discussion of the treatment of these two types of Balancing Authority Areas is in included in Section 4.2.6.
3.1.6 Utility Distribution Company (UDC)
The UDC7 concept includes entities such as the California Department of Water resource’s (CDWR) that has grid-connected Loads, but do not necessarily constitute an electricity distribution company. A UDC service area is defined by a set of nodes within appropriate FNM Load zones and the corresponding UDC losses computed within the FNM application.
3.2 FNM Market RepresentationThe FNM includes Market data that supplements the transmission system data described in Section 3.1. This data comes from the following sources:
CAISO Master File
CAISO Supplemental Market Data Management Process
Network Applications
Commercial and operational data which comes primarily from the CAISO Master File includes resources, equipment and topology related information used in the IFM an RTM processes. This information is mapped to the physical network model. They include the following;
Aggregated Generation and Load resource definitions
Logical resources (e.g. to support load bidding for Non-Spinning Reserve))
Designated Congestion Areas for MPM and analysis
RUC zone definitions
7 This load is modeled at the grid connection point (or the Point of Delivery-consistent with the Tariff definitions) and metered separately.
Version 7 Last Revised: October 30, 2014 May 29, 2015 Page 31
CAISO Business Practice Manual BPM for Managing Full Network Model
Trading Hub definitions
Pricing Nodes and Pricing Locations
UDC and MSS area definitions
Balancing Authority Area Intertie definitions
Generator operating constraints (e.g. Pmax, Pmin, Ramp Rate, etc)
AS region definitions
The Supplemental Market Data (SMDM) application maps information to physical model elements using Global Unique Identifiers. SMDM data can change frequently depending upon the data point, from daily to as frequent as hourly or for every market run. SMDM data includes the following:
Constraint definitions and enforcement requirements, including Transmission Interfaces and Nomograms
Contingencies to be included in the Contingency Analysis application
Exception list for constraints that are to be only monitored in the IFM and RTM
Generation Distribution Factor (DGF) library
Load Distribution Factor (LDF) library
3.3 Use of Full Network ModelThe FNM supports the functions processed by the IFM/RTM System to analyze and resolve transmission congestion and losses and to calculate LMPs. Exhibit 3-1 shows the IFM/RTM market analysis functions using the FNM as the basis for their calculations along with the data flow supporting the functions.
Version 7 Last Revised: October 30, 2014 May 29, 2015 Page 32
CAISO Business Practice Manual BPM for Managing Full Network Model
Exhibit 3-3: Market Analysis Engine
Listed below is a brief discussion of the IFM/RTM system and business processes. For a more detailed discussion of these please see the CAISO BPM for Market Operations.
The set of IFM/RTM System functions that utilize the FNM is referred to as the Market Analysis Engine. The first function performed by the Market Analysis Engine is the Security Constraint Unit Commitment (SCUC). The SCUC function analyzes the Bid schedule to determine the optimal Generation Commitment and Dispatch while satisfying constraint violations using a linear programming analysis. (A linear program is an optimization process used to solve a series of linear equations subject to linear constraints.) The outputs of the SCUC are an optimized Dispatch for Market clearing within the network, Demand, and Bid constraints applied, and the Locational Marginal Prices (LMP). The optimized Dispatch is used to update the injections and withdrawals of the FNM that is then solved by an AC Power Flow that calculates bus voltage magnitudes and phase angles from which real and reactive line flows are calculated.
Version 7 Last Revised: October 30, 2014 May 29, 2015 Page 33
Power Flow Security Analysis
SCUC Optimization
(Linear Program)
Load Forecast
Outage Schedule
Full Network Model
Limit Violations Detected
BaseCase
AC Network Applications
Market Analysis Engine
IFM/ RTM System
No
Yes
LMP & Dispatch Solutions
SE Solution for RTM Analysis
( RTM Only)
Bid Schedules
EMS
Geo Database
FNM Assembly,Topology Processor,
Bus Scheduler
Generation, Load, Reactive Distribution
Factors, Etc.
Reliability Network Model & EMS Source
Data Market Network Model
GeneratorPmax, Pmin,
Ramp Rates, etc.
SMDMMaster File
CAISO Business Practice Manual BPM for Managing Full Network Model
The AC Power Flow solution creates the base case for a contingency analysis that is performed for a pre-defined and pre-determined set of “n-1” and critical “n-2” outage conditions. The critical “n-2” outage conditions have been identified through operating procedures as creating binding constraints. The outage conditions are referred to as contingencies. The contingency analysis identifies line flow and voltage limit violations for each outage condition. If limit violations exist in the base case or for any contingency case, the constraints for the SCUC are redefined according to the AC network analysis and the SCUC solution is recalculated.8 This process is iterated until an optimized solution with no limit violations is obtained. The Power Flow and contingency analysis are AC functions meaning they solve the non-linear circuit equations. This pair of functions is referred to as the AC network applications.
The Market Analysis Engine is used for analyzing Energy and Ancillary Services scheduling, congestion management, intertie losses, and for calculating LMPs for the IFM and the RTM. For the IFM and the RTM, the Power Flow is initialized using distribution factors9, outage schedules, and a Load forecast. For the RTM analysis, the State Estimator solution from the EMS is transmitted to the IFM/RTM System and used to initialize the Power Flow. For the RTM, a Security Constrained Economic Dispatch (SCED) is used to determine the Dispatch of Participating Generating Units. The SCED is also a component of the Market Analysis Engine.
In order to ensure that the financial hedging that is provided by Congestion Revenue Rights (CRRs) is consistent with prices resulting from the Market, the CRR system obtains its network model from the FNM that is used to run the Markets. Preparation of the CRR network model for export from the market systems follows initial steps that are described in Section 2.2 of this BPM. Subsequent processing of the network model for CRR purposes is described in the BPM for Congestion Revenue Rights.
3.3.1 IFM/RTM Market Analysis Engine
The Market Analysis Engine of the IFM/RTM System includes the SCUC and the network applications functions. The use of these functions is described in this section.
8 The Market Analysis Engine uses an iterative process between the SCUC Optimization and the AC Network Applications ("NA") functions. On the first iteration, SCUC performs an optimization without network constraints. NA then determines any violations of network constraints using the initial unconstrained optimization solution, as well as determining loss sensitivity factors and other AC power flow results, and returns the update to SCUC. SCUC repeats its optimization, with the updated knowledge of network constraints, in a second iteration. The same process can be repeated in the Day-Ahead Market as a third iteration, if NA identifies additional constraint violations at the end of the second iteration.
9 For IFM and other Day-Ahead Market purposes, distribution factors are initialized from a data library in the Supplemental Market Data Management (SMDM) application, outage schedules are initialized from the Outage Scheduler, and the Demand forecast is initialized from the Automated Load Forecasting System (ALFS). For FMM and other Real-Time Market runs, distribution factors are initialized from the state estimator solution, outage schedules are initialized from the Outage Scheduler, and the Demand forecast is initialized from the Very Short Term Load Predictor (VLSTP), which is a separate function within the market system. These data sources flow into the FNM Assembly process as shown in Exhibit 3-1.
Version 7 Last Revised: October 30, 2014 May 29, 2015 Page 34
CAISO Business Practice Manual BPM for Managing Full Network Model
3.3.1.1 Security Constrained Unit Commitment Solution
The SCUC optimizes Generation, Load, import and export schedules and clears Energy and AS supply and Demand Bids to optimizing Energy scheduling and Dispatch, and reservation of Ancillary Service capacity while respecting transmission constraints and inter-temporal constraints (e.g. Minimum Up Time/Down Time of a Generating Unit) in order to arrive at an optimal solution. The optimal solution results in Energy Supply and Demand Schedules, AS awards, and Locational Marginal Prices. Transmission constraints are represented as linearized transmission constraints in SCUC10. Linearized transmission constraints reflect adjustments to branch thermal ratings based on reactive power flows (since SCUC uses MW limits rather than MVA limits) and refinements to loss sensitivity factors and shift factors showing each resource's contribution to binding network constraints, based on the AC power flow solution that is performed during each SCUC/NA iteration. The binding network constraints include ones that are identified through contingency analysis, which is described in Section 3.3. These transmission constraints are refined using AC Power flow and contingency analysis algorithms.
The Unit Commitment (UC) task of the SCUC determines optimal unit commitment status and the Dispatch schedules of Generation Resources including curtail able Demands and interchanges. The objective function is to minimize the total production costs (or Bid-based cost as adjusted by market mitigation mechanisms) subject to network, as well as resource related constraints11 over the entire time horizon. The UC forms the basis of the SCUC function.
The SCUC application optimizes AS provision and Energy output for each participating resource (generator, Load, interchange, etc). If necessary, the SCUC application commits additional resources besides the Resources that are already committed in the previous iteration(s) or self-committed as indicated by the Energy schedules in order to meet the scheduled Load in IFM (or forecast Load in RUCs) and the AS requirements. Based on the results of the commitment and Dispatch decisions, the SCUC produces the LMPs and the Ancillary Service Marginal Prices (ASMPs) for each market interval.
In addition to optimal procurement of AS and Energy, the SCUC application optimizes the use of the transmission network at the same time. The use of the congested Intertie transmission capacity is awarded to those Energy Bids and AS Bids that value the transmission network most according to their Energy or AS Bids. AS Bids from resources inside the CAISO Balancing Authority Area do not compete for the use of the transmission network within the CAISO
10 The transmission constraints, as a general set of limits, are provided in the CRR FNM that will be available through Section 6.5.1.1 of the tariff, including any variation by season or time-of-day. The linearized transmission constraints that are computed during the internal processing of each market run will not be available to Market Participants. The inter-temporal constraints are operational constraints specific to resources that participate in CAISO Markets, and are not available to other Market Participants in general.
11 The SCUC formulation constraints are identified in the BPM for Market Operations.
Version 7 Last Revised: October 30, 2014 May 29, 2015 Page 35
CAISO Business Practice Manual BPM for Managing Full Network Model
Balancing Authority Area12; it is assumed that regional procurement of AS guarantees that sufficient reserves are available to meet local reliability needs13. Energy and AS capacity Bids compete for the use of Interties when their Demands for transmission are in the same direction. For example, AS imports compete with Energy schedules on designated Interties in the import direction. Moreover, consistent with WECC and NERC principles, Energy does not provide counter-flow for AS capacity when the Demands for transmission are in opposite directions, and, AS capacity does not provide counter-flow for Energy when the Demands for transmission are in opposite directions.
For the IFM, the overall mitigated Bid cost is a function of the total of the Start-Up and Minimum Load Cost of CAISO-committed resources, the Energy Bids of all scheduled resources, and the AS Bids of resources selected to provide AS capacity. This forms the objective function for the IFM.
RUC simultaneously optimizes over 24 hours with the objective to minimize the total Start-Up Costs, Minimum Load Costs and incremental availability costs (i.e. RUC Availability Bids) while meeting the adjusted CAISO Forecast of CAISO Demand. RUC also assures that transmission constraints are not violated using the FNM.
3.3.1.2 Network Analysis AC Solution
In order to operate the power system reliably, it is necessary to maintain an acceptable level of power system security. Power system security refers to the satisfaction of power system operating limits for both the existing system state (base case) and the post contingency state. Normally, these limits include branch flow limits, generator output limits, bus voltage limits, and limits on local control devices like LTC taps, shunt MVAR banks, and phase shifters. In general, the security constraints corresponding to the contingencies are enforced in a preventive control mode, i.e. the optimal generating unit commitment and generator loading are determined such that no security violations arise if any defined contingency occurs.
Power systems operating with no Real-Time or contingency limit violations are referred to as operating in a feasible state. The transmission network feasibility evaluation includes AC power flow solutions for both the base case and for a set of pre-selected contingency cases. The power flow is an analytical tool used to compute the steady state voltage magnitude and phase 12 AS Bids from resources inside the CAISO Control Area do not compete for internal transmission since market
optimization does not explicitly reserve capacity for AS on internal constraints. This is possibly because minimum and maximum procurement limits within each AS Region ensure that the CAISO has the ability to maintain reliability within each AS Region, using resources within the AS Regions and the transfer capability between regions to redispatch the system in the event of contingencies.
13 For interties, there is a specific amount of capacity that must be allocated between Energy and Ancillary Service Schedules, and resources at a different location generally cannot be re-dispatched in Real-Time to alter the capacity utilization. Within the CAISO Control Area, there are multiple paths through the network, and resources at multiple locations can be re-dispatched to restore flows within the network capacity. Further details are in Market Operations BPM Section 4.1.
Version 7 Last Revised: October 30, 2014 May 29, 2015 Page 36
CAISO Business Practice Manual BPM for Managing Full Network Model
angle at all buses of the network. From the voltage values, the real and reactive power flows on each line and transformer are calculated assuming Generation and Load at the respective buses are known. The AC power flow respects Generating Unit MW and MVAR limits, scheduled voltages for local voltage controlled buses and limits on shunt capacitor banks, LTC taps, and phase-shifter taps.
The IFM/RTM System uses the power flow solution to establish the base case for the contingency analysis. The contingency analysis studies the power system network after it is disturbed by taking out of service a power system component from the base case such as a line, Generator, Load, transformer, switching device status change, etc. The removal of a power system component from the base case constitutes a contingency condition and the contingency analysis solves a power flow to determine if any limit violations occur following the removal of the power system component. Branch flow violation results for line, transformer, and switching device status change are passed back to the SCUC function as refined constraints. Contingencies involving changes in Generator or Load status may be evaluated in monitoring mode14, but are not included in the constraints that are passed back to SCUC and enforced in the SCUC solution. Exhibit 3-1 depicts this iterative process, which includes the SCUC optimization process, power flow analysis, by security analysis followed by a check to determine if violations need to be passed back to the SCUC application. If so the SCUC/power flow/ contingency analysis loop is completed again. If not LMPs are determined along with generation dispatch and the process is complete for that time period.
3.3.1.3 Reference Bus
Locational Marginal Pricing (LMP) is used for scheduling and pricing non-discriminatory transmission access and operating the CAISO wholesale electricity spot Markets. LMPs consist of three components:
Marginal Energy price Marginal price of transmission losses Marginal price of Congestion on network constraints
A power flow solution which includes representing both MW and MVAR flows is used to calculate transmission losses. This is approach is used because the SCUC application which is a linearized solution of the power network represents only MW flows in its analysis. The marginal price of transmission losses is a product of marginal loss sensitivities and the marginal
14 A contingency being "evaluated in monitoring mode" means that a power flow analysis is run assuming that a change in status of a network element (typically an outage) has occurred, to see if an emergency rating is exceeded, and that the result is reported to the operator, but the optimization does not re-dispatch the system to mitigate the overload. In the case of modeling of generation or load contingencies, the Network Applications software is configured to analyze such contingencies but not to re-dispatch the system to avoid post contingency overloads.
Version 7 Last Revised: October 30, 2014 May 29, 2015 Page 37
CAISO Business Practice Manual BPM for Managing Full Network Model
Energy price. The marginal price of congestion component of the LMP is a summation of the products of power transfer distribution factors (PTDFs) and the shadow price of transmission constraints. Both of these parameters are computed relative to a reference bus.15
To prevent the impacts of congestion prices, as well as the impacts loss prices, from being sensitive to the selection of a single slack or reference bus, the CAISO uses a distributed slack bus, as opposed to a single slack bus, in power flow formulation in obtaining LMP decomposition. A distributed slack bus is a reference value in which the slack injection is distributed to all nodes by participation factors.
A detailed description of the disaggregating of LMP components and distributed slack bus is provided in the CAISO BPM for Market Operations.
15 Please see the CAISO BPM for Market Operations for a complete discussion of LMP price determination and the use of a reference bus.
Version 7 Last Revised: October 30, 2014 May 29, 2015 Page 38
SMDMMaster File
Dynamic Model(CIM)
Power System Operations Systems
Power Flow solution engine
Substation Details
including Bus/Switch
Configuration
Transmission Registry
WECC Sourcebus/branchbasecase
model
GEO Database(node/breaker)
CIM Converter(bus/branch
CIM)
SCADA Telemetry
Default switch positions
Validation Process
Reliability Model
State Estimator
EMS
Market Equivalents(CIM)
External Model(CIM)
ISO Internal Model(CIM)
Static Model
Commercial Market Data
Supplemental Market Data
Merge and Validate
IFM/RTM System
SCUC ModelNetwork Applications Model
Full Network Model
CAISO Business Practice Manual BPM for Managing Full Network Model
4. FNM Components & Development for the IFM & RTM
Welcome to the Full Network Model Components section of the BPM for Managing Full Network Model. In this section, you find the following information:
A description of how CAISO develops the FNM
Descriptions of the market components that supplement the reliability model to form the FNM
4.1 FNM DevelopmentThe development of the FNM is best described using the figure in Exhibit 4-1.
Exhibit 4-4: FNM Development
Version 7 Last Revised: October 30, 2014 May 29, 2015 Page 39
CAISO Business Practice Manual BPM for Managing Full Network Model
The WECC network model (labeled Source bus/branch base case model) is used along with CAISO Register16, to provide a positive sequence17 load flow network model. The results of the network model are transferred to a Common Information Model (CIM)18 converter module, where the model output format is converted to CIM format. This Power Flow Model and solution are merged with substation configuration details, including bus and switch arrangements along with default switch statuses and Supervisory Control and Data Acquisition (SCADA) data. This merged information is transferred to a Geospatial Data Base (GDB)19 in CIM format and in node/breaker configuration. Two network models are generated within the GDB environment namely: a) reliability (EMS) network model which is used in the power operations systems and b) the “wires” representation for the Full Network Model (static market model) which is used in the IFM and RTM systems.
The static market model from the GDB and the dynamic model of the power system are exported from the EMS to the IFM/RTM system. The static and dynamic models are described in Section 4.1.3. In the RTM environment the static model is updated with dynamic data based upon real time operations that comes from the State Estimator application which is merged with commercial Market and Supplemental Market Data Maintenance (SMDM) system data for the various Market runs. In the IFM environment, on the other hand, the static model is merged with commercial Market data (e.g., Bids-Energy, Self-Schedules, etc.,) and SMDM data (e.g., Transmission Interfaces, Nomograms, etc.) for the Fifteen Minute Market runs.
For the purpose of initial model validation in the IFM environment, the static and dynamic models are merged with commercial Market data and SMDM. The FNM is validated and the results are made available to both the IFM and RTM system applications in the production environment. This model validation is performed as one of the many internal CAISO Full Network Model (FNM) tasks. In this case, model validation is performed to make sure that the FNM is correct in terms of 1) topology against the physical model used in the EMS, 2) components of the Supplemental Market Data Management (SMDM), 3) power flow convergence, and 4) other market data acceptable for use in performing typical market executions.
The following are examples of typical components that are validated in this process:
16 The CAISO Register is a CAISO data base that includes grid information provided by PTOs. This information includes for example, line and transformer rating information and POR and POD definitions.
17 A positive sequence model is a model which uses representation of network elements that is used for analyzing balanced three phase flows in power networks. Such a model is not useful for analyzing single phase flows or unbalanced three phase flows.
18 CIM stands for Common Information Model. CIM is an IEC Standard non proprietary information format for exchanging network model data using a node-breaker model.
19 A Geospatial Data Base model provides geometrical or topological relationship between the elements represented in the model when the model is displayed in graphic one-line diagram form.
Version 7 Last Revised: October 30, 2014 May 29, 2015 Page 40
CAISO Business Practice Manual BPM for Managing Full Network Model
Number of transformers in the system and their parameters,
Voltage controlled devices,
Transmission lines,
Synchronous machines, and
Energy consumers/Loads.
The commercial market information in the FNM process includes for example Resource Bids and Schedules along with aggregation and disaggregation information. The supplemental market information includes contingency definitions, AS region definitions and requirements, Transmission Interface definitions and limits, Nomogram definitions and limits, constraint definitions, and monitoring and enforcement requirements. The commercial market data and supplemental market data are described in detail in Section 4.2.
The FNM is created with data from three sources:
EMS CIM data representing the physical network which is shown on the upper left portion of Exhibit 4-1
CASIO Master File20, which represents commercial market data which are labeled as Commercial Market Data in Exhibit 4-1. This data includes Market only Resource models representing Market views of physical Resources and topology not modeled in the EMS and other commercial data as described in more detail in Section 4.2
SMDM representing supplemental market information, shown as Supplemental Market Data in Exhibit 4-1
The source of the static CIM network model is the CAISO EMS. The CIM model is imported to the IFM/RTM System to support the network applications within the Market environment. The network model used in the EMS is referred to as the reliability network model. The FNM is different from the reliability network model as a result of model adjustments required for the IFM/RTM System applications needs. Modifications to the EMS CIM model are needed to represent the Market view of Load, Generation, and the power system network. These Market views represent physical Resources and the topological connections of physical Resources not modeled in the EMS. The EMS model is one of the applications that support the market functions. For example for market purposes, additional market structure and supporting data
20 The CAISO Master File is a permanent data base used to maintain data needed to support a number of CAISO applications including market applications.
Version 7 Last Revised: October 30, 2014 May 29, 2015 Page 41
CAISO Business Practice Manual BPM for Managing Full Network Model
need to be included in the EMS model to form the FNM, such as the market-only generators and market-only network topology. Data associated with the Market Resources and commercial attributes are loaded to the IFM/RTM System via software interfaces.
The Dynamic Model data which is used to update the FNM static information is based upon real time information. This data is based upon the results of the CAISO’s State Estimator (SE) application. This software application is used in the Power Systems Operations software systems as a part of the process to monitor the real time state of the power system. The SE results that are passed to the FNM for the RTM provides a consistent update to the power system network state that reflects the most recent operation of the network.
The FNM uses two data repositories: the network applications database and the SCUC database as shown in Exhibit 4-1. The combination of the physical model in CIM format in the network model application database and Market data in the SCUC database makes up the FNM. Some of the Market Resource models and commercial attributes data needed by the network applications are input from CAISO Master File database.
4.1.1 Physical Model
The physical model extracted from the EMS is a detailed Node/Breaker model in CIM format, which is described in more detail in Section 4.2. This model represents the physical topology and elements of the network. As shown in Exhibit 4-1 separate files are extracted for different portions of the CAISO network. The CAISO network within California (Internal ISO) and in other Balancing Authority Areas is one set of data provided. Separate data files are also provided for the Market view of Resources. These models are merged into a single model representing the physical transmission network to be used for Market applications.
4.1.2 Market Model
The topology of the physical network model is adjusted for Market model requirements such as:
Addition of Market scheduled Generation Units that cannot be feasibly represented in the Reliability network model environment. This includes for example market only generators such as small QF resources and generation that is connected to distribution systems.
The physical or static portion of the FNM is different from the reliability network model as the result of required model augmentation/modification to support Market analysis. Other adjustments to the EMS physical model are made in other supplementary Market data support files and tables. Market adjustment data is imported to the SCUC application via a data loading
Version 7 Last Revised: October 30, 2014 May 29, 2015 Page 42
CAISO Business Practice Manual BPM for Managing Full Network Model
interface. Commercial Market data required by the Power Flow and contingency analysis include but are not limited to the following items:
Price Locations/Aggregated Price Locations Trading Hubs Definition of Load Aggregation Participating Load and Proxy Demand Resource Models Reactive Distribution Factors and Load Distribution Factors Definition of aggregated Generation facilities (e.g., combined cycle units, watershed
hydro units, etc.) Logical Resources External Scheduling Points Transmission Interface Constraint Definitions Nomogram Constraint Definitions Constraint Exceptions WECC Scheduling Limits Contingencies Contingency exception lists UDC and MSS attributes Designated Congestion Areas (DCA) Definition of RUC Zones Definition of A/S Regions Modeling Integrated Balancing Authority Areas & Metered Sub-Systems (MSS)
4.1.3 FNM Data Types
The following classes of data exist in the model used for Market analysis.
Static Data – Static data refers to the network model topology and impedance data (i.e., the “wires” model) that is provided from the EMS data base maintenance process and augmented with network model elements specific to the Market modeling requirements. The static model is updated on a periodic model update cycle. The static model consists of the model of the physical network in both internal and external areas.
Dynamic Data – The solution of the EMS State Estimator is imported to the Market network applications (currently, every five-minutes). This data is referred to as the dynamic data portion of the FNM. The dynamic data is a snapshot of the EMS State Estimator result that indicates actual operating conditions of the power system at a given time.
Version 7 Last Revised: October 30, 2014 May 29, 2015 Page 43
CAISO Business Practice Manual BPM for Managing Full Network Model
Supplemental Data - Supplemental applications provide the following information to the FNM: Contingency definitions Ancillary Service Region definitions and requirements Transmission Interface definitions and requirements Nomogram definitions and requirements Constraint definitions and enforcement requirements Exception list Generation Distribution Factors (GDFs) Load Distribution Factors (LDFs)
The supplemental data reference the physical network model (i.e., static CIM data) using the global unique identifiers of the referenced physical equipment. Portions of the supplemental data can be changed by the user prior to a Market run (e.g. outages and branch constraint exceptions). Supplemental data can change once a day (e.g. outage or branch limit derating for IFM), once every 15 minutes (for RTM) or every Market run. CAISO operators will change the supplemental data according to the latest system conditions. The GDFs and LDFs used in market runs will be updated as needed, e.g., to use hourly values in IFM, to reflect differences in generation conditions and forecasted load variations. If outages occur within an operating hour, the market application can include those changes in the results of subsequent market runs.
Exhibit 4-2 depicts in more detail the data used by the Market Analysis Engine as part of the various Market runs (IFM, RTM). Each Market run accesses the relevant data from the appropriate source for the time horizon being analyzed. Supplemental data is applied to the static CIM files to create the network model for each time period of the Market. The dynamic data is supplied from EMS only for RTM analysis. The static CIM data, the dynamic data (SE solution snapshot), and the supplemental data are used to support network analysis in the IFM/RTM system. Note that IFM does not use dynamic data, but rather uses Bids applied to the static network model.
Version 7 Last Revised: October 30, 2014 May 29, 2015 Page 44
CAISO Business Practice Manual BPM for Managing Full Network Model
Exhibit 4-5: Full Network Model Components
The RTM imports dynamic data from the CAISO EMS State Estimator (SE). The SE results are applied to the network applications as input for solving the Power Flow for the RTM only. Only data required for obtaining a Power flow solution is imported into the RTM. In general, this data includes bus injections values, regulated voltage values, transformer tap positions, voltage regulator status and switch (automatic breaker and manual switch) statuses. An alternate source of data is read in those situations where the EMS SE solution does not exist or is of insufficient quality. In this case, the last good solution of the SE is used.
4.2 FNM Market ComponentsThis section contains descriptions of the components that are included in the FNM.
4.2.1 Nodes & Buses
The FNM is a node-breaker model when it is imported from the EMS. The node-breaker model is transformed to a bus-branch model by a topology processor after taking into account the open/close status of switching devices. The difference between these two types of electrical network models is described later in this section.
Version 7 Last Revised: October 30, 2014 May 29, 2015
Full Network Model
Dynamic Model from EMS for
RTM only
Outage Derates
Static ModelFrom EMS
Voltage/Tap Schedules
Load, Generation, and Reactive
Distribution FactorsConstraints/Exceptions
Contingencies
Market Analysis Engine(Topology Process, Power Flow, Security Analysis, Unit
Commitment, Unit Dispatch, Congestion Management, Loss Management, Locational Marginal Pricing)
FMM/RTM IFM
Page 45
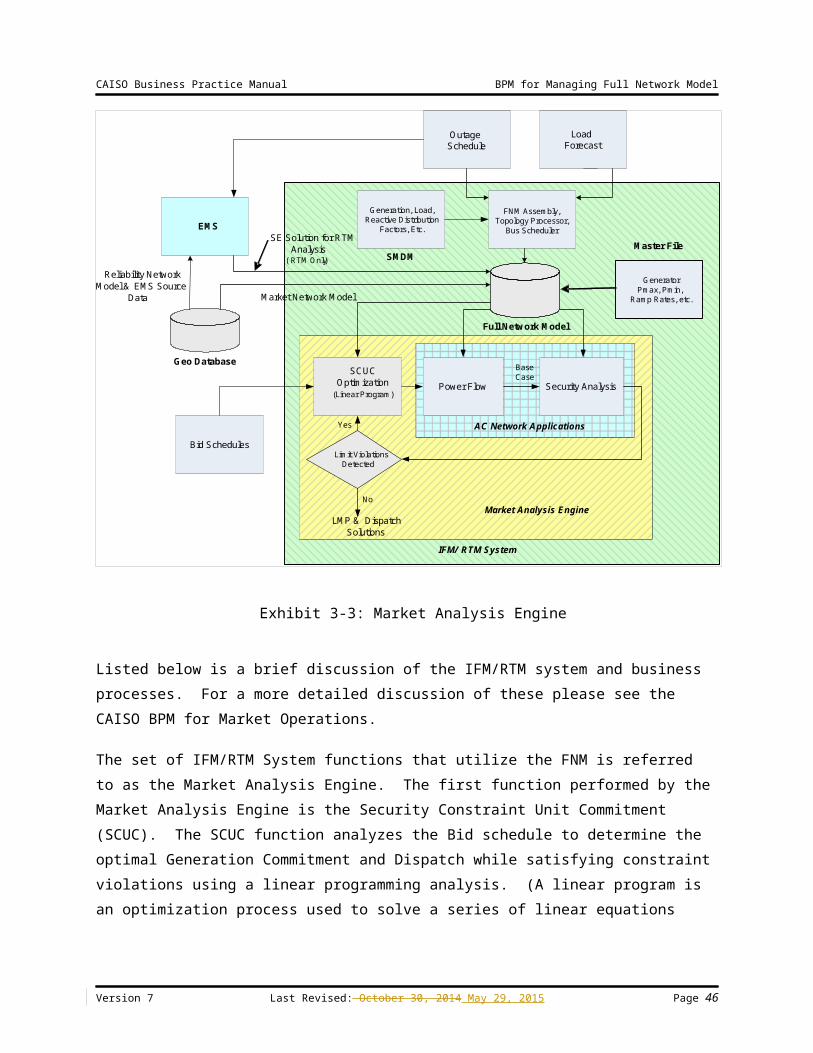
CAISO Business Practice Manual BPM for Managing Full Network Model
A Node represents a connection point used to define the physical topological connectivity of the network. Each terminal of any piece of electrical equipment is connected to a Node. Nodes can represent a section of a physical busbar segment that is separated by breakers, switches or branches from other physical busbar sections of the same bus or other buses. In the node-breaker model, nodes are static and do not change as the result of switching device statuses.
A bus is the representation of all topological nodes connected through closed switching devices (e.g. breakers). This is also referred to as a “power flow” bus. The set of Nodes that constitute a bus can change based on the open/close status of switching devices whose terminals are connected to the Nodes. The number of buses in the model is dynamic due to their definition being dependent on the state of switching devices. The bus to which each Generation and Load resource is connected can change based on the dynamic status of switching devices. A mapping between connectivity nodes and their bus is maintained to track the association between Generation and Load resource bus connectivity and the physical node connectivity.
The bus-branch model is used in the formulation of power flow equations. The difference between a node-breaker representation and a bus-branch representation is shown in Exhibit 4-3.
Exhibit 4-6: Node/Breaker Conversion to Bus/Branch Model Format
Version 7 Last Revised: October 30, 2014 May 29, 2015
Generator
Breaker
Transmission Line
Load
Load
Node/Breaker Model
Station A
Load
Station B
Station B
Station A
Bus
Bus/Branch Model Node Node
Node
Page 46
CAISO Business Practice Manual BPM for Managing Full Network Model
4.2.1.1 Network Node (CNode)
The FNM is composed of network connectivity Nodes21 (CNodes) interconnected with network branches. Generating Units and Loads are modeled at the appropriate CNodes. A network Node (Connectivity Node or CNode) represents a connection point used to define the physical topological connectivity of the network. Each terminal of equipment is connected to a CNode. Each Generation and Load resource is connected to a CNode. Multiple network devices might be connected to a CNode except in the case of Generation or Loads. There is at most one injection device (Load or Generation) connected to a CNode. A CNode associated with Generation or Load can only be changed via update of the network model (static CIM network model from EMS).
4.2.1.2 Price Location (PNode)
As defined in the CAISO Tariff, Appendix A, a Pricing Node (PNode) is described as follows:
“A single network Node or subset of network Nodes where a physical injection or withdrawal is modeled and for which a Locational Market Pricing is calculated and used for financial settlements.”
In general, the pricing Location of a Generating Unit coincides with the CNode where the relevant revenue quality meter is connected or compensated, to reflect the point at which the Generating Units are connected to the CAISO Balancing Authority Area. This Location is referred to as the “Point Of Receipt” (POR) and is considered to be a PNode. Although the Schedule, Dispatch, and LMP of a Generating Unit refers to the POR, the Energy injection is modeled in the FNM for network analysis purposes at the corresponding Generating Unit(s) (at the interconnection point), taking account of any losses in the transmission network leading to the POR. The pricing Location of a Generating Unit or PNode may be different from the CNode(s) of the corresponding Generating Unit(s) in the FNM. Even though the network model includes network elements that are not part of the CAISO Controlled Grid, the Pricing Node (PNode) represents the point at which the injection is received into the CAISO Controlled Grid for Supply, or withdrawal is delivered out of the CAISO Controlled Grid for Demand. Examples of network elements that are not part of the CAISO Controlled Grid include step-up transformers and other generation ties.
The applicability of the PNode to settlements is established in Tariff Section 10.2.7 and other related Sections. Section 10.2.7 provides that the Meter Service Agreement establishes the PNode and CAISO Controlled Grid interface for CAISO Metered Entities. Among other related
21 The CAISO BPMs have adopted “Connectivity Node” or CNode as an alternative expression of “Node”.
Version 7 Last Revised: October 30, 2014 May 29, 2015 Page 47
CAISO Business Practice Manual BPM for Managing Full Network Model
Tariff Sections are 11.2.1.1, 11.2.1.3, and 11.5.2, which define the PNode as the relevant location for reporting meter data and for the LMP used in settlements.
Pricing Locations (or PNodes) are a defined set of network Nodes, resource Nodes and dominant Nodes. LMPs are calculated at all these locations.
Some PNodes correspond to a single CNode in the network model, i.e. these PNodes and CNodes have a one-to-one relationship. Not every CNode needs to be defined as a PNode. In general, PNodes correspond to the Nodes where Generator or Load resources are connected and where the calculation of LMP is needed. Among the CNodes that comprise a network bus, one stable (expected to be active) CNode is defined as the dominant CNode. The dominant CNode is defined only for buses where no resource is connected. By default LMPs are calculated at every PNode that is connected to a resource and also for each resource. In buses where no resources are connected, a dominant Node is selected in order to reduce the computational burden of calculating LMPs. Within a substation, there can be tens or hundreds of CNodes. Every place where two pieces of equipment connect is a CNode. Many CNodes can be expected to be de-energized when equipment (e.g., lines, transformer, etc.) are taken out of service. Thus, a dominant or stable CNode is one that would not be expected to be routinely taken out of service. Such dominant or stable CNodes are normally chosen to be the CNode associated with the bus bars in a substation.
Exhibit 4-4 shows graphically the concept of a selecting a dominant CNode using the substation included in Exhibit 4-3.
Version 7 Last Revised: October 30, 2014 May 29, 2015 Page 48
CAISO Business Practice Manual BPM for Managing Full Network Model
Exhibit 4-7: Examples of Dominant CNodes in Detailed Node/Breaker Model
In addition to resources and resource Nodes, LMPs are also calculated at dominant Nodes. The criteria for selecting the dominant Node is based on ensuring that for all, or most combinations, of breaker statuses of the busbar the dominant Node is part of the bus. The PNode corresponding to the dominant CNode is used as the reference for CRRs that have the associated network bus as the source or sink.
4.2.2 Load Model
This section describes the modeling of Loads in the FNM.
4.2.2.1 Load Aggregation and Load Distribution Factors
Each SC can schedule Load at multiple Take-Out Points. A Load Take-Out Point can be used by multiple SCs. Each SC can have more than one Load Schedule at any Load Take-Out Point as long as each Load Schedule at the same Load Take-Out Point has a separate resource ID and settlement-quality meter.
Version 7 Last Revised: October 30, 2014 May 29, 2015
Load
Station A Load
Station B
Dominant CNode
Dominant CNode
Dominant CNode
Page 49
CAISO Business Practice Manual BPM for Managing Full Network Model
The overall system Load, which is determined from the Load forecast, is distributed to individual Nodes in the FNM using Load Distribution Factors (LDFs). The calculation of LDFs is based on actual Demand at each PNode that represents Load, and is managed in the Supplemental Market Data Management (SMDM) portion of the market applications. Market applications use LDFs to calculate total loads for aggregated areas to distributed load points, and depend on having the LDFs sum to 1.0. If the load pattern does not change but the overall load level changes, the LDFs are used to distribute the overall load level proportionally to the distributed load points. While the LDFs are originally calculated in the Supplemental Market Data Management (SMDM) application to sum to 1.0, applications that use the LDFs may account for outages or use a subset of the original aggregated area, which could cause the sum of the LDFs to differ from 1.0. In these cases, the applications that use the LDFs re-scale the LDFs.
Loads are aggregated in Load Zones in multiple hierarchical layers. A Load Zone is a standard set of nodes located within the CAISO Balancing Authority Area that is designated by CAISO to simplify the submission of Demand Bids and Settlement. Load Zones may consist of customized Load Aggregations and standard/default Load Aggregations. For scheduling and settlement, SCs may schedule Load at an aggregated level or at a nodal level if they are registered to schedule at the nodal level. Initially, only certain Loads can and are required to register to schedule at the nodal level. These include:
Loads served by ETCs
Loads in MSSs that choose to settle on a “net” basis. (Loads in MSSs that chose to settle on a gross basis must schedule at the MSS but will be settled at the LAP price.)
Loads that are directly associated with Generation (e.g., the pumping mode of a pumped storage Generator)
Participating Loads (e.g., pumps)
All LDF values are time dependent. Despite the differences in their calculation and uses, all types of LDFs have a similar structure for their content and may be contained in a single table structure.
The values of the LDFs for each Load Zone and RUC zone add up to 1.0 when the table is populated and applications that use LDFs make proportional adjustments to the data if needed to ensure that this is the case if the user’s application requires this characteristic. In certain cases there is the need to normalize LDFs to ensure actual Load distribution.
When a new CNode associated with Load is introduced via update of the network model, a Utility Distribution Company (UDC) may submit a request to include the CNode in the LDF
Version 7 Last Revised: October 30, 2014 May 29, 2015 Page 50
CAISO Business Practice Manual BPM for Managing Full Network Model
library. The LDF library, maintained by CAISO, displays the load distribution factors by node used in the Day-Ahead Market. To protect confidential data the load distribution factors for single customer nodes are aggregated and reported by DLAP as “AGGR_UNDISCLOSED”. Procedure for submitting CNodes, which will be included in the LDF library, can be viewed in the Market Instruments BPM, section 10.2.6 Day-Ahead Load Distribution Factors.
4.2.2.2 Custom Load Aggregation
Custom Load Aggregation allows SCs to aggregate their Load in a Load Zone and submit a single preferred schedule and optional Energy Bid for the entire Load in that Load Zone, rather than individual Schedules and Bids at every Load Node in that Load Zone. The Custom Load Aggregation is defined by a set of custom LDFs submitted by the SC as frequently as hourly. Scheduling Load deviations in the Hour-Ahead Scheduling Process requires nodal scheduling since the custom LDFs for that Market may vary considerably by hour.
SCs are eligible for Custom Load Aggregation in a given Load Zone if they meet the following requirements:
At each Node in the Load Zone, the Load that is part of the Custom Load Aggregation must be registered with CAISO. Initially, Custom Load Aggregation is limited to Loads served by ETCs, Participating Loads, and Loads that are associated with Generation, such as pumped-storage generators in pumping mode.22
Load registrations are supported by LDFs that will be maintained consistently with nodal meter data.
Meter data for Settlement of Load under Custom Load Aggregation is submitted at the nodal level.
The IFM scheduling software distributes the aggregate Load Schedule and any Energy Bid to the individual Load Nodes in the Load Zone using the submitted custom LDFs.
4.2.2.3 Reactive Distribution Factors
The FNM contains reactive Loads (MVAR), as well as active Loads (MW). Reactive Loads are considered proportional to active Loads. Reactive load (MVAR) is calculated as a fixed proportion to the real power (MW) on each load Take Out Point. The proportional factor is the
22 Loads other than those that are sinks for ETCs, Participating Loads, and Loads associated with Generation are generally scheduled using Load Aggregation Points (LAPs), thus they are not eligible for Custom Load Aggregation.
Version 7 Last Revised: October 30, 2014 May 29, 2015 Page 51
CAISO Business Practice Manual BPM for Managing Full Network Model
Reactive Distribution Factor (RDF), which is predetermined by the CAISO's Supplemental Market Data Management (SMDM) application as a rolling average of State Estimator results.
As scheduled or forecasted MW Loads by Load Zone or RUC Zone are translated to nodal Loads using Load Distribution Factors (LDFs), reactive MVAR nodal Loads are determined by multiplying the nodal MW Loads by a predetermined Reactive Distribution Factor (RDF), defined by MVAR/MW.
4.2.3 Resource Models
The following sub-sections provide a description of the market resource entities and how they are physically and commercially modeled.
4.2.3.1 Individual Generating Unit
A Generating Unit is defined in the CAISO Tariff, Appendix A, Master Definitions as follows:
“An individual electric generator and its associated plant and apparatus whose electric output is capable of being separately identified and metered or a Physical Scheduling Plant that, in either case, is:
located within the CAISO Balancing Authority Area (which includes a Pseudo-Tie of a Generating Unit to the CAISO Balancing Authority Area); and
connected to the CAISO Controlled Grid, either directly or via interconnected transmission, or distribution facilities or via a Pseudo-Tie; and
capable of producing and delivering net Energy (Energy in excess of a generating station’s internal power requirements).”
Each Generator resource can only be scheduled by one SC23. One SC can schedule multiple Generators.
The following sections provide descriptions of how individual Generators are modeled with respect to the POR24.
23 ISO Tariff Section 4.5.1.1.3 establishes the limit of only one SC per meter. Section 4.5.1.1.3 provides that if an SC applies to register with the CAISO for a generating resource for which another SC is already registered, the CAISO must return the application of the new SC. The CAISO must do so with an explanation that only one SC may register with the CAISO for the meter or Meter Point in question and that an SC has already registered or that more than one SC is attempting to register for that meter or Meter Point. It is then up to the competing SCs to determine entitlement to submit Schedules for the Generating Unit. Section 4.5.1.1.3 continues unchanged in the Tariff.
24 The POR is the PNode at the ISO metering point of a particular generator, based on its metering configuration. This metering point could be a different point, away from the physical connecting point of the generation resource,
Version 7 Last Revised: October 30, 2014 May 29, 2015 Page 52
CAISO Business Practice Manual BPM for Managing Full Network Model
4.2.3.1.1 Generator With POR at Station
Refer to Exhibit 4-5. A single Generating Unit is connected to the CAISO Controlled Grid at a CNode. The revenue meter registers deliveries at the POR.
Exhibit 4-8: Generating Unit with POR at Station
The Master File includes an entry for each Generating Unit in this case. The Generating Unit record in the Master File has one physical member called Generator G1. The Generating limits of the commercial entity reflect Market registration and can be different from the physical limits. The MW value and limits for Bids, Dispatch, and Settlement are on the basis of the POR for the Generating Unit.
4.2.3.1.2 Generating Unit with Auxiliary Load with POR at the Station
Refer to Exhibit 4-5. One or more physical units in one station can be modeled with one or more station auxiliary Loads explicitly modeled.
Pgross is disaggregated to the individual physical units using station Generation Distribution Factors (GDFs).
which is its Cnode. The Pnode is the node that defines the price that applies to the generator's output for settlements.
Version 7 Last Revised: October 30, 2014 May 29, 2015
Generator
MMeter
POR Node
Step-up Transformer
Page 53
CAISO Business Practice Manual BPM for Managing Full Network Model
Paux is disaggregated to the individual physical Loads using auxiliary Load Distribution Factors.
Bidding is performed on a net Power output basis at the POR (which may or may not be the net Power). As reflected in Tariff Section 10.2.7 and other related Sections, the Meter Service Agreement establishes the PNode and CAISO Controlled Grid interface for CAISO Metered Entities. The Generator's PNode defines the relevant location for reporting meter data and for the LMP used in settlements, and it is the SC's responsibility to supply Bids corresponding to the PNode that it has established.
Exhibit 4-9: Net Metered Generating Station with Auxiliary Load
Both Generation and auxiliary Load components for this Market Resource are included in the Master File. The following equations summarize the model:
Pnet=Pgross−Paux
PPOR=(1−β )⋅Pnet
Here the term β is the POR loss factor as described in the POR section, Section 4.2.3.7.
Version 7 Last Revised: October 30, 2014 May 29, 2015
Generator
MMeter
POR Node
Auxiliary Load
Step-up Transformer
Pgross Paux
Pnet
Page 54
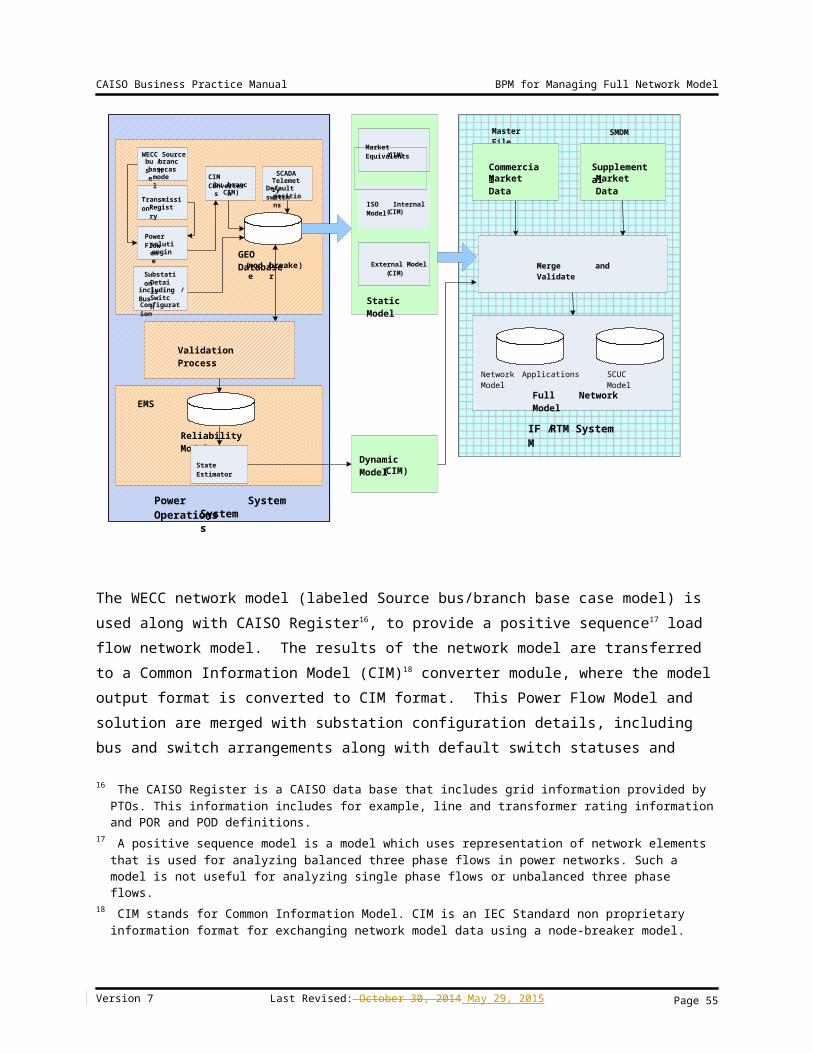
CAISO Business Practice Manual BPM for Managing Full Network Model
The total auxiliary Load MW value is defined as
Paux=u⋅[Pauxmin+aslope⋅( Pgross−Pgross
min ) ]+(1−u)⋅Pauxoff
Where:
Pgrossmin
is the minimum MW limit of the Resource on a gross basis
Pauxmin
is the value of the total auxiliary Load when the Resource is at its minimum gross Power output level
Pauxoff
is the value of the total auxiliary Load if the resource is off-line. Note that if the auxiliary Load disappears when the unit is off-line then the value for this component is zero.
aslope is the slope associated with the variable portion of the station aux Load
u is the commitment variable that indicates whether or not this Resource is committed; u is equal to 1 if the resource is on-line and 0 if it is off-line.
The quantities GDF, LDF, Pauxmin
, Pauxoff
, aslope , and Pgrossmin
are defined as part of the Master File as parameters that characterize the auxiliary Load. The Market parameters such as the Bids, the Bid limits, the ramp rates, etc are on a net Power basis.
Market optimization determines the value ofPPOR . The equations above are used to
calculate the values of Pgross andPaux . These schedules are distributed to the physical Resources using the GDFs and LDFs.
This section contains a number of parameters. These parameters are set by the CAISO based on analysis of network characteristics. Their values are reviewed when the configuration of generators' interconnections with the CAISO Controlled Grid changes, or when the CAISO otherwise determines that changes in nearby network configurations may have changed sufficiently to affect the parameters' values.
4.2.3.1.3 Generator with Pumping Capability
A Generator with pump storage capacity is a pump storage unit. Pump storage units are hydro plants that generate by drawing water from a reservoir during peak hours for Generation and
Version 7 Last Revised: October 30, 2014 May 29, 2015 Page 55
CAISO Business Practice Manual BPM for Managing Full Network Model
pump water back into the reservoir during off-peak hours. Depending on the selected mode of operation of the unit, it operates either as a Generator or as a pump. It is revenue metered at its POR. The unit model is similar to that shown in Exhibits 4-5 and 4-6.
When operating as a Generator, the unit supplies Power to the CAISO Controlled Grid.
When operating as a pump, the unit takes Power from the CAISO Controlled Grid.
There is one resource ID in Master File to represent the physical unit of the pump storage plant in both generation mode and load/pump mode. There is also an indication that this unit can either generate or pump. This market resource participates in the CAISO Markets as either a Generator or a Load. The IFM Bids and Dispatch are on the basis of the market resource information. The Market software internally handles the Generation or Demand Bid of this market resource and commit/Dispatch appropriately. The market software can handle both modes of the pump storage plants with single resource ID. One is the generation model, which is the positive schedule, and the other is load/pump mode, which is the negative schedule. Settlements applies the appropriate rules for settling this market resource in a particular interval dependent on the direction of Energy flow (injection to network=Generation, take from network=pumping Load).
The generating limits of the unit reflect its market registration and can be different from the physical limits. The MW value and limits for Dispatch purposes (and IFM Bids, Dispatch and Settlement) are based on the overall Market Resource POR25.
4.2.3.1.4 Generating Unit with POR at Generator Tie
The Node at which Energy is delivered to a receiving party may be different from the node at which the Energy is generated.
Refer to Exhibit 4-7. This is a Generating Unit with auxiliary Load and with the station transformer modeled. The unit is metered at the station bus. The POR is remote from the Generator station bus linked to the Generator by a Generator tie.
25 Operating limits and operating points for Schedules and Dispatch, which are the basis for settlement, are all based on MW received by the CAISO at the PNode established in the Meter Service Agreement, for Generating Units with pumping capability (as well as for all other Generating Units).
Version 7 Last Revised: October 30, 2014 May 29, 2015 Page 56
CAISO Business Practice Manual BPM for Managing Full Network Model
Exhibit 4-10: Generating Unit Market POR Different from Generator Terminal
There is one Market Resource entry in the Master File with one physical unit and auxiliary Load. The unit’s Market limits are different from the physical unit limits and represent the commercial limits. Commercial data describing a Generating Unit's physical capabilities are contained in the CAISO's Master File, and are values that the Generator can regularly deliver to the CAISO Markets. The Generating Unit may have additional physical capacity that is available under limited circumstances, or that is produced by the physical unit but consumed within the plant, but the Master File values are based on net dependable capacity. Also, losses between the physical unit and the Generator's PNode are not included in the net dependable capacity.
The IFM Bids, Dispatch and Settlement are on the basis of the market resource POR information. All Dispatch related quantities (MW, limits, etc.) are provided on the basis of the POR.
4.2.3.2 Generation Aggregation
Generation Aggregation (GA) supports aggregate bidding of Generation Resources26. The Generation Aggregation Location corresponds to an Aggregated Pricing Node. The Aggregated Generation is scheduled as a single Generating Unit Bid. The aggregated schedule is distributed to the individual Generation resources using the specified Generation Distribution Factors (GDFs).
An aggregated Generation Scheduling Point is used to Schedule the following resources:
26 For aggregated generation to be considered a unique market resource, it must be defined as a Physical Scheduling Plant. Alternatively, resources within a MSS may be defined as a System Unit.
Version 7 Last Revised: October 30, 2014 May 29, 2015 Page 57
CAISO Business Practice Manual BPM for Managing Full Network Model
Physical Scheduling Plant units, e.g., a set of resources (typically hydro) that share the same energy resource (e.g., cascading river systems) and therefore are scheduled together to avoid inefficient use of the energy resource (e.g., water flow.)
Other types of Generation resources that need to be scheduled at aggregated level.27
Exhibit 4-11: Generation Aggregation
Refer to Exhibit 4-8. There is a single market resource in the Master File for this aggregated Generation. This single entry in the Master File includes three physical Generating Units G1, G2, and G3 each with its own GDF.28 The Aggregated Generation is considered a unique
27 Whether a generation resource will be scheduled as an individual unit or in an aggregate configuration is determined when the Generator applies to interconnect to the grid.
28 The single entry in Master File refers to an aggregate market resource ID. This single resource ID has three individual "unit" resource IDs, which are not used for the purpose of scheduling. The market participant will use the single market resource ID to schedule in CAISO markets and for settlements. The resources G1, G2 and G3 will
Version 7 Last Revised: October 30, 2014 May 29, 2015
Aggregated Pricing
Location
Pricing Node(PNode)
Network Node(Cnode)
G1 G3G2Generation Resource
Generation Aggregation
Page 58
CAISO Business Practice Manual BPM for Managing Full Network Model
market resource and its limits represent the commercial data submitted for the market resource. The IFM Bids, Dispatch, and Settlement are on the basis of the single market resource information. There is a one to one relationship between the physical member units of this market resource and the related physical entities in EMS.
4.2.3.2.1 Combined Cycle Generating Unit
A combined cycle Generating Unit is a type of Generation aggregation. A combined cycle unit uses two or more Generation processes in series or in parallel, configured to optimize the Energy output of the system. Typically, the initial Generation process uses natural gas from which the hot exhaust is redirected to a steam heat recovery process.
Refer to Exhibit 4-9. The combined cycle Generating Unit is modeled as a set of Generating Units and its auxiliary Load in the physical system. It is typically metered at its POR.
Exhibit 4-12: Combined Cycle Generating Unit
The approach to modeling a combined cycle unit is to provide an aggregated Generating Unit with a single market resource ID (defined by the CAISO) regardless of the different modes of operation (e.g., 1x1, 2x1, etc.). If the operating characteristics for the particular operating configuration differ from that registered in the Master File under the corresponding resource ID,
be used in power flow and state estimator calculations. The values of G1, G2, and G3 will be calculated by using the predefined GDFs.
Version 7 Last Revised: October 30, 2014 May 29, 2015
Steam Gas Gas
M
POR Node
Combustion UnitsSteam Unit
Steam Gas Gas
M
POR Node
Combustion UnitsSteam Unit
Page 59
CAISO Business Practice Manual BPM for Managing Full Network Model
it is the responsibility of the SC that represents the combined cycle Generating Unit to select the operating mode and submit appropriate three-part Bids and inter-temporal constraints for the corresponding resource ID.29 The SCUC optimal scheduling and Dispatch application assumes that the mode of operation is given and constant, as indicated by the selected resource ID, i.e., the operating configuration is not subject to optimization.
GDFs are used to disaggregate the total output of the plant to individual members for scheduling purposes.30 The Generating limits of the resource reflect Market registration and may be different from the physical limits. The MW value and limits for Dispatch purposes (and the three part UC Bids, Dispatch and Settlement) is based on the overall market resource POR.
The combined cycle unit model may have station auxiliary Loads modeled, as described in CAISO Tariff Section 10.1.3.1 (Permitted Netting) and in Section 4.2.3.1.2 of this BPM.
4.2.3.3 Distributed Generation
Distributed Generation connects to the power system at distribution voltage levels. Distributed Generation is modeled in the FNM, but is only modeled in the EMS reliability model if it can be meaningfully represented by the State Estimator. This refers to the fact that there are some small resources which the market needs to represent for scheduling and settlements purposes, but are too small to be feasibly represented in the EMS environment. Factors affecting whether distributed Generation can be meaningfully represented by the State Estimator include the availability of real-time telemetry data, the size of the Generating facility, and detail of the system representation between the CAISO Controlled Grid and the underlying systems. When distributed Generation is represented only in the FNM, it is represented as connecting to the nearest transmission substation.
4.2.3.4 Generation Distribution Factors
Generation aggregation supports aggregate bidding of Generation Resources. The Generation aggregation location corresponds to an Aggregated Pricing Node. Generation Distribution Factors (GDFs) are used to approximate the share of each of the Generation resources that make up the aggregated Generation. Bids for aggregated Generation resources are submitted for the aggregation, not for individual physical units, and Schedules and Dispatch instructions are similarly sent to the Generator for the aggregated Generation resource. Since the CAISO's FNM separately models each individual resource for which telemetry is available, GDFs provide
29 It is the SC's responsibility to submit current information about operating limitations into CAISO outage management system, and to submit Bids that reflect actual operating capabilities. The procedures for outage coordination are stated in Section 9 of the CAISO's Tariff.
30 Settlements for uninstructed deviations apply to the aggregated resource that is used in scheduling, not to the individual components of an aggregated generating resource.
Version 7 Last Revised: October 30, 2014 May 29, 2015 Page 60
CAISO Business Practice Manual BPM for Managing Full Network Model
the translation from market Bids, Schedules, and Dispatch instructions to the individual units in the FNM.
The aggregated Generation is scheduled as a single Generating Unit Bid. The aggregated Schedule is distributed to the individual Generation Resources using the specified GDFs, properly normalized to account for any Generation Outages.
GDFs are populated into the GDF table through two mechanisms.
1) First, the SC representing the aggregated Generation Resource may submit GDFs for its Resource as part of its Bid, to represent its expected proportion of output from each Generating Unit within the aggregated Resource.
2) Second, CAISO maintains a default set of GDFs for each aggregated Generation resource, which is based on quantities such as maximum capacity or historical production, and which are used if the SC representing the Generator does not submit GDFs as part of its Bid.31
4.2.3.5 System Resources
System Resources are defined in the CAISO Tariff as either a group of resources, single resource, or a portion of a resource located outside of the CAISO Balancing Authority Area, or an allocated portion of a Balancing Authority Area’s portfolio of generating resources that are either a static Interchange schedule or directly responsive to that Balancing Authority Area’s Automatic Generation Control (AGC) capable of providing Energy and/or Ancillary Services to the CAISO Balancing Authority Area, provided that if the System Resource is providing Regulation to the CAISO it is directly responsive to AGC. Scheduling Coordinators who desire to offer System Resources into the CAISO Markets must provide the CAISO with a list of the resource names which identifies its type and Intertie location. These IDs are then placed in the CAISO’s Master File to facilitate participation of such resources. Attachment B, titled “Master File Update Procedures” in the Market Instruments BPM provides the details regarding the setup and maintenance of System Resources as well as a description of the Market Participant data elements contained in the Master File.
4.2.3.6 Participating Load
Loads that are bid into the Market as resources are known as Participating Loads. The definition of a Participating Load is given in Appendix A of the Tariff as follows:
31 Please note that the process for validation of GDFs submitted by SCs is described in Section 8.2.10 of the BPM for Market Instruments. The BPM for Market Instruments would also address, in future drafts, any changes to the described process.
Version 7 Last Revised: October 30, 2014 May 29, 2015 Page 61
CAISO Business Practice Manual BPM for Managing Full Network Model
“An entity, including an entity with Pumping Load, providing Curtailable Demand, which has undertaken in writing by execution of a Participating Load Agreement to comply with all applicable provisions of the CAISO Tariff.”
In the FNM a non-aggregated Participating Load is modeled as a part of the nodal Load modeled at a particular Node. The overall Load MW/MVAR values may be measured at the locations shown.
A Participating Load is a registered nodal Load with meter for participation in CAISO’s Energy and Non-Spinning Reserve AS Markets.
Each Participating Load has one market resource record defined in the Master File with one physical member. The Master File contains information as to whether this is the only end use-use Load at this location, and other information to allow submission of IFM Bid information for the Participating Loads. Each market resource is scheduled by a single SC. In the case of a Participating Load, the market resource may represent only a fraction of the Demand that exists at a Take-Out Point. Participating Loads may include aggregations across multiple Take-Out Points as discussed in Section 4.2.3.7.
While POD loss adjustments are not made for Loads as they are for Generating Units, both Participating Loads and Generating Units have PNodes that are established for scheduling and Settlement in CAISO Markets. These PNodes might not be the same as the CNode where the resource is connected. Settlement is made on the basis of the market resource at the Point of Delivery.
Participating Loads can be set up to participate as a Pumped Storage unit or alternatively under an arrangement that uses a similar bidding approach to the way Non-Participating Load is structured.
The Pumped Storage alternative cannot be used for Aggregated Participating Loads that share common metering. Thus the second alternative offers a more effective approach for Aggregated Participating Load as discussed in the next section.
4.2.3.7 Aggregated Participating Loads and Proxy Demand Resources
Aggregate Participating Loads that provide Curtailable Demand are treated similar to Participating Loads. As described in the previous section, two alternative approaches/structures are available to Participating Loads. The first is to deal with the Participating Load in the same way as a Pumped Storage unit is handled. This is discussed in Section 4.2.3.1.3. The Pumped Storage approach is not expected to be a good representation of the operating characteristics of many Loads that want to take advantage of the Aggregated Participating Load capability. As
Version 7 Last Revised: October 30, 2014 May 29, 2015 Page 62
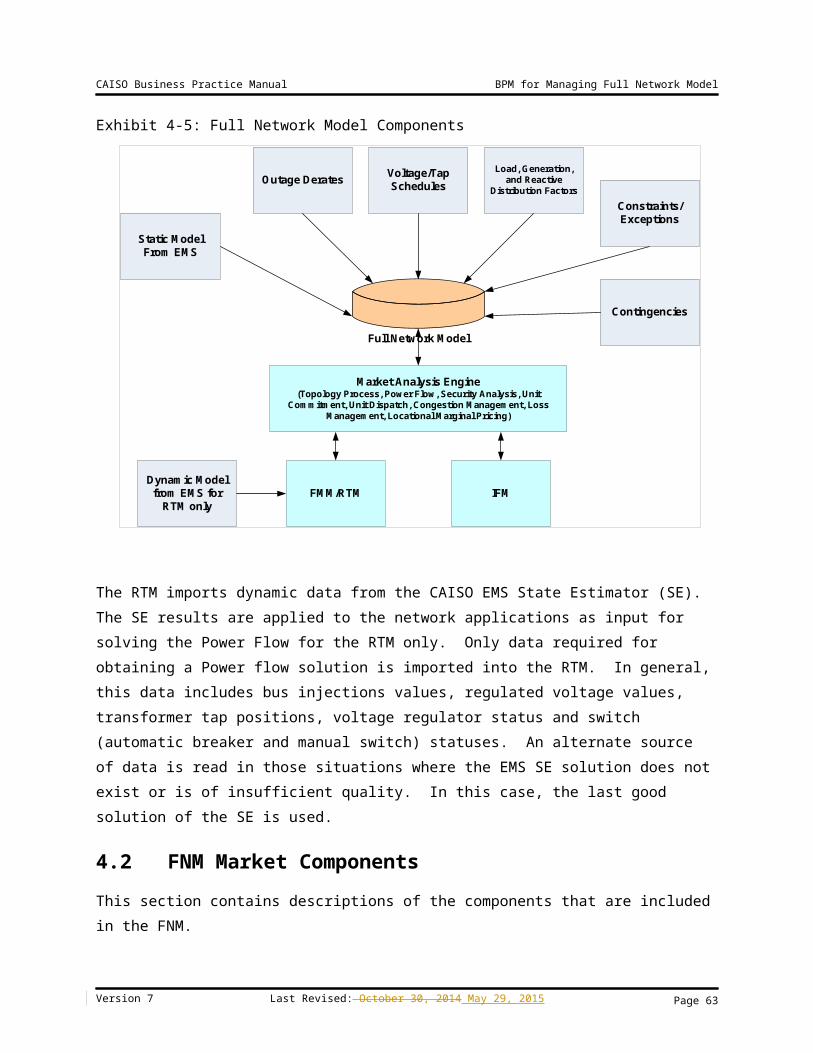
CAISO Business Practice Manual BPM for Managing Full Network Model
discussed in the previous section, a second alternative is available, through a manual CAISO work around, which addresses some of the issues with the first alternative including the shortcoming of not being capable of handling loads that share common metering. Under the alternative approach, the Aggregated Participating Load is eligible to provide Non–Spinning Reserve (on a contingency basis) provided that metering and network topology support this approach.32 Under this alternative approach, the Aggregated Participating Load uses Energy bids similar to Non-Participating Load (ten segment energy only bid curve, etc.).
An Aggregated Participating Load is a collection of nodal Participating Loads that may be aggregated if the individual Loads are under 1 MW or are located at the same bus, or may be approved by the CAISO on a case-by-case basis within specified geographic areas, e.g., pumping Loads within the same watershed or water delivery system that bid into the CAISO Markets on a aggregated basis. The overall Loads at each bus may or may not have MW/MVAR measurements at the bus level. In general, the aggregated Participating Loads must be electrically (topologically) close. The pumping plants that are currently Participating Loads are within the same water delivery system. For scheduling, Scheduling Coordinators representing Participating Loads will submit their Schedules as an aggregated resource ID, and the IFM/RTM will distribute the Schedules to individual Loads for optimization. In general, the Load aggregations must be in a single AS Region and RUC zone.
An Aggregated Participating Load is registered as a Custom Load Aggregation Point and consists of multiple nodal Participating Loads. The individual nodal Participating Loads must be metered to qualify for registration. The Aggregated Participating Load bids into the CAISO’s Energy and Non-Spinning Reserve AS Markets pursuant to Tariff Sections 30.5.2.3 and 30.5.2.6 as a single entity and is included in SCUC optimization accordingly.
The Master File contains registration of a market resource for each Aggregated Participating Load and its member nodal Participating Loads. An Aggregated Participating Load may include only a portion of a member nodal Load. The default Aggregated Participating Load’s Load Distribution Factors, known as Custom Load Distribution Factors (CLDFs) are registered in the Master File. CLDFs represent the percentage of each individual member’s default share of the Aggregated Participating Load. It is possible that only a portion of a Participating Load will be subject to a Bid in any particular time interval, although it is expected that the full amount of Demand that is registered as a Participating Load would be dispatchable at some point in time. The full amount of Demand that is registered as a Participating Load would be subject to its locational price, rather than the LAP or MSS price, pursuant to Tariff Section 30.5.3.2.
32 The metering and network topology serving the Participating Load must allow the CAISO to distinguish it from other Loads in the FNM when running DAM and to recognize injections or withdrawals from the network in RTM. If this alternative approach, the CAISO represents RT Bids and Dispatch using a fictitious generator at the same location as the Participating Loads. In Settlement, the response to RT Dispatch will appear as a reduction in Demand, rather than as output from the fictitious generator.
Version 7 Last Revised: October 30, 2014 May 29, 2015 Page 63
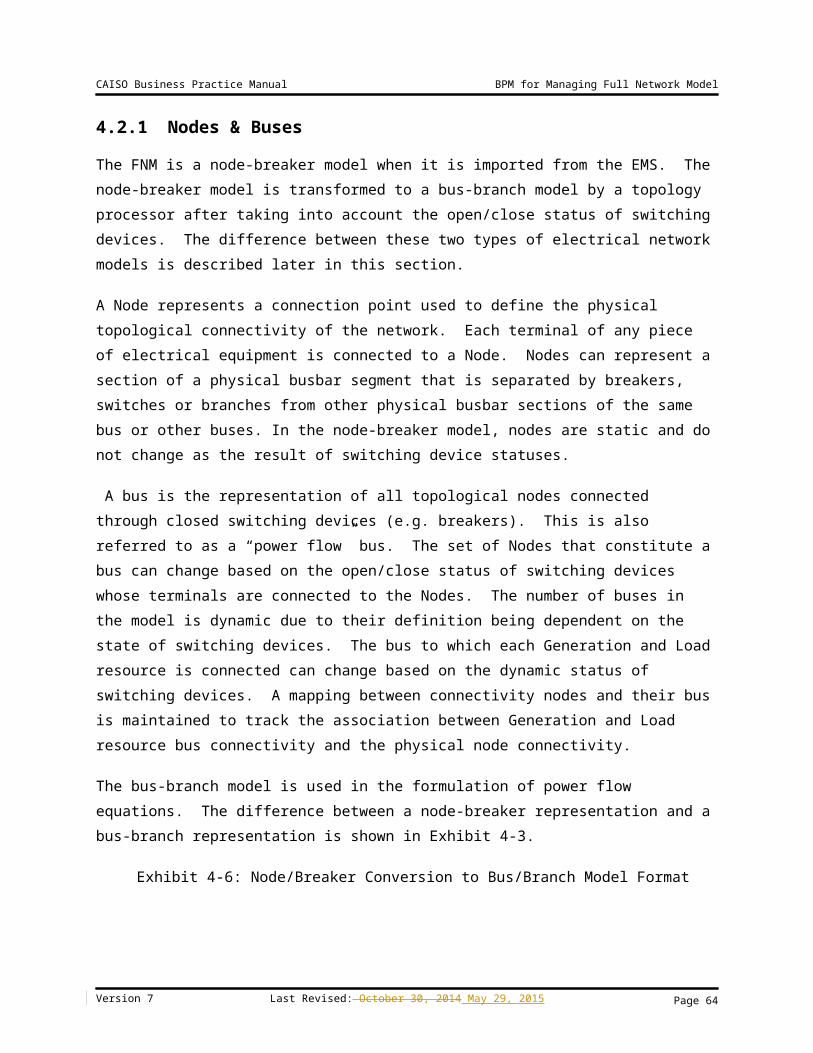
CAISO Business Practice Manual BPM for Managing Full Network Model
For the FNM and for market applications, this market resource is referenced by the ID of the registered Aggregated Participating Load.
The modeling of Proxy Demand resources is similar to the modeling of Aggregated Participating Loads. A Proxy Demand Resource is a Load or aggregation of Loads that provides Demand Response Services pursuant to a Proxy Demand Resource Agreement between the CAISO and a Demand Response Provider, which can be represented by a different Scheduling Coordinator than the Load Serving Entity. The Load Serving Entity schedules the demand of these Loads as described in section 4.2.2. The Demand Response Provider establishes a separate resource consisting of a proxy generator at a PNode, or an aggregation of proxy generators at an APNode, which have the general characteristics of other generator aggregations for network modeling purposes, as described in section 4.2.3.2. The locations of proxy generators may be either established at default locations by the CAISO (pre-defined PDR), using Generation Distribution Factors maintained by the CAISO (custom PDR), or identified by the Demand Response Aggregator, who would then provide Generation Distribution Factors to the CAISO. The Generation Distribution Factors are weighting factors for calculation of applicable LMP for the Proxy Demand Resource. The aggregations of locations in a Proxy Demand Resource must be contained within a Sub-Load Aggregation Point (Sub-LAP), which is a subset of PNodes designated by the CAISO within a Default LAP. Within each Sub-LAP, the default locations that the CAISO identifies to represent Proxy Demand Response resources represent take-out points serving the largest amounts of demand within the Sub-LAP, and are distributed sufficiently to represent the geographic distribution of Load within the Sub-LAP.
4.2.3.8 Point of Receipt
The section addresses the issues related to losses within a Market Participant’s internal network where the Point of Receipt (POR) for Generation is not located at the same node where the Energy is produced.
The physical model within FNM is based on a detailed model of the power system with individual equipment represented. The analytical applications (power flow, contingency analysis, loss sensitivity and shift factor calculations) use this model.
The commercial content of the FNM is defined as an additional layer on top of the detailed physical layer. The commercial model is based on the model of resources as they participate in CAISO Markets and deliver their products at their POR.
Exhibit 4-10 illustrates an example of a physical model with three Generating Units belonging to a Market Participant. The Market Participant connects to the CAISO Controlled Grid through the Market Participant’s own transmission system. Exhibit 4-11 is the representation of the same participant on the market side where the physical resources are aggregated to a single
Version 7 Last Revised: October 30, 2014 May 29, 2015 Page 64
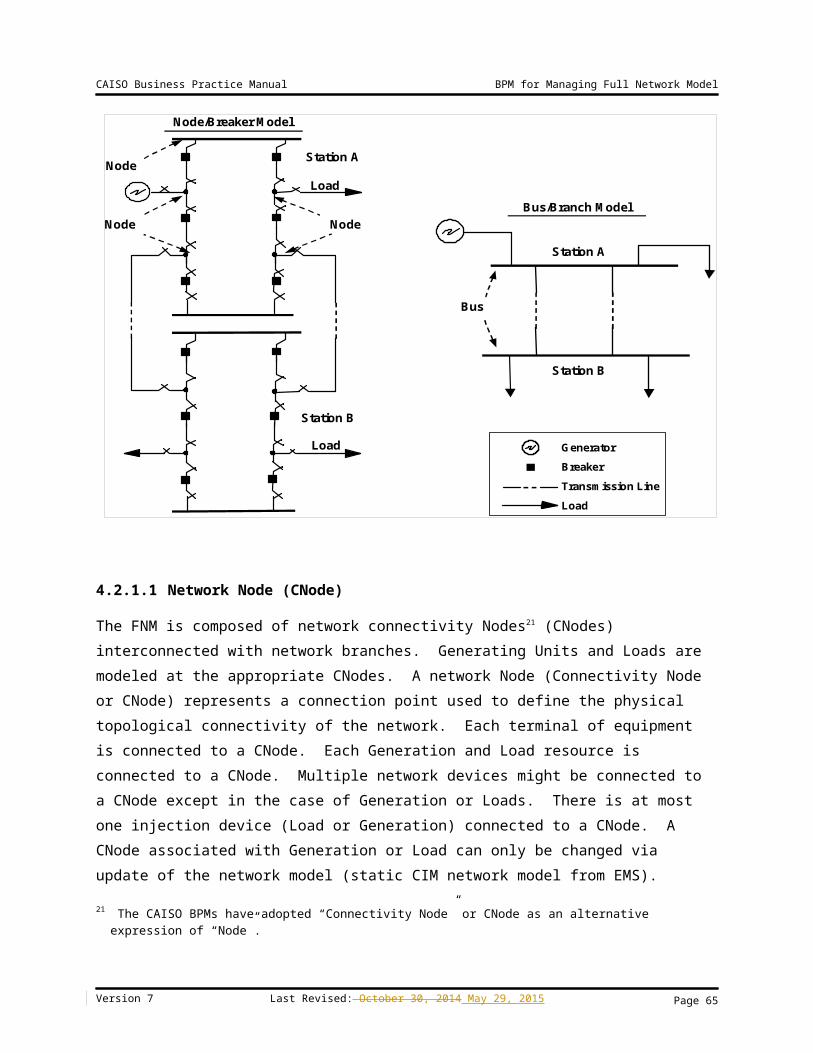
CAISO Business Practice Manual BPM for Managing Full Network Model
market resource and the transmission facilities of the Market Participant and the related losses are internalized.
In general, a meter may be located at either the resource's PNode or another point that is closer to the CNode where the resource is physically connected. If the meter is not located at the PNode, the meter may or may not contain electronic loss compensation to represent deliveries to the PNode. The ADFs and beta values will be determined through AC power flow analysis, and applied using the stated equations as discussed later in this section.
The key considerations for the three Generating Unit examples are:
The LMPs at Buses 1 and 2 and other ISO Grid locations must not be influenced by the internal losses associated with the network of the Market Participant.
Network loss sensitivities must exclude the impact of the Market Participant’s internal network.
The Market Participant’s internal losses must not be included in the calculation of total system losses.
Exhibit 4-13: Detailed Physical Model of Aggregated Market Participant
Version 7 Last Revised: October 30, 2014 May 29, 2015 Page 65
CAISO Business Practice Manual BPM for Managing Full Network Model
Exhibit 4-14: Commercial Model of Aggregated Market Resource
An approximate model is used to allow a simplified approach for handling the situation where the POR is distinct from the physical Generator terminal. The key to the approach is to define two quantities for each of the physical resources that are associated with the market resource. The first is the aggregate distribution factor (ADF). This is the distribution factor that indicates how much of the aggregate market resource is distributed to an individual Generator if the internal network for the Market Participant were lossless (ADFs in the formulations in this section of the document are lossless GDFs). In other words the ADF values would sum to 1.0 for all the physical Generators that are associated with the aggregate Resource. The second quantity that is defined for a physical Generator that is part of an aggregate is the factor beta. This factor represents how much of the MW output of the physical Generator is lost before it reaches the POR for the market resource. This factor allows the losses of the Market Participant’s internal network to be approximated in a simple fashion. The ADF and beta for an individual are combined into an overall GDF.
Version 7 Last Revised: October 30, 2014 May 29, 2015
G1 G2 Gn
To CAISO Grid
Market Participant’sLossyNetwork
PODBus 2Bus 1
POD
G1 G2 Gn
To CAISO Grid
Market Participant’s Lossy Network
PORBus 2Bus 1
POR
G1 G2 Gn
To CAISO Grid
Market Participant’sLossyNetwork
PODBus 2Bus 1
POD
G1 G2 Gn
To CAISO Grid
Market Participant’s Lossy Network
PORBus 2Bus 1
POR
G
POD
To CAISO Grid
Market Resource with internalized Loss ModelGenerator
POR
To CAISO Grid
Market Resource with internalized Loss ModelG
POD
To CAISO Grid
Market Resource with internalized Loss ModelGenerator
POR
To CAISO Grid
Market Resource with internalized Loss Model
Page 66
CAISO Business Practice Manual BPM for Managing Full Network Model
The following formulas indicate how these factors are used to go between the physical Generators and the market resource. They also indicate how the internal losses of the Market Participant’s network are excluded from impacting the market losses and loss sensitivities.
Disaggregate market resources to physical resources using the following formulas:
Gi=GDFi⋅Gm
GDF i=ADFi
(1−βi ) Convert calculated system losses calculated by network applications (NA) to market
losses for use by SCUC according to the following formula:
lossm=losss−∑i=1
n
β i Gi
Convert the NA calculated physical loss sensitivities to a market resource loss sensitivity using the following formula:
Δlossm
ΔGm≃∑
i=1
n
(∂ losss
∂Gi⋅GDF i−βi⋅GDF i)=∑
i=1
n
(∂ loss s
∂Gi−β i)⋅GDFi
Convert the NA calculated physical Resource MW base points to the market resource MW base point using the following formula:
Gm0 =∑
i=1
n
(1−β i )⋅Gi0
4.2.4 Modeling Transmission Related Market Attributes
The following sections describe market related concepts impacting transmission system modeling in the FNM.
4.2.4.1 Intertie Scheduling Constraints
Interties represent the transmission interconnections between the CAISO Balancing Authority Area and adjoining Balancing Authority Areas and are used as the Scheduling Points for imports, exports, and wheeling. Interties or Scheduling Points are also used for wheeling power across a Balancing Authority Area. An Intertie can be used by multiple SCs. Each SC can schedule interchange at multiple Interties. An SC can have multiple interchange schedules at the same Intertie Scheduling Point by assigning a unique interchange identifier to each interchange schedule.
Version 7 Last Revised: October 30, 2014 May 29, 2015 Page 67
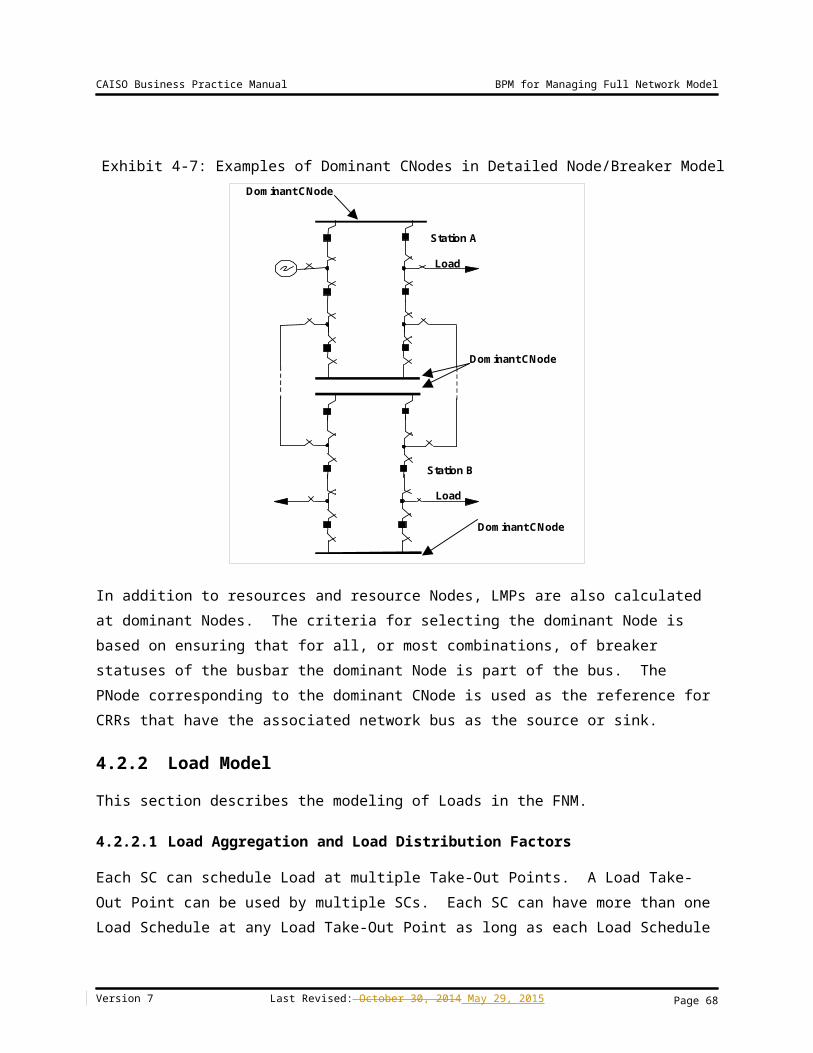
CAISO Business Practice Manual BPM for Managing Full Network Model
With each Intertie there is a requirement to include the following scheduling constraints during the SCUC optimization:
max (0 , I−E )+R≤F I ⇒ {I−E+R≤F I
R≤F I
max (0 , E−I )+S≤FE ⇒{E−I +S≤F E
S≤F E
Where:
I = Total Energy Import
E = Total Energy Export
R = Total AS Import (total of RegUp, Spin, and NonSpin imports, and RegDown exports)
FI = Intertie ATC in the import direction
FE = Intertie ATC in the export direction
S = Total AS Export (total of RegUp, Spin, and NonSpin exports, and RegDown imports)
And the double arrow in each of the equations denotes that the inequalities on the left translate into the two sets of inequalities on the right.
The Energy and Ancillary Service co-optimization constraints discussed in this section apply in general to all "Intertie" constraints. An Intertie constraint is a capacity constraint that is defined for a set of Scheduling Point resources. The Intertie constraints for Energy & AS co-optimization are defined as a limit on the capacity that is scheduled from a collection of specific Scheduling Point resources, whereas the Transmission Interface constraints pertain to flows on groups of branches as a result of Energy Scheduled in CAISO Markets from all resources, regardless of whether the resources are part of a particular Intertie constraint's definition. Limits on flows on Transmission Interfaces across Interties are discussed in sections 2.1.1.2 and 4.2.5.1.
4.2.4.2 ETC/TOR Contracts
ETC and TOR Contracts are defined in Appendix A of the CAISO Tariff as follows:
Existing Transmission Contracts (ETC) or Existing Contracts – “The contracts which grant transmission rights in existence on the CAISO Operations Date (including any contracts entered into pursuant to such contracts) as may be amended in
Version 7 Last Revised: October 30, 2014 May 29, 2015 Page 68
CAISO Business Practice Manual BPM for Managing Full Network Model
accordance with their terms or by agreement between the parties thereto from time to time.”
Transmission Ownership Right (TOR) – “The ownership or joint ownership right to transmission facilities within the CAISO Balancing Authority Area of a Non-Participating TO that has not executed the Transmission Control Agreement, which transmission facilities are not incorporated into the CAISO Controlled Grid.”
To allow end-to-end operations from the allocation and auction of CRRs to financial settlements, the FNM needs to include additional elements for these entities, to represent the sources and sinks of ETC and TOR transactions. The role of the FNM in scheduling ETCs and TORs consists primarily of establishing PNodes to represent the sources and sinks of these transactions, so that the ETCs/TORs will be properly scheduled and settled in the IFM and RTM. Since the FNM represents a nodal model, any ETC/TOR from node to node will become an ETC/TOR using these source and sink PNodes. The treatment of ETCs and TORs during market optimization is described in the BPM for Market Operations.
The Master File includes the ETC and TOR contracts. The Master File stores the Contract Reference Number (CRN) of the ETC or TOR. The ETC and TOR values are provided by the transmission owners when the CRN is first established.
4.2.4.3 Modeling for New Participating Transmission Owners and External Systems
The following Southern California municipalities have joined CAISO as New Participating Transmission Owners (i.e., New PTOs): Anaheim, Riverside, Banning, Vernon, Azusa and Pasadena. These cities have transferred the operational control of their contract rights on certain transmission networks outside of California to CAISO through the New PTO agreements. In the future other entities may enter similar arrangements with the CAISO and become New PTOs. Managing congestion on the New PTO rights within the CAISO market requires special considerations as discussed below.
Unlike CAISO’s original market design, which used a simple radial network model to perform zonal Congestion Management, modeling the New PTO rights requires a detailed representation of the network in the CAISO Balancing Authority Area and CAISO Controlled Grid. The lines that are modeled within the New PTO network model are actual physical lines within other Balancing Authority Areas. Because most of these Converted Rights involve capacity outside the CAISO Balancing Authority Area, their modeling involves different considerations from the network within the CAISO Balancing Authority Area.
The market system allows for co-optimization within scheduling limits for Schedules at any of the New PTO and other external Scheduling Points, taking into account the pertinent contractual
Version 7 Last Revised: October 30, 2014 May 29, 2015 Page 69
CAISO Business Practice Manual BPM for Managing Full Network Model
and ownership rights of the New and existing PTOs within their network area. Thus, this model takes into consideration the simultaneous contract and ownership rights on each of the transmission line segments in IFM and RTM to determine a feasible point-to-point transmission capacity per direction.
The New PTO network Scheduling Points are normal Scheduling Points at which the CAISO Controlled Grid connects with other Balancing Authority Areas, as specified in the CAISO Tariff. The New PTO model and other parts of the external model are a subset of the overall physical network model for the external region, and the quantity of transmission rights under CAISO operational control is not proportional to the total network capacity, so contractual rights cannot be enforced as conventional Transmission Interface limits on flows through the looped network model. Instead, the use of a set of nested intertie scheduling constraints recognizes the point-to-point characteristic of the New PTO contractual rights. Each intertie scheduling constraint accounts for the net schedules at one or more Scheduling Points, to limit the net schedules to the available capacity from New PTO Scheduling Points into the CAISO balancing authority, or between New PTO Scheduling Points. The limit applied to each of these intertie scheduling constraints has the form that is presented in section 4.2.4.1, with the ATC applicable to the intertie scheduling constraint being equal to the quantity of transmission rights placed under CAISO operational control, to or from the combined Scheduling Points to which it applies.
In the Real-Time Market, compensating injections are used to match modeled flows across the market area’s boundary with flows observed in the SE solution, as described in section 3.1.4. Because the compensating injections are not market schedules, this process does not affect the enforcement of the nested intertie scheduling constraints.
4.2.4.4 Dynamic Transfers
Dynamic Transfer is a general term that applies to either dynamic schedules or pseudo-ties. The term “dynamic schedule” refers to an interchange schedule in which the resource remains under the control of the native balancing authority (BA) where the source of transfer is electrically located, and the native BA includes the resource’s output in its balancing of supply and demand. The term “pseudo-tie” refers to a transfer in which the source is accounted for in the attaining BA’s balance. The attaining BA also performs other balancing area functions for pseudo-tie resources.
Dynamic imports and pseudo-ties offer benefits to both the native and attaining BAs. In the case of dynamic transfer imports, dynamic schedules facilitate mid-hour dispatch of ancillary services and energy bid into the ISO real-time markets on the interties. Typically, adjacent balancing authorities preclude dispatch during mid-hour of static scheduled reserves as energy, as they view ancillary services solely as “contingency reserves” to be dispatched only in system
Version 7 Last Revised: October 30, 2014 May 29, 2015 Page 70
CAISO Business Practice Manual BPM for Managing Full Network Model
emergencies. Mid-hour dispatch of these services requires manual scheduling work, in real time, between the respective balancing authority real-time schedulers, and adjustments to static balancing authority area interchange schedules. Dynamic schedules “automate” this mid-hour dispatch and interchange adjustment process. Thus, dynamic schedules facilitate the provision of ancillary services and energy to the ISO on the interties, no longer restricting these services to pre-dispatch, on an hourly basis.
A pseudo-tie takes the use of conventional dynamic scheduling functionality several steps further, with additional benefits to both balancing authorities. A pseudo-tie effectively brings the external generating resource into the ISO BAA, electrically. The native BAA benefits most from the voltage support provided by the resource, locally, and is released from any regulation burden for the pseudo-tie generator.
4.2.4.5 Remedial Action Schemes
Remedial Action Schemes (RAS) are protection schemes used to support power system reliability.33 The action resulting from a RAS is determined by operational needs, and may include automatic Load shedding, Generation tripping, transmission system separation, or other measures to restore safe system operating conditions. Execution of these actions is triggered by overloads, outages, frequency deviation, or other conditions. The planning and implementation of RAS is determined by system reliability needs. Market operations are affected by RAS availability and operations, but are not the reason for RAS implementation.
Generally, RAS are manually armed and triggered by telemetry. Some RAS are armed most of the time, while others are armed only when critical system conditions already exist and additional system protection is required. The arming or activation of RAS does not consider market pricing as a condition. If a RAS affects the impact of a contingency, the CAISO will account for this impact as part of the definition of that particular contingency.
The impact on the FNM is that RAS activation or deactivation may affect transmission limits. When arming or activation of RAS affects transmission constraints, the CAISO’s operators respond by adjusting the transmission limits that are used in future market dispatch intervals. Similarly, adjustments as appropriate will be made upon deactivation of an RAS.
4.2.5 Groupings & Zone Definitions
The following sections describe Market related concepts impacting modeling of groups and zones in the FNM.
33 The RASs are owned by PTOs, and as a result details regarding their design and operation are released on terms determined by the PTOs. The CAISO will implement the RAS for reliability purposes and determine appropriate transmission limits based on the RAS status, but will not post the RAS information on the CAISO website.
Version 7 Last Revised: October 30, 2014 May 29, 2015 Page 71
CAISO Business Practice Manual BPM for Managing Full Network Model
4.2.5.1 Transmission Interface Constraints
A Transmission Interface consists of one or more transmission line branches. A branch can be a member of multiple Transmission Interfaces. The default Transmission Interface definition is included with the EMS network model data. The ratings for Transmission Interfaces are referred to as system operating limits, usually determined by power flow analysis, transient stability analysis, voltage stability analysis and contingency analysis, performed by power system operations engineers and sometimes involving multiple neighboring Balancing Authority Areas. To establish a common practice for scheduling limits that are expressed as Total Transfer Capability (TTC), a system operating limit is commonly used as the corresponding TTC for Interties, but these limit values may differ in some cases. These ratings are specified in MW’s, are directional and can change based on season. Transmission Interfaces only have normal ratings. The normal ratings are used in the base case only. 34 The default Transmission Interface rating is included with the EMS network model data. Representative values of Transmission Interface ratings are contained in the CRR FNM that is released under Section 6.5.1.1 of the tariff, as described in Section 2.2. For major Transmission Interfaces such as Interties and Paths 15 and 26, updates of Transmission Interface ratings will be made available through the CAISO OASIS.
Usually these ratings already take into consideration the effects of significant contingencies. The determination of the system operating limits and TTCs is not in the scope of the IFM/RUC software. External applications and processes provide the system operating limit and TTC, and are applied as scheduling limits, ETC/TOR reservations, Transmission Reliability Margin (TRM), and the resulting Available Transmission Capability (ATC) on the relevant Transmission Interface(s). IFM subtracts the amount of ETC/TOR reservation from the TTC of the relevant Intertie Transmission Interfaces to obtain the ATC, as described in Appendix L of the tariff. The actual ratings of the Transmission Interfaces used by the IFM/RUC application are affected by certain ETC/TOR reservations (such as ownership shares of the Southwest Power Link that have not been placed under CAISO Operational Control) and need to be handled by the IFM/RUC application. Sufficiently prior to the closure of the Day-Ahead Market, PTOs inform the CAISO of the amount of the ETC/TOR reservations on their networks for the Trading Day, which can be used in DAM and RTM. Details are described in CAISO Operating Procedures. See Section 4.2.7 for further discussion and examples.
Constraints are also modeled to represent DC lines, including the Pacific DC Intertie, the IPP DC intertie, and the Trans-Bay Cable. The modeling of DC lines can be illustrated by the Trans-Bay Cable. The Trans-Bay Cable is modeled in the market system using an injection at the source where power flows into the AC network, at Potrero Terminal, and a withdrawal at the sink where power is withdrawn from the AC network, at Pittsburg Terminal. The market 34 These limits incorporate contingencies and stability studies.
Version 7 Last Revised: October 30, 2014 May 29, 2015 Page 72
CAISO Business Practice Manual BPM for Managing Full Network Model
optimization determines the flow on the Trans-Bay cable by including a wheeling bid between these two terminals, which is compared to the price differential between them. The wheeling bid guarantees that the injections and withdrawals at the source and sink remain equal. In this case, it is assumed that the Potrero terminal will always have a higher price compared to the Pittsburg terminal. Outages and derates are managed through an Intertie constraint that allows the software to control the total flow on the line. In DAM, the MVar injections are assumed fixed. RTM utilizes the MVar injections from the solved SE solution.
4.2.5.2 Utility Distribution Company
A UDC is a subset of an FNM Load Zone.
From the IFM/RTM system applications perspective, UDC losses for each relevant UDC service area (or zone) within California that is not itself part of an MSS (e.g., PG&E, Azuza, etc.) are calculated for the first Dispatch interval of the Real-Time Market Dispatch execution. Losses for a UDC that also satisfies the MSS classification (e.g., NCPA) are not required for the purpose of Unaccounted for Energy (UFE) allocation due to their special loss treatment under the MSS agreement. Measurement of incremental losses relative to the distributed slack bus applies to the calculation of LMPs and LMP components. LMPs and LMP components apply to the primary Settlement of Energy transactions in CAISO Markets. The losses discussed in this section are actual MW losses, and are measured within the boundaries of Utility Distribution Companies to support the Settlement of Unaccounted-for Energy (UFE).
From the Power flow perspective, the following must be calculated for each five-minute interval to be used by the Settlements Department for the calculation of UFE:
Transmission losses in each relevant utility service area Sum of all transmission losses in all relevant utility service areas Total ISO system transmission losses
The settlement of Transmission Losses is described in BPM Configuration Guide CC 6474 - Real Time Unaccounted for Energy Settlement in the Settlements & Billing BPM.
4.2.5.3 Aggregated Price Locations (APL)
An aggregated pricing Location (APL), also known as an Aggregated Pricing Node, consists of an aggregation of individual Pricing Nodes (PNodes). The APLs correspond to Trading Hubs, Default Load Zones or aggregated Generation Scheduling Points. The LMP’s at APLs are calculated as a weighted average of the LMP’s of the individual Pricing Locations or Pricing Nodes associated with the PNodes.
Version 7 Last Revised: October 30, 2014 May 29, 2015 Page 73
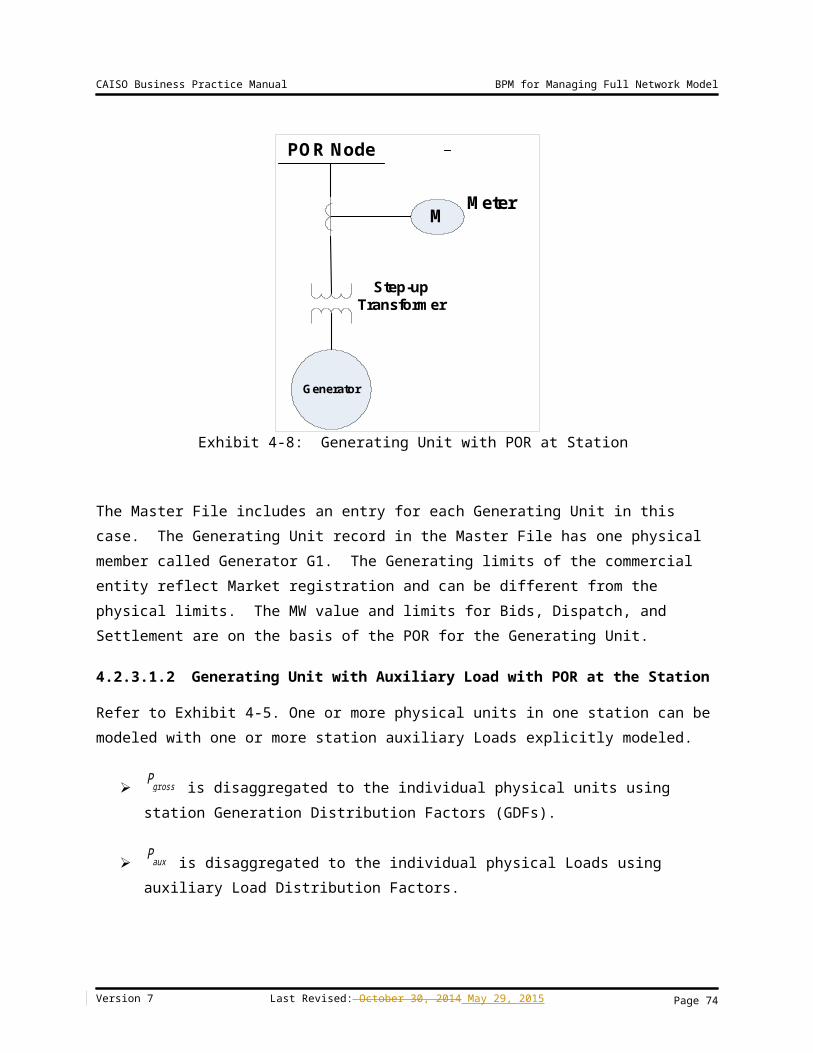
CAISO Business Practice Manual BPM for Managing Full Network Model
An APL in this context is defined based on two or more PNodes. The main difference between the PNode and the APL is that the prices at APLs are calculated after the Market optimization based on the prices of the PLs.
Exhibit 4-14 12 shows the relationship between CNodes, PNodes, and APLs.
Exhibit 4-15: Price Location and Aggregation Relationships
4.2.5.4 Trading Hubs
Trading Hubs are defined in the CAISO Tariff Attachment A as follows:
“An aggregation of network Pricing Nodes maintained and calculated by the CAISO for settlement and trading purposes posted by the CAISO on its CAISO website.”
Trading Hubs, which are a form of an Aggregated Pricing Node, are aggregation points that include all Generation Points of Receipt connected to the associated network nodes. The Trading Hub GDFs describe the distribution pattern of the entire Generation output within the Trading Hub, for each season and time-of-use period (on-peak or off-peak). The CAISO builds the model of Trading Hubs and the associated Hub GDFs. Initially, the Trading Hubs are set up to be the same as the CAISO’s existing congestion zones (e.g., NP15, SP15 and ZP26).
In any of the CAISO Markets, Trading Hub prices are weighted averages calculated using the individual Trading Hub member nodal prices weighted by Trading Hub GDFs.
Version 7 Last Revised: October 30, 2014 May 29, 2015
Aggregated Pricing Node
Pricing Node
Connectivity Node
Page 74
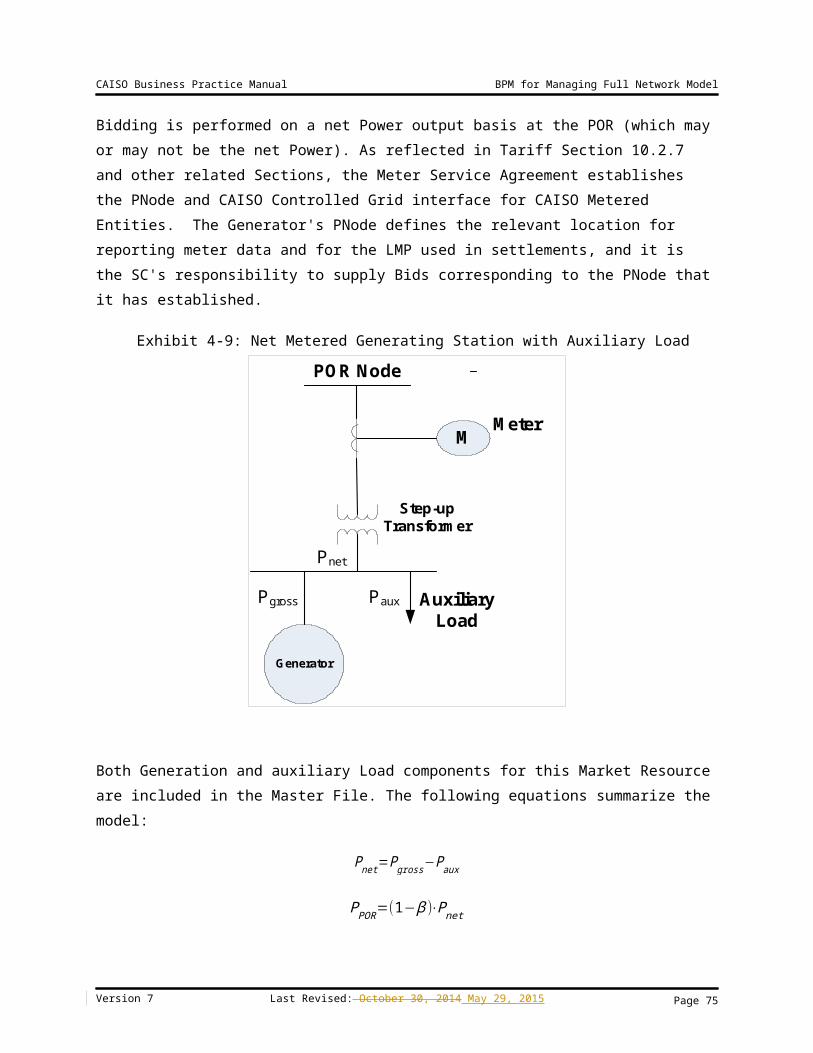
CAISO Business Practice Manual BPM for Managing Full Network Model
The Trading Hubs and the Trading Hub Generation Distribution Factors are maintained in the CAISO software applications. The Trading Hubs and the Trading Hub Generation Distribution Factors will be published to market participants from these sources.
4.2.5.5 Metered Sub-Systems
The discussion of MSSs in this BPM is intended to address only issues pertinent to modeling of MSSs in the FNM. Details of other aspects of MSS operation are contained in Section 4.9.1 of the CAISO Tariff and in the BPM for Market Operations.
The following principles apply to modeling of Metered Sub-System (MSSs):
MSSs, their detailed transmission systems, Generators and Loads are modeled in the FNM.
CAISO State Estimator solves for the state of the grid within the MSSs.
CAISO forecasts the Load of MSSs. Load forecast of MSS is distributed using Load Distribution Factors (LDFs).
MSSs may have multiple interchange points with CAISO (e.g., Silicon Valley Power-Santa Clara).
Resources in an MSS may participate in CAISO Energy and AS Markets.
Additional market scheduling and settlement features apply to MSSs. For example, an MSS may elect to carry out its own Load following (and opt out of RUC) or may have CAISO provide Load following (and participate in RUC). The details of these market features are beyond the scope of this BPM.
For an MSS, internal MSS transmission constraints are monitored but not enforced by the IFM/RTM system. (The mechanism for accomplishing this is the FNM exception list) For an MSS, the losses are calculated and stored in a database separate from the loss values of UDCs and the Utility. Losses in the MSS internal transmission system are included in the Power flow solution, but separated from the reporting of UDC losses to settlements. The effect of the operation of the MSS internal transmission system is excluded from CAISO losses, loss sensitivity calculations and LMPs.
4.2.5.6 RUC Zones
The RUC requirements are specified by RUC zones. The RUC zones include the three default Load zones (i.e., the three original PTO service areas) and other RUC zones defined by CAISO,
Version 7 Last Revised: October 30, 2014 May 29, 2015 Page 75
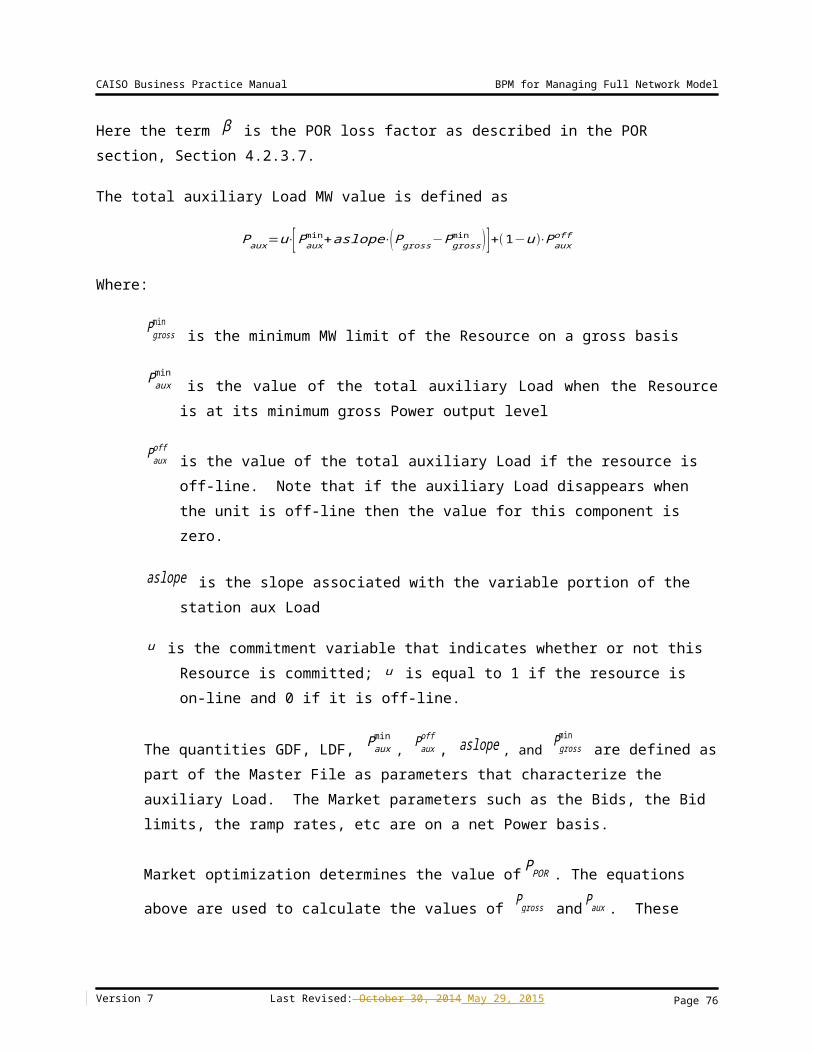
CAISO Business Practice Manual BPM for Managing Full Network Model
which need not coincide with the boundaries of three original PTO service areas. The RUC requirements for the default RUC zones do not include the RUC requirements for the custom RUC zones. The net short quantities are represented in two forms: (i) MW, and (ii) percent of Load Forecast (LF) cleared in the IFM, for each RUC zone. The RUC requirement setter (RRS) application allows the operator to make adjustments to these quantities on either a system wide basis, or for an individual RUC zones. Adjustments are made by changing either of the two forms displayed (MW or percentage LF). The default for this adjustment factor is 100%. If the operator specifies a percentage other than 100%, then the system Loads are adjusted by that amount for the RUC procurement.
4.2.6 Integrated Balancing Authority Areas (IBAAs)
The FNM includes models for a number of other Balancing Authority Areas to manage congestion within the CAISO network. Section 27.5.3 of the CAISO Tariff provides that the FNM will include a model of an IBAA’s network topology and provides a general description of how the FNM will model an IBAA.35 Pricing for Scheduling Points associated with IBAAs is further described in CAISO Tariff Appendix C (Section G).
Presently, the FNM includes the following external Balancing Authority Areas as IBAAs. These are Balancing Authority Areas that have been determined to have direct interconnections with the CAISO Balancing Authority Area, such that power flows within the IBAA significantly affect power flows within the CAISO Balancing Authority Area, and whose network topology should therefore be modeled in further detail in the FNM beyond the simpler modeling of other interconnections between the IBAA and the CAISO Balancing Authority Area. The IBAAs currently as defined in Section 27.5.3.1 of the CAISO Tariff in effect are:
1) Sacramento Municipal Utility District, which includes the transmission facilities of the following entities:
Western Area Power Administration – Sierra Nevada Region Modesto Irrigation District City of Redding City of Roseville
2) Turlock Irrigation District
Together, the Sacramento Municipal Utility District and Turlock Irrigation District are referred to as the SMUD-TID IBAA.
35 IBAAs were originally referred to as Embedded and Adjacent Control Areas (ECAs and ACAs), which are terms that may appear elsewhere in Business Practice Manuals.
Version 7 Last Revised: October 30, 2014 May 29, 2015 Page 76
CAISO Business Practice Manual BPM for Managing Full Network Model
If approved by the Commission, the CAISO may model additional IBAAs after the initial implementation of the SMUD-TID IBAA pursuant to the procedures provided in Section 27.5.3 of the CAISO Tariff. In the event that the CAISO proposes additional IBAAs, it will follow a stakeholder process as prescribed by CAISO Tariff Section 27.5.3.8 and as further described below.
4.2.6.1 Background
Power systems modeling recognizes that the CAISO Balancing Authority Area is interconnected with several other Balancing Authority Areas in the Western Electricity Coordinating Council (WECC) interconnected system. For example, the CAISO’s Reliability model includes a model for adjacent Balancing Authority Areas’ high voltage physical networks. One of the goals of the CAISO market is to manage congestion through power systems modeling by reflecting, where feasible, actual power flows on the integrated system. In contrast, interactions between Balancing Authority Areas in the Western interconnection generally consist of managing flows through deliveries at interties between Balancing Authority Areas, which do not necessarily reflect actual power flows. An accurate network model of neighboring Balancing Authority Areas whose networks are closely interrelated with the CAISO, and actual flows between areas, allows the CAISO to achieve its congestion management objectives.
The SMUD-TID IBAA transmission network is embedded and/or runs in parallel with major parts of the CAISO network thereby having significant impact in the operation of the CAISO grid. Loop flow or unscheduled parallel flow to and from the SMUD-TID IBAA is significant and has a significant impact on optimal resource scheduling and the Locational Marginal Prices (LMPs) in the CAISO Markets. With respect to the SMUD-TID IBAA, the high degree of integration between those Balancing Authority Areas and the CAISO Balancing Authority Area creates congestion management issues between the Day Ahead and Real-Time Markets. If the CAISO can more accurately model certain flows on its system during the Integrated Forward Market, it will be able to clear more feasible schedules in the Day-Ahead Market that are more likely to reflect the flows that will materialize in Real-Time.
4.2.6.2 Modeling Approach
Prior to developing an appropriate model through consultation with a potential IBAA operator, and internal identification and review of available data, the CAISO does not have sufficient existing data to model IBAAs because it does not have visibility over facilities and resources within an IBAA. However, the CAISO does have the capability to implement alternative methodologies to model IBAAs. The CAISO intends to continue to work with other Balancing Authority Areas to obtain information to improve its modeling efforts. Once the CAISO is able to develop workable modeling details of other Balancing Authority Areas, the CAISO will then
Version 7 Last Revised: October 30, 2014 May 29, 2015 Page 77
CAISO Business Practice Manual BPM for Managing Full Network Model
make an assessment of how to best model these areas in the FNM for the market. When the CAISO is able to obtain detailed operational data, the CAISO will be able to apply modeling principles for transactions between an IBAA and the CAISO Balancing Authority Area, including but not limited to the following:
The FNM may model IBAA transmission systems, Generators and Loads.
CAISO State Estimator observes operating conditions throughout the WECC, including the IBAAs, and provides the pertinent data to the market systems for maintaining reliability during market operations.
Net Interchange values for IBAAs, which are available as schedules at the CAISO-IBAA boundary, and as net or gross schedules at other boundaries between IBAAs and other Balancing Authority Areas, allow modeling of inter-area transactions.
Entities with control of supply resources or loads within the IBAA may participate in the CAISO Markets on a resource-specific basis. As appropriate, scheduling may reflect an aggregation of resources rather than scheduling all resources individually.
Generation or Demand located within an IBAA may schedule dynamic transfers with or wheeling schedules through the CAISO Balancing Authority Area.
The CAISO may monitor IBAA internal transmission constraints, but does not enforce such constraints in the CAISO market. (The mechanism for enabling the ability to monitor but not necessarily enforce constraints is the FNM Exception List.)
The CAISO may calculate IBAA system losses and distinguish them from CAISO system losses to enable the CAISO to dispatch CAISO resources based solely upon conditions within the CAISO system.
Losses within an IBAA transmission system may be excluded from CAISO loss sensitivity calculations and LMPs.
The Load and Generation pattern in the CAISO’s Forward Markets is obtained by scaling the IBAA Load and Generation according to Intertie Distribution Factors to meet the Load and net-interchange values between the IBAA and external Balancing Authority Areas.
When less detailed operational data are available, the CAISO will implement a simplified modeling approach for IBAAs. The CAISO has implemented this simplified approach for the SMUD-TID IBAA. If IBAA resources do not participate in the CAISO Markets on a resource-
Version 7 Last Revised: October 30, 2014 May 29, 2015 Page 78
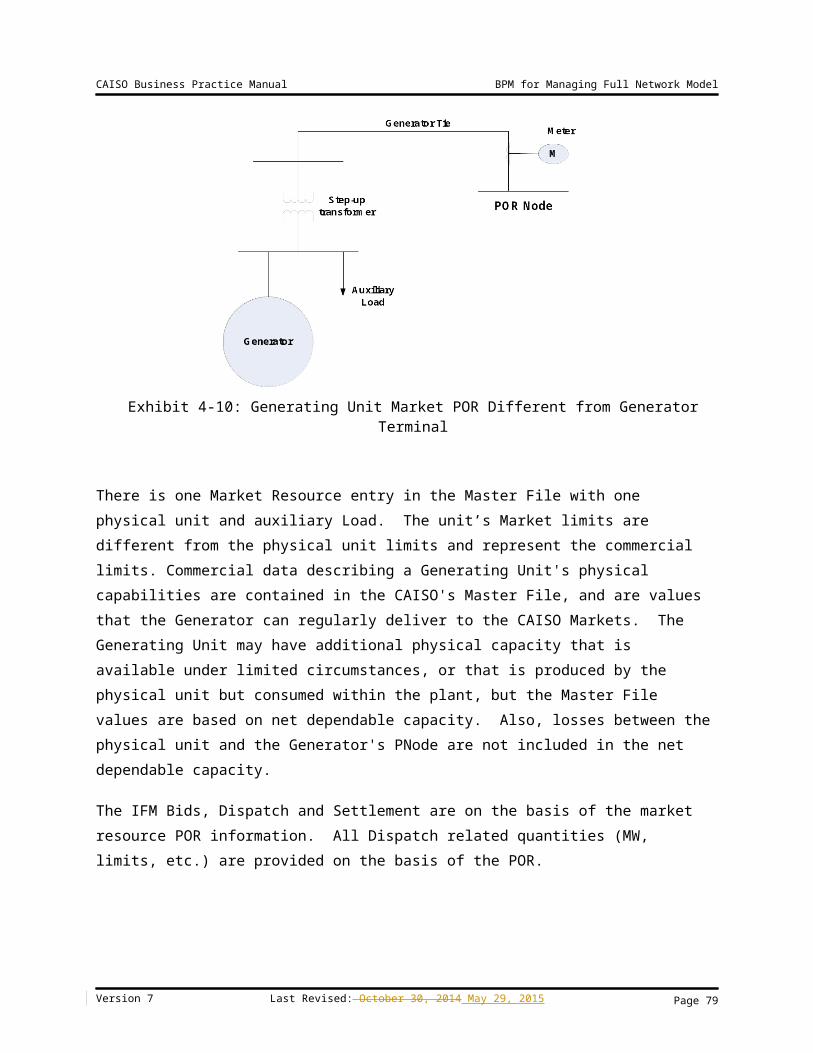
CAISO Business Practice Manual BPM for Managing Full Network Model
specific basis (e.g., Resource-Specific System Resources), the CAISO will establish areas in which all IBAA resources (supply and demand) are modeled as aggregations of pseudo-injections at central points in the IBAA’s high voltage transmission network. In the Day-Ahead Market, the CAISO will assume that schedules have their source or sink at these resource aggregations. If a State Estimator solution is available to the market systems in the Real-Time Market, the CAISO will be able to view the actual locations of supply and demand within the IBAA, and only incremental Dispatch would be modeled as pseudo-injections. If the confidentiality of real-time operational data for an IBAA precludes basing the CAISO’s Real-Time Market solution on a State Estimator solution for the IBAA, the CAISO will estimate the pseudo-injections within the IBAA at levels that produce flows at the CAISO boundary that match the flows that are observed by the CAISO. This calculation approach uses the same methodology as estimating pseudo-injections in a New PTO network, as described in Section 4.2.4.3 of this BPM. However, calculated pseudo-injections only approximate conditions in the IBAA, and are likely to be less accurate for future Dispatch Intervals than if a State Estimator solution were available. Consistent with its Tariff, the CAISO will respect operating limits of transmission facilities in the Day Ahead and Real Time Markets and will not relax scheduling constraints on Interties with adjacent Balancing Authorities.
In cases where the exchange of operational data between the IBAA and the CAISO does not enable the CAISO to verify the location and operation of the resources within the IBAA that are dispatched to implement the interchange transactions, the CAISO establishes default pricing rule or reflect the value of interchange transactions with the IBAA. If any market participant believes that the default rules will not appropriately price or reflect the value of the resources supporting the interchange transactions, market participants may obtain alternative pricing arrangements by negotiating a Market Efficiency Enhancement Agreement (MEEA). An MEEA is an agreement between the CAISO and an entity or group of entities that use the transmission system of an IBAA, which provides for an alternative modeling and pricing arrangement to the default IBAA modeling and pricing provisions of the IBAA. Pursuant to an MEEA, the CAISO can obtain more detailed information that enables the CAISO to verify the location and operation of the resources within the IBAA that actually are dispatched to implement interchange transactions. By doing so, the CAISO can settle the resources covered by the MEEA at LMPs representing these resources’ actual location. Section 27.5.3.2 of the CAISO Tariff describes the information required to develop and obtain pricing under a MEEA, and section 27.5.3.3 describes the process for establishing a MEEA.
An owner of generation within the IBAA may choose to designate a specific resource for participation in the CAISO Markets by opting to register the resource as a Dynamic Resource-Specific System Resource or a Non-Dynamic Resource-Specific System Resource, or a pseudo tie. The IBAA modeling approach continues to allow this possibility for any Resource-Specific
Version 7 Last Revised: October 30, 2014 May 29, 2015 Page 79
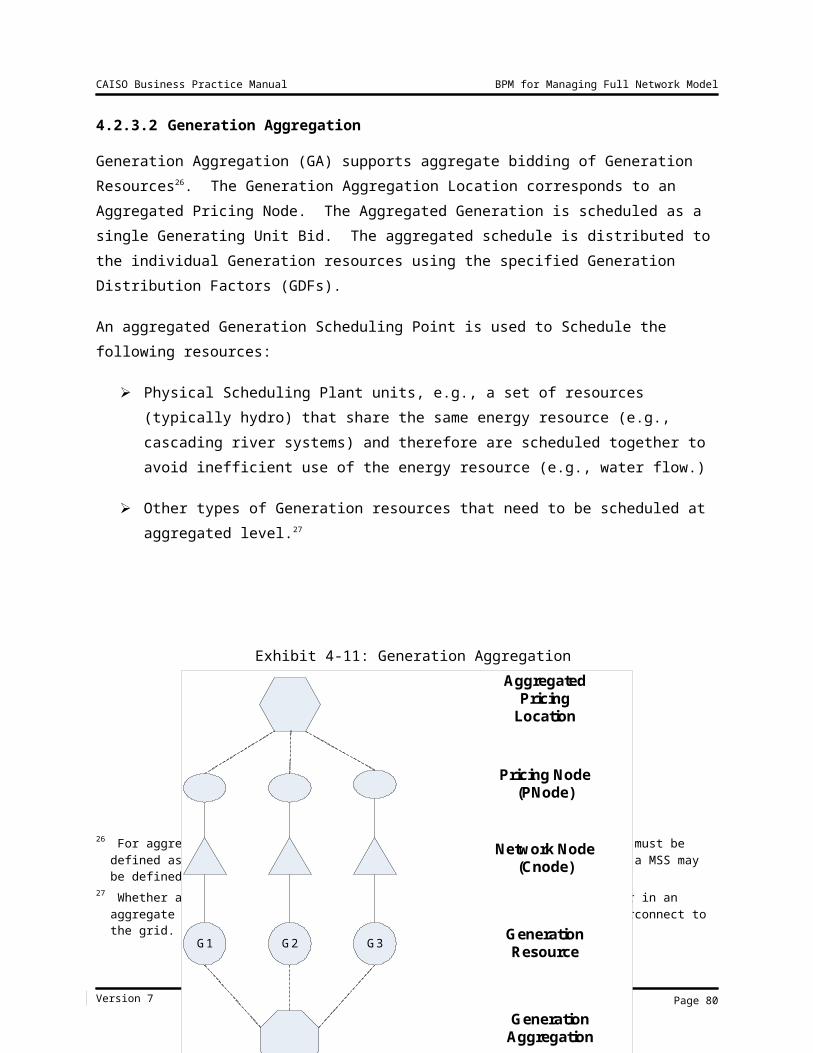
CAISO Business Practice Manual BPM for Managing Full Network Model
System Resource or pseudo ties.36 In the event that there is a Dynamic Resource-Specific System Resource in the IBAA, the MEEA may further provide that the MEEA signatory in control of such resource may also obtain pricing under the MEEA for imports to the CAISO Balancing Authority Area from the Dynamic Resource-Specific System Resource. A Dynamic Resource-Specific System Resource will need to provide sufficient information including telemetry to allow the CAISO to monitor its compliance with the CAISO’s Dispatch Instructions, including schedules, at its specific location.
The manner in which modeling is handled for any new IBAA will be determined after analysis of the requisite information, and after a consultative process with the applicable Balancing Authority and CAISO Market Participants, as described in Section 27.5.3.8 of the CAISO Tariff. The pertinent details for each IBAA will be documented in an appendix to this BPM. For the SMUD-TID IBAA, an appendix to this BPM provides modeling details.
4.2.6.3 CAISO Process for Establishing or Modifying IBAAs
Prior to implementing a new, or modifying an existing Integrated Balancing Authority Area the CAISO will:
1) Consult with all affected Balancing Authority Areas, Market Participants and interested stakeholders regarding appropriate changes to the existing IBAA or the creation of a new IBAA and the appropriate pricing and settlement treatment of transactions with the modified or new IBAA;
2) File all necessary and appropriate changes to the CAISO Tariff regarding the proposed or modified defined IBAAs with the FERC.
3) If necessary, change the BPM for FNM to reflect the modeling specifications for the new IBAA or modified IBAA;
4) Add a new Appendix to the BPM for FNM to reflect the specifications for the new IBAA or modify existing Appendix to reflect change of an existing IBAA;
The CAISO’s IBAA consultation process will include discussion of appropriate modifications to the CAISO’s FNM to enable the CAISO to accurately model the impact of power flows on the
36 Owners of Dynamic Resource-Specific System Resource or a Non-Dynamic Resource-Specific System Resource within the IBAA must continue to meet the tariff requirements for such resources, including the requirement to execute either the Dynamic Scheduling Agreement or the Resource-Specific System Resource agreement. A pseudo-tie resource must enter into a pseudo-tie agreement and any other relevant agreements that may be necessary to support their specific arrangement.
Version 7 Last Revised: October 30, 2014 May 29, 2015 Page 80
CAISO Business Practice Manual BPM for Managing Full Network Model
CAISO Controlled Grid. The process will address the projected impacts on power flow calculations and congestion management in the CAISO Markets Processes. Modifications to the CAISO FNM may include but are not limited to transmission network topology, the location of generation and load on the IBAA system, distribution factors, and the identification of sub-systems within each IBAA. Through the consultation process the CAISO will address the appropriate definition of the PNodes or APNodes for the proposed or modified IBAA, the weighting factors for determining the average price of the nodes where System Resources have been modeled in the IBAA, the need to create prices for each operationally relevant sub-system within the IBAA, and the manner by which the CAISO may exclude the marginal transmission losses within the IBAA.
The CAISO will conduct stakeholder meetings to discuss the new implementation of the IBAA or the modifications to the existing IBAA. In addition, the CAISO will provide notice regarding any affected BPM changes pursuant to the BPM Change Management process as reflected in the BPM for Change Management. The adoption of new IBAAs or modifications to the existing IBAAs as specified in the CAISO Tariff will also require approval of the Federal Energy Regulatory Commission. To the extent practicable, the process described above will be completed with at least 60-days prior to the CAISO filing any tariff changes for a new IBAA or modifying an existing IBAA. In addition, the CAISO will endeavor to issue any such notification prior to the start of the Annual CRR Allocation and Auction process.
4.2.6.4 IBAA and Congestion Revenue Rights (CRRs)
The amount of Congestion cost that will be charged in the Day-Ahead Market for Schedules to or from an IBAA will be consistent with the pricing approach described above. Settlement of CRRs will pay the CRR Holder on the same basis for Schedules to or from an IBAA as these Schedules are charged for Congestion in the Day-Ahead Market. The same System Resource pricing aggregation(s) will be used for CRR Settlements as are used in the Day-Ahead Market, so CRR Settlement will be consistent with the resource locations that are used for Settlement of the IBAAs’ Congestion costs.
4.2.7 Nomogram Constraints
This section describes the use of Nomograms to establish operating constraints for the Power system components.
Version 7 Last Revised: October 30, 2014 May 29, 2015 Page 81
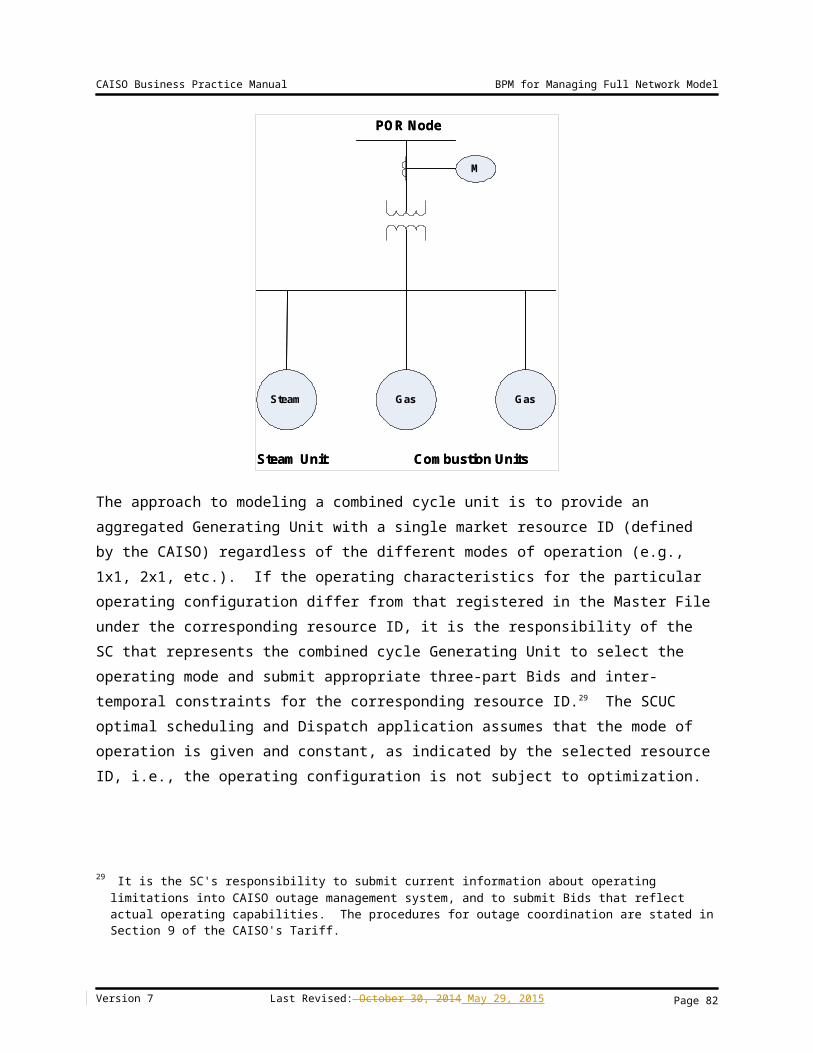
CAISO Business Practice Manual BPM for Managing Full Network Model
4.2.7.1 Nomogram Constraints in General
A Nomogram is a set of piece-wise linear inequality constraints relating control and state variables that define a feasible operating region. Nomograms relate Resource output and transmission interface flows. As defined in the CAISO tariff, a Nomogram is:
“A set of operating or scheduling rules which are used to ensure that simultaneous operating limits are respected, in order to meet NERC and WECC reliability standards, and any requirements of the NRC.”
Another way of describing a Nomogram is as a multi-dimensional representation of the operational capabilities of a system when there is a tradeoff between two or more decision variables, such as the import or export of Energy on one transmission path versus the use of a second path. It represents the tradeoff that must be made when transferring Power over the two paths. The Nomogram graphically defines a closed area within which it is safe to operate.
Nomogram development results in identification and illustration of the boundary between secure and insecure regions of operation for the most limiting contingencies. The limits of the Nomogram are obtained through off-line studies with seasonal prediction of operating conditions and a predefined contingency list. Operating within the safe region of a Nomogram ensures that after a contingency event, the resulting flows would not cause a violation of established thermal, voltage and/or stability limits.
CAISO utilizes a set of Nomograms to define system operating regions. The application programs have the capability to handle some of these complex Nomogram constraints by translating them into a MW Generation constraint. The constraint sets must be piecewise linear and convex. Any other Nomograms beyond these types are outside of the current scope of work and are addressed on a case-by-case basis. Some Nomograms may consist of a family of curves (hyperplanes) with each curve representing different combinations of Generator on/off statuses or other relevant parameters. A member of the CAISO staff pre-selects the desired curve prior to the SCUC run.
The following are examples of typical Nomograms:
AC Interface MW Flow vs. AC Interface MW Flow
AC Interface MW Flow vs. Area MW Generation
4.2.7.1.1 Data Modeling for Nomograms Relating AC Interface MW Flows
The following formulation illustrates a single piecewise linear constraint curve consisting of an AC Interface MW Flow vs. another AC Interface MW Flow. It is assumed that the curve is
Version 7 Last Revised: October 30, 2014 May 29, 2015 Page 82
CAISO Business Practice Manual BPM for Managing Full Network Model
convex. The formulation can be easily extended to treat AC Interface MW Flow vs. Area MW Generation constraints.
The Nomogram constraints imposed by a piecewise linear curve shown in Exhibit 4-15 13 can be expressed as:
ak⋅F1+bk⋅F2≤ck k=1,2,…,N
Where:
N is the number of linear segments on the curve
F1 , F2 are AC Interface MW flows
ak, bk, are coefficients of piecewise linear curve segments
ck is the right highest value for which the linear constraint curve is valid.
For example
If k=2 then
a1F1 + b2F2 is less than C2
This linear constraint curve describes a nomogram for the range of 0 to C2.
Exhibit 4-16: AC Interface MW Flow vs. Interface MW Flow Constraint
Version 7 Last Revised: October 30, 2014 May 29, 2015
Tota
l MW
Flo
w fo
r A
C In
terf
ace
2
Total MW Flow for AC Interface 1
Page 83
CAISO Business Practice Manual BPM for Managing Full Network Model
This set of equations as graphically depicted in the graph in Exhibit 4-15 defines a system constraint that can be enforced using a process similar to Transmission Interface type of constraint processing. For the purpose of converting the AC Interface MW flows into unit MW Generation constraints, the AC Interface 1 and AC Interface 2 MW flows can be expressed as:
F1=F1b+∑
j=1
NG
D1j (PG
j −PGjb )
and F2=F2
b+∑j=1
N G
D2j (PG
j −PGjb)
Where:
D1j, D2
jare the shift factors of Interface 1 and 2 MW flows vs. unit MW Generation
F1b, F2
b are the base case MW flow across Interface 1 and Interface 2, respectively
PGj, PG
jbare the actual and base case MW Generation of Generator j respectively
NG is the number of Generators.
4.2.8 Contingency Management
In addition to enforcing thermal capacity constraints during normal conditions on individual branches of the network, Transmission Interface constraints, and Nomogram constraints, the Market optimization process also enforces constraints that are determined through contingency analysis. The AC power flow solution resulting from the optimized Dispatch performed by the SCUC function creates the base case for a contingency analysis that is performed for a pre-defined and pre-determined set of “n-1” and critical “n-2” transmission outage conditions. If the contingency analysis identifies that line flows would violate emergency thermal capacity constraints for branches of the network, the AC network analysis adds the relevant contingency constraints to the optimization problem formulation to avoid these post contingency violations. The contingency constraints normally apply only to network branches and not to Transmission Interfaces or Nomograms because they incorporate the effect of contingencies in the interface TTC and the nomogram limits. The Market systems make resource commitment and scheduling choices to ensure that no contingency from that list causes violations of emergency branch limits in the post-contingency state, should it occur. Guarding against violations of emergency limits protects transmission equipment for a short duration, until the system can be re-dispatched to restore flows to normal branch limits.
Version 7 Last Revised: October 30, 2014 May 29, 2015 Page 84
CAISO Business Practice Manual BPM for Managing Full Network Model
The EMS and Market systems both contain contingency analysis functionality, but they function in different ways.
The EMS system assesses a large set of contingencies periodically, regardless of whether there are violations. Additionally, the EMS system is able to identify branches that are nearing their normal operating limit. These branches are added to the list of contingencies that are evaluated in detail.
The Market system can analyze a large number of pre-selected contingencies in each run. The same contingencies are used in each interval of a given Market run. The CAISO’s market operations staff specifies the contents of the Market system’s contingency list before each run. That is, the Market optimization software does not dynamically select the contingencies. Instead, the contingency management process for the Market system selects contingencies based on three main sources: 1) prior experience of the CAISO’s engineers to identify recurring limiting contingencies, 2) an assessment of all contingencies by the network analysis software after IFM to identify critical contingencies that were not used in the optimization software during the IFM run, and 3) the use of limiting contingencies identified by the EMS in real-time. The performance of this process is enhanced through an ongoing review to identify and update recurring limiting contingencies.
CAISO may define some of the contingencies for activation during certain system conditions. Publication of activated contingencies will be available on market portal.
After completion of IFM runs, the active contingency list is refined for RTM runs. A means for identifying contingencies that were not considered in the resource optimization in IFM, but that may be likely to cause contingent overloads in RTM if no further action is taken, is an assessment in study mode after completion of the IFM. After the IFM performs unit commitment and scheduling, its Network Analysis function can assess all of the available contingencies, i.e., this function is not limited to 150 contingencies in study mode.
The ranked lists resulting from the EMS system’s assessments also provide information on which contingencies may need to be considered in RTM market runs. However, the CAISO’s operators are aware that the Market dispatch accounts for the contingencies that are known to be the most critical for the current system conditions, so the presence of a contingency in the set that is active in EMS does not necessarily mean that it should replace others for the RTM runs.
Version 7 Last Revised: October 30, 2014 May 29, 2015 Page 85
CAISO Business Practice Manual BPM for Managing Full Network Model
5. Maintenance of FNM for IFM & RTM This section describes the business processes used by CAISO to maintain the Full Network Model. It provides a high level summary of the business processes CAISO uses to maintain the FNM and update the FNM to include new or modified facilities and it also explains the information that Market Participants are required to supply to the CAISO to support the FNM maintenance and update process.
5.1 FNM Update Process FlowThis section describes the business processes used by the CAISO to maintain and update the FNM for use in the EMS, IFM and RTM systems. The processes description includes how the scope of FNM changes is developed, what timeline is followed, how changes to the FNM are developed and tested and how new version of the FNM are placed into use. The description also identifies the data and information sources used to maintain and update the FNM and how the data and information are processed to provide the FNM for the end-use applications.
The graphic in Exhibit 5-1 depicts a high level overview of the FNM update business process flow. From that summary we can see that there are multiple steps in this process which have been grouped into the FNM scope process and the FNM implementation process. The FNM scope process is used to define the scope of the changes to be made in the planned FNM update, while the FNM implementation process is used to make the changes included in the FNM scope, test them and place them into production. From the graphic we can also see that data gathering can take up to 6 months before the scope cutoff and the start of the implementation process. The FNM scope and implementation process will be described in more detail in the following sections. For specific dates and schedules regarding the FNM please refer to the ISO public website under “Market & Operations/ Network and Resource Modeling.” (Direct Web Link)
Version 7 Last Revised: October 30, 2014 May 29, 2015 Page 86
CAISO Business Practice Manual BPM for Managing Full Network Model
Exhibit 5-17: FNM Update Process Flow and Timeline
Version 7 Last Revised: October 30, 2014 May 29, 2015 Page 87
CAISO Business Practice Manual BPM for Managing Full Network Model
Version 7 Last Revised: October 30, 2014 May 29, 2015 Page 88
5.1.1 FNM Work Scope
The process begins with the CAISO identifying the scope of the changes for the next FNM update By evaluating generation and transmission projects that the CAISO has been advised of by the Market Participant who enters the project into the CAISO’s Resource Interconnection Management System (RIMS) data base. Through this process, the CAISO identifies new or modified generation and transmission resources which will be parallel to the grid. Thus for this process, the CAISO uses a 180-210 day look-ahead time window to assess projects which need to be included in the FNM update scope. Any project that is due to be placed into operation shown in RIMS and the CAISO Register is a candidate for inclusion in the FNM updates process. All projects that include the addition, modification, and/or change of rating or use of the following facility types must be entered into RIMS, along with its associated one-line diagram, and the CAISO Register at least 180-210 days in advance by the Market Participant to be assured of inclusion into the FNM by next database run following their Commercial Operation Date (COD) under the new changes:
Generators
Substations associated with CAISO controlled facilities
Transmission lines and/or taps associated with CAISO controlled facilities
Changes in breaker and/or disconnect arrangements, quantities, and/or uses
Power transformers (transmission and distribution) connected to CAISO controlled facilities
Reactive equipment (reactors, capacitors, and SVCs) under CAISO control
Special Protection Schemes (SPS) that automatically control load or generation
New interconnects with non-PTO loads and/or generation
SCADA point additions and/or changes
Protective relay scheme modifications for equipment >200kV
The CAISO organizational groups that are the primarily involved in this scoping process include the Transmission Planning, Grid Assets, Outage Management, Network Applications, EMS Services, Model and Contract Implementation, and Market Operations groups.
Version 7 Last Revised: October 30, 2014 May 29, 2015 Page 89
5.1.2 FNM Data Gathering
After the projects to be included in the FNM update scope have been determined from RIMS and the CAISO Register, the CAISO conducts a data gathering process that can take up to six (6) months prior the scope cutoff date. The data gathering process collects from the appropriate Market Participants the necessary network model and market-related data and information which are needed for the FNM. This process includes requests to the PTOs or other transmission entities for transmission network parameter data, substation configuration information, RAS operational details, protective relay modification details, and real time telemetry related to the new or modified transmission facilities. This data is needed to ensure that the accurate grid topology and real-time data are provided to the State Estimator, other grid operations tools, and real-time situational awareness for the system operators. Examples of transmission data to be submitted include, but are not limited to: type, impedance, rating and connectivity of new or modified transmission facilities. It also includes requests to Participating Generators or other generation entities for generating facility data and information related to new or modified generation facilities. This data is needed to both maintain and update the “wires” model portion of the FNM, the market-specific portions of the FNM, operational instructions, and provide real-time situational awareness for the system operators. Examples include, but are not limited to: unit type, capacity, ramp rate, heat rate, and operating limitations related to new and re-powered generation facilities.
For the same reasons as the CAISO, the WECC also needs updated transmission and generation project data to support and maintain their west-wide system model. The WECC requires data for generation projects that are 10 MW or greater. Through the process described below, the WECC will obtain project data at the same time as the CAISO by being copied on all CAISO data requests and PTOs and generation owners’ responses in the following manner:
1. The CAISO requests project data from PTOs and generation owners through the use of two email mailboxes:
a. PTO Model Update Request ([email protected]) – for transmission project data requests
b. GEN Model Update Request ([email protected]) – for generation project data requests
2. The CAISO requests project data by sending an email specifying the required data to the appropriate PTO or generation owner representative and including the address of a representative designated by the WECC in the “cc” line of the distribution list for the message.
Version 7 Last Revised: October 30, 2014 May 29, 2015 Page 90
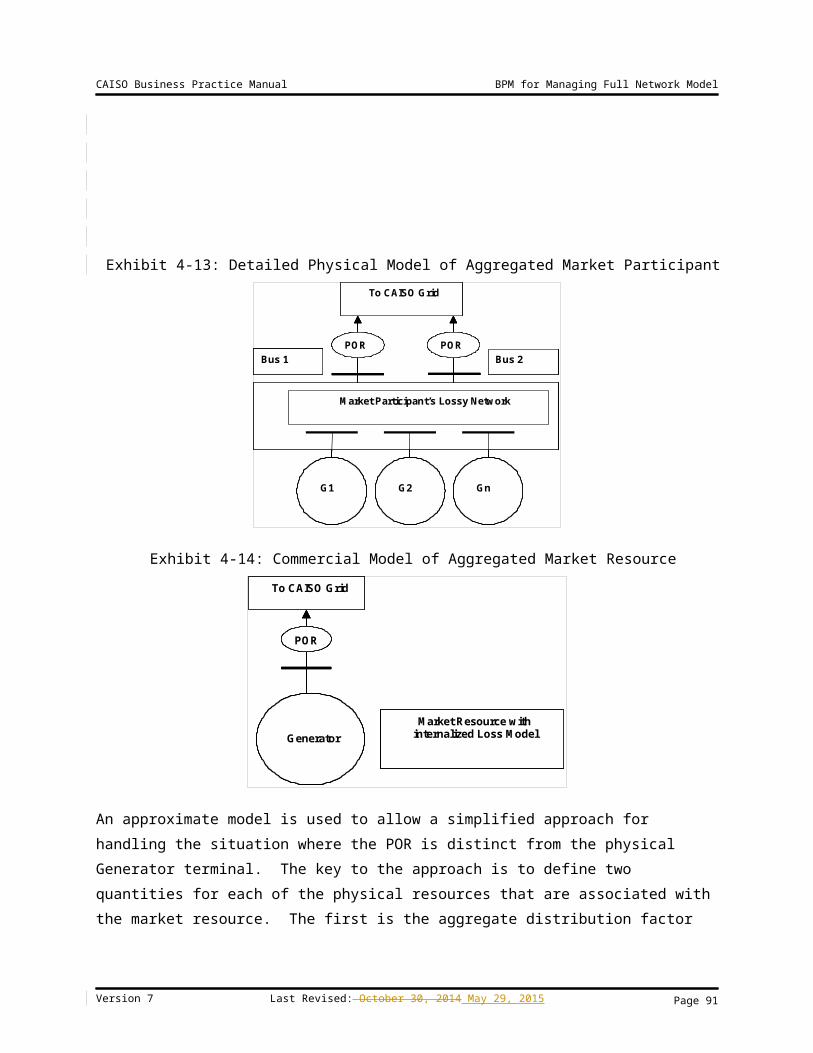
[a.] WECC Model Update address – [email protected]@peakrc.com
3. The PTO or generation owner representative responds to the CAISO request using the ‘Reply All’ email function, which will include the WECC representative.
The WECC will contact PTO and Generation owner representatives directly for any clarification concerning the response and include the CAISO by adding the appropriate PTO model or GEN model update request email address in the “cc” line.
5.1.3 Finalize FNM Scope and Update & Test FNM
Within six (6) months, data and information should be provided to the CAISO, which will then establish a final FNM update scope. Facilities for which adequate and complete information cannot be provided by the Market Participants in a timely manner will be excluded from the next update of the FNM. This may preclude facilities from being interconnected to the grid or participating in the market according to the facility owner’s desired schedule. This may also impact the overall solutions derived from the FNM or may limit approvals for outage requests. It is imperative and essential that Market Participants make full and complete data and information available to the CAISO, sufficiently in advance (6 months at a minimum) of the time that the Market Participant expects to interconnect or remove project facilities to or from the grid. See discussion of timing in the following sections.
Based on the final FNM update scope, the CAISO begins the process to update the various facets of the FNM (e.g., “wires” model, market data bases, etc.) and to test the new FNM in the CAISO’s various operating environments. Depending on the nature and complexity of the FNM changes, the maintenance and update process may include a market simulation test involving the Market Participants.
5.1.4 Test Bid Preparation and Market Simulation
This step in the process includes the actions needed to generate the test bids required for developing and testing new Full Network Model including a market simulation test if required by the changes included in the scope of the FNM update.
The test bids are required to be generated for all market resources including Generators, Non-Participating Loads, Proxy Demand Resources, Interties, resources in external Balancing Authority Area, etc. The test bids are stored in a repository for future reference and new model testing. For the internal integration test, CAISO will prepare market bids for IFM/RTM applications. For the market simulation, it will be prepared by Market Participants who will participate in the market simulation. The purpose of the market simulation is to test the CAISO
Version 7 Last Revised: October 30, 2014 May 29, 2015 Page 91
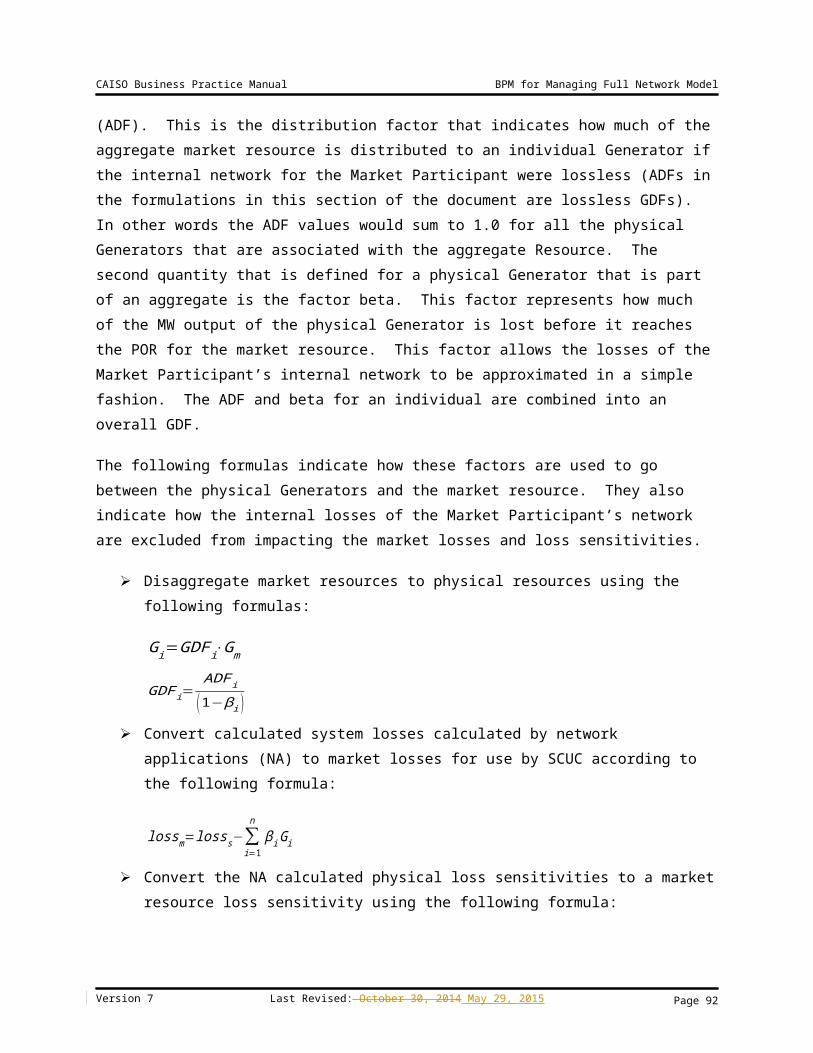
market software applications and market participants’ software applications to be able to accomplish the changes of the Full Network Model release.
5.1.5 Production Promotion and Timing
After successful system testing including testing of all necessary CAISO systems as well as Market Participant systems if required by the scope of the FNM update, a coordination process will be used to plan and implement the promotion of the new production versions to the production systems for the EMS System, Network Application, and Model & Contract Implementation, Network Model as well as Market Participants systems.
5.1.6 Updates of FNM and Time Frame
The FNM maintenance and update process will occur on a periodic basis. The time associated with each periodic update will vary based on various factors, including the complexity and nature of the updates required, the schedule for new projects connecting to or disconnecting from the grid, operating systems software updates that are also being made, the level and nature of FNM testing that must be performed, and other factors which can only be assessed immediately prior to each update cycle. It is anticipated that most periodic updates to the FNM will occur on a 30-60 day cycle; however, some periodic updates may involve longer time intervals. The time variability of the update process underscores the necessity and requirement for Market Participants to provide the CAISO with full and complete data and information well in advance of the time that the Market Participant expects its new or modified facilities to connect to or disconnect from the grid. The CAISO is not responsible for delays in beginning market participation or for incompleteness or incorrectness based on the failure of Market Participants to enter all facility additions or changes into RIMS and the CAISO Register or to make full and complete data and information available to the CAISO on the schedule required by the CAISO.
5.1.7 Notification to CAISO of New Equipment Release, Re-rated equipment, or Existing Equipment Removal
When an outage will result in the release of new transmission equipment for service, the removal of transmission equipment from service, or re-rating of equipment, the Market Participant will clearly identify in the CAISO outage management system outage request submitted to the CAISO the specific CAISO operated equipment that will be changed during the outage. Failure to supply this information will delay the inclusion of new/modified equipment in the FNM, resulting in potential impact to LMPs. The Market Participant should identify the equipment to be changed using the template below and should insert the completed template into the CAISO outage management system outage request. The completed template should contain the following information, as applicable: the Market Participant’s unique project number for the work to be done during the outage, as required in the CAISO RIMS application; the
Version 7 Last Revised: October 30, 2014 May 29, 2015 Page 92
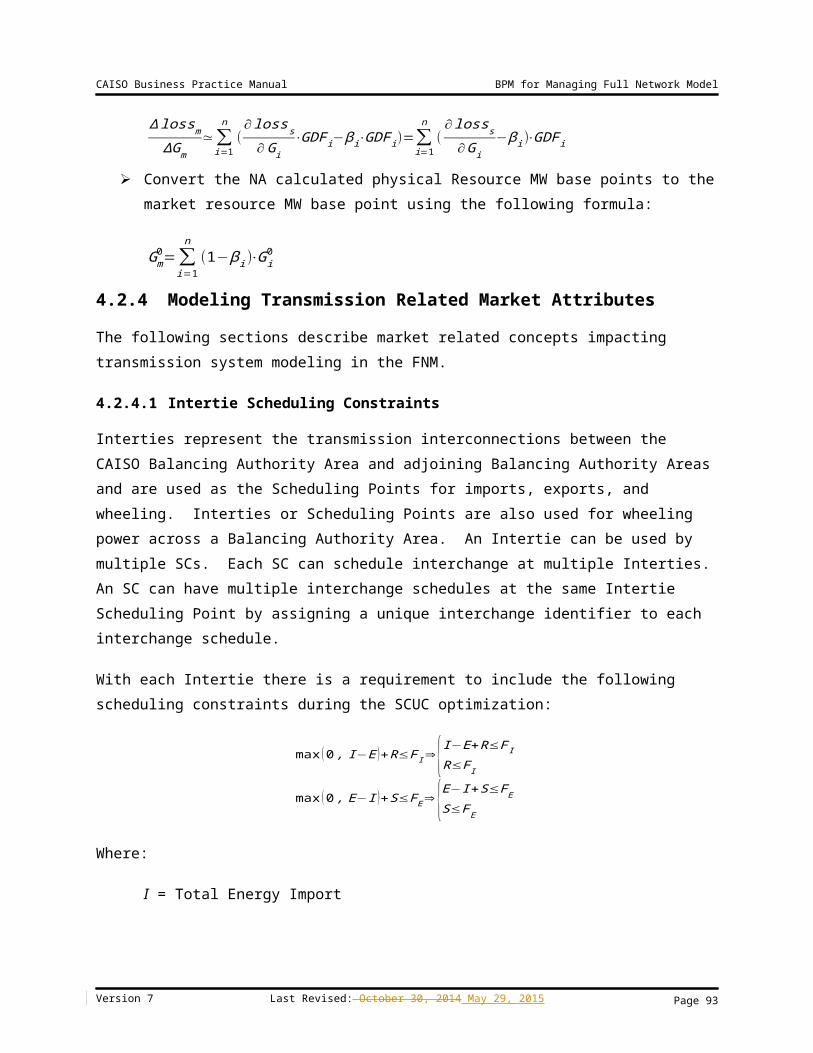
specific identification of all new equipment to be placed in service affecting power flow on the CAISO grid (including but not limited to circuit breakers, disconnect switches, transformers, and re-routed/re-rated transmission lines); the specific identification of all equipment being removed from service; and any qualifying notes .
TEMPLATE:
Project: (Market participant Project Number:)
New Equipment to be released for CAISO Control:
Re-rated equipment to be released for CAISO Control:
Equipment permanently removed from service:
Notes:
Example 1:
Project: Market Participant Project Number: 12345
New Equipment to be released for CAISO Control: Station “X” CB’s 122, 132; Station “X” disconnect switches 121, 123, 125, 131, 133, and 135.
Equipment permanently removed from service: Station “X” CB 112; Station “X” disconnect switches 111, 113, 115, 117, and 119.
Notes: Station “X” CB 112 replaced by CB’s 122 and 132.
Example 2:
Project: CAISO Rims Project Number: 67890
New Equipment to be released for CAISO Control: Alpha-Beta #1-230kV Line re-conductoring project completed.
Equipment permanently removed from service: None
Notes: None.
Version 7 Last Revised: October 30, 2014 May 29, 2015 Page 93
FNM Data Bases
Full Network ModelSMDM
PGI
RIMS
Master File
TransmissionRegister
OutageSystem
PSLFBasecase
Network AnalysisMarket
Application System
5.2 Data Bases Supporting the FNM Update Process This section provides a general description of the data bases utilized and updated as part of the CAISO’s process to maintain and update the FNM for use in the EMS, IFM and RTM systems. This includes the data bases which are continually maintained and updated based on data and information provided by Market Participants to the CAISO, as well as data bases that are only updated as part of each periodic FNM update cycle. Exhibit 5-2 provides an overview of the data bases utilized for the FNM maintenance and update process.
Exhibit 5-18: FNM Data Bases
5.2.1 Resource Interconnection Management System (RIMS) Data Base
The RIMS data base is used by the CAISO to track all new transmission and generation projects, or modification to existing transmission and generation facilities. For transmission projects, the input into the RIMS data base is performed by the PTOs or other transmission entities concerning additions or changes that are scheduled to be made to the transmission system. Such information includes nature of projects, specific components or phases of these
Version 7 Last Revised: October 30, 2014 May 29, 2015 Page 94
projects, and the target date for energizing and interconnecting the transmission projects or its various phases with the grid. For generation projects, the input is from generation owners and developers through their application to interconnect new or upgraded generation facilities to the grid. This includes the nature of the project and target date for interconnecting the new or modified generation facility to the grid.
Transmission projects are tracked entirely within the RIMS data base from initial reporting to the CAISO by the PTO or transmission entity through the completion and full integration of the transmission project into the FNM. Generation projects are tracked initially through the RIMS data base from the initial application through the interconnection study and approval processes. Once a generation project is approved by the CAISO for implementation, its detailed progress and implementation phases are then tracked through the Participating Generator Interconnection (PGI) data base (discussed below) through the completion of the project and full integration of the generation project in the FNM. The RIMS data base includes only summary tracking of generation projects during the implementation phase with regard to certain aspects related to update of the “wires” model portion of the FNM
Access is provided through an interface via a secure web-enabled database environment to view and make changes to CAISO RIMS data from various levels of CAISO, PTO, and Market Participant user permissions and functionality. This access is addressed in the user manuals and a screening document at: -<www.caiso.com/docs/2005/09/28/20050928175045775.html>
5.2.2 Participating Generator Interconnection (PGI) Data Base
The CAISO Tariff states that a Participating Generator is a Generator or other seller of Energy or Ancillary Services through a Scheduling Coordinator over the CAISO Controlled Grid from a Generating Unit with a rated capacity of 1 MW or greater, or from a Generating Unit with a rated capacity of from 500 kW up to 1 MW for which the Generator elects to be a Participating Generator, or from a Generating Unit providing Ancillary Services or submitting Energy Bids through an aggregation arrangement approved by the CAISO, which has undertaken to be bound by the terms of the CAISO Tariff, in the case of a Generator through a Participating Generator Agreement, Net Scheduled PGA, or Pseudo-Tie Participating Generator Agreement. It includes the following information and data for the new participating generation. It will be critical for the Market Participants to review all documents and fill in all required data and information in order to keep the CAISO FNM process up to date.
Forms
Information Request Sheet: PGA
Information Request Sheet: QF Participating Generator Agreement (PGA)
Version 7 Last Revised: October 30, 2014 May 29, 2015 Page 95
Information Request Sheet: MSA/ISOME
Participating Generator Agreement and schedules
Qualifying Facility Participating Generator Agreement (QF PGA) and schedules
Metering System Agreement for ISO Metered Entities (MSA/ISOME) and schedules
Resource Data Template
Application Access Request/Change Form
Contracts
Participating Generator Agreement
Meter Service Agreement for ISO Metered Entities
Qualifying Facility Participating Generator Agreement
Certification Technical Information
ISO Generator Interconnection Manual (GIM)
ADS Technical Information
CA ISO Connected Entity Service Guide Version 2.0
Metering Guidelines
Guidelines for Metering Certification of prospective ISO Metered Entities that wish to participate in the California ISO Markets. These guidelines complement, but do not replace, Metering Protocols and Tariff.
The following link provides access to the California ISO Generator Interconnection Manual
<http://www.caiso.com/participate/Pages/Generation/Default.aspx>
5.2.3 CAISO Register
CAISO maintains the CAISO Register of all transmission lines, associated facilities, and other necessary components that are at the relevant time being subject to the CAISO's Operational Control. In order to keep the CAISO Register current, each PTO is required by the Transmission Control Agreement (TCA) Section 4.2.3 to submit a change for each addition or
Version 7 Last Revised: October 30, 2014 May 29, 2015 Page 96
removal of a transmission line or associated facility or Entitlement from the ISO's Operational Control or any change in a transmission line or associated facility's ownership, rating, or the identity of the responsible PTO. The CAISO Register discloses for each transmission line and associated facility the following information:
Identity of the PTO responsible for operation and maintenance and its owners (if other than the PTO)
Dates which the ISO assumed or relinquished Operational Control
Date of any change in the identity of the PTO responsible for its operation and maintenance or in the identity of its owner and
Applicable rating(s)
Additions or removals of transmission lines, associated facilities, and Entitlements prior to becoming under or being removed from the ISO’s Operational Control and increases in the rating limits of lines, transformers, series capacitors, series reactors, and other dynamically determined facilities that are approved by the CAISO and registered in the CAISO Register will be added to the next model build of the current production model, as described in Section 5.1.6 if they are entered into RIMS and CAISO Register 120 days before they are operational under the new change. The timing of the addition will depend on when the CAISO receives the updated information or increased rating relative to the status of the model build process.
Decreases in the rating limits of lines, transformers, series capacitors, series reactors, and other dynamically determined facilities that are approved by the CAISO and registered in the CAISO Register will also follow the model build process. However a parallel earlier entry of these derates into the EMS and Market models will be expedited by the Outage Coordination Office by the end of the next business day.
The CAISO Register also allows PTO and CAISO administrators of the register to group and share transmission components to assist in finding limiting components.
Access provided through an interface via a secure Web-enabled database environment to view and make changes to CAISO Register data from various levels of CAISO, PTO, and Market Participant user permissions and functionality is addressed in the user manuals and a screening document at: -<www.caiso.com/docs/2005/09/28/200509281729045775.html>
Version 7 Last Revised: October 30, 2014 May 29, 2015 Page 97
For reference, the Transmission Control Agreement (TCA) can be found at the following CAISO web link:
< http://www.caiso.com/Documents/TransmissionControlAgreement.pdf>
The WECC Power Flow Model, which forms the basis of the FNM topology model, is available for the following portions of the FNM:
Base Case data for the non-CAISO Balancing Authority Area system represented in the FNM (e.g., IBAA)
5.2.4 Outage System
The CAISO outage management system is used by Market generator and transmission owners to provide the CASIO with the latest schedule information for their generation and transmission equipment. The process used is described in the BPM for Outage Management and additional information on the CAISO outage management system is available at the following link:
<http://www.caiso.com/docs/2005/10/28/200510281047542112.html>
Outage information is provided to the CAISO using the CAISO outage management system; however, outages will not be included in an FNM release version until the outage has been approved by the CAISO. Regarding the timing of changes to the FNM, all known approved transmission line outages or generator outages are updated in the FNM before the IFM and RTM open.
5.2.5 Master File
The Master File is the data repository used for many applications at the CAISO including data that describes generators connected to the CAISO grid. This data base must be updated to reflect changes necessary for the FNM to accurately reflect the grid and the generators connected to the grid. The Resource Data Template (RDT) is used to update the Master File data base for data that pertains to new or existing generators. The RDT is described below in Section 5.4.
5.2.6 SMDM Process
SMDM is the market data used for the IFM/RTM. The Supplemental Market Data Management (SMDM) is key input for developing the Full Network Model.
The main constituents of SMDM are:
Version 7 Last Revised: October 30, 2014 May 29, 2015 Page 98
1. Interface information with other Balancing Authority Areas apart from CAISO Balancing Authority Area
2. Transmission Interface definition
3. Nomograms
4. Exception List - This list of generators/participants which need to be monitored but not enforced
5. Constraints List - This list contains the technical / commercial constraints with the transformers / generators within the network which need to be monitored and enforced from CAISO
6. Ancillary Services Definition - This contains the definitions of regions to maintain the source/Demand balance of the electric system within reliability constraints for the Integrated Forward Market (IFM) and Real-Time Market (RTM). There are currently following regions involved-
a. NP15 & Ties
b. ZP26 & Ties
c. SP15 & Ties
d. ISO (NP15+ZP26+SP15 + All Ties)
e. Only Ties
5.3 Market Participant Data RequirementsThis section describes the data and process that is expected from the Market Participants to support the FNM. This data includes topology information from transmission owners, Generating Unit characteristics from Generators, Load Distribution Factors for Custom Load Aggregation, Generation Distribution Factors for aggregation of Generating Units, etc.
5.3.1 Power System Components
The network model is a mathematical representation of the physical components, which comprise the power system. The network model includes representations for major power system components including Loads, Generating Units, and Transmission Elements (i.e., transmission lines, transformers, and shunt and series compensators). A description of each of
Version 7 Last Revised: October 30, 2014 May 29, 2015 Page 99
these major components as represented in the network model and the data required are noted in the sub-items below.
5.3.1.1 Loads
In the network model, a Load is the representation of each physical take-out point from the high voltage network represented. Loads may thus represent, for example, each distribution step-down transformer from the high voltage network through which power and Energy ultimately flows on the way to the end-use consumer. Or, in the case where a lower voltage equivalent distribution bus needs to be represented, the Load represents the total of the consumer load (plus distribution system losses) load fed from that bus.
For network modeling, CAISO needs to know the physical configuration of the system, the number of physical load take-out points, and the maximum real (expressed in MW) and reactive (expressed in MVAr) demand which would be served through each physical take-out point. The physical configuration and the number of take-out points is normally derived from the system one-line diagrams provided by the PTOs or other interconnected entities (e.g., MSSs, UDCs, IBAAs, etc.). Where the auxiliary loads associated with Generating Units need to be represented in the network model, such information comes from one-line diagrams provided to CAISO by Participating Generators.
5.3.1.2 Generating Units
In the network model, a Generating Unit may represent a single, physical Generating or Pump Unit or a collection of smaller Generating or Pump Units, which connect to the grid through a common point of interconnection. The representation employed depends on many factors including the size and make-up of the Generating or Pump Unit, and the real time telemetry which is available for use in the reliability model. CAISO makes the determination of how Generating and Pump Units are represented based on data, one-line diagrams, and other information provided.
For each Generating or Pump Unit represented in the network model, CAISO needs the following information:
Base rating of the unit (expressed in MVA)
Base voltage rating of unit (expressed in kV)
Maximum, designed, gross real power output capability (expressed in MW)
Maximum, designed, gross reactive power output capability (expressed in MVar)
Version 7 Last Revised: October 30, 2014 May 29, 2015 Page 100
Maximum, designed, gross reactive power absorption capability (expressed in MVar)
Generating Unit data is provided by the Generator in the case of Participating Generators and MSSs, and from the PTOs, UDCs or adjoining interconnected entities in the case of non-Participating Generators.
5.3.1.3 Transmission Elements
Transmission elements in the network model include transmission lines, cable circuits, transformers, and series and shunt compensation devices. For network modeling, CAISO needs to know the electrical parameters for each element. For transmission lines the parameters needed include the base MVA and voltage ratings, resistance, reactance, shunt susceptance, and normal and emergency capability expressed in MVA. For transformers, the parameters needed include base MVA rating, rated winding voltages, resistance, reactance, tap information, and normal and emergency capability expressed in MVA. For series compensators, the parameters needed include base MVA and voltage, reactance, and normal and emergency capability expressed in MVA. For shunt compensators, the parameters needed include the base MVA and voltage ratings, and reactive capability expressed in MVAr. The parametric data for the various transmission elements is normally derived from impedance diagrams, equipment test reports or other data streams provided by the PTOs or other interconnected entities (e.g., MSSs, UDCs, IBAAs, etc.). For step-up transformers associated with Participating Generating Units, such information comes from one-line diagrams or technical data provided to CAISO by the Participating Generators.
5.3.2 Generator and Transmission Outages and Derates
Generation and transmission outage data is provided to the CAISO through the CAISO outage management system. In accordance with CAISO Tariff Sections 9 through 9.6. The data provided includes long-range planning data (for periods 6 days through 15 months) as well as outage information for short-range outage coordination to include the current operating day through 45 days out. Providing CAISO with outage information well in advance is imperative to maintaining an accurate FNM. New and upgraded system facilities with phased-in service dates for equipment need to be communicated in the outage card allowing the FNM and operator displays to reflect the modified system operating conditions. The data and processes used to update generation and transmission outage information are described in the CAISO Outage Management BPM, which can be accessed at the following link:
<http://bpmcm.caiso.com/Pages/BPMDetails.aspx?BPM=Outage Management>
Version 7 Last Revised: October 30, 2014 May 29, 2015 Page 101
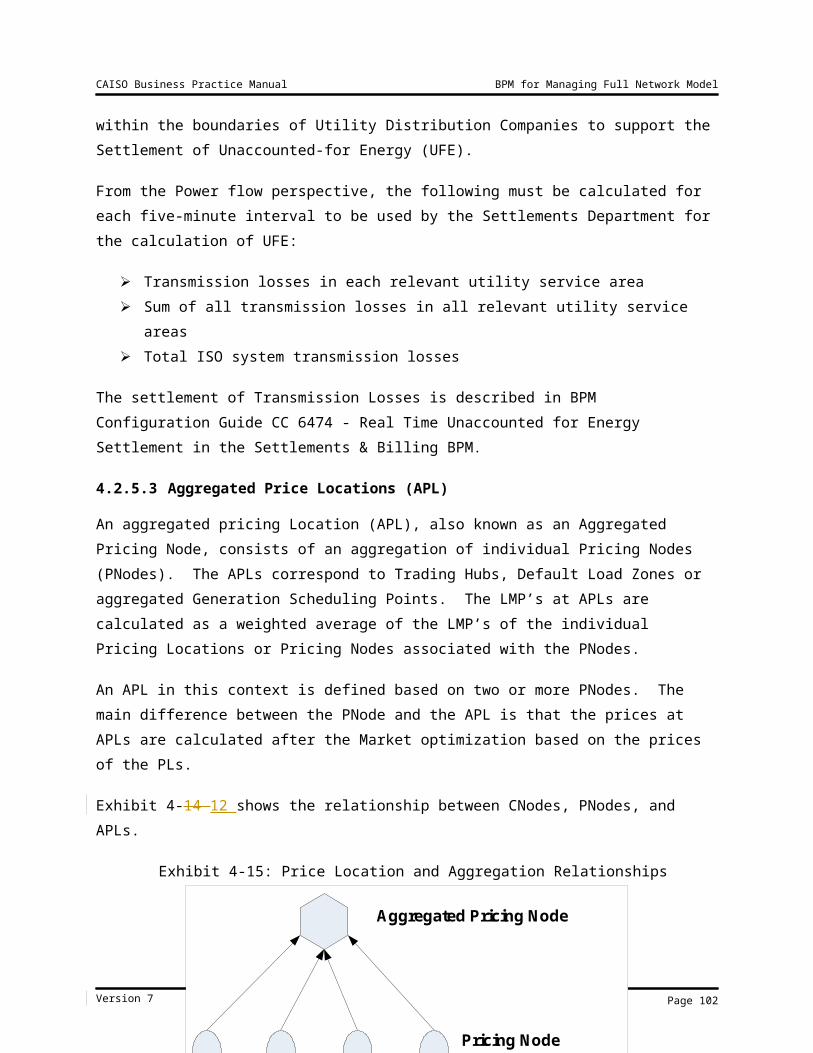
5.3.3 Real-Time Telemetry
As changes are made to the network, new generators are connected to the grid, or changes are made to existing SCADA points, facilities owners must provide the CAISO data required to properly incorporate those changes in the CAISO EMS system to ensure the SCADA points are processed properly and are used properly in downstream software applications (e.g. alarming, state estimation, etc.). The process used by facility owners to provide updates for their SCADA points will be described in a future update of this BPM.
5.4 Data Update and Submittal for Market ApplicationsThe data related to market applications is submitted through the RDT (Resource Data Template, MS Excel format) process. The RDT update process is described in the following sections. Details regarding the information contained in the RDT are described in the Market Instruments BPM which includes Attachment B, titled “Master File Update Procedures”. Attachment B provides both a list of the specific data elements and a description of each.
5.4.1 Generation RDT
The generator RDT data is necessary to be used in various market applications, such as SIBR, IFM, RTN, etc. Each Scheduling Coordinator will retrieve RDTs from the Market Participant Portal, review the data for accuracy, and provide updates as needed. CAISO will validate and approve the data for use by the various CAISO market applications. CAISO expects that the average change submitted will be reflected in the Master File for use by the FNM within 5 to 11 days. The process will conclude with a notice to the affected Scheduling Coordinator regarding the status of the requested change and its effectiveness.
5.4.2 System Resource RDT
Information for System Resources, also known as Intertie resources, are collected separately on the Intertie RDT under the same process used for the Generator RDT.
Version 7 Last Revised: October 30, 2014 May 29, 2015 Page 102
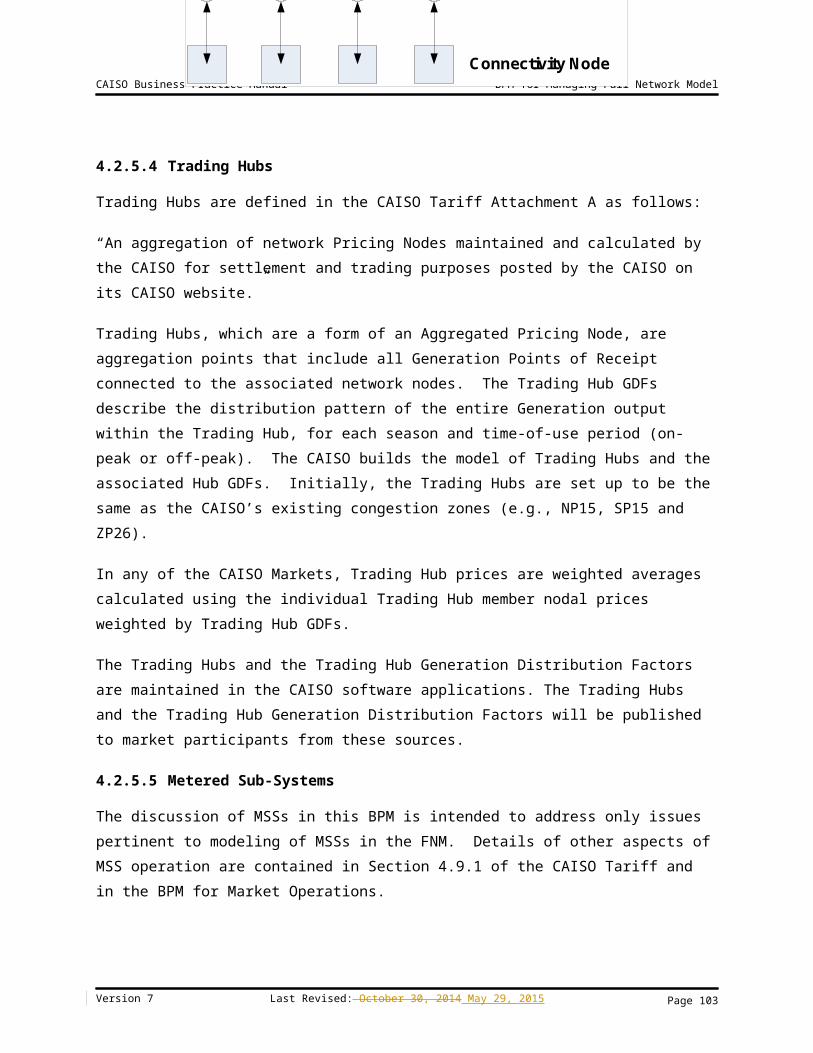
Appendix to Business Practice Manual forManaging Full Network Model
Implementation ofSacramento Municipal Utilities District and
Turlock Irrigation District Balancing Authority Areas asIntegrated Balancing Authority Areas
1. Introduction
As provided in Section 27.5.3 of the CAISO Tariff and in Section 4.2.6 of the BPM for FNM, a key feature of the CAISO Markets for enhancing reliability and increasing the efficient utilization of its CAISO Controlled Grid facilities is the development and application of a detailed and accurate Full Network Model (“FNM”), including the modeling of other Balancing Authority Areas that most directly impact the CAISO’s Congestion Management such as Integrated Balancing Authority Areas (IBAA). This appendix describes the methodology for modeling the SMUD-TID IBAA. Information specific to the SMUD-TID IBAA is also available in the CAISO Tariff available on the CAISO website.
2. Modeling Approach
The modeling approach described herein recognizes the flow interactions that occur between the CAISO and the SMUD-TID IBAA networks by relying on a limited but readily available set of information that is provided by base case power flow models available on the WECC web site.
This approach represents and recognizes the interconnections and associated intertie constraints with the CAISO to address the impacts of parallel flows in the Day-Ahead and Real-Time Markets. Under this modeling approach, rather than modeling physical resources internal to these IBAA networks, the physical sources and sinks are abstracted using individual or aggregations of System Resource injections located at dominant transmission bus locations within the IBAA network. These transmission bus locations represent the points within the IBAA network where marginal sources from remote locations feed into the high voltage grid and/or load is ultimately served via lower level distribution stations. Exhibit A-1 below presents a conceptual illustration of the SMUD-TID IBAA model. The SMUD-TID IBAA is electrically connected to the CAISO at several boundary Scheduling Points and contains generation and load resources at a number of locations. The CAISO will predefine Resource Identifiers (Resource IDs) that associate the Scheduling Points at the CAISO and IBAA boundaries with
Version 7 Last Revised: October 30, 2014 May 29, 2015 Page 103
individual or aggregate System Resources that the CAISO models as the marginal sources and sinks for the IBAA as reflected in Exhibit A-1 below.37
Aggregated System Resource
Definitions and IDFs
BusIntertie
Distribution Factor
SMUD Hub(Exports from
CAISO)
37005_ELVERTAS 230kV 0.2337010_HURLEY S 230kV 0.3437012_LAKE 230kV 0.23
37016_RNCHSECO 230kV 0.20Captain Jack
Intertie(Imports to
CAISO)45035_CAPTJACK500kV 1.00
Exhibit A-1: Definition of System Resource Aggregations for SMUD-TID IBAA
The default pricing location for import Schedules to the CAISO from the SMUD-TID IBAA is mapped back to the Captain Jack intertie. The default pricing location for export Schedules from the CAISO to the SMUD-TID IBAA are mapped to the “SMUD Hub”, using predetermined Intertie Distribution Factors to aggregated System Resources. The CAISO calculated these Intertie Distribution Factors based on a WECC seasonal power flow base case study. These System Resources are among the locations that the CAISO uses in the Real-Time Market to approximate the actual sources of flows that affect the CAISO and SMUD-TID boundary.38 The
37 Resource IDs will be established that map each IBAA transmission owner’s Scheduling Points to the default System Resources.
38 The Intertie Distribution Factors in Exhibit A-1 have been developed from the WECC seasonal power flow base case model using a technique that has been discussed in meetings between the CAISO and the IBAA operators, using Power Technologies, Inc., Power System Simulator for Engineering (PSS/E) version 29. After editing the WECC power flow case to recognize the buses for the IBAA as a separate Balancing Authority Area, the technique consists of the following steps, for the limited purpose of computing the Intertie Distribution Factors, as follows:
1. For the hubs representing exports from the CAISO, including the SMUD Hub that represents the SMUD IBAA as a whole, the IBAA is equivalenced to retain and count load only at the buses that comprise the Sys-tem Resources, with all generation also being retained at its buses. The resulting load distribution among these buses within each aggregated System Resource defines the Intertie Distribution Factors for exports from the CAISO.
2. For purposes of the hubs representing imports to the CAISO, the IBAA is then equivalenced to only the buses that comprise the System Resources, but this time with no generation being retained. Starting from the assignment of load only to the buses that comprise the aggregated System Resource, the difference in
Version 7 Last Revised: October 30, 2014 May 29, 2015 Page 104
CAISO will establish Resource IDs for each combination of Scheduling Points and individual or aggregate System Resources that is being scheduled. Multiple Resource IDs may exist in the CAISO Markets at each intertie Scheduling Point, and each will be mapped to a predefined set of System Resources. These Scheduling Points are listed in Exhibit A-2 below, and are further illustrated in Exhibit A-1. Exhibit A-2 includes a typical value of the capacity of each intertie Scheduling Point, which is a limit on the total energy and ancillary service capacity that can be scheduled at each intertie, regardless of the total physical flow in the network. If import or export Bids that are submitted in the market exceed the scheduling capacity of their individual Scheduling Points, the CAISO is unable to accept the Bids that would exceed its capacity. In this event, Bids for use of that Scheduling Point must be used to adjust the Schedules within the scheduling capacity, which is a different type of constraint than flow limits based on the modeled source or sink of the Schedules. As a result of these scheduling limits at the Interties, LMPs for imports or exports may diverge based on constraints at Scheduling Points between the SMUD-TID IBAA and CAISO Balancing Authority Area.
Exhibit A-2: Scheduling Points for SMUD-TID IBAA
3. IBAA Pricing and Settlement Approach
The CAISO’s pricing and settlement approach aligns the settlement of transactions with the operational modeling of the SMUD-TID IBAA, by pricing transactions based on a single or aggregate locational price that uses the same location(s) where the transactions are being sourced or sunk within the IBAA, as shown in Exhibit A-1 above.
load at the retained buses after it is netted with generation, relative to step 1, defines the Intertie Distribution Factors for imports to the CAISO.
Version 7 Last Revised: October 30, 2014 May 29, 2015
Current Scheduling Point X-RefSCHEDULING
POINT (TNAME) BRANCH_GROUP GROUP_TYPE ITC GROUP_TYPE EXP_MW_RATING IMP_MW_RATING COMMENTSCTNWDW_2_CTTNWD CTW230 CTNWDRDMT_BG BG CTNWDRDMT_ITC ITC 320 320CTNWDW_2_RNDMTN RDM230 CTNWDWAPA_BG BG CTNWDWAPA_ITC ITC 1594 1594
LAKE_2_GOLDHL LAKERANCHO_2_BELOTA RACHOSECOOAKTID_1_OAKCSF OAKDALE OAKDL_BG BG OAKDL_ITC ITC 246 246
LLNL_1_TESLA LLL115 LLNLTESLA_BG BG LLNLTESLA_ITC ITC 164 164
NEW TRCYCOTPISO COTPISO_MSL BG COTPISO_ITC ITC 33 33
NEW MSL and ITC covering just CAISO portion of COTP
TRACY5_5_COTP TRCYCOTP COTP_MSL BG COTP_ITC ITC 1567 1567TRACY5_5_PGAE TRCYPGAE TRACYPGAE_BG BG TRACYPGAE_ITC ITC 4388 4388TRCYPP_2_TESLA TESLA230 TRACYPSDO_BG BG TRACYPSDO_ITC ITC 396 396
WESTLY_2_LOSBNS WESTLYLBNS LSBNSWESTLY_BG BG LSBNSWESTLY_ITC ITC 637 637WESTLY_2_TESLA WESTLYTSLA TSLAWESTLY_BG BG TSLAWESTLY_ITC ITC 637 637
STNDFD_1_STNCSF STANDIFORD STNDFD_BG BG STNDFD_ITC ITC 306 306
N/A N/A TRACYHRDLN_BG BG N/A N/A 73 73No ITC needed since not a scheduling location.
1271 1271RNCHLAKE_BG BG RNCHLAKE_ITC ITC
Page 105
For import schedules to the CAISO Balancing Authority Area that use the southern terminus of the California-Oregon Transmission Project (COTP) at the Tracy substation and pay the Western Area Power Administration (Western) or Transmission Agency of Northern California (TANC) for line losses, the CAISO will replace the marginal cost of losses of the applicable default LMP that applies to such IBAA transactions. Scheduling Coordinators (SCs) need to establish system resource IDs to submit bids, including self-schedules, to establish schedules that are eligible for this loss adjustment consistent with the CAISO Tariff. Prior to obtaining these system resource IDs, SCs need to certify to use these IDs for bids, including self-schedules, that only originate from transactions that use the COTP and pay Western or TANC for losses. A self-certification form is available on the CAISO website: http://www.caiso.com/docs/2005/10/05/2005100520241822328.html. By actually using such system resource IDs, the SC represents that covered transactions use the COTP and pay Western or TANC for line losses. Schedules and dispatches settled under such resource IDs shall be subject to a default IBAA LMP for imports that accounts for the marginal cost of losses as if an actual physical generation facility exists at the southern terminus of COTP at the 500 kV Tracy scheduling point rather than the marginal cost of losses specified in CAISO Tariff Section 27.5.3.
Version 7 Last Revised: October 30, 2014 May 29, 2015 Page 106