clean development mechanism project design document form (cdm … · 2015-10-07 · clean...
TRANSCRIPT

PROJECT DESIGN DOCUMENT FORM (CDM-SSC-PDD) - Version 03
CDM – Executive Board
1
CLEAN DEVELOPMENT MECHANISM
PROJECT DESIGN DOCUMENT FORM (CDM-SSC-PDD)
Version 03 - in effect as of: 22 December 2006
CONTENTS
A. General description of the small scale project activity
B. Application of a baseline and monitoring methodology
C. Duration of the project activity / crediting period
D. Environmental impacts
E. Stakeholders’ comments
Annexes
Annex 1: Contact information on participants in the proposed small scale project activity
Annex 2: Information regarding public funding
Annex 3: Baseline information
Annex 4: Monitoring Information

PROJECT DESIGN DOCUMENT FORM (CDM-SSC-PDD) - Version 03
CDM – Executive Board
2
Revision history of this document
Version
Number
Date Description and reason of revision
01 21 January
2003
Initial adoption
02 8 July 2005 • The Board agreed to revise the CDM SSC PDD to reflect
guidance and clarifications provided by the Board since
version 01 of this document.
• As a consequence, the guidelines for completing CDM SSC
PDD have been revised accordingly to version 2. The latest
version can be found at
<http://cdm.unfccc.int/Reference/Documents>.
03 22 December
2006 • The Board agreed to revise the CDM project design
document for small-scale activities (CDM-SSC-PDD), taking
into account CDM-PDD and CDM-NM.

PROJECT DESIGN DOCUMENT FORM (CDM-SSC-PDD) - Version 03
CDM – Executive Board
3
SECTION A. General description of small-scale project activity
A.1 Title of the small-scale project activity:
>>
The title of the project: Yuliangwan Small Hydroelectric Project (YSHP), Hunan Province, China
Version: 03
Date of Submission: 20/06/2007
A.2. Description of the small-scale project activity:
>>
Yuliangwan Small Hydroelectric Project (hereinafter referred to as “the project’) is a low head
hydropower project, is located in Hongjiang District of Huaihua City, Hunan Province, P.R.China. The
project construction commenced in December 2004. The total installed capacity of the project is 8 MW (4
MW×2) with annual net generated electricity of 32819.1 MWh. The surface area1 at full reservoir level of
the project is 697,000 m2, thus the power density of the proposed project is 11.48 W/m2. The generated
electricity of the project will be delivered to the regional power grid, i.e. Central China Power Grid
(CCPG).
The purpose of the project is to generate electricity by using Wushui River water resources to alleviate
electricity shortage in Central China. The project will contribute to the reduction of GHG emission by
displacing part of the electricity from the fossil fuel fired power plants of the CCPG, and the expected
annual GHG emission reductions over the first crediting period is 31,216 tCO2e/yr, which will contribute
to alleviation of climate change. In addition, the project will be beneficial to:
(a) The project will provide clean electricity to CCPG. The project activity can increase temporary and
permanent employment opportunities for local residents during construction and operation of the project,
which will increase income of the local residents. It is helpful to local socio-economic development.
(b) The project developer will construct roads around the reservoir area and other traffic infrastructure,
which will be greatly convenient for local residents and will ultimately promote the local transportation
business development.
(c) During operation period of the project, it will pay lots of tax to local government, which will promote
local economic development.
A.3. Project participants:
>>
1 Proof document: Huaihua Institute of Hydraulic and Electric Engineering Reconnaissance Design&Research

PROJECT DESIGN DOCUMENT FORM (CDM-SSC-PDD) - Version 03
CDM – Executive Board
4
Name of Party involved (*)
((host) indicates a host Party) Private and/or public entity(ies) project
participants (*) (as applicable)
Kindly indicate if the
Party involved wishes to
be considered as project
participant (Yes/No)
People’s Republic of China
(Host)
Yuliangwan Hydropower of Hongjiang District
Co., Ltd. No
Sweden Carbon Asset Management Sweden AB No
(*) In accordance with the CDM modalities and procedures, at the time of making the CDM-PDD public
at the stage of validation, a Party involved may or may not have provided its approval. At the time of
requesting registration, the approval by the Party(ies) involved is required.
Host country: People’s Republic of China. P.R. China approved the Kyoto Protocol to the United
Nations Framework Convention on Climate Change on 30 August 2002, and is a Party to the Kyoto
Protocol. The Designated National Authority (DNA) of P. R. China is the National Development and
Reform Commission (NDRC).
Project owner: Yuliangwan Hydropower of Hongjiang District Co., Ltd is a private joint-stock
company, which business scope is mainly on hydropower station project.
Purchaser: Carbon Asset Management Sweden AB is a part of Tricorona AB which is a Swedish
company listed on the Stockholm Stock Exchange since 1989. Sweden has ratified the Kyoto Protocol to
the United Nations Framework Convention on Climate Change on May 31, 2002.
Please refer to Annex 1 for more detailed information.
A.4. Technical description of the small-scale project activity:
A.4.1. Location of the small-scale project activity:
>>
A.4.1.1. Host Party(ies):
>>
People’s Republic of China (Host)
A.4.1.2. Region/State/Province etc.:
>>
Hunan Province
A.4.1.3. City/Town/Community etc:
>>
PROJECT DESIGN DOCUMENT FORM (CDM-SSC-PDD) - Version 03
CDM – Executive Board
5
Hongjiang District, Huaihua City
A.4.1.4. Details of physical location, including information allowing the
unique identification of this small-scale project activity :
>>
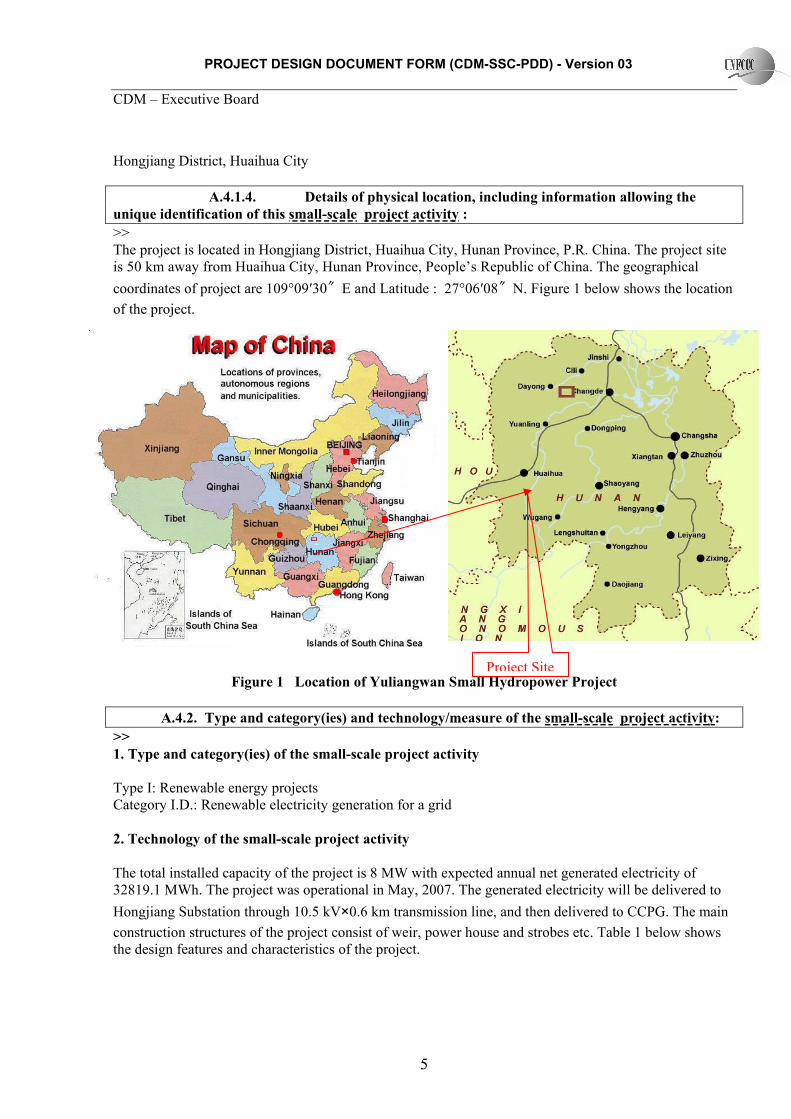
The project is located in Hongjiang District, Huaihua City, Hunan Province, P.R. China. The project site
is 50 km away from Huaihua City, Hunan Province, People’s Republic of China. The geographical
coordinates of project are 109°09′30〞E and Latitude : 27°06′08〞N. Figure 1 below shows the location
of the project.
Figure 1 Location of Yuliangwan Small Hydropower Project
A.4.2. Type and category(ies) and technology/measure of the small-scale project activity:
>>
1. Type and category(ies) of the small-scale project activity
Type I: Renewable energy projects
Category I.D.: Renewable electricity generation for a grid
2. Technology of the small-scale project activity
The total installed capacity of the project is 8 MW with expected annual net generated electricity of
32819.1 MWh. The project was operational in May, 2007. The generated electricity will be delivered to
Hongjiang Substation through 10.5 kV×0.6 km transmission line, and then delivered to CCPG. The main
construction structures of the project consist of weir, power house and strobes etc. Table 1 below shows
the design features and characteristics of the project.
N N
Project Site

PROJECT DESIGN DOCUMENT FORM (CDM-SSC-PDD) - Version 03
CDM – Executive Board
6
Table 1 Design features and characteristics of the project2
Main weir 24.1 m in height, 112 m in length
Damgate(m) 7 holes, 7.3×12 arc strobe Main construction
Power house size(m) 41.7×33.2×35.1
Model GZTFO8B-WP-350
Quantity 2
Rated water head 5.2 m
Rated flow rate 89.4m3/s Turbine
Manufacturer Tianjin Tianfa Hydroelectric
Equipment Plant
Model SF4000-48/3970
Quantity 2
Capacity 4000 kW
Rated voltage 10500 V
Equipment
Generator
Manufacturer Tianjin Tianfa Hydroelectric
Equipment Plant
The main equipments, such as the turbines and generators, are made in China. The manufacturers are
well-known in Chinese hydropower equipment manufacture market. The power generation technology for
the project is commonly used in China.
A.4.3 Estimated amount of emission reductions over the chosen crediting period:
>>
The ex-ante estimated amount of emission reductions over the first crediting period of the project are
listed in Table 2 below:
Table 2 Ex-ante estimation of emission reductions
Year Annual estimation of emission
reductions (tCO2e)
01/09/2007-31/08/2008 31,216
01/09/2008-31/08/2009 31,216
01/09/2009-31/08/2010 31,216
01/09/2010-31/08/2011 31,216
01/09/2011-31/08/2012 31,216
01/09/2012-31/08/2013 31,216
01/09/2013-31/08/2014 31,216
Total estimated reductions (tones of CO2e) 218,512
Total number of crediting years 7
Annual average over the crediting period of estimated
reductions (tones of CO2 e) 31,216
A.4.4. Public funding of the small-scale project activity:
2 Yuliangwan Hydropower Plant Feasibility Study Report

PROJECT DESIGN DOCUMENT FORM (CDM-SSC-PDD) - Version 03
CDM – Executive Board
7
>>
There is no public funding for this project.
A.4.5. Confirmation that the small-scale project activity is not a debundled component of a
large scale project activity:
The project participants confirm that the project is not a debundled component of a larger project activity.
There is no registered small-scale CDM project activity or an application to register another small-scale
CDM project activity:
� With the same project participants;
� In the same project category and technology/measure; and
� Registered within the previous 2 years; and
� Whose project boundary is within 1 km of the project boundary of the proposed small-scale
activity at the closest point.

PROJECT DESIGN DOCUMENT FORM (CDM-SSC-PDD) - Version 03
CDM – Executive Board
8
SECTION B. Application of a baseline and monitoring methodology
B.1. Title and reference of the approved baseline and monitoring methodology applied to the
small-scale project activity:
>>
Title of the approved baseline and monitoring methodology: AMS-I.D.-Grid connected renewable
electricity generation (Version 11, EB 31)
Reference: Appendix B of the simplified modalities and procedures for small scale CDM project
activities
Please click following link for more information about the methodology and the reference:
http://cdm.unfccc.int/methodologies/SSCmethodologies/approved.html
B.2 Justification of the choice of the project category:
>>
The project is a grid-connected renewable power generation project activities which meet all the
applicability criteria stated in methodology:
1. The project makes use of renewable water resources to supply electricity to regional power grid i.e.
CCPG, which is dominant of fossil fuel fired power plants.
2. The total installed capacity of the project is 8 MW, which satisfies the requirement that the capacity of
the project should be at most 15 MW for a small-scale CDM project.
3. The power density of the project is 11.48 W/m2, which is greater than 4 W/m2 regulated by EB rules.
Therefore, the methodology AMS.I.D is applicable to the project, and the emission from the project
reservoir can be ignored.
B.3. Description of the project boundary:
>>
According to methodology AMS I.D, renewable energy and power generation activities of the project is
the project boundary for physical and geographical places of the renewable energy projects. The
generated electricity of the project will be delivered to CCPG, which includes Henan Province, Hubei
Province, Hunan Province, Jiangxi Province, Sichuan Province and Chongqing Municipality Power Grid3.
The main emission sources and type of GHGs in project boundary are listed in Table 3 below:
Table 3 GHG emissions in project boundary
3 Chinese DNA’s Guideline of emission factors of Chinese grids

PROJECT DESIGN DOCUMENT FORM (CDM-SSC-PDD) - Version 03
CDM – Executive Board
9
Source Gas Included? Justification/Explanation
CO2 Yes Main emission source
CH4 No Excluded for simplification. This is
conservative Baseline Fuel-fired Power
Plants in CCPG
N2O No Excluded for simplification. This is
conservative
CO2 No Excluded for simplification.
CH4 No
As two projects’ power density will be
greater than 10 W/m2 respectively, the
project emission is not needed to be
calculated.
Project Activity Yuliangwan
Hydropower Plant
N2O No Excluded for simplification.
B.4. Description of baseline and its development:
>>
There are 4 realistic and credible baseline scenario alternatives identified for the project:
Alternative 1––The project activity not undertaken as CDM project activity
In this scenario the project will generate zero-emission power with renewable hydraulic energy source
and cause the emission reduction by displacing equivalent power generation from CCPG. However, the
project can not be implemented due to the investment barrier, which will be analyzed in detail in the
section of B.5.
Therefore, the alternative 1 is not a possible baseline scenario.
Alternative 2 — Construct a fossil fuel-fired power plant with equivalent annual electricity
generation
This alternative is to construct a fossil fuel-fired power plant with equivalent annual electricity generation
to the project. The average annual utilization hours of the fossil fuel plants are 5,6334 in China, which are
larger than the average annual utilization of hydropower plants. Thus, the installed capacity of the fossil
fuel-fired plants with equivalent annual electricity generation to the project will be smaller than 8 MW.
However, according to the current laws and regulations in China, the coal-fired power plants with
installed capacity of 135 MW or below are prohibited for construction in the areas covered by large
power grids5 and fuel-fired power plants with installed capacity less than 100 MW is strictly restricted for
construction6.
Therefore, the alternative 2 is not a possible baseline scenario.
Alternative 3 – Construct an alternative renewable power plant with equivalent annual electricity
4 <National Statistics Express of Power Industry in 2006>, China Electricity Council
5 General Office of the State Council [Decree No. 2002-6]: <Notice on Strictly Prohibiting the Construction of
Coal-fired Power Plants with Installed Capacity of 135 MW or Below>
6 <Temporary Stipulation of Construction & Management of Small Scale Fuel-fired Generators>, August, 1997

PROJECT DESIGN DOCUMENT FORM (CDM-SSC-PDD) - Version 03
CDM – Executive Board
10
generation
The alternative is to construct power plants using other renewable energy resources, which can generate
equivalent electricity annually to the project. However, there are not enough renewable energy resources,
such as photovoltaics, tidal/wave, wind, geothermal and renewable biomass etc., to support the
construction of power plants. It can be seen from Table A10 that there are only fuel-fired power plants
and hydropower plants in CCPG. Furthermore, due to the limitation of technology development and high
costs, constructing an alternative renewable power plant is not financially attractive.
Therefore, the alternative 3 is not a possible baseline scenario.
Alternative 4 –Equivalent annual generated electricity supplied by CCPG (continuation of current
practice)
Under this alternative, the increasing demand of electricity would be met from CCPG by increasing its
installed capacity through the possible expansion of existing power plants as well as construction of new
power plants according to the current policies and regulations in China. The installed capacity of the
CCPG has been increased for many years, and CCPG is a fuel-fired dominant power grid. So the
alternative 4 is the only realistic and credible choice.
From the analysis above, the only realistic and credible alternative for the project is:
Alternative 4 – Equivalent annual electricity supplied by CCPG
B.5. Description of how the anthropogenic emissions of GHG by sources are reduced below
those that would have occurred in the absence of the registered small-scale CDM project activity:
The approved methodology AMS-I.D prescribes the use of Attachment A to Appendix B of the simplified
modalities and procedures for small-scale CDM project activities for determining whether the project is
additional. The Attachment A asks the project owners to justify the additionality by showing that the
project activity (and so the GHG emission reduction) faced prohibitive barriers such as:
(a) Investment barrier;
(b) Technological barrier;
(c) Barrier due to prevailing practice;
(d) Other barriers.
The insurmountable barrier for the implementation of the project is investment barrier. There are three
analysis methods recommended to conduct investment analysis, including simple cost analysis (Option I),
investment comparison analysis (Option II) and benchmark analysis (Option III).
Option I: Simple cost analysis. This analysis method can be used if the project activity produces no
economic benefits other than CDM related income. However, this option is not applicable to the project
because the project activity generates the revenue from the sale of generated electricity.
Option II: Investment comparison analysis. This analysis method can be only used if the alternatives to
the project are similar investment projects. However, this option is not applicable to the project because

PROJECT DESIGN DOCUMENT FORM (CDM-SSC-PDD) - Version 03
CDM – Executive Board
11
the alternative to the proposed project is equivalent annual electricity supplied by CCPG, which is
irrelevant for the project owners to make business decision.
Option III: Benchmark analysis. According to Economic Evaluation Code for Small Hydropower
Projects7 (SL16-95) approved by Ministry of Water Resources of P. R. China, and is the most important
reference for small-scale hydropower projects (SHP) assessment in China, the financial benchmark rate of
return (after tax) for Chinese small hydropower projects (with installed capacity below 25 MW) is 10%.
The benchmark analysis is applicable to the project.
According to the Economic Evaluation Code for Small Hydropower Projects, a project will be financially
acceptable when its IRR of the total investment is better than the sectoral benchmark IRR of 10%.
Table 4 below are basic parameters for financial analysis.
Table 4 Basic parameters for financial evaluation
Parameter Unit Value Data source
Installed capacity MW 8 Feasibility Study Report
Fixed assets investment Million RMB¥ 62.61 Feasibility Study Report
Equity Million RMB¥ 21.56 Feasibility Study Report
Bank loan Million RMB¥ 41.15 Feasibility Study Report
Current funds Million RMB¥ 0.1 Feasibility Study Report
Investment horizon Year 20 SL16-95
Net electricity generation MWh 32819.1 Feasibility Study Report
Electricity tariff (VAT Incl.) RMB¥/kWh 0.28 Feasibility Study Report
VAT / 6% Feasibility Study Report
City maintenance & construction
tax and surtax for education
expenses / 4% Feasibility Study Report
Income tax % 33 Feasibility Study Report
Project lifetime Year 30 Feasibility Study Report
135.75
Calculated, from the first year
to the tenth year of operational
period O&M cost 10,000 RMB¥
86.52
Calculated, from the eleventh
year to the twentieth year of
operational period
Without CERs revenue, the NPV of the project is RMB¥-9.40 million and the project IRR is only 7.55%,
which is lower than benchmark IRR. The project is not financially attractive.
Sensitivity Analysis
7 http://apps.lib.whu.edu.cn/12/test/gfbz/2/j/xsdpj.html

PROJECT DESIGN DOCUMENT FORM (CDM-SSC-PDD) - Version 03
CDM – Executive Board
12
The sensitivity analysis is conducted to check whether, under reasonable variations in the critical
assumptions, the project IRR remain below the benchmark IRR. The main factors affecting the financial
indicators are total investment, electricity tariff and annual O&M cost, thus these three critical
assumptions are used to conduct sensitivity analysis.
Table 5 Sensitivity Analysis (IRR)
Percentage variation
Critical assumption
+10% -10%
Total investment 6.65% 8.61%
Electricity tariff (VAT Incl.) 8.59% 6.47%
Annual O&M cost 7.41% 7.70%
Sensitivity analysis of the project shows: without CERs revenue, the project IRR is lower than the
benchmark IRR even under the most advantageous circumstances, such as electricity tariff increases by
10% or total investment declines by 10%. So, the project is not financially attractive to investors.
However, with CERs revenue, the project IRR is 11.96%, which is above the benchmark IRR.
Financing barrier
The project is located in Hongjiang District, one of the poorest area in Hunan Province. Hunan is
abundant with water resources, however, the most technically and commercially attractive water
resources have already been developed in last century. The remaining are those with remote location and
weak water resources. The project is a small scale hydropower plant without regulation and reserve
function of water resources, so the power generation of the project is depended on unstable water
resources which will increase the power generation risks.
It can be found from the Yuliangwan Hydropower Plant Feasibility Study Report that the project IRR is
below the benchmark IRR. The project faced severe financing barriers. The project owner decided to
suspend the project development until solving the financing problems.
The CDM experts of Hunan Provincial Sciences Information Institute visited the project site in August
2004. The experts realized the financing barriers of the project and introduced the CDM incentive to the
project owner8. The project owner was encouraged by the news and decided to develop the project as a
CDM project. The project owner entrusted the Fangxing Accountant Office of Huaihua City to analyze
the financial indicator of the project, the results of the financial indicator shows that the project IRR is
11.98% with CERs revenue. The potential CERs revenue enhanced the shareholders’ confidence. The
project owner presented the CDM development application letter to local DRC. The Hongjiang District
Development and Reform Commission approved the CDM application letter from the project owner in
October 2004. Due to the CDM incentives, the project construction was commenced in December 2004
due to the CDM incentives.
The project owner still faced many unexpected problems during the construction period:
8 Hongjiang District Development and Reform Commission: Inspection report of CDM experts from Hunan
Provincial Sciences Information Institute, August, 2004.

PROJECT DESIGN DOCUMENT FORM (CDM-SSC-PDD) - Version 03
CDM – Executive Board
13
1. The main financial revenue for Hongjiang District is the tourism industry. In order to be compatible
with the development of tourism of Hongjiang District, the project owner had to abandon the weir site
with good economic efficiency and geological conditions. As a result, the change of weir site caused
additional investment by RMB¥ 6.96 million9.
2. As national policy is adjusted, the increased land compensation standard caused additional investment
by RMB¥ 1.5 million10.
3. In order to improve the traffic infrastructure of the project site, the project owner constructed a
highway bridge over the weir and strengthened the roads beside the river banks. It caused additional
investment of RMB¥ 1.8 million11.
4. The increasing prices of raw materials, labour force, installation of electric machinery equipments
caused additional investment by RMB¥ 9.17 million12.
The sum of above-mentioned additional investment accounted for 31% of planned fixed assets investment.
The additional investment will lead to a much lower IRR when does not take into account of CERs
revenue. The project owner sought support from Local DRC and Hunan CDM Project Service Centre in
2006. With their assistances, the project owner signed the Emission Reductions Purchase Agreement
(ERPA) with foreign CERs purchaser. The CDM development got sustantial progress. The project owner
applied for bank loan from local Construction Bank after subscription of ERPA, the bank approved the
bank loan since they considered the CERs revenue could enhance the bank loan repayment ability from
project owners.
Conclusion
Without CERs revenue, the project owner would not be able to develop the project. Therefore, the project
is additional and it does not belong to conventional practice.
B.6. Emission reductions:
B.6.1. Explanation of methodological choices:
>>
Project Emissions
The proposed project is a new small scale hydropower station, the power density is 11.48 W/m2, greater
than 10 W/m2, thus PEy=0
9 Proof document: Institute of Hydraulic and Electric Engineering Reconnaissance Design&Research
10 Proof document: Resettlement Office of Hongjiang District, Huaihua City
11 The Agreement of Yuliangwan Hydropower Station Bridge Construction
12 Engineering Supervision Department: Summary of Yuliangwan Hydropower Station Engineering Cost Budget &
Over Budget

PROJECT DESIGN DOCUMENT FORM (CDM-SSC-PDD) - Version 03
CDM – Executive Board
14
Baseline Emissions
According to baseline methodology ACM0002, the baseline emissions are the CO2 emissions from the
equivalent electricity generation in CCPG that are displaced by the project activity. So the baseline
emissions by the project activity during a given year y is obtained as follow:
According to ACM0002, the project emission should be calculated as:
BEy=EGy·EFy (1)
Where:
EGy is electricity supplied by the project activity to the grid in year y, in MWh;
EFy is baseline emission factor in year y, in tCO2e/MWh.
According to baseline methodology ACM0002, the baseline emission factor (EFy) is calculated as a
Combined Margin (CM), which is consisting of the weighted average of Operating Margin (OM)
emission factor and Build Margin (BM) factor by utilizing an ex-ante 3 years data vintage for the CCPG.
the baseline emission factor (EFy) is calculated as a Combined Margin (CM), which is consisting of the
weighted average of Operating Margin (OM) emission factor and Build Margin (BM) factor by utilizing
an ex-ante 3 years data vintage for the CCPG. The data used for calculation are from an official source
(where available) and publicly available. The calculation processes are as follows:
Step 1. Calculating the Operating Margin emission factor (EFOM,y);
Step 2. Calculating the Build Margin emission factor (EFBM,y);
Step 3. Calculating the baseline emission factor (EFy).
Step 1: Calculate the Operating Margin emission factor(s) (EFOM, y)
According to baseline methodology ACM0002, there are four methods for calculating the EFOM, y:
(a) Simple OM, or
(b) Simple adjusted OM, or
(c) Dispatch Data Analysis OM, or
(d) Average OM
Method (c) should be the first methodological choice. However, this method requires the detailed
dispatch data of the CCPG, which is confidential information and is not available to be obtained by public.
Thus, method (c) is not applicable. Due to the same reasons, the method (b) is not applicable.
Method (a) can be used where low-cost/must run resources constitute less than 50% of total grid
generation in: 1) average of the five most recent years, or 2) based on long-term normals for
hydroelectricity production. The only low-cost/must run resource in CCPG is hydropower plants. It can
be found from Table 6 that installed capacity of hydropower plants constitute less than 50% of CCPG
during year 2001 to 2005. Thus, method (a) is applicable to calculate EFOM, y. And method (d) can only be

PROJECT DESIGN DOCUMENT FORM (CDM-SSC-PDD) - Version 03
CDM – Executive Board
15
used where low-cost/must run resources constitute more than 50% of total grid generation, therefore,
method (d) is not applicable to calculate EFOM, y.
Table 6 Electricity generation of hydropower plants in CCPG during year 2001~~~~200513
Year 2001 2002 2003 2004 2005
Electricity generation of
hydros (%) 36.76 35.95 34.43 38.37 38.56
Due to the detailed data on the individual power plants connected to the power grid is not available,
therefore information by type of generating source are used for OM calculation. According to baseline
methodology ACM0002, tthe EFOM, y is calculated by utilizing an ex-ante 3 years data vintage for CCPG,
the formula as follow:
∑
∑ ⋅
=
j
yj
ji
ji
yji
ysimpleOMGEN
COEFF
EF,
,
,
,,
,, (2)
Where:
Fi, j, y is the amount of fuel i (in a mass or volume unit) consumed by relevant provinces j in year (s) y; j
refers to the power sources delivering electricity to the grid, not including low-operating cost and must-
run power plants, and including imports to the grid;
COEFi, j, y is the CO2 emission coefficient of fuel i (tCO2 / mass or volume unit of the fuel), taking into
account the carbon content of the fuels used by relevant provinces j and the percent oxidation of the fuel
in year (s) y; and
GENj, y is the electricity (MWh) delivered to the grid by province j.
The CO2 emission coefficient COEFi is obtained as:
2,i i CO i iCOEF NCV EF OXID= ⋅ ⋅ (3)
Where:
NCVi is the net calorific value (energy content) per mass or volume unit of a fuel i;
OXIDi is the the oxidation factor of the fuel;
EFCO2, i is the CO2 emission factor per unit of energy of the fuel i.
There are net exports from the CCPG to other power grids, thus the imports are not taken into account.
EFOM,y is calculated according to the statistics information of recent 3 years (from 2003 to 2005), the data
are the latest and available at the time of this PDD submission, the detailed calculations are shown in
Table A2-Table A7 of Annex 3.
13 China Electric Power Yearbook 2002~2006

PROJECT DESIGN DOCUMENT FORM (CDM-SSC-PDD) - Version 03
CDM – Executive Board
16
Step 2: Calculating the Build Margin emission factor (EFBM, y)
According to baseline methodology ACM0002, the Build Margin emission factor (EFBM, y) is calculated
by utilizing an ex-ante 3 years data vintage for CCPG, the formulae as follow:
, , ,
,
,
,
i m y i m
i m
BM y
m y
m
F COEF
EFGEN
⋅
=
∑
∑ (4)
Where :
Fi, m, y, COEFi, m and GENm, y are analogous to the variables described for the simple OM method above for
plants m.
Due to the difficulty of separating the coal-fired, gas-fired or oil-fired installed capacity from the total
fuel-fired installed capacity, according to the approved deviation14 by CDM EB, the EFBM, y will be
calculated as:
1) Based on the most recent years energy balance of the CCPG, calculating the proportions of CO2
emissions from the coal-fired, oil-fired and gas-fired power plants in total fuel-fired CO2 emissions;
2) Based on the most advanced commercialized technologies which applied by the coal-fired, oil-fired
and gas-fired power plants, calculating the fuel-fired emission factor of the CCPG;
3) Calculating the EFBM, y through fuel-fired emission factor times the weighted-average of fuel-fired
installed capacity which is more close to 20% in the new capacity additions.
Sub-Step 2a: Calculating the percentages of CO2 emissions from the coal-fired, gas-fired and oil-
fired power plants in total fuel-fired CO2 emissions
, , ,
,
, , ,
,
i j y i j
i GAS j
Gas
i j y i j
i j
F COEF
F COEFλ
∈
×
=×
∑
∑
, , ,
,
, , ,
,
i j y i j
i OIL j
Oil
i j y i j
i j
F COEF
F COEFλ
∈
×
=×
∑
∑
, , ,
,
, , ,
,
i j y i j
i GAS j
Gas
i j y i j
i j
F COEF
F COEFλ
∈
×
=×
∑
∑ (5)
Where:
λGas, λOil and λCoal are respectively the percentages of CO2 emissions from the gas-fired, oil-fired, coal-
fired power plants in total fuel-fired CO2 emissions;
Fi, j, y is the amount of fuel i (tce) consumed by the province j in year y;
COEFi, j is the CO2 emission coefficient (tCO2/tce) of fuel i, taking into account the carbon content of the
fuels used by the grid and the percent oxidation of the fuel in year y.
14 EB approved deviation for Methodologies AM0005 and AMS-I.D on 7 October 2005.

PROJECT DESIGN DOCUMENT FORM (CDM-SSC-PDD) - Version 03
CDM – Executive Board
17
Sub-Step 2b: Calculating the fuel-fired emission factor (EFThermal)
Error! Objects cannot be created from editing field codes. (6)
Where:
EFThermal is the fuel-fired emission factor;
EFCoal, Adv, EFOil, Adv and EFGas, Adv are corresponding to the emission factors of coal, oil and gas, which are
applied by the most advanced commercialized technologies.
It can be found from Table A8 of Annex 3 that the sum of λOil and λGas account for only 0.52% of total
fuel-fired CO2 emissions, it is reasonable to replace EFThermal with EFCoal, Adv. As a conservative approach,
the final EFThermal is calculated as follow:
EFThermal = EFCoal, Adv﹒ (1-λOil-λGas) (7)
Sub-Step 2c: Calculating the Build Margin (BM) emission factor (EFBM,y)
, ×ThermalBM y Thermal
Total
CAPEF EF
CAP= (8)
Where:
EFBM,y is the Build Margin (BM) emission factor with advanced commercialized technologies for year y;
CAPTotal is the new capacity additions;
CAPThermal is the new fuel-fired capacity additions;
EFThermal is fuel-fired emission factor.
EFBM,y is calculated according to the latest and available data at the time of this PDD submission, the
detailed calculations are shown in Table A8-Table A11 of Annex 3.
Step 3: Calculating the baseline emission factor (EF y)
According to baseline methodology ACM0002, baseline emission factor EFy is calculated as the weighted
average of the Operating Margin emission factor (EFOM, y) and the Build Margin emission factor (EFBM, y):
, ,y OM OM y BM BM yEF w EF w EF= ⋅ + ⋅ (9)
Where:
The weighs wOM and wBM, by default, are 50% ( i.e., wOM= wBM= 0.5), and EFOM, y and EFBM, y are
calculated as described in Steps 1 and 2 above and are expressed in tCO2e/MWh.
Leakage

PROJECT DESIGN DOCUMENT FORM (CDM-SSC-PDD) - Version 03
CDM – Executive Board
18
According to baseline methodology ACM0002, there is no need for the project to consider leakage (Ly).
Emission Reductions
The annual emission reduction (ERy) of the project is the difference between baseline emission and
project activity emission. The final GHG emission reduction is calculated as follows:
ERy (tCO2e/yr) = BEy -PEy-Ly (10)
B.6.2. Data and parameters that are available at validation:
Data / Parameter: NCVi
Data unit: kJ/kg or kJ/m3
Description: The net calorific value (energy content) per mass or volume unit of fuel i
Source of data used: China Energy Statistical Yearbook 2006
Value applied: See Annex 3 for details.
Justification of the
choice of data or
description of
measurement methods
and procedures actually
applied :
Data used are from Chinese authorities.
Any comment:
Data / Parameter: OXIDi
Data unit: %
Description: Oxidation factor of the fuel i
Source of data used: Revised 2006 IPCC Guidelines for National Greenhouse Gas Inventories
Value applied: See Annex 3 for details.
Justification of the
choice of data or
description of
measurement methods
and procedures actually
applied :
No specific local value available, adopt the IPCC default value.
Any comment:
Data / Parameter: Fi, j, y
Data unit: 104 t, 108 m3
Description: The quantity of fuel i (in a mass or volume unit) consumed by the relevant
provinces j in year(s) y
Source of data used: China Energy Statistical Yearbook 2004-2006
Value applied: See Annex 3 for details.
Justification of the
choice of data or
description of
measurement methods
Data used are from Chinese authorities.

PROJECT DESIGN DOCUMENT FORM (CDM-SSC-PDD) - Version 03
CDM – Executive Board
19
and procedures actually
applied :
Any comment:
Data / Parameter: Electricity generation in CCPG
Data unit: MWh
Description: The electricity generated by source j in year y of each province connected to
CCPG.
Source of data used: China Electric Power Yearbook 2004-2006
Value applied: See Annex 3 for details.
Justification of the
choice of data or
description of
measurement methods
and procedures actually
applied :
Data used are from Chinese authorities.
Any comment:
Data / Parameter: Internal use rate of power plant
Data unit: %
Description: The internal power consumption of power plants in year(s) y
Source of data used: China Electric Power Yearbook 2004-2006
Value applied: See Annex 3 for details.
Justification of the
choice of data or
description of
measurement methods
and procedures actually
applied :
Data used are from Chinese authorities.
Any comment:
Data / Parameter: Standard coal consumption of power generation
Data unit: t/MWh
Description: The standard coal consumption of power generation of Chinese mainly sub-
critical and super critical power plants.
Source of data used: Conservative value
Value applied: 0.32
Justification of the
choice of data or
description of
measurement methods
and procedures actually
applied :
The best available technologies in China are mainly sub-critical and super
critical power plants, with the standard coal consumption of power generation
of 0.327t/MWh and 0.323t/MWh respectively. It is conservative for standard
coal to adopt the value 0.32t/MWh. It can be found from China Electric Power
Yearbook 2005 that the standard coal consumption of power generation is
0.371t/MWh in Central China Power Grid. Thus, the value 0.32t/MWh is very
conservative to calculation BM. Any comment:
Data / Parameter: EFCO2, i

PROJECT DESIGN DOCUMENT FORM (CDM-SSC-PDD) - Version 03
CDM – Executive Board
20
Data unit: tCO2/TJ
Description: The CO2 emission factor per unit of fuel i
Source of data used: Revised 2006 IPCC Guidelines for National Greenhouse Gas Inventories
Value applied: See Annex 3 for details.
Justification of the
choice of data or
description of
measurement methods
and procedures actually
applied :
No specific local value available, adopt the IPCC default value.
Any comment:
Data / Parameter: CAPi, j, y
Data unit: MW
Description: Installed capacities of power plant category i of province j in years y.
Source of data used: China Electric Power Yearbook 2001-2006
Value applied: See Annex 3 for details.
Justification of the
choice of data or
description of
measurement methods
and procedures actually
applied :
Data used are from Chinese authorities.
Data / Parameter: Surface Area
Data unit: m2
Description: Surface area at the full reservoir level
Source of data used: Institute of Hydraulic and Electric Engineering Reconnaissance Design&Research
Value applied: 812,000
Justification of the
choice of data or
description of
measurement methods
and procedures actually
applied :
The data provided by Huaihua Institute of Hydraulic and Electric Engineering
Reconnaissance Design&Research is reliable and creditable.
Any comment:
B.6.3 Ex-ante calculation of emission reductions:
>>
Project Emissions
The proposed project is a new small scale hydropower station, the power density is 11.48 W/m2, greater
than 10 W/m2, thus PEy=0
Baseline Emissions

PROJECT DESIGN DOCUMENT FORM (CDM-SSC-PDD) - Version 03
CDM – Executive Board
21
According to formulae (3)-(9) in section B.6.1, the calculation results of EFOM , EFBM and EFy are listed
in table 7, the detailed calculation processes are shown in Annex 3.
Table 7 EFOM , EFBM and EFy of CCPG (tCO2e/MWh)
EFOM EFBM EFy
1.28956 0.61277 0.95116
According to formula (2) in section B.6.1, the annual baseline emissions (BEy) is calculated as follow:
BEy = 32819.1×0.95116 = 31,216 tCO2e/yr
Leakage
According to baseline methodology ACM0002, Ly = 0
Emission Reductions
According to formula (10) in section B.6.1, the annual emission reductions (ERy) is calculated as follow:
ERy (tCO2e/yr) = 31216― 0― 0 = 31,216 tCO2e/yr
B.6.4 Summary of the ex-ante estimation of emission reductions:
>>
The summary of the ex-ante estimation of emission reductions are listed in Table 8 below:
Table 8 Summary of the ex-ante estimation of emission reductions
Year
Estimation of
project activity
emissions
(tonnes of CO2e)
Estimation of
baseline
emissions
(tonnes of CO2e)
Estimation of
leakage
(tonnes of CO2e)
Estimation of
overall emission
reductions
(tonnes of CO2e)
01/09/2007-
31/08/2008 0 31,216 0 31,216
01/09/2008-
31/08/2009 0 31,216 0 31,216
01/09/2009-
31/08/2010 0 31,216 0 31,216
01/09/2010-
31/08/2011 0 31,216 0 31,216
01/09/2011-
31/08/2012 0 31,216 0 31,216
01/09/2012-
31/08/2013 0 31,216 0 31,216
01/09/2013-
31/08/2014 0 31,216 0 31,216
Total 0 218,512 0 218,512

PROJECT DESIGN DOCUMENT FORM (CDM-SSC-PDD) - Version 03
CDM – Executive Board
22
(tonnes of CO2e)
B.7 Application of a monitoring methodology and description of the monitoring plan:
B.7.1 Data and parameters monitored:
Data / Parameter: EGy
Data unit: MWh
Description: Electricity delivered to CCPG
Source of data to be used: Measured onsite and checked with Electricity sales receipts provided by
Hunan Power Grid Company.
Value of data 32819.1
Description of measurement
methods and procedures to be
applied:
The net generated electricity by the project is measured continuously
through national standard electricity metering instruments and will be
recorded manually by respective designated staff of daily.
QA/QC procedures to be
applied:
The monitoring data will be directly used for emission reductions
calculation. Sales receipts and other records will be used for double
checking to ensure the consistency. The meters will be calibrated at a
regular interval by qualified organization to ensure the normal
operation.
Any comment: The uncertainty of data is very low.
B.7.2 Description of the monitoring plan:
>>
An overall monitoring plan will be applied to the project. The project owner compiled a monitoring and
management manual i.e. The Monitoring and Management Manual of Yuliangwan Hydropower Plant.
The aim of monitoring plan is to make sure that the net generated electricity monitored and evaluated
during the project activity operation period is completed, consistent, and precise. It has identified the
duties of the related responsibilities. The details are summarized as follows:
1. Monitoring subject
The primary data monitored is the electricity quantity upon grids by the project activity.
2. Processing and managing structure
In order to obtain effective monitored data, the project owner established a monitoring management
structure which identified the relative staffs for data recording, collection and preservation. In addition,
the project owner will designate a special monitoring director to take charge of supervising. The
monitoring director is responsible for checking of monitoring and recording tasks (such as meter reading,
sales receipts), emission reductions calculation and monitoring reports preparation etc.. The director will
receive technical supports from the Hunan CDM Project Service Centre. The detailed structure is as
follow:
General Manager
General Engineer
Assistant Manager

PROJECT DESIGN DOCUMENT FORM (CDM-SSC-PDD) - Version 03
CDM – Executive Board
23
Figure 2 Operation and management structure of the project
3. Monitoring apparatus and instalment:
The meters will be installed in accordance with <Technology & Management Regulations for Power
Metering Devices> (DL/T448-2000), the accuracy of the meters must meet the national standard. The
meter (Master Meter) will be installed in power house and backup meter (Backup Meter) of Master Meter
will be installed at Hongjiang Substation (high voltage side). The Master Meter and Backup Meter belong
to the Power Grid Company. The project owner, Power Grid Company and quality supervision
organization will check and accept the Master Meter and Backup Meter before the project operation. The
meter (Meter1) used for measuring captive electricity consumption will be installed in power house as
well as owned by the project owner. There is an independent meter in power house (Meter2 and Meter3)
for each generator to monitor the electricity generation. The Power Grid Company is responsible for
maintenance and operation of Master Meter as well as Backup Meter and the project owner is responsible
for meters inside the power house. All the installed meters must be pasted with seal after installation or
calibration. The seal is forbidden to rip by either party independently. The principal diagram of the meter
positions are as follows:
The first
generator
The second
generator
Meter2 Meter3
Meter1

PROJECT DESIGN DOCUMENT FORM (CDM-SSC-PDD) - Version 03
CDM – Executive Board
24
Figure 3 Meter positions of the project
4. Data monitoring
The readings of Master Meter are used for calculating the emission reductions when the Meter is in
normal operation state. The monitoring steps are as follows:
(1) The duty staff record the readings of meters which are inside power house everyday;
(2) Project owner and Power Grid Company collect as well as record the Master Meter readings together
monthly;
(3) The Power Grid Company provides the project owner with the net electricity generation data;
(4) The project owner provides the Power Grid Company with sales receipts and preserves the copies of
the sales receipts.
(5) The project owner records the net electricity generation of the project.
(6) The project owner provides DOE with readings record of Master Meter and copies of sales receipts.
5. Quality control
1) Calibration of meters
The calibration of meters conducted by qualified organization must comply with national standards and
sectoral regulations to ensure the accuracy. The meters must be pasted with seal after calibration. The
calibration records must be archived together with other monitoring records.

PROJECT DESIGN DOCUMENT FORM (CDM-SSC-PDD) - Version 03
CDM – Executive Board
25
When the following situations occurred, all the meters should be tested by a qualified organization in 3
days:
(1) The Master Meter reading is beyond the allowable error.
(2) The meters have any malfunction and are replaced.
2) Emergency treatment
The project owner should inform the Power Grid Company immediately if Master Meter occur
malfunction situation. The net generated electricity during this period should be treated as follows:
(1) Using Backup Meter for net electricity generation monitoring.
(2) If the Backup Meter is also in malfunction, the net electricity generation should be calculated as
follow:
net generated electricity=(Meter2+Meter3-Meter1)×(1-line lose ratio)
The line loss ratio is determined by historical data.
(3) After handling of the emergency, the project owner must prepare a report regarding the emergency to
explain to DOE that the handling method is reasonable.
6. Data management
All monitoring data and records will be archived in electronic document as well as paper document. The
electronic documents will be backed up in Compact Disc or Hard Disc form. The project owner will also
keep the copies of sales receipts and prepare a monitoring report at the end of each year, which includes
the net generated electricity, the monitoring data summary, the calibration records, the emission
reductions calculation, meters’ corrective action records and emergency report (if applicable). All the
monitored data will be delivered to Hunan CDM Project Service Centre who is entrusted as monitoring
consultant by the project owner.
All the electronic and paper documents will be archived during the crediting period and two years after.
7. Training program
The project owner and Hunan CDM Service Center together will train together all the relative staffs
before operation of generators. The training contains CDM knowledge, operational regulations, quality
control (QC) standard flow, data monitoring requirements and data management regulations etc..
More information can be obtained from The Monitoring and Management Manual of Yuliangwan
Hydropower Plant.
B.8 Date of completion of the application of the baseline and monitoring methodology and the
name of the responsible person(s)/entity(ies)
>>
Final Date of completion of the baseline study and monitoring methodology (DD/MM/YYYY):

PROJECT DESIGN DOCUMENT FORM (CDM-SSC-PDD) - Version 03
CDM – Executive Board
26
20/06/2007
The persons and entity completing the application of the baseline and monitoring methodology are:
Hengzhi Xu, Hunan CDM Project Service Center, E-mail: [email protected], Tel:+13911129715
Hanwen Zhang, Hunan CDM Project Service Center, E-mail: [email protected], Tel:+86-731-
4586782
The persons and entity mentioned above are not project participants.
PROJECT DESIGN DOCUMENT FORM (CDM-SSC-PDD) - Version 03
CDM – Executive Board
27
SECTION C. Duration of the project activity / crediting period
C.1 Duration of the project activity:
C.1.1. Starting date of the project activity:
>>
08/12/2007 (Starting date of construction)
C.1.2. Expected operational lifetime of the project activity:
>>
The project is expected to have a minimum operating life of 25 years and 0 month.
C.2 Choice of the crediting period and related information:
C.2.1. Renewable crediting period
C.2.1.1. Starting date of the first crediting period:
>>
01/09/2007
C.2.1.2. Length of the first crediting period:
>>
7 years and 0 month
C.2.2. Fixed crediting period:
Not applicable.
C.2.2.1. Starting date:
>>
C.2.2.2. Length:
>>

PROJECT DESIGN DOCUMENT FORM (CDM-SSC-PDD) - Version 03
CDM – Executive Board
28
SECTION D. Environmental impacts
>>
D.1. If required by the host Party, documentation on the analysis of the environmental impacts
of the project activity:
>>
The project owner entrusted a third party: Huaihua Environmental Protection Research Institute of
Science & Technology to conduct the environmental impact assessment (EIA) on Yuliangwan
Hydropower Project and obtained the approval from Environmental Protection Bureau of Huaihua City in
October, 2005 (Huaihuanhan [2005] No.13).
The EIA report is prepared for future reference, and the main comments of the EIA are as follows:
1. The proposed project activity is mainly related to Changqing Village and Guihuayuan Village in
Hongjiang District, Huaihua City and Huangmao Village in Huitong County, which does not involve in
resettlement issues.
2. The proposed project is a hydropower project, which has no industrial pollutants drainage and has little
pollution impact on surrounding environment. Environment influence occurs mainly in the period of the
construction stage of the project.
3. Sewage generated during the construction period caused trifling contamination of the water
downstream. There is no any rare aquatic animals in river. With the completion of the project, the water
quality will recover in a short time. The project owner should construct sediment pool to treat wastewater.
4. The main impacts on the air quality will come from flying dust and emission caused by cement mixture
process and transportation, the main pollutant is TSP. Another pollution source is the waste gas emission
of machine fuel consumption, the main pollutant is NOx. To avoid these impacts, the project owner
should spray water regularly, and the workers should be protected by masks. The project owner should
plant trees after construction completion. These measures would prevent air pollution effectively.
5. Solid waste generated during construction will caused temporary pollution. The project developer
should specially build a garbage dump for the storage of life trash and solid waste produced during the
construction process.
6. The construction of the project will have certain influence to the vegetation. There is no precious plants
in project activity site. After the project completion, the project developer should carry on forestation to
restore the vegetation of the construction site. The project has little effect on the biodiversity, but the
construction of the weir will not lead to the eradication of species of terrestrial wildlife, so that it will not
affect the biodiversity.
7. Completion of the project will have a series of benefits. It will greatly relieve the power shortage
situation in Hongjiang District, improve the local investment environment and infrastructure construction,
promote local industry development and agriculture production and enhance the life quality of the local
residents persistently. After the construction completion of Yuliangwan project, it will also promote the
development of the local tourism industry.

PROJECT DESIGN DOCUMENT FORM (CDM-SSC-PDD) - Version 03
CDM – Executive Board
29
D.2. If environmental impacts are considered significant by the project participants or the host
Party, please provide conclusions and all references to support documentation of an environmental
impact assessment undertaken in accordance with the procedures as required by the host Party:
>>
Both of the host Party and the project owner regard that the proposed project will not bring significant
impacts on the environment. After the completion of the project construction, the project will be put into
operation only after the inspection and acceptance of local environmental protection department.

PROJECT DESIGN DOCUMENT FORM (CDM-SSC-PDD) - Version 03
CDM – Executive Board
30
SECTION E. Stakeholders’ comments
>>
E.1. Brief description how comments by local stakeholders have been invited and compiled:
>>
The project developer held a stakeholders symposium in the office of Hongjiang District Government in
March, 2006. Totally 30 representatives from government, school, mass organizations, Changqing
Village, Guihuayuan Village and Huangmao Village attended the symposium. The developer introduces
the basic situation of the project, and the representatives carried on a serious discussion on issues of the
project construction and parties’ interests.
E.2. Summary of the comments received:
>>
Summary of survey:
All of the participants of the stakeholders symposium made a statement of their position. They said that
the project construction would relieve the power shortage situation of local region and promote the
development of local economy. The combination of dam and bridge will bring great convenience to the
local people's daily life. The participants of the stakeholders symposium agreed on that the proposed
project will be beneficial to the environment. They expressed full support to the construction of the
project and also raised some issues which need to be solved.
Issues presented in the stakeholders symposium were as follows:
1.In order to construct the project smoothly, the project owner was requested to coordinate relationships
through the communication with local government and relevant departments, in particular the
township government and Villages.
2.Some people worried about that the project will have negative impact to the local vegetation.
3.The local residents required the project owner to build life wharf and ferryboat wharf to facilitate their
daily life.
4.Some residents required to solve the drinking water problem of Huangmaotuan Village although the
problem was not derived from the project.
E.3. Report on how due account was taken of any comments received:
>>
After compiling the survey results, the project owner made a quick response in views of the questions
reflected in the stakeholders symposium. The following are the corresponding replies towards the
problems shown in the previous section:
1. The project owner promised to communicate frequently with local government officials, leaders of
various departments, Village cadres and the related masses in the period of construction and

PROJECT DESIGN DOCUMENT FORM (CDM-SSC-PDD) - Version 03
CDM – Executive Board
31
operation of the project so as to coordinate the relationship, and make a appropriate treatment when
finding problems related to the project.
2.Vegetation around the project site will be restored immediately by the project owner after the
completion of the project.
3.The project owner promised to construct wharf to facilitate the local residents’ daily life.
4.The project owner promised to construct drinking water wells voluntarily for local villagers.
The above mentioned measures have been completed at the time of the PDD submission.

PROJECT DESIGN DOCUMENT FORM (CDM-SSC-PDD) - Version 03
CDM – Executive Board
32
Annex 1
CONTACT INFORMATION ON PARTICIPANTS IN THE PROJECT ACTIVITY
Project owner
Organization: Yuliangwan Hydropower of Hongjiang District Co., Ltd.
Street/P.O.Box:
Building: Office Buiding of Yuliangwan Hydropower of Hongjiang District Co., Ltd.
City: Hongjiang District, Huaihua City
State/Region: Hunan Province
Postfix/ZIP: 418200
Country: People’s Republic of China
Telephone: +86-745-7634778
FAX: +86-745-7634778
E-Mail: [email protected]
URL: None
Represented by: Wenxiao Dong
Title: Manager
Salutation: Mr
Last Name: Dong
Middle Name: None
First Name: Wenxiao
Department: Yuliangwan Hydropower of Hongjiang District Co., Ltd.
Mobile: +86-13707451961
Direct FAX: +86-745-7634778
Direct tel: +86-745-7634778
Personal E-Mail: [email protected]

PROJECT DESIGN DOCUMENT FORM (CDM-SSC-PDD) - Version 03
CDM – Executive Board
33
CERs Purchaser
Organization: Carbon Asset Management Sweden AB
Street/P.O.Box: Drottninggatan 92-94
Building: /
City: Stockholm
State/Region: /
Postfix/ZIP: 111 36
Country: Sweden
Telephone: +46 8 506 885 00
FAX: +46 8 34 60 80
E-Mail: [email protected]
URL: www.tricorona.se
Represented by: Niels Von Zweigbergk
Title: President & CEO
Salutation: Mr.
Last Name: Zweigbergk
Middle Name: Von
First Name: Niels
Department: /
Mobile: +46 708 59 35 00
Direct FAX: +46 8 34 60 80
Direct tel: +46 8 506 263 96
Personal E-Mail: [email protected]:[email protected]

PROJECT DESIGN DOCUMENT FORM (CDM-SSC-PDD) - Version 03
CDM – Executive Board
34
Annex 2
INFORMATION REGARDING PUBLIC FUNDING
There is no public funding for this project.

PROJECT DESIGN DOCUMENT FORM (CDM-SSC-PDD) - Version 03
CDM – Executive Board
35
Annex 3
BASELINE INFORMATION
The installed capacity, fuel consumption data used for OM and BM calculation are derived from <China
Energy Statistical Yearbook>, <China Electric Power Yearbook>. Furthermore, the data are compiled by
Chinese DNA, for more information, please refer to following link:
http://cdm.ccchina.gov.cn/web/NewsInfo.asp?NewsId=1235
The low calorific value, CO2 emission factor and oxidation factor of fuels are listed in Table A1 below.
Table A1 Low calorific values, CO2 emission factors and oxidation factors of fuels
Fuel Low Calorific Value Emission Factor
(tC/TJ) Oxidation Factor
Raw Coal 20908 kJ/kg 25.8 100%
Cleaned Coal 26344 kJ/kg 25.8 100%
Other Washed Coal 8363 kJ/kg 25.8 100%
Coke 28435 kJ/kg 25.8 100%
Crude Oil 41816 kJ/kg 20.0 100%
Gasoline 43070 kJ/kg 18.9 100%
Diesel Oil 42652 kJ/kg 20.2 100%
Fuel Oil 41816 kJ/kg 21.1 100%
Natural Gas 38931 kJ/m3 15.3 100%
Coke Oven Gas 16726 kJ/m3 12.1 100%
Other Gas 5227 kJ/m3 12.1 100%
LPG 50179 kJ/kg 17.2 100%
Refinery Dry Gas 46055 kJ/kg 15.7 100%
Data Source:
The net calorific values are quoted from <China Energy Statistical Yearbook 2006>, Page 287.
The emission factors and oxidation factors are quoted from <Revised 2006 IPCC Guidelines for National
Greenhouse Gas Inventories >, Table 1.4, Page 1.24, Chapter 1, Volume 2.

PROJECT DESIGN DOCUMENT FORM (CDM-SSC-PDD) - Version 03
CDM – Executive Board
36
Step 1: Calculating the Operating Margin emission factor (EFOM,y)
Table A2 Simple OM Emission Factors Calculation of CCPG for Year 2003
Fuel Unit Jiangxi Henan Hubei Hunan Chongqing Sichuan Total EF Oxidation
Average
Low
Calorific
Value
CO2 Emission
(tCO2e)
(tC/TJ) (%) (MJ/t,km3)
K=G*H*I*J*44
/12/10000 (for
mass unit)
A B C D E F G=A+B+
C+D+E+F H I J
K=G*H*I*J*44
/12 /1000 (for
volume unit)
Raw Coal 104 t 1427.41 5504.94 2072.4
4 1646.47 769.47 2430.93 13851.66 25.8 100 20908 273971539.89
Cleaned Coal 104 t 0 25.8 100 26344 0
Other Washed Coal 104 t 2.03 39.63 106.12 147.78 25.8 100 8363 1169146.40
Coke 104 t 1.22 1.22 29.2 100 28435 37142.18
Coke Oven Gas 108 m3 0.93 0.93 12.1 100 16726 69013.15
Other Gas 108 m3 0 12.1 100 5227 0
Crude Oil 104 t 0.5 0.24 1.2 1.94 20 100 41816 59490.23
Diesel Oil 104 t 0.52 2.54 0.69 1.21 0.77 5.73 20.2 100 42652 181015.94
Fuel Oil 104 t 0.42 0.25 2.17 0.54 0.28 1.2 4.86 21.1 100 41816 157229.00
LPG 104 t 0 17.2 100 50179 0
Refinery Dry Gas 104 t 1.76 6.53 0.66 8.95 15.7 100 46055 237285.34
Natural Gas 108 m3 0.04 2.2 2.24 15.3 100 38931 489222.52
Total 276371084.63
Data Source: <China Energy Statistical Yearbook 2004>

PROJECT DESIGN DOCUMENT FORM (CDM-SSC-PDD) - Version 03
CDM – Executive Board
37
Table A3 Fuel-fired Electricity Generation of CCPG for Year 2003
Province Electricity Generation Electricity Generation Auxiliary Power Ratio Supplied Electricity
(108 kWh) (MWh) (%) (MWh)
Jiangxi 271.65 27165000 6.43 25418291
Henan 955.18 95518000 7.68 88182218
Hubei 395.32 39532000 3.81 38025831
Hunan 295.01 29501000 4.58 28149854
Chongqing 163.41 16341000 8.97 14875212
Sichuan 327.82 32782000 4.41 31336314
Total 225987719
Data Source: <China Electric Power Yearbook 2004>
According to Table A2, the total CO2 emissions of CCPG is 276371084.63 tCO2e in year 2003. According to Table A3, the total supplied electricity of CCPG
is 225987719.2 MWh. According to formula (2) in section B.6.1, the EFOM, Simple, 2003 is 1.2229 tCO2e/MWh.

PROJECT DESIGN DOCUMENT FORM (CDM-SSC-PDD) - Version 03
CDM – Executive Board
38
Table A4 Simple OM Emission Factors Calculation of CCPG for Year 2004
Fuel Unit Jiangxi Henan Hubei Hunan Chongqing Sichuan Total EF Oxidation Average Low
Calorific Value
CO2 Emission
(tCO2e)
(tC/TJ) (%) (MJ/t,km3)
K=G*H*I*J*
44/12/10000
(for mass unit)
A B C D E F G=A+B+
C+D+E+F H I J
K=G*H*I*J*4
4/12 /1000 (for
volume unit)
Raw Coal 104 t 1863.8 6948.5 2510.5 2197.9 875.5 2747.9 17144.1 25.8 100 20908 339092605.29
Cleaned Coal 104 t 2.34 2.34 25.8 100 26344 58316.13
Other Washed Coal 104 t 48.93 104.22 89.72 242.87 25.8 100 8363 1921441.23
Coke 104 t 109.61 109.61 29.2 100 28435 3337011.41
Coke Oven Gas 108 m3 1.68 0.34 2.02 12.1 100 16726 149899.53
Other Gas 108 m3 2.61 2.61 12.1 100 5227 60527.09
Crude Oil 104 t 0.86 0.22 1.08 20 100 41816 33118.27
Gasoline 104 t 0.06 0.01 0.07 20.2 100 43070 2089.33
Diesel Oil 104 t 0.02 3.86 1.7 1.72 1.14 8.44 21.1 100 42652 266627.32
Fuel Oil 104 t 1.09 0.19 9.55 1.38 0.48 1.68 14.37 17.2 100 41816 464893.14
LPG 104 t 0 15.7 100 50179 0
Refinery Dry Gas 104 t 3.52 2.27 5.79 15.3 100 46055 153506.38
Natural Gas 108 m3 2.27 2.27 25.8 100 38931 495774.61
Total 346035809.73
Data Source: <China Energy Statistical Yearbook 2005>

PROJECT DESIGN DOCUMENT FORM (CDM-SSC-PDD) - Version 03
CDM – Executive Board
39
Table A5 Fuel-fired Electricity Generation of CCPG for Year 2004
Province Electricity Generation Electricity Generation Auxiliary Power Ratio Supplied Electricity
(108 kWh) (MWh) (%) (MWh)
Jiangxi 301.27 30127000 7.04 28006059
Henan 1093.52 109352000 8.19 100396071
Hubei 430.34 43034000 6.58 40202363
Hunan 371.86 37186000 7.47 34408206
Chongqing 165.2 16520000 11.06 14692888
Sichuan 346.27 34627000 9.41 31368599
Total 249074186
Data Source: <China Electric Power Yearbook 2005>
According to Table A4, the total CO2 emissions of CCPG is 346035809.73 tCO2e in year 2004. According to Table A5, the total supplied electricity of CCPG
is 249074186 MWh. According to formula (2) in section B.6.1, the EFOM, Simple, 2004 is 1.3893 tCO2e/MWh.

PROJECT DESIGN DOCUMENT FORM (CDM-SSC-PDD) - Version 03
CDM – Executive Board
40
Table A6 Simple OM Emission Factors Calculation of CCPG for Year 2005
Fuel Unit Jiangxi Henan Hubei Hunan Chongqing Sichuan Total EF Oxidation
Average
Low
Calorific
Value
CO2 Emission
(tCO2e)
(tC/TJ) (%) (MJ/t,km3)
K=G*H*I*J*44
/12/10000 (for
mass unit)
A B C D E F G=A+B+
C+D+E+F H I J
K=G*H*I*J
*44/12/1000 (for
volume unit)
Raw Coal 104 t 1869.29 7638.87 2732.15 1712.27 875.4 2999.77 17827.75 25.8 100 20908 352614496.76
Cleaned Coal 104 t 0.02 0 0.02 25.8 100 26344 498.43
Other Washed Coal 104 t 138.12 89.99 228.11 25.8 100 8363 1804669.00
Coke 104 t 25.95 105 130.95 29.2 100 28435 3986695.05
Coke Oven Gas 108 m3 1.15 0.36 1.51 12.1 100 16726 112053.61
Other Gas 108 m3 10.2 3.12 13.32 12.1 100 5227 308896.88
Crude Oil 104 t 0.82 0.36 1.18 20 100 41816 36184.78
Gasoline 0.02 0.02 0.04 18.9 100 43070 1193.90
Diesel Oil 104 t 1.3 3.03 2.39 1.39 1.38 9.49 20.2 100 42652 299797.78
Fuel Oil 104 t 0.64 0.29 3.15 1.68 0.89 2.22 8.87 21.1 100 41816 286959.09
LPG 104 t 0 17.2 100 50179 0.00
Refinery Dry Gas 104 t 0.71 3.41 1.76 0.78 6.66 15.7 100 46055 176572.11
Natural Gas 108 m3 3 3 15.3 100 38931 655208.73
Total 360283226.12
Data Source: <China Energy Statistical Yearbook 2006>

PROJECT DESIGN DOCUMENT FORM (CDM-SSC-PDD) - Version 03
CDM – Executive Board
41
Table A7 Fuel-fired Electricity Generation of CCPG for Year 2005
Province Electricity Generation Electricity Generation Auxiliary Power Ratio Supplied Electricity
(108 kWh) (MWh) (%) (MWh)
Jiangxi 305.61 30561000 6.48 28580647.2
Henan 1311.3 131130000 7.32 121531284
Hubei 476.15 47615000 2.51 46419863.5
Hunan 403.08 40308000 5 38292600
Chongqing 186.69 18669000 8.05 17166145.5
Sichuan 365.42 36542000 4.27 34981656.6
Total 286972196.8
Data Source: <China Electric Power Yearbook 2006>
According to Table A6, the total CO2 emissions of CCPG is 360283226.12 tCO2e in year 2005. According to Table A7, the total supplied electricity of
CCPG is 286972196.8 MWh. According to formula (2) in section B.6.1, the EFOM, Simple, 2005 is 1.2555 tCO2e/MWh.
The Operating Margin (OM) emission factor is the weighted average emission factors of year 2003-2005, as follow:
EFOM = 1.28956 tCO2e/MWh

PROJECT DESIGN DOCUMENT FORM (CDM-SSC-PDD) - Version 03
CDM – Executive Board
42
Step 2: Calculating the Build Margin emission factor (EFBM,y)
Sub-Step 2a: Calculating of percentages of CO2 emissions from the coal-fired, gas-fired and oil-fired power plants in total fuel-fired CO2 emissions
Table A8 Percentages of CO2 emissions from the coal-fired, gas-fired and oil-fired power plants in total fuel-fired CO2 emissions
Jiangxi Henan Hubei Hunan Chongqing Sichuan Total
Average
Low
Calorific
Value
Emission
Factor
(tC/TJ)
Oxidation CO2 Emission
(tCO2e)
Fuel Unit A B C D E F G=A+…+F H I J K=G*H*I*J*44
/12/100
Raw Coal 104 t 1869.29 7638.87 2732.15 1712.27 875.4 2999.77 17827.75 20908 kJ/kg 25.8 100% 352614496.76
Cleaned Coal 104 t 0.02 0 0.02 26344 kJ/kg 25.8 100% 498.43
Other Washed Coal 104 t 138.12 89.99 228.11 8363 kJ/kg 25.8 100% 1804669.00
Coke 104 t 25.95 105 130.95 28435 kJ/kg 29.2 100% 3986695.05
Subtotal 358406359.24
Crude Oil 104 t 0.82 0.36 1.18 41816 kJ/kg 20 100% 36184.78
Gasoline 104 t 0.02 0.02 0.04 43070 kJ/kg 18.9 100% 1193.90
Diesel Oil 104 t 1.3 3.03 2.39 1.39 1.38 9.49 42652 kJ/kg 20.2 100% 299797.78
Fuel Oil 104 t 0.64 0.29 3.15 1.68 0.89 2.22 8.87 41816 kJ/kg 21.1 100% 286959.09
Subtotal 624135.55
Natural Gas 107 m3 30 30 38931 kJ/m3 15.3 100% 655208.73
Coke Oven Gas 107 m3 11.5 3.6 15.1 16726 kJ/m3 12.1 100% 112053.61
Other Gas 107 m3 102 31.2 133.2 5227 kJ/m3 12.1 100% 308896.88
LPG 104 t 0 50179 kJ/kg 17.2 100% 0.00
Refinery Dry Gas 104 t 0.71 3.41 1.76 0.78 6.66 46055 kJ/kg 15.7 100% 176572.11
Subtotal 1252731.33
Total 360283226.12
Data Source: <China Energy Statistical Yearbook 2006>
According to Table A8 and formula (5) in section B.6.1, the percentages of CO2 emissions from the coal-fired, oil-fired and gas-fired power plants in total
fuel-fired CO2 emissions are calculated as:
λCoal = 99.48%,λOil = 0.17%,λGas = 0.35%

PROJECT DESIGN DOCUMENT FORM (CDM-SSC-PDD) - Version 03
CDM – Executive Board
43
Due to the sum of λOil and λGas account for only 0.52% of total fuel-fired CO2 emissions, it is reasonable to replace EFThermal with EFCoal, Adv. As a conservative
approach, the final EFThermal is calculated as follow:
EFThermal = EFCoal, Adv﹒ (1-λOil-λGas)
Sub-Step 2b: Calculating the fuel-fired emission factor (EFThermal)
The best available technologies in China are mainly sub-critical and super critical power plants, with the standard coal consumption of power generation of
327g/kWh and 323g/kWh respectively. It is conservative for standard coal to adopt the value 320g/kWh. It can be found from <China Electric Power
Yearbook 2005> that the standard coal consumption of power generation is 371kg/kWh in Central China Power Grid. Thus, the value 320g/kWh is very
conservative to calculation BM.
Parameters used for calculating coal-fired plant emission factor are shown in Table A9 below:
Table A9 Parameters used for calculating coal-fired plant emission factor
Parameter Unit Value Comment
NCV of standard coal TJ/t coal 0.02927 The data is derived from General Code Comprehensive Energy
Consumption Calculation (GB2589-81)
Coal consumption of power generation t/MWh 0.32 Conservative value
Emission factor of coal tC/TJ 25.8 The data is derived from IPCC2006
Oxidation factor of coal / 100% The data is derived from IPCC2006
The EFThermal is 0.88145 tCO2e/MWh

PROJECT DESIGN DOCUMENT FORM (CDM-SSC-PDD) - Version 03
CDM – Executive Board
44
Sub-Step 2c: Calculating the Build Margin (BM) emission factor (EFBM,y)
Table A10 Installed Capacities of CCPG
Installed
Capacity Unit 2000 2001 2002 2003 2004 2005
Fuel-fired MW 39864.6 42569.2 43303.2 46893.5 53744.7 60167.3 Hydro MW 28637.8 30397 31034.7 36557 34642 38405.1 Nuclear MW 0 0 0 0 0 0 Wind &
Others MW 0 0 0 0 0 24
Total MW 68502.4 72966.2 74337.9 83450.5 88386.7 98596.4 Data Source: <China Electric Power Yearbook 2001-2006>
Table A11 Newly Added Installed Capacity from Year 2000-2005
2000 2001 2002 2003 2004 2005
A B C D E F F-C
Fuel-fired
(MW) 39864.6 42569.2 43303.2 46893.5 53744.7 60167.3 16864.1
Hydro
(MW) 28637.8 30397 31034.7 36557 34642 38405.1 7370.4
Nuclear MW 0 0 0 0 0 0 Wind &
Others MW 0 0 0 0 0 24
Total
(MW) 68502.4 72966.2 74337.9 83450.5 88386.7 98596.4 24258.5
Percentage
of newly
installed
capacity to
2005
30.51% 25.98% 24.59% 15.34% 10.33% 0.00%
Percentage of newly
added fuel-fired plants 69.52%
It can be concluded from Table A13 that capacity additions from year 2002 to 2005 is closer to 20% of
the total additions and it is obvious the capacity additions during year 2002 to 2005 are larger than the
capacity of five plants, so year 2002 and 2005 are chosen to calculate the BM emission factor of CCPG.
According to Table A11 and formula (8) in section B.6.1, the EFBM is calculated as:
EFBM = 0.61277 tCO2e/MWh
Step 3: Calculating the baseline emission factor (EFy)
According to formula (9) in section B.6.1, the baseline emission factor of CCPG is calculated as:
EFy = 0.95116 tCO2e/MWh

PROJECT DESIGN DOCUMENT FORM (CDM-SSC-PDD) - Version 03
CDM – Executive Board
45
Annex 4
MONITORING INFORMATION
Please refer to the section B.7 of the PDD and The Monitoring and Management Manual of Yuliangwan
Hydropower Plant.