clean development mechanism project design document … pdd version 04.pdf · clean development...
TRANSCRIPT
PROJECT DESIGN DOCUMENT FORM (CDM PDD) - Version 03.1. CDM – Executive Board page 1
CLEAN DEVELOPMENT MECHANISM PROJECT DESIGN DOCUMENT FORM (CDM-PDD)
Version 03 - in effect as of: 28 July 2006
CONTENTS
A. General description of project activity B. Application of a baseline and monitoring methodology C. Duration of the project activity / crediting period D. Environmental impacts E. Stakeholders’ comments
Annexes Annex 1: Contact information on participants in the project activity Annex 2: Information regarding public funding Annex 3: Baseline information Annex 4: Monitoring plan Appendix 1: Abbreviation

PROJECT DESIGN DOCUMENT FORM (CDM PDD) - Version 03.1. CDM – Executive Board page 2 SECTION A. General description of project activity A.1 Title of the project activity: >> Title of project activity : LMEL 25 MW Waste Heat based Captive Power Plant. Document version No : 004 Date of the document : 30/06/2008 A.2. Description of the project activity: >> Purpose of project activity The purpose of the project activity is to achieve efficient use of waste heat to generate electricity using the waste heat contained waste gases. The electricity so generated shall be used to meet the power requirement of Lloyds Metals and Engineers Limited (LMEL) sponge iron Plant itself and balance will be supplied to Mahrashtra State Electricity Distribution Company Limited (MSEDCL) grid to wheel the electricity to the consumers of power trading company. An The purpose of the proposed project activity is to generate electricity by generating steam using waste heat contained in the waste flue gases released from ABC (After Burning Chamber) of existing 1 number 500TPD started in May 1997 and existing 4 numbers 100 TPD DRI (Direct Reduction Iron) sponge iron kilns started in February 2006 in the manufacturing process of sponge iron of LMEL. The heat contained in waste gases will be transferred to water which converts water in to steam in WHRBS (Waste Heat Recovery Boilers) producing 109.2 tonnes/h of steam at 70 bar and 490deg c. Steam generated from 5 WHRBS is combined in a header which also receives 13.2 tonnes/h of steam from coal based FBC boiler (FBCB) so that total 122.4 tonnes/hr of steam at and 490 deg C will be fed into the steam turbo-generator (STG) to generate 30 MW. Steam from other sources is taken to common header to take care of situation of variations in waste heat gas quantity and quality and for ensuring proper working of STG (steam from FBC= 122.4-steam from WHRB). This PDD is developed for the 25 MW electricity generated in STG using WHRB steam. Steam consumed in STG = 122.4 tonnes/h WHRB steam used = 109.2 tonnes/h WHRB steam contribution = 109.2* 30/ 122.4 = 26.76 MW However we have considered WHRB contribution as 25 MW by rounding on lower side to be conservative as steam generated in WHRB is influenced by uncertainties in flue gas conditions and have developed this PDD. LMEL have plans to expand sponge iron manufacturing facility and due to which additional waste heat containing waste gases will be generated in the process and LMEL have plans to install WHRB to generate steam and to generate additional waste heat based electricity and LMEL will approach again in future CDM EB for registration for this added capacity in line with methodology. As per methodology “in case of planned expansion, a separate CDM project should be registered for additional capacity”. The power generated by the project activity shall be used by LMEL to meet their electricity requirements and surplus will be supplied to MSEDCL grid that will wheel the electricity to the consumers of power trading company. LMEL have entered into power purchase agreement (PPA) with the power trading company. Current status of Project activity

PROJECT DESIGN DOCUMENT FORM (CDM PDD) - Version 03.1. CDM – Executive Board page 3 1 All major packages like boilers, turbine, cooling tower, water treatment plant, ESP, DCS, and Electrical etc are ordered 2 Engineering is complete and civil work process started 3 Scheduled commissioning date: March 2009 4 The time frame of major activities is as follows. The latest project schedule for the project activity has been submitted to DOE. Equipment Expected at site STG August 2008 WHRBS November 2008 Cooling tower December 2008 Other equipment like DCS December 2008 Civil work July to January 2009 Commissioning/start up March 2009 Background of the company LMEL has two divisions namely pipe division and Sponge Iron division. The pipe division has licensed Capacity of 90000 tonnes/year and sponge iron division has licensed capacity of 390000 tonnes/year. The company is putting the project activity in sponge iron division and the power generated will be used for in house consumption of LMEL at Ghugus and balance electricity will be wheeled to consumers of power trading company through MSEDCL grid as the same is the only statutory grid in the state. The reduction in GHG emission from facility of the project arises from the replacement / displacement of an equivalent amount of electricity to the extent of electricity generated from steam which is produced from waste heat recovered from waste gases in WHRB, which would have been otherwise generated and supplied by grid which is mainly dependant on fossil fuel based power plants. The total CO2 emission reduction for the entire crediting period of 10 years has been calculated as 1183054 tonne CO2 equivalent. The other benefits being reduction of CO2 emissions considering global scenario, Sustainable development through better energy efficiency and it also leads to the improvement of local environment. LMEL will have proper monitoring system in line with approved methodology ACM 0012 to calculate the power generated out of the power plant and accurately record the reduction in CO2 emissions. LMEL will follow monitoring plan to achieve complete transparency in monitoring, recording and calculating reduction in CO2 emissions. The project activity will lead to sustainable development and promote sustainable Industrial growth by conserving natural resources and preventing the thermal pollution even though no such statutory requirement exists. Social benefit to state The project activity increases the employment within the company LMEL for skilled manpower and Professionals due to the 4 no WHRBS and 1 no STG and other equipment. Skilled and unskilled labour will gain temporary employment while executing the project.
PROJECT DESIGN DOCUMENT FORM (CDM PDD) - Version 03.1. CDM – Executive Board page 4 Maharashtra state is facing more than 5000 MW power shortage leading to power starvation and hence the project activity enables the state grid to bridge this gap by reduction in demand on grid as company generates electricity and supplies to consumers who presently use grid power. This helps the grid to supply power to other consumers and meet its social obligations. Economical Benefits to State The project involves investment of around 1000 million rupees and will involve more than 700 million rupees capital equipment purchase. Engineering industry will benefit and provide employment opportunity for professionals, skilled and unskilled people. The state will generate revenue out of the manufacturing activities supported by the power generation and due to purchase of equipment for execution of project by way of Sales Tax; Excise Duty; Entry Tax etc. Maharashtra state is facing more than 5000 MW power shortage leading to power starvation and hence the project activity enables the state grid to bridge this gap by reduction in demand on grid as company generates electricity and supplies to consumers who presently use grid power. This helps the grid to supply power to other consumers and create economical activity leading to economical benefits to state. Environmental Benefit The Project activity is waste heat recovery based Power Plant by utilizing waste heat from flue gases coming from process and thus effectively saving environment of thermal pollution. In the absence of project activity flue gases would have been cooled in a scrubber by LMEL leading to water pollution as fly ash would pollute water. The project activity displaces power from fossil fuel based power of the grid and hence reduces CO2 emission. In the absence of project activity LMEL would have let the hot gases into atmosphere or used a water scrubber to reduce the flue gas temperature. This is not useful use of heat and also leads to water pollution as cooling water gets mixed with ash coming with flue gases. The project activity eliminates the present wastage of water as water is put into drain after scrubber. Reduction of T & D Losses of Power The Power generated by the project activity will be used for in house requirement of LMEL who is the waste gas generator without any T&D losses as the utility points are in the same premises and surplus power is supplied to grid/power trading company who can distribute the electricity locally without any significant T&D losses. This is significant as grid has more than 30% losses in its T&D. Reduction in SPM level in the Atmosphere and other additional Economic benefits. The proposed project activity of power generation does not produce any ash. However ESP shall remove the ash coming with flue gases which will be collected in ash hopper. This ash will be given free of cost to cement plants & brick manufactures for further Economic benefit and use. The ash used for production of bricks replaces the fired clay bricks and reduces the air pollution caused by the conventional brick kilns due to the coal burning. A.3. Project participants: >>
PROJECT DESIGN DOCUMENT FORM (CDM PDD) - Version 03.1. CDM – Executive Board page 5
Name of the Party Involved (host) host party-
Private and/or Public entity (ies) Project Participant as applicable
Kindly indicate if the party involved wishes to be Considered as project participant (Yes/ No)
India (host) Ministry of Environment and Forest
Lloyds Metals and Engineers Limited.
No
A.4. Technical description of the project activity: A.4.1. Location of the project activity: >> A.4.1.1. Host Party(ies): >> India A.4.1.2. Region/State/Province etc.: >> Maharashtra, India A.4.1.3. City/Town/Community etc: Village: Ghugus, District: Chandrapur A.4.1.4. Detail of physical location, including information allowing the unique identification of this project activity (maximum one page): Physical Location: The project activity is located within the industrial facility of Lloyds Metals and Engineers Limited is located at Plot No A 1-2. MIDC Area, village Ghugus about 25 KM from Chandrapur town and situated at Longitude 79 07 15 E Latitude 19 56 N. Nearest Railway station is Tadali.

PROJECT DESIGN DOCUMENT FORM (CDM PDD) - Version 03.1. CDM – Executive Board page 6
A.4.2. Category (ies) of project activity: The project activity may be principally categorised in category –1 Energy Industries (Renewable /non renewable) as per Scope of Projects activities enlisted in the “list of sectoral scopes and approved base line and monitoring “methodologies” on the website for accreditation of “Designated operational Entities”. The CDM PDD is based on approved methodology ACM0012 version 02 and sectoral scope; 01 & 04 EB 35 “consolidated baseline methodology for GHG emission reductions for waste gas or waste heat or waste pressure based energy system” A.4.3. Technology to be employed by the project activity: WHRB based Power Plant of LMEL is proposed to utilise the heat content of flue gases coming out of each ABC of existing 4 numbers 100 TPD operating since February 2006 and existing 1 number 500 TPD sponge iron kiln operating since May 1997 during sponge iron manufacturing process at LMEL. The waste heat recovery boilers are based on designs of ERK Eckrohrkessel GmbH, Germany and the licence to manufacture these boilers is with Lloyds Steel Industries Ltd Engineering division. The process technology transfer is complete. The technology is environmentally safe and abides by all boiler regulation.
PARAMETERS WHRB Data for each boiler
Capacity tonnes/hr 12.7 58.4 Steam pressure kg/cm2 a 70 70 Steam temperature deg c 490 490 Flue gas flow rate N m3/h 27000 120000
PROJECT DESIGN DOCUMENT FORM (CDM PDD) - Version 03.1. CDM – Executive Board page 7
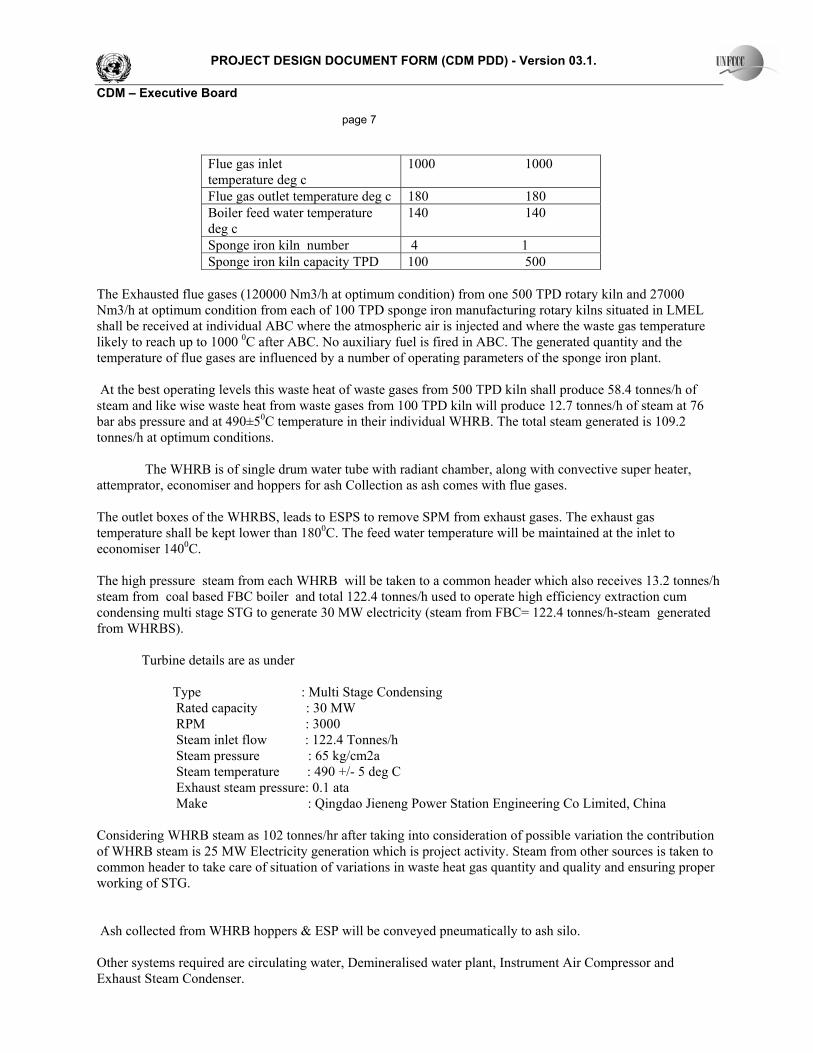
Flue gas inlet temperature deg c
1000 1000
Flue gas outlet temperature deg c 180 180 Boiler feed water temperature deg c
140 140
Sponge iron kiln number 4 1 Sponge iron kiln capacity TPD 100 500
The Exhausted flue gases (120000 Nm3/h at optimum condition) from one 500 TPD rotary kiln and 27000 Nm3/h at optimum condition from each of 100 TPD sponge iron manufacturing rotary kilns situated in LMEL shall be received at individual ABC where the atmospheric air is injected and where the waste gas temperature likely to reach up to 1000 0C after ABC. No auxiliary fuel is fired in ABC. The generated quantity and the temperature of flue gases are influenced by a number of operating parameters of the sponge iron plant. At the best operating levels this waste heat of waste gases from 500 TPD kiln shall produce 58.4 tonnes/h of steam and like wise waste heat from waste gases from 100 TPD kiln will produce 12.7 tonnes/h of steam at 76 bar abs pressure and at 490±50C temperature in their individual WHRB. The total steam generated is 109.2 tonnes/h at optimum conditions. The WHRB is of single drum water tube with radiant chamber, along with convective super heater, attemprator, economiser and hoppers for ash Collection as ash comes with flue gases. The outlet boxes of the WHRBS, leads to ESPS to remove SPM from exhaust gases. The exhaust gas temperature shall be kept lower than 1800C. The feed water temperature will be maintained at the inlet to economiser 1400C. The high pressure steam from each WHRB will be taken to a common header which also receives 13.2 tonnes/h steam from coal based FBC boiler and total 122.4 tonnes/h used to operate high efficiency extraction cum condensing multi stage STG to generate 30 MW electricity (steam from FBC= 122.4 tonnes/h-steam generated from WHRBS). Turbine details are as under Type : Multi Stage Condensing Rated capacity : 30 MW RPM : 3000 Steam inlet flow : 122.4 Tonnes/h Steam pressure : 65 kg/cm2a Steam temperature : 490 +/- 5 deg C Exhaust steam pressure: 0.1 ata Make : Qingdao Jieneng Power Station Engineering Co Limited, China Considering WHRB steam as 102 tonnes/hr after taking into consideration of possible variation the contribution of WHRB steam is 25 MW Electricity generation which is project activity. Steam from other sources is taken to common header to take care of situation of variations in waste heat gas quantity and quality and ensuring proper working of STG. Ash collected from WHRB hoppers & ESP will be conveyed pneumatically to ash silo. Other systems required are circulating water, Demineralised water plant, Instrument Air Compressor and Exhaust Steam Condenser.

PROJECT DESIGN DOCUMENT FORM (CDM PDD) - Version 03.1. CDM – Executive Board page 8 Steam from exhaust of STG rotor will be condensed in water cooled condenser. Only DM (De Mineralised) water will be used in boiler to avoid scale formation on boiler tubes. Total Waste water is recycled and reused after treatment. The technology is environmentally safe and abides all legal norms and standards for SPM emissions. No supplementary fuel is used in WHRB. A.4.4 Estimated amount of emission reductions over the chosen crediting period:
Years Annual estimation of emission reductions in tonnes of CO2eq
2009-10 104827 2010-11 119803 2011-12 119803 2012-13 119803 2013-14 119803 2014-15 119803 2015-16 119803 2016-17 119803 2017-18 119803 2018-19 119803 Total estimated reductions (tonnes CO2 e)
1183054
Total number of crediting years 10 Annual average over the crediting period of estimated reductions ( tonnes CO2 e)
118305.4
A.4.5. Public funding of the project activity: No public funding from parties included in Annex-I is available for the project activity. No ODA funds are used in project activity. SECTION B. Application of a baseline and monitoring methodology B.1. Title and reference of the approved baseline and monitoring methodology applied to the project activity: Title of approved methodology: “Consolidated baseline methodology for GHG emission reduction for waste gas or waste heat or waste pressure based energy system” Methodology No &Version : ACM 0012, Version 02, Sectoral Scope: 1&4 EB 35 Other methodologies ACM 0012 draws upon : 1 “Tool for the demonstration and assessment of additionality” (Version 05) EB 39. 2 Tool to calculate the emission factor for an electricity system version 01

PROJECT DESIGN DOCUMENT FORM (CDM PDD) - Version 03.1. CDM – Executive Board page 9 EB 35 B.2 Justification of the choice of the methodology and why it is applicable to the project activity: The methodology applies to project activities that utilize waste gas or waste heat or waste pressure as energy source for generation of electricity. In line with the methodology the project activity utilizes only the waste heat from waste gases to generate electricity. Applicable conditions of Methodology How the project activity meets the conditions If project activity is use of waste pressure to generate electricity, electricity generated using waste gas pressure should be measurable
Project activity uses only waste heat from waste gases to generate electricity.
Energy generated in the project activity may be used within the industrial facility or exported outside the industrial facility
The project activity generates electricity from waste heat and the generated electricity is used within the LMEL industrial facility and balance is exported outside the industrial facility to consumers of power trading company by wheeling electricity through MSEDCL grid.
The electricity generated in the project activity may be exported to grid
The surplus electricity after meeting the electricity requirements of LMEL who is the generator of waste gases will be exported to consumers of power trading company by wheeling through MSEDCL grid.
Energy in the project activity can be generated by the owner of the industrial facility producing waste gas/heat or by a third party (e.g.ESCO) within the industrial facility.
LMEL produces the waste gases containing waste heat during their sponge iron manufacturing process and also generates electricity using the waste heat.
Regulations do not constrain the industrial facility generating waste gas from using the fossil fuels being used prior to the implementation of project activity
LMEL presently does not use the fossil fuel for electricity generation prior to the implementation of project activity. Regulations do not constrain LMEL generating waste gas from using the fossil fuels being used prior to the implementation of project activity.
The methodology covers both new and existing facilities. For existing facilities, the methodology applies to existing capacity, as well as to planned increases in capacity during the crediting period. If capacity expansion is planned, the added capacity must be treated as a new facility.
The sponge iron kilns are existing.The date of commercial operation can be taken as the date of consent to operate issued by MPCB. The details are as under: 1x500 TPD Sponge iron kilns Consent to operate letter dated BO/Wardha/RONR/R/C-388 Dated:12-05-1997 4x100 TPD Sponge iron kilns Consent to operate letter dated BO/PCI-II/RONG/EIC No-0475-05/O/CC-87 Dated 27-02-2006 The project activity is new facility of LMEL within the premises of LMEL who generate waste heat containing waste gases in their manufacturing process from 4x100 TPD and 1x500 TPD sponge iron kilns. LMEL have plans to expand sponge iron manufacturing facility and due to which additional waste heat containing waste gases will be generated in the process and LMEL have plans to install WHRB to generate steam and to generate additional waste heat based electricity and LMEL will approach again in future CDM EB for registration for
PROJECT DESIGN DOCUMENT FORM (CDM PDD) - Version 03.1. CDM – Executive Board page 10
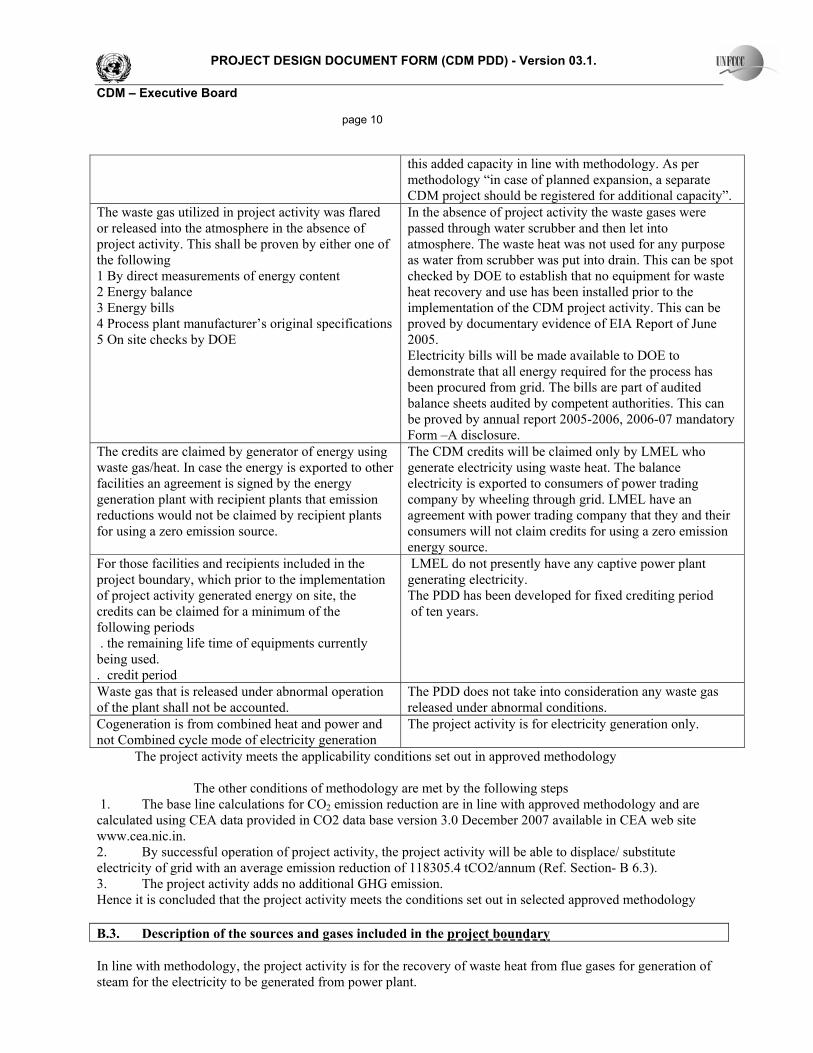
this added capacity in line with methodology. As per methodology “in case of planned expansion, a separate CDM project should be registered for additional capacity”.
The waste gas utilized in project activity was flared or released into the atmosphere in the absence of project activity. This shall be proven by either one of the following 1 By direct measurements of energy content 2 Energy balance 3 Energy bills 4 Process plant manufacturer’s original specifications 5 On site checks by DOE
In the absence of project activity the waste gases were passed through water scrubber and then let into atmosphere. The waste heat was not used for any purpose as water from scrubber was put into drain. This can be spot checked by DOE to establish that no equipment for waste heat recovery and use has been installed prior to the implementation of the CDM project activity. This can be proved by documentary evidence of EIA Report of June 2005. Electricity bills will be made available to DOE to demonstrate that all energy required for the process has been procured from grid. The bills are part of audited balance sheets audited by competent authorities. This can be proved by annual report 2005-2006, 2006-07 mandatory Form –A disclosure.
The credits are claimed by generator of energy using waste gas/heat. In case the energy is exported to other facilities an agreement is signed by the energy generation plant with recipient plants that emission reductions would not be claimed by recipient plants for using a zero emission source.
The CDM credits will be claimed only by LMEL who generate electricity using waste heat. The balance electricity is exported to consumers of power trading company by wheeling through grid. LMEL have an agreement with power trading company that they and their consumers will not claim credits for using a zero emission energy source.
For those facilities and recipients included in the project boundary, which prior to the implementation of project activity generated energy on site, the credits can be claimed for a minimum of the following periods . the remaining life time of equipments currently being used. . credit period
LMEL do not presently have any captive power plant generating electricity. The PDD has been developed for fixed crediting period of ten years.
Waste gas that is released under abnormal operation of the plant shall not be accounted.
The PDD does not take into consideration any waste gas released under abnormal conditions.
Cogeneration is from combined heat and power and not Combined cycle mode of electricity generation
The project activity is for electricity generation only.
The project activity meets the applicability conditions set out in approved methodology The other conditions of methodology are met by the following steps 1. The base line calculations for CO2 emission reduction are in line with approved methodology and are calculated using CEA data provided in CO2 data base version 3.0 December 2007 available in CEA web site www.cea.nic.in. 2. By successful operation of project activity, the project activity will be able to displace/ substitute electricity of grid with an average emission reduction of 118305.4 tCO2/annum (Ref. Section- B 6.3). 3. The project activity adds no additional GHG emission. Hence it is concluded that the project activity meets the conditions set out in selected approved methodology B.3. Description of the sources and gases included in the project boundary In line with methodology, the project activity is for the recovery of waste heat from flue gases for generation of steam for the electricity to be generated from power plant.
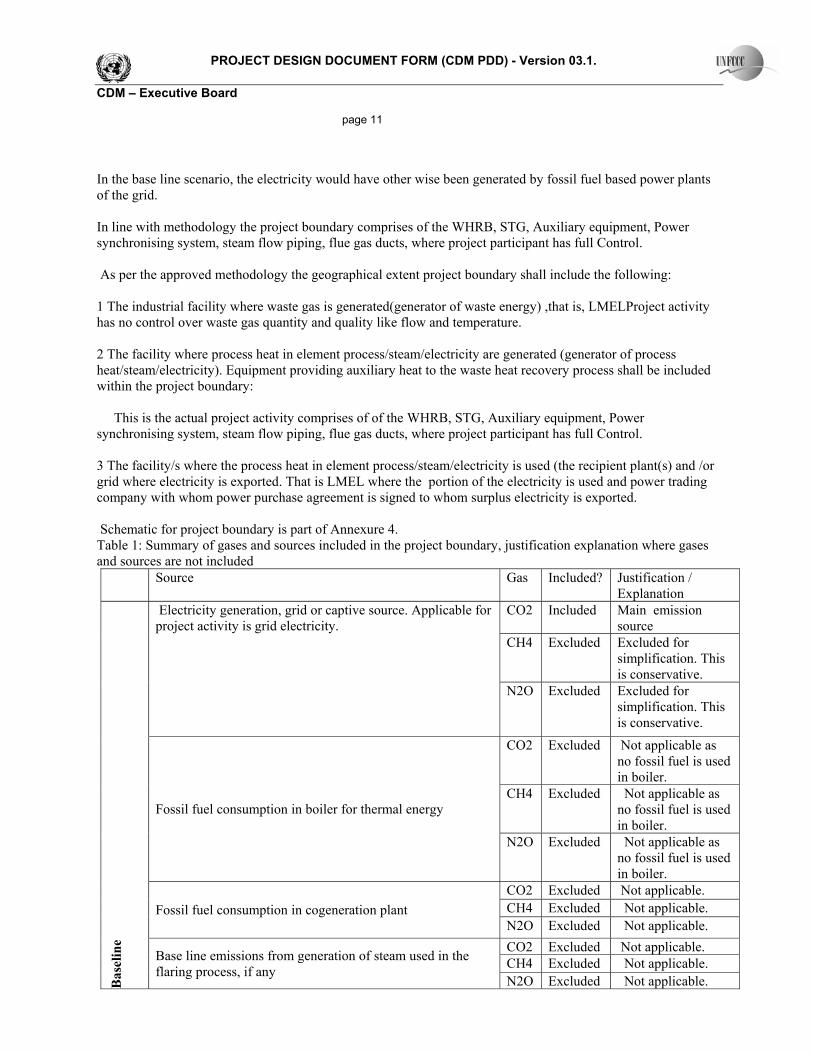
PROJECT DESIGN DOCUMENT FORM (CDM PDD) - Version 03.1. CDM – Executive Board page 11 In the base line scenario, the electricity would have other wise been generated by fossil fuel based power plants of the grid. In line with methodology the project boundary comprises of the WHRB, STG, Auxiliary equipment, Power synchronising system, steam flow piping, flue gas ducts, where project participant has full Control. As per the approved methodology the geographical extent project boundary shall include the following: 1 The industrial facility where waste gas is generated(generator of waste energy) ,that is, LMELProject activity has no control over waste gas quantity and quality like flow and temperature. 2 The facility where process heat in element process/steam/electricity are generated (generator of process heat/steam/electricity). Equipment providing auxiliary heat to the waste heat recovery process shall be included within the project boundary: This is the actual project activity comprises of of the WHRB, STG, Auxiliary equipment, Power synchronising system, steam flow piping, flue gas ducts, where project participant has full Control. 3 The facility/s where the process heat in element process/steam/electricity is used (the recipient plant(s) and /or grid where electricity is exported. That is LMEL where the portion of the electricity is used and power trading company with whom power purchase agreement is signed to whom surplus electricity is exported. Schematic for project boundary is part of Annexure 4. Table 1: Summary of gases and sources included in the project boundary, justification explanation where gases and sources are not included
Source Gas Included? Justification / Explanation
CO2 Included Main emission source
CH4 Excluded Excluded for simplification. This is conservative.
Electricity generation, grid or captive source. Applicable for project activity is grid electricity.
N2O Excluded Excluded for simplification. This is conservative.
CO2 Excluded Not applicable as no fossil fuel is used in boiler.
CH4 Excluded Not applicable as no fossil fuel is used in boiler.
Fossil fuel consumption in boiler for thermal energy
N2O Excluded Not applicable as no fossil fuel is used in boiler.
CO2 Excluded Not applicable. CH4 Excluded Not applicable. Fossil fuel consumption in cogeneration plant N2O Excluded Not applicable. CO2 Excluded Not applicable. CH4 Excluded Not applicable.
Bas
elin
e
Base line emissions from generation of steam used in the flaring process, if any
N2O Excluded Not applicable.
PROJECT DESIGN DOCUMENT FORM (CDM PDD) - Version 03.1. CDM – Executive Board page 12
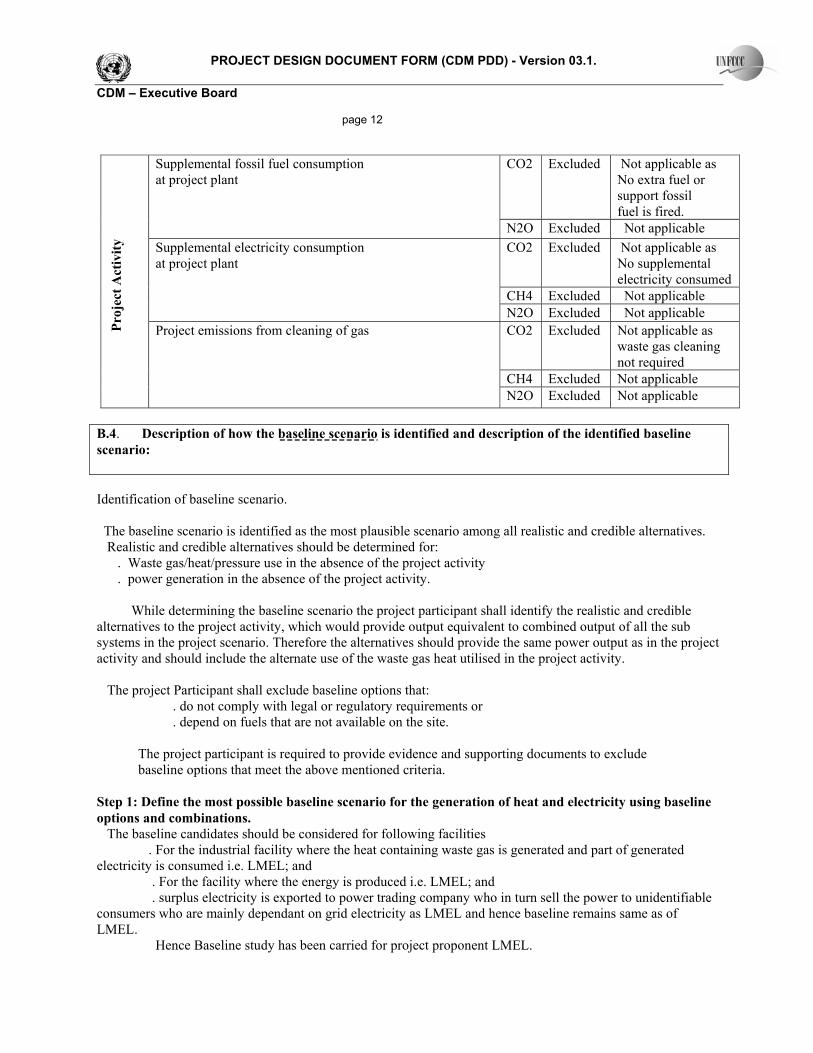
CO2 Excluded Not applicable as No extra fuel or support fossil fuel is fired.
Supplemental fossil fuel consumption at project plant
N2O Excluded Not applicable CO2 Excluded Not applicable as
No supplemental electricity consumed
CH4 Excluded Not applicable
Supplemental electricity consumption at project plant
N2O Excluded Not applicable CO2 Excluded Not applicable as
waste gas cleaning not required
CH4 Excluded Not applicable
P
roje
ct A
ctiv
ity
Project emissions from cleaning of gas
N2O Excluded Not applicable B.4. Description of how the baseline scenario is identified and description of the identified baseline scenario: Identification of baseline scenario. The baseline scenario is identified as the most plausible scenario among all realistic and credible alternatives. Realistic and credible alternatives should be determined for: . Waste gas/heat/pressure use in the absence of the project activity . power generation in the absence of the project activity. While determining the baseline scenario the project participant shall identify the realistic and credible alternatives to the project activity, which would provide output equivalent to combined output of all the sub systems in the project scenario. Therefore the alternatives should provide the same power output as in the project activity and should include the alternate use of the waste gas heat utilised in the project activity. The project Participant shall exclude baseline options that: . do not comply with legal or regulatory requirements or . depend on fuels that are not available on the site. The project participant is required to provide evidence and supporting documents to exclude baseline options that meet the above mentioned criteria. Step 1: Define the most possible baseline scenario for the generation of heat and electricity using baseline options and combinations. The baseline candidates should be considered for following facilities . For the industrial facility where the heat containing waste gas is generated and part of generated electricity is consumed i.e. LMEL; and . For the facility where the energy is produced i.e. LMEL; and . surplus electricity is exported to power trading company who in turn sell the power to unidentifiable consumers who are mainly dependant on grid electricity as LMEL and hence baseline remains same as of LMEL. Hence Baseline study has been carried for project proponent LMEL.
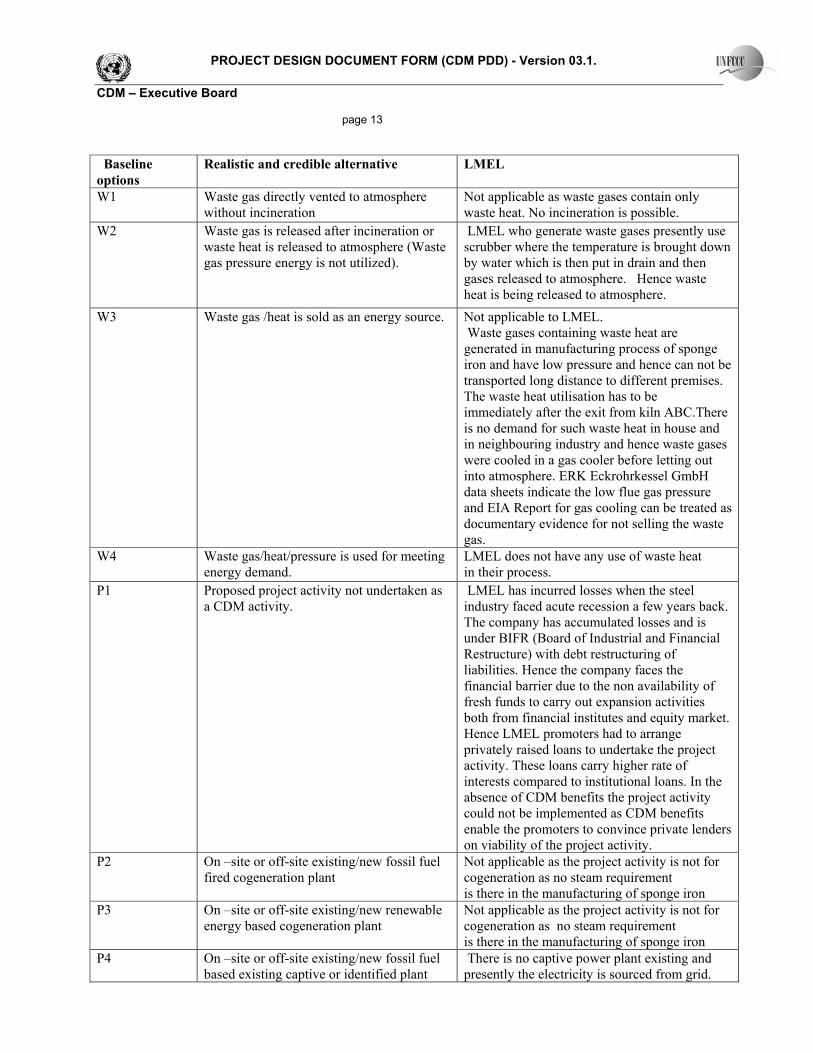
PROJECT DESIGN DOCUMENT FORM (CDM PDD) - Version 03.1. CDM – Executive Board page 13 Baseline options
Realistic and credible alternative LMEL
W1 Waste gas directly vented to atmosphere without incineration
Not applicable as waste gases contain only waste heat. No incineration is possible.
W2 Waste gas is released after incineration or waste heat is released to atmosphere (Waste gas pressure energy is not utilized).
LMEL who generate waste gases presently use scrubber where the temperature is brought down by water which is then put in drain and then gases released to atmosphere. Hence waste heat is being released to atmosphere.
W3 Waste gas /heat is sold as an energy source. Not applicable to LMEL. Waste gases containing waste heat are generated in manufacturing process of sponge iron and have low pressure and hence can not be transported long distance to different premises. The waste heat utilisation has to be immediately after the exit from kiln ABC.There is no demand for such waste heat in house and in neighbouring industry and hence waste gases were cooled in a gas cooler before letting out into atmosphere. ERK Eckrohrkessel GmbH data sheets indicate the low flue gas pressure and EIA Report for gas cooling can be treated as documentary evidence for not selling the waste gas.
W4 Waste gas/heat/pressure is used for meeting energy demand.
LMEL does not have any use of waste heat in their process.
P1 Proposed project activity not undertaken as a CDM activity.
LMEL has incurred losses when the steel industry faced acute recession a few years back. The company has accumulated losses and is under BIFR (Board of Industrial and Financial Restructure) with debt restructuring of liabilities. Hence the company faces the financial barrier due to the non availability of fresh funds to carry out expansion activities both from financial institutes and equity market. Hence LMEL promoters had to arrange privately raised loans to undertake the project activity. These loans carry higher rate of interests compared to institutional loans. In the absence of CDM benefits the project activity could not be implemented as CDM benefits enable the promoters to convince private lenders on viability of the project activity.
P2 On –site or off-site existing/new fossil fuel fired cogeneration plant
Not applicable as the project activity is not for cogeneration as no steam requirement is there in the manufacturing of sponge iron
P3 On –site or off-site existing/new renewable energy based cogeneration plant
Not applicable as the project activity is not for cogeneration as no steam requirement is there in the manufacturing of sponge iron
P4 On –site or off-site existing/new fossil fuel based existing captive or identified plant
There is no captive power plant existing and presently the electricity is sourced from grid.
PROJECT DESIGN DOCUMENT FORM (CDM PDD) - Version 03.1. CDM – Executive Board page 14
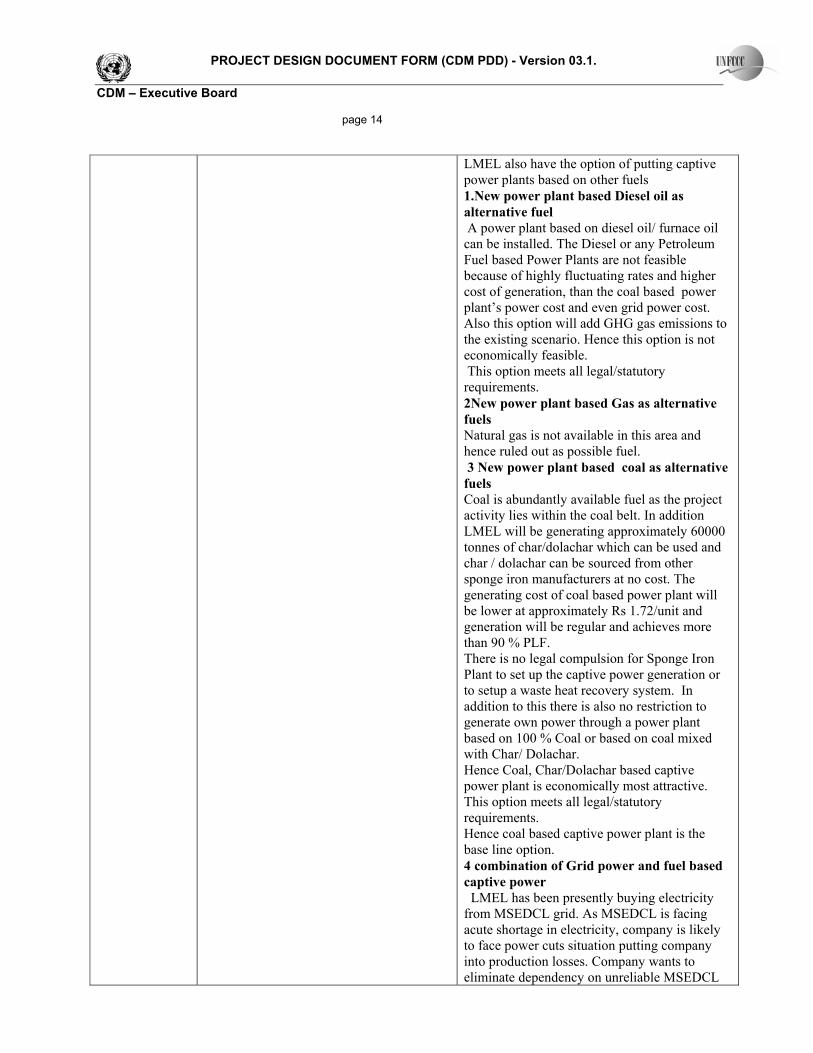
LMEL also have the option of putting captive power plants based on other fuels 1.New power plant based Diesel oil as alternative fuel A power plant based on diesel oil/ furnace oil can be installed. The Diesel or any Petroleum Fuel based Power Plants are not feasible because of highly fluctuating rates and higher cost of generation, than the coal based power plant’s power cost and even grid power cost. Also this option will add GHG gas emissions to the existing scenario. Hence this option is not economically feasible. This option meets all legal/statutory requirements. 2New power plant based Gas as alternative fuels Natural gas is not available in this area and hence ruled out as possible fuel. 3 New power plant based coal as alternative fuels Coal is abundantly available fuel as the project activity lies within the coal belt. In addition LMEL will be generating approximately 60000 tonnes of char/dolachar which can be used and char / dolachar can be sourced from other sponge iron manufacturers at no cost. The generating cost of coal based power plant will be lower at approximately Rs 1.72/unit and generation will be regular and achieves more than 90 % PLF. There is no legal compulsion for Sponge Iron Plant to set up the captive power generation or to setup a waste heat recovery system. In addition to this there is also no restriction to generate own power through a power plant based on 100 % Coal or based on coal mixed with Char/ Dolachar. Hence Coal, Char/Dolachar based captive power plant is economically most attractive. This option meets all legal/statutory requirements. Hence coal based captive power plant is the base line option. 4 combination of Grid power and fuel based captive power LMEL has been presently buying electricity from MSEDCL grid. As MSEDCL is facing acute shortage in electricity, company is likely to face power cuts situation putting company into production losses. Company wants to eliminate dependency on unreliable MSEDCL
PROJECT DESIGN DOCUMENT FORM (CDM PDD) - Version 03.1. CDM – Executive Board page 15
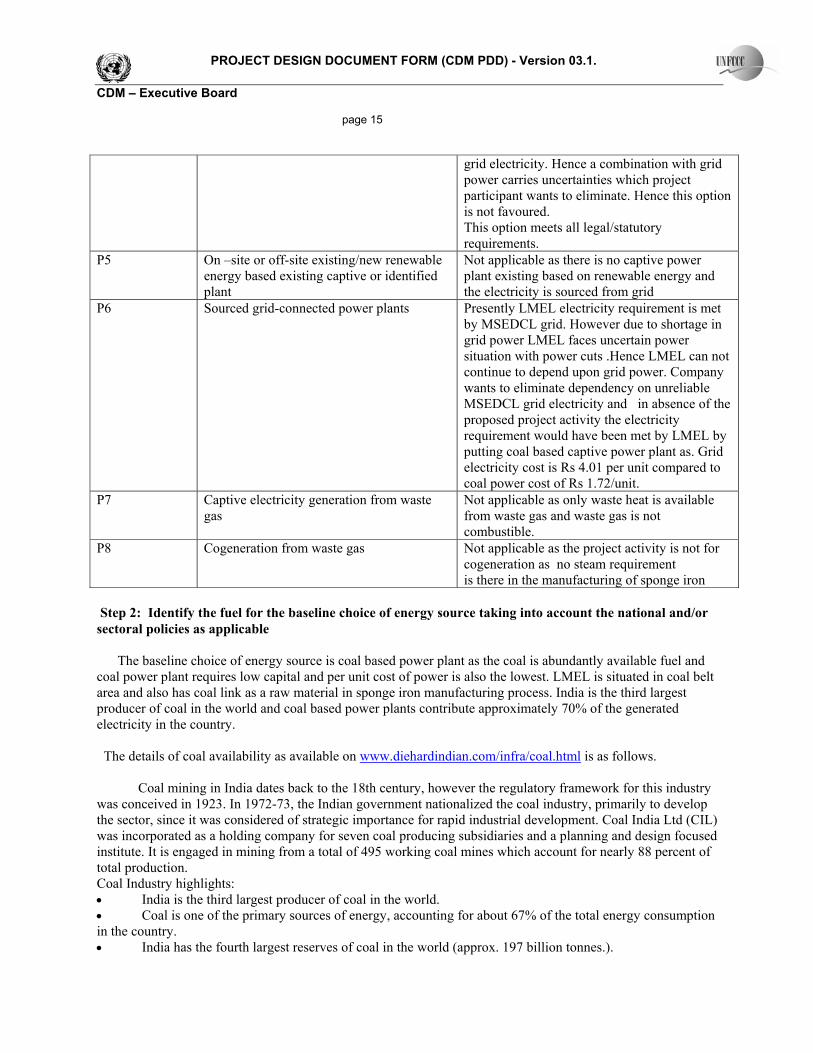
grid electricity. Hence a combination with grid power carries uncertainties which project participant wants to eliminate. Hence this option is not favoured. This option meets all legal/statutory requirements.
P5 On –site or off-site existing/new renewable energy based existing captive or identified plant
Not applicable as there is no captive power plant existing based on renewable energy and the electricity is sourced from grid
P6 Sourced grid-connected power plants Presently LMEL electricity requirement is met by MSEDCL grid. However due to shortage in grid power LMEL faces uncertain power situation with power cuts .Hence LMEL can not continue to depend upon grid power. Company wants to eliminate dependency on unreliable MSEDCL grid electricity and in absence of the proposed project activity the electricity requirement would have been met by LMEL by putting coal based captive power plant as. Grid electricity cost is Rs 4.01 per unit compared to coal power cost of Rs 1.72/unit.
P7 Captive electricity generation from waste gas
Not applicable as only waste heat is available from waste gas and waste gas is not combustible.
P8 Cogeneration from waste gas Not applicable as the project activity is not for cogeneration as no steam requirement is there in the manufacturing of sponge iron
Step 2: Identify the fuel for the baseline choice of energy source taking into account the national and/or sectoral policies as applicable The baseline choice of energy source is coal based power plant as the coal is abundantly available fuel and coal power plant requires low capital and per unit cost of power is also the lowest. LMEL is situated in coal belt area and also has coal link as a raw material in sponge iron manufacturing process. India is the third largest producer of coal in the world and coal based power plants contribute approximately 70% of the generated electricity in the country. The details of coal availability as available on www.diehardindian.com/infra/coal.html is as follows. Coal mining in India dates back to the 18th century, however the regulatory framework for this industry was conceived in 1923. In 1972-73, the Indian government nationalized the coal industry, primarily to develop the sector, since it was considered of strategic importance for rapid industrial development. Coal India Ltd (CIL) was incorporated as a holding company for seven coal producing subsidiaries and a planning and design focused institute. It is engaged in mining from a total of 495 working coal mines which account for nearly 88 percent of total production. Coal Industry highlights: • India is the third largest producer of coal in the world. • Coal is one of the primary sources of energy, accounting for about 67% of the total energy consumption in the country. • India has the fourth largest reserves of coal in the world (approx. 197 billion tonnes.).

PROJECT DESIGN DOCUMENT FORM (CDM PDD) - Version 03.1. CDM – Executive Board page 16 • Coal deposits in India occur mostly in thick seams and at shallow depths. Noncoking coal reserves aggregate 172.1 billion tonnes (85 per cent) while coking coal reserves are 29.8 billion tonnes (the remaining 15 per cent). • Indian coal has high ash content (15-45%) and low calorific value. • With the present rate of around 0.8 million tons average daily coal extraction in the country, the reserves are likely to last over 100 years. • The energy derived from coal in India is about twice that of energy derived from oil, as against the world, where energy derived from coal is about 30% lower than energy derived from oil. • As of 2003, India has 19 coal washeries (total capacity: 27.2 million tonnes per annum) of which 15 are owned by CIL. • The use of beneficiated coal has gained acceptance in steel plants and power plants located at a distance from the pithead. Energy and Environment 27 November 2006, Forbes magazine. China India Recoverable Coal Reserves 126,214.7 million Short tons 101,903.2 million Short tons Coal Production 2,156.4 million Short tons 403.1 million Short tons Coal Consumption 2,062.4 million Short tons 430.6 million Short tons Production India has huge untapped potential for underground mining with extractable reserves up to a depth of 600 meters. Currently mining is done predominantly by open cast methods to exploit the 64 billion tonnes of proven reserves situated within a depth of 300 meters. Lower operating and production costs, greater percentage recovery and a higher output per man shift compared with underground mining are some of the advantages presently associated with open cast mining in India. External trade Presently, India is not a major exporter of coal and essentially caters to the demands of neighboring countries like Bangladesh, Nepal and Bhutan. However, there are no restrictions on coal exports under the existing Export-Import Policy of India. India imports small quantities of low ash-content coal principally for use by steel plants, which blend it with Indian coal. Import duties are low and are expected to be lowered further. A look into the future India's coal demand is expected to increase manifold within the next 5 to 10 years due to the completion of on-going coal;-based power projects, and demand from metallurgical and other industries. Demand for coal has been rising at an annual rate of 6 per cent since 1992-93 and CIL and its subsidiaries will be unable to meet the projected demand alone. The investment needed to bridge the gap----400 million tonnes, between the level of production in the public sector (290 million tonnes in 1995-96) and the projected demand of 690 million tonnes (2009-10)----is estimated to be US$ 18 billion. The public sector corporations----are expected to increase their production by about 250 million tonnes by 2009-10, subject to their making an additional investment of US$ 8-10 billion. The balance requirement of 150 million tonnes will have to be met by imports in the short run and by new investments in the long run. With the advent of the economic reforms, government controls regarding pricing and distribution have been relaxed and a new coal policy permitting private sector participation in commercial coal mining has been announced. STEP 3: Step 2 and/or Step 3 of the latest approved version of the “ Tool for the demonstration and assessment of additionality ’’ shall be used to identify the most plausible baseline scenarios by eliminating non feasible options

PROJECT DESIGN DOCUMENT FORM (CDM PDD) - Version 03.1. CDM – Executive Board page 17 Section B.5 covers the stepwise demonstration of additionality as per the “Tool for the demonstration and assessment of additionality version 05 EB 39 ’’. We have demonstrated the additionality based on step 2 and parameters have been worked out based on IRR and option III bench mark analysis. Comparison between coal based power plant IRR and WHRB based power plant are as follows: IRR Bench mark Coal based power
plant
WHRB based power without CDM credits
WHRB based power plant with CDM credits
Equity 14% 23.5% 1.5% 7.7% Coal based power plant Equity IRR exceeds the bench mark and becomes economically attractive option. We have worked out levelised costs and the comparision as follows: Power Cost/unit FBC power Rs 1.72 Grid power Rs 4.01 WHRB power Rs 1.96 As coal based electricity cost is the cheapest the same is the baseline. STEP 4: If more than one credible and plausible alternative scenario remain, the alternative with the lowest base line emissions shall be considered as the most likely baseline scenario. Project scenario: Generation of Electricity
Scenario Baseline option Waste gas Power 1 W2 P4
As coal based electricity cost is the cheapest the same is the most appropriate baseline P4 scenario. It is most economical for LMEL to put coal based captive power plant. Hence in the absence of project activity LMEL will put coal based captive power plant. However as LMEL exports surplus electricity to power trading company who supply to consumers not identifiable but are normally using grid power and grid power conservatively gives lower emission factor and lower emission reductions and hence grid electricity P6 is considered to calculate baseline emissions reductions even though continuation of using only grid power is not an option for LMEL. We give below the comparison of emission factors The excel calculations for a new coal based captive power plant and grid electricity are enclosed to prove the grid emission factor is lower than coal based captive power plant. We give below the calculated emission factor 1Grid emission factor is 0.795 t CO2/MWh 2 Coal based CPP emission factor 1.09 t CO2/MWh. The MSEDCL grid power is being used by LMEL at the moment. We select western grid electricity of which MSEDCL is a part and hence western grid electricity emission factor used to calculate baseline emission reductions which will give conservative reduction in base line emissions as grid power is mainly coal based but also comprises of diesel, hydel and nuclear power which will give lower emission factor for grid compared to coal based power plant.
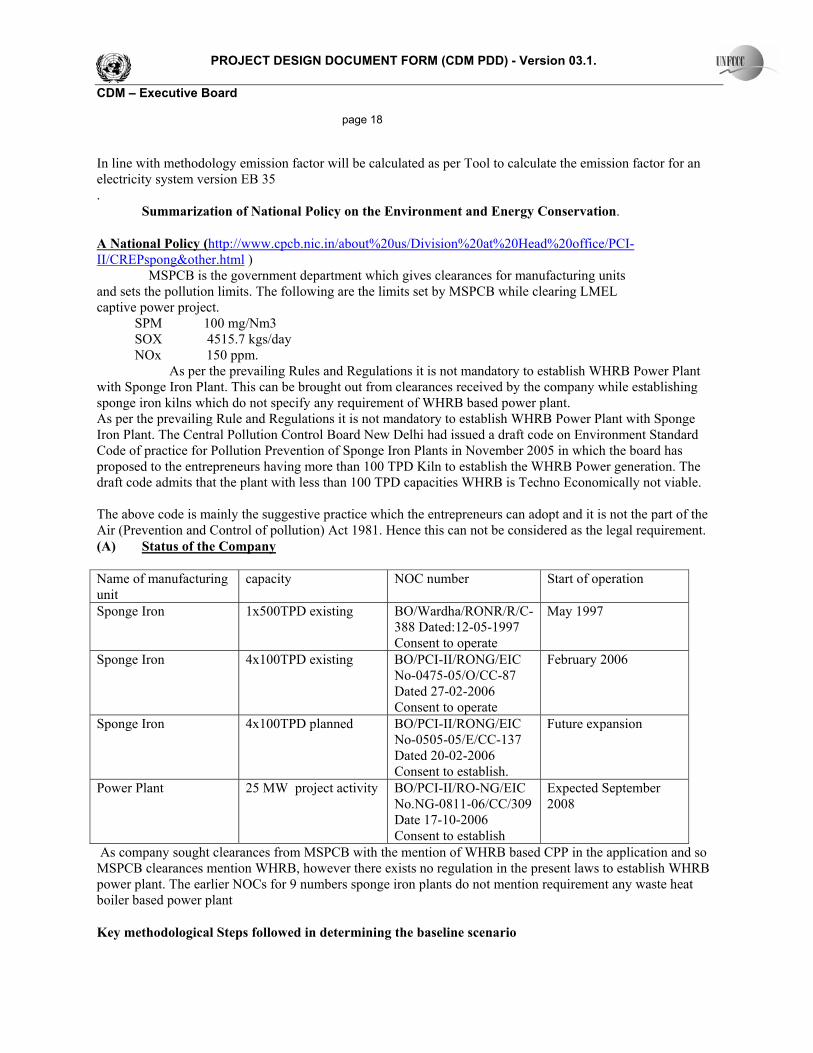
PROJECT DESIGN DOCUMENT FORM (CDM PDD) - Version 03.1. CDM – Executive Board page 18 In line with methodology emission factor will be calculated as per Tool to calculate the emission factor for an electricity system version EB 35 . Summarization of National Policy on the Environment and Energy Conservation. A National Policy (http://www.cpcb.nic.in/about%20us/Division%20at%20Head%20office/PCI-II/CREPspong&other.html ) MSPCB is the government department which gives clearances for manufacturing units and sets the pollution limits. The following are the limits set by MSPCB while clearing LMEL captive power project. SPM 100 mg/Nm3 SOX 4515.7 kgs/day NOx 150 ppm. As per the prevailing Rules and Regulations it is not mandatory to establish WHRB Power Plant with Sponge Iron Plant. This can be brought out from clearances received by the company while establishing sponge iron kilns which do not specify any requirement of WHRB based power plant. As per the prevailing Rule and Regulations it is not mandatory to establish WHRB Power Plant with Sponge Iron Plant. The Central Pollution Control Board New Delhi had issued a draft code on Environment Standard Code of practice for Pollution Prevention of Sponge Iron Plants in November 2005 in which the board has proposed to the entrepreneurs having more than 100 TPD Kiln to establish the WHRB Power generation. The draft code admits that the plant with less than 100 TPD capacities WHRB is Techno Economically not viable. The above code is mainly the suggestive practice which the entrepreneurs can adopt and it is not the part of the Air (Prevention and Control of pollution) Act 1981. Hence this can not be considered as the legal requirement. (A) Status of the Company Name of manufacturing unit
capacity NOC number Start of operation
Sponge Iron 1x500TPD existing BO/Wardha/RONR/R/C-388 Dated:12-05-1997 Consent to operate
May 1997
Sponge Iron 4x100TPD existing BO/PCI-II/RONG/EIC No-0475-05/O/CC-87 Dated 27-02-2006 Consent to operate
February 2006
Sponge Iron 4x100TPD planned BO/PCI-II/RONG/EIC No-0505-05/E/CC-137 Dated 20-02-2006 Consent to establish.
Future expansion
Power Plant 25 MW project activity BO/PCI-II/RO-NG/EIC No.NG-0811-06/CC/309 Date 17-10-2006 Consent to establish
Expected September 2008
As company sought clearances from MSPCB with the mention of WHRB based CPP in the application and so MSPCB clearances mention WHRB, however there exists no regulation in the present laws to establish WHRB power plant. The earlier NOCs for 9 numbers sponge iron plants do not mention requirement any waste heat boiler based power plant Key methodological Steps followed in determining the baseline scenario
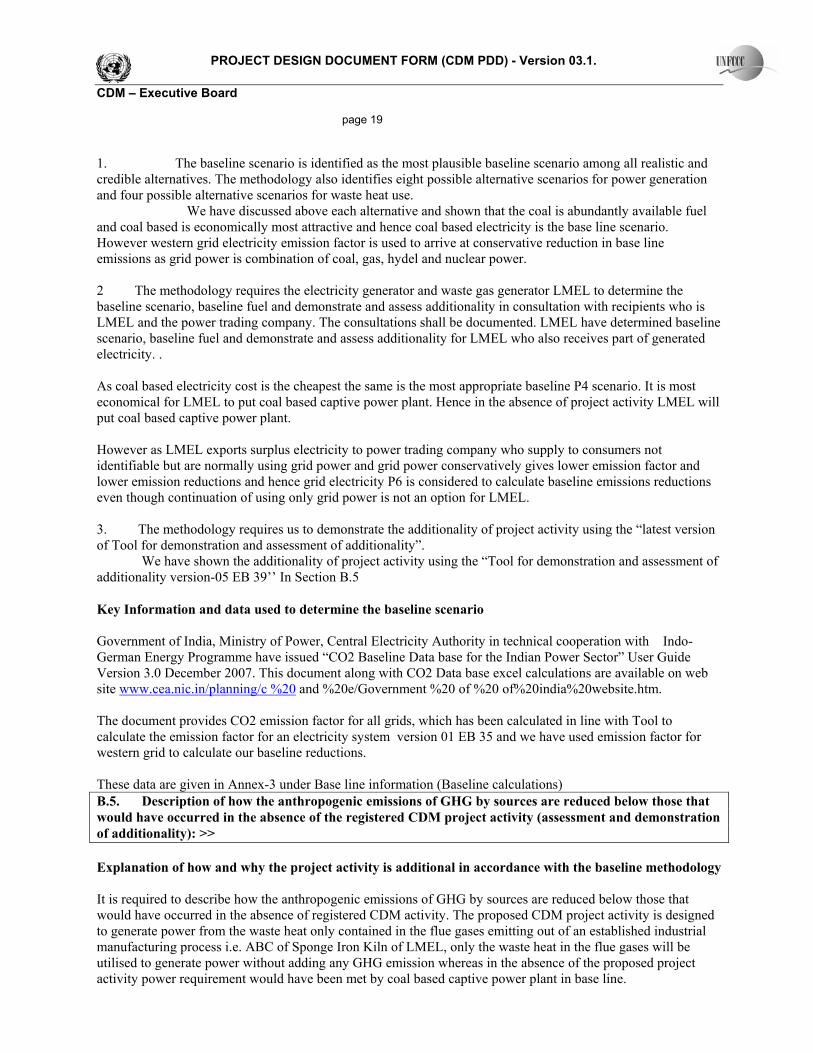
PROJECT DESIGN DOCUMENT FORM (CDM PDD) - Version 03.1. CDM – Executive Board page 19 1. The baseline scenario is identified as the most plausible baseline scenario among all realistic and credible alternatives. The methodology also identifies eight possible alternative scenarios for power generation and four possible alternative scenarios for waste heat use. We have discussed above each alternative and shown that the coal is abundantly available fuel and coal based is economically most attractive and hence coal based electricity is the base line scenario. However western grid electricity emission factor is used to arrive at conservative reduction in base line emissions as grid power is combination of coal, gas, hydel and nuclear power. 2 The methodology requires the electricity generator and waste gas generator LMEL to determine the baseline scenario, baseline fuel and demonstrate and assess additionality in consultation with recipients who is LMEL and the power trading company. The consultations shall be documented. LMEL have determined baseline scenario, baseline fuel and demonstrate and assess additionality for LMEL who also receives part of generated electricity. . As coal based electricity cost is the cheapest the same is the most appropriate baseline P4 scenario. It is most economical for LMEL to put coal based captive power plant. Hence in the absence of project activity LMEL will put coal based captive power plant. However as LMEL exports surplus electricity to power trading company who supply to consumers not identifiable but are normally using grid power and grid power conservatively gives lower emission factor and lower emission reductions and hence grid electricity P6 is considered to calculate baseline emissions reductions even though continuation of using only grid power is not an option for LMEL. 3. The methodology requires us to demonstrate the additionality of project activity using the “latest version of Tool for demonstration and assessment of additionality”. We have shown the additionality of project activity using the “Tool for demonstration and assessment of additionality version-05 EB 39’’ In Section B.5 Key Information and data used to determine the baseline scenario Government of India, Ministry of Power, Central Electricity Authority in technical cooperation with Indo-German Energy Programme have issued “CO2 Baseline Data base for the Indian Power Sector” User Guide Version 3.0 December 2007. This document along with CO2 Data base excel calculations are available on web site www.cea.nic.in/planning/c %20 and %20e/Government %20 of %20 of%20india%20website.htm. The document provides CO2 emission factor for all grids, which has been calculated in line with Tool to calculate the emission factor for an electricity system version 01 EB 35 and we have used emission factor for western grid to calculate our baseline reductions. These data are given in Annex-3 under Base line information (Baseline calculations) B.5. Description of how the anthropogenic emissions of GHG by sources are reduced below those that would have occurred in the absence of the registered CDM project activity (assessment and demonstration of additionality): >> Explanation of how and why the project activity is additional in accordance with the baseline methodology It is required to describe how the anthropogenic emissions of GHG by sources are reduced below those that would have occurred in the absence of registered CDM activity. The proposed CDM project activity is designed to generate power from the waste heat only contained in the flue gases emitting out of an established industrial manufacturing process i.e. ABC of Sponge Iron Kiln of LMEL, only the waste heat in the flue gases will be utilised to generate power without adding any GHG emission whereas in the absence of the proposed project activity power requirement would have been met by coal based captive power plant in base line.
PROJECT DESIGN DOCUMENT FORM (CDM PDD) - Version 03.1. CDM – Executive Board page 20 However as LMEL exports surplus power to power trading company who supply electricity to consumers who mainly use grid power , hence grid power emission factor is used to calculate the emission reductions for arriving at conservative emission reductions.. It is required to explain how and why the proposed project activity is additional and therefore not the baseline scenario in accordance to the selected baseline methodology. As per the decision 17 / CP.7 AND 18/CP.9 a CDM activity is additional, if anthropogenic emissions of GHGs by sources are reduced below those that would have occurred in the absence of registered project activity. The tool for the demonstrations and assessment of additionality (version 05) EB 39 requires the project participant to demonstrate and assess additionality, as per the steps given below: 1) Identification of alternative to project activity. 2) Investment analysis to determine that the project activity is either 1) not the most economically or financially attractive, or 2) not economically or financially feasible. 3) Barrier analysis. 4) Common practice analysis. We have discussed realistic and credible alternatives available to project activity in B.4 and have come to conclusion that coal based power plant is the most economical base line option. However as LMEL is using MSEDCL grid electricity presently, LMEL have selected western region grid electricity of which MSEDCL is a part as the baseline scenario to arrive at conservative baseline reductions. We hereby proceed to establish the additionality of proposed project activity using “the tool for the demonstration and assessment of additionality” (version 05) EB 39. As per the guidelines for PDD preparation it is needed to demonstrate the consideration of CDM benefits were seriously considered if the starting date of project activity is before validation date. The board discussed in detailed manner regarding CDM benefits during the board meeting of 28-10-2006. We give below the Summary of the board meetings 1. The problem of power cuts and resulting production losses was discussed in the meeting. The managing director proposed the installation of captive power generation. Lloyds Steel Industries Ltd (LSIL) was appointed as consultant. 2. LSIL made presentation before the Board that waste heat available in flue gases from kilns can generate more than 25 MW. LSIL suggested that one 25 MW Siemens make STG is available readily and the same can be used in captive power plant. The steam required will be generated from 5 WHRBS at optimum conditions. The additional 4 number WHRB steam will improve the PLF of CPP and a new turbine can be added for use along with existing turbine to increase the electricity generation at a later date. 3 High project cost due to 9 boilers and instead only putting one coal based FBC boiler based captive power plant was discussed in detail. LSIL informed the board regarding CDM and the fact that a project of WHRB based CPP from Chattisgarh state has been registered with CDM EB for availing CDM benefits. LSIL suggested that company can apply for CDM registration and CDM benefits would make WHRB project viable. After board deliberations it was decided to establish WHRB based captive power plant and apply for CDM benefits. Board also appointed LSIL as consultant for CDM activities. The project activity is for 5 boilers capable of giving 102 tonnes/h steam required for 25 MW electricity generation. The balance 4 boilers will come up when expansion of 4x100 TPD kilns is executed for which LMEL have consent to establish from MSPCB and as already stated LMEL plan to approach CDM for planned addition in future.
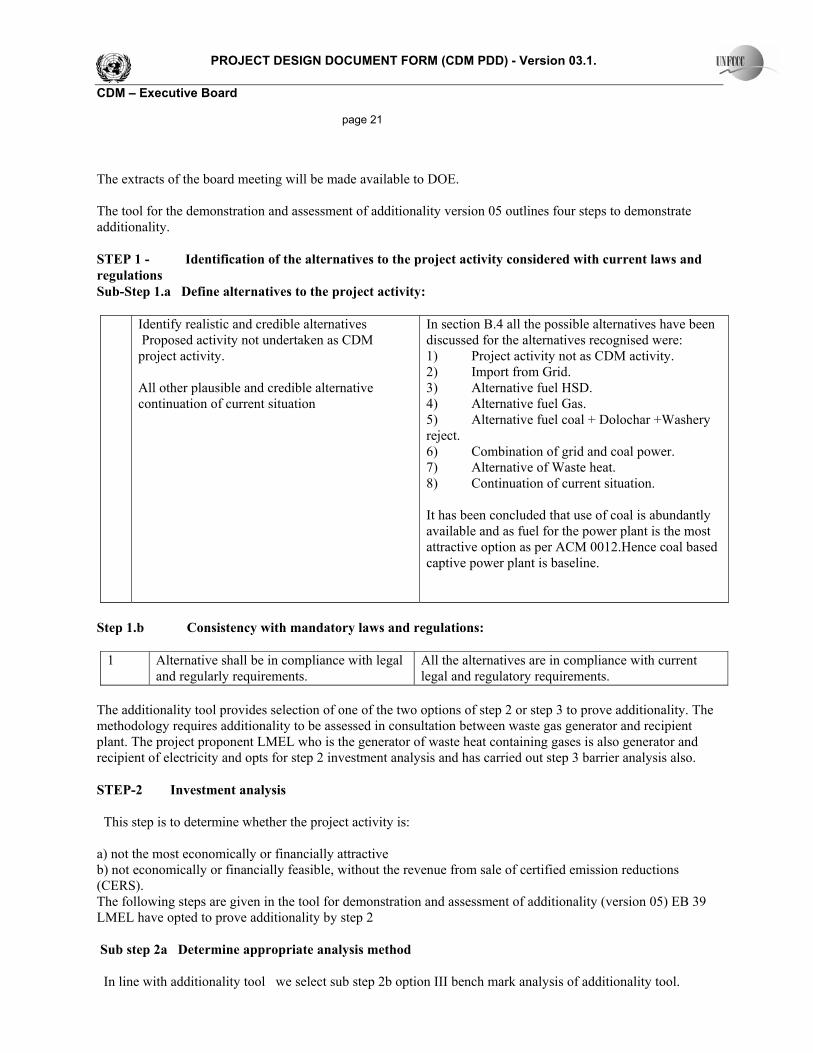
PROJECT DESIGN DOCUMENT FORM (CDM PDD) - Version 03.1. CDM – Executive Board page 21 The extracts of the board meeting will be made available to DOE. The tool for the demonstration and assessment of additionality version 05 outlines four steps to demonstrate additionality. STEP 1 - Identification of the alternatives to the project activity considered with current laws and regulations Sub-Step 1.a Define alternatives to the project activity:
Identify realistic and credible alternatives Proposed activity not undertaken as CDM project activity. All other plausible and credible alternative continuation of current situation
In section B.4 all the possible alternatives have been discussed for the alternatives recognised were: 1) Project activity not as CDM activity. 2) Import from Grid. 3) Alternative fuel HSD. 4) Alternative fuel Gas. 5) Alternative fuel coal + Dolochar +Washery reject. 6) Combination of grid and coal power. 7) Alternative of Waste heat. 8) Continuation of current situation. It has been concluded that use of coal is abundantly available and as fuel for the power plant is the most attractive option as per ACM 0012.Hence coal based captive power plant is baseline.
Step 1.b Consistency with mandatory laws and regulations:
1 Alternative shall be in compliance with legal and regularly requirements.
All the alternatives are in compliance with current legal and regulatory requirements.
The additionality tool provides selection of one of the two options of step 2 or step 3 to prove additionality. The methodology requires additionality to be assessed in consultation between waste gas generator and recipient plant. The project proponent LMEL who is the generator of waste heat containing gases is also generator and recipient of electricity and opts for step 2 investment analysis and has carried out step 3 barrier analysis also. STEP-2 Investment analysis This step is to determine whether the project activity is: a) not the most economically or financially attractive b) not economically or financially feasible, without the revenue from sale of certified emission reductions (CERS). The following steps are given in the tool for demonstration and assessment of additionality (version 05) EB 39 LMEL have opted to prove additionality by step 2 Sub step 2a Determine appropriate analysis method In line with additionality tool we select sub step 2b option III bench mark analysis of additionality tool.
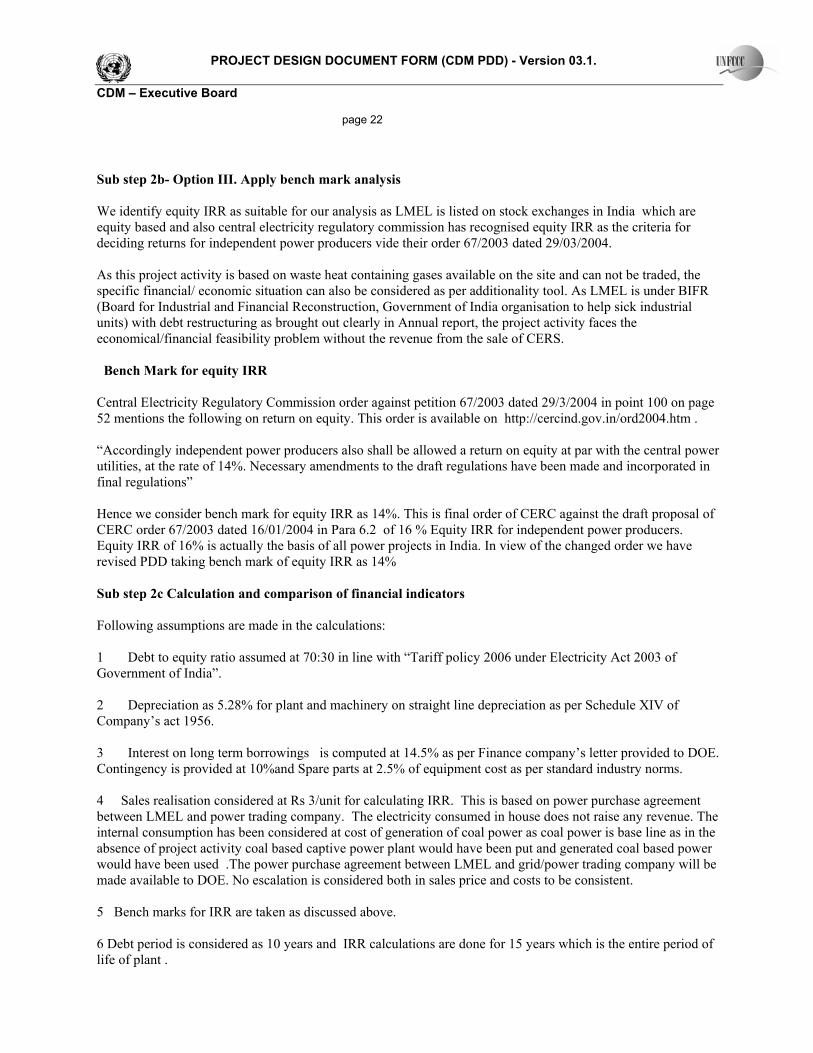
PROJECT DESIGN DOCUMENT FORM (CDM PDD) - Version 03.1. CDM – Executive Board page 22 Sub step 2b- Option III. Apply bench mark analysis We identify equity IRR as suitable for our analysis as LMEL is listed on stock exchanges in India which are equity based and also central electricity regulatory commission has recognised equity IRR as the criteria for deciding returns for independent power producers vide their order 67/2003 dated 29/03/2004. As this project activity is based on waste heat containing gases available on the site and can not be traded, the specific financial/ economic situation can also be considered as per additionality tool. As LMEL is under BIFR (Board for Industrial and Financial Reconstruction, Government of India organisation to help sick industrial units) with debt restructuring as brought out clearly in Annual report, the project activity faces the economical/financial feasibility problem without the revenue from the sale of CERS. Bench Mark for equity IRR Central Electricity Regulatory Commission order against petition 67/2003 dated 29/3/2004 in point 100 on page 52 mentions the following on return on equity. This order is available on http://cercind.gov.in/ord2004.htm . “Accordingly independent power producers also shall be allowed a return on equity at par with the central power utilities, at the rate of 14%. Necessary amendments to the draft regulations have been made and incorporated in final regulations” Hence we consider bench mark for equity IRR as 14%. This is final order of CERC against the draft proposal of CERC order 67/2003 dated 16/01/2004 in Para 6.2 of 16 % Equity IRR for independent power producers. Equity IRR of 16% is actually the basis of all power projects in India. In view of the changed order we have revised PDD taking bench mark of equity IRR as 14% Sub step 2c Calculation and comparison of financial indicators Following assumptions are made in the calculations: 1 Debt to equity ratio assumed at 70:30 in line with “Tariff policy 2006 under Electricity Act 2003 of Government of India”. 2 Depreciation as 5.28% for plant and machinery on straight line depreciation as per Schedule XIV of Company’s act 1956. 3 Interest on long term borrowings is computed at 14.5% as per Finance company’s letter provided to DOE. Contingency is provided at 10%and Spare parts at 2.5% of equipment cost as per standard industry norms. 4 Sales realisation considered at Rs 3/unit for calculating IRR. This is based on power purchase agreement between LMEL and power trading company. The electricity consumed in house does not raise any revenue. The internal consumption has been considered at cost of generation of coal power as coal power is base line as in the absence of project activity coal based captive power plant would have been put and generated coal based power would have been used .The power purchase agreement between LMEL and grid/power trading company will be made available to DOE. No escalation is considered both in sales price and costs to be consistent. 5 Bench marks for IRR are taken as discussed above. 6 Debt period is considered as 10 years and IRR calculations are done for 15 years which is the entire period of life of plant .
PROJECT DESIGN DOCUMENT FORM (CDM PDD) - Version 03.1. CDM – Executive Board page 23
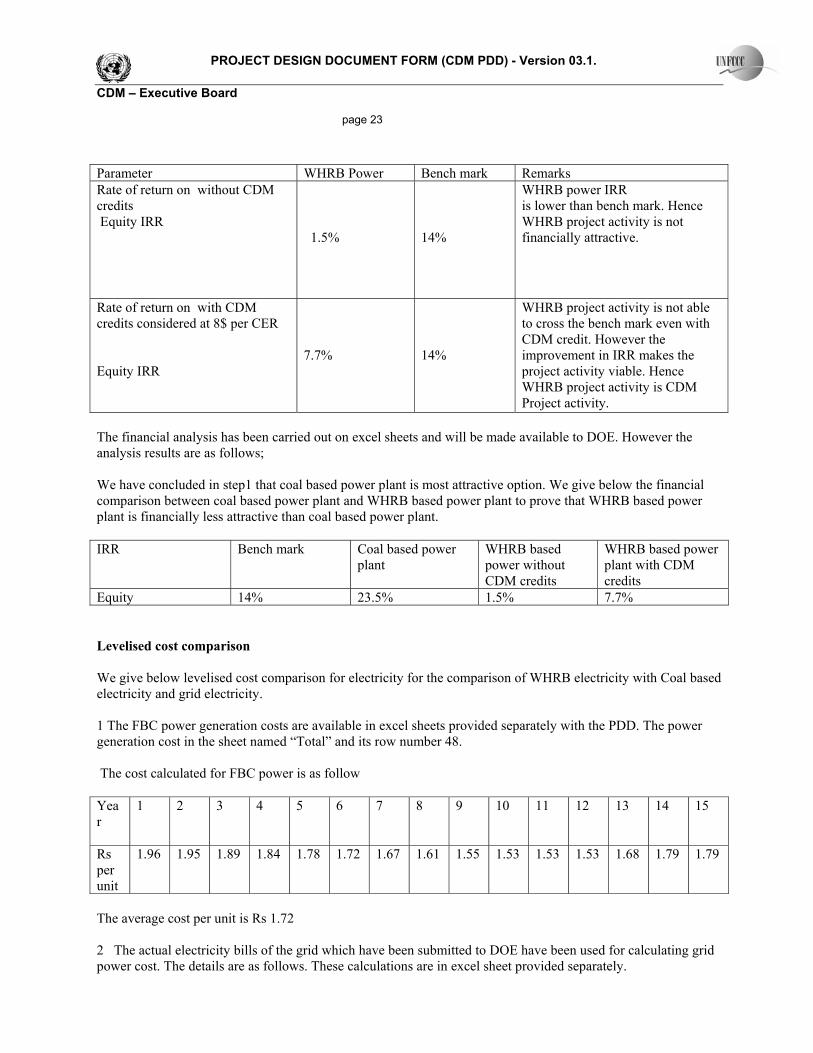
The financial analysis has been carried out on excel sheets and will be made available to DOE. However the analysis results are as follows; We have concluded in step1 that coal based power plant is most attractive option. We give below the financial comparison between coal based power plant and WHRB based power plant to prove that WHRB based power plant is financially less attractive than coal based power plant. IRR Bench mark Coal based power
plant WHRB based power without CDM credits
WHRB based power plant with CDM credits
Equity 14% 23.5% 1.5% 7.7% Levelised cost comparison We give below levelised cost comparison for electricity for the comparison of WHRB electricity with Coal based electricity and grid electricity. 1 The FBC power generation costs are available in excel sheets provided separately with the PDD. The power generation cost in the sheet named “Total” and its row number 48. The cost calculated for FBC power is as follow Year
1 2 3 4 5 6 7 8 9 10 11 12 13 14 15
Rs per unit
1.96 1.95 1.89 1.84 1.78 1.72 1.67 1.61 1.55 1.53 1.53 1.53 1.68 1.79 1.79
The average cost per unit is Rs 1.72 2 The actual electricity bills of the grid which have been submitted to DOE have been used for calculating grid power cost. The details are as follows. These calculations are in excel sheet provided separately.
Parameter WHRB Power Bench mark Remarks Rate of return on without CDM credits Equity IRR
1.5%
14%
WHRB power IRR is lower than bench mark. Hence WHRB project activity is not financially attractive.
Rate of return on with CDM credits considered at 8$ per CER Equity IRR
7.7%
14%
WHRB project activity is not able to cross the bench mark even with CDM credit. However the improvement in IRR makes the project activity viable. Hence WHRB project activity is CDM Project activity.

PROJECT DESIGN DOCUMENT FORM (CDM PDD) - Version 03.1. CDM – Executive Board page 24 Billed Month May 2007 June 2007 July 2007 Units consumed 2085840 1821240 1963740 Bill Amount 9576507.81 7272432 6803275 Grid electricity/unit 4.59 3.99 3.46 Average grid electricity cost = Rs 4.01 / unit 3 The WHRB power cost calculations are available in excel sheets enclosed in annexure under sheet Total and column 48. The cost calculated for WHRB power is as follows Year
1 2 3 4 5 6 7 8 9 10 11 12 13 14 15
Rs per unit
2.49 2.32 2.25 2.17 2.10 2.02 1.94 1.86 1.78 1.74 1.72 1.72 1.73 1.74 1.81
The average cost per unit is Rs 1.96 4 Hence the comparison of levelised costs are as follows Power Cost/unit FBC power Rs 1.72 Grid power Rs 4.01 WHRB power Rs 1.96 Sub-step 2d Sensitivity analysis Additionality tool requires showing whether the conclusion regarding the financial attractiveness is robust to reasonable variations in the critical assumptions. We consider sales price variation to carry out sensitivity analysis. The sensitivity analysis has been done considering increase or decrease in sales price over Rs 3/unit considered. Table of sensitivity analysis.
Variation in sales price
WHRB without CDM
WHRB with CDM Bench Mark
Equity IRR -10% -5% +5% +10% +15%
-3.3% -0.9% 3.8% 5.9% 8%
2.8% 5.3% 10% 11.8% 13.8%
14%
Sensitivity analysis shows that even with upward increase of 15% in sales price of WHRB electricity that the bench mark hurdle is not crossed in case of equity IRR when CDM benefits are not considered. However when CDM benefits are considered equity IRR comes very close to the bench mark when sales price increases by 15%. Hence it can be concluded that project activity is financially not attractive without CDM benefits. The project activity is enabled by CDM benefits STEP –3 Barrier analysis to show additionality.

PROJECT DESIGN DOCUMENT FORM (CDM PDD) - Version 03.1. CDM – Executive Board page 25 Sub-Step 3.a Identification of barriers that would prevent the implementation of the type of the project activity.
Investment barriers
Debt funding is not available for this type of proposed project activity.
LMEL has incurred losses when the steel industry faced acute recession a few years back. The company has accumulated losses and is under BIFR(Board for Industrial and Financial Reconstruction , Government of India) with debt restructuring of liabilities. Hence the company faces the financial barrier due to the non availability of fresh funds to carry out expansion activities both from financial institutes and equity market. The company’s finance demands go through close scrutiny of the concerned financial institutions and have not been able to secure institutional loans for project activity. When LMEL approached for finance of stand alone WHRB project activity, the financial lenders advised that: 1. WHRB captive project does not fall under essential services. 2. As WHRB Project involved many boilers the stand alone project is not economically feasible. Hence the finance can not be made available. 3. It was advised by financial lenders that company should go for coal based captive power generation as the same is most economically attractive. The financial lenders refusal / advice letter will be made available to DOE. As the debt funds were not available from banks for the project activity the project proponent has to raise the debt funds from private investors at higher interest than lending rates of banks.
3.a.1
No access to international capital markets due to real or perceived risks.
LMEL have not received any foreign assistance and they are not in a position to access the international capital markets.
How CDM revenues help to allievate the above barrier
CDM revenues help to make the project activity more financially feasible and help convincing the private investors to lend funds for the project activity.
Whether coal based power plant face the barrier
Coal based power plant will be having low investment and Equity IRR is 23.5% above bench mark versus higher WHRB Power plant investment and equity IRR of 1.5% without CDM benefits and 7.7% with CDM benefits below bench mark. Hence investors are easily convinced on feasibility of coal based project. Hence coal based power plant does not face this barrier. Excel sheets as supporting document is submitted to DOE.
3.a.b Technological barrier
Skilled and or properly trained labour not available
1) As per Joint Plant Committee report “Survey of sponge Iron Industry 2005-06”( cdm.unfccc.int/UserManagement/FileStorage/RN9VLFOWZZPXTN3YAQ1SZD000M541F -). JPC report of 2005-06 is the latest government of India official report. Hence this report is more reliable as it covers the expansion activities in sponge iron industry giving fair picture of the ensuing years. There is no other reliable report is available on sponge iron industry and hence has been considered as documentary evidence. 1. 77 units out of 147 coal based unit are going in for expansion in capacity. 2. Jharkhand, Chhattisgarh and Maharashtra are states where majority of expansion activities will be installed. 3. Constraints faced by sponge iron industry are: a) Raw Material
PROJECT DESIGN DOCUMENT FORM (CDM PDD) - Version 03.1. CDM – Executive Board page 26
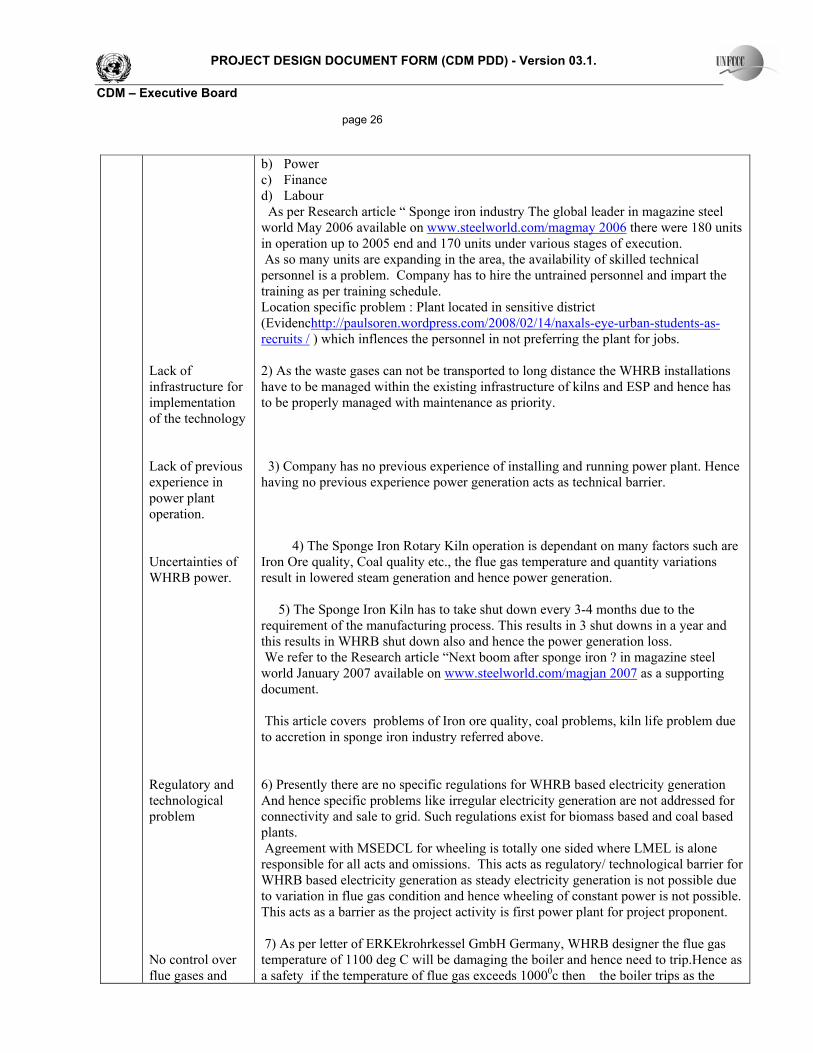
Lack of infrastructure for implementation of the technology Lack of previous experience in power plant operation. Uncertainties of WHRB power. Regulatory and technological problem No control over flue gases and
b) Power c) Finance d) Labour As per Research article “ Sponge iron industry The global leader in magazine steel world May 2006 available on www.steelworld.com/magmay 2006 there were 180 units in operation up to 2005 end and 170 units under various stages of execution. As so many units are expanding in the area, the availability of skilled technical personnel is a problem. Company has to hire the untrained personnel and impart the training as per training schedule. Location specific problem : Plant located in sensitive district (Evidenchttp://paulsoren.wordpress.com/2008/02/14/naxals-eye-urban-students-as-recruits / ) which inflences the personnel in not preferring the plant for jobs. 2) As the waste gases can not be transported to long distance the WHRB installations have to be managed within the existing infrastructure of kilns and ESP and hence has to be properly managed with maintenance as priority. 3) Company has no previous experience of installing and running power plant. Hence having no previous experience power generation acts as technical barrier. 4) The Sponge Iron Rotary Kiln operation is dependant on many factors such are Iron Ore quality, Coal quality etc., the flue gas temperature and quantity variations result in lowered steam generation and hence power generation. 5) The Sponge Iron Kiln has to take shut down every 3-4 months due to the requirement of the manufacturing process. This results in 3 shut downs in a year and this results in WHRB shut down also and hence the power generation loss. We refer to the Research article “Next boom after sponge iron ? in magazine steel world January 2007 available on www.steelworld.com/magjan 2007 as a supporting document. This article covers problems of Iron ore quality, coal problems, kiln life problem due to accretion in sponge iron industry referred above. 6) Presently there are no specific regulations for WHRB based electricity generation And hence specific problems like irregular electricity generation are not addressed for connectivity and sale to grid. Such regulations exist for biomass based and coal based plants. Agreement with MSEDCL for wheeling is totally one sided where LMEL is alone responsible for all acts and omissions. This acts as regulatory/ technological barrier for WHRB based electricity generation as steady electricity generation is not possible due to variation in flue gas condition and hence wheeling of constant power is not possible. This acts as a barrier as the project activity is first power plant for project proponent. 7) As per letter of ERKEkrohrkessel GmbH Germany, WHRB designer the flue gas temperature of 1100 deg C will be damaging the boiler and hence need to trip.Hence as a safety if the temperature of flue gas exceeds 10000c then the boiler trips as the
PROJECT DESIGN DOCUMENT FORM (CDM PDD) - Version 03.1. CDM – Executive Board page 27
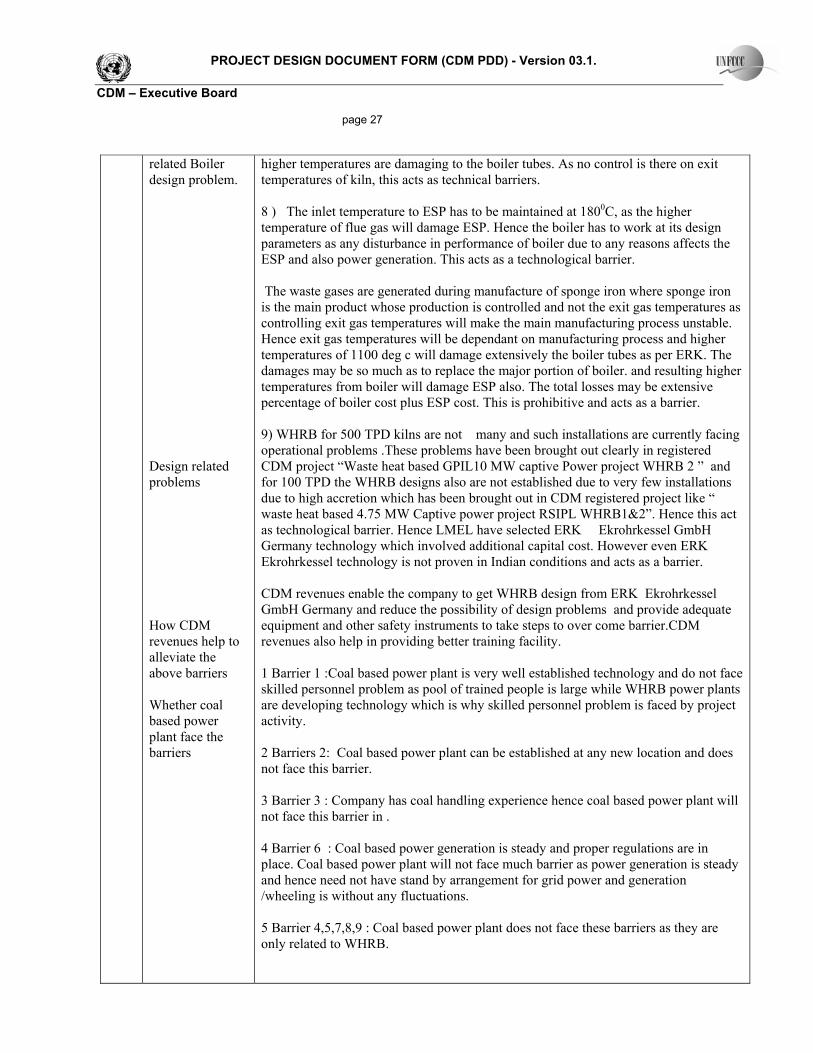
related Boiler design problem. Design related problems How CDM revenues help to alleviate the above barriers Whether coal based power plant face the barriers
higher temperatures are damaging to the boiler tubes. As no control is there on exit temperatures of kiln, this acts as technical barriers. 8 ) The inlet temperature to ESP has to be maintained at 1800C, as the higher temperature of flue gas will damage ESP. Hence the boiler has to work at its design parameters as any disturbance in performance of boiler due to any reasons affects the ESP and also power generation. This acts as a technological barrier. The waste gases are generated during manufacture of sponge iron where sponge iron is the main product whose production is controlled and not the exit gas temperatures as controlling exit gas temperatures will make the main manufacturing process unstable. Hence exit gas temperatures will be dependant on manufacturing process and higher temperatures of 1100 deg c will damage extensively the boiler tubes as per ERK. The damages may be so much as to replace the major portion of boiler. and resulting higher temperatures from boiler will damage ESP also. The total losses may be extensive percentage of boiler cost plus ESP cost. This is prohibitive and acts as a barrier. 9) WHRB for 500 TPD kilns are not many and such installations are currently facing operational problems .These problems have been brought out clearly in registered CDM project “Waste heat based GPIL10 MW captive Power project WHRB 2 ” and for 100 TPD the WHRB designs also are not established due to very few installations due to high accretion which has been brought out in CDM registered project like “ waste heat based 4.75 MW Captive power project RSIPL WHRB1&2”. Hence this act as technological barrier. Hence LMEL have selected ERK Ekrohrkessel GmbH Germany technology which involved additional capital cost. However even ERK Ekrohrkessel technology is not proven in Indian conditions and acts as a barrier. CDM revenues enable the company to get WHRB design from ERK Ekrohrkessel GmbH Germany and reduce the possibility of design problems and provide adequate equipment and other safety instruments to take steps to over come barrier.CDM revenues also help in providing better training facility. 1 Barrier 1 :Coal based power plant is very well established technology and do not face skilled personnel problem as pool of trained people is large while WHRB power plants are developing technology which is why skilled personnel problem is faced by project activity. 2 Barriers 2: Coal based power plant can be established at any new location and does not face this barrier. 3 Barrier 3 : Company has coal handling experience hence coal based power plant will not face this barrier in . 4 Barrier 6 : Coal based power generation is steady and proper regulations are in place. Coal based power plant will not face much barrier as power generation is steady and hence need not have stand by arrangement for grid power and generation /wheeling is without any fluctuations. 5 Barrier 4,5,7,8,9 : Coal based power plant does not face these barriers as they are only related to WHRB.

PROJECT DESIGN DOCUMENT FORM (CDM PDD) - Version 03.1. CDM – Executive Board page 28
Barriers due to prevailing practice.
Discuss the project activity in host country. How CDM revenues help to
Joint Plant Committee report as “ Survey of Indian Sponge Iron Industry 2005-06” lists the following: 1) Out of 147 surveyed Sponge Iron Industry surveyed only 16 have captive power generation. Maharashtra has 18 sponge iron units. Out of 16 units, all have opted for CDM registration which can be checked on UNFCCC web site. Hence the prevailing practice for sponge iron units is to let out flue gases into atmosphere without using for power generation. The waste heat recovery based power plants were not prevailing practice even for all industries in India as per the study of CEA. CEA of government of India have brought a study of captive power plants in India in august 2005. As per the study the break up of various options in captive power plants are: Web address www.cea.nic.in Fuel No of CPPS Coal 66 HSD/FO 70 Biomass 41 NG/Naphtha 18 Hot gases 7 Waste heat 6 Hydel 2 Total 208 The study indicates waste heat based CPP forms approximately 3%. 2) However after the awareness of CDM has spread sponge iron industry is making efforts to avail the benefits and utilise waste heat to generate electicity. There are 48 projects under CDM out of 227 sponge Iron manufacturing companies. As CDM activity can not be treated as common practice, the diffusion of WHRB based power generation as non CDM projects is negligible. 3) As the captive power generation based on WHRB is not sufficient diffused in the region/ country, WHRB based captive power project is not prevailing practice. 4)In Maharashtra state the sponge iron units normally do not have WHRB and to the best of our knowledge only one unit is putting WHRB based CPP and that project is also registered with CDM. A CDM project can not be considered as common practice. It can be said that state of Maharastra does not have diffusion WHRB CPP activity in sponge iron units. JPC Report can be made available and details of units going for CDM benefit can be checked from UNFCC website www.unfccc.int CDM revenues help to make the project activity feasible and enable the company to

PROJECT DESIGN DOCUMENT FORM (CDM PDD) - Version 03.1. CDM – Executive Board page 29
alleviate the above barrier Whether coal based power plant face the barrier
put the project activity and cross the barrier of prevailing practice of not using the waste heat in sponge iron industry. Coal based power plant does not face this barrier as it is common practice to establish Coal based power plants.
Regulatory Barriers How CDM revenues help to alleviate the above barrier Whether coal based power plant face the barrier
Presently there are no specific regulations for WHRB based electricity generation And hence specific problems like irregular electricity generation are not addressed for connectivity and sale to grid. Such regulations exist for biomass based and coal based plants. CDM Revenues help to make the project viable. Coal based power generation is steady and proper regulations are in place.
Sub-Step –3.b. Show that the identified barriers would not prevent the implementation of at least one of the alternatives (except the proposed project activity). As above the identified barriers are: 1) 3.a.a. investment barrier 2) 3.a.b technological barrier 3) 3.a.c prevailing practice barrier 4) 3.a.d operational barrier 5) 3.a.e regulatory barrier. The identified other alternatives are: 1) Drawing power from existing MSEDCL grid (P6) None of the above barriers act as barriers in this alternative and MSEDCL would be having no objections to continue to supply the additional demand of power as already and presently the required power is being provided by MSEDCL. But the grid power is costlier than captive power. As well as the grid has the power crisis, resulting into frequent power cuts. 2) CPP based on HSD/Gas (P4) None of the above as a barrier in this alternative. However CPP based on HSD/Gas will have additional GHG emissions from the plant. 3) CPP based on coal (P4)

PROJECT DESIGN DOCUMENT FORM (CDM PDD) - Version 03.1. CDM – Executive Board page 30 None of the above barriers act as barriers in this alternative. This option is economically most attractive. LMEL would be putting coal based power plant in the absence of project activity. 4) Alternative use of Waste Heat from Flue Gases (W3) like using Waste heat from flue gases for other use in the plant is not applicable as LMEL has no such heat requirement in the plant. No other beneficial use of the Waste Heat is in practice in the region. 5) Continuation of the current situation (P6), as shown above the continuation of current situation is to draw more power from grid. This option will face no barrier but company has to face power cuts imposed by grid as grid is facing acute power shortage. STEP-4 Common practice analysis We identify and discuss the existing Common practice through the following sub-steps which Complements additionality test

PROJECT DESIGN DOCUMENT FORM (CDM PDD) - Version 03.1. CDM – Executive Board page 31 Sub-Step-4.a Analyse other activities similar to project activity
Analysis of activities similar to the project activity.
The project activity is to generate electricity from waste heat generated in sponge iron manufacturing. Sponge Iron Industry followed the practice of letting the flue gases out into atmosphere without utilising waste heat. This can be proved as per the following reports available. 1 As per JPC report as “Survey of Indian Sponge Iron Industry 2005-06” only 16 units out of 147 sponge iron units have captive power generation. 2 DRI UPDATE by Sponge Iron Manufacturers Association May 2007 publication and article “Tapping CDM potential in Indian Sponge Iron Industry –A perspective mentions the following. Total no of units of sponge iron are 227. WHRB is viable only for plants having capacity of 1 lac tonne per annum. There are only 90 units having capacity more than 1 lac tonne per annum out of which 13 plants have gone CDM way. All the WHRB installations are under CDM. The diffusion of less than 15% even with CDM benefits. Web address is www.simaindia.org As per the information available on www.unfcccc.int there are now 48 WHRB based power plants in sponge iron industry in India under CDM Registration procedure.The details of one project not available on net. State wise and capacity wise break up is as follows: STATE WISE CAPACITY WISE Chattisgarh 25 Jharkhand 3 Less than 10 MW 26 West Bengal 5 Above10 to 25 MW 16 Orissa 9 25 MW 4 Tamilnadu 3 Above 25 MW 2 Gujarath 1 ------ Mahrashtra 2 48 - -------- 48 All these CDM WHRB project activities have come up after CDM benefits became available and first project activity “ Waste heat based 7MW Captive Power Project Godavari Power and Ispat Ltd (GPIL)” got registered in April 2006. It can be concluded that even with CDM benefits the WHRB based power installations are approximately 21%( 48 out of 229) showing the resistance existing to use waste heat.The CDM project activities can not be considered as common practice.

PROJECT DESIGN DOCUMENT FORM (CDM PDD) - Version 03.1. CDM – Executive Board page 32 Sub-Step 4.b Discuss any similar options that are occurring
The CDM registration of the project activity will have following positive effects: 1 As explained in the above steps, through CDM registration project participant hopes to lower the risks of the investment associated with this kind of Project Activity.
Activities in similar scale.
The waste heat based power plants are mainly captive power plants set up in mainly sponge iron plants with CDM credits. The project activity is for 25 MW electricity generation from waste heat from waste gases in 5 boilers from 1 number 500 TPD and 4 numbers 100 TPD Sponge Iron capacity. As per available information no project activity is occurring with such combination without CDM benefits. Similar project activities also under CDM generating 25 MW are being put by 1 GPIL( Godavari Power and Ispat Ltd ) with 2 WHRBS for 2 x500 TPD 2 SKS Ispat Ltd with 4 boilers for 2x 350TPD, 2X100 TPD 3 Chattisgarh Electricity Co Limited CECL with 4 WHR boilers 2x100, 2x500 TPD kilns and also from Ferro Alloy furnaces. All these projects are under CDM process. Without CDM enabling these projects would not be feasible. Essential difference between the projects being lower number of boilers in the GPIL and SKS Ispat project activities resulting in lower capital and running cost. In case of CECL part of heat is being generated by burning gas hence technically it is different. Normally WHRB project activity covers one kiln of 500 TPD or 2 or more 100 TPD kilns which is evident from www.unfccc.int as all project activities in India are enabled by CDM. Out of 48 project activities in India as shown in 4.a only 4 projects are of 25 MW capacities. The combination has the disadvantage of handling high and low waste gas flow rates and related problems of design explained under technological barrier which we describe in brief below. It also involves high capital cost compared to other Projects which involve lower number of boilers. 500 TPD WHRB is also not established design with Indian boiler manufacturing companies due to small number of installations. The WHRB presently installed are facing some initial problems resulting in shut downs. This can be verified from details provided in GPIL waste heat based 10 MW captive power plant PDD registered with CDM on www.cdmunfccc.int. 100 TPD units do not put WHRB due to high costs and technical problems brought out in technological barrier. Even the Government of India proposed draft policy( Available on web address http://www.cpcb.nic.in/about%20us/Division%20at%20Head%20office/PCI-II/CREPspong&other.html )states that WHRB is not recommended for 100 TPD and lower capacity plants as the same is not viable. Hence CDM registration has been driving force as all the units are under CDM and such projects can not be considered as common practice.
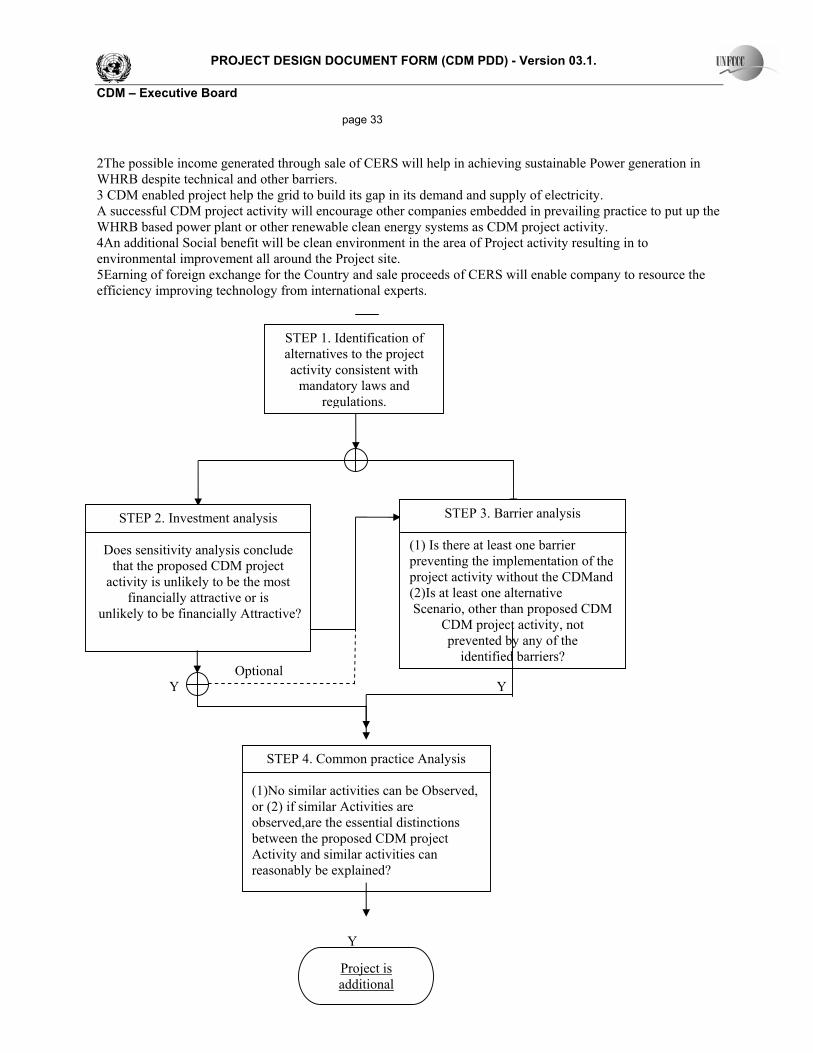
PROJECT DESIGN DOCUMENT FORM (CDM PDD) - Version 03.1. CDM – Executive Board page 33 2The possible income generated through sale of CERS will help in achieving sustainable Power generation in WHRB despite technical and other barriers. 3 CDM enabled project help the grid to build its gap in its demand and supply of electricity. A successful CDM project activity will encourage other companies embedded in prevailing practice to put up the WHRB based power plant or other renewable clean energy systems as CDM project activity. 4An additional Social benefit will be clean environment in the area of Project activity resulting in to environmental improvement all around the Project site. 5Earning of foreign exchange for the Country and sale proceeds of CERS will enable company to resource the efficiency improving technology from international experts.
N Optional Y Y Y
STEP 1. Identification of alternatives to the project activity consistent with
mandatory laws and regulations.
STEP 2. Investment analysis
Does sensitivity analysis conclude that the proposed CDM project
activity is unlikely to be the most financially attractive or is
unlikely to be financially Attractive?
STEP 3. Barrier analysis
(1) Is there at least one barrier preventing the implementation of the project activity without the CDMand (2)Is at least one alternative Scenario, other than proposed CDM
CDM project activity, not prevented by any of the
identified barriers?
STEP 4. Common practice Analysis
(1)No similar activities can be Observed, or (2) if similar Activities are observed,are the essential distinctions between the proposed CDM project Activity and similar activities can reasonably be explained?
Project is additional
PROJECT DESIGN DOCUMENT FORM (CDM PDD) - Version 03.1. CDM – Executive Board page 34 B.6. Emission reductions: B.6.1. Explanation of methodological choices: Selected methodology is ACM 0012 Version 02, EB 35 The project activity meets the applicability conditions of baseline methodology, namely. 1. The methodology gives 4 steps to determine the baseline. All these 4 steps have been discussed in B.4 and arrived at baseline scenario of W2/P4. As coal based electricity cost is the cheapest the same is the baselineP4. LMEL would put coal based captive power plant in the absence of project activity. However as LMEL exports surplus power to power trading company who supply electricity to consumers who mainly use grid power , hence grid power emission factor is used to calculate the emission reductions for arriving at conservative emission reductions.. The excel calculations for a new coal based captive power plant and grid electricity are enclosed to prove the grid emission factor is lower than coal based captive power plant. We give below the calculated emission factor 1Grid emission factor is 0.795 t CO2/MWh 2 Coal based CPP emission factor 1.09 t CO2/MWh. The MSEDCL grid power is being used by LMEL at the moment. We select western grid electricity of which MSEDCL is a part and hence western grid electricity emission factor used to calculate baseline emission reductions which will give conservative reduction in base line emissions as grid power is mainly coal based but also comprises of diesel, hydel and nuclear power which will give lower emission factor for grid compared to coal based power plant. The emission reductions are achieved by displacing fossil fuel based grid electricity with WHRB based electricity which uses only waste heat and does not use any fuel. The reduction in GHG emission from facility of the project arises from the replacement / displacement of an equivalent amount of electricity to the extent of electricity generated from steam which is produced from waste heat recovered from waste gases in WHRB, which would have been otherwise generated and supplied by grid which is mainly dependant on fossil fuel based power plants. 2 The additionality has been proved using additionality tool “the tool for the demonstration and assessment of additionality” (version 05) EB 39. 3 The baseline emissions have been calculated for scenario 1 applicable for grid electricity baseline using equations 1, 1a, 1a.1, 1f. The baseline emissions for the year shall be determined as follows BE y = BE En, y + BE fist y = BE En, y (equation 1) Where, BE y = Total baseline Emissions during a given year y. BE En y =Baseline emissions from energy generated by the project activity during a given year y. BE fist, y = Baseline emission from generation of steam, if any, using fossil fuel that would have been used for flaring in the absence of the project activity =0 as no steam from fossil fuel is used for flaring in baseline ACM 0012 covers many options .we give below the explanation for selected options: 1 Base line emissions

PROJECT DESIGN DOCUMENT FORM (CDM PDD) - Version 03.1. CDM – Executive Board page 35 Base line emissions are calculated for Scenario 1 as the electricity is obtained from MSEDCL Grid in baseline. The applicable equations are 1a, 1a.1 2 Calculation of energy generated (electricity) in units supplied by waste heat As the steam from WHRBs go to a common header which also receives the steam from other source, applicable calculation will be as per Situation 2 as it is not possible to measure the net calorific value of the waste gas/heat and steam generated with different fuels in dedicated boilers are fed into turbine through the common steam header. The applicable equation 1e 3 Capping of baseline emissions The methodology requires capping for element of conservativeness. We have selected Method 2 using manufacturer’s data and applicable equation 1f to calculate baseline cap f cap. Baseline emissions for Scenario 1 Scenario 1 represents the electricity is obtained from grid. BEEn y in tCO2 = BE Elec,y + BE Ther,,y = BE Elec,y ( equation 1a) BEEn y base line emissions from energy generated by project activity BE Elec,y base line emissions due to electricity that is displaced by the project activity BE Ther,,y base line emissions from thermal energy generated by project activity = 0 as the Project activity is only for electricity generation Base line emissions from electricity(BE Elec,y} that is displaced by the project activity BE Elec,y = f cap *f wg *∑ ∑EG y *EF Elec, y ( equation 1a.1) EG y = quantity of electricity supplied to the recipients by generator EF Elec, y = CO2 emission factor for the grid electricity displaced due to project activity Calculation of the energy generated (electricity) in units supplied by waste heat EGj, Y Applicable situation 2 as per Methodology Fraction of total electricity by the project activity using waste gas fwg (for situation 2 of methodology applicable as justified above equation 1e) = ST whr,y/ ST whr,y +ST other,y (equation 1e) ST whr, y = energy content of the steam generated by WHRB fed into turbine via common steam header ST other, y = energy content of the steam generated by other boilers fed into turbine via common steam header The applicable conditions of methodology for Method 2 are . All the boiler have to provide superheated steam . The calculation should be based on energy supplied to the steam turbine. The enthalpy and the steam flow rate must be monitored for each boiler to determine the steam energy content. The calculation implicitly assumes that properties of steam (temperature and pressure) generated from different sources are same.The enthalpy of steam and feed water will be determined at measure temperature and presuure and the enthalpy difference will be multiplied with quantity measured by steam meter. any vented steam should be deducted from steam produced with waste heat.
PROJECT DESIGN DOCUMENT FORM (CDM PDD) - Version 03.1. CDM – Executive Board page 36 The baseline cap as applicable in Method 2 equation 1f. Baseline cap f cap = the value of capping calculated by equation 1f of methodology = Q WG, BL/ Q WG, Y (equation 1f) Q WG, BL= Quantity of waste gas generated prior to start of the project activity Nm3 Q WG, Y = Quantity of waste gas used for energy generation during the year Nm3 The CO2 emission factor has been calculated as per Tool to calculate the emission factor for an electricity system version EB 35 . Tool to calculate the emission factor for an electricity system version 1 EB 35 requires calculation of EF OM,simple , EF BM, and combined EF y using formulae given in section B.6.3. Government of India, Ministry of Power, and Central Electricity Authority in technical cooperation with Indo-German Energy Programme have issued “CO2 Baseline Data base for the Indian Power Sector’ User Guide Version 3 December 2007. This document along with CO2 Data base excel calculations are available on web site www.cea.nic.in The objective is to facilitate adoption of authentic baseline emission data and also to ensure uniformity in the calculation of CO2 emission reductions by CDM Project developers, the Central Electric Authority in cooperation with GTZ CDM-India has compiled a data base containing the necessary data on CO2 emissions for all grid connected power stations in India. The data base currently covers the five fiscal years 2000-01 to 2006-07.CEA intends to update data base at the end of each financial year. The calculations cover all five regional grids. The CO2 Data base is designed to be consistent with “The tool to calculate emission factor for an electricity system version 1 EB 35” The calculations provide EF OM , EF BM and combined coefficient for each year from 2001-02 to 2006-07.as per methodology calculations for combined margin must be based on data from official source(where available) and made publicly available. CO2 Baseline Data base for the Indian Power Sector’ User Guide Version 3 December 2007 is prepared by Central Electricity Authority , Government of India . This document along with CO2 Data base excel calculations are available on web site www.cea.nic.in . 4 EF OM has been taken from available values from CO2 data base for last 3 vintage years and the values are provided in B.6 and EF BM for 20% addition in grid electricity for 2006 has been taken from the same CO2 data base referred in point 3 value provided in B.6. Combined emission factor is calculated in B.6.3 using weighted average for EF OM for the last 3 years and giving 50% weitage to EF OM and EF BM . The western grid emission factor is 0.795 t CO2/MWh. The calculations are provided in B.6 and in separate excel sheet. 5 The emission reductions achieved are calculated considering 70 % PLF in the first year and 80% PLF from second year onwards. Emission reductions calculated in first year are 104827 tonnes and from second year onwards 119803 tonnes/year. The total emission reductions achieved for crediting period of 10 years is 1183054 tonnes at an average emission reduction of 118305.4 tonnes/year. Emission Reductions ER y = BE y - PE y =BE y = BE Elec, y = BE En, y ERy = Total emission reductions tonnes/year BE y = Baseline emissions for the project activity during the year y. PE y= 0 The project emissions are Nil as the power plant is based on waste heat recovery from waste flue gases with no auxiliary fuel being used. No leakage is applicable under this methodology.
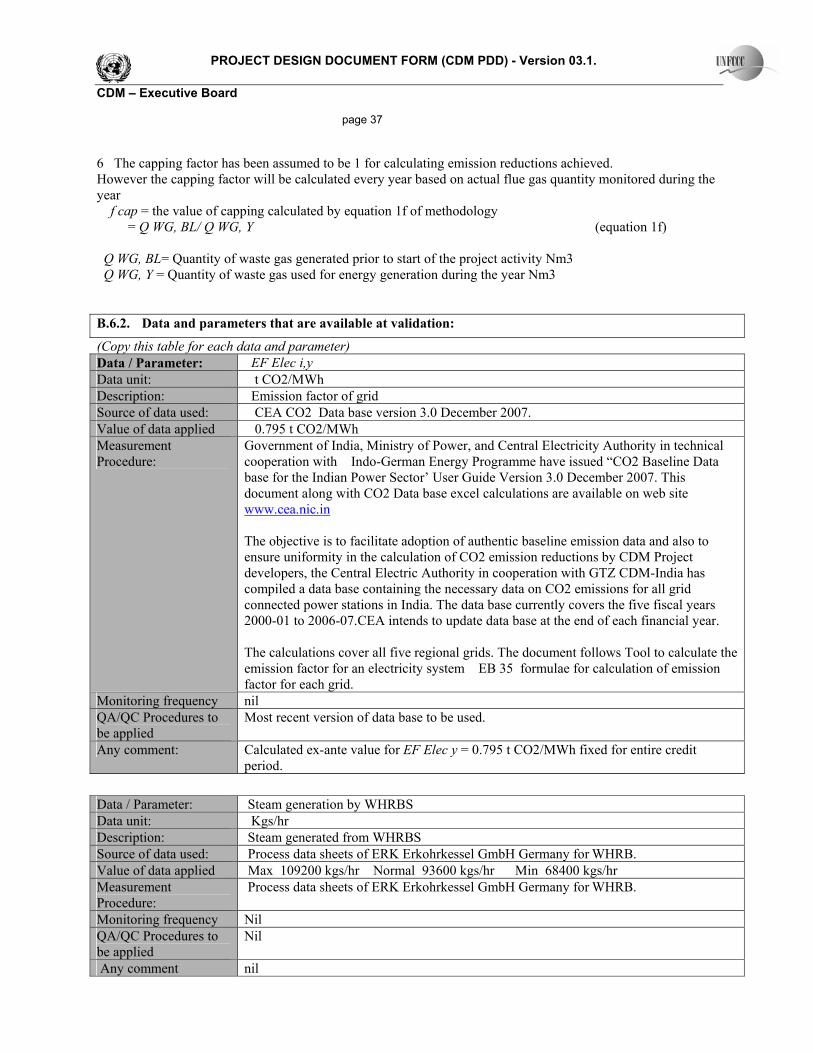
PROJECT DESIGN DOCUMENT FORM (CDM PDD) - Version 03.1. CDM – Executive Board page 37 6 The capping factor has been assumed to be 1 for calculating emission reductions achieved. However the capping factor will be calculated every year based on actual flue gas quantity monitored during the year f cap = the value of capping calculated by equation 1f of methodology = Q WG, BL/ Q WG, Y (equation 1f) Q WG, BL= Quantity of waste gas generated prior to start of the project activity Nm3 Q WG, Y = Quantity of waste gas used for energy generation during the year Nm3 B.6.2. Data and parameters that are available at validation:
(Copy this table for each data and parameter) Data / Parameter: EF Elec i,y Data unit: t CO2/MWh Description: Emission factor of grid Source of data used: CEA CO2 Data base version 3.0 December 2007. Value of data applied 0.795 t CO2/MWh Measurement Procedure:
Government of India, Ministry of Power, and Central Electricity Authority in technical cooperation with Indo-German Energy Programme have issued “CO2 Baseline Data base for the Indian Power Sector’ User Guide Version 3.0 December 2007. This document along with CO2 Data base excel calculations are available on web site www.cea.nic.in The objective is to facilitate adoption of authentic baseline emission data and also to ensure uniformity in the calculation of CO2 emission reductions by CDM Project developers, the Central Electric Authority in cooperation with GTZ CDM-India has compiled a data base containing the necessary data on CO2 emissions for all grid connected power stations in India. The data base currently covers the five fiscal years 2000-01 to 2006-07.CEA intends to update data base at the end of each financial year. The calculations cover all five regional grids. The document follows Tool to calculate the emission factor for an electricity system EB 35 formulae for calculation of emission factor for each grid.
Monitoring frequency nil QA/QC Procedures to be applied
Most recent version of data base to be used.
Any comment: Calculated ex-ante value for EF Elec y = 0.795 t CO2/MWh fixed for entire credit period.
Data / Parameter: Steam generation by WHRBS Data unit: Kgs/hr Description: Steam generated from WHRBS Source of data used: Process data sheets of ERK Erkohrkessel GmbH Germany for WHRB. Value of data applied Max 109200 kgs/hr Normal 93600 kgs/hr Min 68400 kgs/hr Measurement Procedure:
Process data sheets of ERK Erkohrkessel GmbH Germany for WHRB.
Monitoring frequency Nil QA/QC Procedures to be applied
Nil
Any comment nil
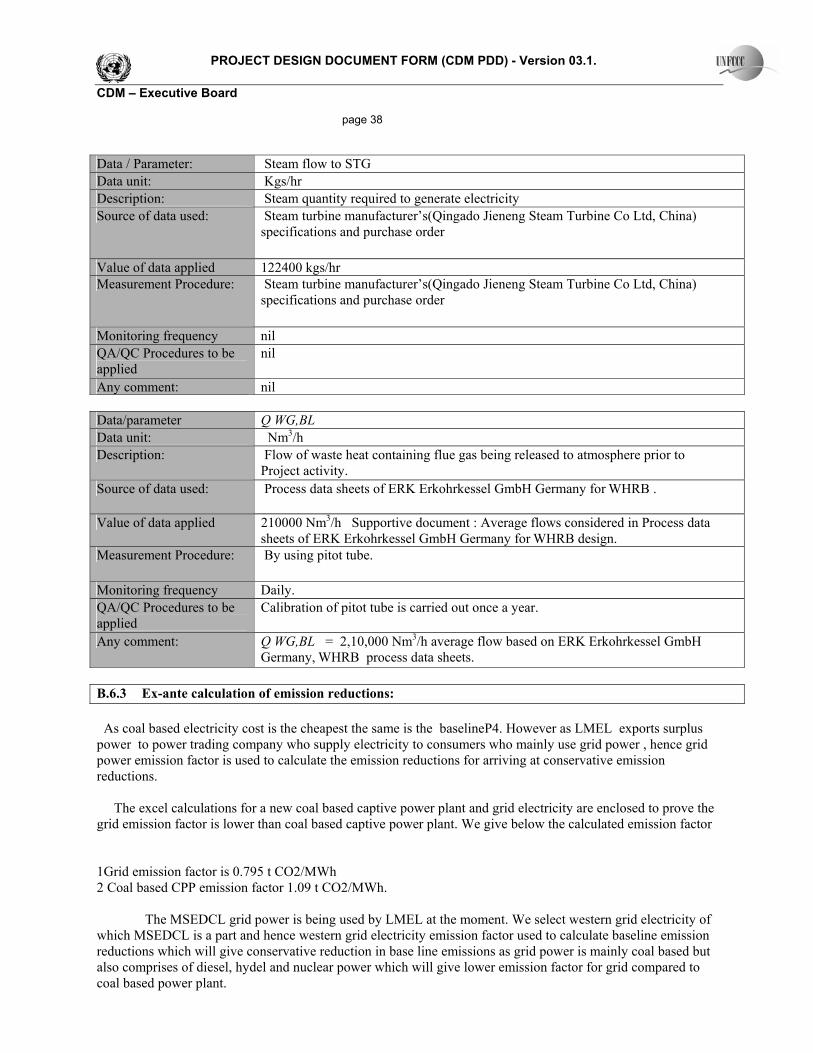
PROJECT DESIGN DOCUMENT FORM (CDM PDD) - Version 03.1. CDM – Executive Board page 38 Data / Parameter: Steam flow to STG Data unit: Kgs/hr Description: Steam quantity required to generate electricity Source of data used: Steam turbine manufacturer’s(Qingado Jieneng Steam Turbine Co Ltd, China)
specifications and purchase order
Value of data applied 122400 kgs/hr Measurement Procedure: Steam turbine manufacturer’s(Qingado Jieneng Steam Turbine Co Ltd, China)
specifications and purchase order
Monitoring frequency nil QA/QC Procedures to be applied
nil
Any comment: nil Data/parameter Q WG,BL Data unit: Nm3/h Description: Flow of waste heat containing flue gas being released to atmosphere prior to
Project activity. Source of data used: Process data sheets of ERK Erkohrkessel GmbH Germany for WHRB .
Value of data applied 210000 Nm3/h Supportive document : Average flows considered in Process data sheets of ERK Erkohrkessel GmbH Germany for WHRB design.
Measurement Procedure: By using pitot tube.
Monitoring frequency Daily. QA/QC Procedures to be applied
Calibration of pitot tube is carried out once a year.
Any comment: Q WG,BL = 2,10,000 Nm3/h average flow based on ERK Erkohrkessel GmbH Germany, WHRB process data sheets.
B.6.3 Ex-ante calculation of emission reductions: As coal based electricity cost is the cheapest the same is the baselineP4. However as LMEL exports surplus power to power trading company who supply electricity to consumers who mainly use grid power , hence grid power emission factor is used to calculate the emission reductions for arriving at conservative emission reductions. The excel calculations for a new coal based captive power plant and grid electricity are enclosed to prove the grid emission factor is lower than coal based captive power plant. We give below the calculated emission factor 1Grid emission factor is 0.795 t CO2/MWh 2 Coal based CPP emission factor 1.09 t CO2/MWh. The MSEDCL grid power is being used by LMEL at the moment. We select western grid electricity of which MSEDCL is a part and hence western grid electricity emission factor used to calculate baseline emission reductions which will give conservative reduction in base line emissions as grid power is mainly coal based but also comprises of diesel, hydel and nuclear power which will give lower emission factor for grid compared to coal based power plant.
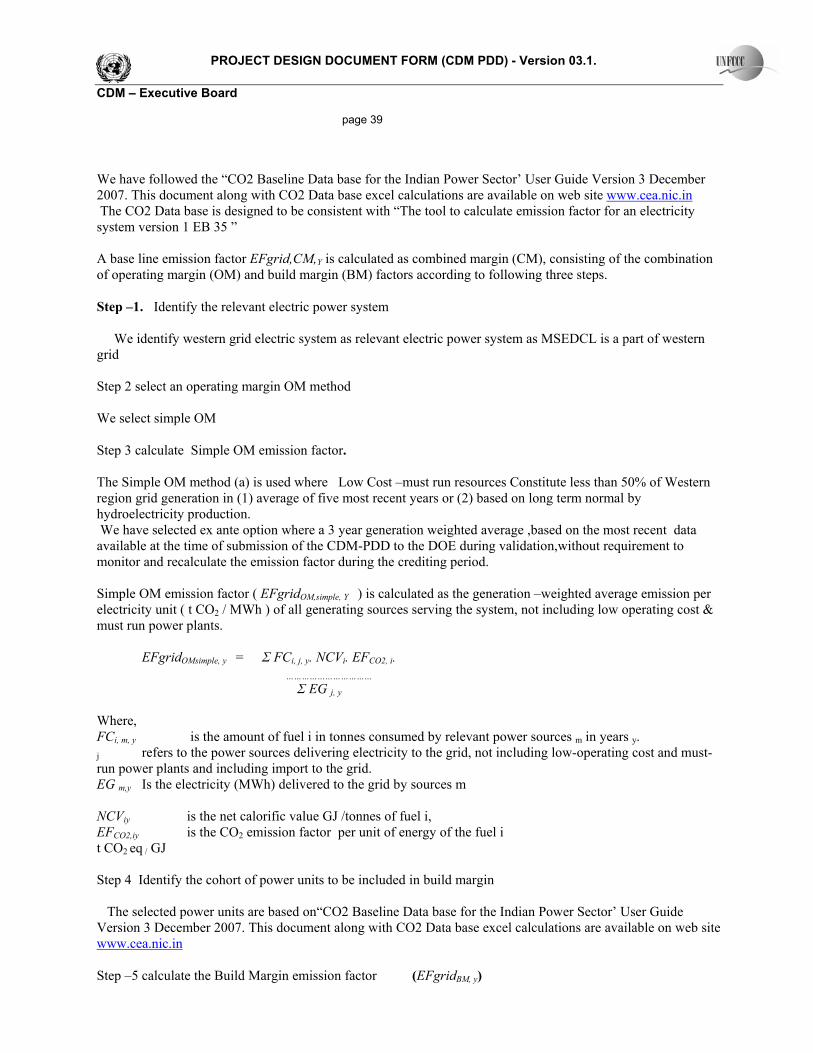
PROJECT DESIGN DOCUMENT FORM (CDM PDD) - Version 03.1. CDM – Executive Board page 39 We have followed the “CO2 Baseline Data base for the Indian Power Sector’ User Guide Version 3 December 2007. This document along with CO2 Data base excel calculations are available on web site www.cea.nic.in The CO2 Data base is designed to be consistent with “The tool to calculate emission factor for an electricity system version 1 EB 35 ” A base line emission factor EFgrid,CM,Y is calculated as combined margin (CM), consisting of the combination of operating margin (OM) and build margin (BM) factors according to following three steps. Step –1. Identify the relevant electric power system We identify western grid electric system as relevant electric power system as MSEDCL is a part of western grid Step 2 select an operating margin OM method We select simple OM Step 3 calculate Simple OM emission factor. The Simple OM method (a) is used where Low Cost –must run resources Constitute less than 50% of Western region grid generation in (1) average of five most recent years or (2) based on long term normal by hydroelectricity production. We have selected ex ante option where a 3 year generation weighted average ,based on the most recent data available at the time of submission of the CDM-PDD to the DOE during validation,without requirement to monitor and recalculate the emission factor during the crediting period. Simple OM emission factor ( EFgridOM,simple, Y
) is calculated as the generation –weighted average emission per electricity unit ( t CO2 / MWh ) of all generating sources serving the system, not including low operating cost & must run power plants. EFgridOMsimple, y
= Σ FCi, j, y. NCVi. EFCO2, i. ……………………………
Σ EG j, y
Where, FCi, m, y is the amount of fuel i in tonnes consumed by relevant power sources m in years y. j refers to the power sources delivering electricity to the grid, not including low-operating cost and must-run power plants and including import to the grid. EG m,y Is the electricity (MWh) delivered to the grid by sources m NCViy is the net calorific value GJ /tonnes of fuel i, EFCO2,iy is the CO2 emission factor per unit of energy of the fuel i t CO2 eq / GJ Step 4 Identify the cohort of power units to be included in build margin The selected power units are based on“CO2 Baseline Data base for the Indian Power Sector’ User Guide Version 3 December 2007. This document along with CO2 Data base excel calculations are available on web site www.cea.nic.in Step –5 calculate the Build Margin emission factor (EFgridBM, y)
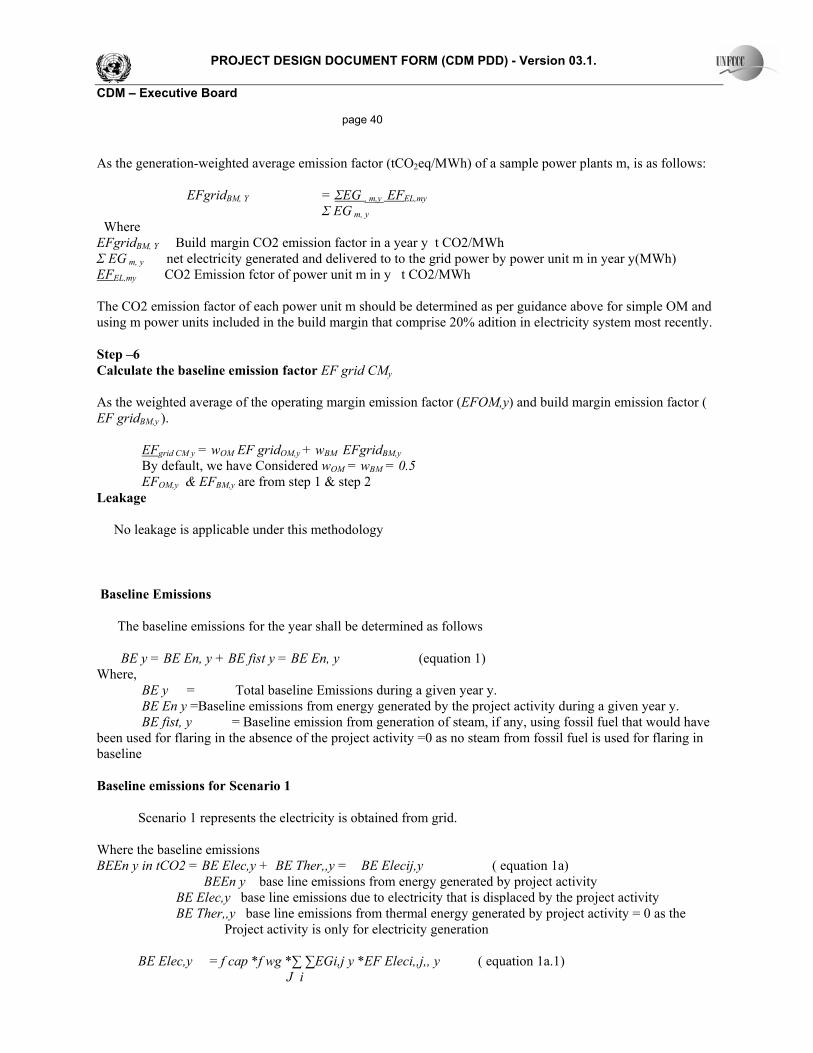
PROJECT DESIGN DOCUMENT FORM (CDM PDD) - Version 03.1. CDM – Executive Board page 40 As the generation-weighted average emission factor (tCO2eq/MWh) of a sample power plants m, is as follows: EFgridBM, Y = ΣEG , m,y EFEL,my Σ EG m, y Where EFgridBM, Y Build margin CO2 emission factor in a year y t CO2/MWh Σ EG m, y net electricity generated and delivered to to the grid power by power unit m in year y(MWh) EFEL,my CO2 Emission fctor of power unit m in y t CO2/MWh The CO2 emission factor of each power unit m should be determined as per guidance above for simple OM and using m power units included in the build margin that comprise 20% adition in electricity system most recently. Step –6 Calculate the baseline emission factor EF grid CMy
As the weighted average of the operating margin emission factor (EFOM,y) and build margin emission factor ( EF gridBM,y ). EFgrid CM y = wOM EF gridOM,y + wBM EFgridBM,y By default, we have Considered wOM = wBM = 0.5 EFOM,y & EFBM,y are from step 1 & step 2 Leakage No leakage is applicable under this methodology Baseline Emissions The baseline emissions for the year shall be determined as follows BE y = BE En, y + BE fist y = BE En, y (equation 1) Where, BE y = Total baseline Emissions during a given year y. BE En y =Baseline emissions from energy generated by the project activity during a given year y. BE fist, y = Baseline emission from generation of steam, if any, using fossil fuel that would have been used for flaring in the absence of the project activity =0 as no steam from fossil fuel is used for flaring in baseline Baseline emissions for Scenario 1 Scenario 1 represents the electricity is obtained from grid. Where the baseline emissions BEEn y in tCO2 = BE Elec,y + BE Ther,,y = BE Elecij,y ( equation 1a) BEEn y base line emissions from energy generated by project activity BE Elec,y base line emissions due to electricity that is displaced by the project activity BE Ther,,y base line emissions from thermal energy generated by project activity = 0 as the Project activity is only for electricity generation BE Elec,y = f cap *f wg *∑ ∑EGi,j y *EF Eleci,,j,, y ( equation 1a.1) J i
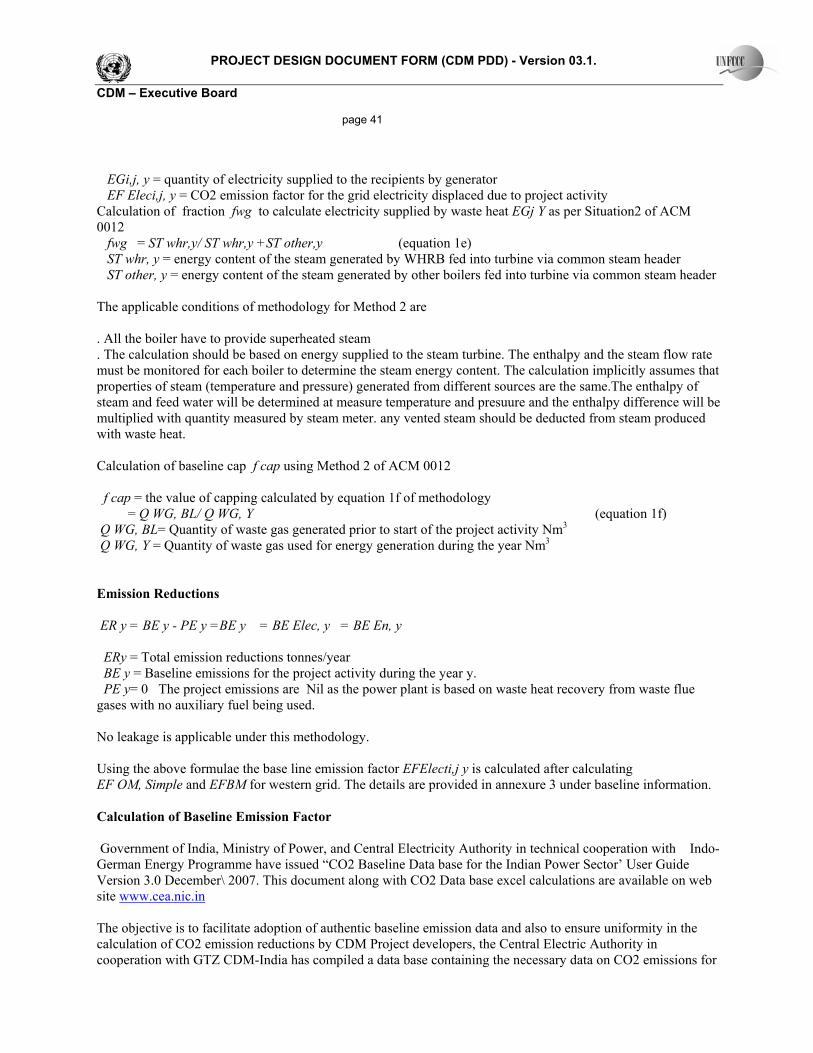
PROJECT DESIGN DOCUMENT FORM (CDM PDD) - Version 03.1. CDM – Executive Board page 41 EGi,j, y = quantity of electricity supplied to the recipients by generator EF Eleci,j, y = CO2 emission factor for the grid electricity displaced due to project activity Calculation of fraction fwg to calculate electricity supplied by waste heat EGj Y as per Situation2 of ACM 0012 fwg = ST whr,y/ ST whr,y +ST other,y (equation 1e) ST whr, y = energy content of the steam generated by WHRB fed into turbine via common steam header ST other, y = energy content of the steam generated by other boilers fed into turbine via common steam header The applicable conditions of methodology for Method 2 are . All the boiler have to provide superheated steam . The calculation should be based on energy supplied to the steam turbine. The enthalpy and the steam flow rate must be monitored for each boiler to determine the steam energy content. The calculation implicitly assumes that properties of steam (temperature and pressure) generated from different sources are the same.The enthalpy of steam and feed water will be determined at measure temperature and presuure and the enthalpy difference will be multiplied with quantity measured by steam meter. any vented steam should be deducted from steam produced with waste heat. Calculation of baseline cap f cap using Method 2 of ACM 0012 f cap = the value of capping calculated by equation 1f of methodology = Q WG, BL/ Q WG, Y (equation 1f) Q WG, BL= Quantity of waste gas generated prior to start of the project activity Nm3 Q WG, Y = Quantity of waste gas used for energy generation during the year Nm3 Emission Reductions ER y = BE y - PE y =BE y = BE Elec, y = BE En, y ERy = Total emission reductions tonnes/year BE y = Baseline emissions for the project activity during the year y. PE y= 0 The project emissions are Nil as the power plant is based on waste heat recovery from waste flue gases with no auxiliary fuel being used. No leakage is applicable under this methodology. Using the above formulae the base line emission factor EFElecti,j y is calculated after calculating EF OM, Simple and EFBM for western grid. The details are provided in annexure 3 under baseline information. Calculation of Baseline Emission Factor Government of India, Ministry of Power, and Central Electricity Authority in technical cooperation with Indo-German Energy Programme have issued “CO2 Baseline Data base for the Indian Power Sector’ User Guide Version 3.0 December\ 2007. This document along with CO2 Data base excel calculations are available on web site www.cea.nic.in The objective is to facilitate adoption of authentic baseline emission data and also to ensure uniformity in the calculation of CO2 emission reductions by CDM Project developers, the Central Electric Authority in cooperation with GTZ CDM-India has compiled a data base containing the necessary data on CO2 emissions for

PROJECT DESIGN DOCUMENT FORM (CDM PDD) - Version 03.1. CDM – Executive Board page 42 all grid connected power stations in India. The data base currently covers the five fiscal years 2000-01 to 2006-07.CEA intends to update data base at the end of each financial year. The calculations cover all five regional grids. The CO2 Data base is designed to be consistent with “The tool to calculate emission factor for an electricity system version 1 EB 35” LMEL has selected western grid as base line and in line with m we have to consider available vintage data for 3 years. We give below data available from the CO2 Base line Data base for the Indian Power Sector referred above. Emission factor 2004-05 2005-06 2006-07 EF OM, Simple tCO2/MWh 1.01 1.00 0.99 EF BM Build Margin tCO2/MWh 0.59 Weighted average EF OM, Simple tCO2/MWh
0.9999
EF y Combined Margin tCO2/MWh 0.795 Net Generation in operating margin GWh 155731 154918 159681 Net Generation in Build Margin GWh 37099 EF y considered for base line calculation is 0.795 t CO2/MWh Calculations Weighted average of EF OM, Simple tCO2/MWh = (155731*1.01+154918*1+159681*0.99) / (155731+154918+159681) = 0.9999 Build Margin based on 20% of the generation For the latest year 2006-07 EF BM Build Margin tCO2/MWh = 0.59 Combined Margin EF y Combined Margin tCO2/MWh = 0.5 *0.9999+0.5*0.59 = 0.795 Base line emission factor will be constant as Ex ante based and fixed for the entire credit period. Calculation of Net Emission Reduction:
Installed capacity of WHRB power generation 25 MW 25 MW Year of generation 1st 2nd-10th Number of working days/year 345 345 number of working hours/day 24 24 Gross generation of electricity at 100% PLF 207000 MWh 207000 MWh PLF 70% 80% Auxiliary consumption 9% 9% Quantity of electricity supplied to the recipients by generator EG y
131859 MWh 150696 MWh
Emission Factor (EF Elec,y) 0.795 tCO2e/MWh 0.795 tCO2e/MWh Capping factor f cap assumed for estimating baseline emission reduction. However this is to be calculated. Capping factor is assumed to arrive at Ex-ante fixed emission reductions. Capping factor will be calculated every year and calculated capping factor will be used for calculating actual emission reductions achieved.
1 1
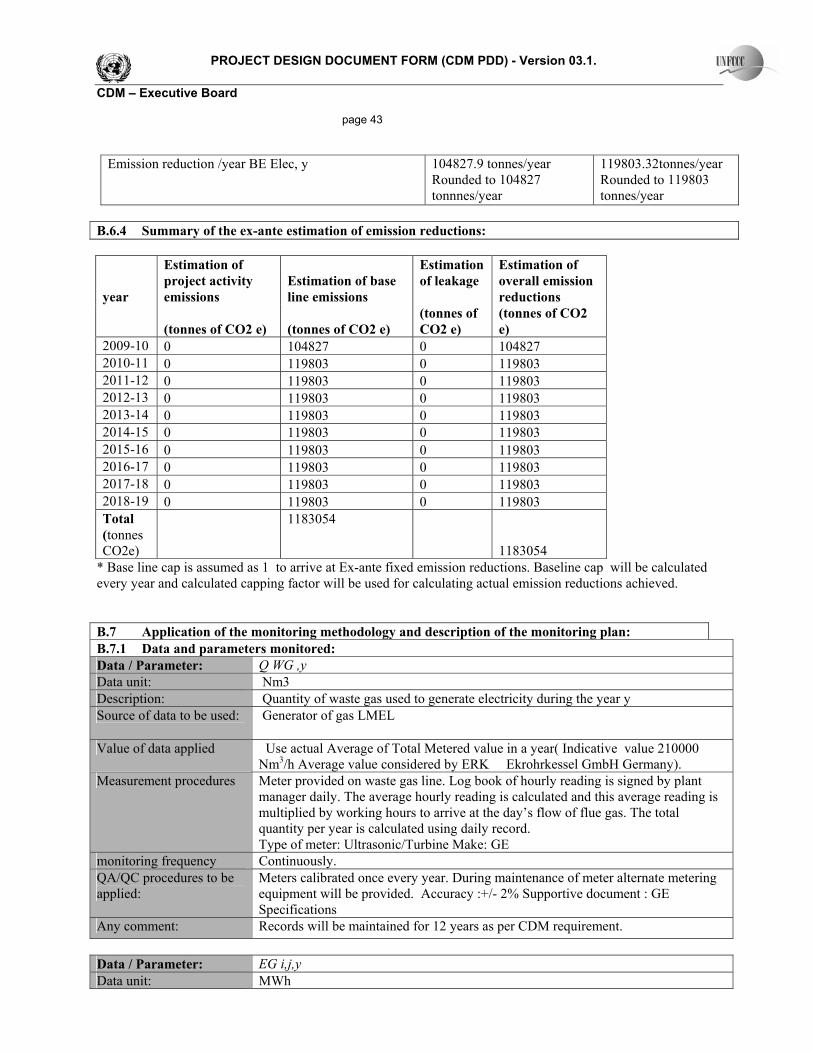
PROJECT DESIGN DOCUMENT FORM (CDM PDD) - Version 03.1. CDM – Executive Board page 43
Emission reduction /year BE Elec, y 104827.9 tonnes/year Rounded to 104827 tonnnes/year
119803.32tonnes/year Rounded to 119803 tonnes/year
B.6.4 Summary of the ex-ante estimation of emission reductions:
year
Estimation of project activity emissions
Estimation of base line emissions
Estimation of leakage
Estimation of overall emission reductions
(tonnes of CO2 e) (tonnes of CO2 e) (tonnes of CO2 e)
(tonnes of CO2 e)
2009-10 0 104827 0 104827 2010-11 0 119803 0 119803 2011-12 0 119803 0 119803 2012-13 0 119803 0 119803 2013-14 0 119803 0 119803 2014-15 0 119803 0 119803 2015-16 0 119803 0 119803 2016-17 0 119803 0 119803 2017-18 0 119803 0 119803 2018-19 0 119803 0 119803 Total (tonnes CO2e)
1183054 1183054
* Base line cap is assumed as 1 to arrive at Ex-ante fixed emission reductions. Baseline cap will be calculated every year and calculated capping factor will be used for calculating actual emission reductions achieved. B.7 Application of the monitoring methodology and description of the monitoring plan: B.7.1 Data and parameters monitored: Data / Parameter: Q WG ,y Data unit: Nm3 Description: Quantity of waste gas used to generate electricity during the year y Source of data to be used: Generator of gas LMEL
Value of data applied Use actual Average of Total Metered value in a year( Indicative value 210000 Nm3/h Average value considered by ERK Ekrohrkessel GmbH Germany).
Measurement procedures Meter provided on waste gas line. Log book of hourly reading is signed by plant manager daily. The average hourly reading is calculated and this average reading is multiplied by working hours to arrive at the day’s flow of flue gas. The total quantity per year is calculated using daily record. Type of meter: Ultrasonic/Turbine Make: GE
monitoring frequency Continuously. QA/QC procedures to be applied:
Meters calibrated once every year. During maintenance of meter alternate metering equipment will be provided. Accuracy :+/- 2% Supportive document : GE Specifications
Any comment: Records will be maintained for 12 years as per CDM requirement. Data / Parameter: EG i,j,y Data unit: MWh
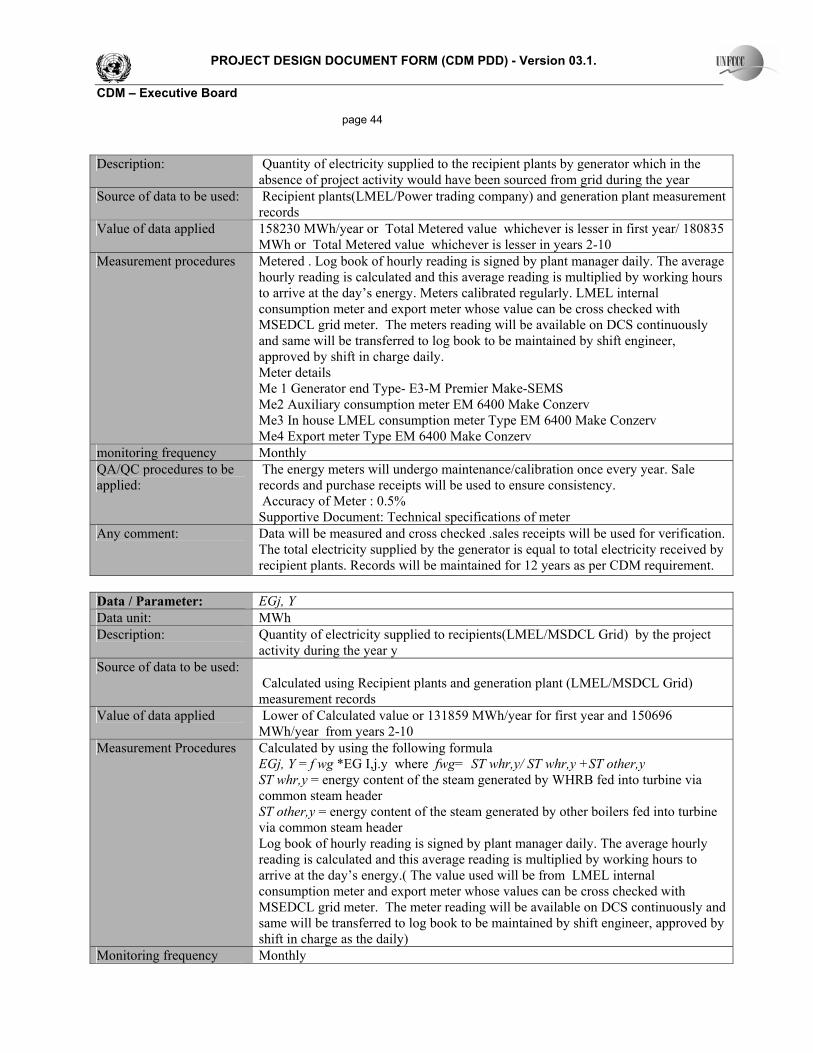
PROJECT DESIGN DOCUMENT FORM (CDM PDD) - Version 03.1. CDM – Executive Board page 44 Description: Quantity of electricity supplied to the recipient plants by generator which in the
absence of project activity would have been sourced from grid during the year Source of data to be used: Recipient plants(LMEL/Power trading company) and generation plant measurement
records Value of data applied 158230 MWh/year or Total Metered value whichever is lesser in first year/ 180835
MWh or Total Metered value whichever is lesser in years 2-10 Measurement procedures Metered . Log book of hourly reading is signed by plant manager daily. The average
hourly reading is calculated and this average reading is multiplied by working hours to arrive at the day’s energy. Meters calibrated regularly. LMEL internal consumption meter and export meter whose value can be cross checked with MSEDCL grid meter. The meters reading will be available on DCS continuously and same will be transferred to log book to be maintained by shift engineer, approved by shift in charge daily. Meter details Me 1 Generator end Type- E3-M Premier Make-SEMS Me2 Auxiliary consumption meter EM 6400 Make Conzerv Me3 In house LMEL consumption meter Type EM 6400 Make Conzerv Me4 Export meter Type EM 6400 Make Conzerv
monitoring frequency Monthly QA/QC procedures to be applied:
The energy meters will undergo maintenance/calibration once every year. Sale records and purchase receipts will be used to ensure consistency. Accuracy of Meter : 0.5% Supportive Document: Technical specifications of meter
Any comment: Data will be measured and cross checked .sales receipts will be used for verification. The total electricity supplied by the generator is equal to total electricity received by recipient plants. Records will be maintained for 12 years as per CDM requirement.
Data / Parameter: EGj, Y Data unit: MWh Description: Quantity of electricity supplied to recipients(LMEL/MSDCL Grid) by the project
activity during the year y Source of data to be used:
Calculated using Recipient plants and generation plant (LMEL/MSDCL Grid) measurement records
Value of data applied Lower of Calculated value or 131859 MWh/year for first year and 150696 MWh/year from years 2-10
Measurement Procedures Calculated by using the following formula EGj, Y = f wg *EG I,j.y where fwg= ST whr,y/ ST whr,y +ST other,y ST whr,y = energy content of the steam generated by WHRB fed into turbine via common steam header ST other,y = energy content of the steam generated by other boilers fed into turbine via common steam header Log book of hourly reading is signed by plant manager daily. The average hourly reading is calculated and this average reading is multiplied by working hours to arrive at the day’s energy.( The value used will be from LMEL internal consumption meter and export meter whose values can be cross checked with MSEDCL grid meter. The meter reading will be available on DCS continuously and same will be transferred to log book to be maintained by shift engineer, approved by shift in charge as the daily)
Monitoring frequency Monthly
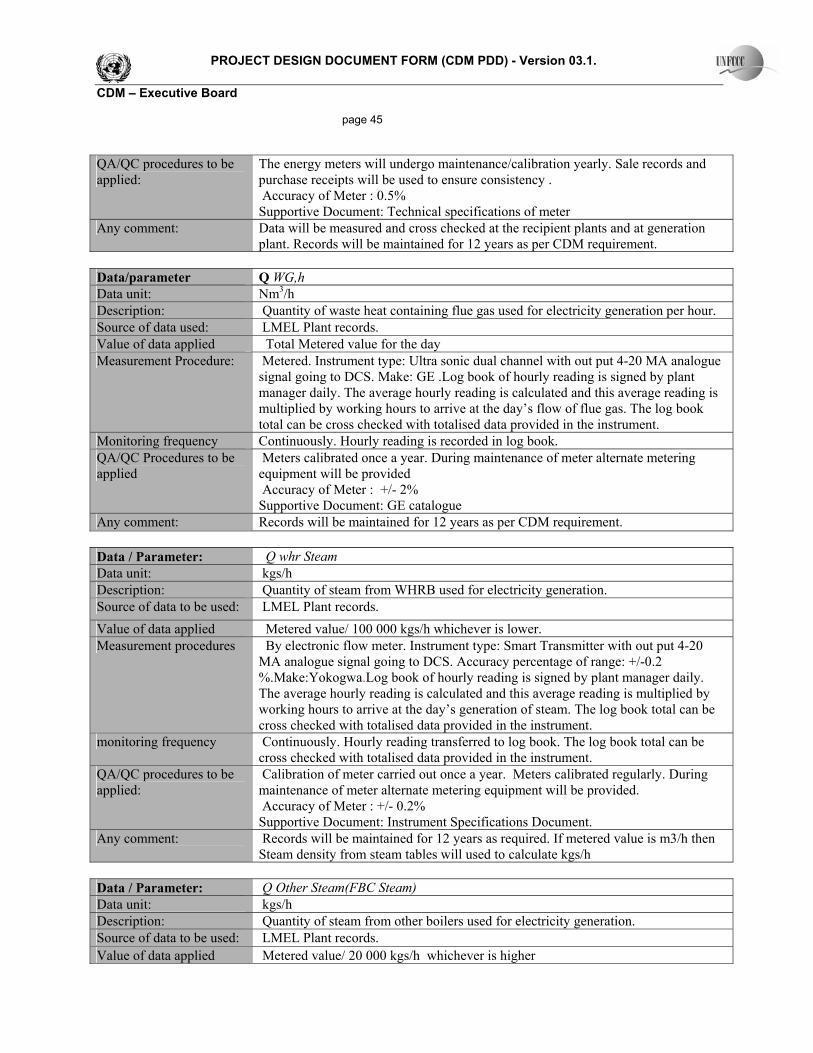
PROJECT DESIGN DOCUMENT FORM (CDM PDD) - Version 03.1. CDM – Executive Board page 45 QA/QC procedures to be applied:
The energy meters will undergo maintenance/calibration yearly. Sale records and purchase receipts will be used to ensure consistency . Accuracy of Meter : 0.5% Supportive Document: Technical specifications of meter
Any comment: Data will be measured and cross checked at the recipient plants and at generation plant. Records will be maintained for 12 years as per CDM requirement.
Data/parameter Q WG,h Data unit: Nm3/h Description: Quantity of waste heat containing flue gas used for electricity generation per hour. Source of data used: LMEL Plant records. Value of data applied Total Metered value for the day Measurement Procedure: Metered. Instrument type: Ultra sonic dual channel with out put 4-20 MA analogue
signal going to DCS. Make: GE .Log book of hourly reading is signed by plant manager daily. The average hourly reading is calculated and this average reading is multiplied by working hours to arrive at the day’s flow of flue gas. The log book total can be cross checked with totalised data provided in the instrument.
Monitoring frequency Continuously. Hourly reading is recorded in log book. QA/QC Procedures to be applied
Meters calibrated once a year. During maintenance of meter alternate metering equipment will be provided Accuracy of Meter : +/- 2% Supportive Document: GE catalogue
Any comment: Records will be maintained for 12 years as per CDM requirement. Data / Parameter: Q whr Steam Data unit: kgs/h Description: Quantity of steam from WHRB used for electricity generation. Source of data to be used: LMEL Plant records. Value of data applied Metered value/ 100 000 kgs/h whichever is lower. Measurement procedures By electronic flow meter. Instrument type: Smart Transmitter with out put 4-20
MA analogue signal going to DCS. Accuracy percentage of range: +/-0.2 %.Make:Yokogwa.Log book of hourly reading is signed by plant manager daily. The average hourly reading is calculated and this average reading is multiplied by working hours to arrive at the day’s generation of steam. The log book total can be cross checked with totalised data provided in the instrument.
monitoring frequency Continuously. Hourly reading transferred to log book. The log book total can be cross checked with totalised data provided in the instrument.
QA/QC procedures to be applied:
Calibration of meter carried out once a year. Meters calibrated regularly. During maintenance of meter alternate metering equipment will be provided. Accuracy of Meter : +/- 0.2% Supportive Document: Instrument Specifications Document.
Any comment: Records will be maintained for 12 years as required. If metered value is m3/h then Steam density from steam tables will used to calculate kgs/h
Data / Parameter: Q Other Steam(FBC Steam) Data unit: kgs/h Description: Quantity of steam from other boilers used for electricity generation. Source of data to be used: LMEL Plant records. Value of data applied Metered value/ 20 000 kgs/h whichever is higher
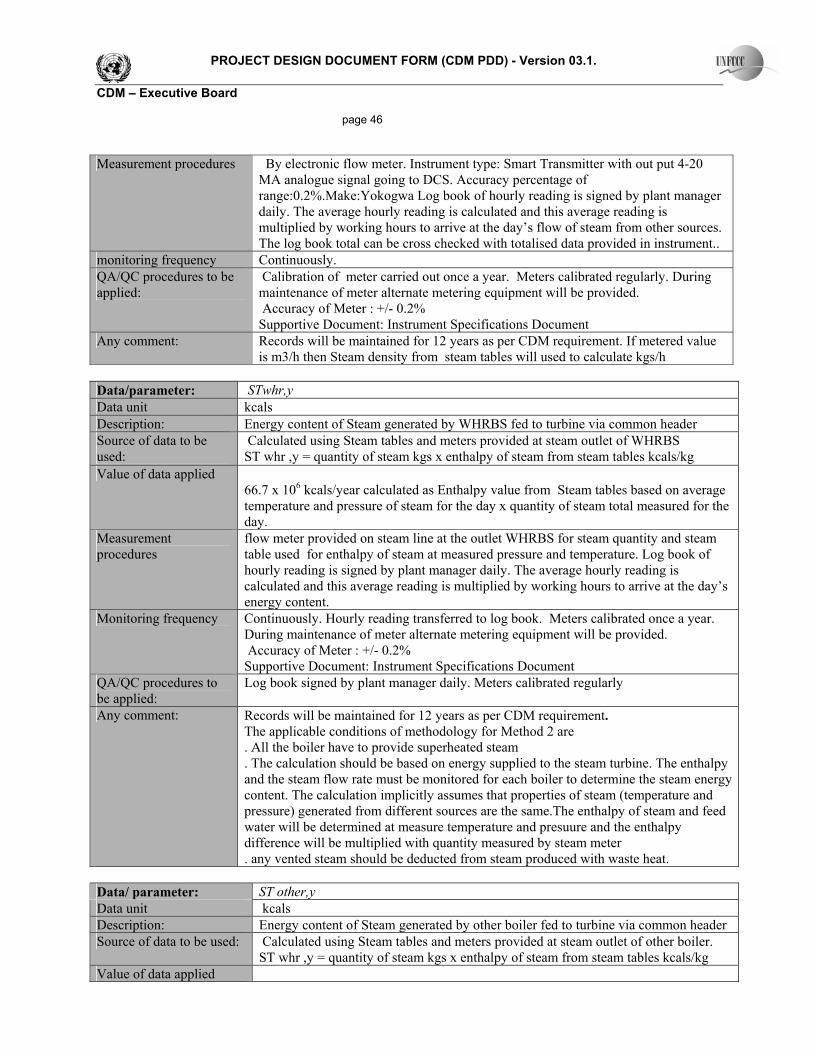
PROJECT DESIGN DOCUMENT FORM (CDM PDD) - Version 03.1. CDM – Executive Board page 46 Measurement procedures By electronic flow meter. Instrument type: Smart Transmitter with out put 4-20
MA analogue signal going to DCS. Accuracy percentage of range:0.2%.Make:Yokogwa Log book of hourly reading is signed by plant manager daily. The average hourly reading is calculated and this average reading is multiplied by working hours to arrive at the day’s flow of steam from other sources. The log book total can be cross checked with totalised data provided in instrument..
monitoring frequency Continuously. QA/QC procedures to be applied:
Calibration of meter carried out once a year. Meters calibrated regularly. During maintenance of meter alternate metering equipment will be provided. Accuracy of Meter : +/- 0.2% Supportive Document: Instrument Specifications Document
Any comment: Records will be maintained for 12 years as per CDM requirement. If metered value is m3/h then Steam density from steam tables will used to calculate kgs/h
Data/parameter: STwhr,y Data unit kcals Description: Energy content of Steam generated by WHRBS fed to turbine via common header Source of data to be used:
Calculated using Steam tables and meters provided at steam outlet of WHRBS ST whr ,y = quantity of steam kgs x enthalpy of steam from steam tables kcals/kg
Value of data applied 66.7 x 10⁶ kcals/year calculated as Enthalpy value from Steam tables based on average temperature and pressure of steam for the day x quantity of steam total measured for the day.
Measurement procedures
flow meter provided on steam line at the outlet WHRBS for steam quantity and steam table used for enthalpy of steam at measured pressure and temperature. Log book of hourly reading is signed by plant manager daily. The average hourly reading is calculated and this average reading is multiplied by working hours to arrive at the day’s energy content.
Monitoring frequency Continuously. Hourly reading transferred to log book. Meters calibrated once a year. During maintenance of meter alternate metering equipment will be provided. Accuracy of Meter : +/- 0.2% Supportive Document: Instrument Specifications Document
QA/QC procedures to be applied:
Log book signed by plant manager daily. Meters calibrated regularly
Any comment: Records will be maintained for 12 years as per CDM requirement. The applicable conditions of methodology for Method 2 are . All the boiler have to provide superheated steam . The calculation should be based on energy supplied to the steam turbine. The enthalpy and the steam flow rate must be monitored for each boiler to determine the steam energy content. The calculation implicitly assumes that properties of steam (temperature and pressure) generated from different sources are the same.The enthalpy of steam and feed water will be determined at measure temperature and presuure and the enthalpy difference will be multiplied with quantity measured by steam meter . any vented steam should be deducted from steam produced with waste heat.
Data/ parameter: ST other,y Data unit kcals Description: Energy content of Steam generated by other boiler fed to turbine via common header Source of data to be used: Calculated using Steam tables and meters provided at steam outlet of other boiler.
ST whr ,y = quantity of steam kgs x enthalpy of steam from steam tables kcals/kg Value of data applied

PROJECT DESIGN DOCUMENT FORM (CDM PDD) - Version 03.1. CDM – Executive Board page 47
13.34 x 10⁶ kcals/year calculated as Enthalpy value Steam tables based on average temperature and pressure of steam for the day x quantity of steam total measured for the day.
Measurement procedures flow meter provided on steam line at the outlet of other boilerfor steam quantity and steam table used for enthalpy of steam at measured pressure and temperature. Log book of hourly reading is signed by plant manager daily. The average hourly reading is calculated and this average reading is multiplied by working hours to arrive at the day’s energy content of steam from other sources. Meters calibrated regularly. During maintenance of meter alternate metering equipment will be provided
Monitoring frequency Continuously. Hourly reading transferred to log book. QA/QC procedures to be applied:
Log book signed by plant manager daily. Meters calibrated once a year. During maintenance of meter alternate metering equipment will be provided. Accuracy of Meter : +/- 0.2% Supportive Document: Instrument Specifications Document
Any comment: Records will be maintained for 12 years as per CDM requirement. The applicable conditions of methodology for Method 2 are . All the boiler have to provide superheated steam . The calculation should be based on energy supplied to the steam turbine. The enthalpy and the steam flow rate must be monitored for each boiler to determine the steam energy content. The calculation implicitly assumes that properties of steam (temperature and pressure) generated from different sources are the same.The enthalpy of steam and feed water will be determined at measure temperature and pressure and the enthalpy difference will be multiplied with quantity measured by steam meter . any vented steam should be deducted from steam produced with waste heat.
Data/ parameter: Temperature Data unit: Deg C Description: Steam/boiler feed water temperature at boilers/ steam temperature at inlet to STG Source of data to be used: Measured and data recorded in log book Value of data applied Average of metered value per day/490+/-5 deg c Monitoring procedures Direct measurement. Instrument type: Smart Transmtter with out put 4-20 MA
analogue signal going to DCS. Accuracy percentage of range: +/-0.2 % Make: Yokogwa
Monitoring frequency continuously QA/QC procedures to be applied:
Log book signed by plant manager daily. Meters calibrated once a year. During maintenance of meter alternate metering equipment will be provided. Accuracy of Meter : +/- 0.2% Supportive Document: Instrument Specifications Document
Any comment: Data used for referring steam table for calculating steam enthalpy. Records will be maintained for 12 years as per CDM requirement.
Data/ parameter: Pressure. Data unit: Bar g. Description: Steam pressure at inlet to STG./ Steam/boiler feed water pressure at boilers Source of data to be used: Measured and data recorded in log book. Value of data applied Average of metered value per day/ 70 kg/cm2 a Monitoring procedures Direct measurement. Instrument type: Smart Transmtter with out put 4-20 MA
analogue signal going to DCS. Accuracy percentage of range: +/-0.2 % Make:Yokogwa
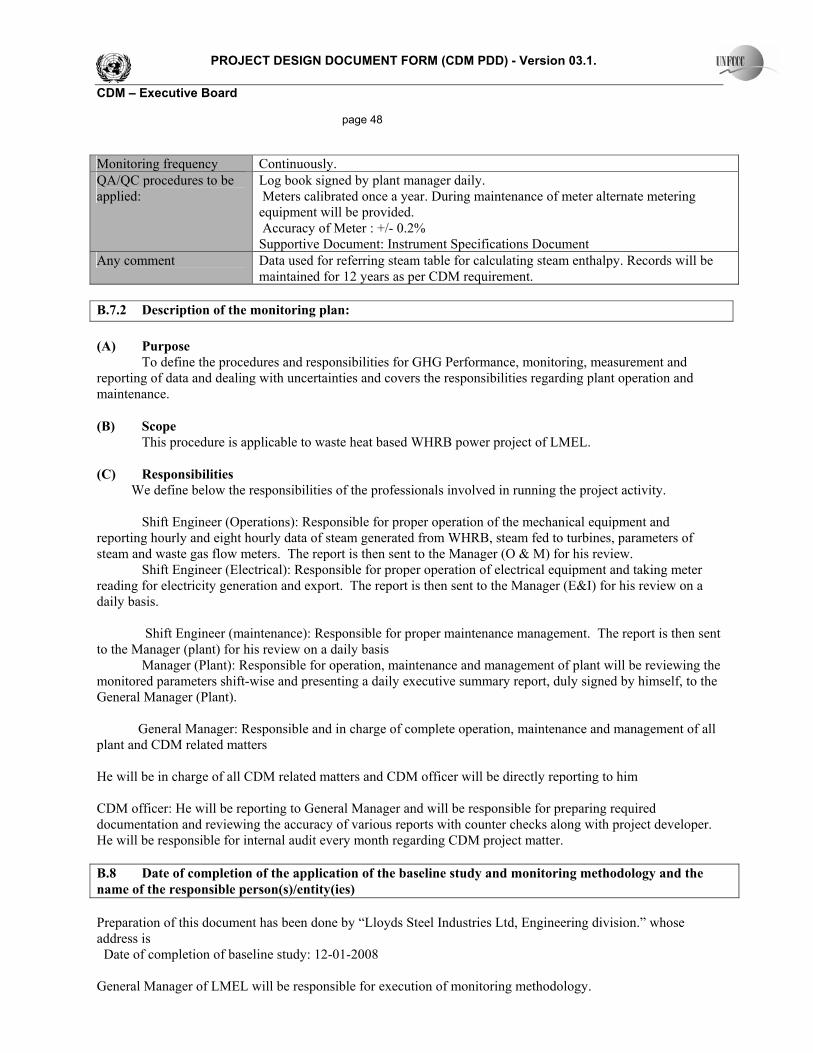
PROJECT DESIGN DOCUMENT FORM (CDM PDD) - Version 03.1. CDM – Executive Board page 48 Monitoring frequency Continuously. QA/QC procedures to be applied:
Log book signed by plant manager daily. Meters calibrated once a year. During maintenance of meter alternate metering equipment will be provided. Accuracy of Meter : +/- 0.2% Supportive Document: Instrument Specifications Document
Any comment Data used for referring steam table for calculating steam enthalpy. Records will be maintained for 12 years as per CDM requirement.
B.7.2 Description of the monitoring plan: (A) Purpose To define the procedures and responsibilities for GHG Performance, monitoring, measurement and reporting of data and dealing with uncertainties and covers the responsibilities regarding plant operation and maintenance. (B) Scope This procedure is applicable to waste heat based WHRB power project of LMEL. (C) Responsibilities We define below the responsibilities of the professionals involved in running the project activity. Shift Engineer (Operations): Responsible for proper operation of the mechanical equipment and reporting hourly and eight hourly data of steam generated from WHRB, steam fed to turbines, parameters of steam and waste gas flow meters. The report is then sent to the Manager (O & M) for his review. Shift Engineer (Electrical): Responsible for proper operation of electrical equipment and taking meter reading for electricity generation and export. The report is then sent to the Manager (E&I) for his review on a daily basis. Shift Engineer (maintenance): Responsible for proper maintenance management. The report is then sent to the Manager (plant) for his review on a daily basis Manager (Plant): Responsible for operation, maintenance and management of plant will be reviewing the monitored parameters shift-wise and presenting a daily executive summary report, duly signed by himself, to the General Manager (Plant). General Manager: Responsible and in charge of complete operation, maintenance and management of all plant and CDM related matters He will be in charge of all CDM related matters and CDM officer will be directly reporting to him CDM officer: He will be reporting to General Manager and will be responsible for preparing required documentation and reviewing the accuracy of various reports with counter checks along with project developer. He will be responsible for internal audit every month regarding CDM project matter. B.8 Date of completion of the application of the baseline study and monitoring methodology and the name of the responsible person(s)/entity(ies) Preparation of this document has been done by “Lloyds Steel Industries Ltd, Engineering division.” whose address is Date of completion of baseline study: 12-01-2008 General Manager of LMEL will be responsible for execution of monitoring methodology.
PROJECT DESIGN DOCUMENT FORM (CDM PDD) - Version 03.1. CDM – Executive Board page 49 Responsible person for baseline and monitoring methodology covered in this PDD. Mr R.M.Alegavi Vice President (Technology) Lloyds Steel Industries Ltd Engineering division 21-B Modern Centre Sane Guruji Marg Mahalaxmi Mumbai 400011 Tel No 91-22-30418111, 30418221 Fax No 91-22-30418260 [email protected], [email protected] SECTION C. Duration of the project activity / crediting period C.1 Duration of the project activity: C.1.1. Starting date of the project activity: 28/10/2006 C.1.2. Expected operational lifetime of the project activity: 15 Years C.2 Choice of the crediting period and related information: C.2.1. Renewable crediting period Not applicable C.2.1.1. Starting date of the first crediting period: Not applicable C.2.1.2. Length of the first crediting period: Not applicable C.2.2. Fixed crediting period: 10 years C.2.2.1. Starting date: 31/03/2009or from the date of registration of the project activity. C.2.2.2. Length: 10 years SECTION D. Environmental impacts D.1. Documentation on the analysis of the environmental impacts, including transboundary impacts: The Project activity is to produce electricity based on waste heat recovery based steam generation (WHRB) and steam turbines. There are no additional GHG emissions other than the existing GHG emissions in the absence of project activity.

PROJECT DESIGN DOCUMENT FORM (CDM PDD) - Version 03.1. CDM – Executive Board page 50 The installation of WHRB and Power plant requires approvals of IBR (Indian Boiler Regulation) and Maharashtra State Pollution Control Board (MSPCB) and both the approvals will be received before the Commissioning of project activity. Environmental impact is negligible as the project activity benefits the local, regional and global environment by, 1. Reducing the thermal pollution which could have been caused by emitting waste gases at 10000C into atmosphere. Project activity recovers the waste heat and save; energy and reduces thermal emission by controlling gas temperature below 2000C. 2. Generates electricity without adding any additional GHG emissions. i) The power generated by new project activity will be used for in house requirement and consumption of own and sister company without any T&D losses. 3. The generated waste water shall be used for plantation to create green belt. 4. Noise level from equipments shall be kept within legal limits. 5. The project will not generate on its own any Fly Ash due to Power generation from the project activity. But ash contained in flue gases will be collected in ash hoppers provided in WHR boiler 6. The proposed ESP shall remove the ash from flue gases which will be collected in Ash Hopper. This ash will be given free of cost to cement plants and brick manufacturers for further Economics benefits and use. The ash used for production of bricks saves the valuable productive soil; also it reduces the Air Pollution caused by the conventional brick kilns, due to the coal burning. The Ash consumed in Cement making reduces the limestone and coal consumption, thus natural resources are saved. LMEL have carried out EIA Study and required environment clearances will be obtained before commissioning activites as required by regulation. D.2. If environmental impacts are considered significant by the project participants or the host Party, please provide conclusions and all references to support documentation of an environmental impact assessment undertaken in accordance with the procedures as required by the host Party: Environmental impact are considered in significant as enumerated in D1, No adverse impact on environment will be there due to project activity. Noise Pollution Equipments like Boiler and STGs shall be provided with noise depressing facilities to dampen and to reduce the noise level to permissible levels at the nearest village. Thermal Pollution: In current situation the hot flue gases will be let out causing considerable thermal pollution. The heat shall be recovered in the boiler and the flue gases be let out by stack of 70 m height below 2000C and hence thermal pollution shall be reduced considerably. Air emission: An ESP provided at the outlet of boiler effectively reduces the flue dust level below to 100 mg/nm3 while acceptable legal standard is 100 mg/nm3. Impact on Water environment Blow down water shall be used for plantation. Sources of waste water are DM Plant and Blow down. All the waste water will be neutralized before using for plantation.
PROJECT DESIGN DOCUMENT FORM (CDM PDD) - Version 03.1. CDM – Executive Board page 51 Monitoring of waste water will be done to limit pH, BOD and COD levels within the stipulated levels. No discharge will be there outside the premises. Hence due to the zero discharge condition, no adverse impact will be there in the water regime. Solid waste management Ash collected from bottom of hopper of ESP shall be transported to Ash Silo equipped with bag filters to ensure clean air. Ash collected shall be supplied to cement manufacturing/ brick manufacturing units. Safety Management To ensure safe working conditions: 1) All moving parts shall be provided with guards/ hoods. 2) Insulation of all hot parts shall be done. 3) Full fledged maintenance department shall ensure the healthy condition of equipments. 4) A disaster management plan already exists to handle crisis situation. All efforts will be done to create clean environment. Parameters like Noise, Fugitive Emission as well as point source emissions will be monitored regularly. Conclusion: Project activity is environment friendly and creates employment and other benefits and promotes sustainable developments SECTION E. Stakeholders’ comments E.1. Brief description how comments by local stakeholders have been invited and compiled: LMEL identifies the following as stake holders to keep the transparency in the operational activity of the project promoter and thereby meeting local/ environmental regulations 1) Local Authority (Member of Legislative Assembly of Maharashtra) 2) Local authority of Village –Ghugus Gram Panchayat 3) Maharashtra electricity supply company of Maharashtra ltd (MSEDCL) 4) Maharashtra State Pollution Control Board, (MSPCB) 5) Ministry of Commerce and Industry. 6) Power trading company E.2. Summary of the comments received: LMEL management apprised the representatives of village Panchayat of village-Ghugus about the project activity personally by the officers of LMEL and called for a meeting of villagers. The Sarpanch who is the head of local governing body panchayat with representative villagers attended the meeting on The members of Panchayat appreciated and had expressed their no objection for project activity. Ghugus Gram Panchayat has issued no objection certificate. We give below queries raised during meeting held on 09/02/2007. Persons attended from Ghugus village Persons from LMEL 1 Mrs Shobha Thakre village sarpanch 1 Mr Sunil Gupta 2 Mr Sheshrao .D.Thakre 2 Mr G.M.Purohit
PROJECT DESIGN DOCUMENT FORM (CDM PDD) - Version 03.1. CDM – Executive Board page 52 3 Mr Dayashankar.R.Tiwari 4 Mr Ganesh.Bapurao.Vitre Ghugus village sarpanch is the elected head of Panchayat body created for looking after interests of the village. Question Reply by LMEL 1 How the village is benefited 1 As waste heat is recovered and flue gases will be
entering atmosphere at lower temperature, the environment of village will improve. 2 Expansion activity will increase employment opportunities
2 Criteria for local people employment Project will require qualified technicians, professionals, skilled and unskilled labour. Local people will be given preference if qualified technicians who have required qualification and experience are available. In case of commercial jobs where specific professional qualification is not required all efforts will be made to employ only local people.
3 Dust emission problem Project does not generate any ash as it is only waste heat based. However the dust from incoming flue gases is separated in ESP being provided. Hence the dust emission will be as per government environment rules
4 Plans for village development Company informed that they will be pleased to contribute to sustained development of the village. The company will address the issues of helping local students in their studies by providing scholarships and help in meeting water problem faced by village. The company also will make their dispensary available to local villagers in case of urgent needs. The company will make efforts to coordinate with gram panchayat in any manner that will help the villagers.
Similarly LMEL management apprised MLA regarding the project activity who also appreciated and expressed no objection for the project activity. MLA is a Maharahtra Legislative Assembly member elected by people from the area of which Ghugus is a constituent. Sarapanch, village Ghugus raised the points of activities required to be carried out by company for benefiting the village. Permission have been sought from the State agencies like MSEDCL, MSPCB, etc. wherever required legally and consent to establish have been received and required consent to operate will be received before commissioning of power plant. E.3. Report on how due account was taken of any comments received: The relevant comments and important clauses mentioned in the project documents/ Detailed project report, clearance from MSPCB (Maharashtra State Pollution Control Board) were considered while preparation of CDM Project Design Document. LMEL management representatives met various stake holders for appraisal regarding project activity and sought the support. LMEL management has decided to interact with village panchayat to make sustainable contribution to village welfare. The proposed schemes will target problems of drinking water and education.
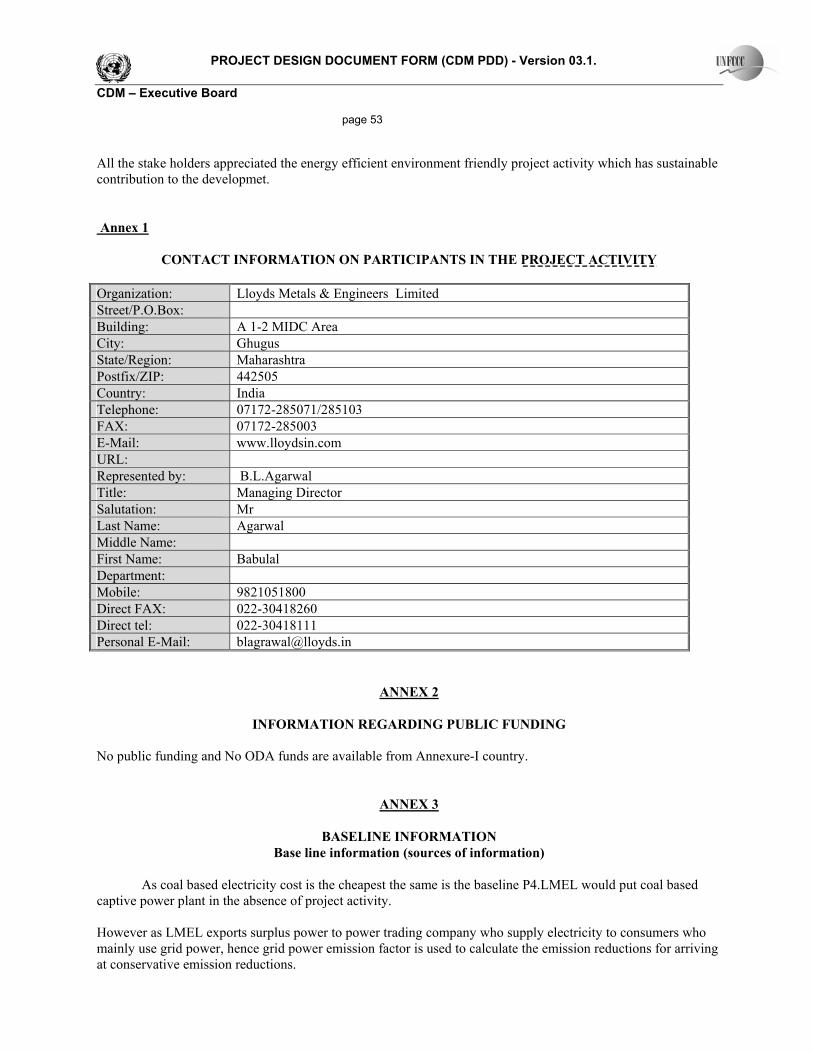
PROJECT DESIGN DOCUMENT FORM (CDM PDD) - Version 03.1. CDM – Executive Board page 53 All the stake holders appreciated the energy efficient environment friendly project activity which has sustainable contribution to the developmet.
Annex 1
CONTACT INFORMATION ON PARTICIPANTS IN THE PROJECT ACTIVITY
Organization: Lloyds Metals & Engineers Limited Street/P.O.Box: Building: A 1-2 MIDC Area City: Ghugus State/Region: Maharashtra Postfix/ZIP: 442505 Country: India Telephone: 07172-285071/285103 FAX: 07172-285003 E-Mail: www.lloydsin.com URL: Represented by: B.L.Agarwal Title: Managing Director Salutation: Mr Last Name: Agarwal Middle Name: First Name: Babulal Department: Mobile: 9821051800 Direct FAX: 022-30418260 Direct tel: 022-30418111 Personal E-Mail: [email protected]
ANNEX 2
INFORMATION REGARDING PUBLIC FUNDING
No public funding and No ODA funds are available from Annexure-I country.
ANNEX 3
BASELINE INFORMATION Base line information (sources of information)
As coal based electricity cost is the cheapest the same is the baseline P4.LMEL would put coal based captive power plant in the absence of project activity. However as LMEL exports surplus power to power trading company who supply electricity to consumers who mainly use grid power, hence grid power emission factor is used to calculate the emission reductions for arriving at conservative emission reductions.

PROJECT DESIGN DOCUMENT FORM (CDM PDD) - Version 03.1. CDM – Executive Board page 54 The excel calculations for a new coal based captive power plant and grid electricity are enclosed to prove the grid emission factor is lower than coal based captive power plant. We give below the calculated emission factor 1Grid emission factor is 0.795 t CO2/MWh 2 Coal based CPP emission factor 1.09 t CO2/MWh. The MSEDCL grid power is being used by LMEL at the moment. We select western grid electricity of which MSEDCL is a part and hence western grid electricity emission factor used to calculate baseline emission reductions which will give conservative reduction in base line emissions as grid power is mainly coal based but also comprises of diesel, hydel and nuclear power which will give lower emission factor for grid compared to coal based power plant.
Government of India, Ministry of Power, Central Electricity Authority in technical cooperation with Indo-German Energy Programme have issued “CO2 Baseline Data base for the Indian Power Sector’ User Guide Version 3.0 December 2007. This document along with CO2 Data base excel calculations are available on web site www.cea.nic.in The objective is to facilitate adoption of authentic baseline emission data and also to ensure uniformity in the calculation of CO2 emission reductions by CDM Project developers, the Central Electric Authority in cooperation with GTZ CDM-India has compiled a data base containing the necessary data on CO2 emissions for all grid connected power stations in India. The data base currently covers the five fiscal years 2000-01 to 2006-07.CEA intends to update data base at the end of each financial year. The calculations cover all five regional grids. The document follows Tool to calculate the emission factor for an electricity system version 01 EB 35 formulae for calculation of emission factor for each grid. LMEL has selected western grid as base line and in line with “Tool to calculate the emission factor for an electricity system version 1 EB 35” we have to consider available vintage data for 3 years. We give below data available from the CO2 Base line Data base for the Indian Power Sector referred above. EF y considered for base line calculation is 0.795 t CO2/MWh Emission factor 2004-05 2005-06 2006-07 EF OM, Simple tCO2/MWh 1.01 1.00 0.99 EF BM Build Margin tCO2/MWh 0.59 Weighted average EF OM, Simple tCO2/MWh
0.9999
EF y Combined Margin tCO2/MWh 0.795 Net Generation in operating margin GWh 155731 154918 159681 Net Generation in Build Margin GWh 37099 Calculations Weighted average of EF OM, Simple tCO2/MWh = (155731*1.01+154918*1+159681*0.99) / (155731+154918+159681) = 0.9999 Build Margin based on 20% of the generation For the latest year 2006-07 EF BM Build Margin tCO2/MWh = 0.59
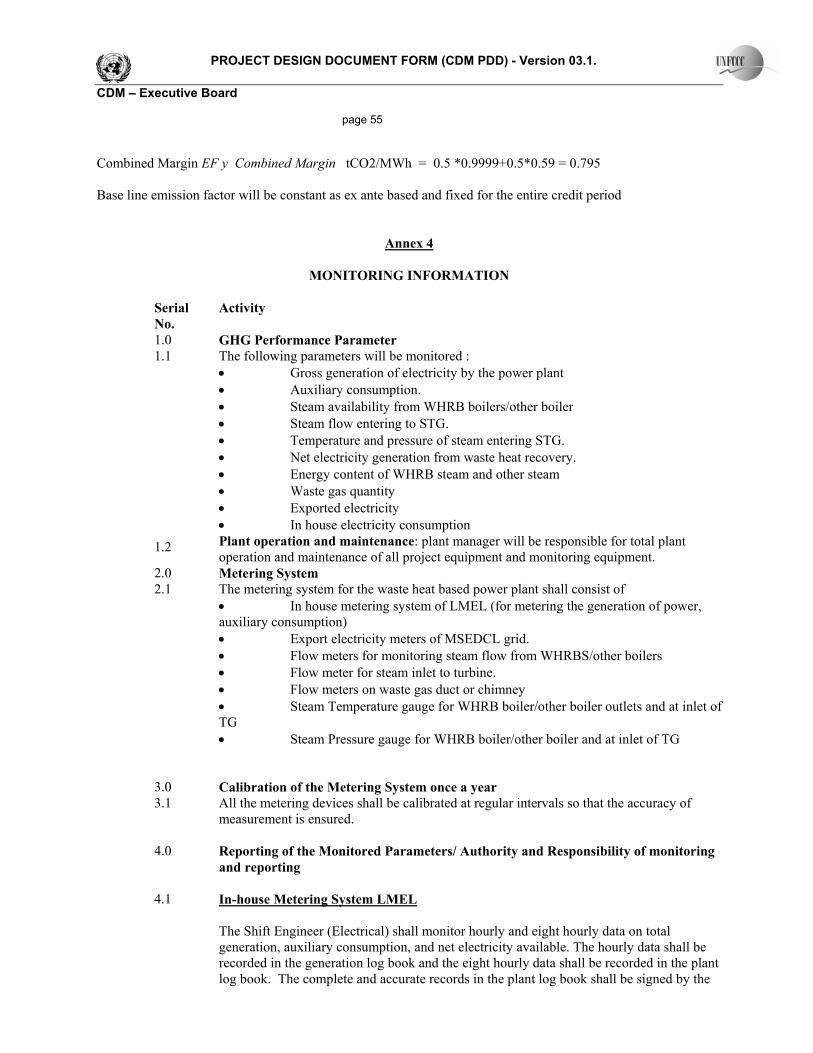
PROJECT DESIGN DOCUMENT FORM (CDM PDD) - Version 03.1. CDM – Executive Board page 55 Combined Margin EF y Combined Margin tCO2/MWh = 0.5 *0.9999+0.5*0.59 = 0.795 Base line emission factor will be constant as ex ante based and fixed for the entire credit period
Annex 4
MONITORING INFORMATION
Serial No.
Activity
1.0 GHG Performance Parameter 1.1 1.2
The following parameters will be monitored : • Gross generation of electricity by the power plant • Auxiliary consumption. • Steam availability from WHRB boilers/other boiler • Steam flow entering to STG. • Temperature and pressure of steam entering STG. • Net electricity generation from waste heat recovery. • Energy content of WHRB steam and other steam • Waste gas quantity • Exported electricity • In house electricity consumption Plant operation and maintenance: plant manager will be responsible for total plant operation and maintenance of all project equipment and monitoring equipment.
2.0 Metering System 2.1 The metering system for the waste heat based power plant shall consist of
• In house metering system of LMEL (for metering the generation of power, auxiliary consumption) • Export electricity meters of MSEDCL grid. • Flow meters for monitoring steam flow from WHRBS/other boilers • Flow meter for steam inlet to turbine. • Flow meters on waste gas duct or chimney • Steam Temperature gauge for WHRB boiler/other boiler outlets and at inlet of TG • Steam Pressure gauge for WHRB boiler/other boiler and at inlet of TG
3.0 Calibration of the Metering System once a year 3.1 All the metering devices shall be calibrated at regular intervals so that the accuracy of
measurement is ensured.
4.0 Reporting of the Monitored Parameters/ Authority and Responsibility of monitoring and reporting
4.1 In-house Metering System LMEL
The Shift Engineer (Electrical) shall monitor hourly and eight hourly data on total generation, auxiliary consumption, and net electricity available. The hourly data shall be recorded in the generation log book and the eight hourly data shall be recorded in the plant log book. The complete and accurate records in the plant log book shall be signed by the
PROJECT DESIGN DOCUMENT FORM (CDM PDD) - Version 03.1. CDM – Executive Board page 56
Shift Engineer (Electrical). Both of these reports shall be sent to the Manager (Plant) The Steam flow meter reading, temperature and pressure gauge and DCS will measure the respective parameters and reporting will be done shift wise by shift in-charge (operations) based on the online measurements.
5. Uncertainties and Adjustments: procedure for identifying and dealing with uncertainties
5.1 The hourly, eight hourly, daily and monthly data shall be recorded at various points as stated above. Any observations (like inconsistencies of report parameters) and/or discrepancies in the operation of the power plant will be documented as “History” in the daily report prepared by the General Manager (Plant) along with its time of occurrence, duration and possible reasons behind such operational disruptions. Necessary corrective actions will be undertaken at the earliest. Furthermore, as a safety measure, the total power generating system shall be equipped with an Automatic Alarming System which gives a prior indication of any fluctuations in the operating parameters of the power plant thereby enabling the operators to take necessary preventive measures. These measures will be undertaken in order to detect and minimize the uncertainty levels in data monitoring.
6.0 Experience and Training 6.1 All the Shift Engineers (Electrical and Instrumentation, Operations) shall be qualified
engineers/ technologists. All the operators of the boiler power plant shall be IBR certified and NPTI certified engineers, and they shall also undergo an exhaustive on-the-job training program including plant operations, data monitoring and report preparation. The technical staff will also be trained by OEM representatives.
6.2 Emergency Preparedness Plan The total power generating system of the waste heat based power plant will be equipped with an “Automatic Alarming System” which helps the operators to take necessary preventive actions before any kind of non-functioning of the power plant which may results. LMEL shall have a fire fighting system in place. In addition to the above the following standard procedures for tackling emergencies arising from, • Blackout • Low boiler drum level/ low feed water level • High flue gas temperature from sponge iron kiln. • Load throw off • Boiler Tube leakage. Boiler tripping at alarm systems will be at place.
Internal audit CDM officer will carry out internal audit every month as per internal audit plan and prepare all necessary CDM related documentation. He will be reporting to General Manager Project Performance Review The company has in place “Audit Plan” which envisages regular monitoring and audit of CDM project . The project performance review will be carried out under this audit plan by CDM officer of the company who will be directly reporting to General Manager. Reference Project Design Document, maintenance manuals, standard OEM procedures and CDM

PROJECT DESIGN DOCUMENT FORM (CDM PDD) - Version 03.1. CDM – Executive Board page 57
documentation. Records
The following reports will be part of records : a. Calibration report of electricity meters. b. Calibration report on other instruments. c. Daily shift record (production). Log sheets. d. Daily shift record (electrical).Log sheets. e. Report to top management. f. CDM reports All reports will be signed by shift engineer/ concerned officer, plant manager and General Manager CALCULATION OF NET POWER GENERATED FROM WHRB PROJECT ACTIVITY: As the steam from WHRBs go to a common header which also receives the steam from other source applicable calculation will be as per situation 2 as it is not possible to measure the net calorific value of the waste gs/heat and steam generated with different fuels in dedicated boilers are fed into turbine through the common steam header. The applicable equation 1e fwg = ST whr,y/ ST whr,y +ST other,y (equation 1e) ST whr, y = energy content of the steam generated by WHRB fed into turbine via common steam header ST other, y = energy content of the steam generated by other boilers fed into turbine via common steam header . All the boiler have to provide superheated steam . The calculation should be based on energy supplied to the steam turbine. The enthalpy and the steam flow rate must be monitored for each boiler to determine the steam energy content. The calculation implicitly assumes that properties of steam (temperature and pressure) generated from different sources are the same.The enthalpy of steam and feed water will be determined at measure temperature and pressure and the enthalpy difference will be multiplied with quantity measured by steam meter . any vented steam should be deducted from steam produced with waste heat. To achieve the above we follow the steps below (as per project monitoring plan given in the schematic diagram enclosed (A) Flow of Steam fed from WHRBS to common header = Q whr Steam (B) Flow of other Steam from other boilers to common header = Q Other Steam (C) Energy content of WHRB steam ST whr = Q whr Steam* Enthalpy of steam (D) Energy content of others steam ST other = Q Other Steam*Enthalpy of steam (F) Fraction of WHRB electricity fwg = ST whr / ST whr+ ST others (G) EGi,,j,y (electricity supplied to recipients by = Electricity supplied to LMEL + Generator) Electricity supplied to MSEDCL grid Grid/ power trading company (H) Quantity of Electricity supplied by project activity to recipient plants

PROJECT DESIGN DOCUMENT FORM (CDM PDD) - Version 03.1. CDM – Executive Board page 58
EGj, y = fwg * EG i,j,y (electricity supplied to recipients by Generator)
Enthalpy of steam is taken from Steam tables based on temperature and pressure.

PROJECT DESIGN DOCUMENT FORM (CDM PDD) - Version 03.1. CDM – Executive Board page 59
PROJECT DESIGN DOCUMENT FORM (CDM PDD) - Version 03.1. CDM – Executive Board page 60 Appendix I : Abbreviation ABC After Burning Chamber Annex Annexure BIFR Board of Industrial and Financial Restructure. CPP Captive Power Plant CEA Central Electricity Authority. CER Carbon Emission Reduction CPCB Central Pollution Control Board CDM Clean Development Mechanism DCS Digital Control System DM De-Mineralized DRI Direct Reduced Iron ESP Electro Static Precipitator EIA Environmental Impact Assessment FBC Fluidized Bed Combustion FBCB Fluidized Bed Combustion Boiler GHG Green House Gas HSD High Speed Diesel HT High Tension IBR Indian Boiler Regulation IRR Internal Revenue Return. JPC Joint Plant Committee kwh Kilo Watt hour LMEL Lloyds Metals and Engineers Limited LSHS Low Sulphur Heavy Stock LSIL Lloyds Steel Industries Ltd MSEDCL Maharashtra State Electricity Distribution Company Ltd MERC Maharashtra State Regulatory Commission MPCB Maharashtra Pollution Control Board MWh Mega Watt hour MW Mega Watt NM3/h Normal Meter Cube per Hour PLF Plant Load Factor PLR Prime Lending Rate. PDD Project Design Document Qty Quantity RBI Reserve Bank of India STG Steam Turbine Generator SPM Suspended Particulate Matter tCO2 Tonnes Carbon-dioxide tCO2eq Tonnes Carbon-dioxide equivalent TISCO Tata Iron & Steel Co Ltd TPD Tonnes per Day Tones/h Tonnes per hour T&D Transmission and Distribution TG Turbine Generator WHR Waste Heat Recovery WHRB Waste Heat Recovery Boiler