clean energy technologies - nrcan.gc.ca · transmission and distribution technologies presented to:...
TRANSCRIPT
DEVON . OTTAWA . VARENNES
- ..
rIMPACT OF LARGE-SCALE
DISTRIBUTED GENERATIONPENETRATION ON
POWER SYSTEM STABILITY
CLEAN ENERGY TECHNOLOGIESTECHNIQUES D'ÉNERGIE ÉCOLOGIQUE---~-._--~"-
C TEe CENTRE DE LA TECHNOLOGIE DE L'ÉNERGIE DE CANMET
1+1 Natural ResourcesCanada
Ressources naturellesCanada Canadã

IMPACT OF LARGE-SCALE DISTRIBUTED GENERATION
PENETRATION ON POWER SYSTEM STABILITY
Prepared by:
Kinectrics Inc.
A. Narang Principal Research Engineer
Transmission and Distribution Technologies
Presented to:
Scientific Authority : Chad Abbey Natural Resources Canada
CETC Varennes – Energy Technology and Programs Sector 1615 Boul.. Lionel Boulet CP4800
Varennes (Québec) J3X 1S6
March 9, 2006

CITATION
Narang, A., Impact of Large-Scale Distributed Generation Penetration on Power System Stability, report # CETC-Varennes 2006-089 (TR), CANMET Energy Technology Centre, Natural Resources Canada, March 2006, 66 pp.
DISCLAMER
This report is distributed for informational purposes and does not necessarily reflect the views of the Government of Canada nor constitute and endorsement of any commercial product or person. Neither Canada nor its ministers, officers, employees or agents makes any warranty in respect to this report or assumes any liability arising out of this report.
ACKNOWLEDGEMENTS
A debt of gratitude to my colleague, Mr Peter Dick, for helping to shape the project and for follow-up discussions related to its scope. Thanks are also extended to Mr Chad Abbey and Dr Lisa Dignard-Bailey at Natural Resources Canada (CETC – Varennes) for their patience and understanding throughout the course of the project. Financial support for this research project was provided by Natural Resources Canada through the Technology and Innovation Program as part of the climate change plan for Canada.
Report – CETC 2006-089 (TR) i March 2006
TABLE OF CONTENT
1 Impact of large-scale distributed generation penetration on power system stability.............................. 3 1.1 Introduction.......................................................................................................................3
2 Objectives & Scope ................................................................................................................................ 6
3 The Stability Problem............................................................................................................................. 7
4 Candidate Study System......................................................................................................................... 9 4.1 Transmission Grid.............................................................................................................9 4.2 Generation Resources & Characteristics ........................................................................16 4.3 Generator Models............................................................................................................19
4.3.1 Cherrywood ................................................................................................................... 21 4.3.2 Lennox........................................................................................................................... 21 4.3.3 Chats Falls ..................................................................................................................... 24 4.3.4 Saunders ........................................................................................................................ 27 4.3.5 DG Units........................................................................................................................ 27 4.3.6 Embedded Network Units ............................................................................................. 28
4.4 Load Representation .......................................................................................................29 5 Impact of Large-Scale DG Penetration ................................................................................................ 30
5.1 Study Scenarios...............................................................................................................30 5.2 Steady-State Stability......................................................................................................31 5.3 Transient Stability...........................................................................................................32 5.4 Assessment......................................................................................................................34
6 References ............................................................................................................................................ 60
7 Bibliography......................................................................................................................................... 63 7.1 Distribution System Impacts...........................................................................................63 7.2 Industry Standards ..........................................................................................................64 7.3 Utility Standards .............................................................................................................65 7.4 Major Reports .................................................................................................................66
Report – CETC 2006-089 (TR) ii March 2006
LIST OF FIGURES
Figure 1 Simplified representation of transmission network serving Ottawa area....................... 10 Figure 2 Solved loadflow for NERC base case (2005 Winter case)............................................. 13 Figure 3 Condensed view of power flows for NERC base case ................................................... 14 Figure 4 Solved base case for the truncated study system............................................................ 15 Figure 5 Required DG response to abnormal system voltages/1/................................................. 19 Figure 6 Required DG response to abnormal system frequency/1/ .............................................. 19 Figure 7 IEEE Type ST1 Excitation System Model..................................................................... 22 Figure 8 PSS/E “IEEEG1” Turbine-Governor Model .................................................................. 23 Figure 9 PSS/E “IEEEST“ Stabilizer model................................................................................. 23 Figure 10 PSS/E ‘IEEEX1’ (IEEE Type 1) Excitation System Model ........................................ 25 Figure 11 PSS/E ‘HYGOV’ Hydro Turbine-Governor Model..................................................... 26 Figure 12 PTI Type ‘SCRX’ bus fed static exciter model............................................................ 28 Figure 13 Power flows relative to thermal line ratings................................................................. 37 Figure 14 Load in Ottawa area increased by 150% ...................................................................... 38 Figure 15 Outage on both Lennox units and 150% load growth in Ottawa area.......................... 39 Figure 16 Chats Falls (2 units) outage, 150% load growth near Ottawa ...................................... 40 Figure 17 Line outage at Chats Falls curtailing reactive power support ...................................... 41 Figure 18 Outage on a 500-kV Lennox circuit yielding unacceptable voltage levels .................. 42 Figure 19 Outage on a 500-kV Lennox circuit limits and 50% load growth................................ 43 Figure 20 Load growth matched by DG capacity (unity power factor), and considering
line-outage contingency at Chats Falls ......................................................................... 44 Figure 21 DG contribution limited to reactive support during line-outage at Chats Falls ........... 45 Figure 22 100% Load growth matched by Local DG Penetration; line outage at Chats Falls ..... 46 Figure 23 100% Load growth matched by Local DG Penetration; 500-kV circuit outage .......... 47 Figure 24 Hawthorne fault scenario; Base operating posture....................................................... 48 Figure 25 Chats Falls fault scenario; Base operating posture....................................................... 49 Figure 26 Hawthorne fault scenario; 100% Load Growth at Hawthorne, no new generation...... 50 Figure 27 Chats Falls fault scenario; 100% Load Growth at Hawthorne, no new generation ..... 51 Figure 28 Hawthorne fault scenario; 100% load surge at Hawthorne (simulating DG tripping) . 52 Figure 29 Chats Falls fault scenario; 100% load surge at Hawthorne (simulating DG tripping). 53 Figure 30 Hawthorne fault scenario; Constant Voltage DG matching 100% Load Growth
Trips at Hawthorne ...................................................................................................... 54 Figure 31 Chats Falls fault scenario; Constant Voltage DG matching 100% Load Growth
Trips at Hawthorne ...................................................................................................... 55 Figure 32 Hawthorne fault scenario; Constant Voltage model DG matching 100% Load
Growth remains I/S ...................................................................................................... 56 Figure 33 Chats Falls fault scenario; Constant Voltage DG matching 100% Load Growth
remains I/S .................................................................................................................... 57 Figure 34 Hawthorne fault scenario; Rotating DG with exciter matching 100% Load Growth,
remains in service. ........................................................................................................ 58 Figure 35 Chats Falls fault scenario; Rotating DG with exciter matching 100% Load Growth,
remains in service. ........................................................................................................ 59
Report – CETC 2006-089 (TR) iii March 2006
LIST OF TABLES
Table 1 Lennox generator model parameters................................................................................ 22 Table 2 Lennox exciter model parameters.................................................................................... 22 Table 3 Lennox governor model parameters ................................................................................ 23 Table 4 Lennox stabilizer model parameters /2 p. 815/................................................................ 24 Table 5 Chats Falls generator model parameters.......................................................................... 24 Table 6 Chats Falls exciter model parameters (PSS/E Model IEEEX1) ...................................... 26 Table 7 Chats Falls turbine-governor model parameters (PSS/E Model HYGOV) ..................... 26 Table 8 Generic DG model parameters (GENROU) .................................................................... 28 Table 9 Parameters for bus-fed static exciter (PSS/E Model SCRX)........................................... 28 Table 10 Embedded Generation.................................................................................................... 29
Report – CETC 2006-089 (TR) iv March 2006
SUMMARY
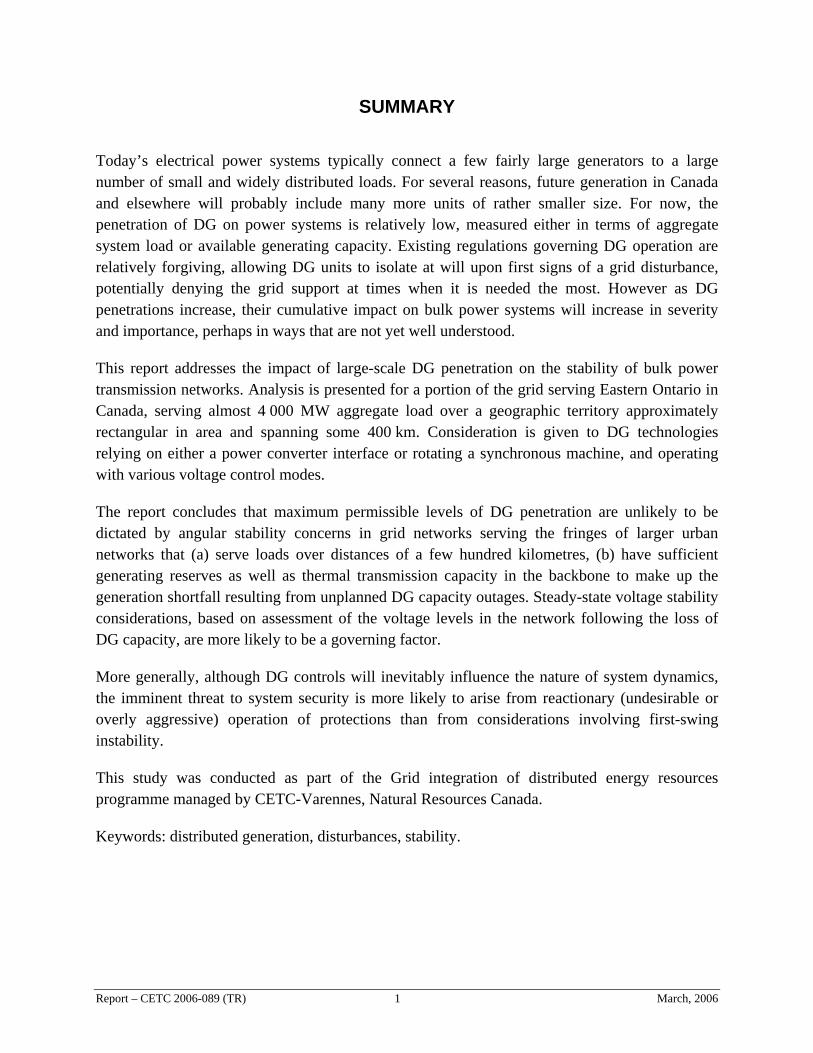
Today’s electrical power systems typically connect a few fairly large generators to a large number of small and widely distributed loads. For several reasons, future generation in Canada and elsewhere will probably include many more units of rather smaller size. For now, the penetration of DG on power systems is relatively low, measured either in terms of aggregate system load or available generating capacity. Existing regulations governing DG operation are relatively forgiving, allowing DG units to isolate at will upon first signs of a grid disturbance, potentially denying the grid support at times when it is needed the most. However as DG penetrations increase, their cumulative impact on bulk power systems will increase in severity and importance, perhaps in ways that are not yet well understood.
This report addresses the impact of large-scale DG penetration on the stability of bulk power transmission networks. Analysis is presented for a portion of the grid serving Eastern Ontario in Canada, serving almost 4 000 MW aggregate load over a geographic territory approximately rectangular in area and spanning some 400 km. Consideration is given to DG technologies relying on either a power converter interface or rotating a synchronous machine, and operating with various voltage control modes.
The report concludes that maximum permissible levels of DG penetration are unlikely to be dictated by angular stability concerns in grid networks serving the fringes of larger urban networks that (a) serve loads over distances of a few hundred kilometres, (b) have sufficient generating reserves as well as thermal transmission capacity in the backbone to make up the generation shortfall resulting from unplanned DG capacity outages. Steady-state voltage stability considerations, based on assessment of the voltage levels in the network following the loss of DG capacity, are more likely to be a governing factor.
More generally, although DG controls will inevitably influence the nature of system dynamics, the imminent threat to system security is more likely to arise from reactionary (undesirable or overly aggressive) operation of protections than from considerations involving first-swing instability.
This study was conducted as part of the Grid integration of distributed energy resources programme managed by CETC-Varennes, Natural Resources Canada.
Keywords: distributed generation, disturbances, stability.
Report – CETC 2006-089 (TR) 1 March, 2006
SOMMAIRE
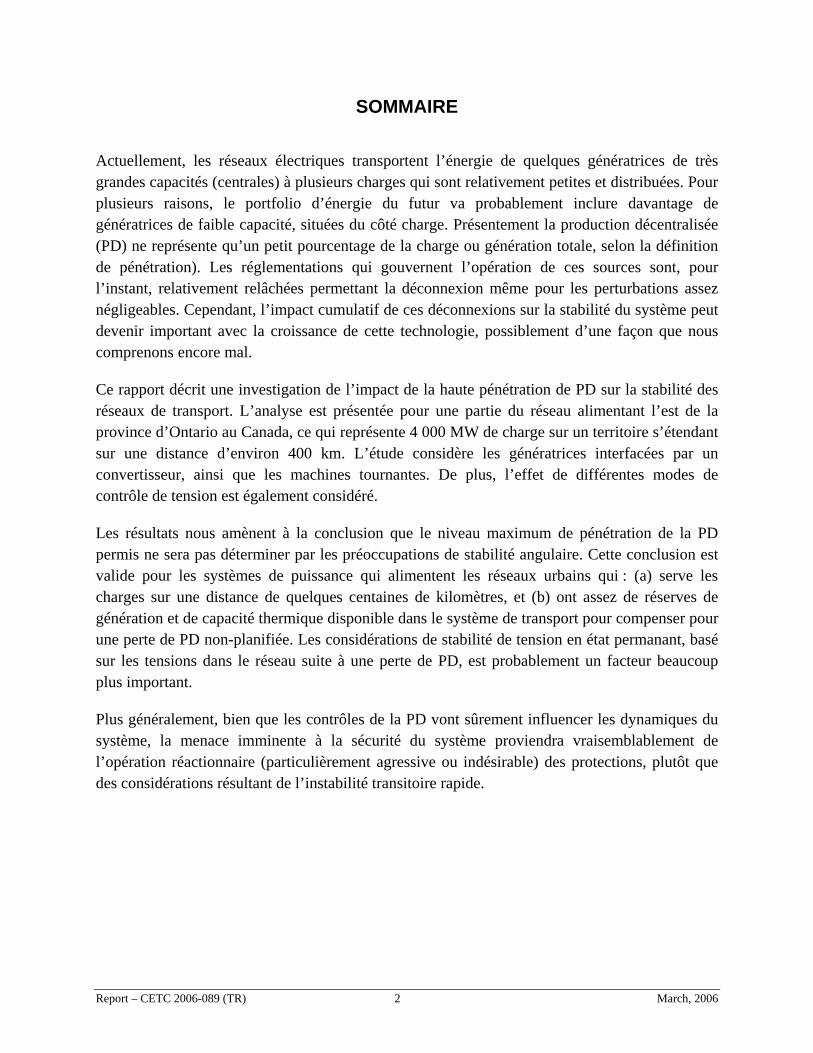
Actuellement, les réseaux électriques transportent l’énergie de quelques génératrices de très grandes capacités (centrales) à plusieurs charges qui sont relativement petites et distribuées. Pour plusieurs raisons, le portfolio d’énergie du futur va probablement inclure davantage de génératrices de faible capacité, situées du côté charge. Présentement la production décentralisée (PD) ne représente qu’un petit pourcentage de la charge ou génération totale, selon la définition de pénétration). Les réglementations qui gouvernent l’opération de ces sources sont, pour l’instant, relativement relâchées permettant la déconnexion même pour les perturbations assez négligeables. Cependant, l’impact cumulatif de ces déconnexions sur la stabilité du système peut devenir important avec la croissance de cette technologie, possiblement d’une façon que nous comprenons encore mal.
Ce rapport décrit une investigation de l’impact de la haute pénétration de PD sur la stabilité des réseaux de transport. L’analyse est présentée pour une partie du réseau alimentant l’est de la province d’Ontario au Canada, ce qui représente 4 000 MW de charge sur un territoire s’étendant sur une distance d’environ 400 km. L’étude considère les génératrices interfacées par un convertisseur, ainsi que les machines tournantes. De plus, l’effet de différentes modes de contrôle de tension est également considéré.
Les résultats nous amènent à la conclusion que le niveau maximum de pénétration de la PD permis ne sera pas déterminer par les préoccupations de stabilité angulaire. Cette conclusion est valide pour les systèmes de puissance qui alimentent les réseaux urbains qui : (a) serve les charges sur une distance de quelques centaines de kilomètres, et (b) ont assez de réserves de génération et de capacité thermique disponible dans le système de transport pour compenser pour une perte de PD non-planifiée. Les considérations de stabilité de tension en état permanant, basé sur les tensions dans le réseau suite à une perte de PD, est probablement un facteur beaucoup plus important.
Plus généralement, bien que les contrôles de la PD vont sûrement influencer les dynamiques du système, la menace imminente à la sécurité du système proviendra vraisemblablement de l’opération réactionnaire (particulièrement agressive ou indésirable) des protections, plutôt que des considérations résultant de l’instabilité transitoire rapide.
Report – CETC 2006-089 (TR) 2 March, 2006
1 Impact of large-scale distributed generation penetration on power system stability
1.1 Introduction
Today’s electrical power systems typically connect a few fairly large generators to a large number of small and widely distributed loads. For several reasons, future generation in Canada and elsewhere will probably include many more units of rather smaller size. Drivers for this trend include a shift towards the use of renewable resources, a desire for increased energy efficiency, an aversion to the risk and long construction periods characteristic of large stations, the benefit of assembling machines in factories rather than in the field, and a general deregulation of the utility industry which favours diversity.
For some years, modelling studies have reviewed the impact of distributed generation on utility distribution systems, including power quality, feeder protections, service reliability and public safety [B1 – B20 in Section 7]. Many issues have been identified for study, to assess the merits and drawbacks of Distributed Generation (DG) in traditional power distribution systems. Some studies have attempted to quantify the levels of DG penetration relative to feeder capacity or existing load, where one or more of these pose a limiting constraint. The bibliography at the end of this report lists a number of industry standards, utility standards and major reports that have come out of this previous work in addition to the above papers.
At this time, the penetration of DG on power systems is relatively low, measured either in terms of aggregate system load or available generating capacity. Existing Standards/1/ favour regulations governing DG operation that are simpler and least disruptive to utility operations. They tend to require that the DG not take part in voltage and frequency control. If a disturbance takes place that causes either voltage or frequency to deviate beyond specified limits, the DG is required to isolate from the grid, and then reconnect when normal operation is restored. Thus frequency and voltage continue to be maintained just as they would without the presence of any DG.
However DG penetrations appear destined to escalate. Therefore attention is shifting towards considering the cumulative effect on the bulk power system due to significant levels of DG capacity. It can be expected that such large-scale presence will have global or system-wide impacts that are not yet fully understood. The present project is concerned primarily with the impact on system stability. Other relevant issues may include impact on resource scheduling to meet real demand, for the provision of ancillary services such as reactive power support, for spinning reserve to accommodate contingencies, and for black start capability following major outages. These however are not within the present scope.
Report – CETC 2006-089 (TR) 3 March, 2006
Stability covers the ability of the power system to supply rated voltage to loads. It includes the need for generators to maintain synchronism (angular stability) when the transmission lines are heavily loaded and stressed by transients such as system faults. Stability may be affected by large-scale presence of DG units because of their differing characteristics, as follows:
They tend to carry small power ratings, ranging from just a few 10’s of kW to perhaps 5 MW, compared to 100’s or 1000’s of MW for centralized plants. Their proportional mechanical inertia is reduced, so stability is lost more rapidly after a system disturbance.
•
•
•
•
•
They are connected on distribution systems, within several kilometers of loads while centralized plants may transmit power 100’s of kilometers to major load centres. This helps promote angular stability, but increases the number of disturbances likely to trip the unit.
They are generally classified as being non-dispatchable, delivering power sporadically or at will. In this respect, their production must be viewed statistically and cannot be relied upon to meet the system demand for aggregate real or local reactive power.
Their protections and controls differ significantly from larger plants because they are typically unstaffed. Standard IEEE 1547 calls for DG to trip within specified disturbance levels. They are not allowed to regulate terminal voltage or system frequency.
In due course, a greater proportion of DGs are likely to utilize advanced technologies such as fuel-cells, solar, wind or biomass, with a power converter interface for delivering power to the grid. The dynamic operating characteristics of such units may differ dramatically from rotating machines.
Under the authority of the Energy Efficiency Act, and to support future compliance with the Kyoto Accord, the Government of Canada wishes to encourage the deployment of renewable sources of electrical energy, most of which will be realized as DG. However it also wishes to ensure that this does not compromise the reliability of electricity supply in Canada. Furthermore it wishes to promote the development of Standards that reflect best available practices, and this in turn requires that the impact of large-scale DG penetrations be studied and understood in advance.
This report begins by identifying the project scope and objectives. This is followed by a brief introduction to the stability problem and the types of analysis that it entails for large scale power systems. Next follows a brief discussion on the types of DG resources likely to be deployed in the foreseeable future, leading to their characterization essentially as those relying on a power converter based interface or those utilizing a more conventional rotating synchronous machine. A representative benchmark system is then identified, corresponding to the network serving Eastern Ontario in Canada (region surrounding Ottawa, the nation’s capitol) and covering a narrow rectangular corridor spanning about 400 km East to West. Analysis of this benchmark is
Report – CETC 2006-089 (TR) 4 March, 2006
then carried out, taking into account steady-state voltage and angular stability considerations, including various DG control modes and system contingencies. This provides a basis for generalizing findings related to the impact of large-scale DG penetration on the stability of grid networks of the type studied here.
Report – CETC 2006-089 (TR) 5 March, 2006
2 Objectives & Scope
The objective of this project is to investigate the impact of future large-scale penetrations of DG on power system stability, considering the normal Canadian utility network architectures: highly meshed to highly radial systems. The goal is to determine the penetration limit expressed as a proportion of total generating capacity, as dictated by considerations of power system stability, assuming that DG operation is governed by existing IEEE 1547 or typical Canadian utility interconnection standards with respect to normal operation, including voltage and frequency tripping thresholds. Strategies for extending the limit to facilitate greater DG integration are considered.
Accordingly the first task in the project involved identifying a suitable candidate system for detailed simulations. It was envisaged that this network would incorporate a variety of conventional generation, including some sufficiently remote from the major load centres to make angular and voltage stability studies worthwhile. It would include meshed and radial connection points for introducing DG. The modelled DG would consider the variety of technologies, fundamentally differentiated as those requiring a power converter interface for exchanging power with the grid and those utilizing a conventional rotating machine interface. The two classes of generation are likely to exhibit different responses in the event of disturbances in the power system, due to differences in their inertias, governor response, tripping characteristics and control function.
Once the above network was chosen and a model suitable for carrying out stability studies had been assembled, it was exercised to determine the limits of DG penetration for different system loading, mix of conventional generation, equipment or line outage contingencies, sources of disturbance, DG location, DG technologies and DG controls. The challenge here is to adequately cover significant permutations of these parameters without conducting an excessive number of simulations.
Finally, the findings of all simulations are condensed into conclusions or applicable guidelines useful to DG proponents, utility planners and government policy makers.
Report – CETC 2006-089 (TR) 6 March, 2006
3 The Stability Problem
A fundamental requirement in the operation of a power system is that power flows and bus voltages be maintained within acceptable limits throughout the network despite changes in load or available transmission and generation resources. Furthermore the system needs to exhibit an ability to remain in a state of operating equilibrium under normal operating conditions and to regain an acceptable state of equilibrium after being subjected to a disturbance”/2/. The disturbance may be associated with an outage of a generator, transformer, line or loads.
Historically, stability has been associated with the need for conventional rotating machines (synchronous or induction) to remain in synchronism in order to deliver power. This aspect of stability is termed angular stability, and is governed by dynamics of generator rotor angles and the power angle relationships that result across the transmission network. However instability can also occur without loss of synchronism. This can occur when voltages reduce uncontrollably due to curtailed generation, equipment outage or an increase in load. It stems from the attempt of load dynamics to restore power consumption beyond the capability of the combined transmission and generation system/3/. The ability of the network to maintain voltage levels within permissible limits at all points on the network, both in normal operation and after being subjected to a disturbance, is termed voltage stability. It tends to be governed by the ability of the system to maintain a balance between the demand and supply of reactive power in the network.
Angular and voltage stability are relevant to steady state conditions, to conditions involving dynamic (small signal) perturbations occurring continuously on the system due to incremental load changes, and for major disturbances such as faults or the loss of significant generation, lines or loads. The phenomena of interest cover dynamics in the range of about 1-10 Hz in frequency, appreciably lower than the fundamental power frequency (60 Hz in North America).
Analysis of system stability begins with a load flow study, performed using a steady-state power frequency model assuming balanced three-phase operation of all transmission lines, loads and generating resources. The model takes the form of an impedance or admittance matrix, and is solved iteratively to yield desired power flows. Voltage regulating apparatus (e.g. transformer taps, reactive sources) may be adjusted automatically to bring voltage levels within permissible limits throughout the network.
Load flow analysis does not include dynamics involving the generator due to incremental changes in voltage, frequency or load. This is addressed by analysis of dynamic stability, and requires introducing models reflecting the response of the prime mover, the excitation system controls, and rotor dynamics. Dynamic stability is checked by linearizing the power flow equations about a specified operating point and analyzing whether small swings in phase angle or voltage will grow over time. This usually occurs only when generators are distant from system loads, so the need for these studies should ease as DG penetration increases.
Report – CETC 2006-089 (TR) 7 March, 2006
Finally analysis is performed to ensure that the system can remain stable following major system disturbances such as faults and equipment outages. The term “Transient Stability” is reserved for this class of analysis. It covers simulating the system response some time into the future, so that dynamic interactions involving control systems, generator dynamics and regulating apparatus can be evaluated. Consideration must be given to all conceivable disturbance events and operating contingencies deemed to be reasonable. Note that a successful transient stability study can prove steady state and dynamic stability, making it a sufficient (but expensive) test.
All of the above studies require consideration of alternative contingencies that may weaken the transmission capability of the system. The focus in the present project is on steady-state and transient stability aspects of power system operation, assuming future load growth to be met largely by large-scale DG which may behave differently than conventional utility-type generation.
Report – CETC 2006-089 (TR) 8 March, 2006
4 Candidate Study System
A previous study/4/ that had considered the impact of large DG capacities on the bulk power system had performed illustrative simulations on the power grid in North America under the jurisdiction of the Western Energy Coordinating Council (WECC). This serves a territory covering the western half of the United States, the Provinces of Alberta and British Columbia in Canada, and a portion of northern Baja in Mexico. The studied model consisted of over 12,000 buses and about 2,290 generators.
Another study was found/5/ that focused specifically on transient stability issues, and identified benchmark systems for analysis, but it is not clear that these necessarily resemble a typical Canadian network.
In order to complement the earlier study focussing specifically on DG issues/4/, but using a rather massive interconnected grid, it was decided that the present effort would focus on a smaller network associated with the fringes of a large interconnected grid. It was reasoned that large DG capacities may impact such remote portions of the grid in a more pronounced, and perhaps different manner.
4.1 Transmission Grid
The candidate study system was envisaged to include essentially an infinite bus, representing a central bulk power grid, branching out into a meshed network supplying a mix of load buses electrically close to as well as remote from this anchor. The network should include a variety of existing generation, including hydraulic and thermal units. There should be sufficient HV circuits and meshing to provide realistic responses for various loading conditions; contingencies such as loss of generation, load, or lines; and disturbances due to faults possibly with delayed clearing. The simulations can be expected to yield a conservative lower limit for DG penetration if the system includes a large load centre connected to the infinite bus through relatively few lines, with intermediate buses containing conventional generation. This would allow interaction between the dynamics of these remote generators with DG units located at the major load centre to accommodate load growth. At the same time, the DG units will provide little local voltage support at the load centre if the controls are configured according to existing standards.
As it happens, the power system supplying the Ottawa area in the Province of Ontario has many of these features, as depicted in a simplified representation of the network belonging to Hydro One (Figure 1). Regional load in the Ottawa area is supplied out of the Hawthorne TS 230-kV bus. Much of the supply arrives on only two 500-kV circuits from Lennox GS near Kingston. This station is then more heavily connected back to Cherrywood (and Pickering), which may be considered an infinite bus since it is electrically close to two major nuclear stations comprising 8 active units and representing about 6000 MW of aggregate capacity. Circuits at 230-kV connect
Report – CETC 2006-089 (TR) 9 March, 2006
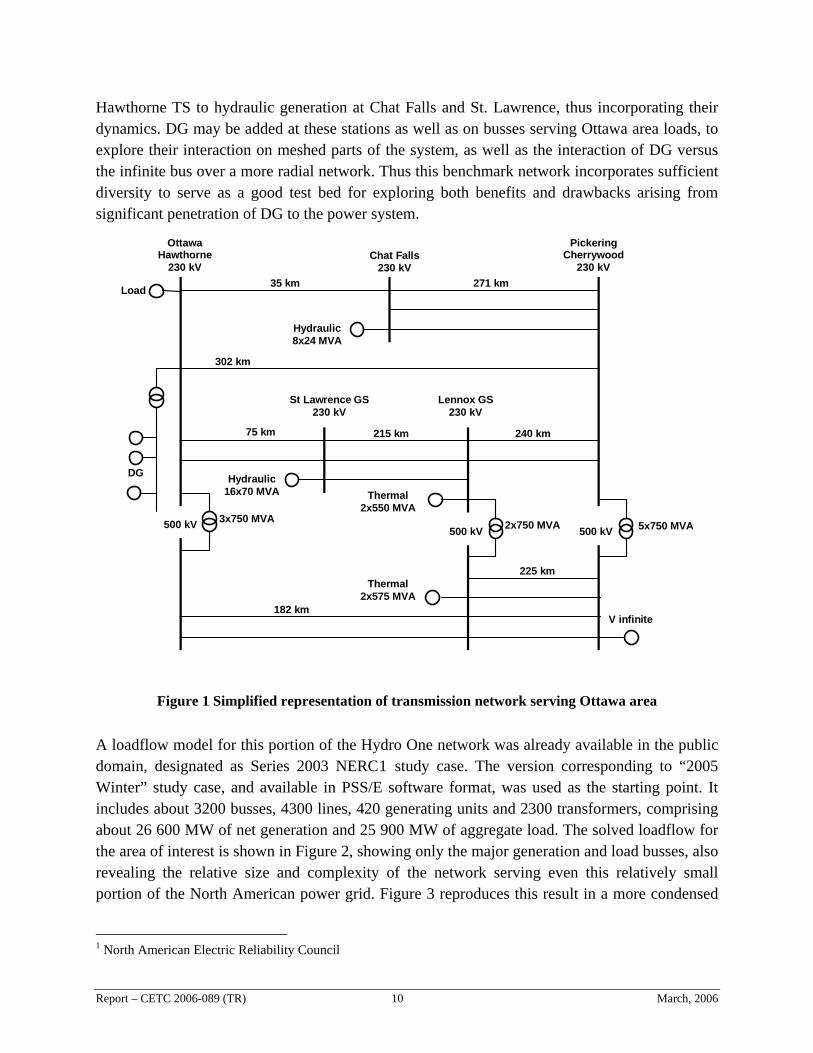
Hawthorne TS to hydraulic generation at Chat Falls and St. Lawrence, thus incorporating their dynamics. DG may be added at these stations as well as on busses serving Ottawa area loads, to explore their interaction on meshed parts of the system, as well as the interaction of DG versus the infinite bus over a more radial network. Thus this benchmark network incorporates sufficient diversity to serve as a good test bed for exploring both benefits and drawbacks arising from significant penetration of DG to the power system.
OttawaHawthorne
230 kVChat Falls
230 kV
PickeringCherrywood
230 kV
St Lawrence GS230 kV
Lennox GS230 kV
500 kV 500 kV500 kV
Hydraulic8x24 MVA
Hydraulic16x70 MVA Thermal
2x550 MVA
Thermal2x575 MVA
V infinite182 km
225 km
240 km215 km75 km
302 km
35 km 271 km
3x750 MVA 2x750 MVA
DG
Load
5x750 MVA
Figure 1 Simplified representation of transmission network serving Ottawa area
A loadflow model for this portion of the Hydro One network was already available in the public domain, designated as Series 2003 NERC1 study case. The version corresponding to “2005 Winter” study case, and available in PSS/E software format, was used as the starting point. It includes about 3200 busses, 4300 lines, 420 generating units and 2300 transformers, comprising about 26 600 MW of net generation and 25 900 MW of aggregate load. The solved loadflow for the area of interest is shown in Figure 2, showing only the major generation and load busses, also revealing the relative size and complexity of the network serving even this relatively small portion of the North American power grid. Figure 3 reproduces this result in a more condensed
1 North American Electric Reliability Council
Report – CETC 2006-089 (TR) 10 March, 2006
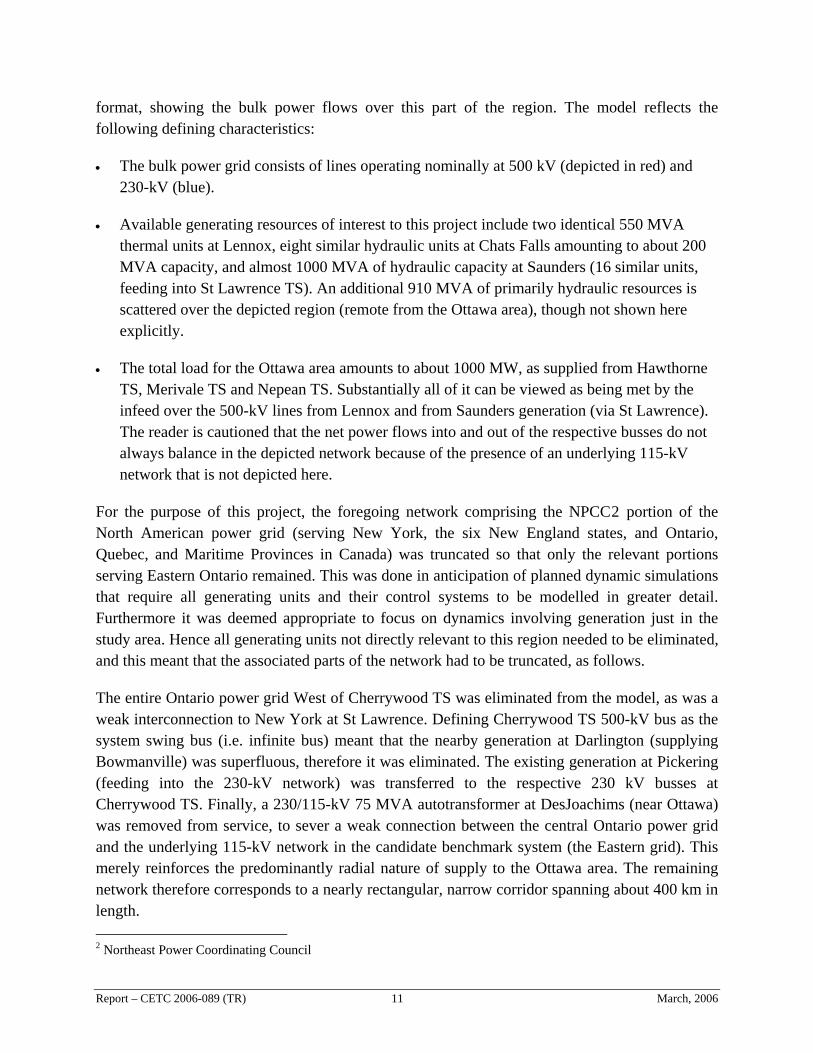
format, showing the bulk power flows over this part of the region. The model reflects the following defining characteristics:
•
•
•
The bulk power grid consists of lines operating nominally at 500 kV (depicted in red) and 230-kV (blue).
Available generating resources of interest to this project include two identical 550 MVA thermal units at Lennox, eight similar hydraulic units at Chats Falls amounting to about 200 MVA capacity, and almost 1000 MVA of hydraulic capacity at Saunders (16 similar units, feeding into St Lawrence TS). An additional 910 MVA of primarily hydraulic resources is scattered over the depicted region (remote from the Ottawa area), though not shown here explicitly.
The total load for the Ottawa area amounts to about 1000 MW, as supplied from Hawthorne TS, Merivale TS and Nepean TS. Substantially all of it can be viewed as being met by the infeed over the 500-kV lines from Lennox and from Saunders generation (via St Lawrence). The reader is cautioned that the net power flows into and out of the respective busses do not always balance in the depicted network because of the presence of an underlying 115-kV network that is not depicted here.
For the purpose of this project, the foregoing network comprising the NPCC2 portion of the North American power grid (serving New York, the six New England states, and Ontario, Quebec, and Maritime Provinces in Canada) was truncated so that only the relevant portions serving Eastern Ontario remained. This was done in anticipation of planned dynamic simulations that require all generating units and their control systems to be modelled in greater detail. Furthermore it was deemed appropriate to focus on dynamics involving generation just in the study area. Hence all generating units not directly relevant to this region needed to be eliminated, and this meant that the associated parts of the network had to be truncated, as follows.
The entire Ontario power grid West of Cherrywood TS was eliminated from the model, as was a weak interconnection to New York at St Lawrence. Defining Cherrywood TS 500-kV bus as the system swing bus (i.e. infinite bus) meant that the nearby generation at Darlington (supplying Bowmanville) was superfluous, therefore it was eliminated. The existing generation at Pickering (feeding into the 230-kV network) was transferred to the respective 230 kV busses at Cherrywood TS. Finally, a 230/115-kV 75 MVA autotransformer at DesJoachims (near Ottawa) was removed from service, to sever a weak connection between the central Ontario power grid and the underlying 115-kV network in the candidate benchmark system (the Eastern grid). This merely reinforces the predominantly radial nature of supply to the Ottawa area. The remaining network therefore corresponds to a nearly rectangular, narrow corridor spanning about 400 km in length.
2 Northeast Power Coordinating Council
Report – CETC 2006-089 (TR) 11 March, 2006
Report – CETC 2006-089 (TR) 12 March, 2006
The resulting truncated model includes about 570 busses, 725 lines, 65 generating units and 360 transformers. Total generation is about 4 000 MW, serving about 3 900 MW of aggregate load. Its solved loadflow is illustrated in Figure 4 for comparison with Figure 3. Power flows in the Ottawa area are seen to be in substantial agreement, confirming that the reduced model remains relevant.
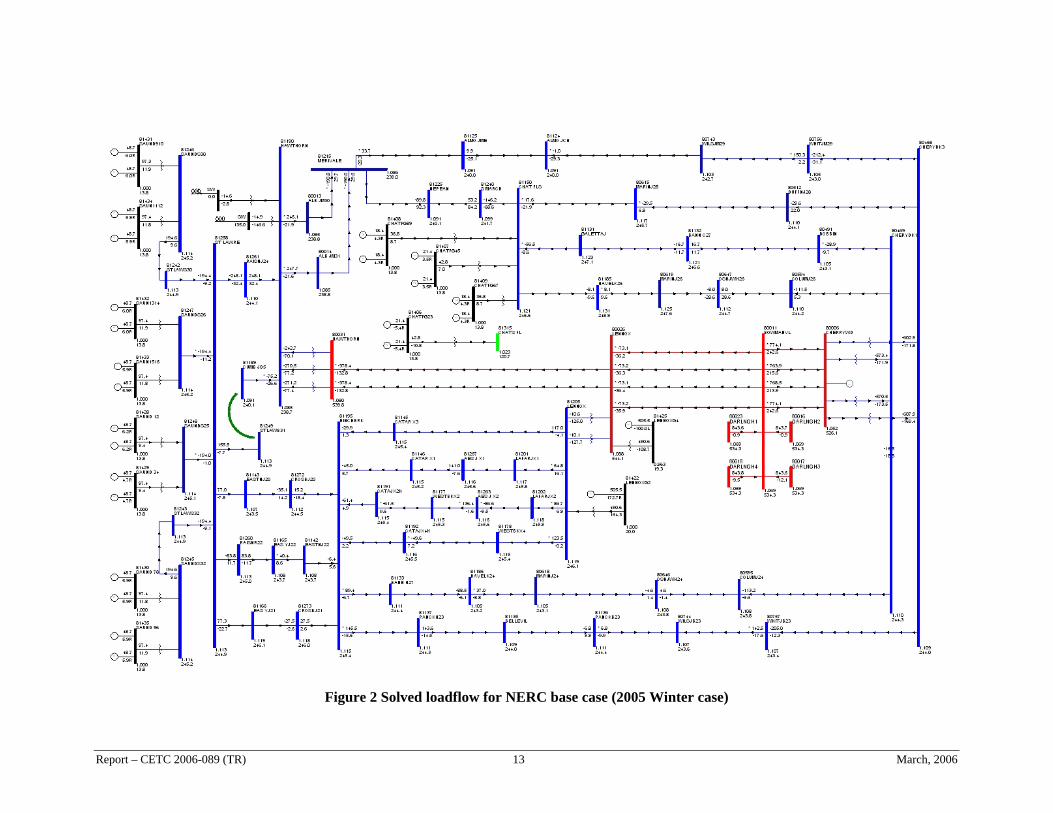
Figure 2 Solved loadflow for NERC base case (2005 Winter case)
Report – CETC 2006-089 (TR) 13 March, 2006
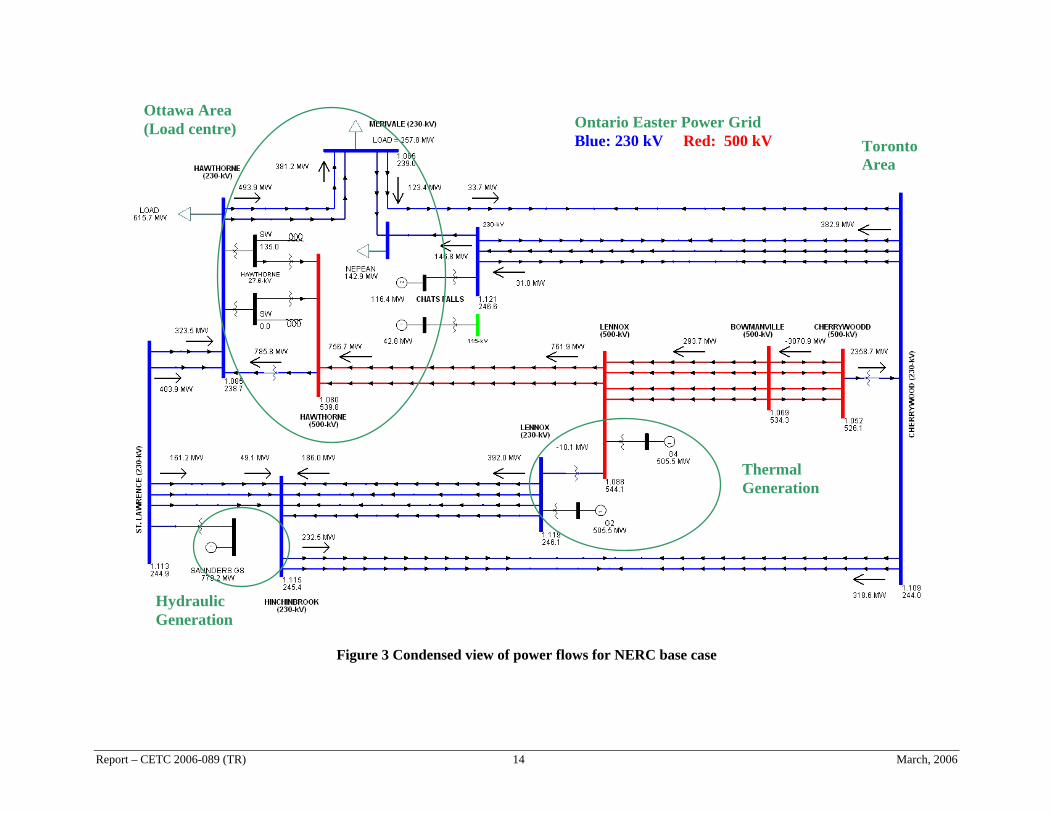
Hydraulic Generation
Ottawa Area (Load centre) Ontario Easter Power Grid
Blue: 230 kV Red: 500 kV
Thermal Generation
Toronto Area
Figure 3 Condensed view of power flows for NERC base case
Report – CETC 2006-089 (TR) 14 March, 2006
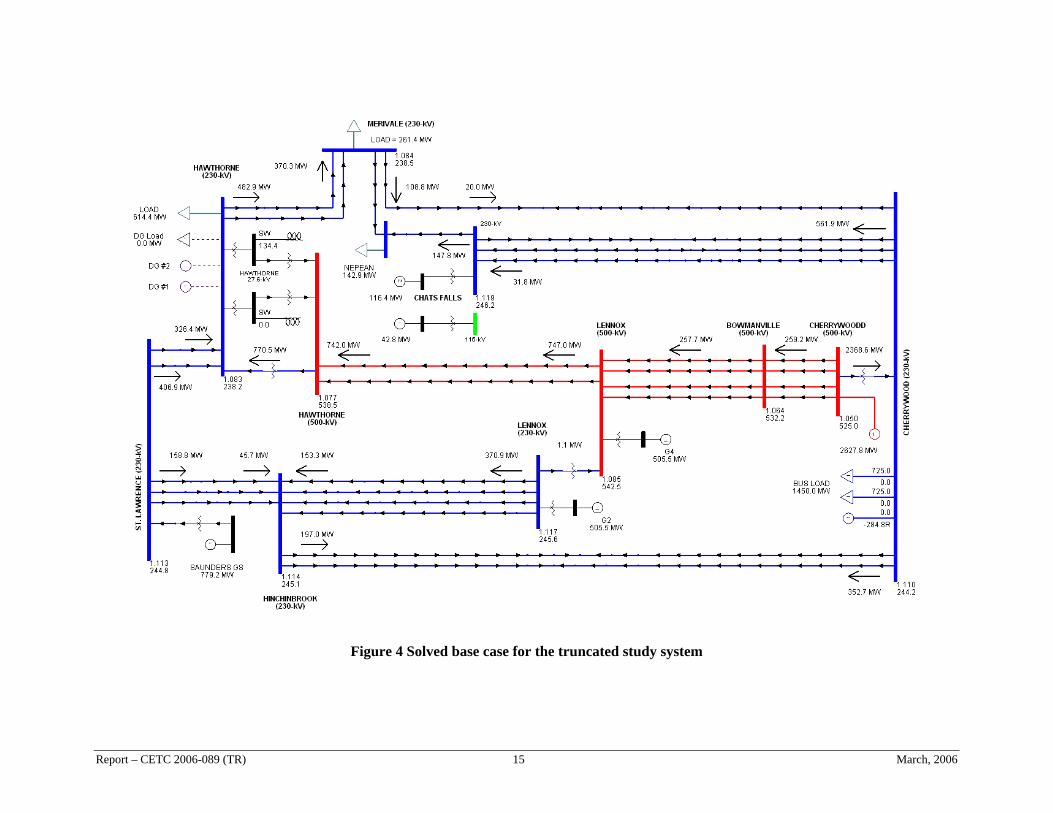
CETC 2006-089 (TR) 15 March, 2006
Figure 4 Solved base case for the truncated study system
Report –
4.2 Generation Resources & Characteristics
Conventional power system resources consist of large synchronous generators, typically carrying ratings ranging from 100 to 1000 MVA, and connected directly to the transmission network. Direct manipulation of the synchronous generator inputs (mechanical torque, field current applied to rotor winding) is used as the primary method of controlling power system frequency and voltage. Speed droop is incorporated in governor controls to automatically share demand changes equitably among all interconnected units without the need for explicit communication, and reactive power droop is used on field excitation systems to regulate voltages.
Distributed generators on the other are generally connected to non-dedicated feeders, located at or near other loads on the distribution system. Their ratings range from a few kilowatts up to a limit of about 10 MW. They may be connected directly at customer premises, downstream of the service entrance, or they may be interconnected to some point on the distribution system via a dedicated tap and transformer unit that is not part of a customer load. Larger units may be connected through dedicated feeders or directly at the distribution substation. These locations are in contrast to conventional utility generation that is generally located far from the loads, interconnected to the bulk transmission networks, and usually configured as plants sizes greater than 50 MW. While this difference may create unique requirements for interfacing to the grid, these details are not relevant to the present study as they have been covered elsewhere/R1-R20/. Of greater relevance here is that DG resources encompass a wide variety of technologies and primary energy sources, and as such, their operating characteristics can differ from conventional generation. A brief summary of the more common DG technologies follows:
1. Reciprocating Engines: Many commercial and institutional facilities include standby generators rated from about 0.1 to 1.0 MW, which could be reconfigured to provide power system peaking capability. Typically these are powered by diesel reciprocating engines, and as such their development may be inhibited by local noise ordinances and by provincial air quality regulations. The generators may be induction or synchronous types. Governors and voltage regulators are provided for terminal voltage and speed control. The inertia of the engine and generator tend to be similar to larger units in per unit of rating. Induction generators do not require governor or voltage controls, relying on the grid to manage both.
2. Conventional Combustion Turbines (CT): CT gensets are a very mature technology, ranging in size from 1 to 25 MW, and are mostly adapted from aircraft engine design. They are fuelled by natural gas, oil or dual fuel systems, and the turbine serves as the prime mover for a conventional synchronous generator. CT units are commonly used for baseload support in cogeneration facilities, where the waste heat from the generation stage can be utilized beneficially for material processing or space heating applications. Alternatively, their quick start capability makes them a good choice for backup emergency power and peak shaving
Report – CETC 2006-089 (TR) 16 March 2006
applications. Generator parameters for larger units would be similar to machines applied to steam turbines. Smaller units will have higher per unit resistances in field and damping circuits, reducing the time constants for transients, but otherwise exhibiting similar rotational dynamics. The governor characteristics may also be similar to a steam turbine.
3. Microturbines: These are extremely small physically compared to their conventional counterparts, while typically sized from 10 to 250 kW in rating. They are designed to operate optimally at very high rotational speeds, up to 100 000 rpm. With the generator rotor on the same shaft as the turbine, its output frequency is on the order of a few kilohertz. This output is rectified and inverted to 60 Hz using a static power converter. Modern inverter control will normally be current-controlled with real and reactive power outer loops. For loadflow analysis, this translates to a constant real and reactive power (P, Q) model. In order to promote dynamic stability, these loops could include integral, proportional or differential feedback controls, though this is not yet common practice. In this event, it may be necessary to include a dynamic representation including some artificial inertia, current and voltage limits for stability studies.
4. Photovoltaics (PV): PV arrays produce direct current from solar energy. Modules are available with output ranging from less than 5 W to over 300 W. Hundreds of these are used to make a PV array for utility scale applications. However for typical residential scale applications, a PV system may consist of just a handful or more modules in the form of a small rooftop installations yielding in the order of 10 kW. In urban areas, at best the ratings could reach a few hundreds of kilowatts for installations on larger commercial buildings. Since PV output is produced as direct current, a static power converter is required to deliver its output to utility supply systems. Stability impacts on the power system are similar to those mentioned above for inverters.
5. Fuel-cell: A fuel-cell is like a battery in that an electrochemical reaction is used to create electric current. There are various fuel cell technologies under rapid development, all utilizing hydrogen and oxygen as the primary reactants which in turn can be derived from a variety of fuels depending on the type of fuel process and reformer used. Regardless of the type of fuel cell utilized, electricity is delivered at the output as direct current. A static power converter is used to interface the unit to the distribution system. Again impacts are similar to those mentioned above for inverters. Little information is available regarding the time dynamics of governor control. Feedback loops schedule appropriate flows of hydrogen and oxygen, with lags resulting from gas-filled volumes, however the dynamics here are too slow to matter for most stability studies.
6. Wind: Wind turbines capture energy from the wind and drive a conventional rotating generator as the prime mover. Individual units can range in size from a few kilowatts to ratings approaching 5 MW. Individual units may be grouped together into wind farms
Report – CETC 2006-089 (TR) 17 March 2006
ranging in capacities to tens of megawatt and connected to utility distribution systems. The larger wind farms tend to be more like bulk generation, often connected to subtransmission networks. It is the smaller scale farms or individual units that can be classified as DG. Wind turbines use squirrel cage generators (constant speed direct-connected induction) or variable speed generators with power electronic converters (doubly fed induction, or inverter interfaced synchronous). Induction machines have been popular historically since they tend to be more rugged in operation and economical in capital cost. However since they draw reactive power for operation, and this need increases with machine output and rating, they can exacerbate voltage regulation problems. Variable speed wind turbines based on either synchronous or wound-rotor (doubly fed induction) machines are a superior alternative, and gaining favour for utility applications. Permanent magnet synchronous machines produce variable frequency output, which must be interfaced to the utility through a power converter interface. Doubly fed induction machines are operated at variable slip by controlling the frequency of the excitation applied to the rotor winding using a power converter interface. The stator output is therefore maintained at power frequency. Force-commutation on the interface allows the units to either supply or absorb reactive power from the utility system.
7. Mini Hydro: Most applications utilize induction motors run as generators. Therefore the parameters are the same as for motors of the same size, and the machines exhibit rotor and electrical dynamics traditionally associated with motor loads.
From the standpoint of system dynamics, this range of DG technologies can be condensed into two categories/4, 6, 7/: those utilizing a rotating machine interfaced directly to the grid, and those requiring an inverter interface for transferring power to the grid. The two classes of generation are distinguished by certain unique performance features and operating parameters that impact power system performance. Fundamentally however, all DG units are required to implement protections and controls that comply with existing applicable Canadian utility connection standards for operation, including voltage and frequency tripping limits, which essentially reflect the requirements defined in IEEE Std 1547. These generally require that in normal operation, the DG “shall not actively regulate the voltage” at its terminals, which implies that the DG must operate at a constant power factor. This restriction, however, is destined to be moderated since a consensus already exists that DG must in due course be allowed to participate fully in exercising grid control in order to achieve maximal societal benefits.
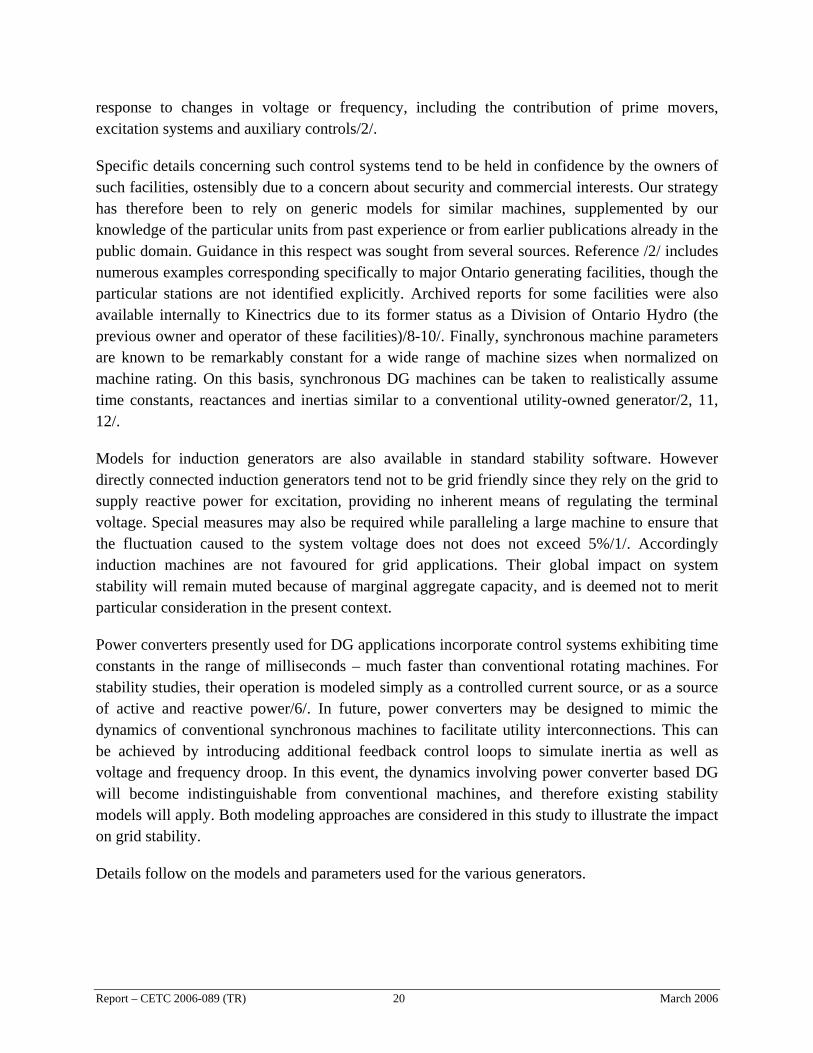
In the event of a disturbance resulting in voltage or frequency excursions beyond certain thresholds, the units must isolate within specified durations (Figure 5 and Figure 6). A further clause in the Standards requires the DG to “cease to energize” the circuit to which it is connected in the event of a fault. As a consequence of these requirements, DG owners have tended to choose overly-aggressively trip settings, whether to guarantee compliance or to shield the unit from undue stresses during system disturbances.
Report – CETC 2006-089 (TR) 18 March 2006
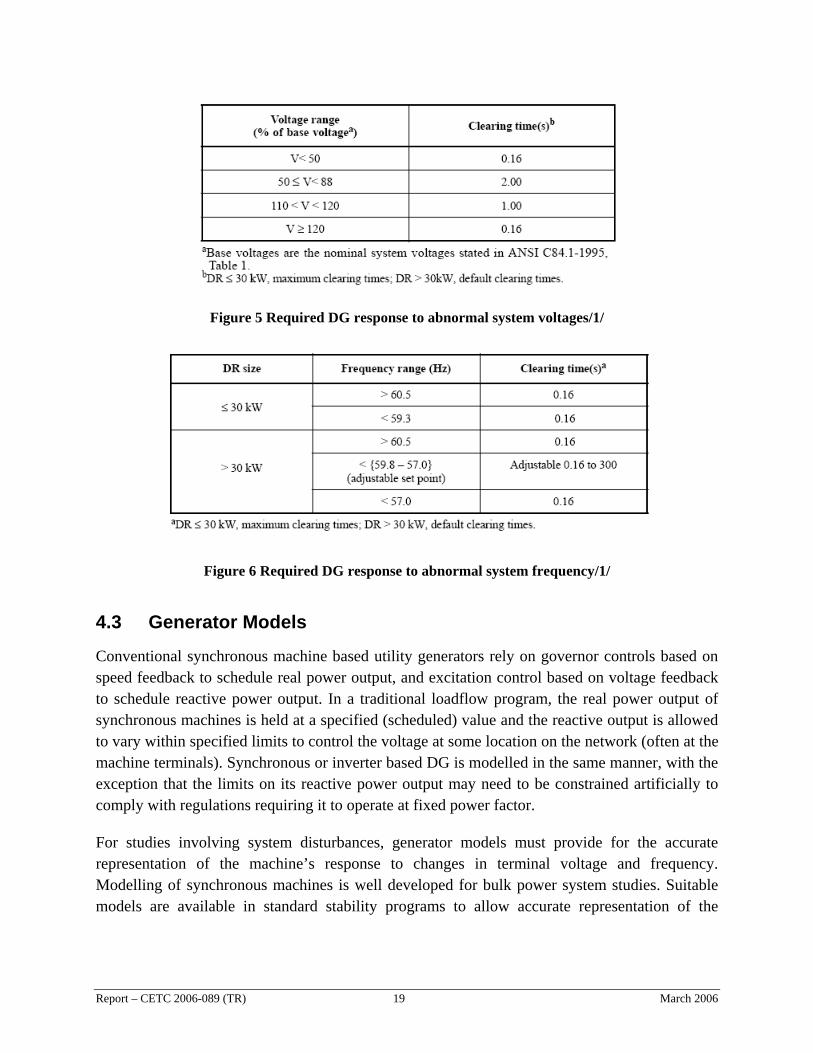
Figure 5 Required DG response to abnormal system voltages/1/
Figure 6 Required DG response to abnormal system frequency/1/
4.3 Generator Models
Conventional synchronous machine based utility generators rely on governor controls based on speed feedback to schedule real power output, and excitation control based on voltage feedback to schedule reactive power output. In a traditional loadflow program, the real power output of synchronous machines is held at a specified (scheduled) value and the reactive output is allowed to vary within specified limits to control the voltage at some location on the network (often at the machine terminals). Synchronous or inverter based DG is modelled in the same manner, with the exception that the limits on its reactive power output may need to be constrained artificially to comply with regulations requiring it to operate at fixed power factor.
For studies involving system disturbances, generator models must provide for the accurate representation of the machine’s response to changes in terminal voltage and frequency. Modelling of synchronous machines is well developed for bulk power system studies. Suitable models are available in standard stability programs to allow accurate representation of the
Report – CETC 2006-089 (TR) 19 March 2006
response to changes in voltage or frequency, including the contribution of prime movers, excitation systems and auxiliary controls/2/.
Specific details concerning such control systems tend to be held in confidence by the owners of such facilities, ostensibly due to a concern about security and commercial interests. Our strategy has therefore been to rely on generic models for similar machines, supplemented by our knowledge of the particular units from past experience or from earlier publications already in the public domain. Guidance in this respect was sought from several sources. Reference /2/ includes numerous examples corresponding specifically to major Ontario generating facilities, though the particular stations are not identified explicitly. Archived reports for some facilities were also available internally to Kinectrics due to its former status as a Division of Ontario Hydro (the previous owner and operator of these facilities)/8-10/. Finally, synchronous machine parameters are known to be remarkably constant for a wide range of machine sizes when normalized on machine rating. On this basis, synchronous DG machines can be taken to realistically assume time constants, reactances and inertias similar to a conventional utility-owned generator/2, 11, 12/.
Models for induction generators are also available in standard stability software. However directly connected induction generators tend not to be grid friendly since they rely on the grid to supply reactive power for excitation, providing no inherent means of regulating the terminal voltage. Special measures may also be required while paralleling a large machine to ensure that the fluctuation caused to the system voltage does not does not exceed 5%/1/. Accordingly induction machines are not favoured for grid applications. Their global impact on system stability will remain muted because of marginal aggregate capacity, and is deemed not to merit particular consideration in the present context.
Power converters presently used for DG applications incorporate control systems exhibiting time constants in the range of milliseconds – much faster than conventional rotating machines. For stability studies, their operation is modeled simply as a controlled current source, or as a source of active and reactive power/6/. In future, power converters may be designed to mimic the dynamics of conventional synchronous machines to facilitate utility interconnections. This can be achieved by introducing additional feedback control loops to simulate inertia as well as voltage and frequency droop. In this event, the dynamics involving power converter based DG will become indistinguishable from conventional machines, and therefore existing stability models will apply. Both modeling approaches are considered in this study to illustrate the impact on grid stability.
Details follow on the models and parameters used for the various generators.
Report – CETC 2006-089 (TR) 20 March 2006
4.3.1 Cherrywood
The infinite bus at Cherrywood need not exhibit any rotor dynamics. Accordingly a classical, constant flux-linkage model is appropriate, as provided by ‘GENCLS’ in PSS/E. The inertia constant (H) is specified as being arbitrarily large, about 3000, to approximate a stiff bus. This also means that system frequency perturbations will be negligible for all reasonable contingencies – a realistic assumption given the capacity of the modeled system relative to much larger grid to which it is paralleled. No exciter or governor model is required since the classical model comprises a constant voltage source behind a fixed reactance.
4.3.2 Lennox
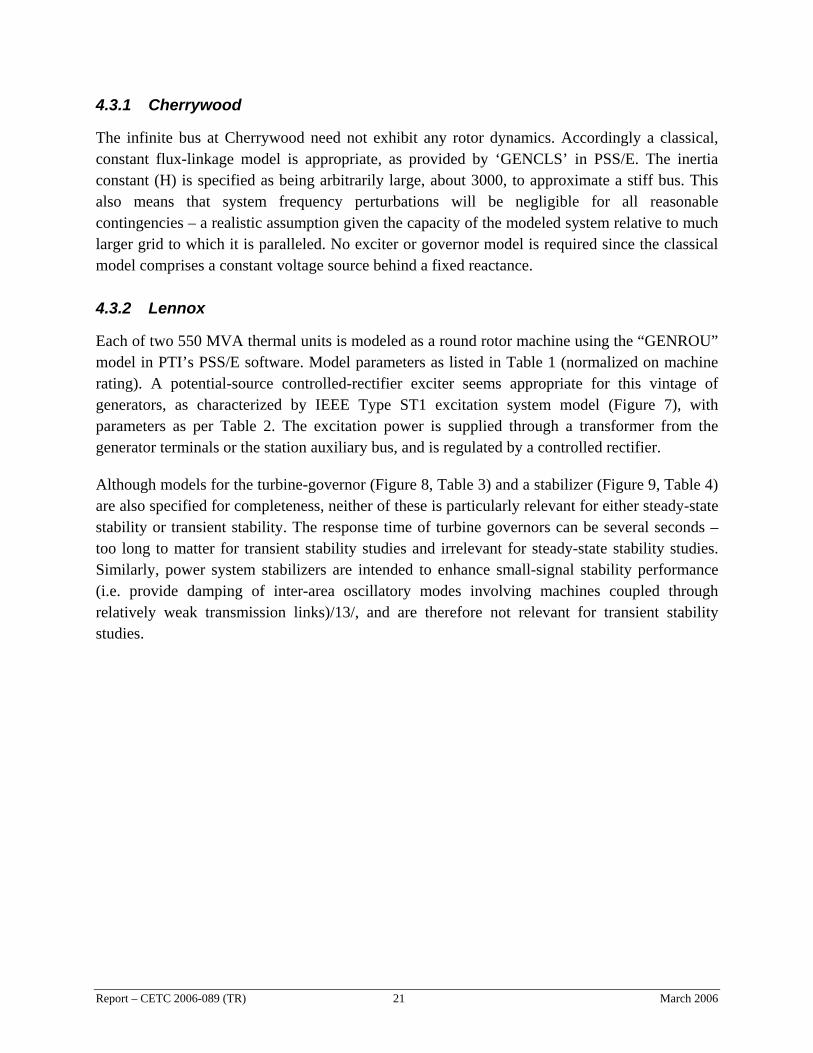
Each of two 550 MVA thermal units is modeled as a round rotor machine using the “GENROU” model in PTI’s PSS/E software. Model parameters as listed in Table 1 (normalized on machine rating). A potential-source controlled-rectifier exciter seems appropriate for this vintage of generators, as characterized by IEEE Type ST1 excitation system model (Figure 7), with parameters as per Table 2. The excitation power is supplied through a transformer from the generator terminals or the station auxiliary bus, and is regulated by a controlled rectifier.
Although models for the turbine-governor (Figure 8, Table 3) and a stabilizer (Figure 9, Table 4) are also specified for completeness, neither of these is particularly relevant for either steady-state stability or transient stability. The response time of turbine governors can be several seconds – too long to matter for transient stability studies and irrelevant for steady-state stability studies. Similarly, power system stabilizers are intended to enhance small-signal stability performance (i.e. provide damping of inter-area oscillatory modes involving machines coupled through relatively weak transmission links)/13/, and are therefore not relevant for transient stability studies.
Report – CETC 2006-089 (TR) 21 March 2006
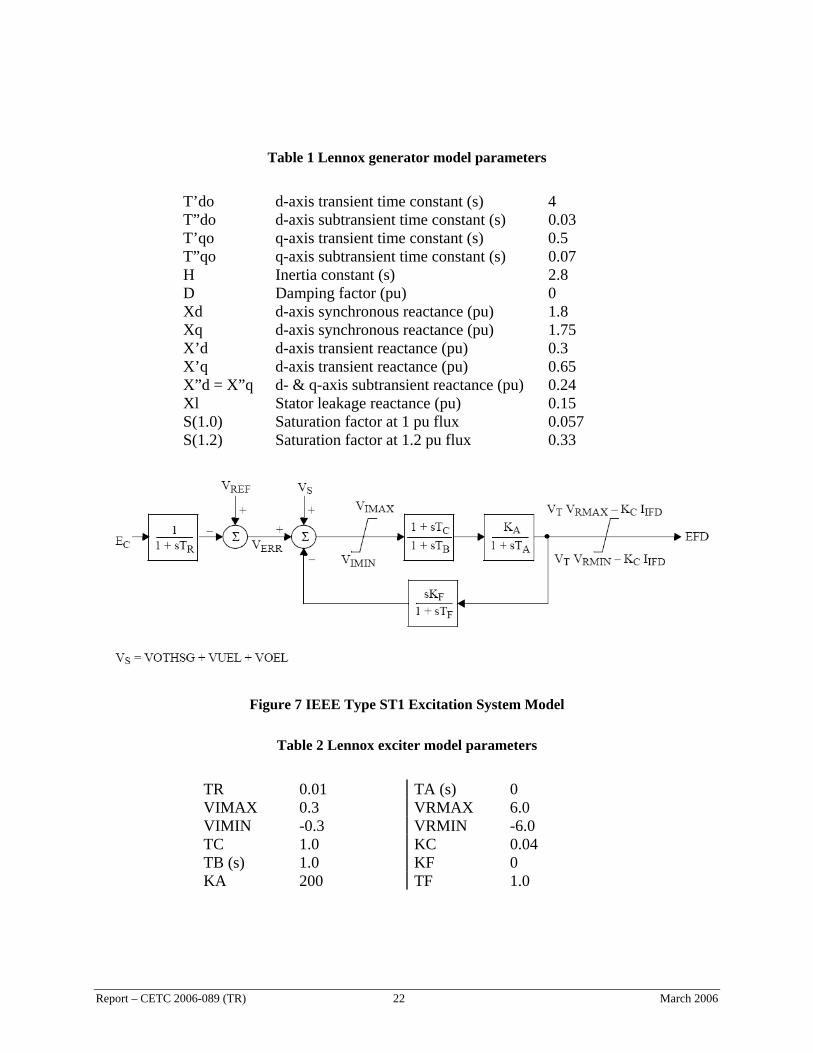
Table 1 Lennox generator model parameters
T’do d-axis transient time constant (s) 4 T”do d-axis subtransient time constant (s) 0.03 T’qo q-axis transient time constant (s) 0.5 T”qo q-axis subtransient time constant (s) 0.07 H Inertia constant (s) 2.8 D Damping factor (pu) 0 Xd d-axis synchronous reactance (pu) 1.8 Xq d-axis synchronous reactance (pu) 1.75 X’d d-axis transient reactance (pu) 0.3 X’q d-axis transient reactance (pu) 0.65 X”d = X”q d- & q-axis subtransient reactance (pu) 0.24 Xl Stator leakage reactance (pu) 0.15 S(1.0) Saturation factor at 1 pu flux 0.057 S(1.2) Saturation factor at 1.2 pu flux 0.33
Figure 7 IEEE Type ST1 Excitation System Model
Table 2 Lennox exciter model parameters
TR 0.01 TA (s) 0 VIMAX 0.3 VRMAX 6.0 VIMIN -0.3 VRMIN -6.0 TC 1.0 KC 0.04 TB (s) 1.0 KF 0 KA 200 TF 1.0
Report – CETC 2006-089 (TR) 22 March 2006
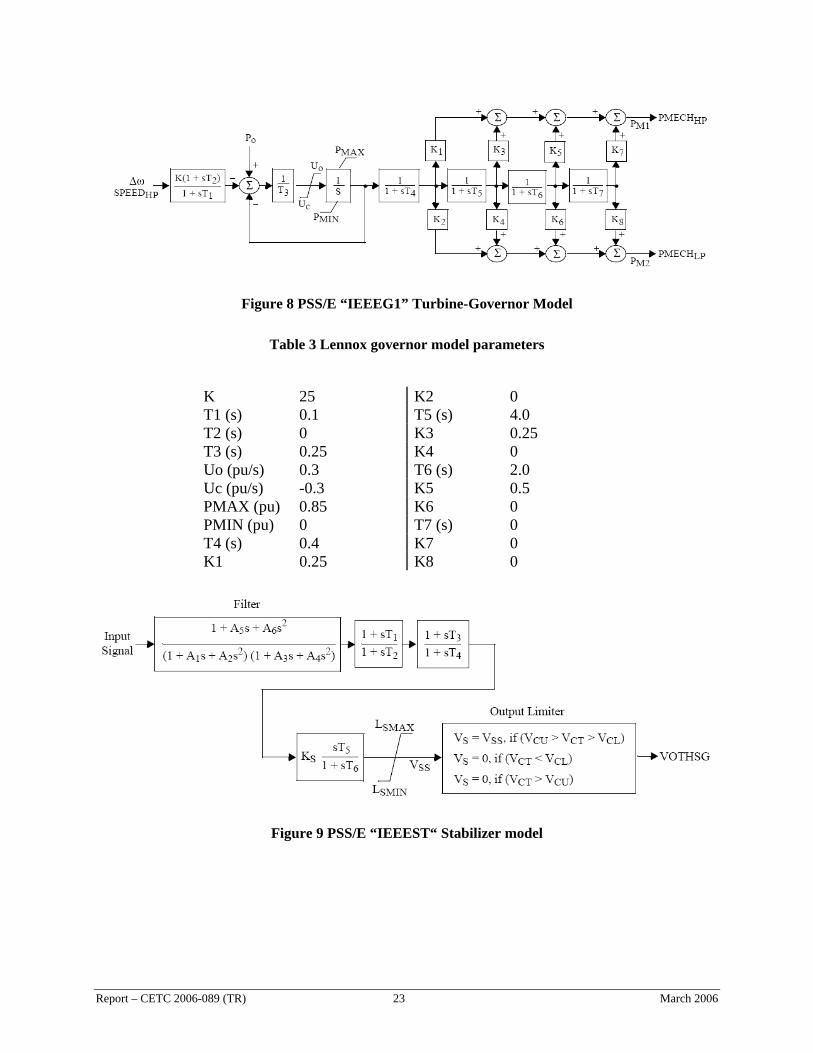
Figure 8 PSS/E “IEEEG1” Turbine-Governor Model
Table 3 Lennox governor model parameters
K 25 K2 0 T1 (s) 0.1 T5 (s) 4.0 T2 (s) 0 K3 0.25 T3 (s) 0.25 K4 0 Uo (pu/s) 0.3 T6 (s) 2.0 Uc (pu/s) -0.3 K5 0.5 PMAX (pu) 0.85 K6 0 PMIN (pu) 0 T7 (s) 0 T4 (s) 0.4 K7 0 K1 0.25 K8 0
Figure 9 PSS/E “IEEEST“ Stabilizer model
Report – CETC 2006-089 (TR) 23 March 2006
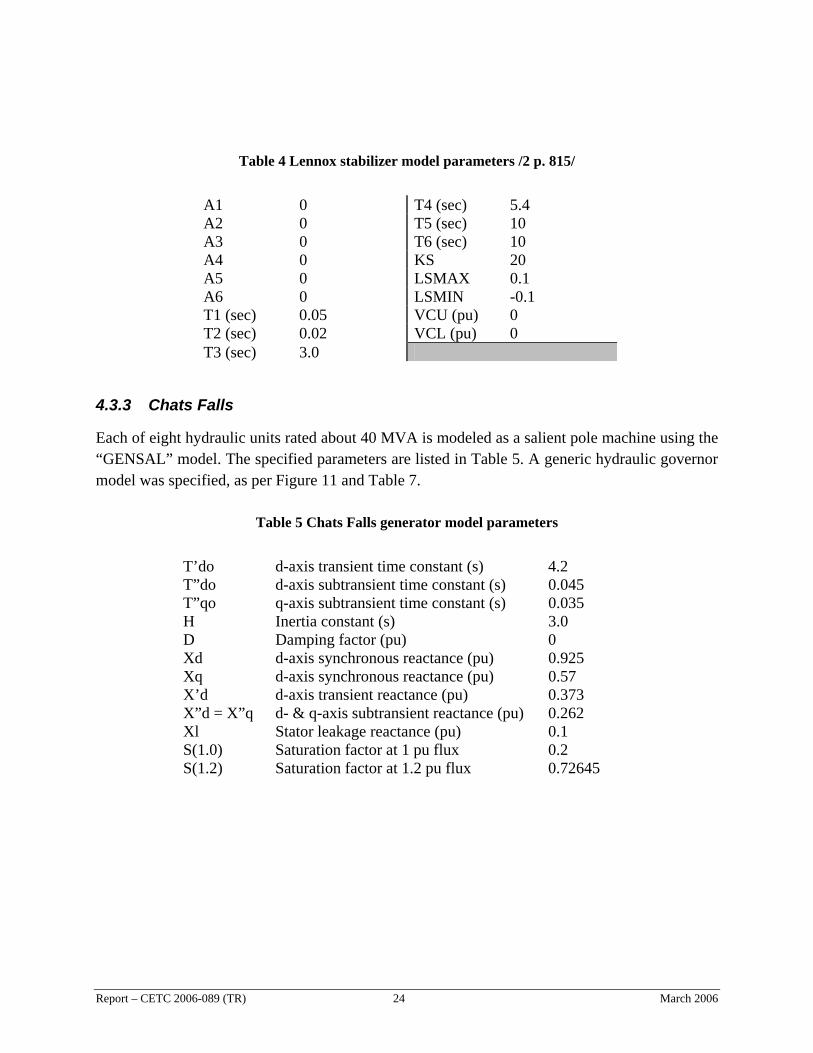
Table 4 Lennox stabilizer model parameters /2 p. 815/
A1 0 T4 (sec) 5.4 A2 0 T5 (sec) 10 A3 0 T6 (sec) 10 A4 0 KS 20 A5 0 LSMAX 0.1 A6 0 LSMIN -0.1 T1 (sec) 0.05 VCU (pu) 0 T2 (sec) 0.02 VCL (pu) 0 T3 (sec) 3.0
4.3.3 Chats Falls
Each of eight hydraulic units rated about 40 MVA is modeled as a salient pole machine using the “GENSAL” model. The specified parameters are listed in Table 5. A generic hydraulic governor model was specified, as per Figure 11 and Table 7.
Table 5 Chats Falls generator model parameters
T’do d-axis transient time constant (s) 4.2 T”do d-axis subtransient time constant (s) 0.045 T”qo q-axis subtransient time constant (s) 0.035 H Inertia constant (s) 3.0 D Damping factor (pu) 0 Xd d-axis synchronous reactance (pu) 0.925 Xq d-axis synchronous reactance (pu) 0.57 X’d d-axis transient reactance (pu) 0.373 X”d = X”q d- & q-axis subtransient reactance (pu) 0.262 Xl Stator leakage reactance (pu) 0.1 S(1.0) Saturation factor at 1 pu flux 0.2 S(1.2) Saturation factor at 1.2 pu flux 0.72645
Report – CETC 2006-089 (TR) 24 March 2006
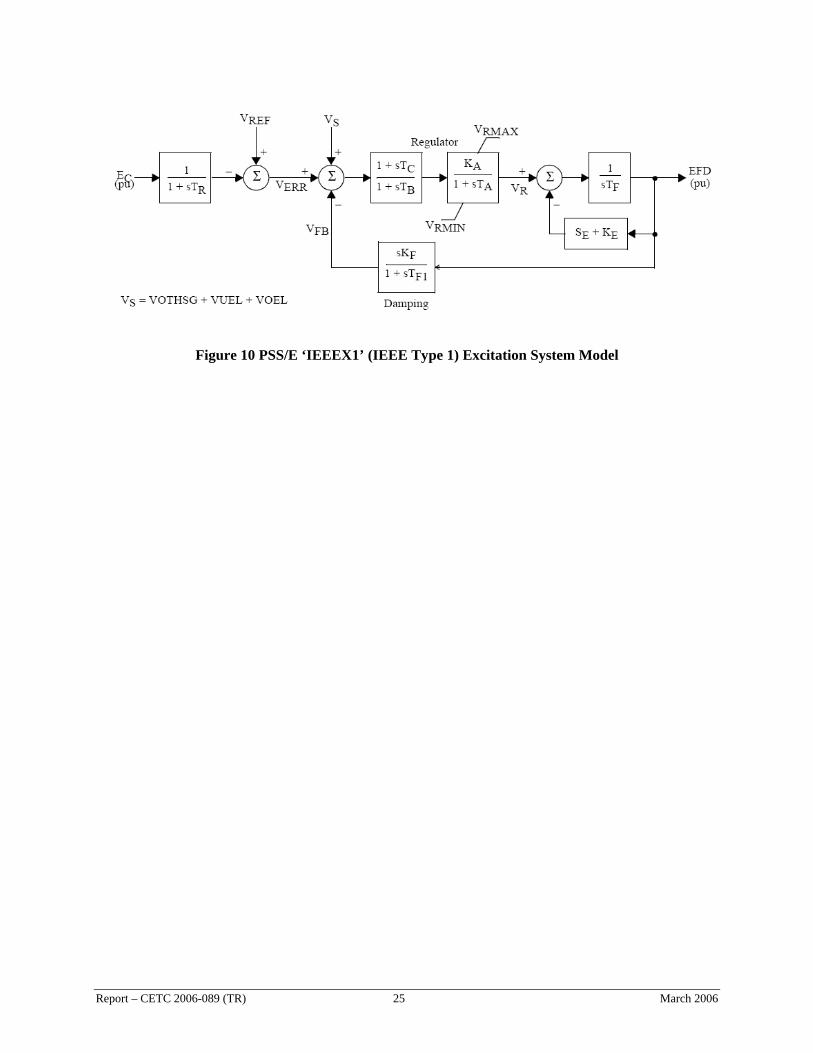
Figure 10 PSS/E ‘IEEEX1’ (IEEE Type 1) Excitation System Model
Report – CETC 2006-089 (TR) 25 March 2006
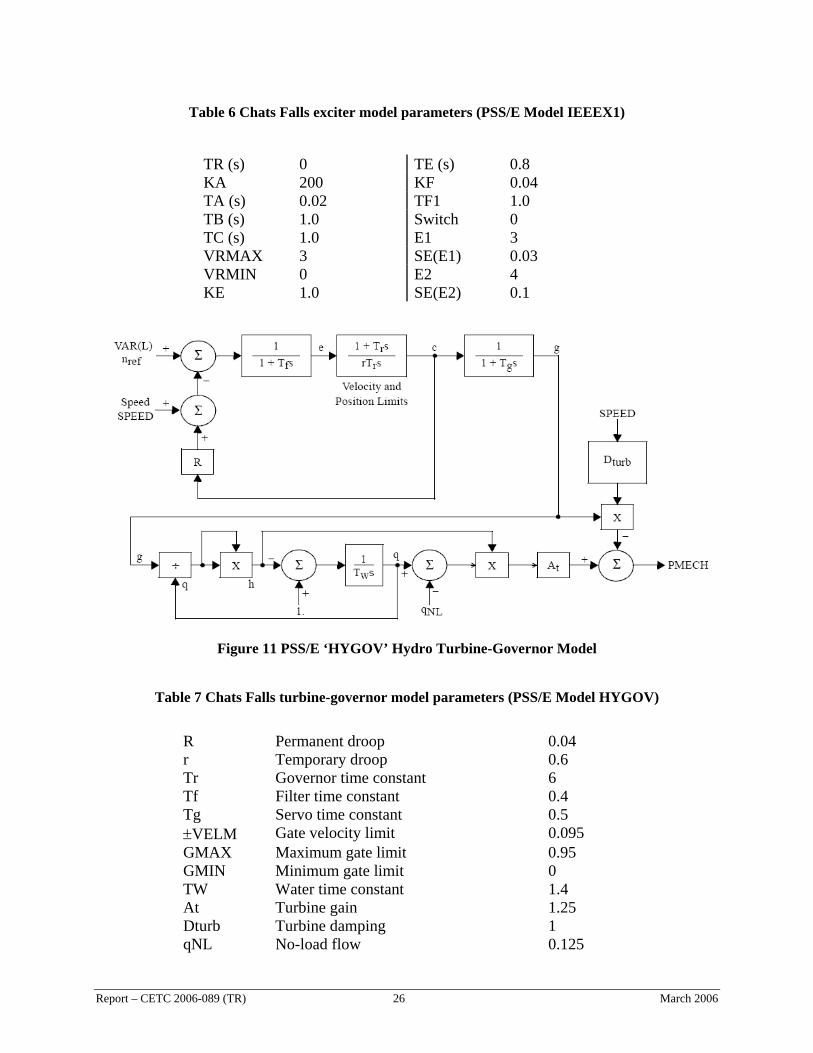
Table 6 Chats Falls exciter model parameters (PSS/E Model IEEEX1)
TR (s) 0 TE (s) 0.8 KA 200 KF 0.04 TA (s) 0.02 TF1 1.0 TB (s) 1.0 Switch 0 TC (s) 1.0 E1 3 VRMAX 3 SE(E1) 0.03 VRMIN 0 E2 4 KE 1.0 SE(E2) 0.1
Figure 11 PSS/E ‘HYGOV’ Hydro Turbine-Governor Model
Table 7 Chats Falls turbine-governor model parameters (PSS/E Model HYGOV)
R Permanent droop 0.04 r Temporary droop 0.6 Tr Governor time constant 6 Tf Filter time constant 0.4 Tg Servo time constant 0.5 ±VELM Gate velocity limit 0.095 GMAX Maximum gate limit 0.95 GMIN Minimum gate limit 0 TW Water time constant 1.4 At Turbine gain 1.25 Dturb Turbine damping 1 qNL No-load flow 0.125
Report – CETC 2006-089 (TR) 26 March 2006
4.3.4 Saunders
Each of 16 hydraulic units rated 60 MVA is modeled as being identical to the Chats Falls units.
4.3.5 DG Units
Three variations are considered for modeling aggregate DG presence:
•
•
•
Existing power converter based DG tend to behave as a source of active and reactive power/6/. Accordingly they can be modeled as such either explicitly or essentially as negative loads (i.e. switching in a DG is equivalent to switching out an identical load).
Generator represented by a classical machine model, denoting a constant voltage source behind a fixed reactance/2/. This models a generator providing a fixed voltage output, corresponding to the behaviour of a power converter without voltage control or a conventional synchronous generator with fixed (or manually controlled) field excitation. The rotor inertia can be specified as being 1-3 for conventional machine, or arbitrarily small values for power converter based units if it is desired that the DG track system frequency without undue lag.
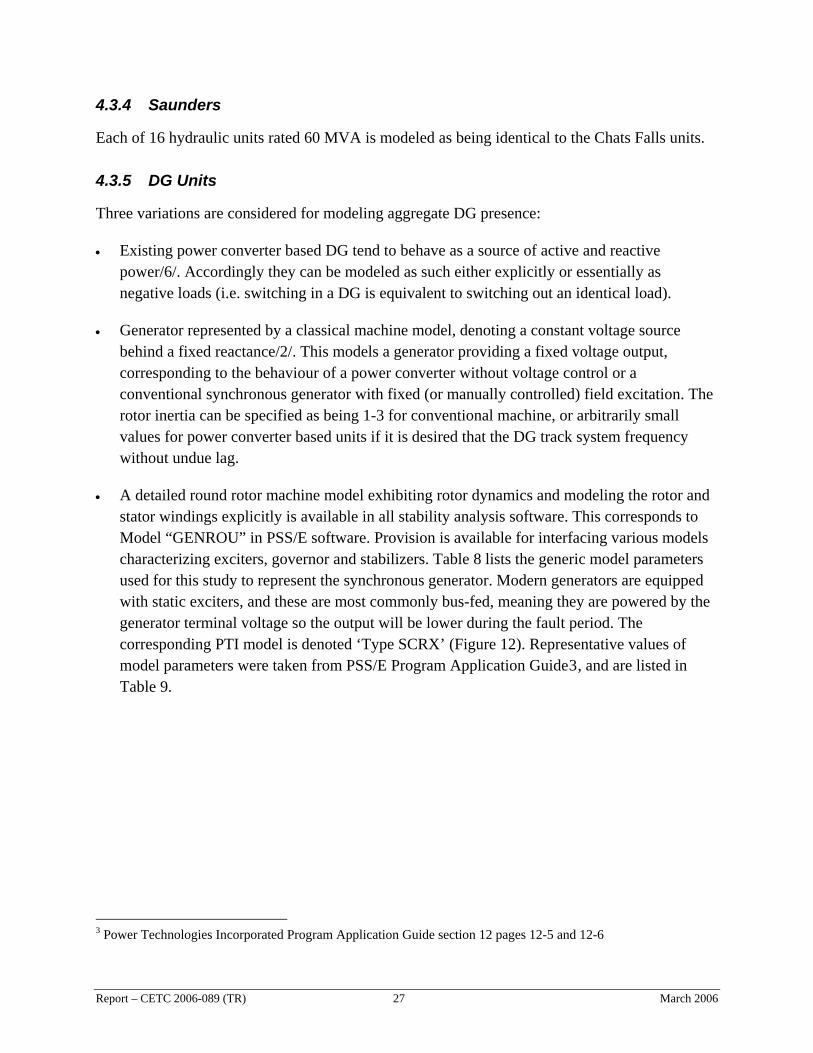
A detailed round rotor machine model exhibiting rotor dynamics and modeling the rotor and stator windings explicitly is available in all stability analysis software. This corresponds to Model “GENROU” in PSS/E software. Provision is available for interfacing various models characterizing exciters, governor and stabilizers. Table 8 lists the generic model parameters used for this study to represent the synchronous generator. Modern generators are equipped with static exciters, and these are most commonly bus-fed, meaning they are powered by the generator terminal voltage so the output will be lower during the fault period. The corresponding PTI model is denoted ‘Type SCRX’ (Figure 12). Representative values of model parameters were taken from PSS/E Program Application Guide3, and are listed in Table 9.
3 Power Technologies Incorporated Program Application Guide section 12 pages 12-5 and 12-6
Report – CETC 2006-089 (TR) 27 March 2006
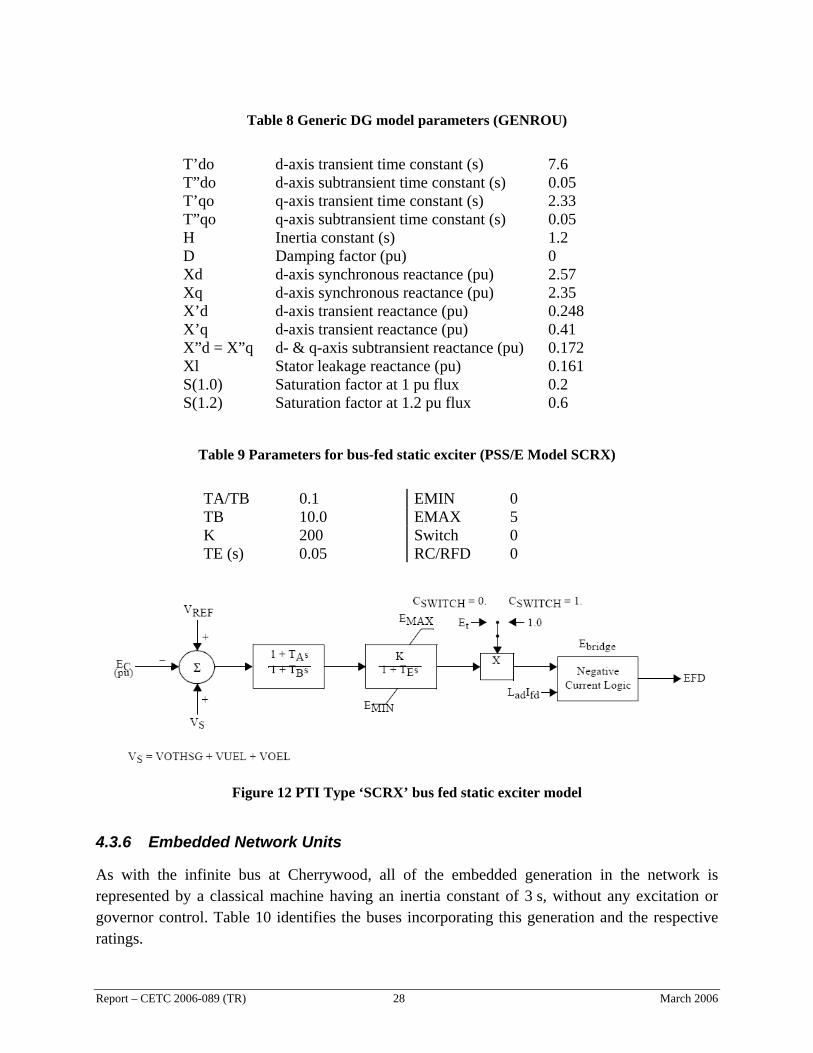
Table 8 Generic DG model parameters (GENROU)
T’do d-axis transient time constant (s) 7.6 T”do d-axis subtransient time constant (s) 0.05 T’qo q-axis transient time constant (s) 2.33 T”qo q-axis subtransient time constant (s) 0.05 H Inertia constant (s) 1.2 D Damping factor (pu) 0 Xd d-axis synchronous reactance (pu) 2.57 Xq d-axis synchronous reactance (pu) 2.35 X’d d-axis transient reactance (pu) 0.248 X’q d-axis transient reactance (pu) 0.41 X”d = X”q d- & q-axis subtransient reactance (pu) 0.172 Xl Stator leakage reactance (pu) 0.161 S(1.0) Saturation factor at 1 pu flux 0.2 S(1.2) Saturation factor at 1.2 pu flux 0.6
Table 9 Parameters for bus-fed static exciter (PSS/E Model SCRX)
TA/TB 0.1 EMIN 0 TB 10.0 EMAX 5 K 200 Switch 0 TE (s) 0.05 RC/RFD 0
Figure 12 PTI Type ‘SCRX’ bus fed static exciter model
4.3.6 Embedded Network Units
As with the infinite bus at Cherrywood, all of the embedded generation in the network is represented by a classical machine having an inertia constant of 3 s, without any excitation or governor control. Table 10 identifies the buses incorporating this generation and the respective ratings.
Report – CETC 2006-089 (TR) 28 March 2006
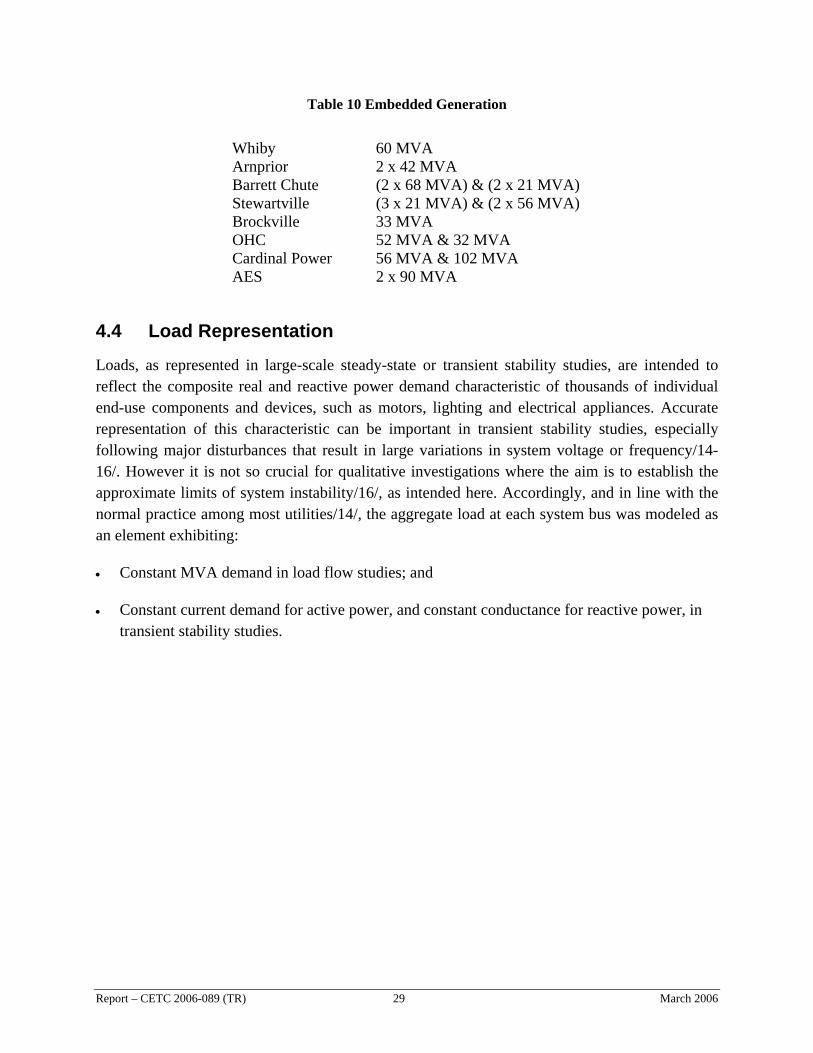
Table 10 Embedded Generation
Whiby 60 MVA Arnprior 2 x 42 MVA Barrett Chute (2 x 68 MVA) & (2 x 21 MVA) Stewartville (3 x 21 MVA) & (2 x 56 MVA) Brockville 33 MVA OHC 52 MVA & 32 MVA Cardinal Power 56 MVA & 102 MVA AES 2 x 90 MVA
4.4 Load Representation
Loads, as represented in large-scale steady-state or transient stability studies, are intended to reflect the composite real and reactive power demand characteristic of thousands of individual end-use components and devices, such as motors, lighting and electrical appliances. Accurate representation of this characteristic can be important in transient stability studies, especially following major disturbances that result in large variations in system voltage or frequency/14-16/. However it is not so crucial for qualitative investigations where the aim is to establish the approximate limits of system instability/16/, as intended here. Accordingly, and in line with the normal practice among most utilities/14/, the aggregate load at each system bus was modeled as an element exhibiting:
Constant MVA demand in load flow studies; and •
• Constant current demand for active power, and constant conductance for reactive power, in transient stability studies.
Report – CETC 2006-089 (TR) 29 March 2006
5 Impact of Large-Scale DG Penetration
The number of permutations in study scenarios that can be explored is formidable in principle. On the system side, there are variations to be considered in loading, in the dispatch of conventional generation, and in contingencies such as lines or equipment outages, or events causing disturbances such as faults, loss of generation or load. On the DG side they include location, the technology (inverter or rotating), power dynamics (exciter characteristics), protection (tripping due to undervoltage or overcurrent), control (whether power remains constant, whether current or power factor are scheduled), and finally DG penetration relative to load growth. In addition, voltage and frequency controls incorporated in the individual units are evidently relevant since these will impact stability. Similarly load characteristics, meaning the manner in which real and reactive demand varies, can influence system stability during major disturbances.
5.1 Study Scenarios
It was envisaged at the outset that the range of parameter variations having relevance is large, possibly including all of the following:
Aggregate system demand (light load, peak load) •
•
•
•
•
•
•
Available generating capacity
Outage contingencies (various lines, buses, generators)/17/
Types and locations for faults, with normal (0.1 s) and delayed (0.5 s) clearing/17/
DG location (aggregated at Chat Falls GS, Hawthorne TS, at both locations)
DG technology (rotating machine only ranging to inverter only)
DG controls (base case, voltage, frequency, voltage and frequency)
For each combination of the above scenarios, the DG penetration could be increased in discrete steps to the point where stability is lost. Clearly several penetration levels multiplied by the various permutations listed above represents an impractical number of simulations. In any event, many of these permutations are expected to result in only minor changes to the stability limit, or will allow such high DG penetration as to be of little interest. Therefore it was deemed sufficient to focus on just a reasonable number of studies with the objective of mapping out the penetration limits over significant parameters.
Report – CETC 2006-089 (TR) 30 March 2006
All simulations were conducted using PTI PSS/E software (version 29), used commonly throughout the industry.
5.2 Steady-State Stability
The notion of steady-state stability is related to the network’s ability to maintain power flows within permissible limits while respecting equipment ratings and maintaining acceptable voltage levels at all buses.
The base case loadflow solution for the projected 2005 winter peak was presented earlier (Figure 4). Its careful examination reveals that the major power corridors are surprisingly lightly loaded relative to their thermal capacities. This is illustrated in Figure 13 by means of shaded rectangular bars overlaying the respective line sections, with the portion in green denoting the relative line loading. The apparent surplus transmission capacity appears to be a consequence of an ambitious program, undertaken in the 1970’s, to enhance the East-West power transfer capacity in the province. The primary transmission corridor, comprising the double circuit 500-kV corridor between Lennox and Hawthorne, is seen to be loaded only to about 10% of its thermal rating.
Further exploratory studies suggest that, neglecting contingencies, the existing network resources can accommodate almost 150% load growth at Hawthorne (amounting to about the region’s aggregate load) before upgrades may be required. This is illustrated in Figure 14, showing another 930 MW (0.95 pf) of additional load supplied out of Hawthorne. Note that the loadflow solution has automatically switched out a 140 MVAr reactor at Hawthorne (provided for voltage control and connected to the autotransformer tertiary) to compensate for the additional reactive demand. Redistributing the load among Hawthorne, Merivale and Nepean was found not to matter appreciably because of their relative proximity. The limiting constraint is found to be associated with an emerging shortfall in the available reactive resources, not the thermal capacity of the 500-kV corridor. This is indicated by the bus voltages in the region (about 1 pu) falling substantially below normal operating level (1.05 pu), and the units at Chats Falls reaching their reactive ceiling. It also illustrates that while the 500-kV lines are efficient at delivering the additional real power demand, they are ineffective at transporting reactive power over the distance involved (about 200 km). Evidence of this can be found in Figure 15, showing that an outage on both Lennox units can be accommodated without causing further degradation in the voltage levels near Ottawa. Hence the critical contingency impacting steady-state (voltage) stability in the Ottawa area is associated with the loss of reactive support.
Reactive power is provided most effectively by nearby generation at Chats Falls and Saunders. Thus loss of generation involving these stations will degrade voltage stability, reducing the ability to accommodate future load growth without further network enhancements. At Chats Falls for instance, an outage of a step up transformer, each of which is shared by two units, is
Report – CETC 2006-089 (TR) 31 March 2006
seen to increase system stress, though only marginally (Figure 16). An outage on the 115-kV radial feed from Chats Falls to Hawthorne (via Nepean and Merivale) is found to be more limiting (Figure 17). Here the available margin for load growth is closer to 100% of existing values. Bear in mind that the available margin may be lower in the summer because of air-conditioning load which poses a considerable reactive burden.
An outage on either one of the Lennox-Hawthorne 500-kV circuits is found to be even more detrimental (Figure 18). It results in the parallel circuit being more heavily loaded, increasing the associated reactive power losses. The available margin for load growth is found to be closer to 50% considering this contingency (Figure 19).
Not surprisingly, the provision of new generation in the Ottawa area is seen to enhance supply security. If these units are restricted to operation at unity power factor (assuming DG units operating at constant power factor) a potential remains for the voltage levels to remain depressed following contingencies, as illustrated in Figure 20 for loss of reactive support from Chats Falls. Figure 21 confirms that normal voltage levels can be restored by providing 370 MVAr of reactive generation locally, confirming once again that the region is starved of reactive resources and that existing transmission corridors have ample capacity to deliver the added real power demand. Finally, Figure 22 and Figure 23 illustrate the impact of having DG resources providing real and reactive power support equitably during the identified critical contingencies. The operating posture in this case is more favourable, with voltage levels remaining normal.
Evidently there is no limit in the ability of the network to accommodate load growth, other than the thermal rating of the associated apparatus (lines, transformers), provided that it is matched by new generation. In the event that new DG capacity outpaces load growth, the region seems to have ample capacity to export the surplus power to other load centres in the province, given that the major transmission corridors are lightly loaded.
5.3 Transient Stability
Network disturbances such as equipment outages, load changes or faults disrupt the prevailing steady state operating conditions, causing a redistribution of power flows. The ability of the network to cope with these disturbances and to re-establish steady-state operation with permissible line flows and voltage levels is addressed by transient stability studies. The network’s transient stability limit is that operating posture (defined as a specified demand and generator loading scenario) beyond which it cannot cope with a specified set of contingencies.
Foregoing steady-state stability analysis identified limits to the candidate network’s capacity to accommodate additional load growth in the absence of new local generating capacity, or assuming this new capacity to be made up entirely of DG that could trip aggressively in case of network disturbances. It was determined that the limiting constraint was a shortfall in reactive
Report – CETC 2006-089 (TR) 32 March 2006
power reserve. This however did not consider potential instabilities associated with generator controls that might interfere with the network’s ability to re-establish stable post-disturbance operating conditions. For instance, certain generators may lose synchronism (angular instability) during the period immediately following the disturbance, potentially causing cascaded outages. Alternatively, the network can experience voltage collapse over a period of seconds to minutes/18/, as slower acting network controls (e.g. tap changes, switched capacitor/reactor banks) attempt to compensate for depressed voltage conditions due to either loss of reactive resources or an increase in reactive losses across the network. Our focus here is primarily on the impact of generator controls on new DG units, and is therefore concerned primarily with angular stability.
Simulations were carried out for various single contingencies (e.g. outage on various lines or existing generating resources). In all cases however, the modelled network was found to be remarkably resilient, resisting angular instability. To illustrate, we have chosen the scenarios identified earlier as representing limiting contingencies from the standpoint of steady-state stability, as follows:
3-phase permanent fault near Hawthorne 500-kV bus resulting in the loss of a Lennox circuit for normal fault clearing time (0.1 s)
•
• 3-phase permanent fault near Chats Falls 230-kV bus resulting in the loss of the circuit towards Nepean.
For each of these contingencies, simulations were carried assuming the following six operating scenarios, therefore amounting to 12 study cases. Simulated responses are shown in Figures identified in parentheses:
Case 1: Base case operating scenario, therefore assuming no load growth and no new generation. This represents the benchmark response reflecting the response of the existing network for comparison. (Figure 24 and Figure 25)
Case 2: 100% load growth at Hawthorne 230-kV bus without any new generation, representing the limiting scenario for steady-state stability. (Figure 26 and Figure 27)
Case 3: 100% load growth matches new generation (denoted hereafter as DG, in brief) such that there is no net impact on load flows in the bulk network. Upon occurrence of a system disturbance, all connected DG is assumed to trip, subjecting the network to the full burden of supplying the assumed load growth. This mode of DG operation may be interpreted to correspond to present practice involving all DG types (power converter or rotating) with aggressive trip settings. (Figure 28 and Figure 29)
Report – CETC 2006-089 (TR) 33 March 2006
Case 4: Repeat Case 3 with DG modeled explicitly as a classical machine, representing a power converter based unit without voltage control or a rotating machine based DG with manual field excitation control. (Figure 30 and Figure 31)
Case 5: DG is modeled explicitly as a classical machine with 100% load growth as before, but not tripped during the disturbance. This illustrates possible beneficial impact on network response due to local DG support. (Figure 32 and Figure 33)
Case 6: DG is modeled explicitly as a conventional round rotor machine with fast responding static excitation system for voltage control. This can be interpreted as representing conventional rotating generator or an advanced breed of “grid-friendly” power converter based DG designed to artificially mimic the same behaviour. All DG is assume to remain in service during disturbance. Note that premature tripping defaults to the scenario modeled in Cases 4. (Figure 34 and Figure 35)
The results of the simulations illustrate that the rotors of all existing conventional machines (at Lennox, Saunders and Chats Falls) oscillate in concert against the rest of the system represented here by the Cherrywood bus. The oscillations appear to be well damped, decaying within 10 s even in the absence of modern static exciters on the available generators. This should be viewed as demonstrating that angular stability is unlikely to be a limiting constraint for the modeled network in the near future even in the event of large-scale DG penetration, and even assuming aggressive tripping provided that adequate generating reserve can be made available to offset the resource shortfall.
5.4 Assessment
The overriding requirement for future supply security in the Ottawa area appears to be the provision of reactive support. New generation, whether in the form of DG or more conventional units, will be most effective if it can contribute this capacity. Otherwise, network upgrades in the form of transmission line reinforcement or other forms of reactive apparatus (e.g. capacitor banks, or more advanced FACTS4 devices) will be necessary. Analysis suggests that from the standpoint of maintaining steady-state stability in the region:
•
Existing resources can accommodate about 150% increase in local load at Hawthorne in normal operation (representing almost 60% of the region’s aggregate load) neglecting any contingencies that cause an outage on certain critical lines. This can be interpreted in a number of ways. It can mean that up to 150% load growth can be accommodated without any DGs subject to availability of generating resources elsewhere in the province. Alternatively, it can infer an even greater load growth that is partially offset by new local DG resources,
4 Commonly used industry term denoting ‘Flexible AC Transmission Systems’, and generally referring to advanced power-converter based apparatus.
Report – CETC 2006-089 (TR) 34 March 2006
and provided that no more than specified amount of generating resource (in MW) experiences a sudden outage (e.g. due to aggressive tripping).
The foregoing projection is overly optimistic given that it does not contemplate any contingencies that could result in the loss of a critical network element. Making this allowance reduces the available margin for load growth to about 50% of existing Hawthorne load (or alternatively, no more than this amount of net generation loss in a single contingency event).
•
•
•
•
If new generating capacity matching load growth is added, but restricted to operation at unity power factor, the region’s ability to accommodate load growth is enhanced marginally, reaching about 100% of existing Hawthorne load.
If local generating resources are able to carry their proportionate share of reactive load, as per existing practice for utility generation, the available margin reverts to that given in (a) subject to immediate availability of local DG resources subsequent to a contingency and possible thermal loading limitations for local power infrastructure.
In the event that new DG capacity outpaces load growth, the region has adequate capacity to export the surplus to other load centres in the province, given that the major transmission corridors are lightly loaded.
Angular stability is found not to be a limiting constraint for dictating permissible levels of DG penetration.
The foregoing conclusions can therefore be generalized as follows. Permissible levels of DG penetration are unlikely to be dictated by angular stability concerns in grid networks serving the fringes of larger urban networks that (a) serve loads over distances of a few hundred kilometres, (b) have sufficient generating reserves as well as thermal transmission capacity in the backbone to make up the generation shortfall resulting from unplanned DG capacity outages. Steady-state voltage stability considerations, based on assessment of the voltage levels in the network following the loss of DG capacity, are more likely to be a governing factor. This is generally the case if generating resources are more distant from the load centres (as for instance for the Hydro Quebec system, where major generating resources are remote from major load centres near Montreal), since reactive support is not transported efficiently over large distances. Finally, we note that these conclusions take into account normally anticipated single-event contingencies, and do not rely on DG to provide post-contingency support.
These findings complement the results of a similar study carried out by Miller/4/, differing in certain fundamental respects. The latter study covered a much larger network comprising the entire WECC grid (including over 12,000 buses and almost 2,300 generators), serving large parts of Western Canada and the United States. The model therefore included all of the generation in
Report – CETC 2006-089 (TR) 35 March 2006
Report – CETC 2006-089 (TR) 36 March 2006
the system, obviating the need for an infinite bus (equivalent to a swing bus in loadflow solution), having the capacity to make up any generation shortfall caused by generator outages. Accordingly, the model exhibited larger frequency deviations during disturbances than in the present study. This allowed the study to examine the impact of various DG control strategies (governor and excitation systems) on system dynamics. Maximum DG penetration level considered was limited to 20% of system demand. The study concluded that while the various DG controls evidently alter the nature of system dynamics following disturbances (e.g. damping of the resulting oscillations), the system was not at risk of losing angular or voltage stability immediately after the disturbance (first swing instability). Instead, the primary risk was overly aggressive under-frequency trip settings on DG units that could cause cascaded tripping of units, and ultimately yield an unmanageable generation shortfall.
Accordingly, the findings of these two studies, taken together, may be reduced to the following conclusion when applied to large-scale DG penetration in power systems. Although DG controls will inevitably influence the nature of system dynamics, the imminent threat to system security is more likely to arise from reactionary (undesirable or overly aggressive) operation of protections than from first-swing instability.
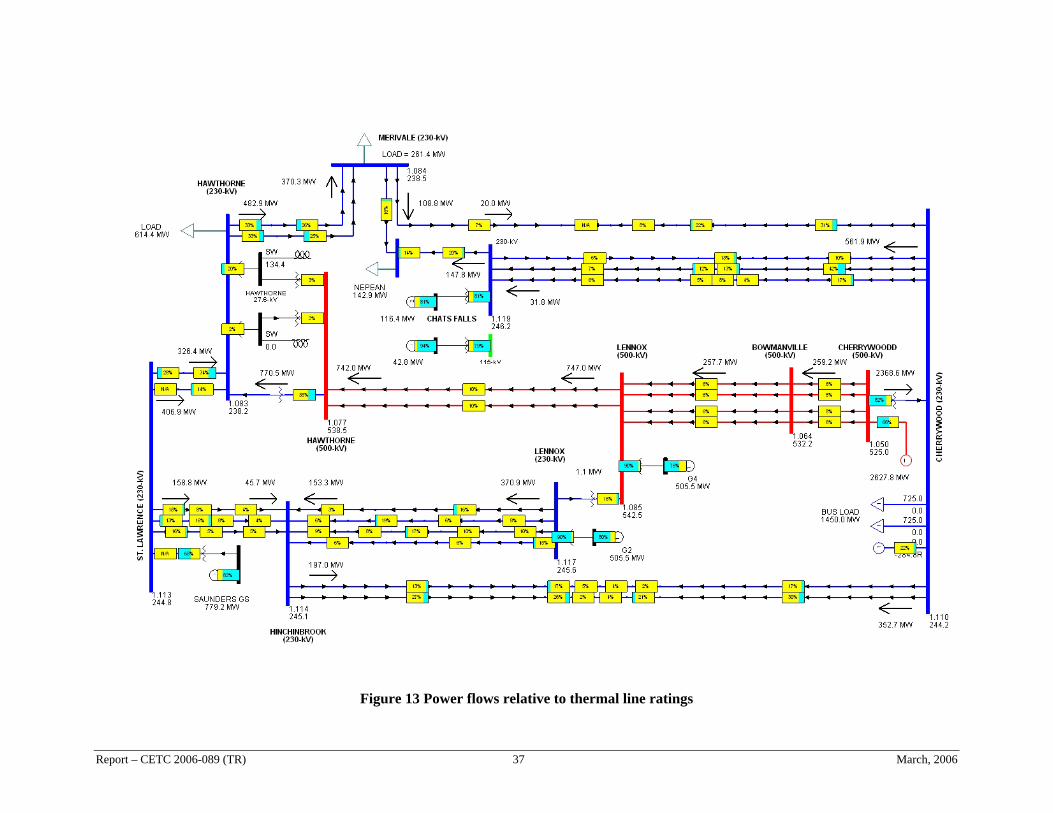
Figure 13 Power flows relative to thermal line ratings
Report – CETC 2006-089 (TR) 37 March, 2006
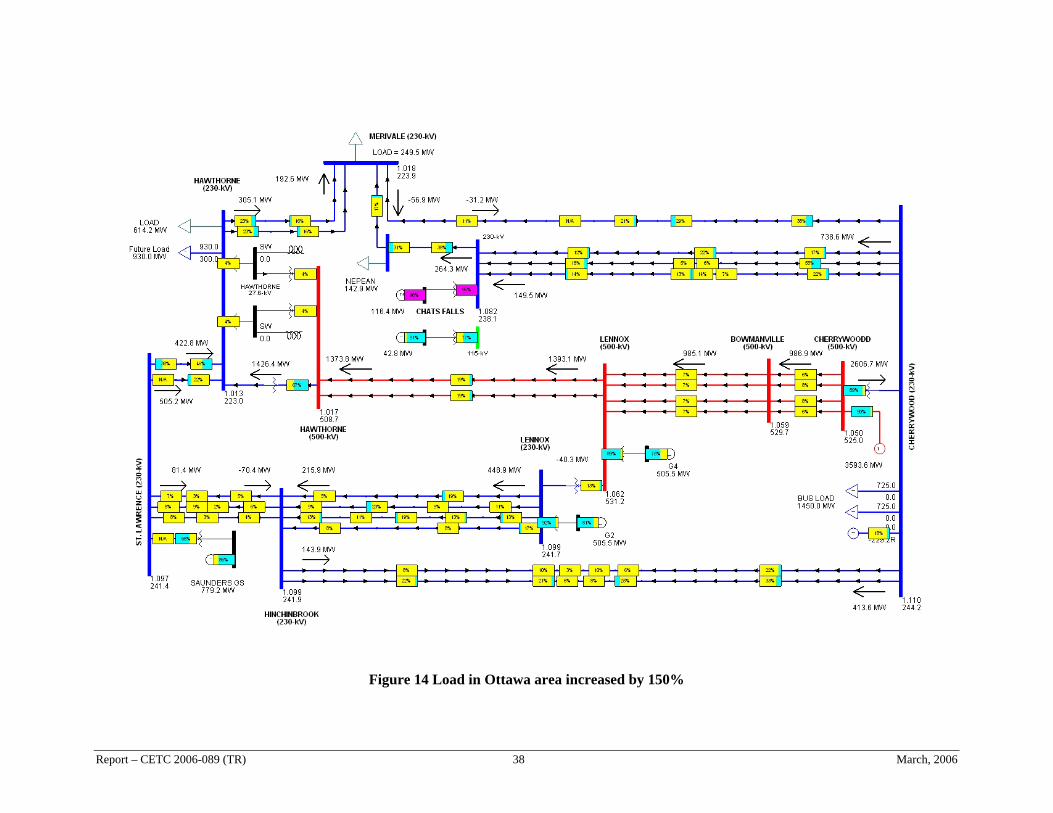
Figure 14 Load in Ottawa area increased by 150%
Report – CETC 2006-089 (TR) 38 March, 2006
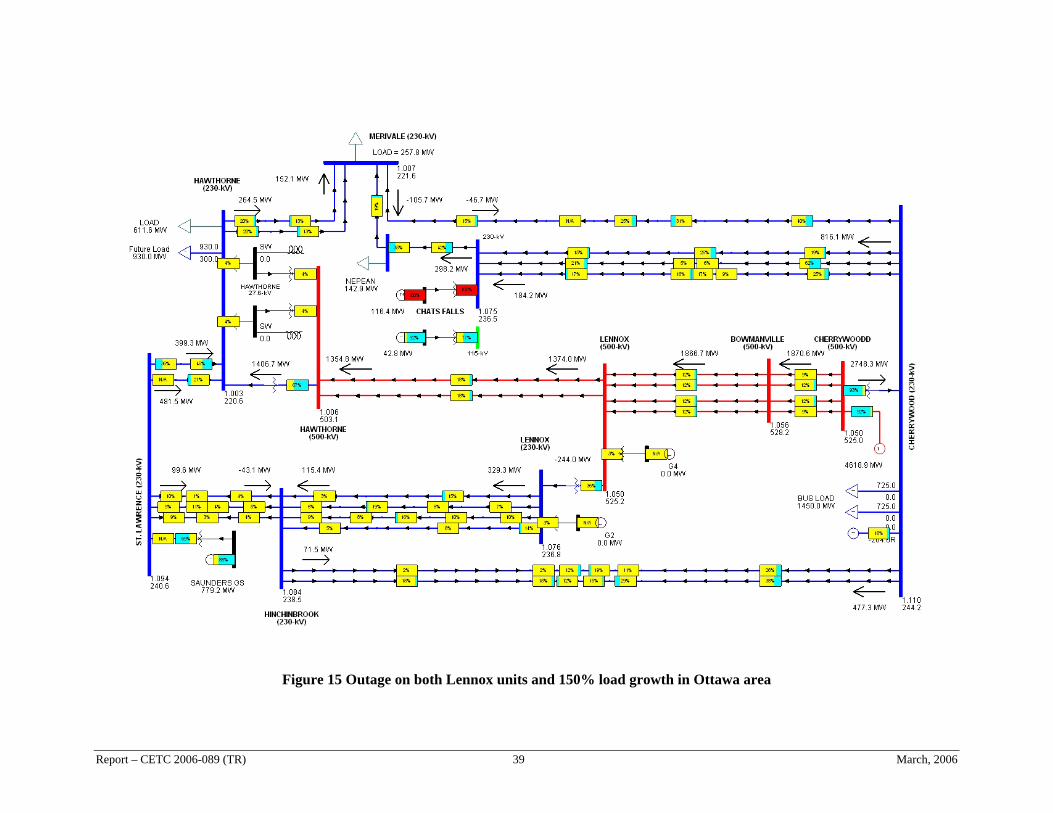
Figure 15 Outage on both Lennox units and 150% load growth in Ottawa area
Report – CETC 2006-089 (TR) 39 March, 2006
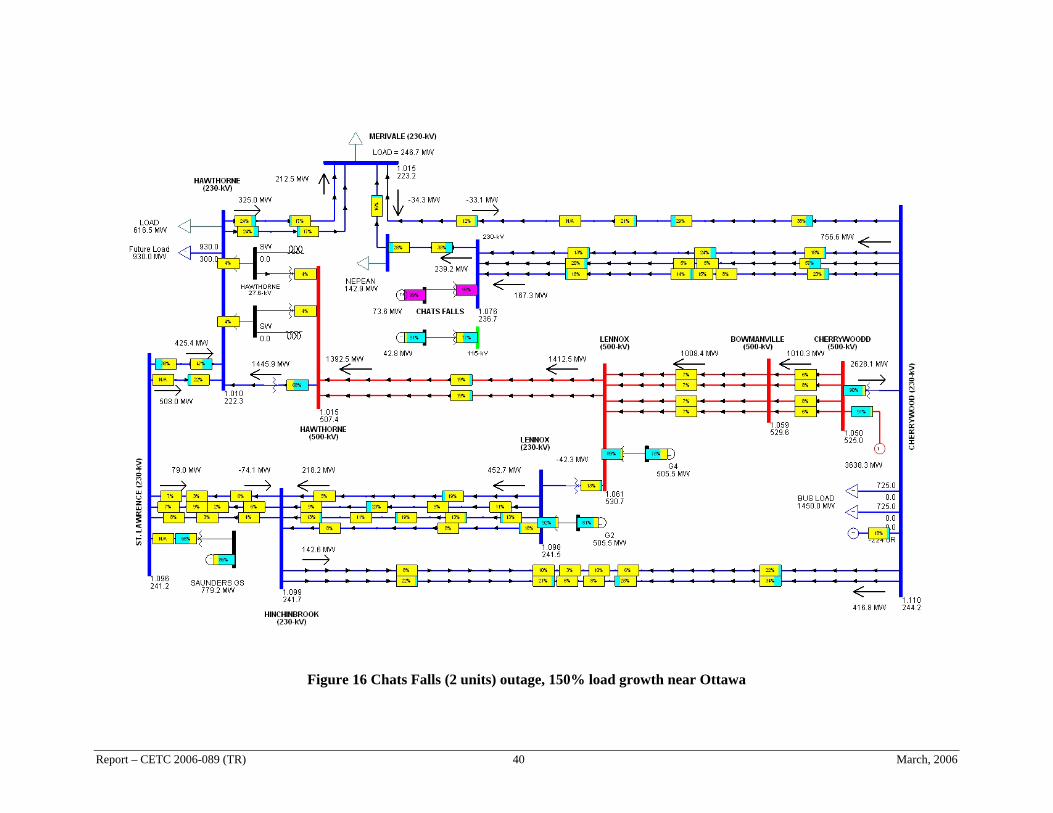
Figure 16 Chats Falls (2 units) outage, 150% load growth near Ottawa
Report – CETC 2006-089 (TR) 40 March, 2006
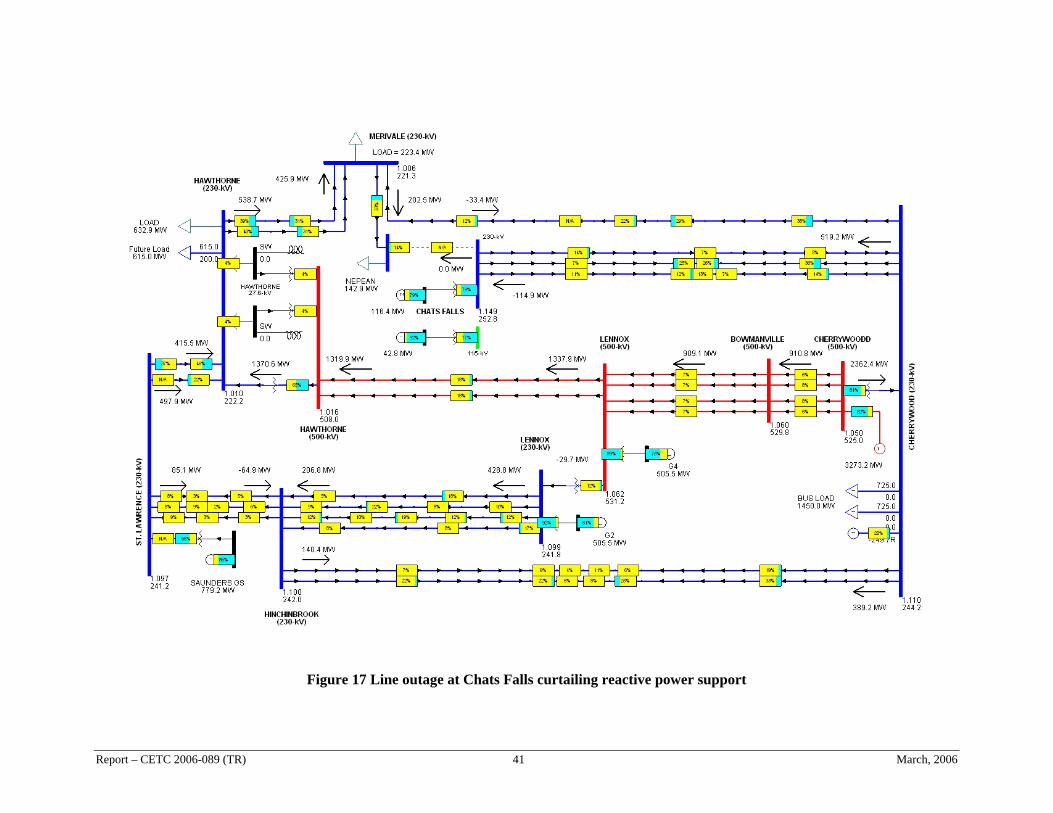
Figure 17 Line outage at Chats Falls curtailing reactive power support
Report – CETC 2006-089 (TR) 41 March, 2006
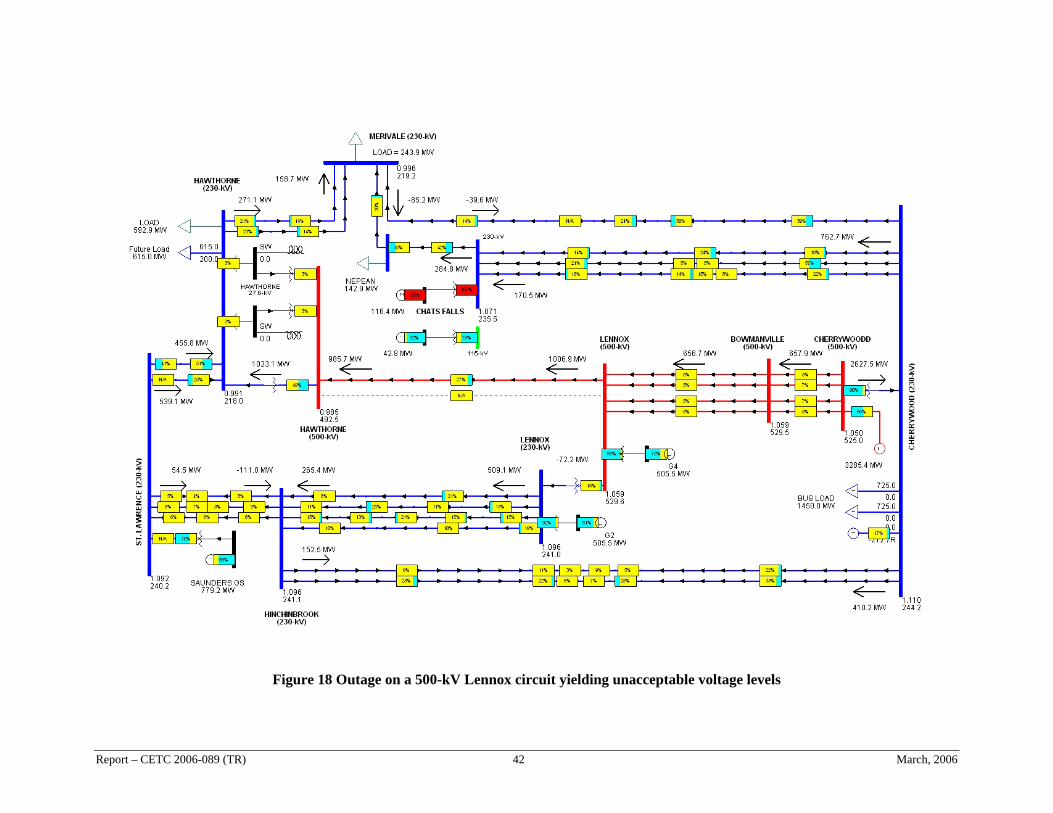
Figure 18 Outage on a 500-kV Lennox circuit yielding unacceptable voltage levels
Report – CETC 2006-089 (TR) 42 March, 2006
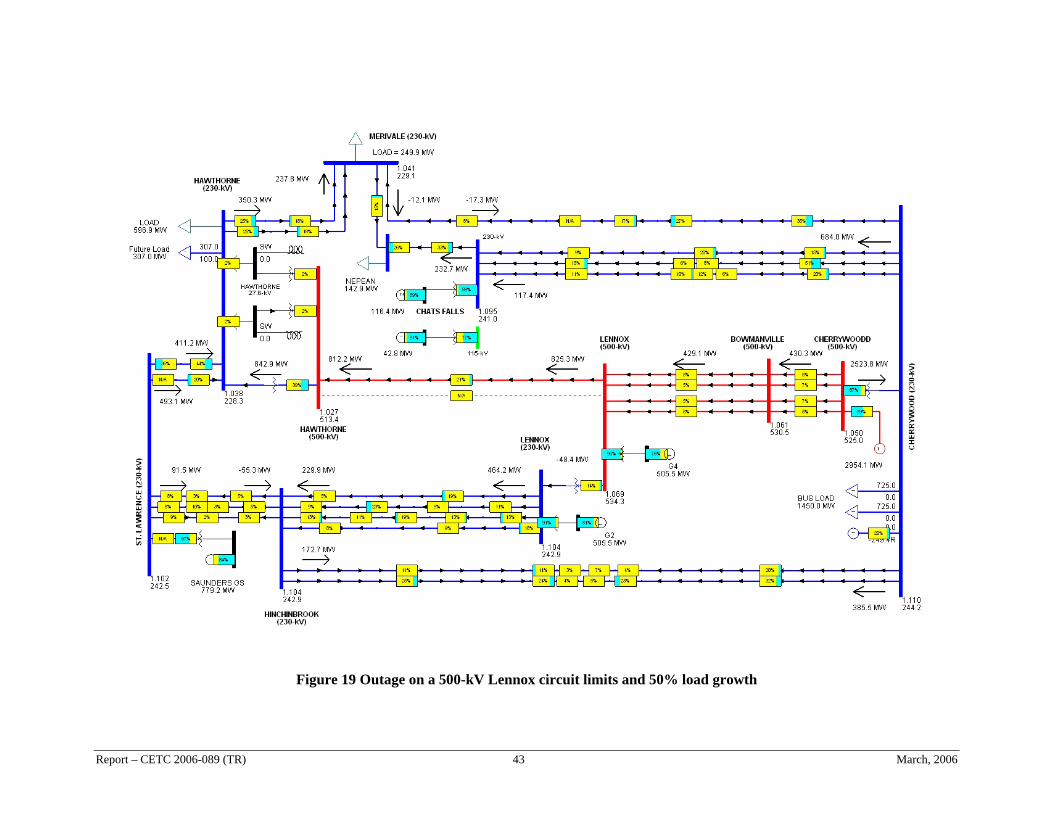
Figure 19 Outage on a 500-kV Lennox circuit limits and 50% load growth
Report – CETC 2006-089 (TR) 43 March, 2006
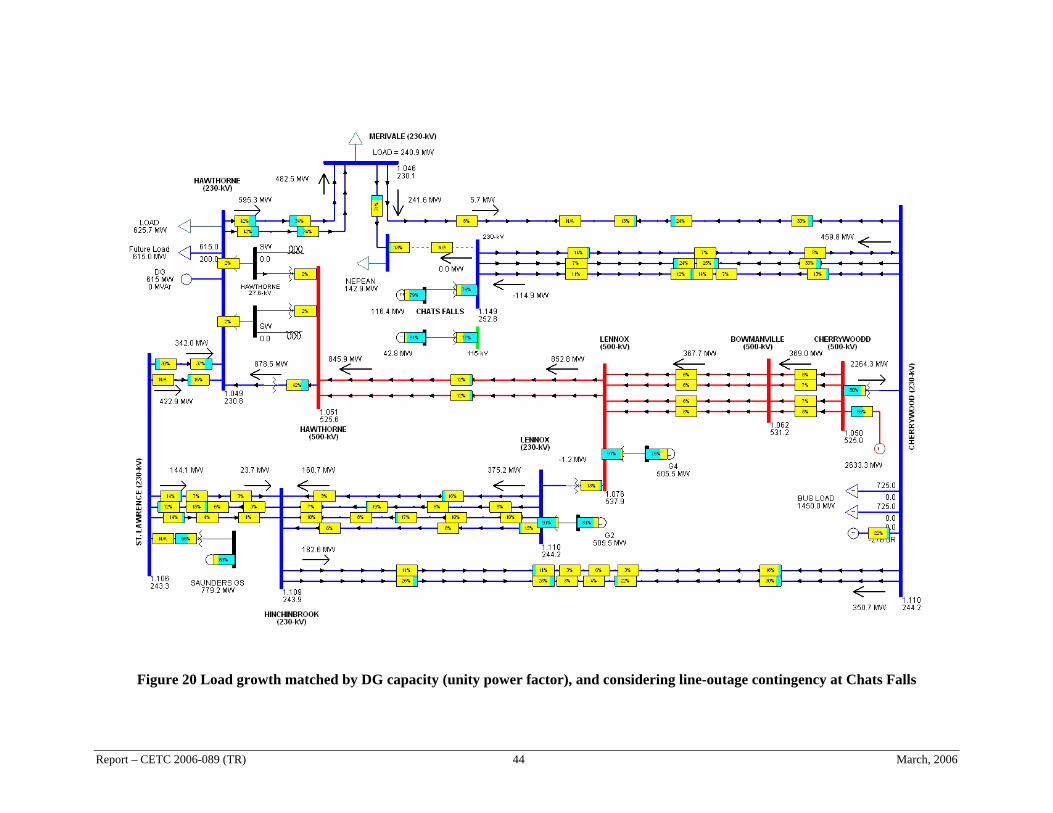
Figure 20 Load growth matched by DG capacity (unity power factor), and considering line-outage contingency at Chats Falls
Report – CETC 2006-089 (TR) 44 March, 2006
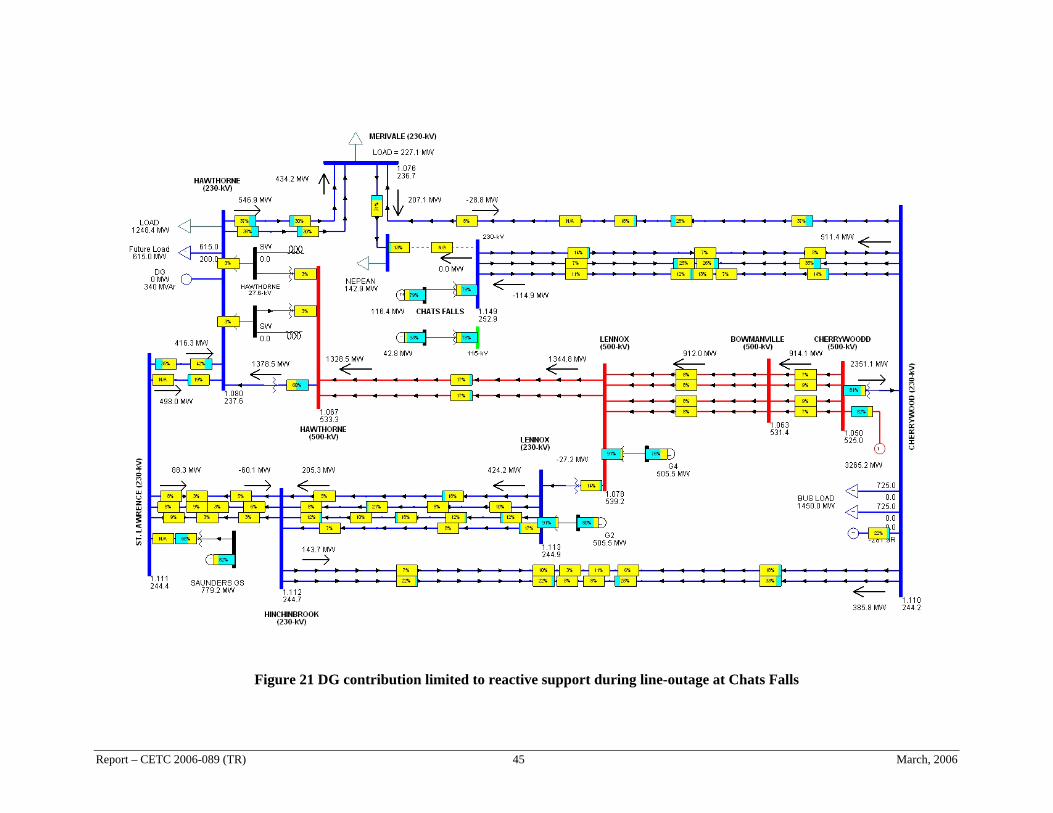
Figure 21 DG contribution limited to reactive support during line-outage at Chats Falls
Report – CETC 2006-089 (TR) 45 March, 2006
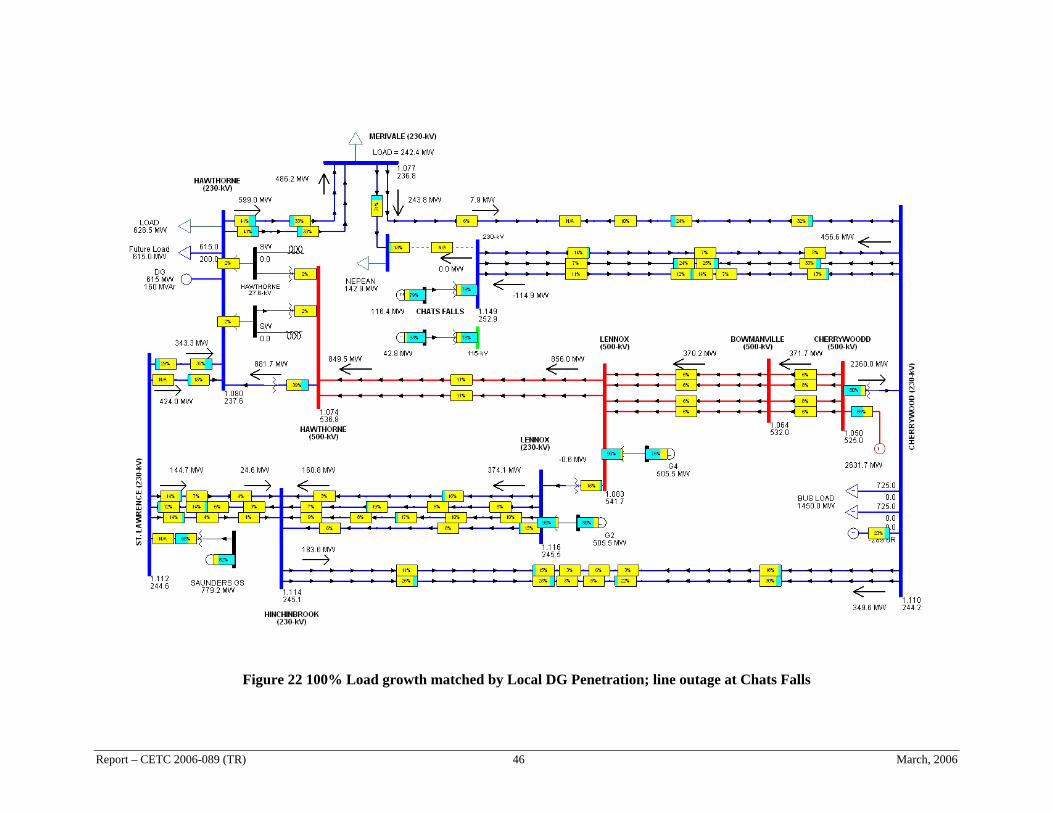
Figure 22 100% Load growth matched by Local DG Penetration; line outage at Chats Falls
Report – CETC 2006-089 (TR) 46 March, 2006
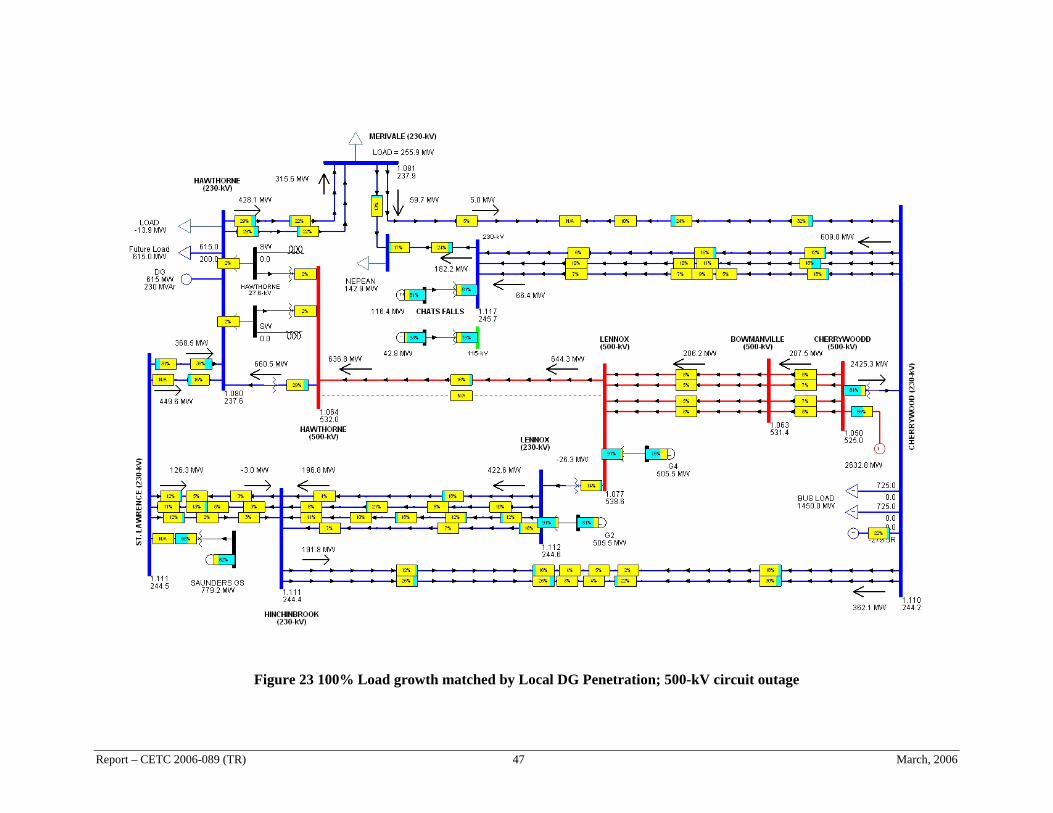
CETC 2006-089 (TR) 47 March, 2006
Figure 23 100% Load growth matched by Local DG Penetration; 500-kV circuit outage
Report –
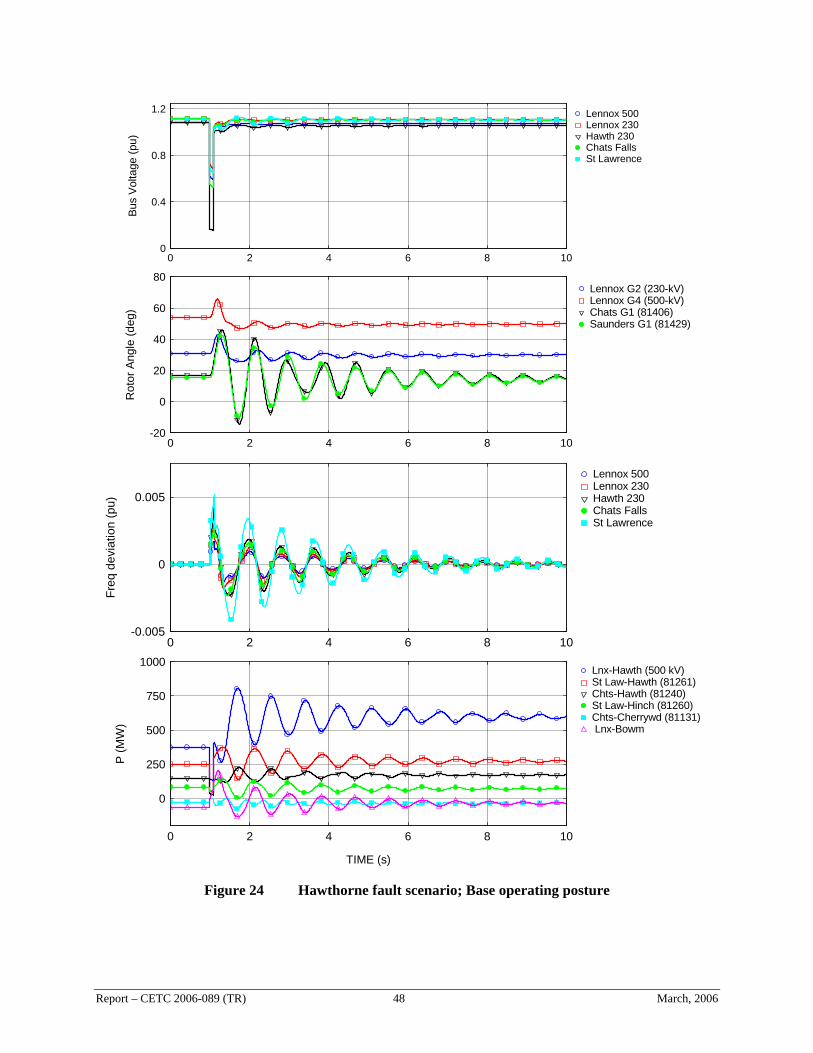
-0.005
0
0.005
0 2 4 6 8 10
Lennox 500Lennox 230Hawth 230Chats FallsSt Lawrence
Freq
dev
iatio
n (p
u)
0
250
500
750
1000
0 2 4 6 8 10
Lnx-Hawth (500 kV)St Law-Hawth (81261)Chts-Hawth (81240)St Law-Hinch (81260)Chts-Cherrywd (81131) Lnx-Bowm
TIME (s)
P (M
W)
-20
0
20
40
60
80
0 2 4 6 8 10
Lennox G2 (230-kV)Lennox G4 (500-kV)Chats G1 (81406)Saunders G1 (81429)
Rot
or A
ngle
(deg
)
0
0.4
0.8
1.2
0 2 4 6 8 10
Lennox 500Lennox 230Hawth 230Chats FallsSt Lawrence
Bus
Vol
tage
(pu)
Figure 24 Hawthorne fault scenario; Base operating posture
Report – CETC 2006-089 (TR) 48 March, 2006
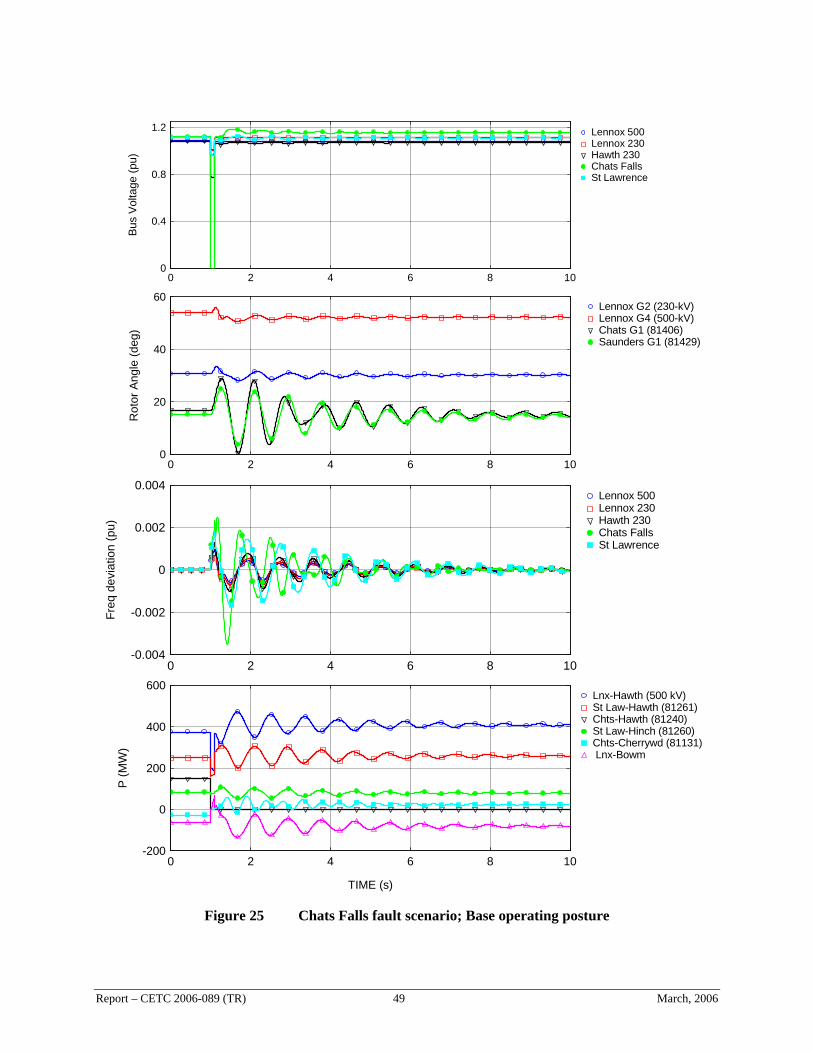
-200
0
200
400
600
0 2 4 6 8 10
Lnx-Hawth (500 kV)St Law-Hawth (81261)Chts-Hawth (81240)St Law-Hinch (81260)Chts-Cherrywd (81131) Lnx-Bowm
TIME (s)
P (M
W)
-0.004
-0.002
0
0.002
0.004
0 2 4 6 8 10
Lennox 500Lennox 230Hawth 230Chats FallsSt Lawrence
Freq
dev
iatio
n (p
u)
0
20
40
60
0 2 4 6 8 10
Lennox G2 (230-kV)Lennox G4 (500-kV)Chats G1 (81406)Saunders G1 (81429)
Rot
or A
ngle
(deg
)
0
0.4
0.8
1.2
0 2 4 6 8 10
Lennox 500Lennox 230Hawth 230Chats FallsSt Lawrence
Bus
Volta
ge (p
u)
Figure 25 Chats Falls fault scenario; Base operating posture
Report – CETC 2006-089 (TR) 49 March, 2006
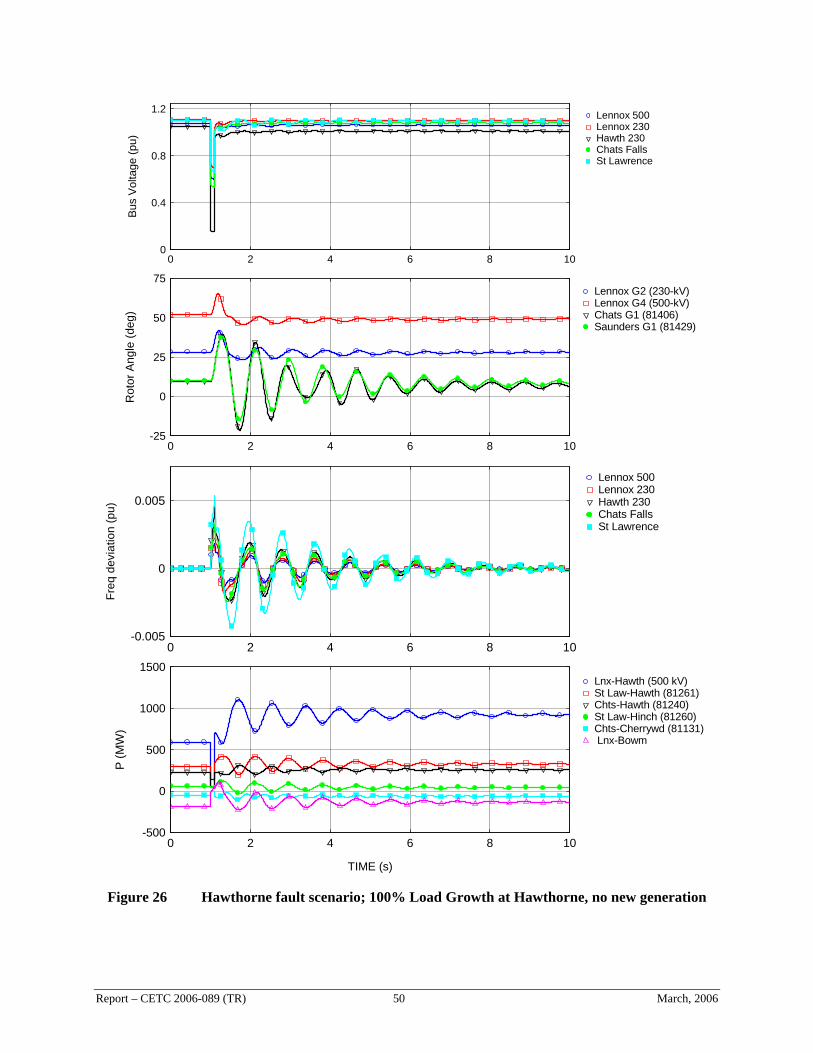
-500
0
500
1000
1500
0 2 4 6 8 10
Lnx-Hawth (500 kV)St Law-Hawth (81261)Chts-Hawth (81240)St Law-Hinch (81260)Chts-Cherrywd (81131) Lnx-Bowm
TIME (s)
P (M
W)
-25
0
25
50
75
0 2 4 6 8 10
Lennox G2 (230-kV)Lennox G4 (500-kV)Chats G1 (81406)Saunders G1 (81429)
Rot
or A
ngle
(deg
)
-0.005
0
0.005
0 2 4 6 8 10
Lennox 500Lennox 230Hawth 230Chats FallsSt Lawrence
Freq
dev
iatio
n (p
u)
0
0.4
0.8
1.2
0 2 4 6 8 10
Lennox 500Lennox 230Hawth 230Chats FallsSt Lawrence
Bus
Volta
ge (p
u)
Figure 26 Hawthorne fault scenario; 100% Load Growth at Hawthorne, no new generation
Report – CETC 2006-089 (TR) 50 March, 2006
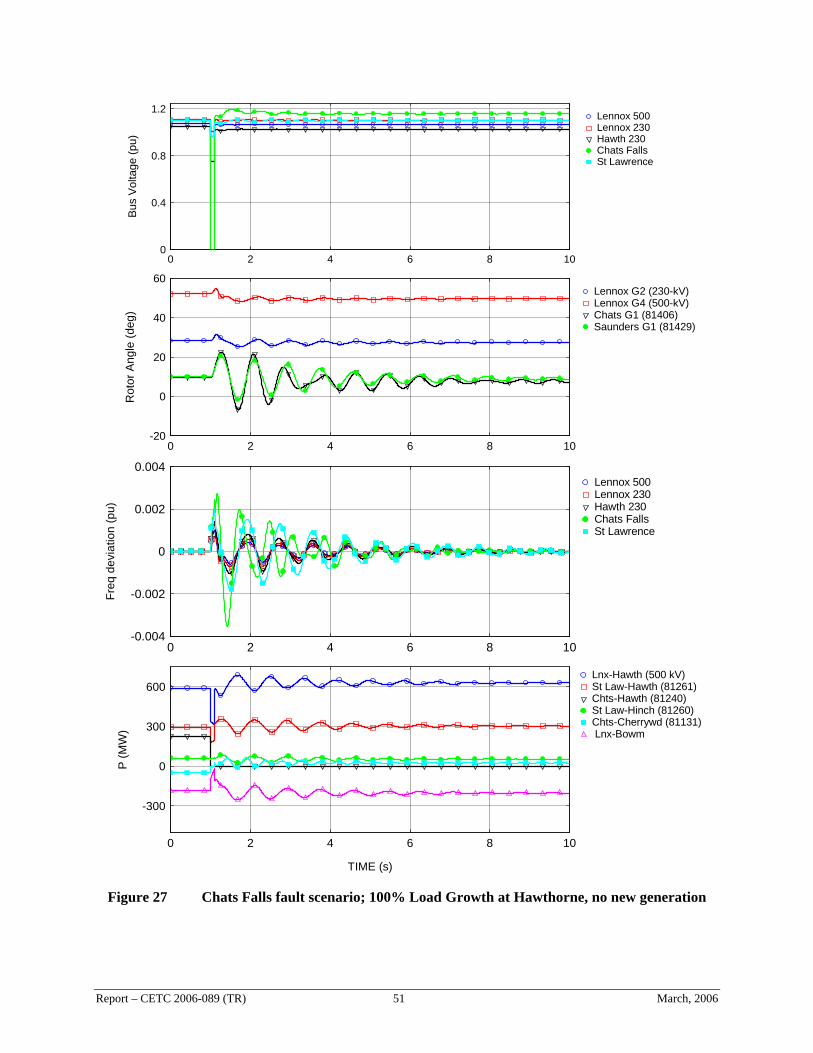
-20
0
20
40
60
0 2 4 6 8 10
Lennox G2 (230-kV)Lennox G4 (500-kV)Chats G1 (81406)Saunders G1 (81429)
Rot
or A
ngle
(deg
)
-0.004
-0.002
0
0.002
0.004
0 2 4 6 8 10
Lennox 500Lennox 230Hawth 230Chats FallsSt Lawrence
Freq
dev
iatio
n (p
u)
-300
0
300
600
0 2 4 6 8 10
Lnx-Hawth (500 kV)St Law-Hawth (81261)Chts-Hawth (81240)St Law-Hinch (81260)Chts-Cherrywd (81131) Lnx-Bowm
TIME (s)
P (M
W)
0
0.4
0.8
1.2
0 2 4 6 8 10
Lennox 500Lennox 230Hawth 230Chats FallsSt Lawrence
Bus
Volta
ge (p
u)
Figure 27 Chats Falls fault scenario; 100% Load Growth at Hawthorne, no new generation
Report – CETC 2006-089 (TR) 51 March, 2006
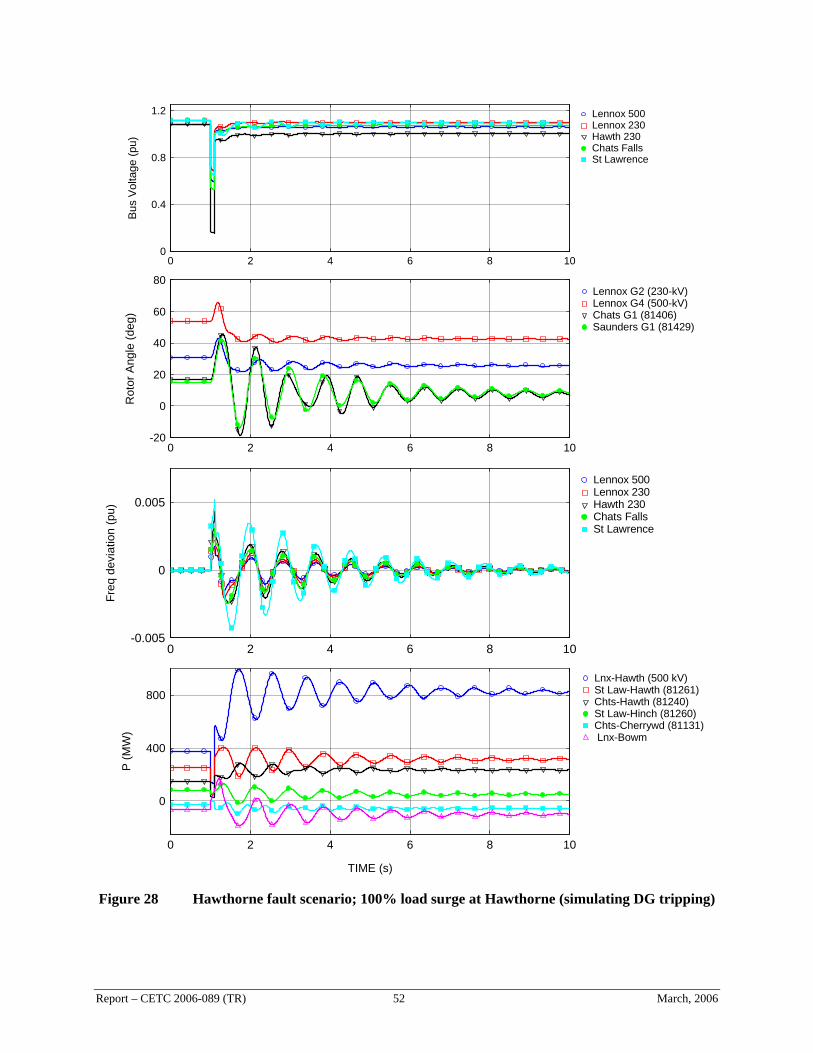
-20
0
20
40
60
80
0 2 4 6 8 10
Lennox G2 (230-kV)Lennox G4 (500-kV)Chats G1 (81406)Saunders G1 (81429)
Rot
or A
ngle
(deg
)
-0.005
0
0.005
0 2 4 6 8 10
Lennox 500Lennox 230Hawth 230Chats FallsSt Lawrence
Freq
dev
iatio
n (p
u)
0
400
800
0 2 4 6 8 10
Lnx-Hawth (500 kV)St Law-Hawth (81261)Chts-Hawth (81240)St Law-Hinch (81260)Chts-Cherrywd (81131) Lnx-Bowm
TIME (s)
P (M
W)
0
0.4
0.8
1.2
0 2 4 6 8 10
Lennox 500Lennox 230Hawth 230Chats FallsSt Lawrence
Bus
Volta
ge (p
u)
Figure 28 Hawthorne fault scenario; 100% load surge at Hawthorne (simulating DG tripping)
Report – CETC 2006-089 (TR) 52 March, 2006
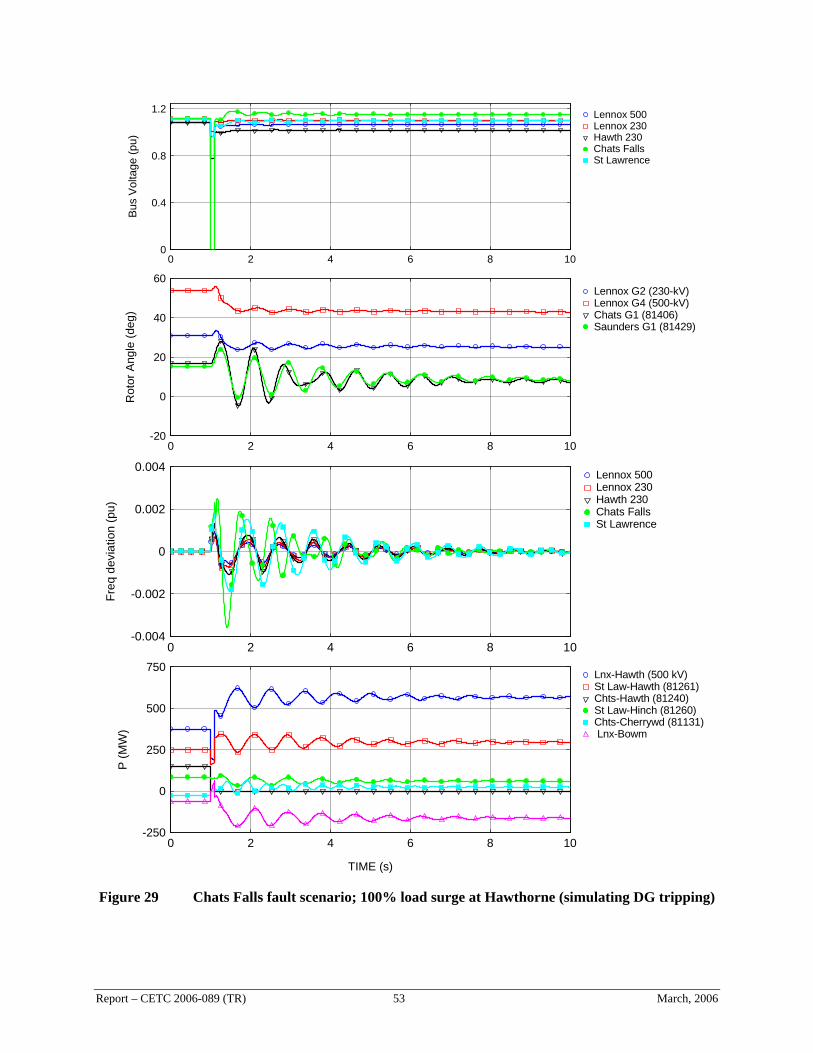
-250
0
250
500
750
0 2 4 6 8 10
Lnx-Hawth (500 kV)St Law-Hawth (81261)Chts-Hawth (81240)St Law-Hinch (81260)Chts-Cherrywd (81131) Lnx-Bowm
TIME (s)
P (M
W)
-0.004
-0.002
0
0.002
0.004
0 2 4 6 8 10
Lennox 500Lennox 230Hawth 230Chats FallsSt Lawrence
Freq
dev
iatio
n (p
u)
-20
0
20
40
60
0 2 4 6 8 10
Lennox G2 (230-kV)Lennox G4 (500-kV)Chats G1 (81406)Saunders G1 (81429)
Rot
or A
ngle
(deg
)
0
0.4
0.8
1.2
0 2 4 6 8 10
Lennox 500Lennox 230Hawth 230Chats FallsSt Lawrence
Bus
Volta
ge (p
u)
Figure 29 Chats Falls fault scenario; 100% load surge at Hawthorne (simulating DG tripping)
Report – CETC 2006-089 (TR) 53 March, 2006
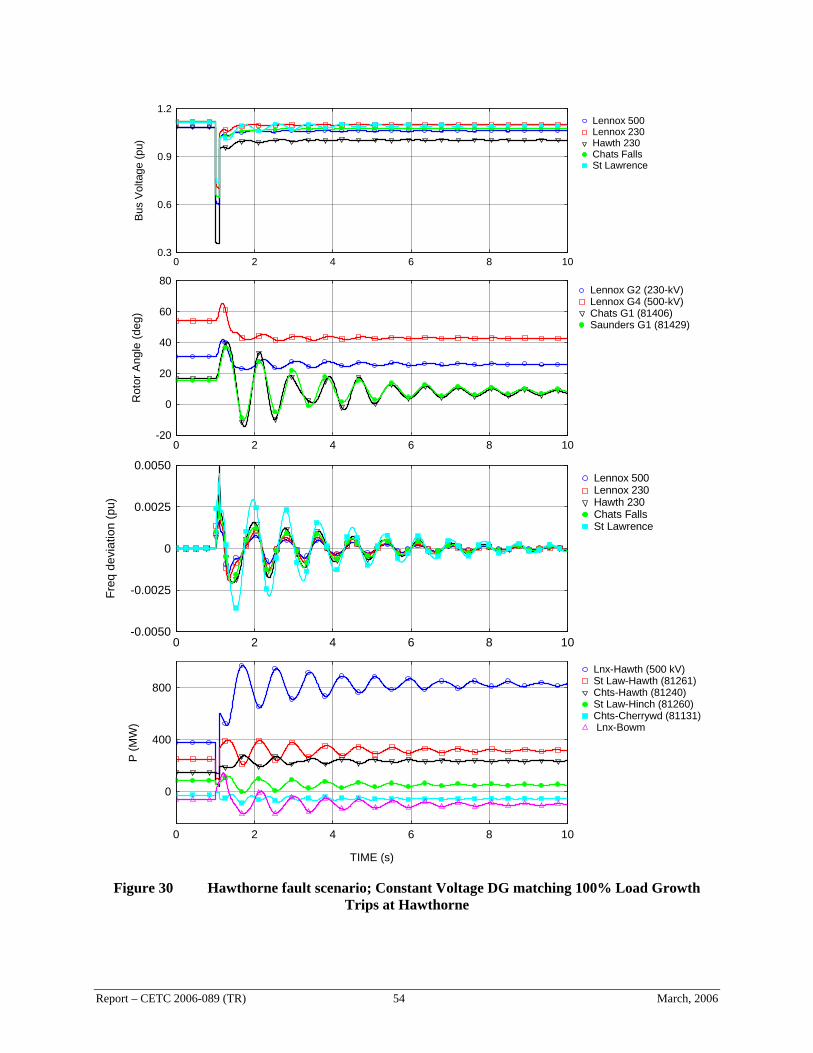
-0.0050
-0.0025
0
0.0025
0.0050
0 2 4 6 8 10
Lennox 500Lennox 230Hawth 230Chats FallsSt Lawrence
Freq
dev
iatio
n (p
u)
-20
0
20
40
60
80
0 2 4 6 8 10
Lennox G2 (230-kV)Lennox G4 (500-kV)Chats G1 (81406)Saunders G1 (81429)
Rot
or A
ngle
(deg
)
0
400
800
0 2 4 6 8 10
Lnx-Hawth (500 kV)St Law-Hawth (81261)Chts-Hawth (81240)St Law-Hinch (81260)Chts-Cherrywd (81131) Lnx-Bowm
TIME (s)
P (M
W)
0.3
0.6
0.9
1.2
0 2 4 6 8 10
Lennox 500Lennox 230Hawth 230Chats FallsSt Lawrence
Bus
Volta
ge (p
u)
Figure 30 Hawthorne fault scenario; Constant Voltage DG matching 100% Load Growth
Trips at Hawthorne
Report – CETC 2006-089 (TR) 54 March, 2006
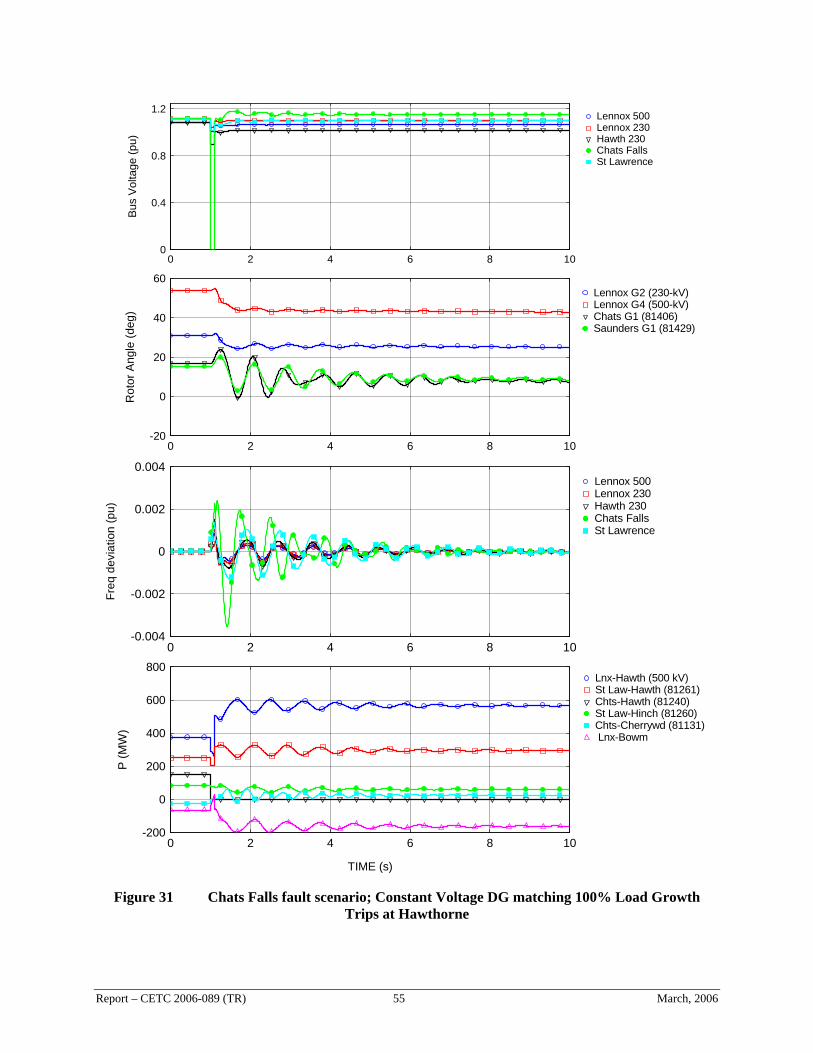
-200
0
200
400
600
800
0 2 4 6 8 10
Lnx-Hawth (500 kV)St Law-Hawth (81261)Chts-Hawth (81240)St Law-Hinch (81260)Chts-Cherrywd (81131) Lnx-Bowm
TIME (s)
P (M
W)
-20
0
20
40
60
0 2 4 6 8 10
Lennox G2 (230-kV)Lennox G4 (500-kV)Chats G1 (81406)Saunders G1 (81429)
Rot
or A
ngle
(deg
)
-0.004
-0.002
0
0.002
0.004
0 2 4 6 8 10
Lennox 500Lennox 230Hawth 230Chats FallsSt Lawrence
Freq
dev
iatio
n (p
u)
0
0.4
0.8
1.2
0 2 4 6 8 10
Lennox 500Lennox 230Hawth 230Chats FallsSt Lawrence
Bus
Volta
ge (p
u)
Figure 31 Chats Falls fault scenario; Constant Voltage DG matching 100% Load Growth
Trips at Hawthorne
Report – CETC 2006-089 (TR) 55 March, 2006
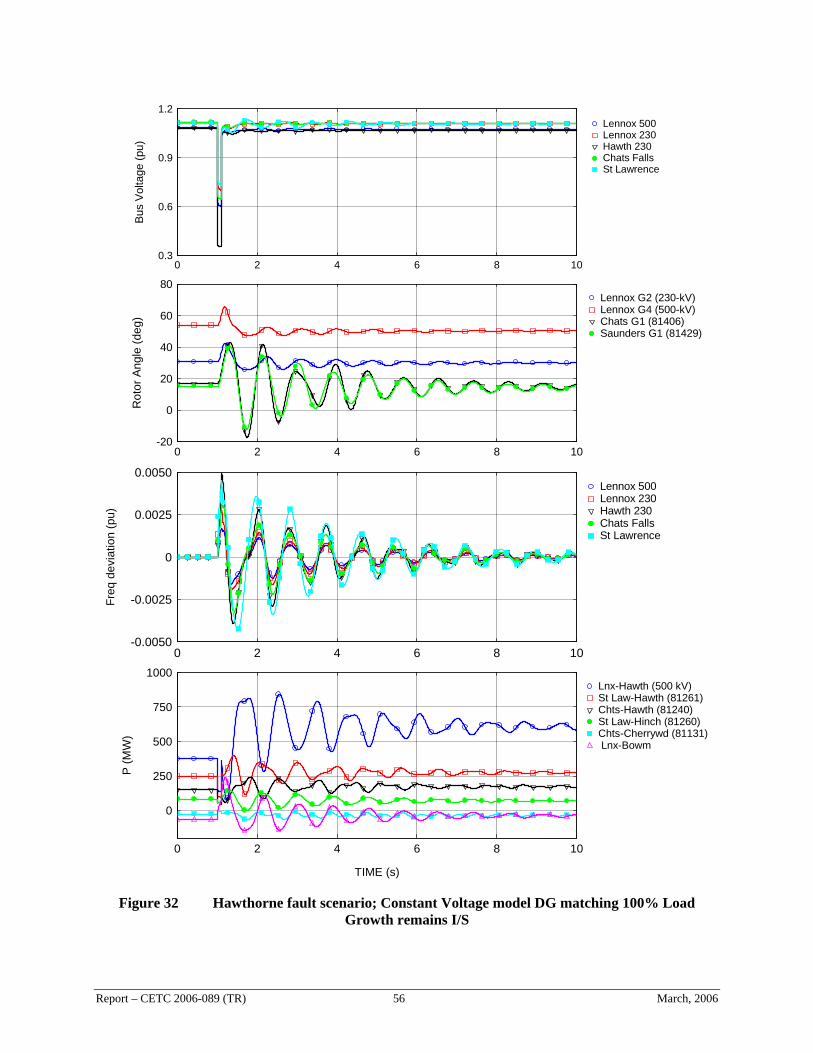
-20
0
20
40
60
80
0 2 4 6 8 10
Lennox G2 (230-kV)Lennox G4 (500-kV)Chats G1 (81406)Saunders G1 (81429)
Rot
or A
ngle
(deg
)
0
250
500
750
1000
0 2 4 6 8 10
Lnx-Hawth (500 kV)St Law-Hawth (81261)Chts-Hawth (81240)St Law-Hinch (81260)Chts-Cherrywd (81131) Lnx-Bowm
TIME (s)
P (M
W)
-0.0050
-0.0025
0
0.0025
0.0050
0 2 4 6 8 10
Lennox 500Lennox 230Hawth 230Chats FallsSt Lawrence
Freq
dev
iatio
n (p
u)
0.3
0.6
0.9
1.2
0 2 4 6 8 10
Lennox 500Lennox 230Hawth 230Chats FallsSt Lawrence
Bus
Volta
ge (p
u)
Figure 32 Hawthorne fault scenario; Constant Voltage model DG matching 100% Load
Growth remains I/S
Report – CETC 2006-089 (TR) 56 March, 2006
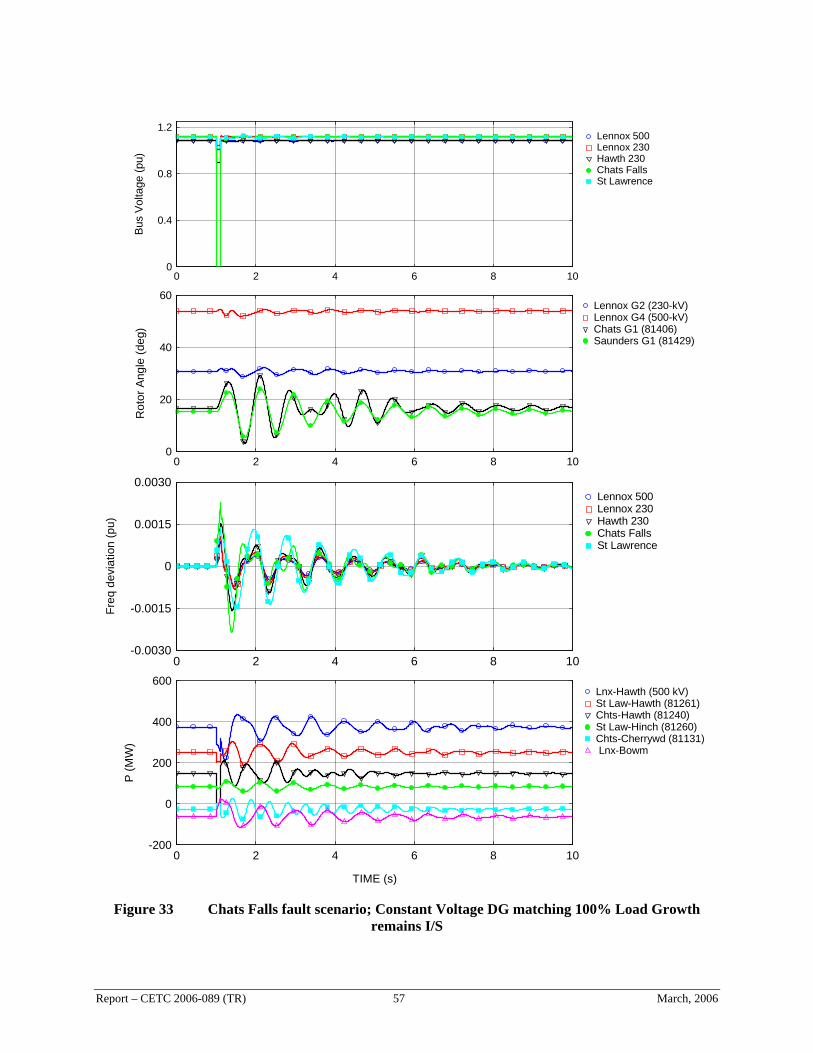
0
20
40
60
0 2 4 6 8 10
Lennox G2 (230-kV)Lennox G4 (500-kV)Chats G1 (81406)Saunders G1 (81429)
Rot
or A
ngle
(deg
)
-0.0030
-0.0015
0
0.0015
0.0030
0 2 4 6 8 10
Lennox 500Lennox 230Hawth 230Chats FallsSt Lawrence
Freq
dev
iatio
n (p
u)
-200
0
200
400
600
0 2 4 6 8 10
Lnx-Hawth (500 kV)St Law-Hawth (81261)Chts-Hawth (81240)St Law-Hinch (81260)Chts-Cherrywd (81131) Lnx-Bowm
TIME (s)
P (M
W)
0
0.4
0.8
1.2
0 2 4 6 8 10
Lennox 500Lennox 230Hawth 230Chats FallsSt Lawrence
Bus
Volta
ge (p
u)
Figure 33 Chats Falls fault scenario; Constant Voltage DG matching 100% Load Growth
remains I/S
Report – CETC 2006-089 (TR) 57 March, 2006
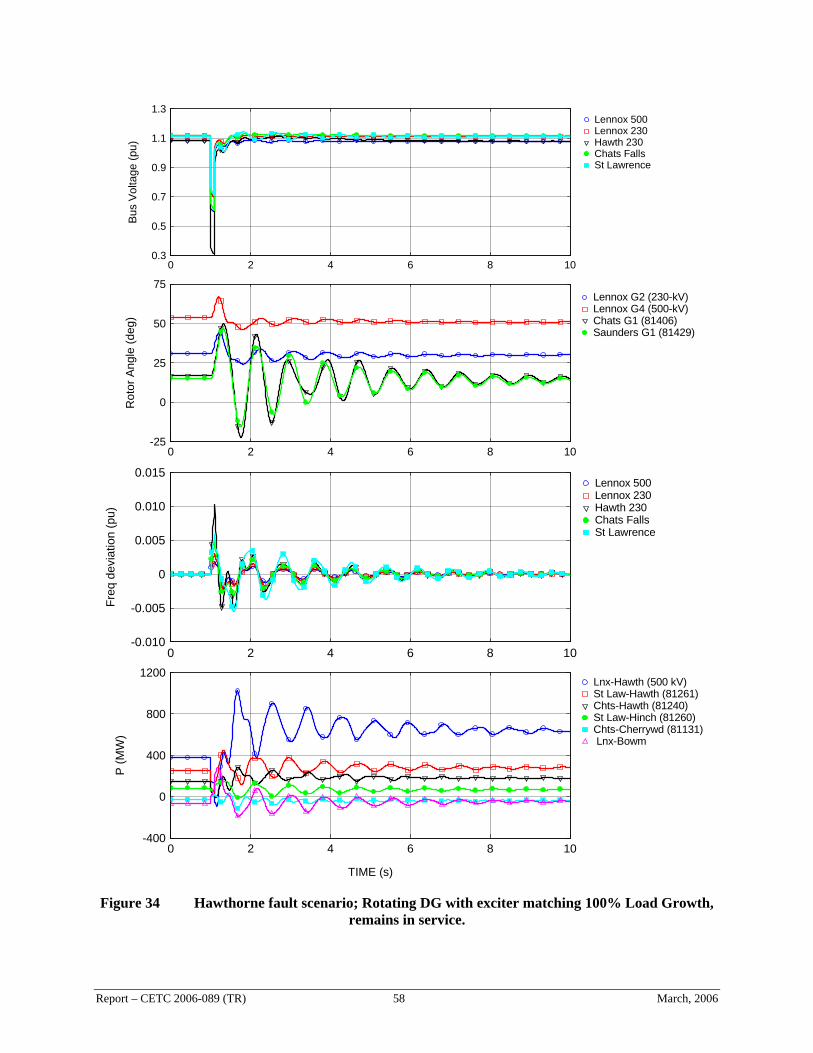
-400
0
400
800
1200
0 2 4 6 8 10
Lnx-Hawth (500 kV)St Law-Hawth (81261)Chts-Hawth (81240)St Law-Hinch (81260)Chts-Cherrywd (81131) Lnx-Bowm
TIME (s)
P (M
W)
-0.010
-0.005
0
0.005
0.010
0.015
0 2 4 6 8 10
Lennox 500Lennox 230Hawth 230Chats FallsSt Lawrence
Freq
dev
iatio
n (p
u)
-25
0
25
50
75
0 2 4 6 8 10
Lennox G2 (230-kV)Lennox G4 (500-kV)Chats G1 (81406)Saunders G1 (81429)
Rot
or A
ngle
(deg
)
0.3
0.5
0.7
0.9
1.1
1.3
0 2 4 6 8 10
Lennox 500Lennox 230Hawth 230Chats FallsSt Lawrence
Bus
Volta
ge (p
u)
Figure 34 Hawthorne fault scenario; Rotating DG with exciter matching 100% Load Growth,
remains in service.
Report – CETC 2006-089 (TR) 58 March, 2006
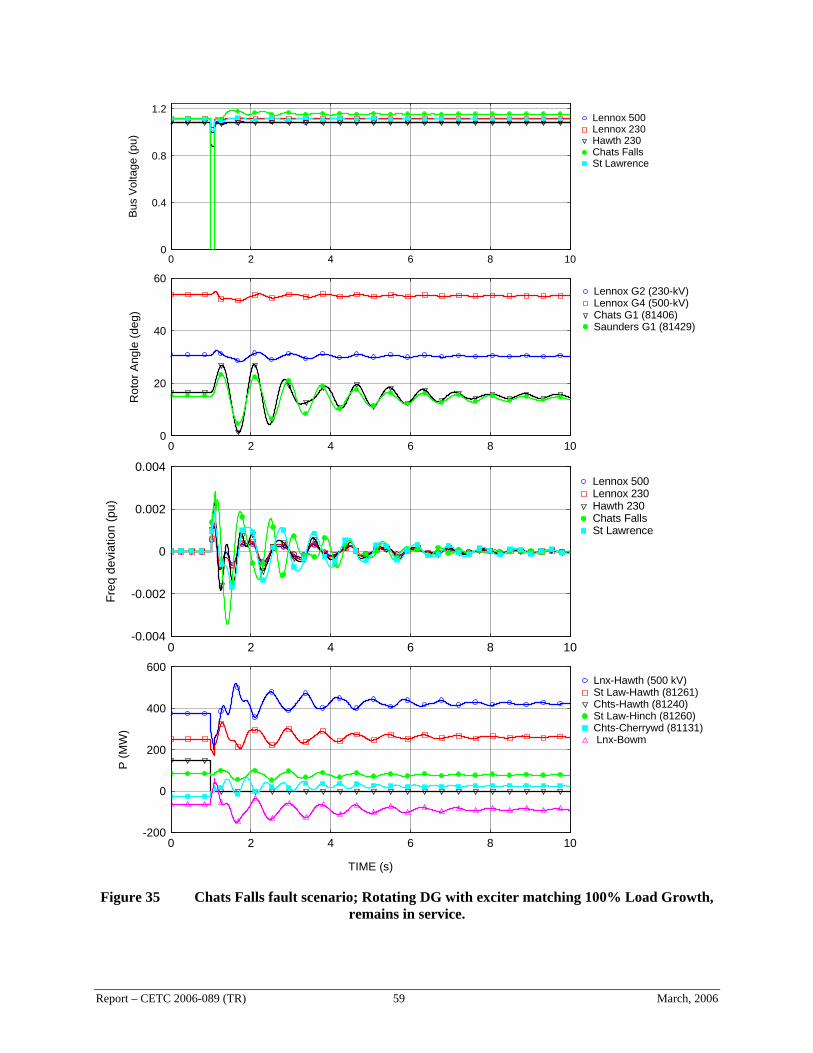
-0.004
-0.002
0
0.002
0.004
0 2 4 6 8 10
Lennox 500Lennox 230Hawth 230Chats FallsSt Lawrence
Freq
dev
iatio
n (p
u)
0
20
40
60
0 2 4 6 8 10
Lennox G2 (230-kV)Lennox G4 (500-kV)Chats G1 (81406)Saunders G1 (81429)
Rot
or A
ngle
(deg
)
-200
0
200
400
600
0 2 4 6 8 10
Lnx-Hawth (500 kV)St Law-Hawth (81261)Chts-Hawth (81240)St Law-Hinch (81260)Chts-Cherrywd (81131) Lnx-Bowm
TIME (s)
P (M
W)
0
0.4
0.8
1.2
0 2 4 6 8 10
Lennox 500Lennox 230Hawth 230Chats FallsSt Lawrence
Bus
Volta
ge (p
u)
Figure 35 Chats Falls fault scenario; Rotating DG with exciter matching 100% Load Growth,
remains in service.
Report – CETC 2006-089 (TR) 59 March, 2006
6 References
[1] IEEE Std 1547-2003. “IEEE Standard for Interconnecting Distributed Resources with Electric Power Systems”, July 2003.
[2] Power System Stability and Control, Prabha Kundur, McGraw Hill Inc, New York, 1994.
[3] Voltage Stability of Electric Power Systems, Van Cutsem T. and Vournas C., Kluwer Academic Publishers, Boston, MA, 1998.
[4] N. Miller and Z. Ye, “Report on Distributed Generation Penetration Study”, NREL/SR-560-34715, August 2003.
[5] IEEE Committee Report, “Transient Stability Test Systems for Direct Stability Methods”, Prepared by the IEEE Stability Test Systems Task Force of the Dynamic System Performance Subcommittee, IEEE T-PAS Vol 7, No 1, February 1992.
[6] J.G. Slootweg et al, “Modeling New Generation and Storage Technologies in Power System Dynamics Simulations”, Presented at 2002 IEEE Power Engineering Society Summer Meeting.
[7] Philip P. Barker and Bradley K. Johnson, “Power System Modeling Requirements for Rotating Machine Interfaced Distributed Resources, Presented at IEEE PES Summer Power Meeting, 2002.
[8] Les Hajagos, “Digital Static Pilot Exciter Test Report – Chats Falls Units 2-5”, Ontario Power Technologies Report 7095-050-1998-RA-0001-R00, November 22, 1999.
[9] R. Berube, “Governor Test Report – Otto Holden GS”, Ontario Power Technologies Report 8264-020-RA-0002-R00, July 28, 2000.
[10] “Excitation System Acceptance Tests – Lambton TGS, Unit G2”, Ontario Power Technologies Report 7095-060-1998-RA-0001-R00, 1998.
[11] W.B. Gish, “Small Induction Generator and Synchronous Generator Constants for DSG Isolation Studies”, IEEE Transactions on Power Delivery, Vol PWRD-1, No 1, April 1986.
[12] IEEE Std 421.5-1992, “Recommended Practice for Excitation System Models for Power System Stability Studies”.
[13] P. Kundur et al, “Application of Power System Stabilizers for Enhancement of Overall System Stability”, IEEE T-PAS Vol 4, No 2, May 1989.
Report – CETC 2006-089 (TR) 60 March, 2006
[14] IEEE Task Force on Load Representation for Dynamic Performance, “Load Representation for Dynamic Performance Analysis”, IEEE Transactions on Power Systems, vol 8, no 2, May 1993.
[15] IEEE Task Force on Load Representation for Dynamic Performance, “Standard Load Models for Power Flow and Dynamic Performance Simulation”, IEEE Transactions on Power Systems, vol 10, no 3, Aug 1995.
[16] Ian A. Hiskens, “Significance of Load Modelling in Power System Dynamics”, X Symposium of Specialists in Electric Operational and Expansion Planning, May 21-25, 2006, Florianopolis, Brasil.
[17] “Document A-2: Basic Criteria for Design and Operation of Interconnected Power Systems”, Northeast Power Coordinating Council, August 1995.
[18] G.K. Morrison et al , “Voltage Stability Analysis Using Static and Dynamic Approaches”, IEEE T-PAS Vol 8, No 3, August 1993.
Report – CETC 2006-089 (TR) 61 March, 2006

Report – CETC 2006-089 (TR) 62 March, 2006
7 Bibliography
7.1 Distribution System Impacts
B1 F.C. Schweppe et al. "Homeostatic Utility Control". IEEE PAS V 99 (1980) n 3 (May) p 1151.
B2 G.L. Park and O.W. Zastrow. "Interconnection Issues Concerning Consumer-Owned Wind Electric Generators". IEEE PAS 101 (1982) n 7 (July) p 2375.
B3 R.C. Dugan, W.T. Jewell and D.J. Roesler. “Harmonics and Reactive Power from Line-Commutated Inverters in Proposed Photovoltaic Subdivision”. IEEE PAS 102 (1983) n 9 (Sep) p 3205.
B4 R.C. Dugan. “Check Dispersed-Generation Harmonics”. Electrical World, Jan 1984 p 75.
B5 R.C. Dugan and D.T. Rizy. "Electric Distribution Protection Problems Associated with the Interconnection of Small Dispersed Generation Devices". IEEE PAS V 103 (1984) n 6 (Jun) p 1121.
B6 M.F. McGranaghan, R.C. Dugan, J.A. King and W.T. Jewell. “Distribution Feeder Harmonic Study Methodology”. IEEE PAS V 103 (1984) n 12 (Dec) p 3663.
B7 D.T. Rizy and W.T. Jewell. “Power Quality and Protection of Electric Distribution Systems with Small, Dispersed Generation Devices”. IEEE 16th Southeastern Symposium on Systems, 1984.
B8 T. Jewell and T. Rizy. “Interconnection Problems Associated with Small Dispersed Electric Generators and Inverter Devices”. ISA Trans V 23 (1984) n 2 p 21.
B9 Paul Longrigg. “Effects on Electrical Distribution Networks of Dispersed Power Generation at High Levels of Connection Penetration”. International Journal of Ambient Energy V 13 (1992) n 4 (Oct) p 199.
B10 D. Kundu. "Technical Requirements to Connect Parallel Generators to the Ontario Hydro Distribution Electrical System", IEEE Energy Conversion, V 7 (1992) n 1 (Mar) p 8.
B11 M.F. McGranaghan et al. “Impact of Utility Switched Capacitors on Customer Systems – Magnification at Low Voltage Capacitors”. IEEE PAS V 7 (1992) n 2 (Apr) p 862.
Report – CETC 2006-089 (TR) 63 March, 2006
B12 D. Kundu et al. "Electrical Impact of a Nug Under 5 MW Rating When Connected to a Distribution Feeder with Various Transformer Connections". IEEE Industrial and Commercial Power Systems Technical Conference, Irvine Ca, 1994.
B13 A. Bagnasco et al. “Management and Dynamic Performances of Combined Cycle Power Plants During Parallel and Islanding Operations”. IEEE EC V 13 (1998) n 2 (Jun) p 194.
B14 J.L. Keopfinger. "Barriers to Interconnection of Distributed Generation and Other Issues". Presentation to EEI Distributed Resources Task Force, Chicago, Jun 1998.
B15 M.W. Davis. “System Protection Options and Relative Costs”. Presentation to EEI Distributed Resources Task Force, Chicago, Jun 1998.
B16. P. Barker, T. Leskan, H. Zaininger and D. Smith, “Integration of Distributed Resources in Electric Utility Systems: Current Interconnection Practice and Unified Approach” EPRI TR-111489, Nov 1998.
B17. E.P. Dick et al, “Integration of Distributed Resources in the Electric Utility Distribution Systems: Distribution System Behavior Analysis for Suburban Feeder”, EPRI TR 111490, Nov 1998.
B18. E.P. Dick, R.W. Beresh and R.D. Quick, “Integration of Distributed Resources in the Electric Utility Distribution Systems: Distribution System Behavior Analysis for Urban and Rural Feeders”, EPRI TR 112737, Nov 1999.
B19. M. Davis, D. Costyk and A. Narang. “Distributed and Electric Power System Aggregation Model and Field Configuration Equivalency Validation Testing”. National Renewable Energy Laboratory Report 560-33909, July 2003.
B20. G.L. Campen. “Results of the Harmonics Measurement Program at the John F. Long Photovoltaic House”. Oak Ridge National Lab report ORNL-5838, 1982.
7.2 Industry Standards
B21 ANSI/IEEE Std 929-1988. "IEEE Recommended Practice for Utility Interface of Residential and Intermediate Photovoltaic (PV) Systems." May 1987.
B22 ANSI/IEEE Std 1021-1988. "Recommended Practice for Utility Interconnection of Small Wind Energy Conversion Systems". May 1987.
B23 ANSI/IEEE Std 1001-1988. "IEEE Guide for Interfacing Dispersed Storage and Generation Facilities with Electric Utility Systems." Apr 1989.
Report – CETC 2006-089 (TR) 64 March, 2006
B24 ANSI/IEEE Std 1035-1989. "IEEE Recommended Practice: Test Procedure for Utility-Interconnected Static Power Converters", Jun 1989.
B25 IEEE C37.95-1989. "IEEE Guide for Protective Relaying of Utility-Consumer Interconnections." Jun 1989.
B26 ANSI C84.1-1989. “American National Standard for Electric Power Systems and Equipment – Voltage Ratings (60 Hertz), New York, 1989.
B27 IEEE. "National Electrical Safety Code Handbook". A discussion of Grounding Rules, General Rules and Parts 1 to 4 of the 1990 Edition of the National Electrical Safety Code.
B28 IEC Std 1000-2-2. “Electromagnetic Compatibility, Part 2: Environment, Section 2: Compatibility levels for low-frequency conducted disturbances and signalling in public low-voltage power supply systems”. CEI 1990.
B29 IEEE Std 1094-1991. "Recommended Practice for the Electrical Design and Operation of Windfarm Generating Stations". Apr 91.
B30 IEEE Std 519-1992. "Recommended Practices and Requirements for Harmonic Control in Electrical Power Systems". Jan 93.
B31 ANSI/IEEE Std C2-1993. "National Electrical Safety Code".
B32 National Fire Protection Association. "National Fire Codes". Volume 3 covering electrical equipment, 1996 Edition.
B33 D.S. Dorr. “Evolution of the New CMEMA Curve”. EPRI Power Electronics Applications Center, Knoxville Tennessee, 1996.
B34. IEEE Std 1547-2003. “IEEE Standard for Interconnecting Distributed Resources with Electric Power Systems”, July 2003.
7.3 Utility Standards
B35 D. Kundu. "Technical Requirements to Connect Parallel Generating Systems to the Ontario Hydro Distribution Electricity System." Ontario Hydro Distribution Planning and Design report 1900p46, Jan 1988.
B36 Brad King. "An Outline of Idaho Power Co Cogeneration and Small Power Producers (CSPP) Protection Requirements". Report to Northwest Power Pool Meeting, Boise Idaho, Sep 1988 with notes added Feb 1998.
Report – CETC 2006-089 (TR) 65 March, 2006
B37 Ohio Edison/Penn Power. “General Conditions for Interconnection of Customer-Owned Generation With the Ohio Edison System”. Revision 2, Apr 1996.
7.4 Major Reports
B38 A.B. Sturton Consultants, Inc. "Preliminary Survey on Connection of Dispersed Generation at the Distribution Level." Canadian Electrical Association report SD-128, May 1981, 50 p.
B39 IEEE Power Engineering Society Tutorial. "Intertie Protection of Consumer-Owned Source of Generation, 3 MVA or Less." Power System Relaying Committee report 88TH0224-6-PWR, 1988, 33 p.
B40 Gulachenski et al. “Photovoltaic Generation Effects on Distribution Feeders”. EPRI Report El-6754s Vol 2, Sep 1991, 139 p.
B41 D.C. Blackburn, Jr. et al. "Static Power Converters of 500 kW or less Serving as the Relay Interface Package for Non-Conventional Generators." IEEE Power System Relay Committee report TH 5975, Feb 1993, 50 p.
B42 A.B. Sturton, S. Otal, J. Carr. "Connecting Small Generators to Utility Distribution Systems." Canadian Electrical Association Report 128 D 767, Jun 1994, ~200 p.
B43 R.C. Dugan and G. Ball. "Engineering Handbook for Dispersed Energy Systems on Utility Distribution Systems". EPRI Report TR 105 589, Nov 1995, 125 p.
B44 J.B. Cardell and M. Illic. “The Control and Operation of Distributed Generation in a Competitive Electric Market". Chapter 12 of: M. Ilic, F. Galiana, C. Fink. “Power Systems Restructuring – Engineering and Economics”. Kluwer Academic Press, Boston, 1998, 65 p.
B45 E. Wong et al. “Collaborative Report and Action Agenda”. California Alliance for Distributed Energy Resources, Jan 1998, ~ 250 p.
B46 P. Barker et al. “Distributed Resources Interconnection Guidelines and Recommended Practices”. EPRI Report, Mar 1998.
Report – CETC 2006-089 (TR) 66 March, 2006