clean filament winding: process optimisation - etheses repository
TRANSCRIPT
CLEAN FILAMENT WINDING:
PROCESS OPTIMISATION
by
NICHOLAS EDWARD HARRY
SHOTTON-GALE
A thesis submitted to
The University of Birmingham
for the degree of
DOCTOR OF PHILOSOPHY
School of Metallurgy and Materials
Sensors and Composites Group
The University of Birmingham
Dec 2012

University of Birmingham Research Archive
e-theses repository This unpublished thesis/dissertation is copyright of the author and/or third parties. The intellectual property rights of the author or third parties in respect of this work are as defined by The Copyright Designs and Patents Act 1988 or as modified by any successor legislation. Any use made of information contained in this thesis/dissertation must be in accordance with that legislation and must be properly acknowledged. Further distribution or reproduction in any format is prohibited without the permission of the copyright holder.
i
ABSTRACT
This thesis reports on a modified wet-filament winding method, termed ‘clean
filament winding’, which was developed to address multiple issues associated
with the conventional method. The modified method comprised of a resin
dispensing unit, static mixer and resin impregnation unit; these were
incorporated to replace the practice of commonly used resin baths. Adaptations
and developments of this method, such as impregnation modelling, fibre
spreading and composite recycling were also used to further enhance the
process.
It was shown that the modified method was able to produce filament wound
tubes with comparable (or superior) mechanical properties when compared the
conventional technique. It was also shown that the modified method had
considerable economic viability whilst providing substantial environmental
impact reductions. These results were attributed to the use of a patented resin
impregnation method which reduced the amount of waste resin, solvent for
cleaning and production-time needed to fabricate filament wound components.
This thesis concludes with details of a closed-loop composites recycling site-
trial. Here, waste-fibre materials were used to manufacture filament wound
tubes as replacements for cardboard tubes for the storage of glass-fibre fabrics.

ii
DEDICATION
On completing this thesis, I would like to thank my mother for her
passion, my father for his drive, my sister for her support and my
girlfriend for her companionship. It was all truly appreciated.
iii
ACKNOWLEDGEMENTS
The author wishes to offer his gratitude to Professor Gerard F Fernando for his
continued support and drive throughout this research project. It was also truly
appreciated.
This research would also not have been possible without the considerable
support provided by Dr Surya Pandita, Mark Paget, Dr Venkata Machavaram,
Sebastian Ballard, Dr Ramani Mahendran, Dr Liwei Wang, Frank Biddlestone
and Dr Stephen Kukureka.
The financial and technical support provided by the Engineering and Physical
Sciences Research Council (EPSRC), Technology Strategy Board (TSB) and
E3 Comp (Halyard Precision Composites, Pultrex, Dispensing Liquid, Huntsman
Advanced Materials, PPG and PD-Interglas) is also duly acknowledged.
iv
TABLE OF CONTENTS
Page
Table of Contents iv
List of Figures ix
List of Tables xvii
List of Publications xix
Glossary xxi
1 Introduction 1
1.1 Introduction to Filament Winding 1
1.2 Issues and Constraints Associated with Conventional 5
Filament Winding
1.3 Aims and Objectives 7
2 Literature Review 10
2.1 Filament Winding 11
2.2 Impregnation Modelling 25
2.2.1 Impregnation Modelling: Permeability 27
2.2.2 Impregnation Modelling: Dimensions of Fibre Bundles 30
2.2.3 Impregnation Modelling: Viscosity of Resin 31
2.2.4 Impregnation Modelling: Pressure 31
2.3 Fibre Spreading 34
2.3.1 Patent Review on Fibre Spreading Techniques 36
v
2.3.1.1 Mechanical Techniques for Fibre Spreading 37
2.3.1.2 Gas-based Techniques for Fibre Spreading 41
2.3.2 Summary of Fibre Spreading Review 43
2.4 EU Directives and Waste Disposal Legislation 44
2.5 Review of Thermoset Composite Recycling Methods 46
2.5.1 Thermal Composite Recycling Methods 46
2.5.2 Mechanical Composite Recycling Methods 50
2.5.3 Chemical Composite Recycling Methods 51
2.5.4 Re-use Composite Recycling Methods 52
2.6 Life Cycle Assessment (LCA) 53
2.6.1 Development of LCA as an Assessment Tool 53
2.6.2 Review of LCA studies 55
2.7 Conclusion of the Literature Review 62
3. Experimental 64
3.1 Materials and Equipment 64
3.1.1 Reinforcing Fibres 64
3.1.2 Resin and Hardener 69
3.1.3 Manufacturing Equipment 70
3.1.3.1 Clean Filament Winding (CFW) 70
3.1.3.2 Conventional Filament Winding 78
3.1.4 Analysis Equipment 79
3.2 Calibration of the Resin Dispensing Unit 80
3.3 Development of a Clean Filament Winding Resin 81
Impregnation Unit
vi
3.3.1 Application of Impregnation Modelling 83
3.4 Fibre Spreading during Clean Filament Winding 86
3.5 Filament Winding Trials 89
3.5.1 In-house Clean Filament Winding 90
3.5.2 On-site Clean Filament Winding 90
3.5.3 Conventional Filament Winding 91
3.5.4 In-house Recycled-Clean Filament Winding 92
3.5.5 On-site Recycled-Clean Filament Winding 93
3.5.6 Manufacture of Composite Overwrapped 94
Pressure Vessels (COPVs)
3.6 Evaluation Methods 97
3.6.1 Image Analysis 97
3.6.2 Resin Burn-off: Fibre Volume Fraction and Void Content 97
3.6.3 Hoop Tensile (Split-Disk) Strength 98
3.6.4 Inter-laminar Shear Strength 99
3.6.5 Lateral Compression Strength 100
3.6.6 Pressure Burst Strength of COPV’s 101
3.6.7 Life Cycle Assessment (LCA) 102
3.6.7.1 Filament Winding LCA Template 105
3.6.8 Life Cycle Cost (LCC) 109
3.6.8.1 Life Cycle Cost of Filament Winding Methods 109
4. Results and Discussion 112
4.1 Materials 112
4.1.1 Reinforcing Fibres 112
vii
4.1.2 Resin and Hardener 121
4.2 Clean Filament Winding 122
4.3 Recycled-Clean Filament Winding 124
4.4 Calibration of the Resin Dispensing Unit 127
4.5 Development of a Clean Filament Winding Resin 131
Impregnation Unit
4.5.1 Application of Impregnation Modelling 133
4.6 Fibre Spreading during Clean Filament Winding 136
4.7 Filament Winding Trials 140
4.7.1 In-house Clean Filament Winding 140
4.7.2 On-site Clean Filament Winding 142
4.7.3 Conventional Filament Winding 146
4.7.4 In-house Recycled-Clean Filament Winding 149
4.7.5 On-site Recycled-Clean Filament Winding 153
4.7.6 Manufacture of Composite Overwrapped 157
Pressure Vessels (COPVs)
4.8 Evaluation Methods 159
4.8.1 Resin Burn-off: Fibre Volume Fraction and Void Content 159
4.8.2 Hoop Tensile (Split-disk) Strength 166
4.8.3 Inter-laminar Shear Strength 173
4.8.4 Lateral Compression Strength 179
4.8.5 Pressure Burst Strength of Composite Overwrapped
Pressure Vessels (COPVs) 188
4.8.6 Life Cycle Assessment (LCA) 191
viii
4.8.7 Life Cycle Cost (LCC) 197
4.8.8 Site-trial of Waste-fibre Tubes 205
5. Conclusions 207
5.1 Recommendations for Future Research 210
6. Appendix 212
6.1 Appendix A: Alternative Mechanical Spreading Methods 212
6.2 Appendix B: Testing Load/Displacement Curves 217
7. List of Definitions and/or Abbreviations 219
8. References 223
ix
LIST OF FIGURES
Figure 1. Schematic illustration of the conventional filament winding process.
Figure 2. Multi-component filament winding. Here, four carbon fibre pressure
vessels (A) are filament wound simultaneously.
Figure 3. A schematic view of meniscus shaped flow advancement.
Figure 4. A diagram showing void formation caused by differential macropore
and micropore flow.
Figure 5. Image of a composite test piece after hoop tensile (split-disk) strength
testing.
Figure 6. Image showing the hoop tensile (split-disk) testing procedure employed
by Sobrinho et al.
Figure 7. Image of a failed hoop tensile (split-disk) testing sample presented by
Sobrinho et al.
Figure 8. Schematic illustration presenting an overview of the various models
that were considered for the design of the resin impregnation unit.
Figure 9. Capillary pressure plotted against fibre volume fraction.
Figure 10. Regions of behaviour in pin impregnation: (1) entry; (2)
impregnation; (3) contact; and (4) exit.
Figure 11. An illustration of fibre spreading. (A) An un-spread fibre bundle; and
(B) a spread fibre bundle. Here w and To are the fibre bundle width and
thickness respectively.
Figure 12. Simulation of the effect of fibre spreading on fibre bundle thickness.
x
Figure 13. Schematic illustration of mechanical fibre spreading (transverse
view). (A) fibre tow; and (B) spreading pin.
Figure 14. Schematic illustration of mechanically-induced fibre spreading
(idealised view): (a) before fibre spreading; and (b) after fibre spreading.
Figure 15. Schematic illustration of an ‘S-wrap’ fibre spreading set-up.
Figure 16. Schematic illustration of gas-based fibre spreading. The highlighted
components are: (A) spreading fixtures; and (B) spread fibres.
Figure 17. Schematic diagram of side-vacuum gas-based fibre spreading.
Figure 18. Overview of recycling processes.
Figure 19. Photograph of the as-received E-glass fibres on conventional
bobbins.
Figure 20. Photograph of the waste slittings showing the relative dimensions of
the warp and weft fibres.
Figure 21. Photograph of a fibre bobbin with waste slittings.
Figure 22. Photograph of direct-loom waste fibres showing the relative
dimensions of the warp and weft fibres.
Figure 23. Photograph of a bobbin with direct-loom waste.
Figure 24. Schematic illustration of the clean filament winding process.
Figure 25. Photograph of: (A) a static mixer; and (B) a static mixing element.
Figure 26. Schematic illustration of the clean filament winding resin delivery
system.
Figure 27. Photographs of: (a) the air circulating oven; and (b) the mandrel
extraction system used during the in-house CFW trials.
xi
Figure 28. Photograph of the conventional 2-axis filament winding machine
used during the industrial site trials in Portsmouth, UK.
Figure 29. Photograph of the retrofitted CFW equipment onto the conventional
2-axis filament winding machine.
Figure 30. Photographs of: (a) the oven; and (b) the mandrel extraction unit
used during the site trials.
Figure 31. Photograph of the conventional filament winding resin bath.
Figure 32. Schematic illustration of the resin impregnation unit.
Figure 33. Mechanical fibre spreading station.
Figure 34. Photograph of the custom-made bobbins used during the industrial
site-trials.
Figure 35. Photograph of aluminium COPV liners.
Figure 36. Photographs of: (a) custom-made end-fittings; and (b) an aluminium
liner held in-place on the in-house filament winding machine.
Figure 37. Photograph of the hoop-tensile test fixture.
Figure 38. Photograph of the inter-laminar shear test fixture.
Figure 39. Photograph of the lateral compression test fixture with a cardboard
tube ring in-situ.
Figure 40. Schematic illustration of the COPV pressure burst test method.
Figure 41. Photographs of: (a) a steel end-nozzle mounted on a COPV; (b) the
controlling unit for the high-pressure hydrostatic water pump; and (c) the
underground water chamber.
Figure 42. Schematic illustration of the LCA template developed during this
study.
xii
Figure 43. LCA Level-3 plan: Input transportation.
Figure 44. LCA Level-2 plan: Filament winding.
Figure 45. LCA Level-2 plan: Cleaning operation.
Figure 46. LCA Top-level plan: Filament winding.
Figure 47. Image analysis micrographs of in-house CFW tube sections.
Figure 48. Image analysis micrographs of conventional filament wound tube
sections.
Figure 49. Image analysis micrographs of on-site CFW tube sections (7 m/min).
Figure 50. Image analysis micrographs of on-site CFW tube sections
(21 m/min).
Figure 51. Image analysis micrographs of in-house R-CFW (waste slittings)
tube sections.
Figure 52. SEM micrographs of the waste slittings (x50 magnification).
Figure 53. SEM micrographs of the waste slittings (x100 magnification).
Figure 54. SEM micrographs of the waste slittings (x500 magnification).
Figure 55. Photographs of varying quality waste slittings.
Figure 56. Image analysis micrographs of R-CFW (direct-loom waste) tube
sections.
Figure 57. SEM micrographs of the direct-loom waste (x50 magnification).
Figure 58. SEM micrographs of the direct-loom waste (x100 magnification).
Figure 59. SEM micrographs of the direct-loom waste (x500 magnification).
Figure 60. Photographs of varying quality direct-loom waste fibres.
Figure 61. Cardboard tube in-use.
Figure 62. Photographs of end-of-life deformed cardboard tubes.
xiii
Figure 63. Comparison of measured and “predicted” volumes of the epoxy
resin (LY3505) at four dispensing rates.
Figure 64. Comparison of measured and “predicted” volumes of the amine
hardener (XB3403) at four dispensing rates.
Figure 65. Comparison of measured and “predicted” volumes of the
epoxy/amine resin system (LY3505/XB3403) at 12.5 rpm.
Figure 66. Simulation of the model proposed by Foley and Gillespie.
Figure 67. Simulation of the model proposed by Gaymans and Wevers.
Figure 68. A response plot showing the influence of Level 1 and Level 2
variations on the four input parameters.
Figure 69. Photograph showing: (A) an as-received fibre tow; and (B) a fibre
tow after fibre spreading.
Figure 70. A graph showing the effect of fibre tow thickness variations on the
transverse impregnation rates.
Figure 71. Photographs of: (a) a filament wound tube in production via the in-
house CFW method; and (b) an example CFW tube.
Figure 72. Photographs of: (a) the spreading station and resin impregnation
unit in-use during the on-site trials: (b) impregnated fibre tows being applied to a
rotating mandrel (106 mm diameter); and (c) a 1.5 m on-site CFW tube.
Figure 73. Photographs of: (a) the resin-bath used during conventional filament
winding; (b) the impregnated fibres being wound on to the rotating mandrel; and
(c) a 1.5 m conventional filament wound tube.
Figure 74. Photographs highlighting the issues associated with conventional
filament winding.
xiv
Figure 75. Photographs of: (a) a 100 mm inner-diameter waste slittings tube
manufactured by the in-house R-CFW method; and (b) two 100 mm inner-
diameter direct-loom waste tubes manufactured by the in-house R-CFW
method.
Figure 76. Photographs of the hoop-wound waste slittings tube during on-site
production.
Figure 77. Photographs of the hoop-wound waste slittings tube.
Figure 78. Photographs of the angle-wound waste slittings tube during on-site
production.
Figure 79. Photographs of the angle-wound waste slittings tube.
Figure 80. Comparison of hoop-wound and angle-wound wall thickness
dimensions of on-site R-CFW tubes.
Figure 81. Photograph of the COPVs manufactured with the in-house CFW
method.
Figure 82. Fibre volume fraction and void content results.
Figure 83. Conventional filament wound tube sections with an outer surface
resin film present.
Figure 84. Summary of hoop tensile (split-disk) strength results.
Figure 85. Photographs of hoop tensile (split-disk) failed samples manufactured
by the in-house CFW process.
Figure 86. Photographs of hoop tensile (split-disk) failed samples.
Figure 87. Photograph and SEM images of a failed waste slittings hoop tensile
(split-disk) test sample.
xv
Figure 88. Photograph and typical SEM images of a failed direct-loom waste
hoop tensile (split-disk) test sample.
Figure 89. Summary of inter-laminar shear strength results.
Figure 90. Photographs of inter-laminar shear failed samples; in-house CFW
samples.
Figure 91. Photographs of inter-laminar shear failed samples.
Figure 92. Photographs of inter-laminar shear failed samples; R-CFW (waste
slittings) and R-CFW (direct-loom waste).
Figure 93. Summary of lateral compression strength results.
Figure 94. Photographs of failed lateral compression samples; in-house CFW.
Figure 95(a). Photographs of failed lateral compression samples: conventional
filament winding.
Figure 95(b). Photographs of failed lateral compression samples: on-site CFW
(7 m/min).
Figure 95(c). Photographs of lateral compression failed samples: on-site CFW
(21 m/min).
Figure 96. Photographs of lateral compression failed samples.
Figure 97. Photograph of the lateral compression test fixture.
Figure 98. Pressure burst strengths of overwrapped COPVs.
Figure 99. Photographs of burst COPV’s.
Figure 100. Radar plot comparing the environmental impact potentials of
conventional and CFW.
Figure 101. Radar plot comparing the environmental impact potentials of
conventional, CFW and R-CFW (waste slittings).
xvi
Figure 102. Radar plot comparing the environmental impact potentials of
conventional, CFW and R-CFW (DLW).
Figure 103. Overall environmental impact reductions achieved by the CFW
and R-CFW methods in comparison to conventional filament winding.
Figure 104. Life cycle cost output data.
Figure 105. Life cycle cost simulations for R-CFW (WS): ‘expensive’.
Figure 106. Life cycle cost simulations for R-CFW (WS): ‘intermediate’.
Figure 107. Life cycle cost simulations for R-CFW (WS): ‘cheap’.
xvii
LIST OF TABLES
Table 1. Overview of filament winding components and manufacturers.
Table 2. Summary of mandrel systems used during filament winding.
Table 3. A summary of test methods used to assess filament wound composites.
Table 4. Comparison of fibre volume fractions produced by composite
manufacturing methods.
Table 5. An overview of selected publications on hoop tensile strengths.
Table 6. Summary of selected models reported in the literature that considered
axial permeability.
Table 7. Selection of models which predict transverse permeability.
Table 8. Summary of selected papers and patents on fibre spreading methods.
Table 9. A summary of thermal recycling methods and references.
Table 10. Summary of chemical recycling methods and references.
Table 11. Summary of natural fibre LCA studies and references.
Table 12. Summary of selected papers that have discussed the LCA of
materials in the automotive industry.
Table 13. Overall ratings from ‘Green guide to Composites’.
Table 14. Properties of E-glass fibres (EC15 1200 Tex).
Table 15. Input factors for the L16 Taguchi analysis.
Table 16. L16 Taguchi array.
Table 17. LCA input and output data for the production of 10 tubes.
Table 18. LCC input and output data for the production of 10 tubes.
Table 19. Dispensed volumes of the epoxy resin, amine hardener and mixed
epoxy resin (LY3505/XB3403).
xviii
Table 20. Summary results of impregnation modelling.
Table 21. Calculation of the average spreading values from the L16 Taguchi
analysis.
Table 22. ANOVA analysis with a confidence level of 95%.
Table 23. Waste slittings wall thickness data.
Table 24. Relative wall thickness dimensions of the on-site waste-fibre filament
wound tubes.
Table 25. Fibre volume fraction and void content results.
Table 26. Hoop tensile (split-disk) strength results.
Table 27. Inter-laminar shear strength results.
Table 28. Lateral compression strength results.
Table 29. Summary of COPV pressure burst strength results.
Table 30. Potential environmental impact data.
Table 31. Life cycle cost output data for the manufacture of a 3 meter filament
wound tube via: (i) in-house CFW; (ii) conventional filament winding; and (iii) in-
house R-CFW.
Table 32. Simulated life cycle cost output data for On-site R-CFW (WS) with
three winding conditions: (i) ‘expensive’; (ii) ‘intermediate’; and (iii) ‘cheap’.
Table 33. LCC output data for cardboard tubes.
xix
LIST OF PUBLICATIONS
Book chapter:
Shotton-Gale, N., Harris, D., Pandita, S.D., Paget, M.A., Allen, J.A. and
Fernando, G.F. (2010) ‘Clean and environmentally friendly wet-filament winding’
Management, Recycling and Reuse of Waste Composites. Woodhead
Publishing in Materials, Chapter 13, pp. 329-368.
Journal papers:
Pandita, S.D., Irfan, M.S., Machavaram, V.R., Shotton-Gale, N., Mahendran,
R.S., Wait, C.F., Paget, M.A., Harris, D., Leek, C. and Fernando, G.F. (2012) .
(2012) ns: (house CFW; (ii) conventional filament winding; and (iii)Journal of
Composite Materials, pp 1-12.
Irfan, M.R., Machavaram, V.R., Mahendran, R.S., Shotton-Gale, N, Wait, C.F.,
Paget, M.A., Hudson, M. and Fernando, G.F. (2012) do, G.F. (2012) . (2012)
ns: (house CFW; (ii) conept and simulations’‘lateral spreading of a fibre bundle
via mechanical means’ Journal of Composite Materials, Vol 46, Issue 3, pp.
311-330.
Patent:
Fernando, G.F., Pandita, S.D., Paget, M.A. and Shotton-Gale, N. (2011) US
Patent Number: 2011/0300301 A. and ns’ Journal of Composite Materials, Vol 4
xx
Conference proceedings:
Shotton-Gale, N., Pandita, S.D., Paget, M., Wait, C., Allen, J.A., Harris, D. and
Fernando, G.F. (2009) ando, G.F. (2009) Wait, C., Allen, J.A., Harris, D. and
Ferf CompositICCM 17, Edinburgh, Scotland.
Shotton-Gale, N., Paget, M., Smith, C., Jameson, N., Wang, L., Malik, S.,
Burns, J., Biddlestone, F., Prasad, A., Harris, D., Machavaram, V., Mahendran,
R. and Fernando, G.F. (2010) ‘An investigation into techniques to fabricate
highly aligned short-fibre prepregs’ SAMPE Europe, Paris, France.
Smith, C., Shotton-Gale, N., Wait, C., Paget, M., Harris, D., Machavaram, V.,
Wang, L., James, J., Price, R. and Fernando, G.F. (2010) ‘Manufacture and
evaluation of filament wound tubes from loom (weaving) waste’, SAMPE
Europe, Paris, France.
xxi
GLOSSARY
Acidification potential: A reduction in the pH of soil or water as a result of the
transformation of air pollutants into acids.
Autoclaving: A composite manufacturing process which involves the curing of
a component under vacuum and heat simultaneously.
Axial flow: Resin flow in the general direction of the parallel fibres
Curing: A process by which a resin mixture solidifies into a permanent
structure.
Eutrophication potential: Also known as ‘overfertilisation’, is the enrichment of
nutrients in aquatic or terrestrial environments which disrupt the environmental
conditions of numerous ecosystems.
Exotherming: A chemical reaction or process that releases energy, usually in
the form of heat.
Fibre bobbin: A spool for storing continuous reinforcing fibres.
Fibre impregnation: A process where a mixed resin system is applied to a
fibre tow to form a composite component.
Fibre tow (or bundle): A collection of individual fibre filaments in parallel
alignment.
Fibre volume fraction: The percentage of fibre in a composite component.
Freshwater aquatic ecotoxicity potential: The impact of toxic substances
emitted to freshwater aquatic ecosystems.
Global warming potential: The impact of green-house gas emissions on the
environment.
xxii
Human toxicity potential: The impacts on human health produced by toxic
components emitted to the environment.
Macropore flow: Flow of resin between multiple fibre tows.
Mandrel: A forming tool which dictates the shape of a composite.
Marine aquatic ecotoxicity potential: The impact of toxic substances emitted
to marine aquatic ecosystems.
Micropore flow: Flow of resin in-between the individual filaments of a fibre tow.
Ozone layer depletion potential: The ability of a set of chemicals to destroy
ozone gases.
Photochemical ozone creation potential: The production of ozone gases at
ground-level.
Pot-life: The length of time that a mixed resin system remains at a viscosity
which will allow processing.
Resin system: A mixed mass of resin and hardener components.
Stoichiometric ratio: The desired ratio of the individual components of a resin
system.
Terrestric ecotoxicity potential: The emission of toxic chemicals into
terrestrial atmospheres.
Thermoset: A polymeric resin system which forms a hardened plastic material
upon curing.
Transeverse flow: Flow of resin through a tow which is perpendicular to
parallel nature of the fibres.
Void content: The percentage of a composite which consists of air or gas
which has been trapped inside the component.
1
CHAPTER 1: INTRODUCTION
1.1 Introduction to Filament Winding
In recent decades, much attention has been dedicated to the utilisation of fibre
reinforced composites in various engineering sectors [1,2,3]. The desire to use
these materials is based on their high stiffness-to-weight and strength-to-weight
ratios. Due to their popularity in numerous applications [4,5,6], it was estimated
that over 4 million tonnes of fibre-reinforced composites were produced in 2010
[7,8]. Amongst this 4 million tonnes, approximately 300,000 tonnes was
fabricated via a method termed ‘filament winding’ [7,9].
In general, the method of filament winding can be performed with a number of
processing techniques, including: (i) resin bath-based impregnation [10]; (ii)
wet- and dry-tape winding [11,12,13]; (iii) electrostatic deposition [14,15]; (iv)
prepreg winding [4,16]; and (v) laser-assisted impregnation [11,17,18]. The
resin bath-based impregnation method is the predominant technique used in
industry and generally involves the use of thermosetting resin systems [4,5,6].
In this study, the term “resin system” is used to describe an intimately mixed
resin and hardener.
A schematic illustration of conventional wet-filament winding, incorporating a
resin bath-based impregnation process, is shown in Figure 1. With reference to
Figure 1, the reinforcing fibre tows (A) from creels or bobbins (B) are fed
through a tensioning system (C) and into a resin bath (D). Inside the resin
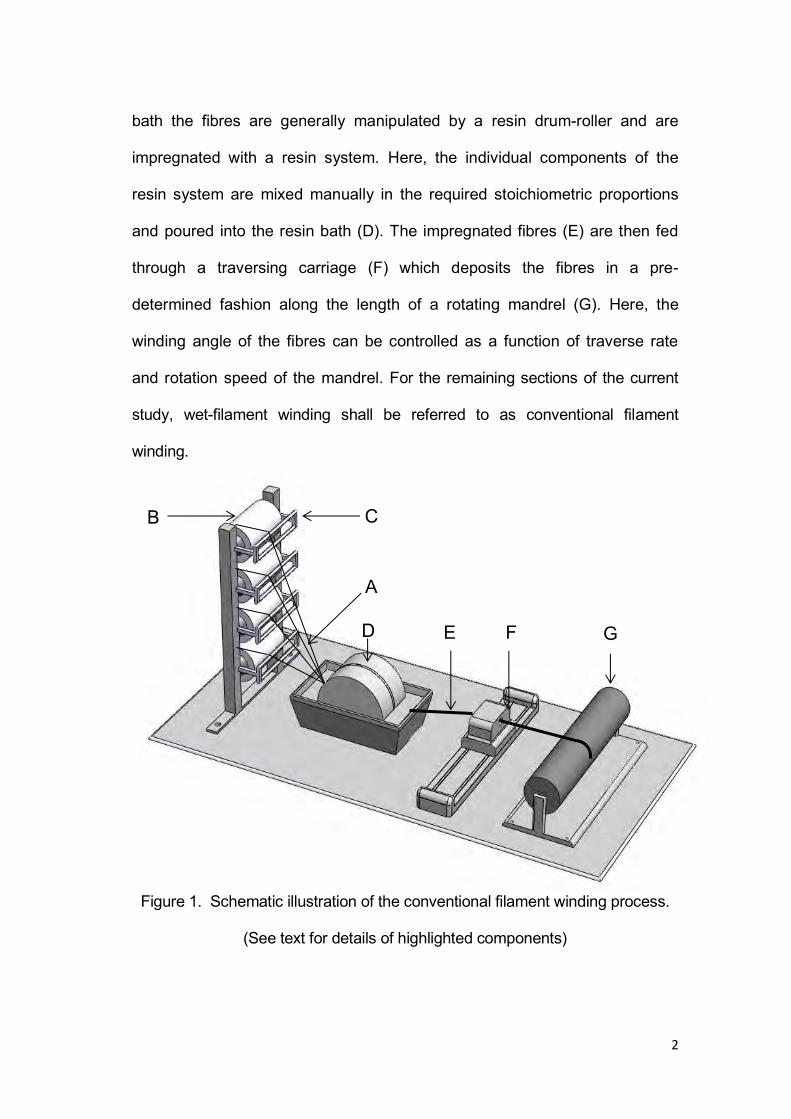
2
bath the fibres are generally manipulated by a resin drum-roller and are
impregnated with a resin system. Here, the individual components of the
resin system are mixed manually in the required stoichiometric proportions
and poured into the resin bath (D). The impregnated fibres (E) are then fed
through a traversing carriage (F) which deposits the fibres in a pre-
determined fashion along the length of a rotating mandrel (G). Here, the
winding angle of the fibres can be controlled as a function of traverse rate
and rotation speed of the mandrel. For the remaining sections of the current
study, wet-filament winding shall be referred to as conventional filament
winding.
Figure 1. Schematic illustration of the conventional filament winding process.
(See text for details of highlighted components)
B
A
D E F G
C
3
Once the required amounts of impregnated fibre are deposited, the assembly is
transferred to an oven and cured. The curing temperature and duration is
dependent on the resin system used. Details of the main components of Figure
1 are discussed below.
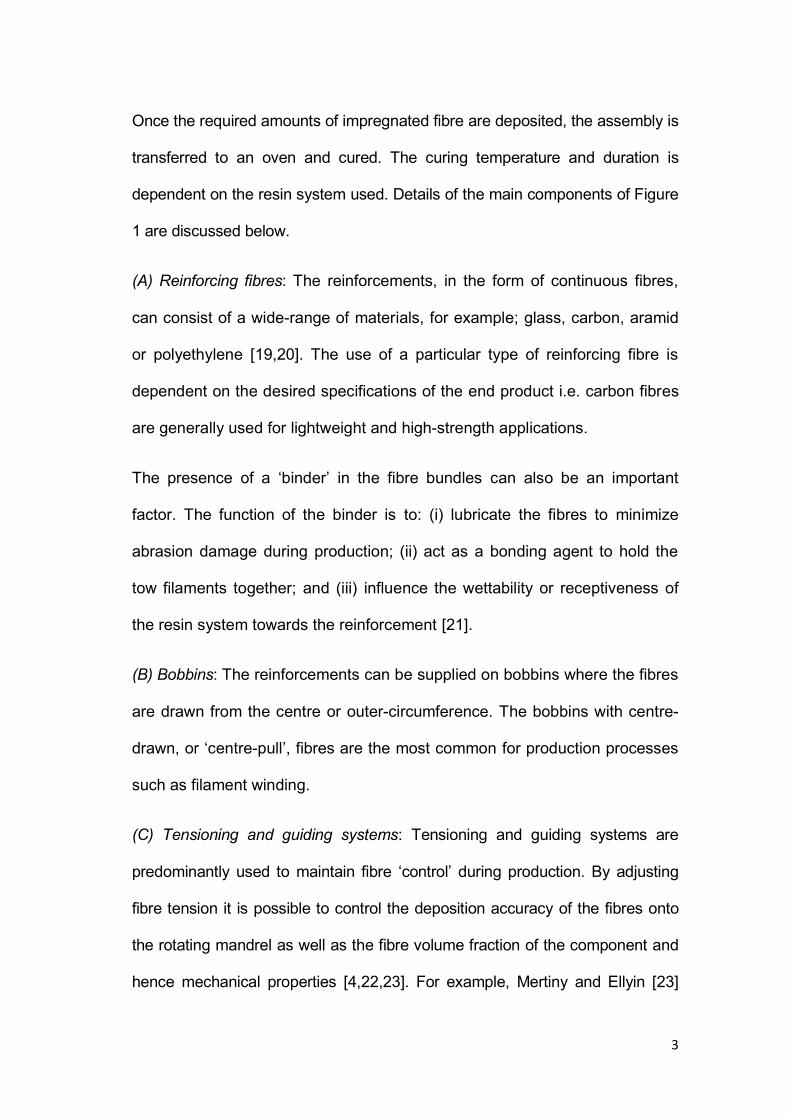
(A) Reinforcing fibres: The reinforcements, in the form of continuous fibres,
can consist of a wide-range of materials, for example; glass, carbon, aramid
or polyethylene [19,20]. The use of a particular type of reinforcing fibre is
dependent on the desired specifications of the end product i.e. carbon fibres
are generally used for lightweight and high-strength applications.
The presence of a ‘binder’ in the fibre bundles can also be an important
factor. The function of the binder is to: (i) lubricate the fibres to minimize
abrasion damage during production; (ii) act as a bonding agent to hold the
tow filaments together; and (iii) influence the wettability or receptiveness of
the resin system towards the reinforcement [21].
(B) Bobbins: The reinforcements can be supplied on bobbins where the fibres
are drawn from the centre or outer-circumference. The bobbins with centre-
drawn, or ‘centre-pull’, fibres are the most common for production processes
such as filament winding.
(C) Tensioning and guiding systems: Tensioning and guiding systems are
predominantly used to maintain fibre ‘control’ during production. By adjusting
fibre tension it is possible to control the deposition accuracy of the fibres onto
the rotating mandrel as well as the fibre volume fraction of the component and
hence mechanical properties [4,22,23]. For example, Mertiny and Ellyin [23]
4
and Cohen et al. [24] demonstrated that variations in winding tension can
produce an increase in composite loading capabilities.
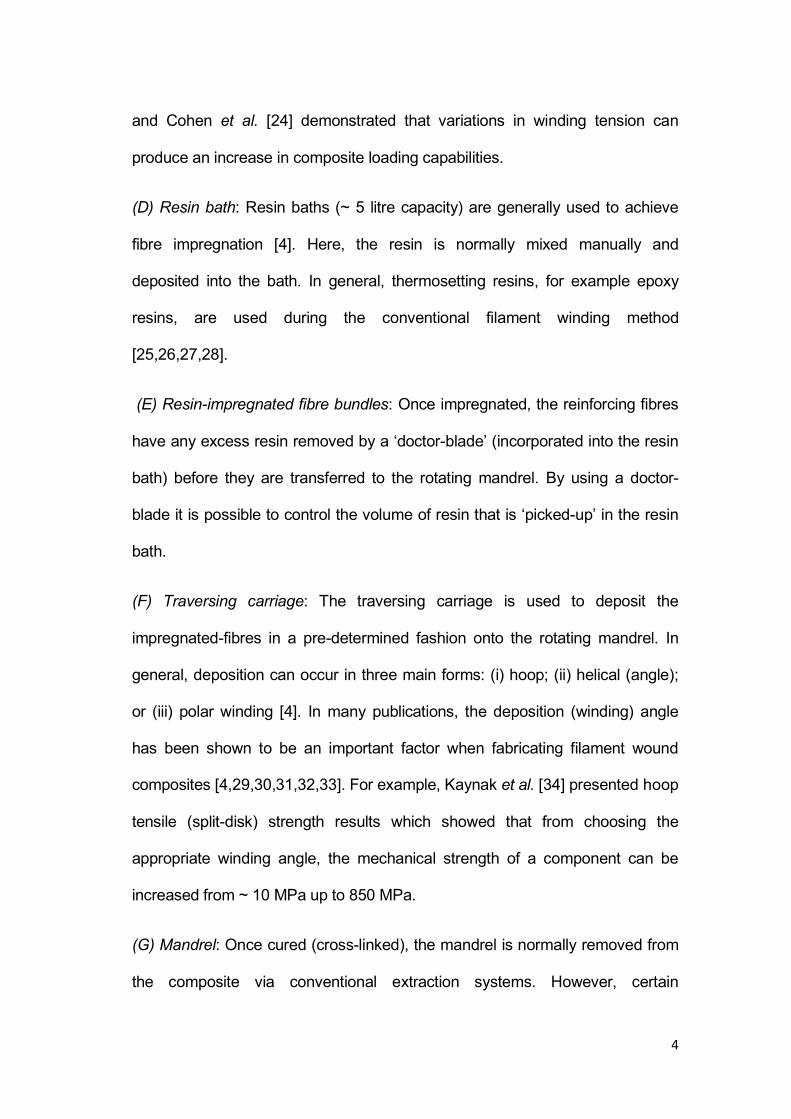
(D) Resin bath: Resin baths (~ 5 litre capacity) are generally used to achieve
fibre impregnation [4]. Here, the resin is normally mixed manually and
deposited into the bath. In general, thermosetting resins, for example epoxy
resins, are used during the conventional filament winding method
[25,26,27,28].
(E) Resin-impregnated fibre bundles: Once impregnated, the reinforcing fibres
have any excess resin removed by a ‘doctor-blade’ (incorporated into the resin
bath) before they are transferred to the rotating mandrel. By using a doctor-
blade it is possible to control the volume of resin that is ‘picked-up’ in the resin
bath.
(F) Traversing carriage: The traversing carriage is used to deposit the
impregnated-fibres in a pre-determined fashion onto the rotating mandrel. In
general, deposition can occur in three main forms: (i) hoop; (ii) helical (angle);
or (iii) polar winding [4]. In many publications, the deposition (winding) angle
has been shown to be an important factor when fabricating filament wound
composites [4,29,30,31,32,33]. For example, Kaynak et al. [34] presented hoop
tensile (split-disk) strength results which showed that from choosing the
appropriate winding angle, the mechanical strength of a component can be
increased from ~ 10 MPa up to 850 MPa.
(G) Mandrel: Once cured (cross-linked), the mandrel is normally removed from
the composite via conventional extraction systems. However, certain
5
applications allow/require the mandrel to be built into the final component [5]. A
discussion of the various mandrel systems which have been used to date is
presented in the following section.
From reviewing the above-discussion, it can be noted that there are various
issues and constraints associated with conventional filament winding. The
following section presents a review of these issues.
1.2 Issues and Constraints Associated with Conventional Filament
Winding
There are a number of issues associated with conventional filament winding.
The following section presents a detailed discussion of these points.
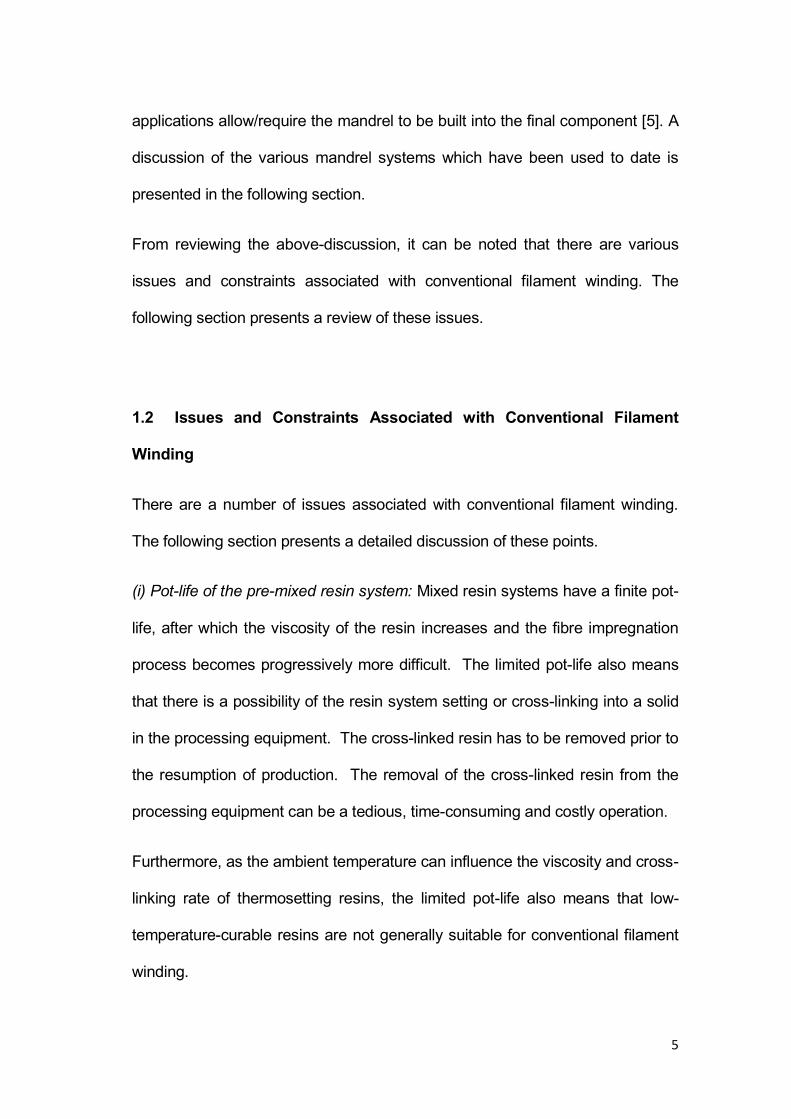
(i) Pot-life of the pre-mixed resin system: Mixed resin systems have a finite pot-
life, after which the viscosity of the resin increases and the fibre impregnation
process becomes progressively more difficult. The limited pot-life also means
that there is a possibility of the resin system setting or cross-linking into a solid
in the processing equipment. The cross-linked resin has to be removed prior to
the resumption of production. The removal of the cross-linked resin from the
processing equipment can be a tedious, time-consuming and costly operation.
Furthermore, as the ambient temperature can influence the viscosity and cross-
linking rate of thermosetting resins, the limited pot-life also means that low-
temperature-curable resins are not generally suitable for conventional filament
winding.
6
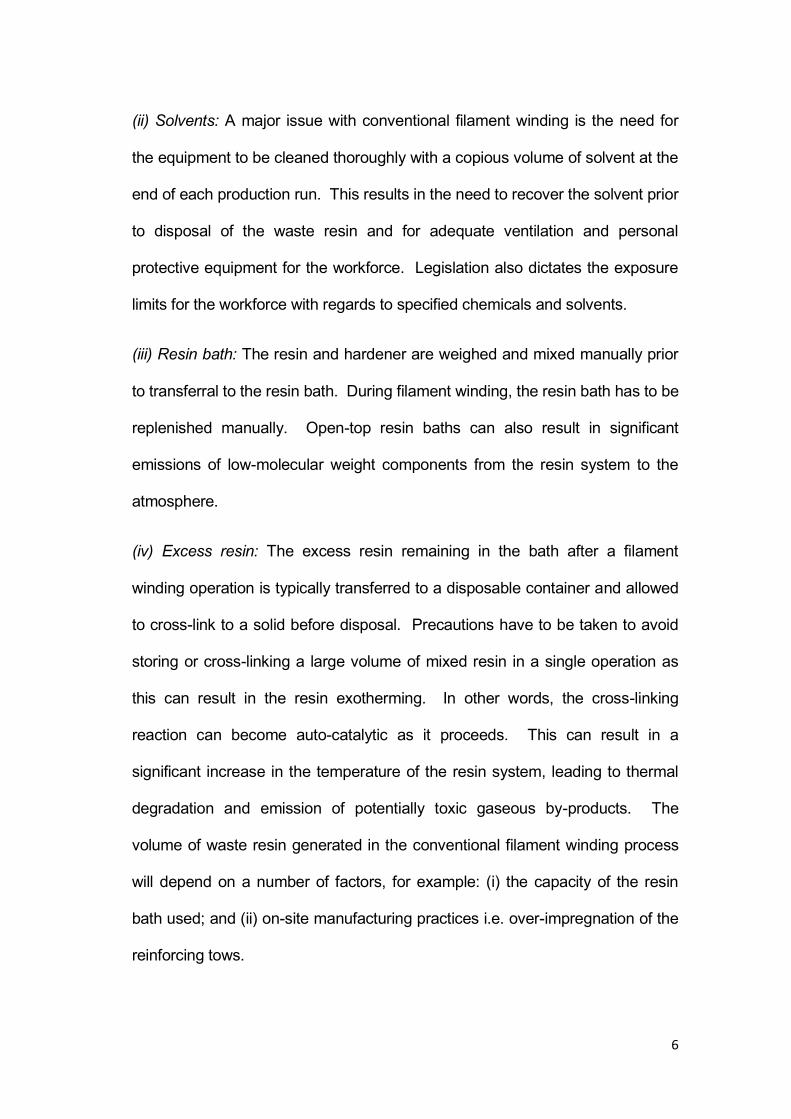
(ii) Solvents: A major issue with conventional filament winding is the need for
the equipment to be cleaned thoroughly with a copious volume of solvent at the
end of each production run. This results in the need to recover the solvent prior
to disposal of the waste resin and for adequate ventilation and personal
protective equipment for the workforce. Legislation also dictates the exposure
limits for the workforce with regards to specified chemicals and solvents.
(iii) Resin bath: The resin and hardener are weighed and mixed manually prior
to transferral to the resin bath. During filament winding, the resin bath has to be
replenished manually. Open-top resin baths can also result in significant
emissions of low-molecular weight components from the resin system to the
atmosphere.
(iv) Excess resin: The excess resin remaining in the bath after a filament
winding operation is typically transferred to a disposable container and allowed
to cross-link to a solid before disposal. Precautions have to be taken to avoid
storing or cross-linking a large volume of mixed resin in a single operation as
this can result in the resin exotherming. In other words, the cross-linking
reaction can become auto-catalytic as it proceeds. This can result in a
significant increase in the temperature of the resin system, leading to thermal
degradation and emission of potentially toxic gaseous by-products. The
volume of waste resin generated in the conventional filament winding process
will depend on a number of factors, for example: (i) the capacity of the resin
bath used; and (ii) on-site manufacturing practices i.e. over-impregnation of the
reinforcing tows.
7
Due to these issues and constraints, a modified filament winding method
termed ‘clean filament winding’ (CFW) was developed in this study; the
following section outlines the aims and objectives.
1.3 Aims and Objectives
This study reports on the development of a modified filament winding method
termed ‘clean filament winding’ (CFW). The aims and objectives of this study
were as follows:
i. To design, manufacture and evaluate a resin impregnation unit to enable
the realisation of the CFW concept.
This philosophy involves the use of a resin dispensing unit where the resin
and hardener are stored separately and pumped on-demand through a static
mixer to a custom-designed resin impregnation unit. In the resin impregnation
unit, the fibres are impregnated in-flight.
ii. To manufacture and compare the mechanical and physical properties of
filament wound tubes produced via a conventional resin bath and CFW
methods.
Filament wound tubes were manufactured in-house and on-site and then
evaluated via the following procedures: (a) image analysis; (b) resin burn-off;
8
(c) scanning electron microscopy (SEM); (d) hoop tensile (split-disk) strength
testing; (e) inter-laminar shear strength testing; and (f) lateral compression
strength testing.
iii. To assess the ‘green’ credentials of the CFW process using life cycle
assessment (LCA) and life cycle cost (LCC) analyses.
Commercially available LCA software ‘GaBi4’ was used to assess the
environmental impacts of the conventional and CFW processes. A simple
study was also undertaken to assess the economic benefits of the CFW
method in comparison to its conventional predecessor.
iv. To undertake site trials with the CFW method in an industrial
environment
Site-trials were undertaken at an industrial manufacturing site (Portsmouth,
UK) where the resin impregnation unit was retro-fitted onto a conventional
filament winding machine to produce filament wound tubes.
v. To apply the CFW process to specified industrial applications, such as:
(a) the use of waste-fabrics for producing filament wound tubes; and (b)
the overwrapping of aluminium pressure vessels to form composite over-
wrapped pressure vessels (COPVs).
9
The CFW method was modified to allow for the processing of composite
materials for specific industrial applications.
The remaining sections of this thesis are structured as follows:
(i) Chapter 2 presents a detailed review of the literature with regards to: (a)
filament winding; (b) impregnation modelling; (c) fibre spreading; (d)
composites recycling; and (e) life cycle assessment (LCA).
(ii) Chapter 3 outlines the experimental investigations which were carried out
to develop the clean filament winding process with regards to: (a) process
improvement; (b) impregnation modelling; (c) fibre spreading; (d) composites
recycling; and (e) life cycle assessment (LCA).
(iii) Chapter 4 presents an in-depth analysis and discussion of the results
produced from the experiments outlined in Chapter 3. Here, qualitative and
quantitative analysis of the clean filament winding method with respect to its
conventional predecessor was carried out.
(iv) Chapter 5 summarises: (i) the main milestones achieved throughout this
research project; and (ii) the possible research projects which could be
undertaken to further progress the investigations presented in the current
study.
10
CHAPTER 2: LITERATURE REVIEW
The following section presents a literature review which aided in developing
the CFW method. The structure of this review consists of the following key
topics:
(i) Filament winding; this was carried out to assess the current status of
filament winding.
(ii) Fibre impregnation modelling; this was completed to aid the design of a
prototype resin impregnation unit.
(iii) Fibre spreading methods; this was undertaken to assist with the
transverse impregnation of a fibre tow.
(iv) Waste composite legislation; this was reviewed to justify the development
of a composite recycling method.
(v) Thermoset composite recycling methods; this review was carried-out to
aid the development of a method termed ‘Recycled-Clean filament winding’
(R-CFW).
(vi) Life cycle assessment (LCA) analyses with regards to composite
manufacturing; this was undertaken to assist with the development of a
method to evaluate the ‘green’ credentials of the CFW method.
11
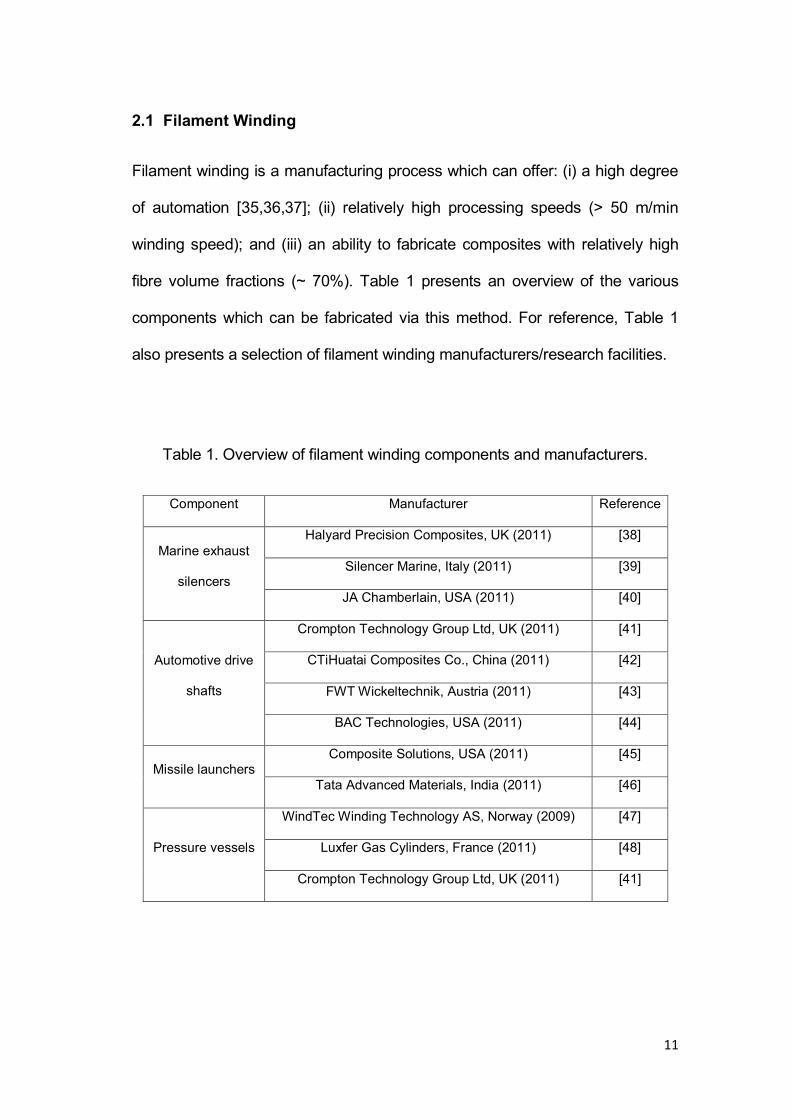
2.1 Filament Winding
Filament winding is a manufacturing process which can offer: (i) a high degree
of automation [35,36,37]; (ii) relatively high processing speeds (> 50 m/min
winding speed); and (iii) an ability to fabricate composites with relatively high
fibre volume fractions (~ 70%). Table 1 presents an overview of the various
components which can be fabricated via this method. For reference, Table 1
also presents a selection of filament winding manufacturers/research facilities.
Table 1. Overview of filament winding components and manufacturers.
Component Manufacturer Reference
Marine exhaust
silencers
Halyard Precision Composites, UK (2011) [38]
Silencer Marine, Italy (2011) [39]
JA Chamberlain, USA (2011) [40]
Automotive drive
shafts
Crompton Technology Group Ltd, UK (2011) [41]
CTiHuatai Composites Co., China (2011) [42]
FWT Wickeltechnik, Austria (2011) [43]
BAC Technologies, USA (2011) [44]
Missile launchers Composite Solutions, USA (2011) [45]
Tata Advanced Materials, India (2011) [46]
Pressure vessels
WindTec Winding Technology AS, Norway (2009) [47]
Luxfer Gas Cylinders, France (2011) [48]
Crompton Technology Group Ltd, UK (2011) [41]
12
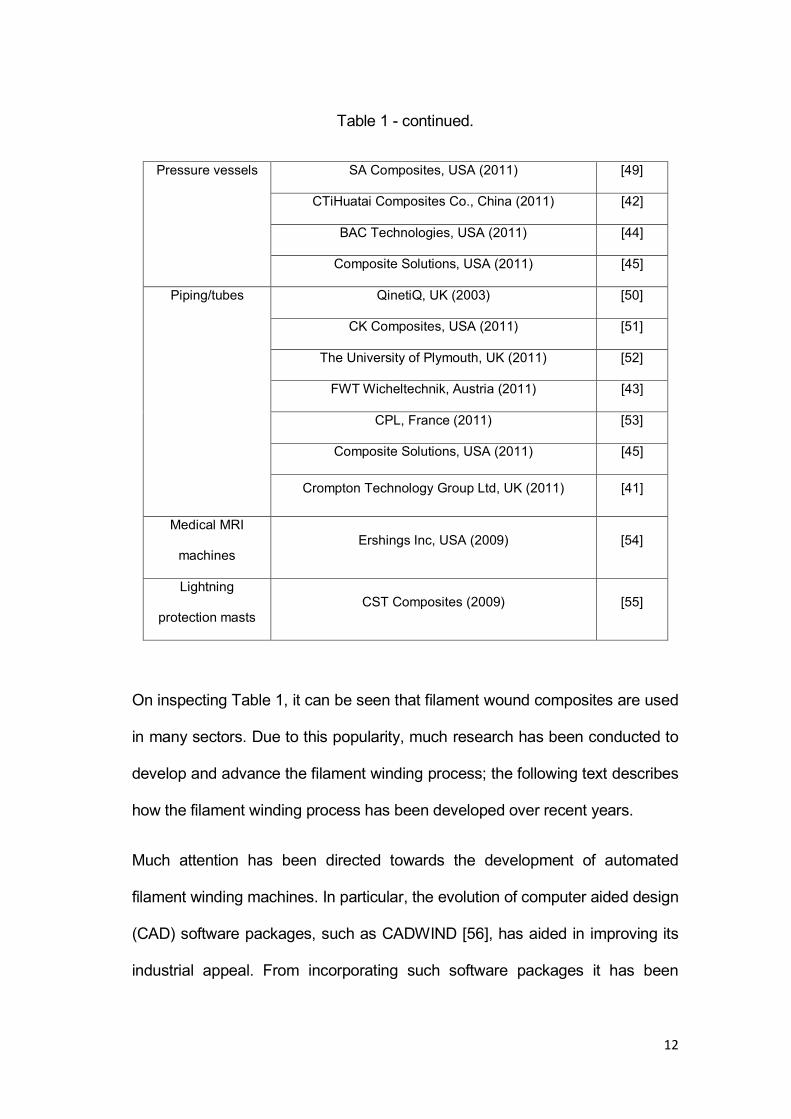
Table 1 - continued.
Pressure vessels SA Composites, USA (2011) [49]
CTiHuatai Composites Co., China (2011) [42]
BAC Technologies, USA (2011) [44]
Composite Solutions, USA (2011) [45]
Piping/tubes QinetiQ, UK (2003) [50]
CK Composites, USA (2011) [51]
The University of Plymouth, UK (2011) [52]
FWT Wicheltechnik, Austria (2011) [43]
CPL, France (2011) [53]
Composite Solutions, USA (2011) [45]
Crompton Technology Group Ltd, UK (2011) [41]
Medical MRI
machines Ershings Inc, USA (2009) [54]
Lightning
protection masts CST Composites (2009) [55]
On inspecting Table 1, it can be seen that filament wound composites are used
in many sectors. Due to this popularity, much research has been conducted to
develop and advance the filament winding process; the following text describes
how the filament winding process has been developed over recent years.
Much attention has been directed towards the development of automated
filament winding machines. In particular, the evolution of computer aided design
(CAD) software packages, such as CADWIND [56], has aided in improving its
industrial appeal. From incorporating such software packages it has been
13
possible to determine winding angles, material needs and processing programs
before any winding trials are completed. The development of such automation
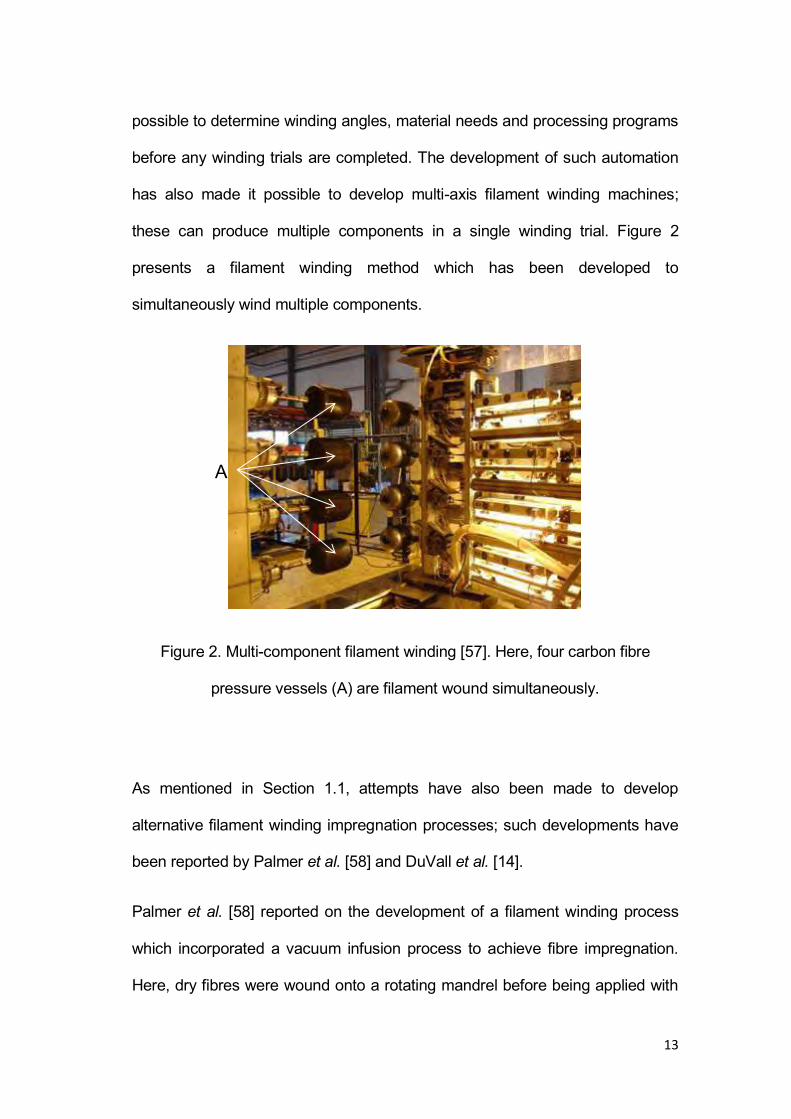
has also made it possible to develop multi-axis filament winding machines;
these can produce multiple components in a single winding trial. Figure 2
presents a filament winding method which has been developed to
simultaneously wind multiple components.
Figure 2. Multi-component filament winding [57]. Here, four carbon fibre
pressure vessels (A) are filament wound simultaneously.
As mentioned in Section 1.1, attempts have also been made to develop
alternative filament winding impregnation processes; such developments have
been reported by Palmer et al. [58] and DuVall et al. [14].
Palmer et al. [58] reported on the development of a filament winding process
which incorporated a vacuum infusion process to achieve fibre impregnation.
Here, dry fibres were wound onto a rotating mandrel before being applied with
A
14
a release film, ‘bleeder’ cloth and vacuum bag (the release film and bleeder
cloth aided with component extraction and excess resin removal respectively).
A vacuum was then applied to the deposited fibres in order to remove the air
from inside the vacuum bag. Once a vacuum was produced, a resin system
was allowed to flow into the reinforcement and impregnation of the fibres could
be achieved.
From incorporating the method presented by Palmer et al. [58], it is possible to
avoid many of the issues presented in Section 1.2. However, from incorporating
this method such issues as vacuum bag application, fibre damage during dry-
winding and processing time can somewhat negate any improvements.
Duvall et al. [14] proposed the use of prepreg (pre-impregnated) fibres during
processing instead of on-line impregnation of dry fibres (as shown in Figure 1).
From incorporating prepreg material, and removing the need to impregnate the
material on-line, the authors stated that a cleaner process was produced.
However, from incorporating this method the cost-of-manufacture was
considerably increased; due to higher material costs.
Many researchers have also directed much effort towards the development of
‘specialised’ mandrel systems. Table 2 presents an overview of the mandrel
systems which have been developed to date.
15
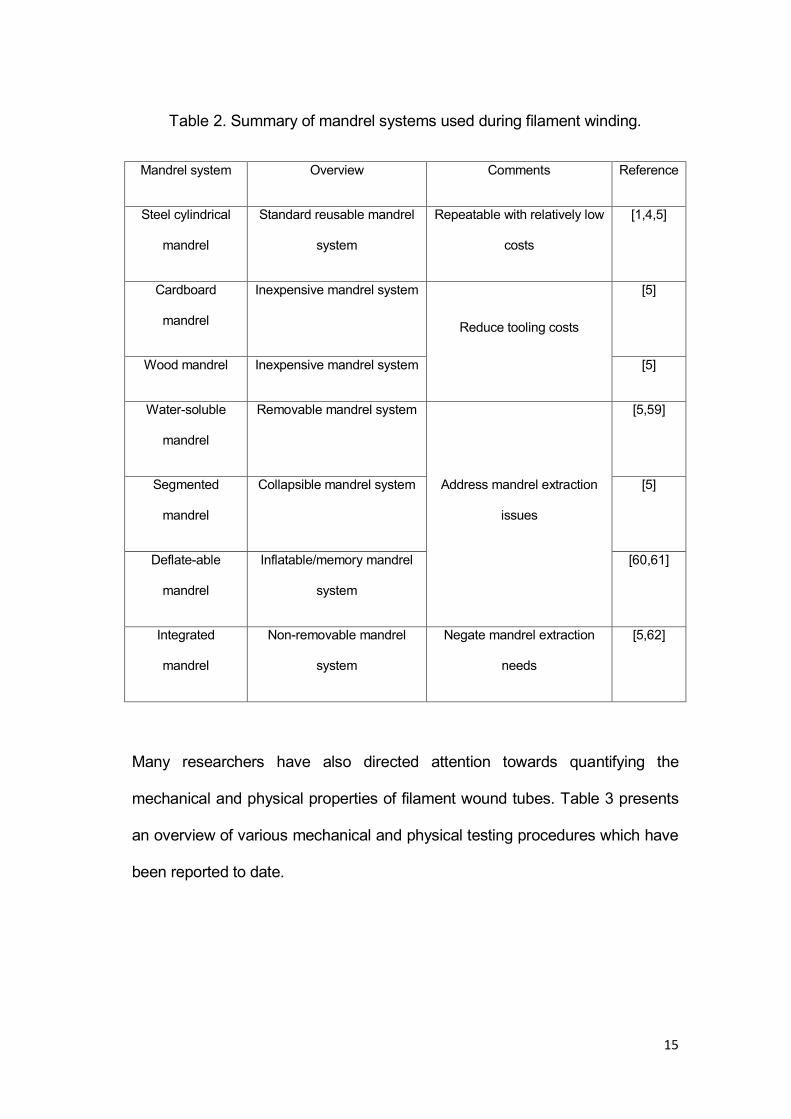
Table 2. Summary of mandrel systems used during filament winding.
Mandrel system Overview Comments Reference
Steel cylindrical
mandrel
Standard reusable mandrel
system
Repeatable with relatively low
costs
[1,4,5]
Cardboard
mandrel
Inexpensive mandrel system
Reduce tooling costs
[5]
Wood mandrel Inexpensive mandrel system [5]
Water-soluble
mandrel
Removable mandrel system
Address mandrel extraction
issues
[5,59]
Segmented
mandrel
Collapsible mandrel system [5]
Deflate-able
mandrel
Inflatable/memory mandrel
system
[60,61]
Integrated
mandrel
Non-removable mandrel
system
Negate mandrel extraction
needs
[5,62]
Many researchers have also directed attention towards quantifying the
mechanical and physical properties of filament wound tubes. Table 3 presents
an overview of various mechanical and physical testing procedures which have
been reported to date.
16
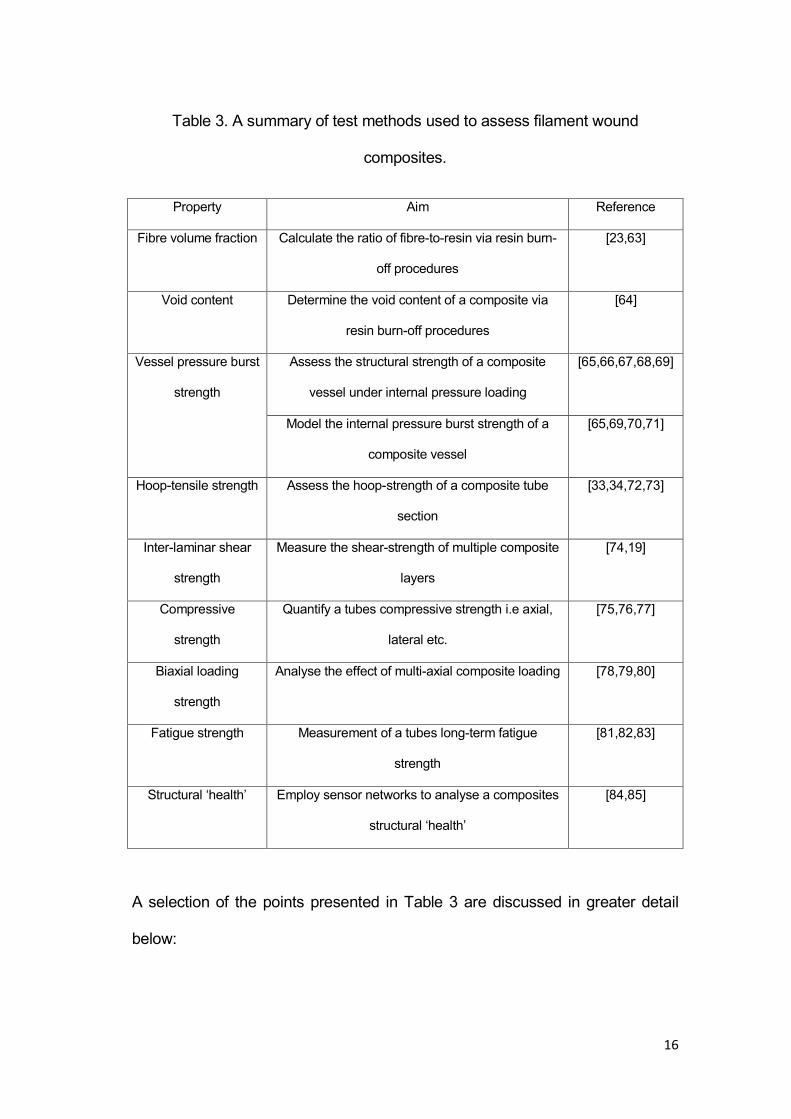
Table 3. A summary of test methods used to assess filament wound
composites.
Property Aim Reference
Fibre volume fraction Calculate the ratio of fibre-to-resin via resin burn-
off procedures
[23,63]
Void content Determine the void content of a composite via
resin burn-off procedures
[64]
Vessel pressure burst
strength
Assess the structural strength of a composite
vessel under internal pressure loading
[65,66,67,68,69]
Model the internal pressure burst strength of a
composite vessel
[65,69,70,71]
Hoop-tensile strength Assess the hoop-strength of a composite tube
section
[33,34,72,73]
Inter-laminar shear
strength
Measure the shear-strength of multiple composite
layers
[74,19]
Compressive
strength
Quantify a tubes compressive strength i.e axial,
lateral etc.
[75,76,77]
Biaxial loading
strength
Analyse the effect of multi-axial composite loading [78,79,80]
Fatigue strength Measurement of a tubes long-term fatigue
strength
[81,82,83]
Structural ‘health’ Employ sensor networks to analyse a composites
structural ‘health’
[84,85]
A selection of the points presented in Table 3 are discussed in greater detail
below:
17
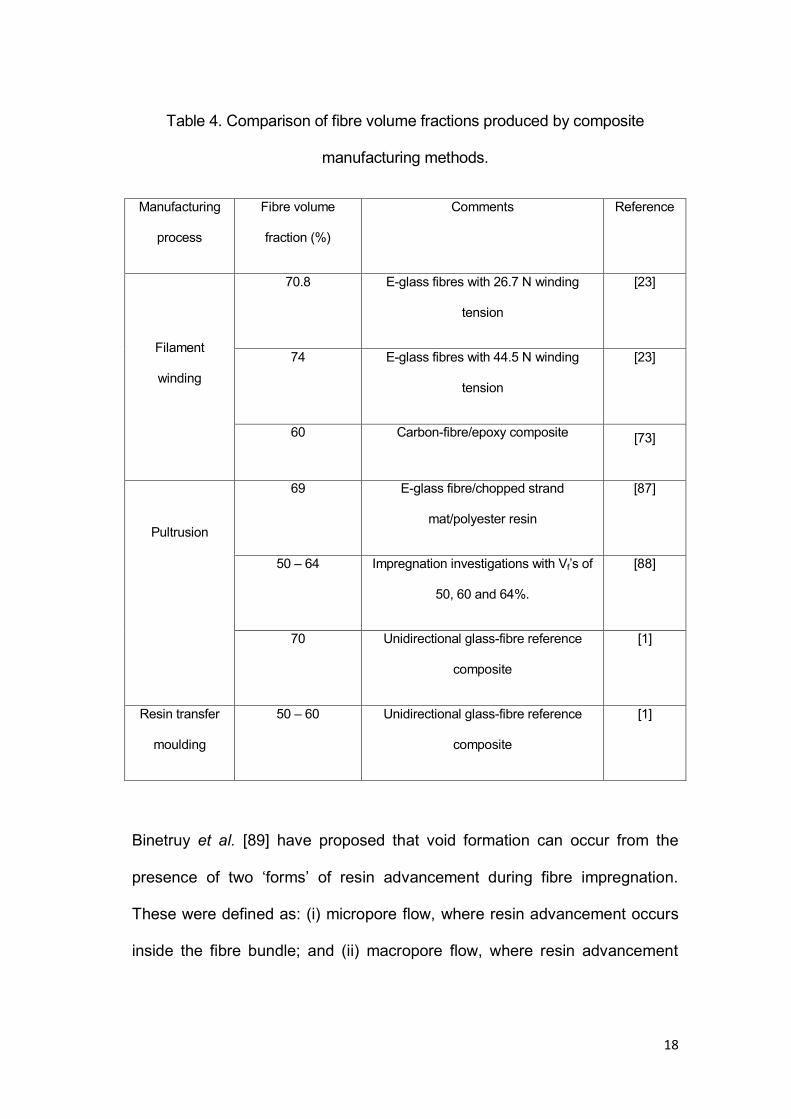
Fibre volume fraction: Conventional resin burn-off or image analysis
procedures can be employed to ascertain the fibre volume fraction of a filament
wound composite. In general, a fibre volume fraction of ~70% is deemed
appropriate; Table 4 presents a comparison of the relative fibre volume
fractions which can be achieved via other composite manufacturing methods.
Here, a value of ~ 70% is generally used in filament winding as this allows for
an adequate amount of load bearing fibres to be incorporated into the
composite with enough resin for full impregnation [23]. For example, Mertiny
and Ellyin [23] showed the importance of fibre volume fraction by investigating
ratios of 70.8% and 74%, as a result of increasing the winding tension from
26.7 N to 44.5 N. This change in fibre volume fraction produced significant
increases in the fibre-dominated mechanical properties of filament wound
composites.
Void content: Conventional resin burn-off procedures can also be employed to
measure the void content of a filament wound composite. In general, it is
desirable that the void content should be as low as possible as the presence of
any voids can severely influence the loading capabilities of a composite [24].
For reference, void contents between 1% and 5% have been consistently
reported in the literature [1,24,86].
18
Table 4. Comparison of fibre volume fractions produced by composite
manufacturing methods.
Manufacturing
process
Fibre volume
fraction (%)
Comments Reference
Filament
winding
70.8 E-glass fibres with 26.7 N winding
tension
[23]
74 E-glass fibres with 44.5 N winding
tension
[23]
60 Carbon-fibre/epoxy composite [73]
Pultrusion
69 E-glass fibre/chopped strand
mat/polyester resin
[87]
50 – 64 Impregnation investigations with Vf’s of
50, 60 and 64%.
[88]
70 Unidirectional glass-fibre reference
composite
[1]
Resin transfer
moulding
50 – 60 Unidirectional glass-fibre reference
composite
[1]
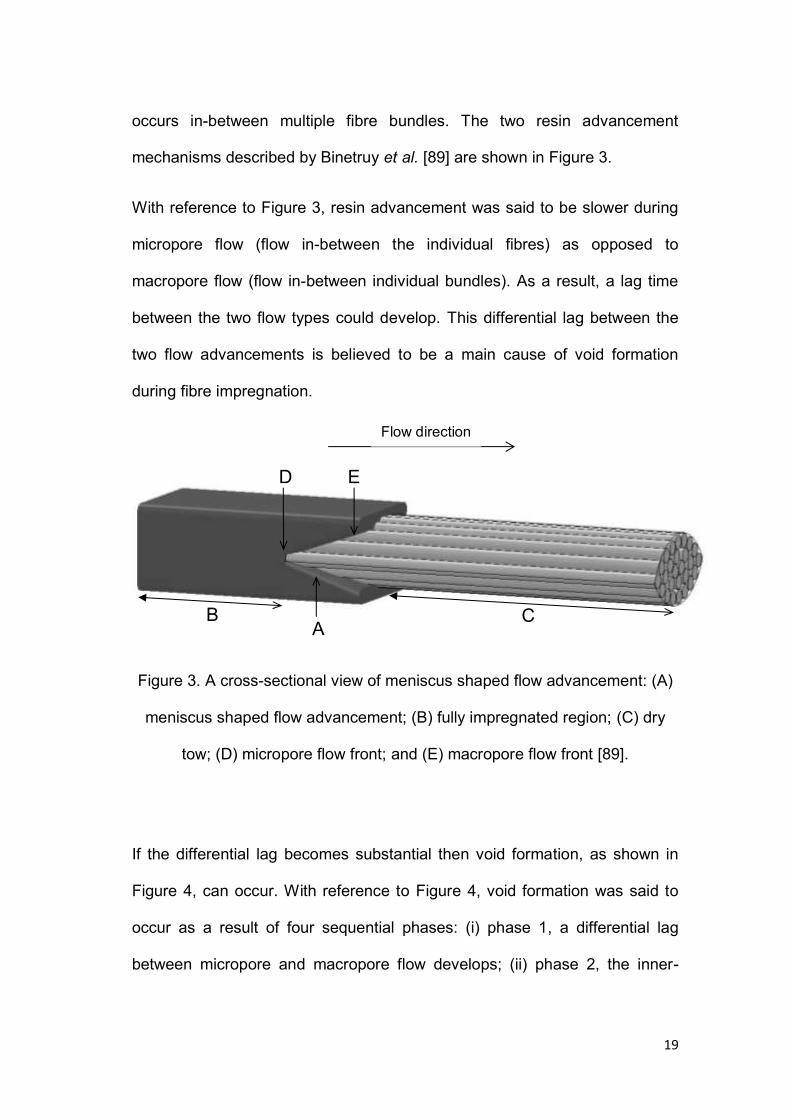
Binetruy et al. [89] have proposed that void formation can occur from the
presence of two ‘forms’ of resin advancement during fibre impregnation.
These were defined as: (i) micropore flow, where resin advancement occurs
inside the fibre bundle; and (ii) macropore flow, where resin advancement
19
occurs in-between multiple fibre bundles. The two resin advancement
mechanisms described by Binetruy et al. [89] are shown in Figure 3.
With reference to Figure 3, resin advancement was said to be slower during
micropore flow (flow in-between the individual fibres) as opposed to
macropore flow (flow in-between individual bundles). As a result, a lag time
between the two flow types could develop. This differential lag between the
two flow advancements is believed to be a main cause of void formation
during fibre impregnation.
Figure 3. A cross-sectional view of meniscus shaped flow advancement: (A)
meniscus shaped flow advancement; (B) fully impregnated region; (C) dry
tow; (D) micropore flow front; and (E) macropore flow front [89].
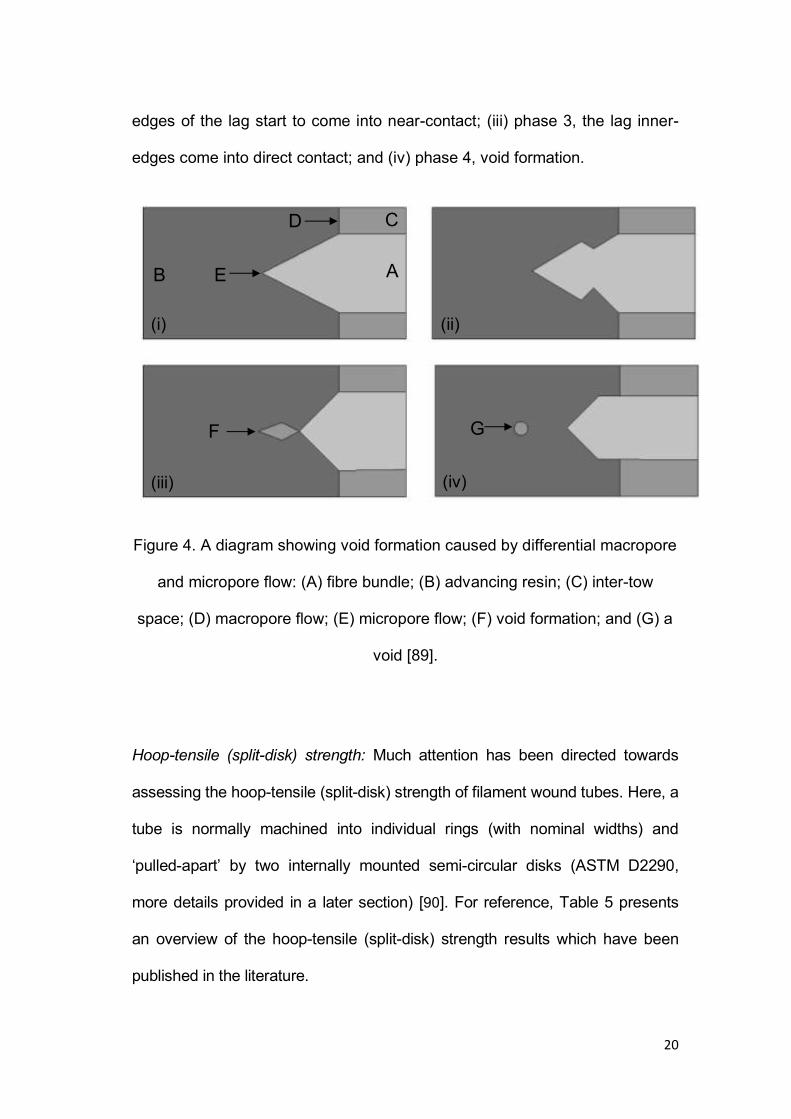
If the differential lag becomes substantial then void formation, as shown in
Figure 4, can occur. With reference to Figure 4, void formation was said to
occur as a result of four sequential phases: (i) phase 1, a differential lag
between micropore and macropore flow develops; (ii) phase 2, the inner-
B A
C
Flow direction
E D
20
edges of the lag start to come into near-contact; (iii) phase 3, the lag inner-
edges come into direct contact; and (iv) phase 4, void formation.
Figure 4. A diagram showing void formation caused by differential macropore
and micropore flow: (A) fibre bundle; (B) advancing resin; (C) inter-tow
space; (D) macropore flow; (E) micropore flow; (F) void formation; and (G) a
void [89].
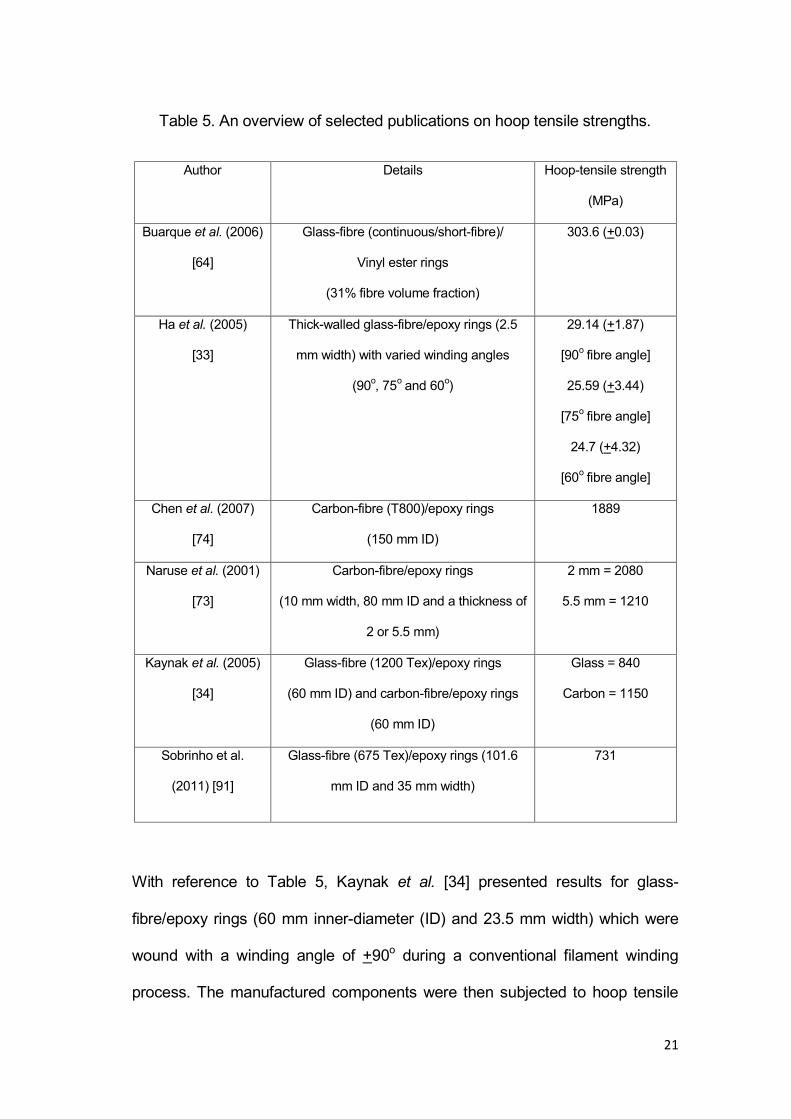
Hoop-tensile (split-disk) strength: Much attention has been directed towards
assessing the hoop-tensile (split-disk) strength of filament wound tubes. Here, a
tube is normally machined into individual rings (with nominal widths) and
‘pulled-apart’ by two internally mounted semi-circular disks (ASTM D2290,
more details provided in a later section) [90]. For reference, Table 5 presents
an overview of the hoop-tensile (split-disk) strength results which have been
published in the literature.
(i) (ii)
(iii) (iv)
A
C D
E
F G
B
21
Table 5. An overview of selected publications on hoop tensile strengths.
Author Details Hoop-tensile strength
(MPa)
Buarque et al. (2006)
[64]
Glass-fibre (continuous/short-fibre)/
Vinyl ester rings
(31% fibre volume fraction)
303.6 (+0.03)
Ha et al. (2005)
[33]
Thick-walled glass-fibre/epoxy rings (2.5
mm width) with varied winding angles
(90o, 75o and 60o)
29.14 (+1.87)
[90o fibre angle]
25.59 (+3.44)
[75o fibre angle]
24.7 (+4.32)
[60o fibre angle]
Chen et al. (2007)
[74]
Carbon-fibre (T800)/epoxy rings
(150 mm ID)
1889
Naruse et al. (2001)
[73]
Carbon-fibre/epoxy rings
(10 mm width, 80 mm ID and a thickness of
2 or 5.5 mm)
2 mm = 2080
5.5 mm = 1210
Kaynak et al. (2005)
[34]
Glass-fibre (1200 Tex)/epoxy rings
(60 mm ID) and carbon-fibre/epoxy rings
(60 mm ID)
Glass = 840
Carbon = 1150
Sobrinho et al.
(2011) [91]
Glass-fibre (675 Tex)/epoxy rings (101.6
mm ID and 35 mm width)
731
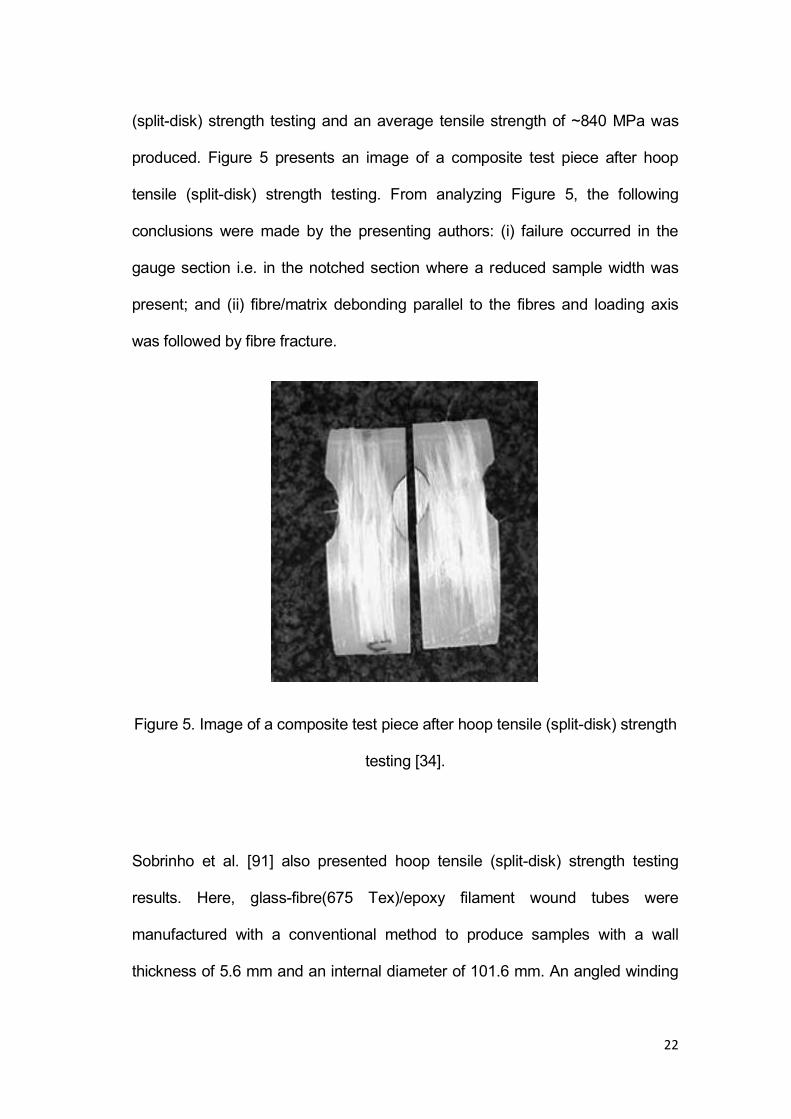
With reference to Table 5, Kaynak et al. [34] presented results for glass-
fibre/epoxy rings (60 mm inner-diameter (ID) and 23.5 mm width) which were
wound with a winding angle of +90o during a conventional filament winding
process. The manufactured components were then subjected to hoop tensile
22
(split-disk) strength testing and an average tensile strength of ~840 MPa was
produced. Figure 5 presents an image of a composite test piece after hoop
tensile (split-disk) strength testing. From analyzing Figure 5, the following
conclusions were made by the presenting authors: (i) failure occurred in the
gauge section i.e. in the notched section where a reduced sample width was
present; and (ii) fibre/matrix debonding parallel to the fibres and loading axis
was followed by fibre fracture.
Figure 5. Image of a composite test piece after hoop tensile (split-disk) strength
testing [34].
Sobrinho et al. [91] also presented hoop tensile (split-disk) strength testing
results. Here, glass-fibre(675 Tex)/epoxy filament wound tubes were
manufactured with a conventional method to produce samples with a wall
thickness of 5.6 mm and an internal diameter of 101.6 mm. An angled winding
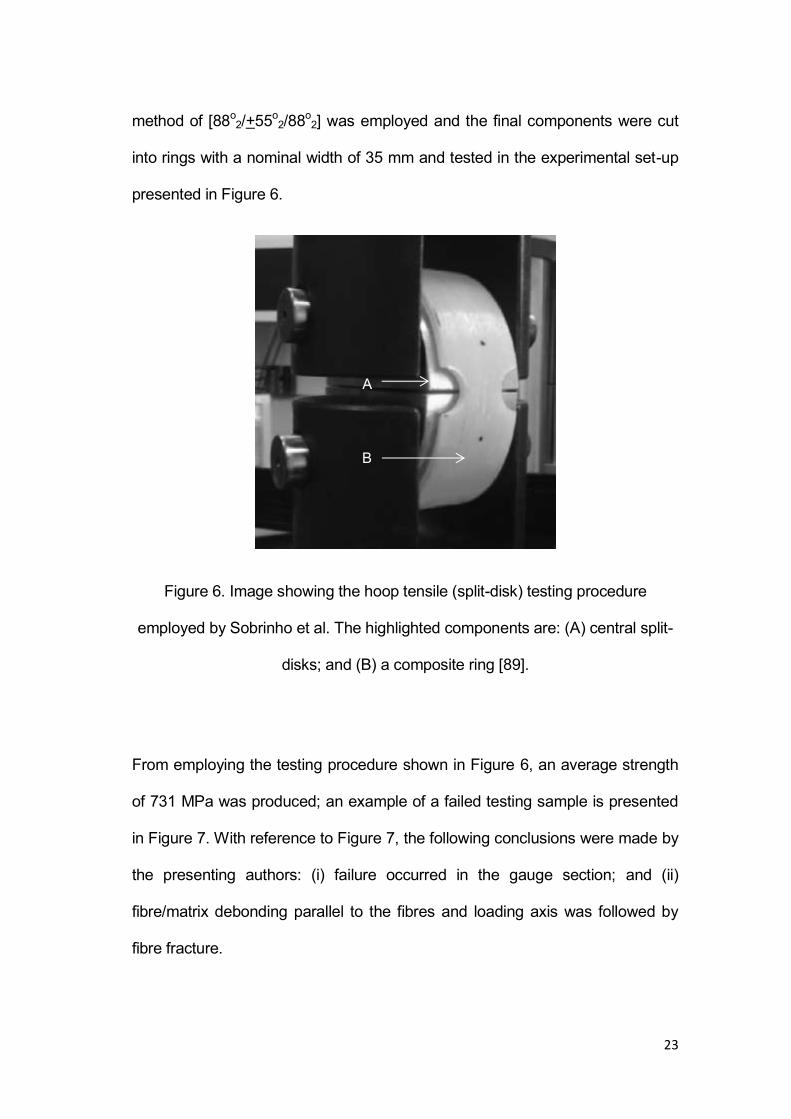
23
method of [88o2/+55o
2/88o2] was employed and the final components were cut
into rings with a nominal width of 35 mm and tested in the experimental set-up
presented in Figure 6.
Figure 6. Image showing the hoop tensile (split-disk) testing procedure
employed by Sobrinho et al. The highlighted components are: (A) central split-
disks; and (B) a composite ring [89].
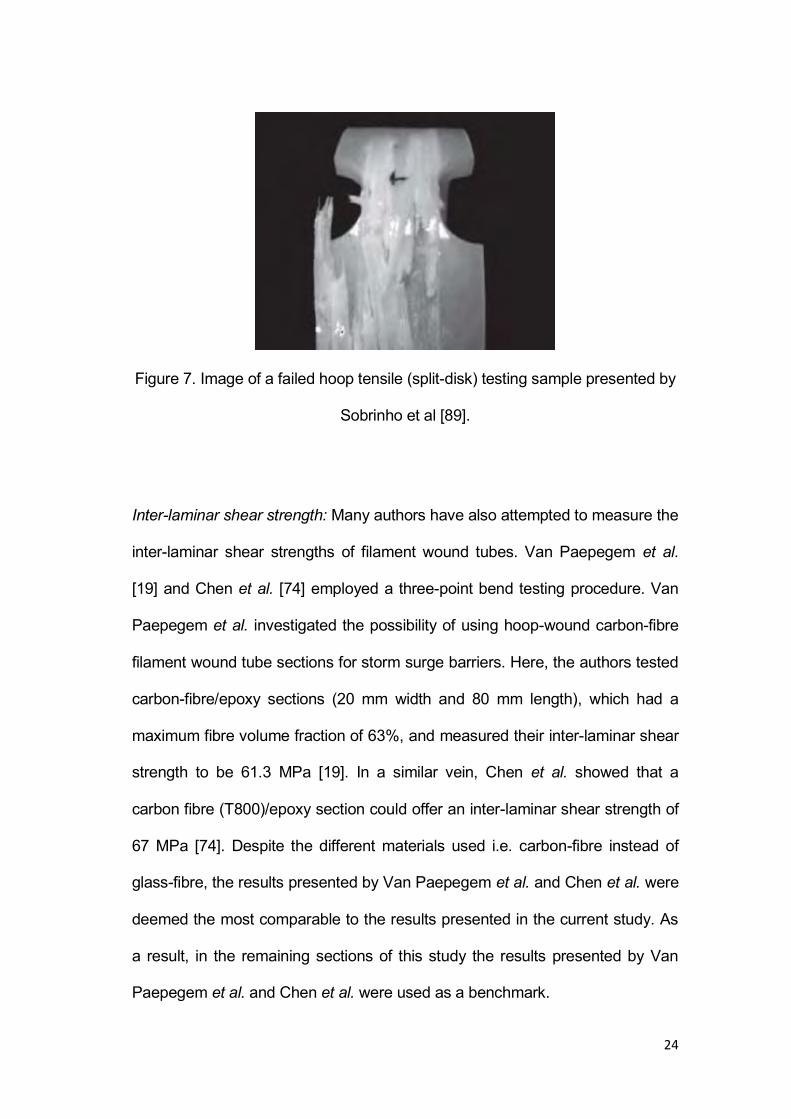
From employing the testing procedure shown in Figure 6, an average strength
of 731 MPa was produced; an example of a failed testing sample is presented
in Figure 7. With reference to Figure 7, the following conclusions were made by
the presenting authors: (i) failure occurred in the gauge section; and (ii)
fibre/matrix debonding parallel to the fibres and loading axis was followed by
fibre fracture.
A
B
24
Figure 7. Image of a failed hoop tensile (split-disk) testing sample presented by
Sobrinho et al [89].
Inter-laminar shear strength: Many authors have also attempted to measure the
inter-laminar shear strengths of filament wound tubes. Van Paepegem et al.
[19] and Chen et al. [74] employed a three-point bend testing procedure. Van
Paepegem et al. investigated the possibility of using hoop-wound carbon-fibre
filament wound tube sections for storm surge barriers. Here, the authors tested
carbon-fibre/epoxy sections (20 mm width and 80 mm length), which had a
maximum fibre volume fraction of 63%, and measured their inter-laminar shear
strength to be 61.3 MPa [19]. In a similar vein, Chen et al. showed that a
carbon fibre (T800)/epoxy section could offer an inter-laminar shear strength of
67 MPa [74]. Despite the different materials used i.e. carbon-fibre instead of
glass-fibre, the results presented by Van Paepegem et al. and Chen et al. were
deemed the most comparable to the results presented in the current study. As
a result, in the remaining sections of this study the results presented by Van
Paepegem et al. and Chen et al. were used as a benchmark.
25
2.2 Impregnation Modelling
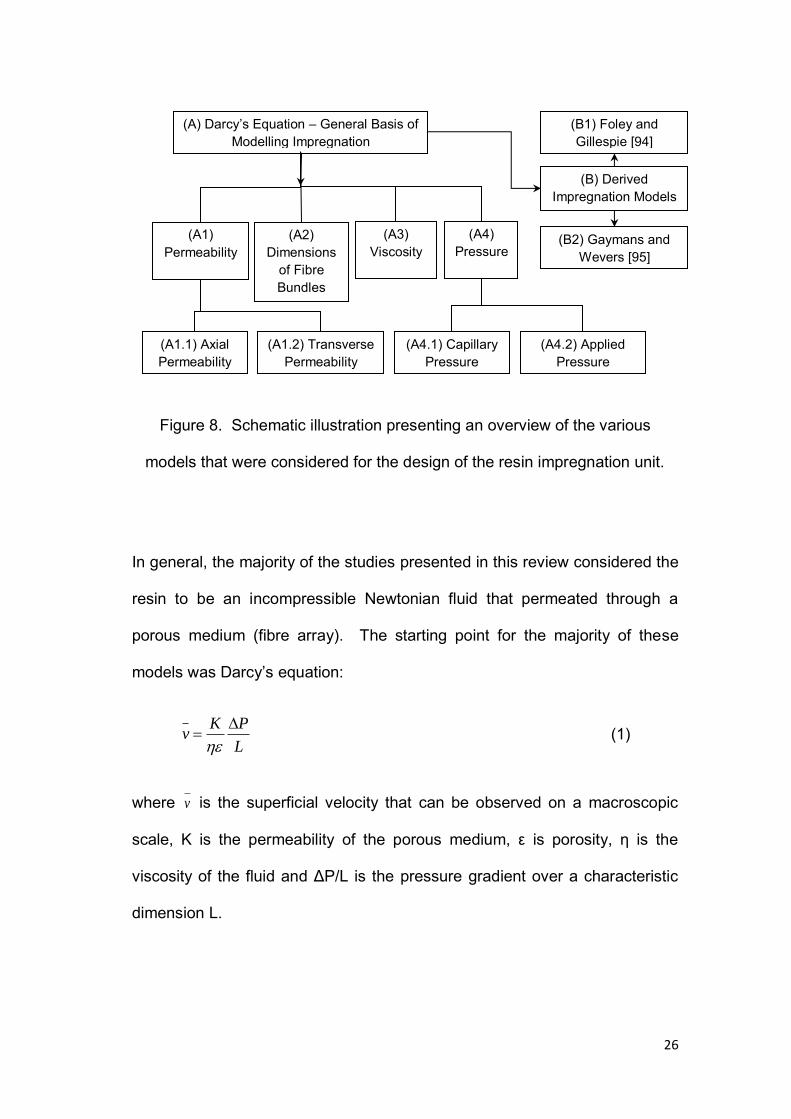
A schematic illustration presenting an overview of the various models that
were considered for the design of a resin impregnation unit is shown in
Figure 8. Here, the rationale for investigating numerous impregnation
models was to ensure that the impregnation unit (developed in the current
study) was able to offer the minimum residence time (time the fibres are
immersed in the resin) needed to inject the required volume of resin into the
fibre tows to achieve full impregnation.
The interpretation of Figure 8 is as follows: the majority of the models that
have been developed for predicting the permeability and time required to
achieve impregnation of fibre tows are based on Darcy’s equation (see
Equation 1). There are four key components to this equation: (i)
permeability; (ii) dimensions of the reinforcement; (iii) viscosity; and (iv)
pressure.
In the following section, each component of Darcy’s equation (A1-A4) is
discussed sequentially before being adapted and applied to two models
developed by Foley and Gillespie (B1) [94] and Gaymans and Wevers (B2)
[95] respectively.
26
Figure 8. Schematic illustration presenting an overview of the various
models that were considered for the design of the resin impregnation unit.
In general, the majority of the studies presented in this review considered the
resin to be an incompressible Newtonian fluid that permeated through a
porous medium (fibre array). The starting point for the majority of these
models was Darcy’s equation:
L
PKv
(1)
where v is the superficial velocity that can be observed on a macroscopic
scale, K is the permeability of the porous medium, ε is porosity, ƞ is the
viscosity of the fluid and ΔP/L is the pressure gradient over a characteristic
dimension L.
(A) Darcy’s Equation – General Basis of Modelling Impregnation
(A4) Pressure
(A3) Viscosity
(A2) Dimensions
of Fibre Bundles
(A1) Permeability
(A4.1) Capillary Pressure
(A4.2) Applied Pressure
(B) Derived Impregnation Models
(B1) Foley and Gillespie [94]
(B2) Gaymans and Wevers [95]
(A1.1) Axial Permeability
(A1.2) Transverse Permeability
27
In the context of developing the design basis for the resin impregnation unit,
the following sections present a brief overview of selected models that
considered the four components of Darcy’s equation.
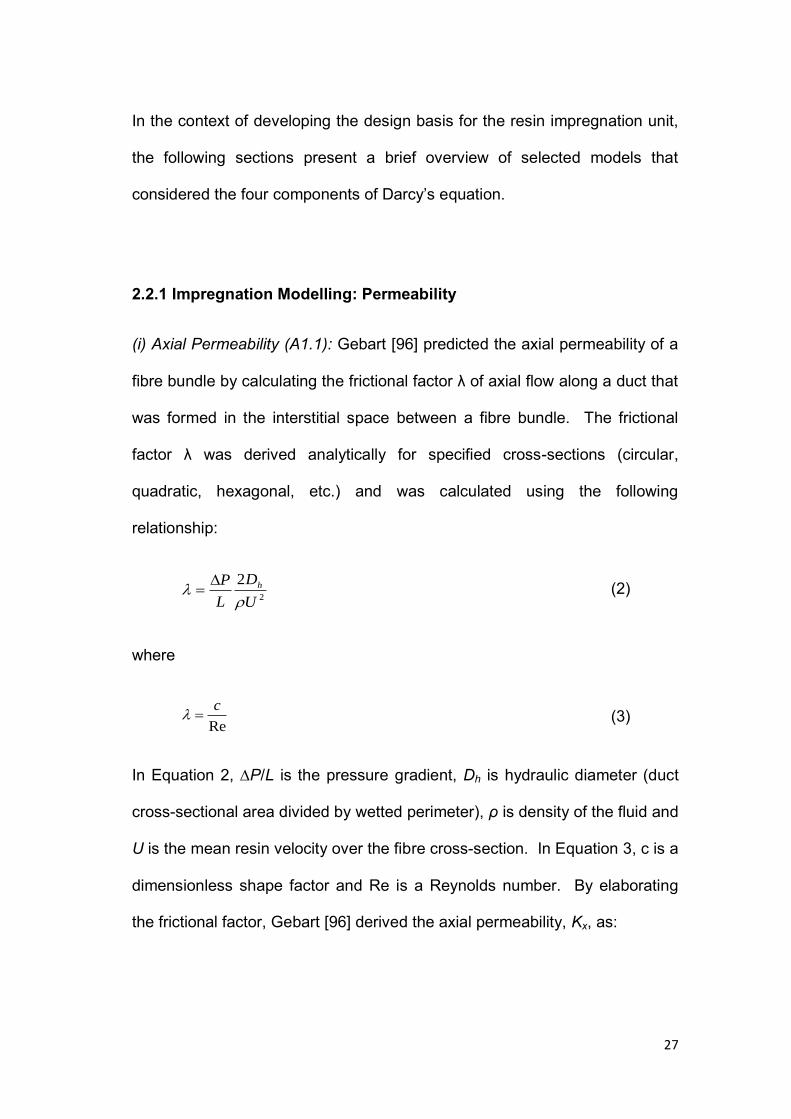
2.2.1 Impregnation Modelling: Permeability
(i) Axial Permeability (A1.1): Gebart [96] predicted the axial permeability of a
fibre bundle by calculating the frictional factor λ of axial flow along a duct that
was formed in the interstitial space between a fibre bundle. The frictional
factor λ was derived analytically for specified cross-sections (circular,
quadratic, hexagonal, etc.) and was calculated using the following
relationship:
2
2
U
D
L
P h
(2)
where
Re
c (3)
In Equation 2, ∆P/L is the pressure gradient, Dh is hydraulic diameter (duct
cross-sectional area divided by wetted perimeter), ρ is density of the fluid and
U is the mean resin velocity over the fibre cross-section. In Equation 3, c is a
dimensionless shape factor and Re is a Reynolds number. By elaborating
the frictional factor, Gebart [96] derived the axial permeability, Kx, as:
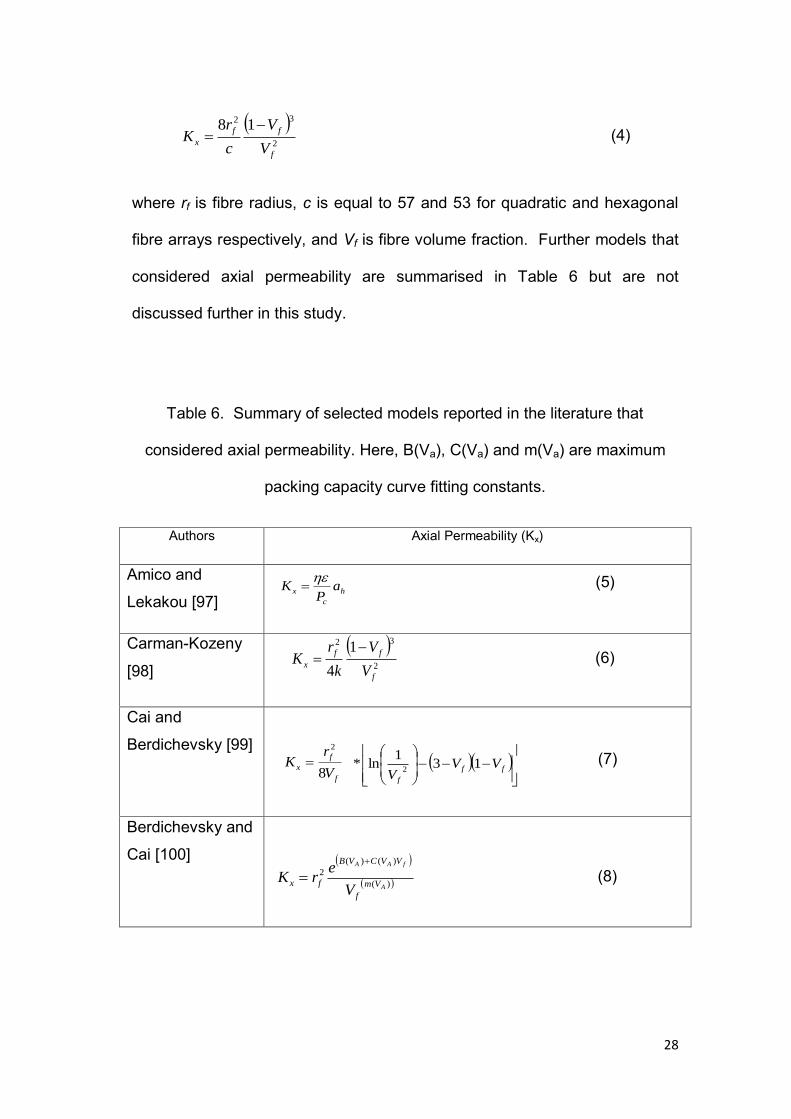
28
2
32 18
f
ff
xV
V
c
rK
(4)
where rf is fibre radius, c is equal to 57 and 53 for quadratic and hexagonal
fibre arrays respectively, and Vf is fibre volume fraction. Further models that
considered axial permeability are summarised in Table 6 but are not
discussed further in this study.
Table 6. Summary of selected models reported in the literature that
considered axial permeability. Here, B(Va), C(Va) and m(Va) are maximum
packing capacity curve fitting constants.
Authors Axial Permeability (Kx)
Amico and
Lekakou [97] h
c
x aP
K
(5)
Carman-Kozeny
[98]
2
32 1
4 f
ff
xV
V
k
rK
(6)
Cai and
Berdichevsky [99]
f
f
xV
rK
8
2
ff
f
VVV
131
ln*2
(7)
Berdichevsky and
Cai [100]
)(
)()(
2
A
fAA
Vm
f
VVCVB
fxV
erK
(8)
29
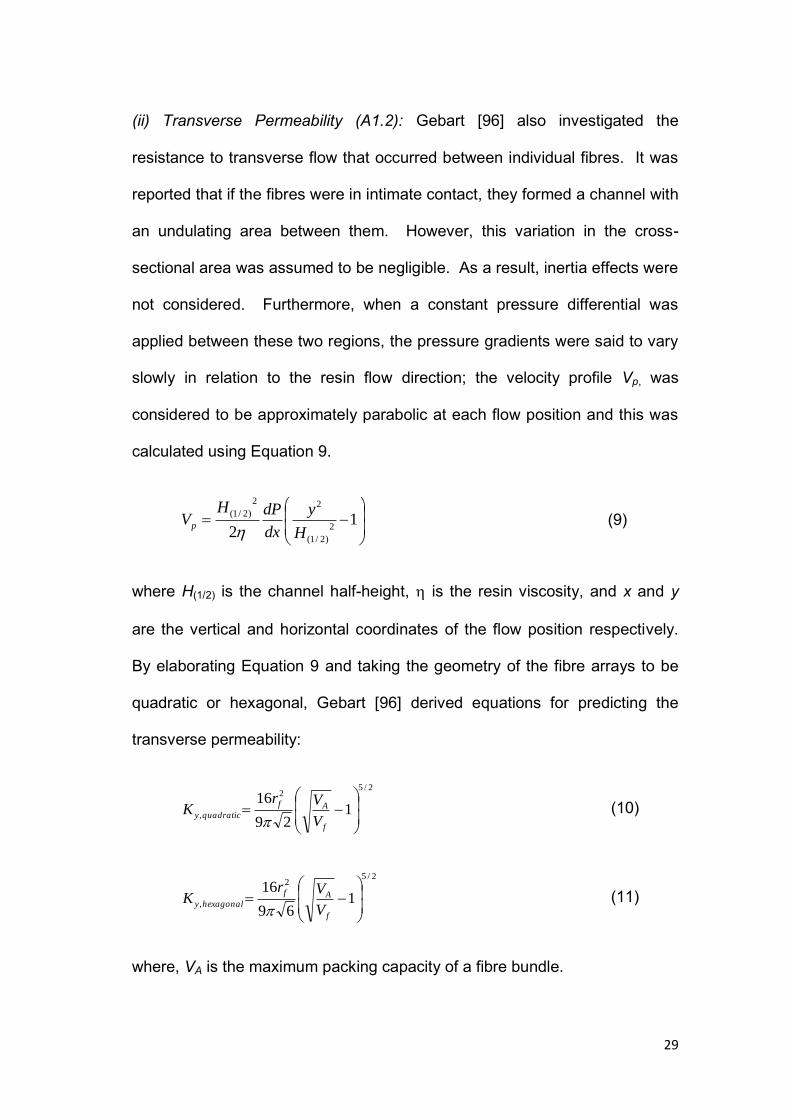
(ii) Transverse Permeability (A1.2): Gebart [96] also investigated the
resistance to transverse flow that occurred between individual fibres. It was
reported that if the fibres were in intimate contact, they formed a channel with
an undulating area between them. However, this variation in the cross-
sectional area was assumed to be negligible. As a result, inertia effects were
not considered. Furthermore, when a constant pressure differential was
applied between these two regions, the pressure gradients were said to vary
slowly in relation to the resin flow direction; the velocity profile Vp, was
considered to be approximately parabolic at each flow position and this was
calculated using Equation 9.
1
22
)2/1(
22
)2/1(
H
y
dx
dPHVp
(9)
where H(1/2) is the channel half-height, is the resin viscosity, and x and y
are the vertical and horizontal coordinates of the flow position respectively.
By elaborating Equation 9 and taking the geometry of the fibre arrays to be
quadratic or hexagonal, Gebart [96] derived equations for predicting the
transverse permeability:
2/5
2
, 129
16
f
Af
quadraticyV
VrK
(10)
2/52
, 169
16
f
Af
hexagonalyV
VrK
(11)
where, VA is the maximum packing capacity of a fibre bundle.
30
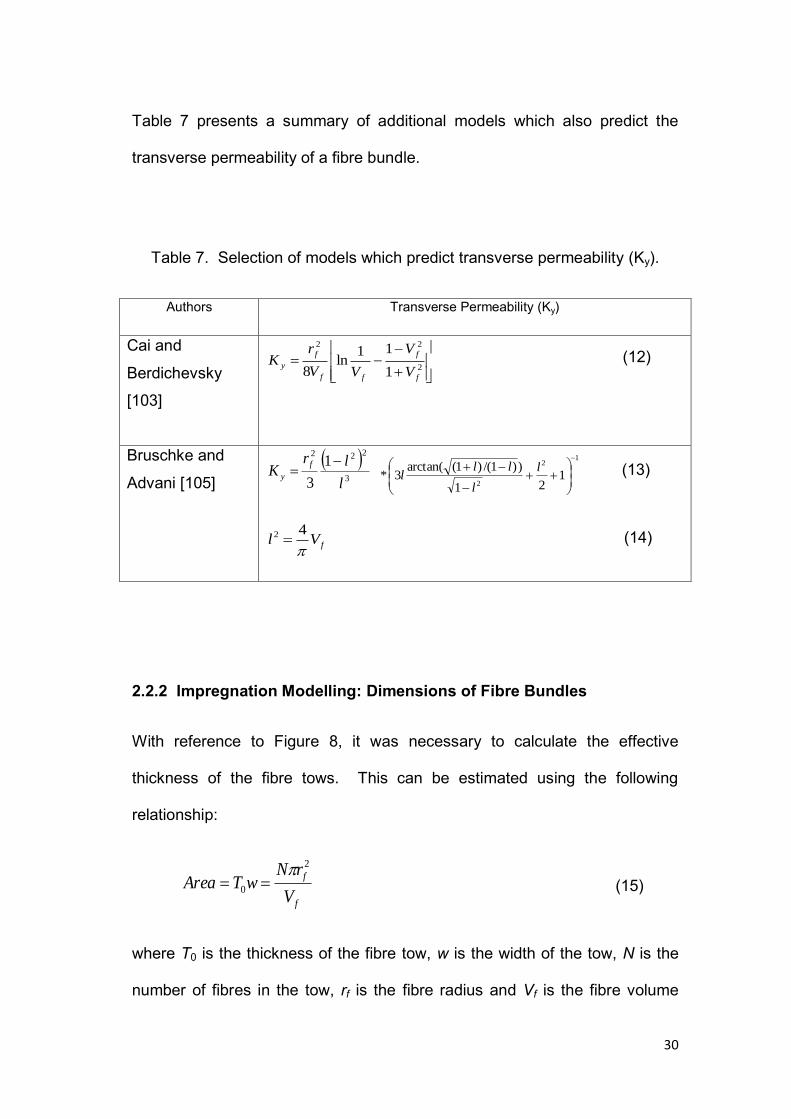
Table 7 presents a summary of additional models which also predict the
transverse permeability of a fibre bundle.
Table 7. Selection of models which predict transverse permeability (Ky).
Authors Transverse Permeability (Ky)
Cai and
Berdichevsky
[103]
2
22
1
11ln
8f
f
ff
f
yV
V
VV
rK (12)
Bruschke and
Advani [105]
3
2221
3 l
lrK
f
y
12
21
21
))1/()1(arctan(3*
l
l
lll (13)
fVl
42 (14)
2.2.2 Impregnation Modelling: Dimensions of Fibre Bundles
With reference to Figure 8, it was necessary to calculate the effective
thickness of the fibre tows. This can be estimated using the following
relationship:
f
f
V
rNwTArea
2
0
(15)
where T0 is the thickness of the fibre tow, w is the width of the tow, N is the
number of fibres in the tow, rf is the fibre radius and Vf is the fibre volume
31
fraction. On inspecting Equation 15, it can be seen that the thickness of a
fibre bundle is related to its width. Devices and techniques for spreading
reinforcing fibres have been reported extensively in patent literature. A
summary and review of selected patents that deal with fibre spreading is
given in Section 2.3.1.
2.2.3 Impregnation Modelling: Viscosity of Resin
With reference to the development of the CFW technology, a commercially
available resin system, LY3505 epoxy resin and XB3403 amine hardener,
was used. The viscosity at the point of impregnation was assumed to be
constant. This is a reasonable assumption as there is a relatively low dead-
volume within the impregnator, which in turn means that the resin system
cannot stagnate. Moreover, when the resin is injected into the fibre tow, a
“fresh” batch of mixed resin system is supplied continuously.
2.2.4 Impregnation Modelling: Pressure
(i) Capillary Pressure (A4.1): Ahn and Seferis [106] developed a model to
calculate the capillary pressure based on the Young-Laplace relationship:
E
cD
P cos4
(16)
where Pc is the capillary pressure, ζ is the surface tension of the wetting fluid,
ϴ is the contact angle between the fluid and solid, and DE is the equivalent
32
diameter of pores in a fibre bundle. Ahn and Seferis [106] employed the
following relationship for evaluating DE for an array of unidirectional fibres:
1
8
F
rD
f
E (17)
where, rf is the fibre radius, ɛ is the porosity, and F is a form factor. F was
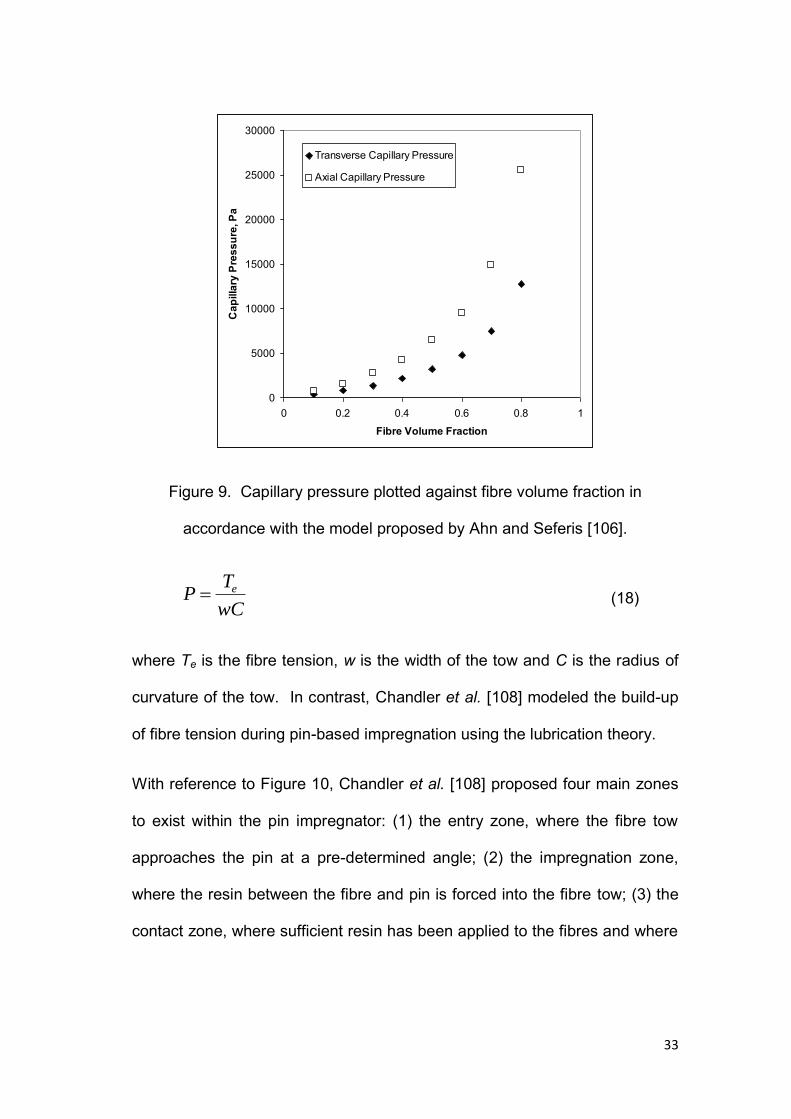
said to equal two for transverse flow and four for axial flow. A simulation of
this can be seen in Figure 9 where the capillary pressure was calculated
using Equations 16 and 17. The fibre radius was assumed to be 8.5
micrometres, the contact angle for the uncured epoxy resin was taken as 57o
and the surface tension was taken as 0.044 N/m [101]. In conclusion, it was
found that the capillary pressure in the axial direction was higher than in the
transverse direction.
(ii) Applied Pressure (A4.2): Bates et al. [107] proposed that the fibre
pressure (P) can also be generated through the use of cylindrical pins during
the impregnation process:
33
Figure 9. Capillary pressure plotted against fibre volume fraction in
accordance with the model proposed by Ahn and Seferis [106].
wC
TP e (18)
where Te is the fibre tension, w is the width of the tow and C is the radius of
curvature of the tow. In contrast, Chandler et al. [108] modeled the build-up
of fibre tension during pin-based impregnation using the lubrication theory.
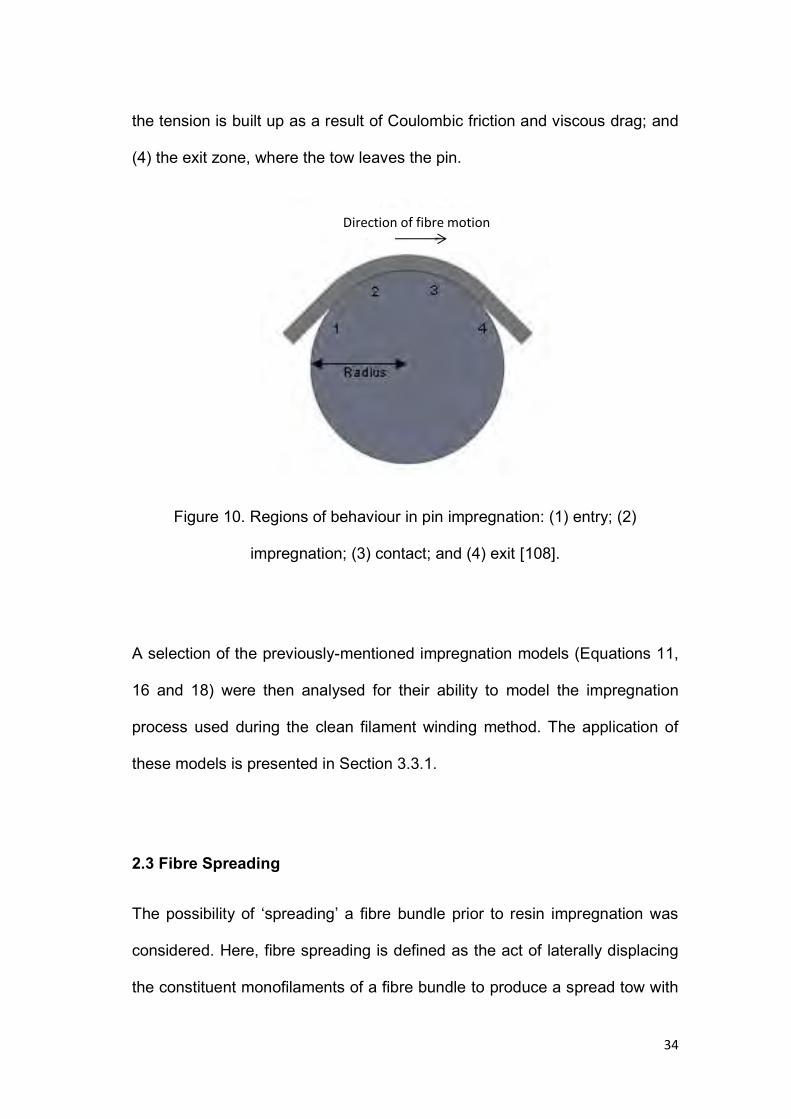
With reference to Figure 10, Chandler et al. [108] proposed four main zones
to exist within the pin impregnator: (1) the entry zone, where the fibre tow
approaches the pin at a pre-determined angle; (2) the impregnation zone,
where the resin between the fibre and pin is forced into the fibre tow; (3) the
contact zone, where sufficient resin has been applied to the fibres and where
0
5000
10000
15000
20000
25000
30000
0 0.2 0.4 0.6 0.8 1
Fibre Volume Fraction
Cap
illar
y Pr
essu
re, P
a
Transverse Capillary Pressure
Axial Capillary Pressure
34
the tension is built up as a result of Coulombic friction and viscous drag; and
(4) the exit zone, where the tow leaves the pin.
Figure 10. Regions of behaviour in pin impregnation: (1) entry; (2)
impregnation; (3) contact; and (4) exit [108].
A selection of the previously-mentioned impregnation models (Equations 11,
16 and 18) were then analysed for their ability to model the impregnation
process used during the clean filament winding method. The application of
these models is presented in Section 3.3.1.
2.3 Fibre Spreading
The possibility of ‘spreading’ a fibre bundle prior to resin impregnation was
considered. Here, fibre spreading is defined as the act of laterally displacing
the constituent monofilaments of a fibre bundle to produce a spread tow with
Direction of fibre motion
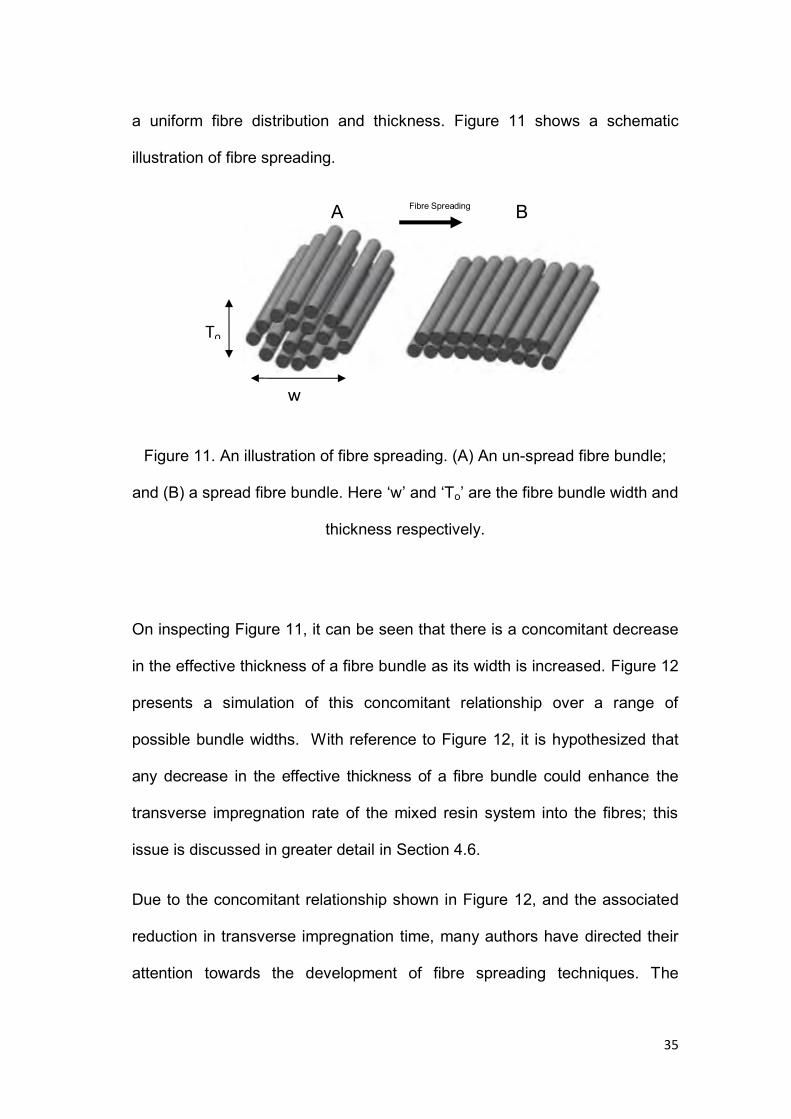
35
a uniform fibre distribution and thickness. Figure 11 shows a schematic
illustration of fibre spreading.
Figure 11. An illustration of fibre spreading. (A) An un-spread fibre bundle;
and (B) a spread fibre bundle. Here ‘w’ and ‘To’ are the fibre bundle width and
thickness respectively.
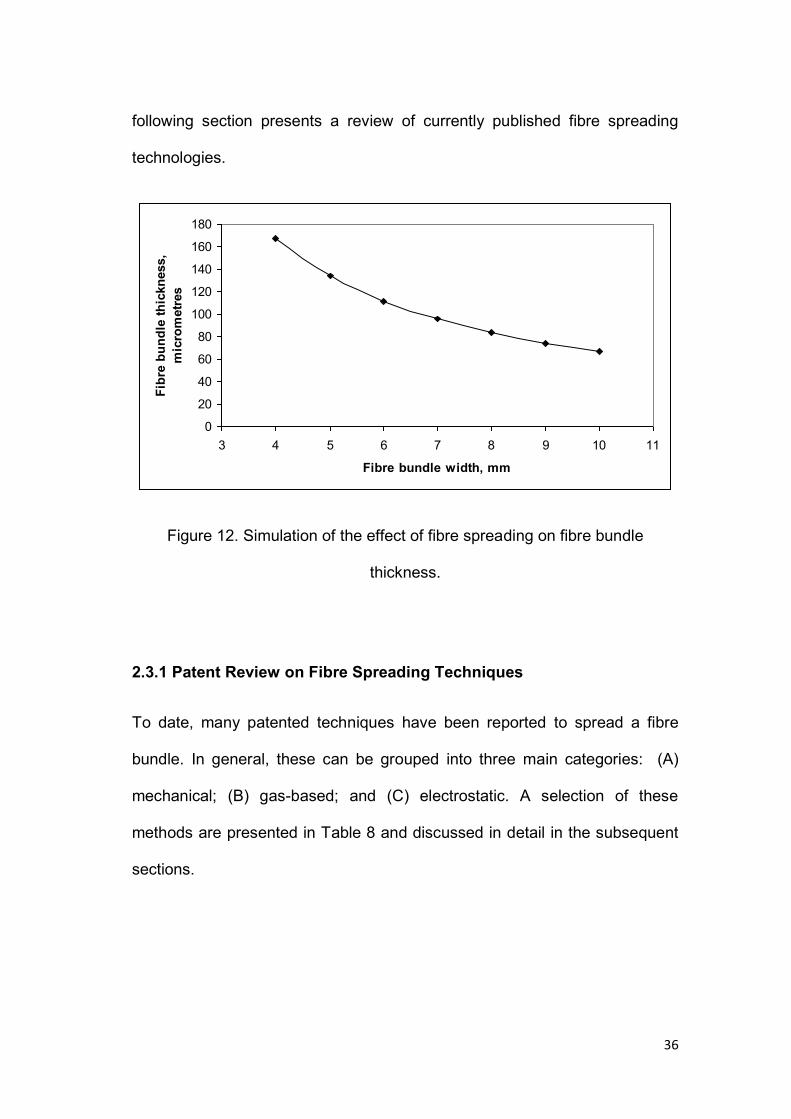
On inspecting Figure 11, it can be seen that there is a concomitant decrease
in the effective thickness of a fibre bundle as its width is increased. Figure 12
presents a simulation of this concomitant relationship over a range of
possible bundle widths. With reference to Figure 12, it is hypothesized that
any decrease in the effective thickness of a fibre bundle could enhance the
transverse impregnation rate of the mixed resin system into the fibres; this
issue is discussed in greater detail in Section 4.6.
Due to the concomitant relationship shown in Figure 12, and the associated
reduction in transverse impregnation time, many authors have directed their
attention towards the development of fibre spreading techniques. The
B A
To
w
Fibre Spreading
36
following section presents a review of currently published fibre spreading
technologies.
Figure 12. Simulation of the effect of fibre spreading on fibre bundle
thickness.
2.3.1 Patent Review on Fibre Spreading Techniques
To date, many patented techniques have been reported to spread a fibre
bundle. In general, these can be grouped into three main categories: (A)
mechanical; (B) gas-based; and (C) electrostatic. A selection of these
methods are presented in Table 8 and discussed in detail in the subsequent
sections.
0
20
40
60
80
100
120
140
160
180
3 4 5 6 7 8 9 10 11
Fibre bundle width, mm
Fibr
e bu
ndle
thic
knes
s,
mic
rom
etre
s
37
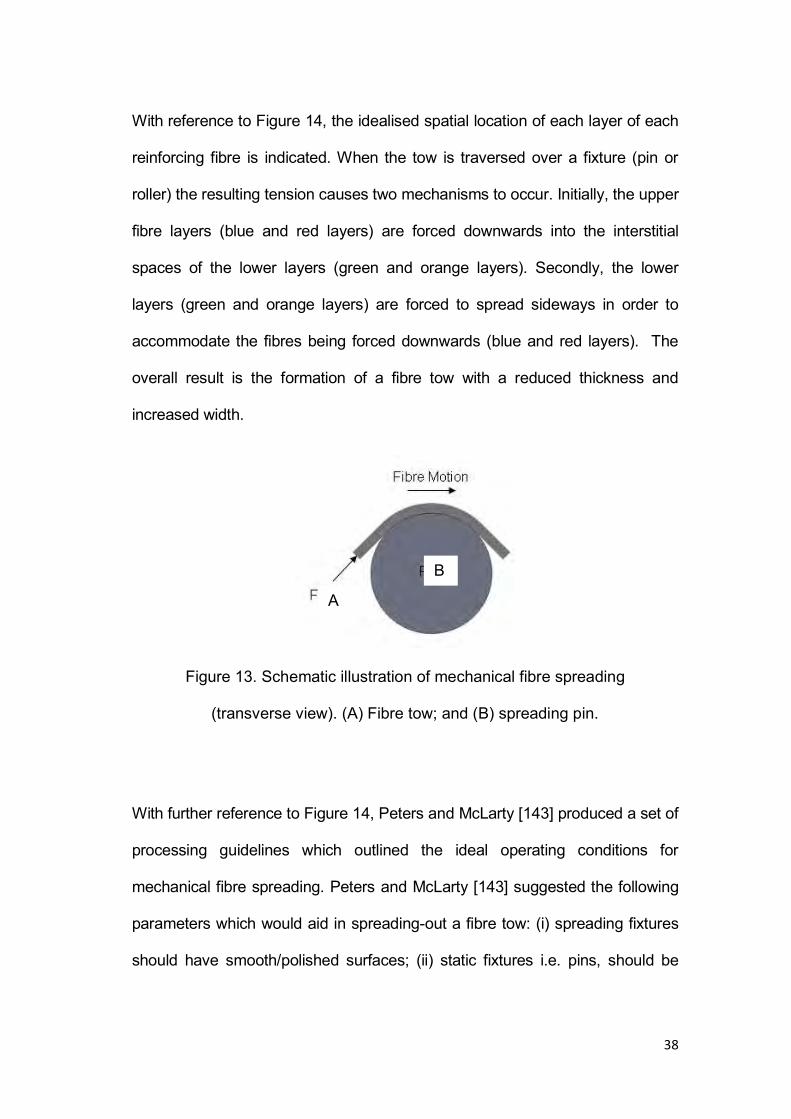
2.3.1.1 Mechanical Techniques for Fibre Spreading
Mechanical fibre spreading is normally achieved by the passing of fibre tows
over a fixed pin or roller [109]; Figures 13 and 14(a and b) show schematic
illustrations. Figure 13 shows a fibre passing over a cylindrical pin fixture and
Figure 14(a and b) shows a schematic idealisation of mechanically-induced
fibre spreading.
Table 8. Summary of selected papers and patents on fibre spreading
methods.
Fibre spreading
techniques
Comments References
Mechanical - Inexpensive and simple
- Usable with multiple tows
- Affected by sizing agents and twists
- Minimal health and safety risks
- Repeatable
[110] [111] [112]
[113] [114] [115]
[116] [117] [118]
[119] [120] [121]
[122] [123] [124]
[125] [126]
Gas-based - Relatively expensive
- Effected by multiple tows
- Severely inhibited by fibre twists
- Health and safety concerns with pressurised
gases
[127] [128] [129]
[130] [131] [132]
[133] [134] [135]
[136] [137] [138]
Electrostatic - Minimal fibre contact
- Relatively expensive
- Effected by fibre twists
- Health and safety concerns
[139] [140] [141]
[142]
38
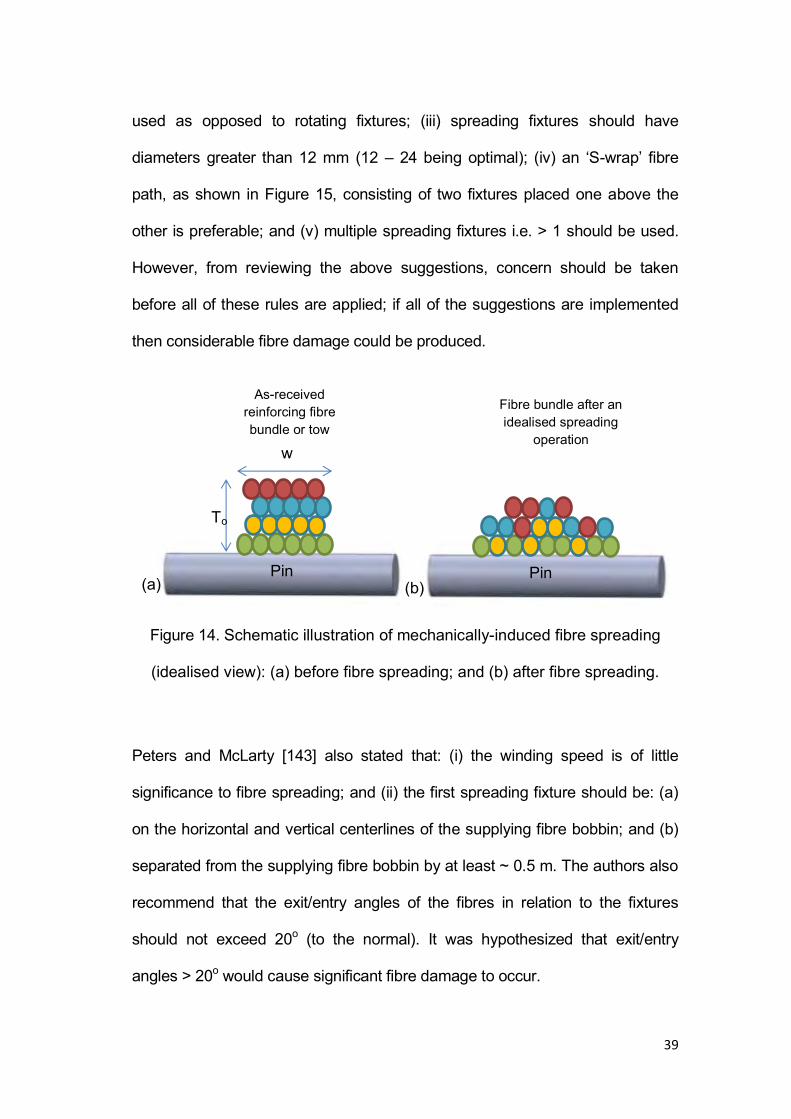
With reference to Figure 14, the idealised spatial location of each layer of each
reinforcing fibre is indicated. When the tow is traversed over a fixture (pin or
roller) the resulting tension causes two mechanisms to occur. Initially, the upper
fibre layers (blue and red layers) are forced downwards into the interstitial
spaces of the lower layers (green and orange layers). Secondly, the lower
layers (green and orange layers) are forced to spread sideways in order to
accommodate the fibres being forced downwards (blue and red layers). The
overall result is the formation of a fibre tow with a reduced thickness and
increased width.
Figure 13. Schematic illustration of mechanical fibre spreading
(transverse view). (A) Fibre tow; and (B) spreading pin.
With further reference to Figure 14, Peters and McLarty [143] produced a set of
processing guidelines which outlined the ideal operating conditions for
mechanical fibre spreading. Peters and McLarty [143] suggested the following
parameters which would aid in spreading-out a fibre tow: (i) spreading fixtures
should have smooth/polished surfaces; (ii) static fixtures i.e. pins, should be
A
B
39
used as opposed to rotating fixtures; (iii) spreading fixtures should have
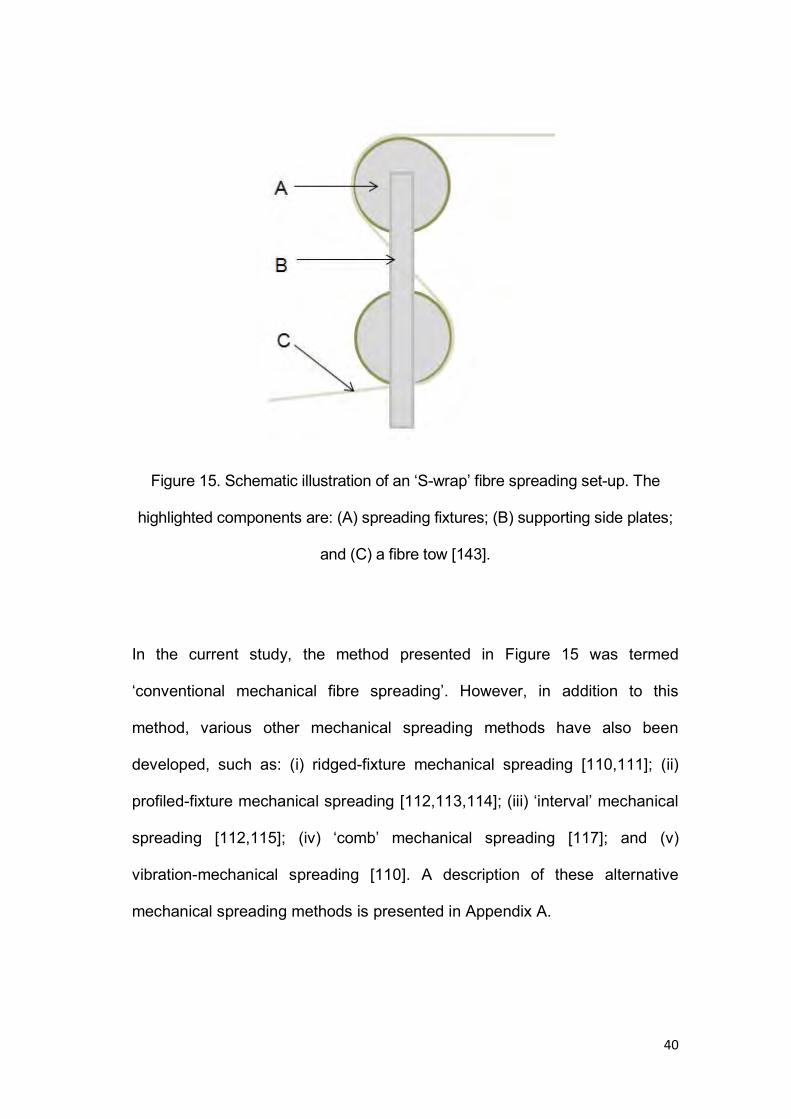
diameters greater than 12 mm (12 – 24 being optimal); (iv) an ‘S-wrap’ fibre
path, as shown in Figure 15, consisting of two fixtures placed one above the
other is preferable; and (v) multiple spreading fixtures i.e. > 1 should be used.
However, from reviewing the above suggestions, concern should be taken
before all of these rules are applied; if all of the suggestions are implemented
then considerable fibre damage could be produced.
Figure 14. Schematic illustration of mechanically-induced fibre spreading
(idealised view): (a) before fibre spreading; and (b) after fibre spreading.
Peters and McLarty [143] also stated that: (i) the winding speed is of little
significance to fibre spreading; and (ii) the first spreading fixture should be: (a)
on the horizontal and vertical centerlines of the supplying fibre bobbin; and (b)
separated from the supplying fibre bobbin by at least ~ 0.5 m. The authors also
recommend that the exit/entry angles of the fibres in relation to the fixtures
should not exceed 20o (to the normal). It was hypothesized that exit/entry
angles > 20o would cause significant fibre damage to occur.
(a) (b) Pin Pin
To
As-received reinforcing fibre bundle or tow
Fibre bundle after an idealised spreading
operation w
40
Figure 15. Schematic illustration of an ‘S-wrap’ fibre spreading set-up. The
highlighted components are: (A) spreading fixtures; (B) supporting side plates;
and (C) a fibre tow [143].
In the current study, the method presented in Figure 15 was termed
‘conventional mechanical fibre spreading’. However, in addition to this
method, various other mechanical spreading methods have also been
developed, such as: (i) ridged-fixture mechanical spreading [110,111]; (ii)
profiled-fixture mechanical spreading [112,113,114]; (iii) ‘interval’ mechanical
spreading [112,115]; (iv) ‘comb’ mechanical spreading [117]; and (v)
vibration-mechanical spreading [110]. A description of these alternative
mechanical spreading methods is presented in Appendix A.
41
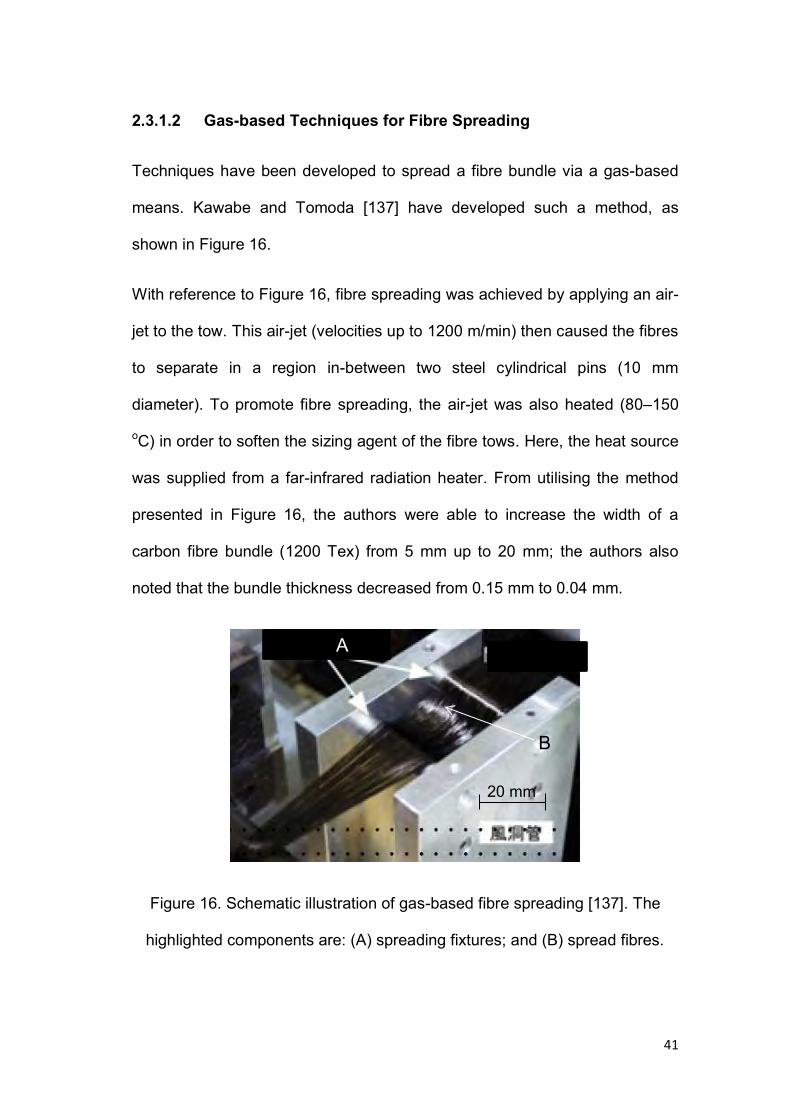
2.3.1.2 Gas-based Techniques for Fibre Spreading
Techniques have been developed to spread a fibre bundle via a gas-based
means. Kawabe and Tomoda [137] have developed such a method, as
shown in Figure 16.
With reference to Figure 16, fibre spreading was achieved by applying an air-
jet to the tow. This air-jet (velocities up to 1200 m/min) then caused the fibres
to separate in a region in-between two steel cylindrical pins (10 mm
diameter). To promote fibre spreading, the air-jet was also heated (80–150
oC) in order to soften the sizing agent of the fibre tows. Here, the heat source
was supplied from a far-infrared radiation heater. From utilising the method
presented in Figure 16, the authors were able to increase the width of a
carbon fibre bundle (1200 Tex) from 5 mm up to 20 mm; the authors also
noted that the bundle thickness decreased from 0.15 mm to 0.04 mm.
Figure 16. Schematic illustration of gas-based fibre spreading [137]. The
highlighted components are: (A) spreading fixtures; and (B) spread fibres.
20 mm
B
A
42
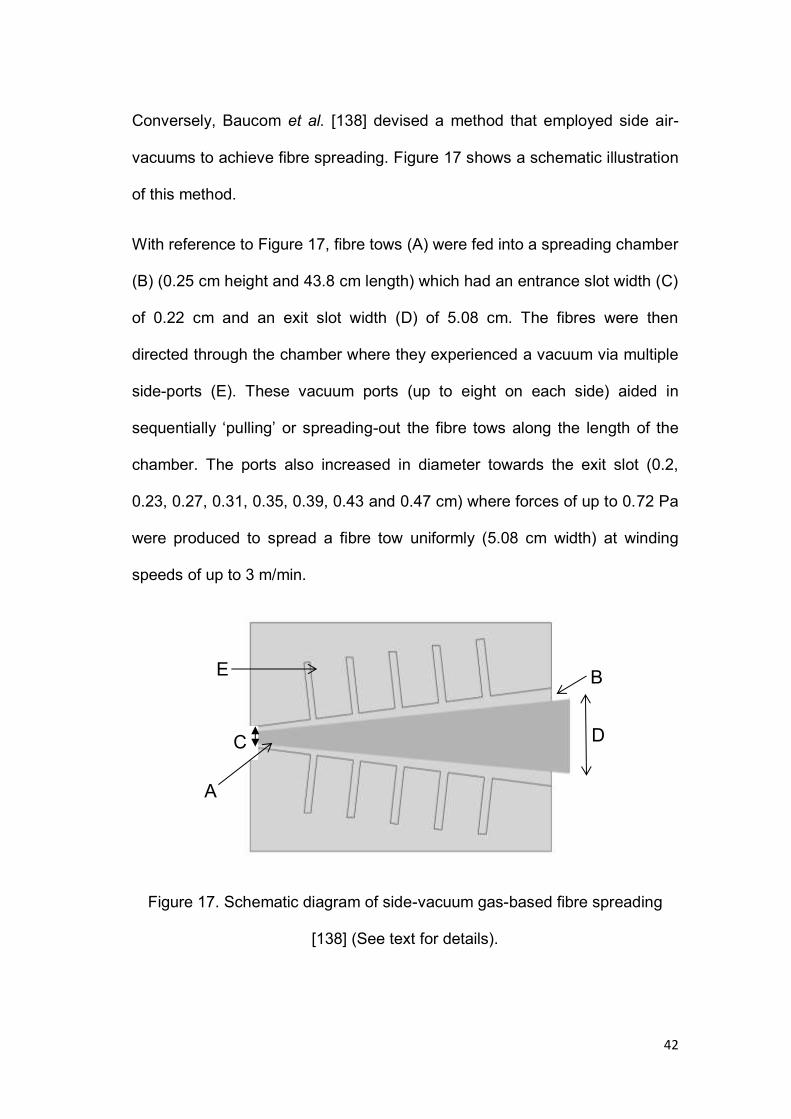
Conversely, Baucom et al. [138] devised a method that employed side air-
vacuums to achieve fibre spreading. Figure 17 shows a schematic illustration
of this method.
With reference to Figure 17, fibre tows (A) were fed into a spreading chamber
(B) (0.25 cm height and 43.8 cm length) which had an entrance slot width (C)
of 0.22 cm and an exit slot width (D) of 5.08 cm. The fibres were then
directed through the chamber where they experienced a vacuum via multiple
side-ports (E). These vacuum ports (up to eight on each side) aided in
sequentially ‘pulling’ or spreading-out the fibre tows along the length of the
chamber. The ports also increased in diameter towards the exit slot (0.2,
0.23, 0.27, 0.31, 0.35, 0.39, 0.43 and 0.47 cm) where forces of up to 0.72 Pa
were produced to spread a fibre tow uniformly (5.08 cm width) at winding
speeds of up to 3 m/min.
Figure 17. Schematic diagram of side-vacuum gas-based fibre spreading
[138] (See text for details).
C D
B E
A
43
From reviewing Figures 16 and 17, it can be seen that these methods were
developed to promote fibre spreading with low mechanical friction forces. The
advantages of this were: (i) a reduced chance of fibre abrasion during
production; and (ii) a reduced need for constant machine maintenance i.e.
maintenance and replacement of smooth spreading fixtures. However,
despite these advantages, gas-based fibre spreading methods also have
negative aspects, such as: (i) the need to heat the fibres to relatively high
temperatures; and (ii) their limited capacity in a multi-tow manufacturing
process.
Due to the multiple issues which are present with each spreading method,
the following section presents an overview of their comparative advantages
and disadvantages.
2.3.2. Summary of Fibre Spreading Review
All of the above-discussed spreading techniques were attempting to fulfill the
following criteria:
(i) Maximise fibre spreading: As previously mentioned, the lateral spreading
of a fibre tow can produce reductions in its nominal thickness; these
reductions can aid with the transverse impregnation of a fibre tow. However,
this is not a straight-forward issue; the presence of fibre twists (produced
from the unwinding of a bobbin) will inhibit the ability of a method to spread-
out a fibre tow.
44
(ii) Maximise fibre spreading without causing fibre damage: The issue of
fibre spreading is further complicated by the presence of a binder system
which coats the individual filaments of a fibre tow. To enable efficient lateral
separation of the individual filaments within a tow, the mechanical integrity of
the binder has to be reduced without inducing secondary damage to the
reinforcement. The development of a fibre spreading method must not cause
any fibre damage during production; any damage will negate any
improvements which the spreading method could produce.
(iii) Health and Safety: All fibre spreading processes must comply with strict
health and safety legislation. The generation of air-borne particles is an issue
for glass and carbon fibres respectively. Therefore, adequate measures will
have to be taken to trap and extract any debris generated during all fibre
spreading processes. Electrical safety issues will also need to be considered
if any electrical potentials are used to induce fibre separation.
(iv) Cost-effective: A fibre spreading process must also not considerably
increase the overall cost of a composite production method. Ideally, the fibre
spreading method should offer: (i) low maintenance costs; (ii) low electrical
consumption costs; and (iii) no dedicated man-power processing costs i.e.
fully automated.
2.4 EU Directives and Waste Disposal Legislation
Thermoset composite materials can be found in many engineering sectors
such as automotive, aerospace and sporting [144]. However, despite their
45
popularity (approximately 4 million tonnes produced in 2010 [7]) relatively
little attention has been directed towards the management of end-of-life
composite materials. To date, UK legislation regarding end-of-life (waste)
composite materials is controlled by the Environmental Action Program 6
(EAP6 2002); entitled ‘Environment 2010: Our Future, Our Choice’ [145,146].
This program has four main priority areas: (i) climate change; (ii) biodiversity;
(iii) environment and health; and (iv) sustainable management of resources
and waste.
The EAP6 2002 action program was developed to address multiple issues
within various fields, however with regards to composite
materials/manufacturing, this action program was developed to: (i) aid with
the reduction of waste material production; (ii) improve waste material
recycling processes; and (iii) strictly control the disposal of any waste
materials. In particular, the EAP6 2002 action program aided with the
enforcement of multiple legislative directives and attempted to address the
increasing costs associated with the disposal of waste composites [147].
The directives which were developed by the EAP6 2002 action plan were
established in-tandem with voluntary agreements, taxes and subsidies;
examples of such directives are:
i. Waste Framework Directive (2008/98/EC) [148]
ii. Landfill Directive (2003/33/EC) [149]
iii. End-of-life Vehicle Directive (2005/673/EC) [150]
To enforce the EAP6 2002 action plan in the UK a set of Environmental
46
Permitting (EP) Regulations were introduced in 2007 [151]. In essence, the
EP regulations acted as an ‘organisational umbrella’ under which over 40
items of individual legislation were pooled [152] i.e. EU directives 2008/98/EC
[148], 2003/33/EC [149], 96/61/EC [153] and 2005/673/EC [150] etc. These
regulations have since been updated over recent years and ‘EP Regulations
2010’ are currently in force.
From reviewing the highlighted directives, it can be seen that the composites
industry will need to dedicate considerable attention to the development of
efficient and economically viable composite recycling methods. The following
section presents a review of the methods which have already been
developed to recycle thermoset composite components.
2.5 Review of Thermoset Composite Recycling Methods
The following section presents a review of various methods which have been
developed to recycle thermoset composite materials. In general, thermoset
composite recycling methods can be categorised into four main areas,
namely; (i) thermal; (ii) mechanical; (iii) chemical; and (iv) re-use. An
overview of these processing methods is presented in Figure 18. With
reference to Figure 18, this diagram has been adopted from the illustrations
presented previously by Pickering [154] and Otheguy et al. [155].
2.5.1 Thermal Composite Recycling Methods [154]
Thermal recycling methods generally utilise high-temperature environments
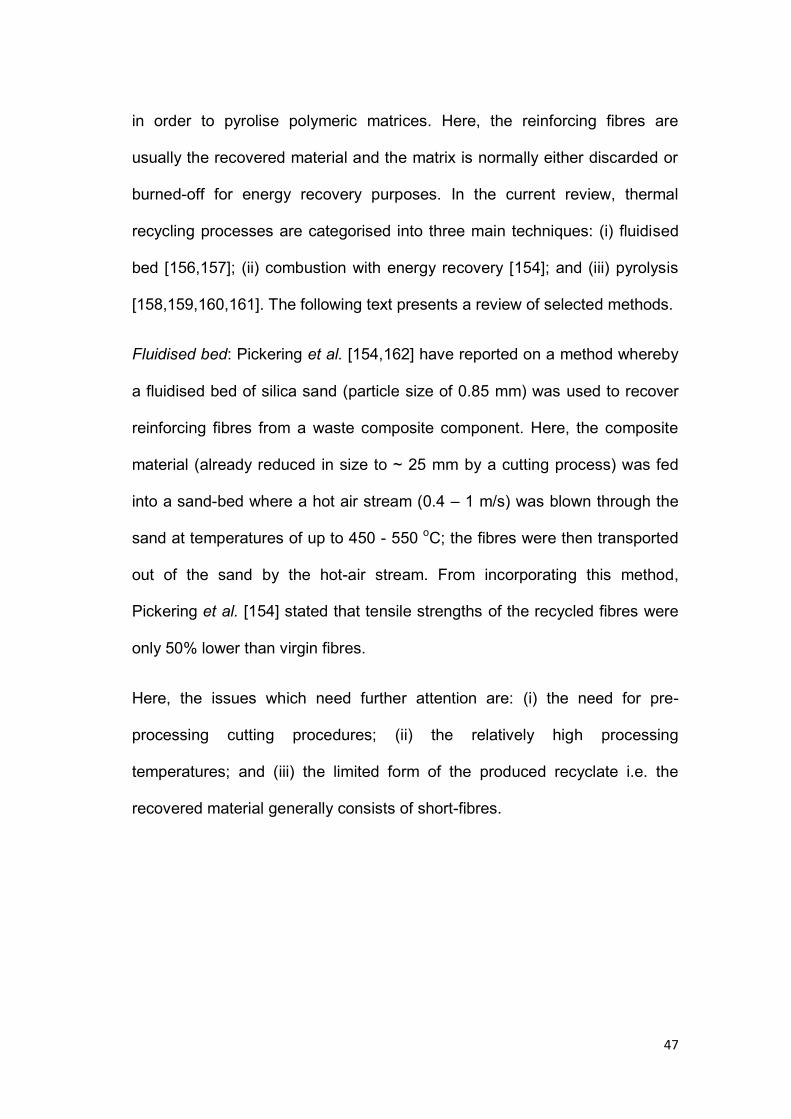
47
in order to pyrolise polymeric matrices. Here, the reinforcing fibres are
usually the recovered material and the matrix is normally either discarded or
burned-off for energy recovery purposes. In the current review, thermal
recycling processes are categorised into three main techniques: (i) fluidised
bed [156,157]; (ii) combustion with energy recovery [154]; and (iii) pyrolysis
[158,159,160,161]. The following text presents a review of selected methods.
Fluidised bed: Pickering et al. [154,162] have reported on a method whereby
a fluidised bed of silica sand (particle size of 0.85 mm) was used to recover
reinforcing fibres from a waste composite component. Here, the composite
material (already reduced in size to ~ 25 mm by a cutting process) was fed
into a sand-bed where a hot air stream (0.4 – 1 m/s) was blown through the
sand at temperatures of up to 450 - 550 oC; the fibres were then transported
out of the sand by the hot-air stream. From incorporating this method,
Pickering et al. [154] stated that tensile strengths of the recycled fibres were
only 50% lower than virgin fibres.
Here, the issues which need further attention are: (i) the need for pre-
processing cutting procedures; (ii) the relatively high processing
temperatures; and (iii) the limited form of the produced recyclate i.e. the
recovered material generally consists of short-fibres.
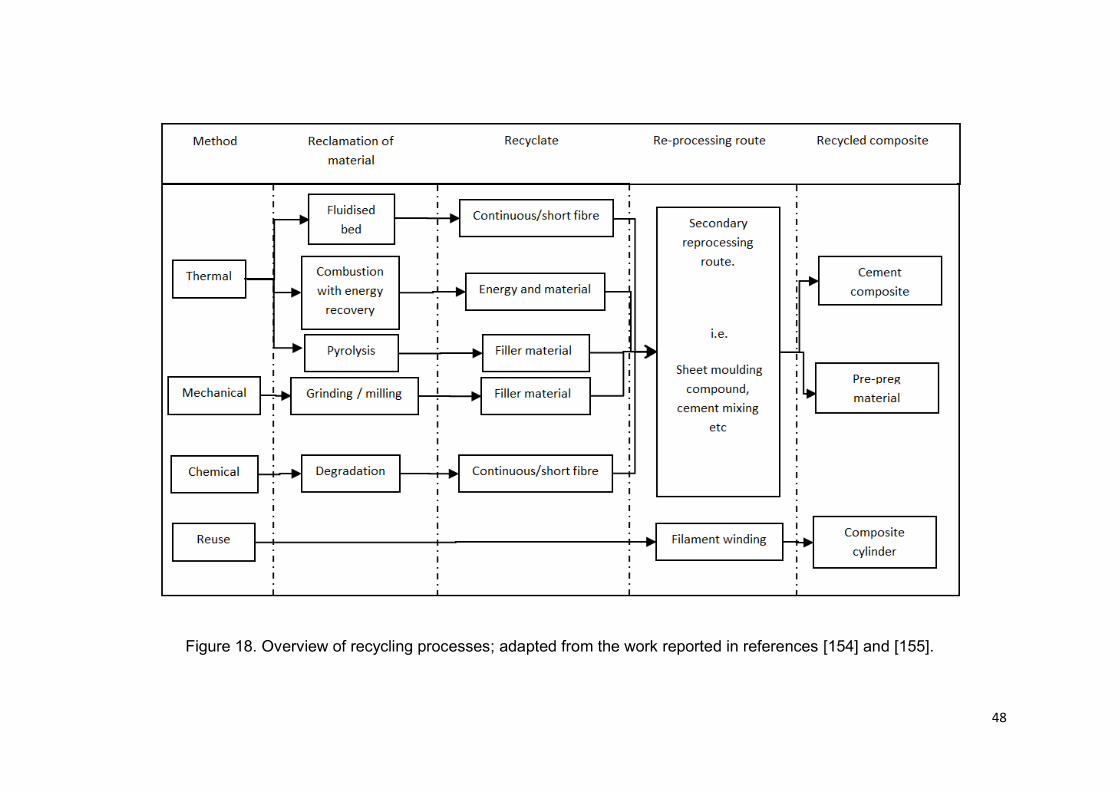
48
Figure 18. Overview of recycling processes; adapted from the work reported in references [154] and [155].
49
Pyrolysis: Cunliffe and Williams [158] have reported on a process for recycling a
polyester/styrene glass-fibre composite. Here, a fixed-bed reactor was used to
heat a composite at 5 oC per minute up to ~450 oC whilst being purged with
nitrogen gas. This process burned-off the resin system and released the
reinforcing fibres. The remaining fibres were then heat treated at 450 oC and
had any remaining ash removed. From incorporating this method, Cunliffe and
Williams [158] stated that they were able to produce recycled reinforcing fibres
which could be substituted into virgin fibre composites (25% weight
replacement). The experimental data from this study showed that the
replacement of virgin fibres with recycled fibres produced a 27%, 10% and 19%
reduction in the composites Charpy impact strength, flexural strength and
flexural modulus respectively.
A summary of the above-mentioned thermal recycling methods is presented in
Table 9. With reference to Table 9, various thermal recycling methods which
were not discussed in this review are also presented for reference. From
reviewing the methods presented in Table 9, it can be seen that relatively
successful recovery of reinforcing fibres have been reported. However, as
mentioned in various studies [154,163], the efficiency, output rates and cost-
effectiveness of these methods are considerably lower than that which is
necessary for economic viability. It was postulated that composite recycling
methods will only become cost-effective if mass carbon-fibre recycling
opportunities are available [154,163]. For example, the method presented by
Pickering et al. would have to process 10,000 tonnes of waste glass-fibre per
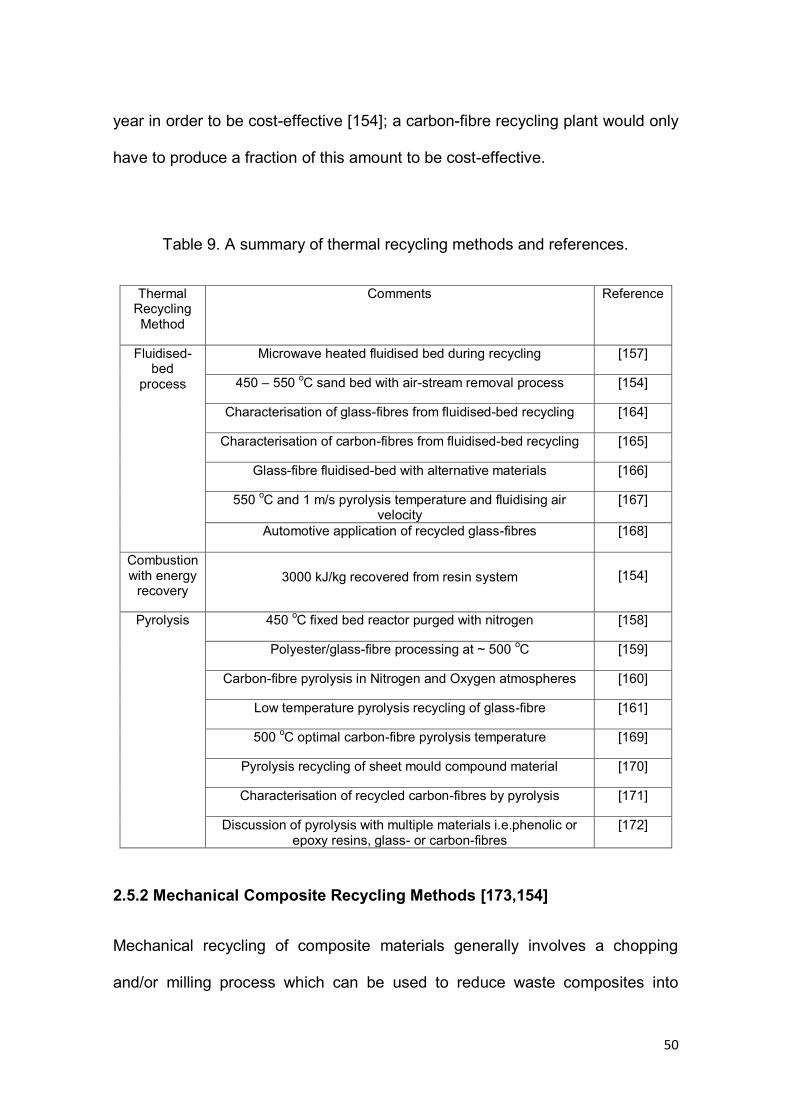
50
year in order to be cost-effective [154]; a carbon-fibre recycling plant would only
have to produce a fraction of this amount to be cost-effective.
Table 9. A summary of thermal recycling methods and references.
Thermal Recycling Method
Comments Reference
Fluidised-bed
process
Microwave heated fluidised bed during recycling [157]
450 – 550 oC sand bed with air-stream removal process [154]
Characterisation of glass-fibres from fluidised-bed recycling [164]
Characterisation of carbon-fibres from fluidised-bed recycling [165]
Glass-fibre fluidised-bed with alternative materials [166]
550 oC and 1 m/s pyrolysis temperature and fluidising air velocity
[167]
Automotive application of recycled glass-fibres [168]
Combustion with energy
recovery
3000 kJ/kg recovered from resin system [154]
Pyrolysis 450 oC fixed bed reactor purged with nitrogen [158]
Polyester/glass-fibre processing at ~ 500 oC [159]
Carbon-fibre pyrolysis in Nitrogen and Oxygen atmospheres [160]
Low temperature pyrolysis recycling of glass-fibre [161]
500 oC optimal carbon-fibre pyrolysis temperature [169]
Pyrolysis recycling of sheet mould compound material [170]
Characterisation of recycled carbon-fibres by pyrolysis [171]
Discussion of pyrolysis with multiple materials i.e.phenolic or epoxy resins, glass- or carbon-fibres
[172]
2.5.2 Mechanical Composite Recycling Methods [173,154]
Mechanical recycling of composite materials generally involves a chopping
and/or milling process which can be used to reduce waste composites into
51
recycled particles [174]. Here, a crushing and/or chopping method is initially
used to reduce all waste materials into parts of 50–100 mm in size [154]. The
chopped/crushed components are then placed inside a hammer mill or high-
speed mill where a further reduction in the size of the waste composite is
achieved (~50 μm). A classifying method i.e. sieving, is normally then employed
to separate the recycled particles into fractions of different size [175]. The
produced components are a mixture of fibre and resin (in a powder form) which
can be used as filler materials in secondary applications [176,177,178].
As mentioned in various review papers [154], it has not yet been possible for a
mechanical recycling method to achieve long-term financial viability. To date,
many attempts have been made to make this method a viable option [179],
however none of these attempts were successful due to: (i) the lack of a strong
outlet market; (ii) relatively high-production costs; and (iii) relatively low
production rates.
2.5.3 Chemical Composite Recycling Methods
Chemical methods, as that proposed by Jiang et al. [180] and others [181-189],
can also be used to recycle waste composite materials. With reference to the
study presented by Jiang et al. [180], recycling was achieved via the use of
supercritical alcohols (supercritical n-propanol) where degradation of the
polymer matrix allowed for the reclamation of reinforcing fibres. Here,
processing took place in a semi-continuous flow reactor where composite
samples (~10 mm x 200 mm) were exposed to supercritical n-propanol whilst
52
the reactor reached a maximum temperature of 310 °C and pressure of 52 Bar.
After a processing time of 40 minutes, the matrix was said to have been fully
degraded and was washed away with the n-propanol. The remaining fibres
could then be cleaned and dried and used in a secondary application [180]. A
summary of the study presented by Jiang et al. [180] and other chemical
recycling methods is presented in Table 10.
2.5.4 Re-use Composite Recycling Methods
In the current study, the term ‘re-use recycling’ was defined as the direct use of
a used/waste material in a manufacturing process or secondary application.
This method, unlike all of the processes described above, does not involve any
reclamation of any of the constituent components of the composite and
therefore is relatively simple. For example, re-use recycling can be achieved
from the simple reincorporation of a used vehicle front guard (bumper) into the
manufacture of a new vehicle [182]. However, this method has been
predominantly used with thermoplastic materials and the incorporation of
thermoset materials has been severely limited.
The limited use of re-use thermoset recycling, however simple, is still relatively
uncommon with composites due to [183]: (i) the possible presence of defects in
the supposed end-of-life products; (ii) a lack of applicable situations; and (iii) the
lack of a lucrative market which would create a great enough demand for
economic viability.
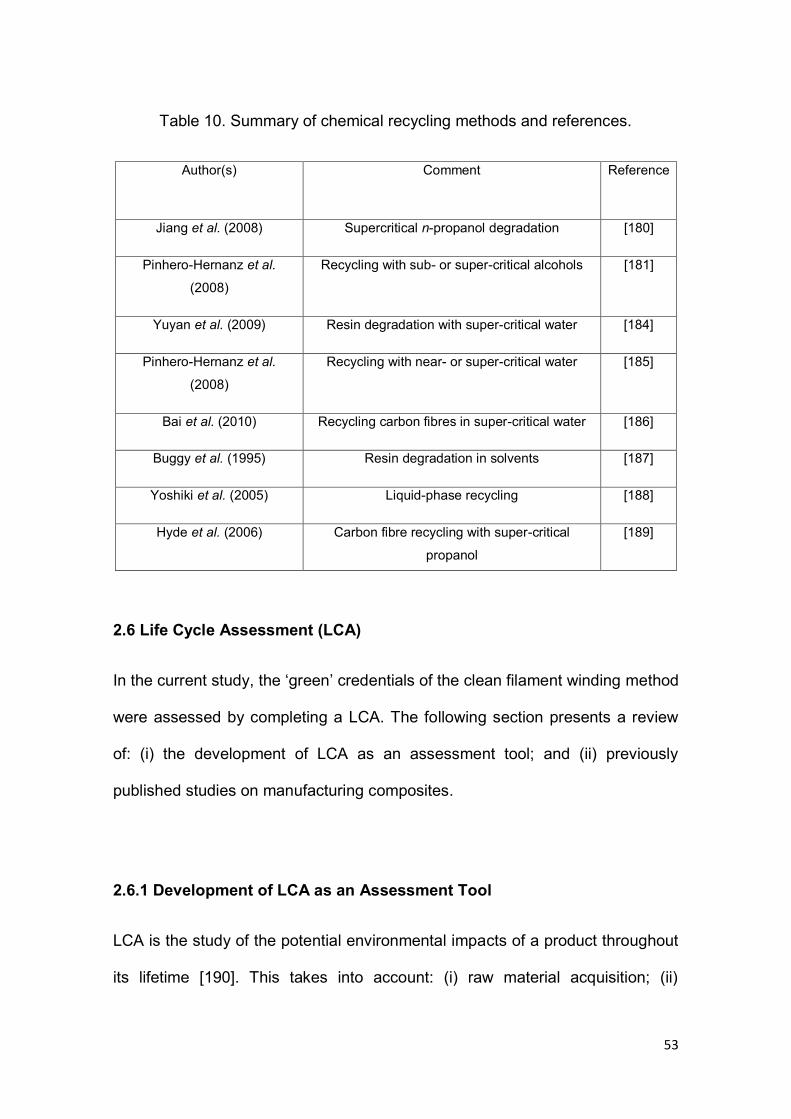
53
Table 10. Summary of chemical recycling methods and references.
Author(s)
Comment Reference
Jiang et al. (2008) Supercritical n-propanol degradation [180]
Pinhero-Hernanz et al.
(2008) Recycling with sub- or super-critical alcohols [181]
Yuyan et al. (2009) Resin degradation with super-critical water [184]
Pinhero-Hernanz et al.
(2008) Recycling with near- or super-critical water [185]
Bai et al. (2010) Recycling carbon fibres in super-critical water [186]
Buggy et al. (1995) Resin degradation in solvents [187]
Yoshiki et al. (2005) Liquid-phase recycling [188]
Hyde et al. (2006) Carbon fibre recycling with super-critical
propanol [189]
2.6 Life Cycle Assessment (LCA)
In the current study, the ‘green’ credentials of the clean filament winding method
were assessed by completing a LCA. The following section presents a review
of: (i) the development of LCA as an assessment tool; and (ii) previously
published studies on manufacturing composites.
2.6.1 Development of LCA as an Assessment Tool
LCA is the study of the potential environmental impacts of a product throughout
its lifetime [190]. This takes into account: (i) raw material acquisition; (ii)
A
54
production; (iii) use; and (iv) end-of-life management options i.e. recycling,
incineration, and/or disposal [191]. To undertake an LCA the following steps
must be completed: (a) an inventory of relevant inputs and outputs of a
production system must be compiled; (b) the potential environmental impacts
associated with the aforementioned inputs and outputs must be evaluated; and
(c) the results presented by the inventory analysis and impact assessment
phases must be interpreted [191].
Originally, the method of LCA was developed as a result of the ‘Earth Summit’
held in Rio de Janeiro, Brazil, in 1992 [192]. Here, world leaders signed and
‘agreed’ with a legislative framework which would attempt to address issues
related to climate change and biological diversity. As a result, an ISO technical
committee (Committee 207) for environmental management was created in
1993. One of the main aims of this ISO committee was to standardise and
develop a series of ISO 1404(x) standards which governed the development of
LCA as an environmental assessment tool and management system [192,193].
A summary of the ISO 1404(x) standards is presented below:
ISO 14040 [194]: An overview of the practice, application and limitations
of LCA to potential users.
ISO 14041 [195]: A guide to the preparation and development of a life
cycle inventory analysis. This involves the compilation and quantification
of the relevant input and outputs of a production system.
ISO 14042 [196]: A guide for completing the impact assessment phase of
an LCA analysis.
55
ISO 14043 [197]: An outline for completing the impact interpretation
phase of an LCA analysis. This should relate to the goal and scope of the
analysis.
A review of LCA studies which have been developed to analyse various
composite manufacturing methods is presented in the following section.
2.6.2 Review of LCA Studies
Several LCA analyses of production methods for composites have been
published. For instance, many authors have analysed the effects of using
natural fibres during composites manufacturing [198,199]; Table 11 presents a
selected summary of such papers.
Many authors have also analysed the effects of improving vehicle fuel efficiency
through the use of lightweight composite components [200,201,202]. For
example, Song et al. [201] completed an LCA investigation into composite
materials in the automotive industry. Song et al. [201] analysed: (i) the flow and
consumption of energy during the production of glass fibre/polyester pultruded
rods; and (ii) the feasibility of using composite materials in the automotive
industry. The four main stages of this LCA investigation were as follows:
(i) Material production: To produce polyester resin (via a conventional chemical
processing method) and glass-fibre (via a conventional drawing process) an
estimated 63-78 MJ/kg and 13–32 MJ/kg of energy was consumed respectively.
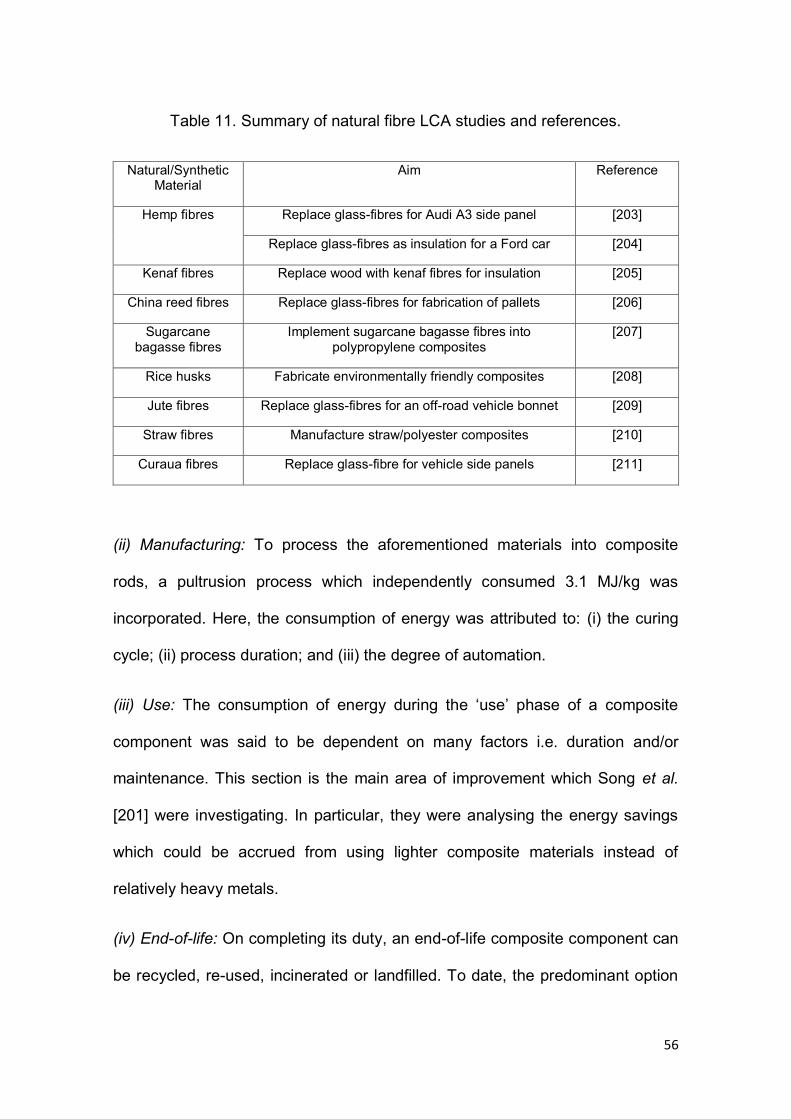
56
Table 11. Summary of natural fibre LCA studies and references.
Natural/Synthetic Material
Aim Reference
Hemp fibres Replace glass-fibres for Audi A3 side panel [203]
Replace glass-fibres as insulation for a Ford car [204]
Kenaf fibres Replace wood with kenaf fibres for insulation [205]
China reed fibres Replace glass-fibres for fabrication of pallets [206]
Sugarcane bagasse fibres
Implement sugarcane bagasse fibres into polypropylene composites
[207]
Rice husks Fabricate environmentally friendly composites [208]
Jute fibres Replace glass-fibres for an off-road vehicle bonnet [209]
Straw fibres Manufacture straw/polyester composites [210]
Curaua fibres Replace glass-fibre for vehicle side panels [211]
(ii) Manufacturing: To process the aforementioned materials into composite
rods, a pultrusion process which independently consumed 3.1 MJ/kg was
incorporated. Here, the consumption of energy was attributed to: (i) the curing
cycle; (ii) process duration; and (iii) the degree of automation.
(iii) Use: The consumption of energy during the ‘use’ phase of a composite
component was said to be dependent on many factors i.e. duration and/or
maintenance. This section is the main area of improvement which Song et al.
[201] were investigating. In particular, they were analysing the energy savings
which could be accrued from using lighter composite materials instead of
relatively heavy metals.
(iv) End-of-life: On completing its duty, an end-of-life composite component can
be recycled, re-used, incinerated or landfilled. To date, the predominant option
57
is to landfill any waste. However, the method of landfilling is considerably
wasteful and, as a result, all ‘material energy’ is lost. This restrictive end-of-life
phase acts as a major barrier to the application of composite materials into
many sectors [201].
On completing the above-mentioned phases, the authors calculated that 50.31
MJ of energy was needed for the production of a 1 kg pultruded rod. This value
was then used to calculate the life-cycle energy consumption of composite
pultruded rods when used as a substitution for steel in the manufacture of an
automotive Truck (Isuzu N-Series). Here, the truck had an overall mass of 3600
kg, of which 643 kg (17.9% of the total truck weight) comprised steel rods.
The results of this comparison showed that the use of composite rods produced
an overall life cycle energy saving of 184.2 GJ of energy; 13.6 GJ of energy
during manufacture, 181 GJ during use (assumed for a travelling distance of
190,000 km over ten years) and -10.4 GJ during end-of-life. With reference to
the ‘use’ phase, considerable energy savings were possible due to the overall
reduction (429 kg) of the truck weight due to the use of lightweight composite
materials. However, with reference to the ‘end-of-life’ phase, the energy deficit
(-10.4 GJ) was attributed to the poor end-of-life options of the composite
materials i.e. lack of re-use and/or recycling options.
The LCA study carried out by Song et al. [201] showed that the use of
composite materials could be beneficial to the automotive industry. However,
comparative results of this study also showed that the substitution of aluminium,
instead of a composite, would result in even further energy reductions. It was
58
demonstrated that the limited end-of-life management options of composite
materials inhibits the comparative LCA performance of composite components.
A summary of this study and other studies which have completed LCA analyses
of composite materials in the automotive industry are presented in Table 12.
However, in contradiction to the above studies, Marsh [212] has recently stated
that it should no longer be acceptable to state that composites help the
environment by simply improving the fuel efficiency of various vehicles. Marsh
[212] argued that the composites industry must react to ensuing legislation and
directives which will attempt to address various issues with regards to: (i)
energy-intensive manufacture: (ii) emission of volatile substances; and (iii) the
production of waste material that is inherently difficult to recycle. As a result, a
report called ‘The green guide to composites: an environmental profiling system
for composite materials and products’, produced from a research project
involving NetComposites, the Building Research Establishment (BRE) and the
UK’s Department of Trade and Industry has been reported [212]. This guide
was produced in an attempt to aid composite manufacturers in choosing a
processing method which fulfils their specific manufacturing needs whilst also
being environmentally and socially acceptable. In this report, a rating system
was used to grade various manufacturing materials and methods depending on
their environmental and social impacts; the ratings ranged from A (good) to E
(poor). A summary of the overall environmental ratings for the processes
analysed during this study are presented in Table 13. In this table, it should be
noted that these results were not produced from a complete cradle-to-grave
LCA analysis; the authors stated that no ‘use’ or ‘end-of-life’ issues were able to
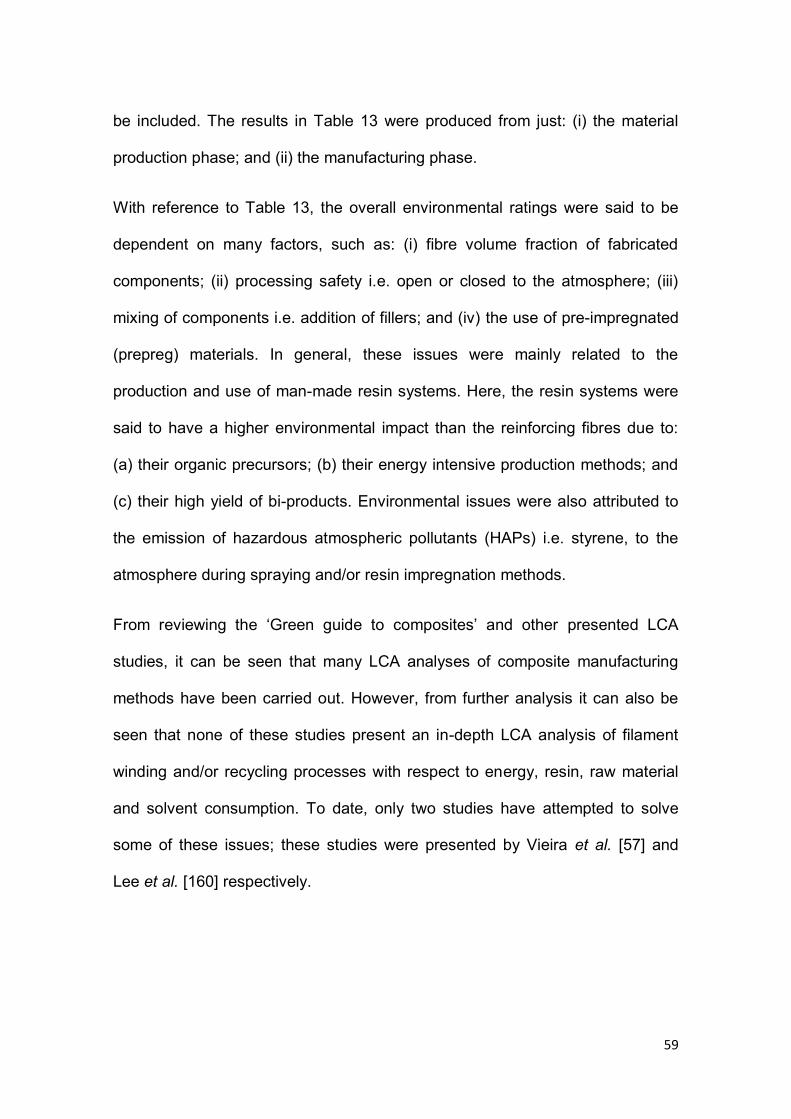
59
be included. The results in Table 13 were produced from just: (i) the material
production phase; and (ii) the manufacturing phase.
With reference to Table 13, the overall environmental ratings were said to be
dependent on many factors, such as: (i) fibre volume fraction of fabricated
components; (ii) processing safety i.e. open or closed to the atmosphere; (iii)
mixing of components i.e. addition of fillers; and (iv) the use of pre-impregnated
(prepreg) materials. In general, these issues were mainly related to the
production and use of man-made resin systems. Here, the resin systems were
said to have a higher environmental impact than the reinforcing fibres due to:
(a) their organic precursors; (b) their energy intensive production methods; and
(c) their high yield of bi-products. Environmental issues were also attributed to
the emission of hazardous atmospheric pollutants (HAPs) i.e. styrene, to the
atmosphere during spraying and/or resin impregnation methods.
From reviewing the ‘Green guide to composites’ and other presented LCA
studies, it can be seen that many LCA analyses of composite manufacturing
methods have been carried out. However, from further analysis it can also be
seen that none of these studies present an in-depth LCA analysis of filament
winding and/or recycling processes with respect to energy, resin, raw material
and solvent consumption. To date, only two studies have attempted to solve
some of these issues; these studies were presented by Vieira et al. [57] and
Lee et al. [160] respectively.
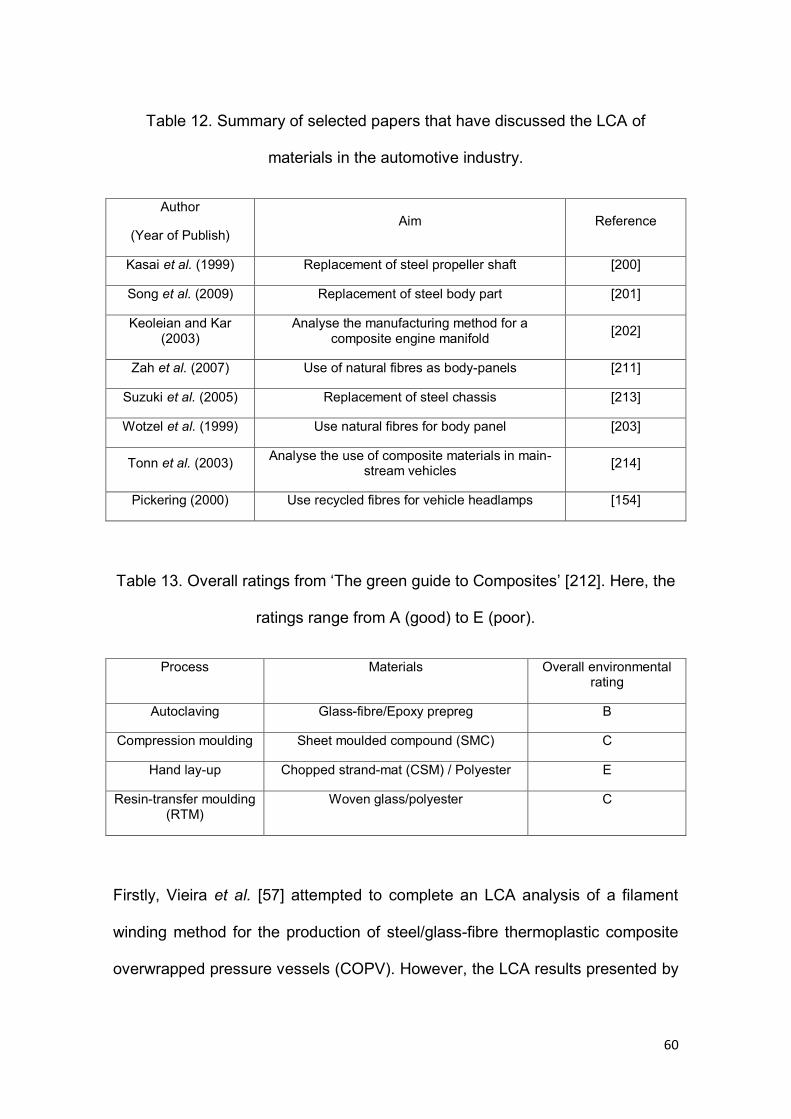
60
Table 12. Summary of selected papers that have discussed the LCA of
materials in the automotive industry.
Author
(Year of Publish) Aim Reference
Kasai et al. (1999) Replacement of steel propeller shaft [200]
Song et al. (2009) Replacement of steel body part [201]
Keoleian and Kar (2003)
Analyse the manufacturing method for a composite engine manifold [202]
Zah et al. (2007) Use of natural fibres as body-panels [211]
Suzuki et al. (2005) Replacement of steel chassis [213]
Wotzel et al. (1999) Use natural fibres for body panel [203]
Tonn et al. (2003) Analyse the use of composite materials in main-stream vehicles [214]
Pickering (2000) Use recycled fibres for vehicle headlamps [154]
Table 13. Overall ratings from ‘The green guide to Composites’ [212]. Here, the
ratings range from A (good) to E (poor).
Process Materials Overall environmental rating
Autoclaving Glass-fibre/Epoxy prepreg B
Compression moulding Sheet moulded compound (SMC) C
Hand lay-up Chopped strand-mat (CSM) / Polyester E
Resin-transfer moulding (RTM)
Woven glass/polyester C
Firstly, Vieira et al. [57] attempted to complete an LCA analysis of a filament
winding method for the production of steel/glass-fibre thermoplastic composite
overwrapped pressure vessels (COPV). However, the LCA results presented by
61
Vieira et al. [57] were not comprehensive and did not allow for a detailed
analysis of the filament winding process. Furthermore, the recycling process
used by Vieira et al. [57] was not for thermoset composite materials.
Secondly, Lee et al. [160] undertook an LCA of two thermoset composite
recycling methods: (i) chemical recycling (with nitric acid); and (ii) thermal
recycling (pyrolysis in oxygen). In summary, Lee et al. [160] concluded that the
chemical recycling method had a lower environmental impact (in comparison to
the thermal recycling method) due to its reduced consumption of electrical
energy (heating energy) during processing; chemical recycling at 80 – 110 oC
and thermal recycling at ~ 500 oC.
The results presented by Lee et al. [160] aided in providing the most fore-front
analysis of any thermoset composite recycling methods. However, from
reviewing this study and the aforementioned LCA analyses, it can be concluded
that there is little published literature which presents an in-depth LCA analysis
of filament winding and/or recycling processes with respect to energy, resin, raw
material and solvent consumption. As a result, the current study was produced
to evaluate and compare the LCA results of the following filament winding and
recycling processes; (i) conventional filament winding; (ii) clean filament winding
(CFW); and (iii) recycled-clean filament winding (R-CFW).
62
2.7 Conclusion of the Literature Review From carrying out the literature review, the following conclusions were made:
(i) The method of filament winding was shown to be able to manufacture
a wide range of composite components; for example, pressure
vessels and drive shafts. On manufacturing these components,
issues such as fibre volume fraction, void content and winding tension
were highlighted as critical parameters.
(ii) The method of impregnation used during filament winding can be
modelled by various equations; the majority of which are derived from
an equation termed Darcy’s Law. Derivations of Darcy’s Law were
identified and highlighted as possible methods to model the
impregnation process of filament winding.
(iii) Fibre spreading was highlighted as a critical component during
filament winding. Here, fibre spreading was thought to be an
important parameter during fibre impregnation and can be achieved
via such methods as mechanical, gas-based and electrostatic
methods.
(iv) Many composite recycling methods were identified, for example
thermal, mechanical, chemical and re-use. However, the considerable
issues associated with these methods were highlighted, including
processing speeds and volumes. As a result, it was concluded that no
long-term recycling success has been achieved to-date but in the
near future, due to ensuing legislation, considerable advancements
will have to be made.
63
(v) Life cycle assessment (LCA) was identified as a quantitative method
which can be used to assess the environmental impact of a
composites manufacturing process. However, from reviewing the
literature it was concluded that very little research has been
presented with regards to filament winding and composites recycling.
64
CHAPTER 3: EXPERIMENTAL
The following section presents details of the experimental procedures which
were carried out during this thesis. In general, the following section presents
details of: (i) materials and equipment; (ii) the development of resin
impregnation and fibre spreading units; (iii) filament winding trials; and (iv)
composite evaluation procedures.
3.1 Materials and Equipment
3.1.1 Reinforcing Fibres
Three types of reinforcing fibres were used in the current study: (i) continuous
E-glass fibres (EC15 1200 Tex); (ii) waste slitting fibres; and (iii) direct-loom
waste (DLW) fibres. Here, the E-glass fibres were used as-received and were
supplied by PPG Industries (UK). The waste slittings and direct-loom waste
were waste glass-fibre materials and were produced from an industrial glass-
fibre weaving process. The following section presents a detailed description of
these materials. For clarification, the waste-fibre materials were used to
investigate the development of a composites recycling method, termed
Recycled-Clean filament winding. A greater discussion of this point is presented
in a later section.
(i) As-received E-glass fibres: The E-glass fibres (1200 Tex) were supplied on
conventional bobbins, as shown in Figure 19, where the fibres were drawn from
the outer circumference during filament winding. Table 14 outlines some
general physical properties of the E-glass fibres used in this study.
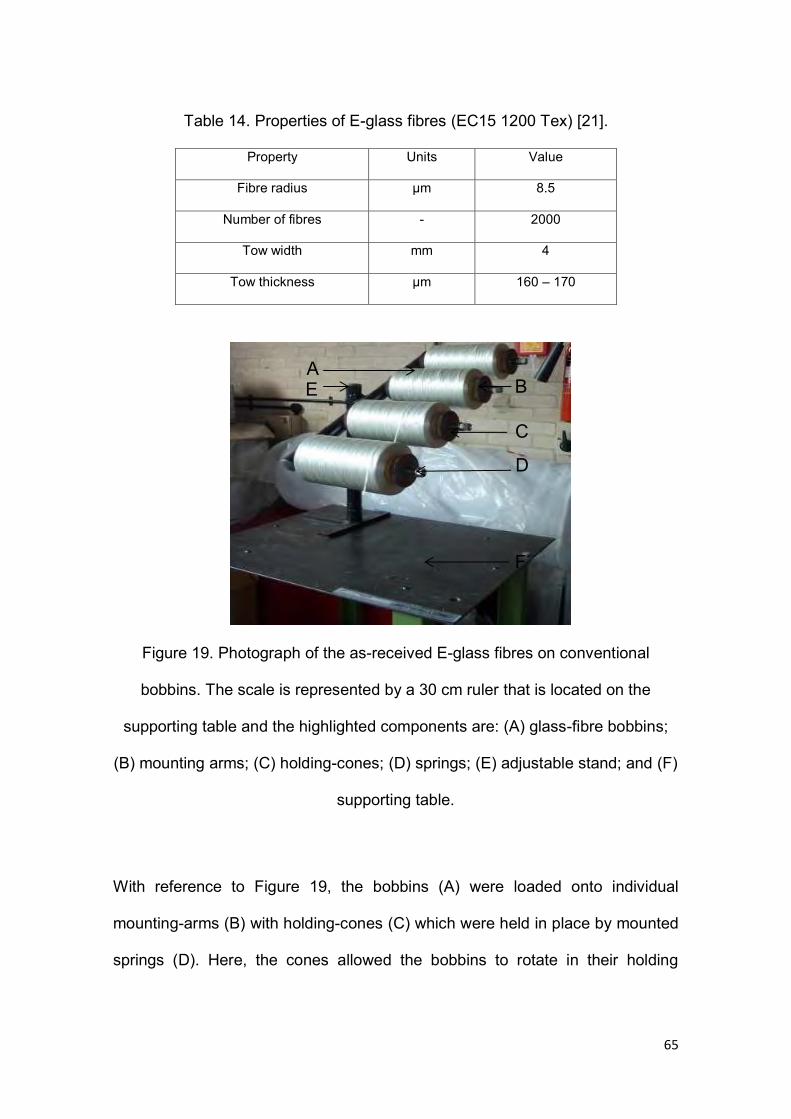
65
Table 14. Properties of E-glass fibres (EC15 1200 Tex) [21].
Property Units Value
Fibre radius µm 8.5
Number of fibres - 2000
Tow width mm 4
Tow thickness µm 160 – 170
Figure 19. Photograph of the as-received E-glass fibres on conventional
bobbins. The scale is represented by a 30 cm ruler that is located on the
supporting table and the highlighted components are: (A) glass-fibre bobbins;
(B) mounting arms; (C) holding-cones; (D) springs; (E) adjustable stand; and (F)
supporting table.
With reference to Figure 19, the bobbins (A) were loaded onto individual
mounting-arms (B) with holding-cones (C) which were held in place by mounted
springs (D). Here, the cones allowed the bobbins to rotate in their holding
E
D
C
B A
F
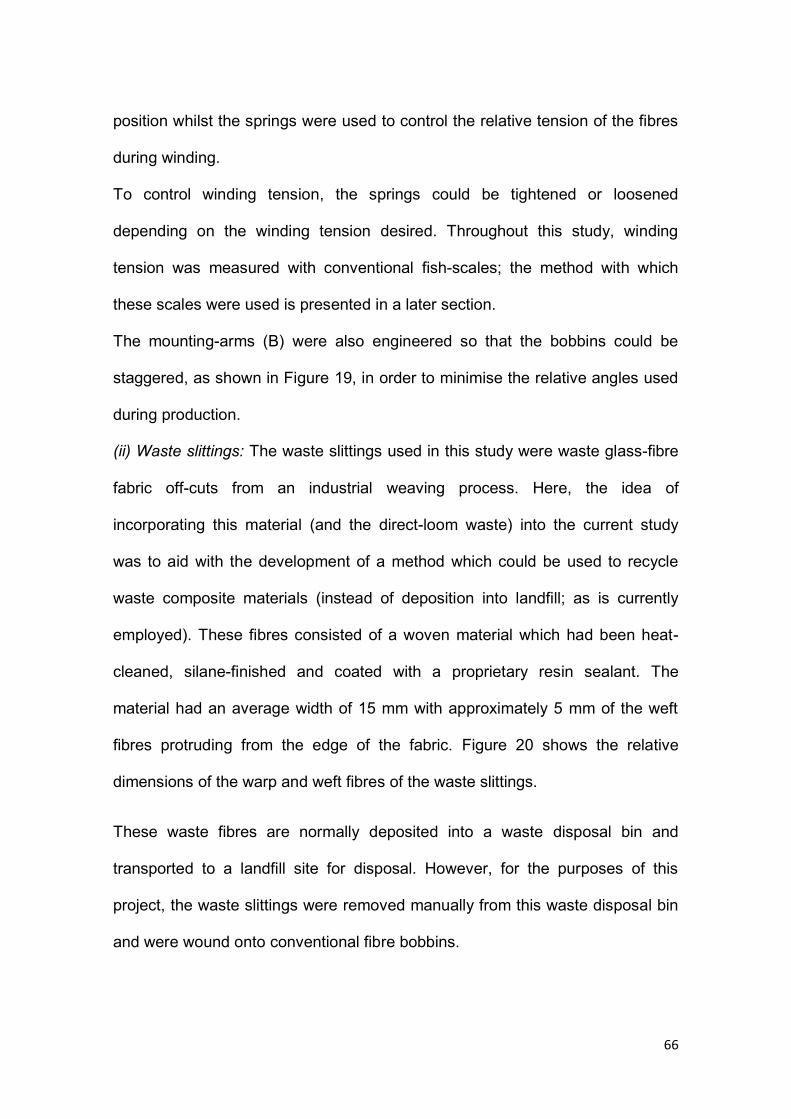
66
position whilst the springs were used to control the relative tension of the fibres
during winding.
To control winding tension, the springs could be tightened or loosened
depending on the winding tension desired. Throughout this study, winding
tension was measured with conventional fish-scales; the method with which
these scales were used is presented in a later section.
The mounting-arms (B) were also engineered so that the bobbins could be
staggered, as shown in Figure 19, in order to minimise the relative angles used
during production.
(ii) Waste slittings: The waste slittings used in this study were waste glass-fibre
fabric off-cuts from an industrial weaving process. Here, the idea of
incorporating this material (and the direct-loom waste) into the current study
was to aid with the development of a method which could be used to recycle
waste composite materials (instead of deposition into landfill; as is currently
employed). These fibres consisted of a woven material which had been heat-
cleaned, silane-finished and coated with a proprietary resin sealant. The
material had an average width of 15 mm with approximately 5 mm of the weft
fibres protruding from the edge of the fabric. Figure 20 shows the relative
dimensions of the warp and weft fibres of the waste slittings.
These waste fibres are normally deposited into a waste disposal bin and
transported to a landfill site for disposal. However, for the purposes of this
project, the waste slittings were removed manually from this waste disposal bin
and were wound onto conventional fibre bobbins.
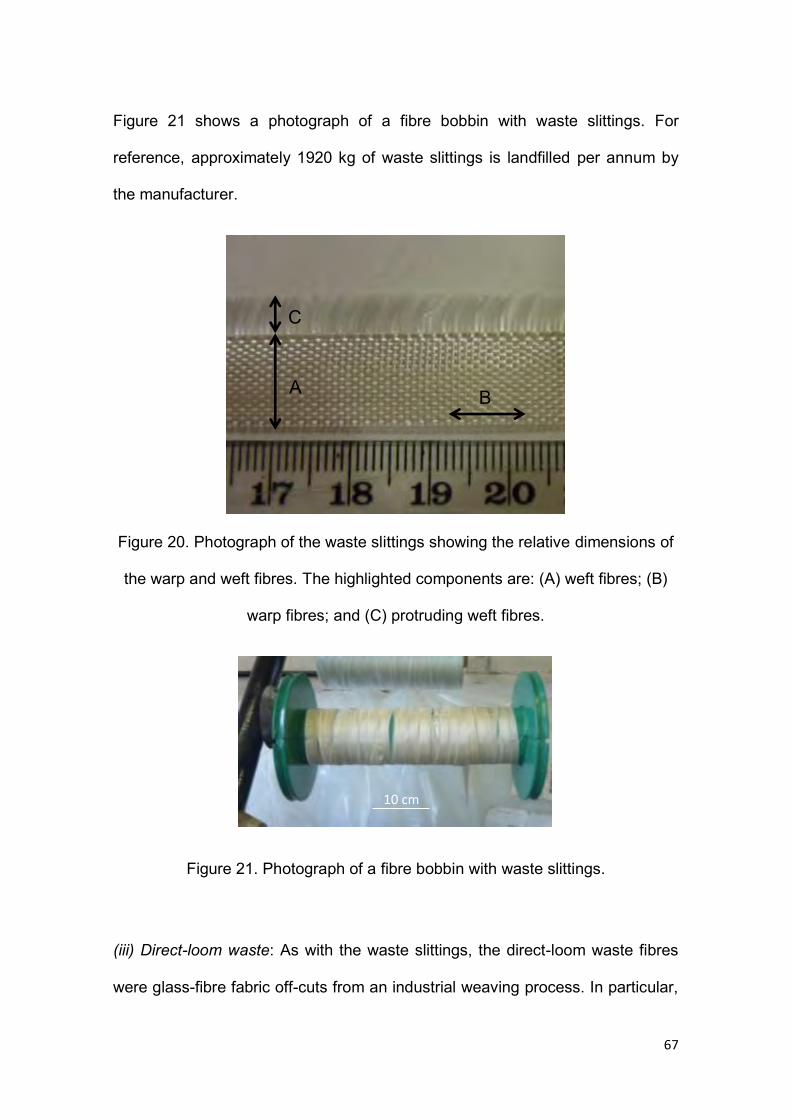
67
Figure 21 shows a photograph of a fibre bobbin with waste slittings. For
reference, approximately 1920 kg of waste slittings is landfilled per annum by
the manufacturer.
Figure 20. Photograph of the waste slittings showing the relative dimensions of
the warp and weft fibres. The highlighted components are: (A) weft fibres; (B)
warp fibres; and (C) protruding weft fibres.
Figure 21. Photograph of a fibre bobbin with waste slittings.
(iii) Direct-loom waste: As with the waste slittings, the direct-loom waste fibres
were glass-fibre fabric off-cuts from an industrial weaving process. In particular,
C
A B
10 cm
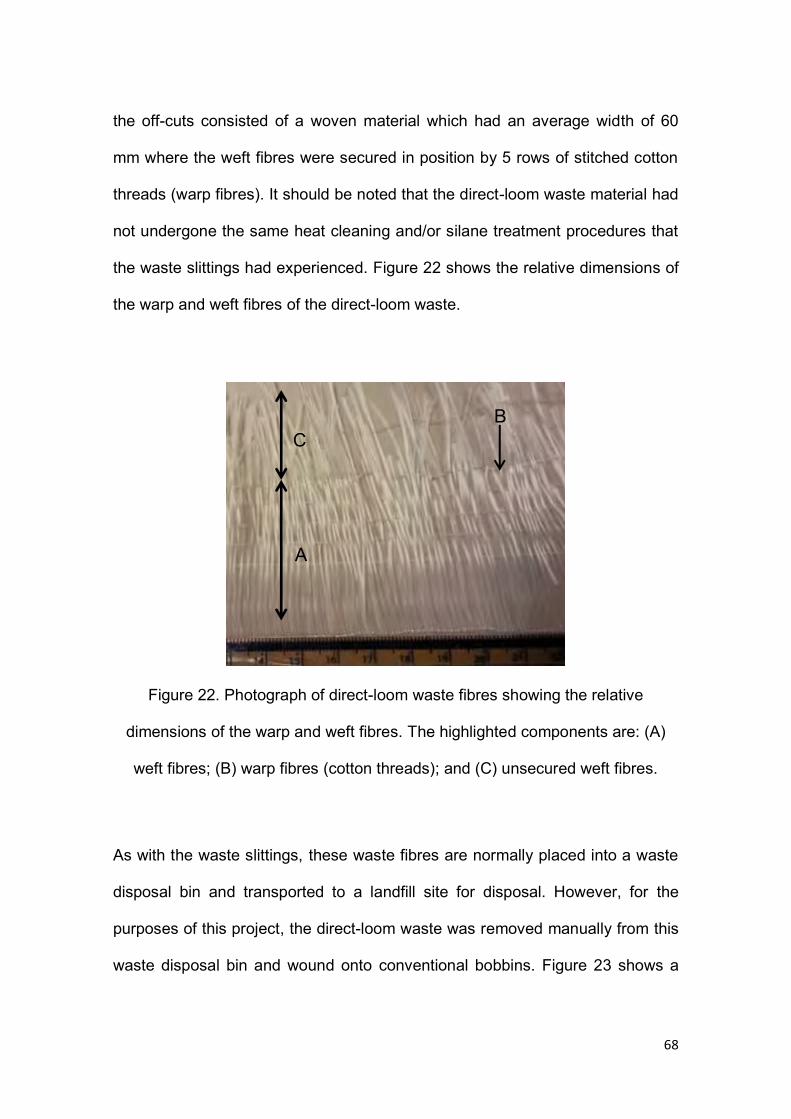
68
the off-cuts consisted of a woven material which had an average width of 60
mm where the weft fibres were secured in position by 5 rows of stitched cotton
threads (warp fibres). It should be noted that the direct-loom waste material had
not undergone the same heat cleaning and/or silane treatment procedures that
the waste slittings had experienced. Figure 22 shows the relative dimensions of
the warp and weft fibres of the direct-loom waste.
Figure 22. Photograph of direct-loom waste fibres showing the relative
dimensions of the warp and weft fibres. The highlighted components are: (A)
weft fibres; (B) warp fibres (cotton threads); and (C) unsecured weft fibres.
As with the waste slittings, these waste fibres are normally placed into a waste
disposal bin and transported to a landfill site for disposal. However, for the
purposes of this project, the direct-loom waste was removed manually from this
waste disposal bin and wound onto conventional bobbins. Figure 23 shows a
C
A
B
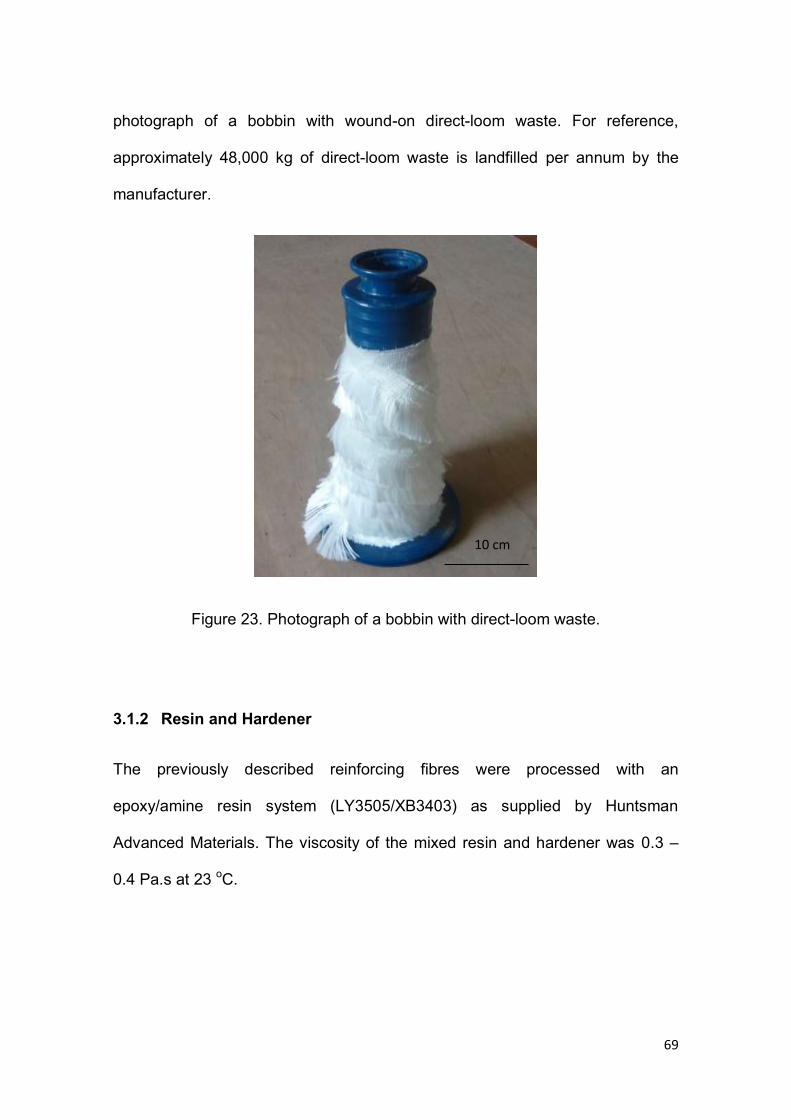
69
photograph of a bobbin with wound-on direct-loom waste. For reference,
approximately 48,000 kg of direct-loom waste is landfilled per annum by the
manufacturer.
Figure 23. Photograph of a bobbin with direct-loom waste.
3.1.2 Resin and Hardener
The previously described reinforcing fibres were processed with an
epoxy/amine resin system (LY3505/XB3403) as supplied by Huntsman
Advanced Materials. The viscosity of the mixed resin and hardener was 0.3 –
0.4 Pa.s at 23 oC.
10 cm
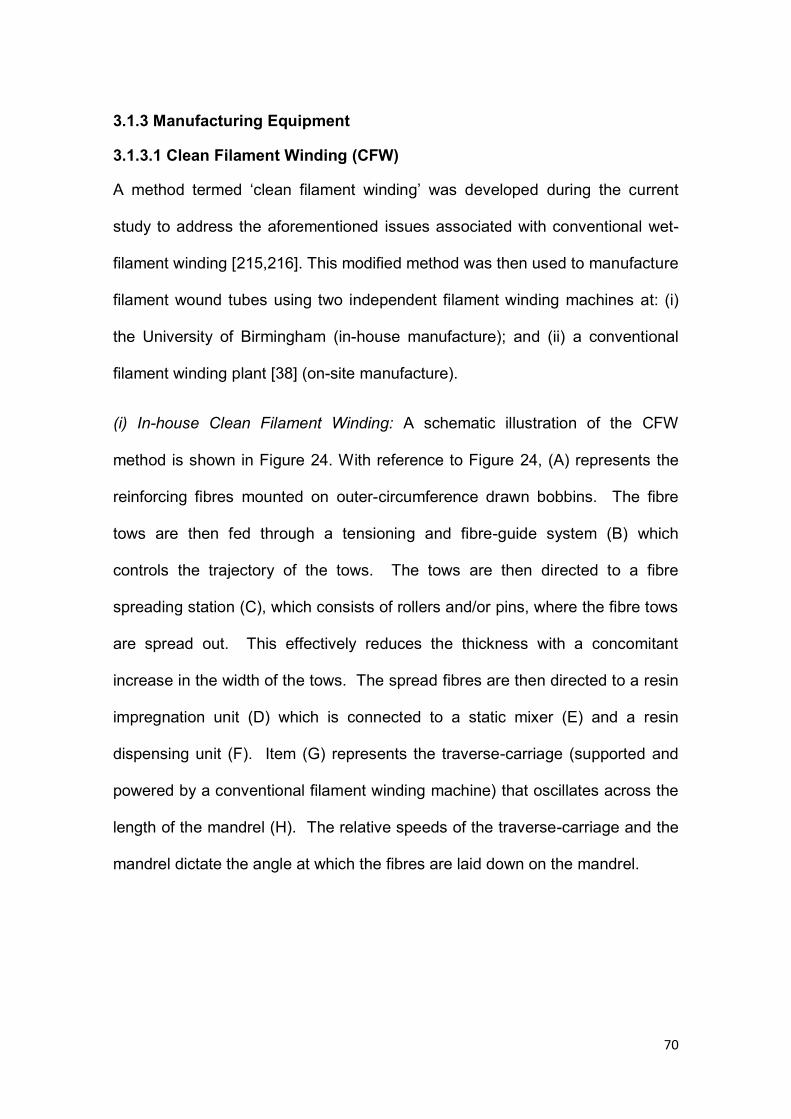
70
3.1.3 Manufacturing Equipment
3.1.3.1 Clean Filament Winding (CFW)
A method termed ‘clean filament winding’ was developed during the current
study to address the aforementioned issues associated with conventional wet-
filament winding [215,216]. This modified method was then used to manufacture
filament wound tubes using two independent filament winding machines at: (i)
the University of Birmingham (in-house manufacture); and (ii) a conventional
filament winding plant [38] (on-site manufacture).
(i) In-house Clean Filament Winding: A schematic illustration of the CFW
method is shown in Figure 24. With reference to Figure 24, (A) represents the
reinforcing fibres mounted on outer-circumference drawn bobbins. The fibre
tows are then fed through a tensioning and fibre-guide system (B) which
controls the trajectory of the tows. The tows are then directed to a fibre
spreading station (C), which consists of rollers and/or pins, where the fibre tows
are spread out. This effectively reduces the thickness with a concomitant
increase in the width of the tows. The spread fibres are then directed to a resin
impregnation unit (D) which is connected to a static mixer (E) and a resin
dispensing unit (F). Item (G) represents the traverse-carriage (supported and
powered by a conventional filament winding machine) that oscillates across the
length of the mandrel (H). The relative speeds of the traverse-carriage and the
mandrel dictate the angle at which the fibres are laid down on the mandrel.
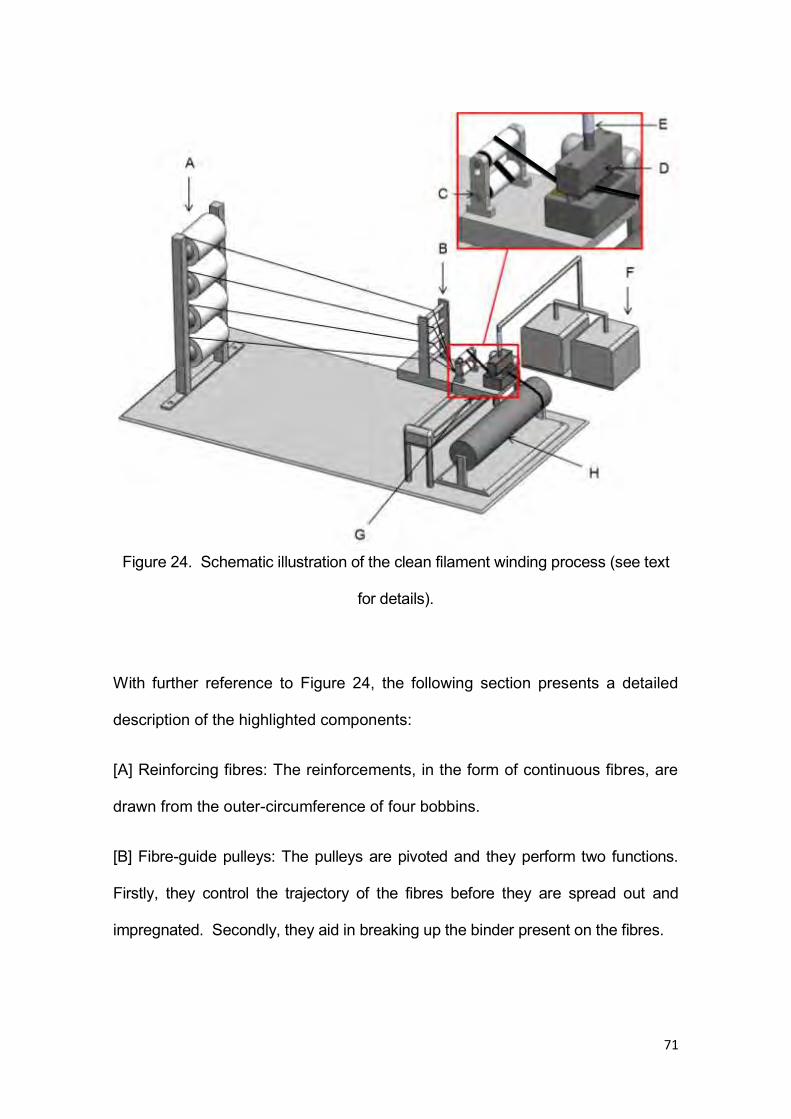
71
Figure 24. Schematic illustration of the clean filament winding process (see text
for details).
With further reference to Figure 24, the following section presents a detailed
description of the highlighted components:
[A] Reinforcing fibres: The reinforcements, in the form of continuous fibres, are
drawn from the outer-circumference of four bobbins.
[B] Fibre-guide pulleys: The pulleys are pivoted and they perform two functions.
Firstly, they control the trajectory of the fibres before they are spread out and
impregnated. Secondly, they aid in breaking up the binder present on the fibres.
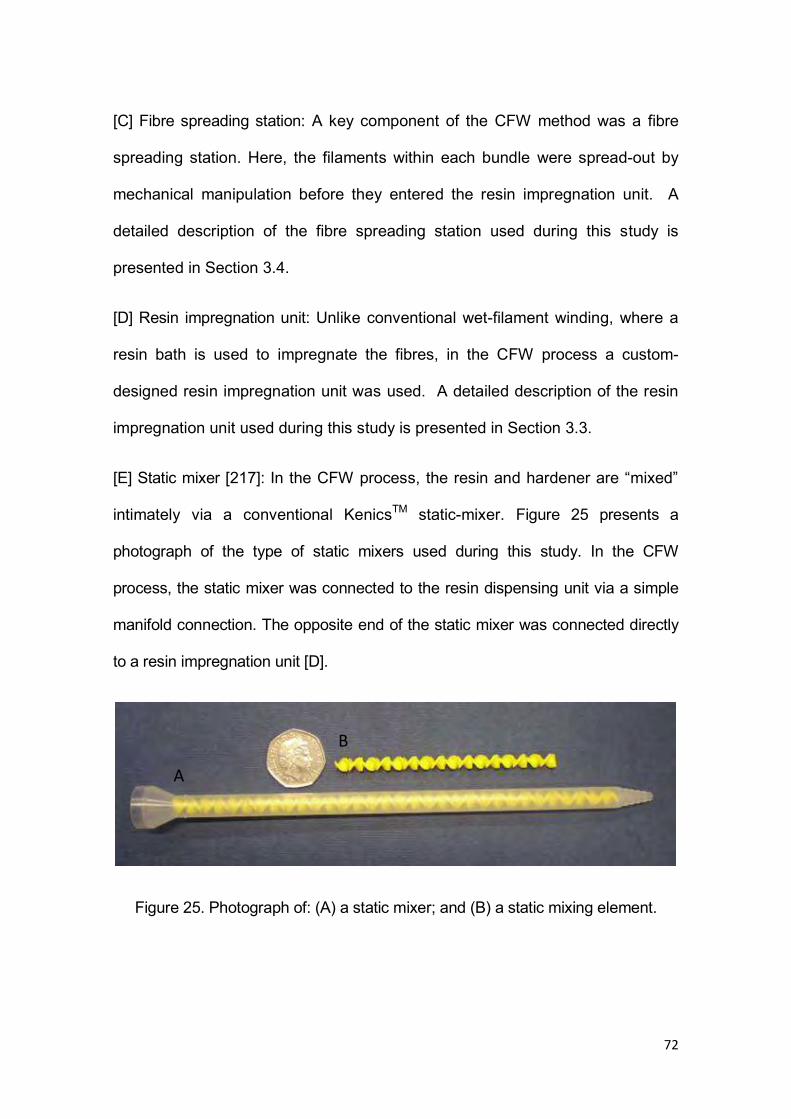
72
[C] Fibre spreading station: A key component of the CFW method was a fibre
spreading station. Here, the filaments within each bundle were spread-out by
mechanical manipulation before they entered the resin impregnation unit. A
detailed description of the fibre spreading station used during this study is
presented in Section 3.4.
[D] Resin impregnation unit: Unlike conventional wet-filament winding, where a
resin bath is used to impregnate the fibres, in the CFW process a custom-
designed resin impregnation unit was used. A detailed description of the resin
impregnation unit used during this study is presented in Section 3.3.
[E] Static mixer [217]: In the CFW process, the resin and hardener are “mixed”
intimately via a conventional KenicsTM static-mixer. Figure 25 presents a
photograph of the type of static mixers used during this study. In the CFW
process, the static mixer was connected to the resin dispensing unit via a simple
manifold connection. The opposite end of the static mixer was connected directly
to a resin impregnation unit [D].
Figure 25. Photograph of: (A) a static mixer; and (B) a static mixing element.
A
B
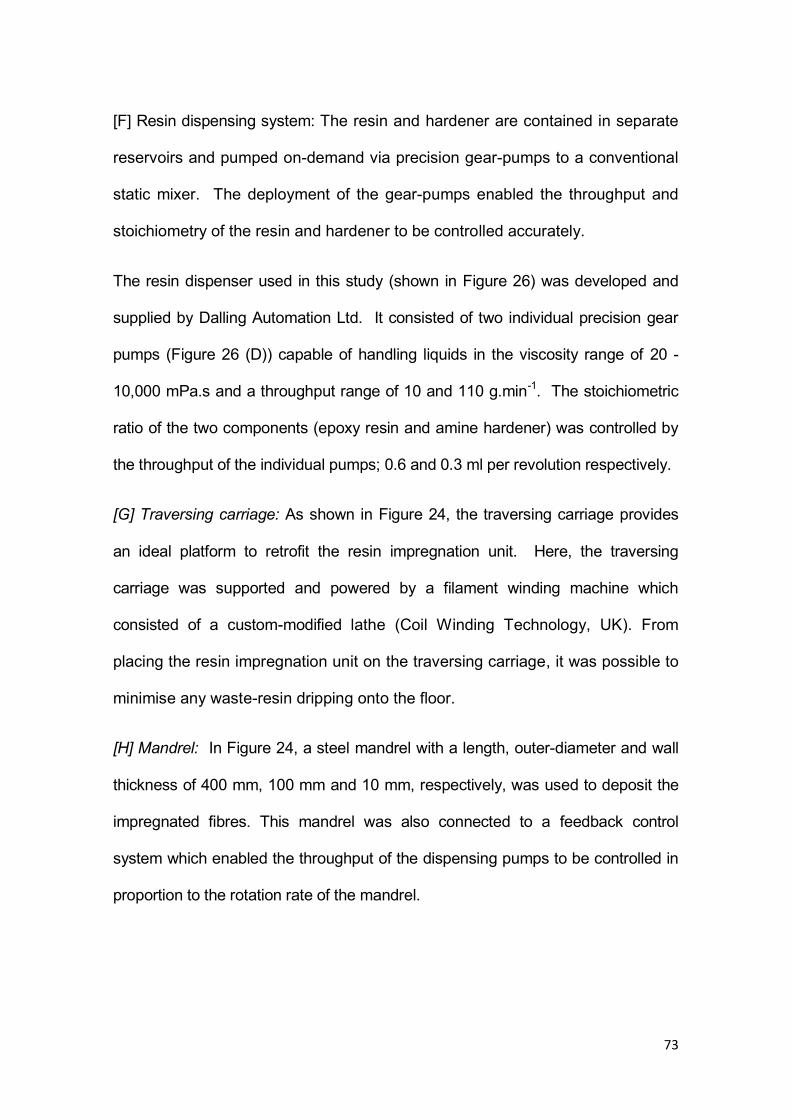
73
[F] Resin dispensing system: The resin and hardener are contained in separate
reservoirs and pumped on-demand via precision gear-pumps to a conventional
static mixer. The deployment of the gear-pumps enabled the throughput and
stoichiometry of the resin and hardener to be controlled accurately.
The resin dispenser used in this study (shown in Figure 26) was developed and
supplied by Dalling Automation Ltd. It consisted of two individual precision gear
pumps (Figure 26 (D)) capable of handling liquids in the viscosity range of 20 -
10,000 mPa.s and a throughput range of 10 and 110 g.min-1. The stoichiometric
ratio of the two components (epoxy resin and amine hardener) was controlled by
the throughput of the individual pumps; 0.6 and 0.3 ml per revolution respectively.
[G] Traversing carriage: As shown in Figure 24, the traversing carriage provides
an ideal platform to retrofit the resin impregnation unit. Here, the traversing
carriage was supported and powered by a filament winding machine which
consisted of a custom-modified lathe (Coil Winding Technology, UK). From
placing the resin impregnation unit on the traversing carriage, it was possible to
minimise any waste-resin dripping onto the floor.
[H] Mandrel: In Figure 24, a steel mandrel with a length, outer-diameter and wall
thickness of 400 mm, 100 mm and 10 mm, respectively, was used to deposit the
impregnated fibres. This mandrel was also connected to a feedback control
system which enabled the throughput of the dispensing pumps to be controlled in
proportion to the rotation rate of the mandrel.
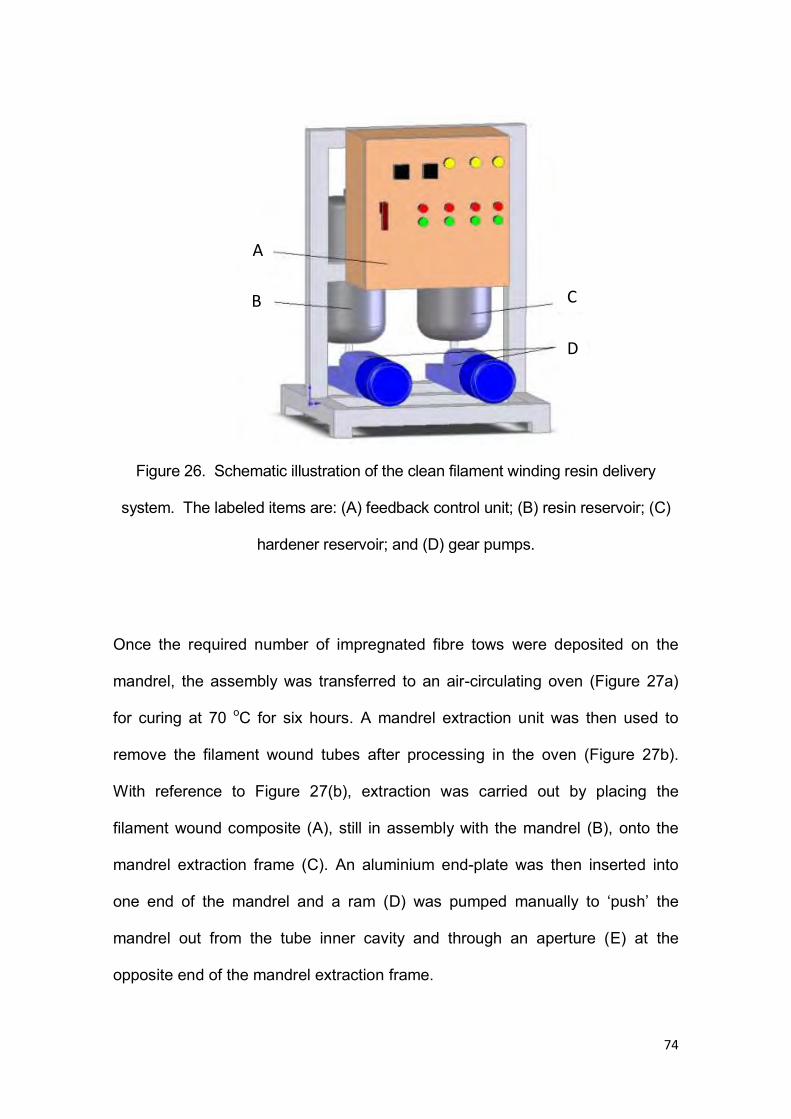
74
Figure 26. Schematic illustration of the clean filament winding resin delivery
system. The labeled items are: (A) feedback control unit; (B) resin reservoir; (C)
hardener reservoir; and (D) gear pumps.
Once the required number of impregnated fibre tows were deposited on the
mandrel, the assembly was transferred to an air-circulating oven (Figure 27a)
for curing at 70 oC for six hours. A mandrel extraction unit was then used to
remove the filament wound tubes after processing in the oven (Figure 27b).
With reference to Figure 27(b), extraction was carried out by placing the
filament wound composite (A), still in assembly with the mandrel (B), onto the
mandrel extraction frame (C). An aluminium end-plate was then inserted into
one end of the mandrel and a ram (D) was pumped manually to ‘push’ the
mandrel out from the tube inner cavity and through an aperture (E) at the
opposite end of the mandrel extraction frame.
A
B C
D
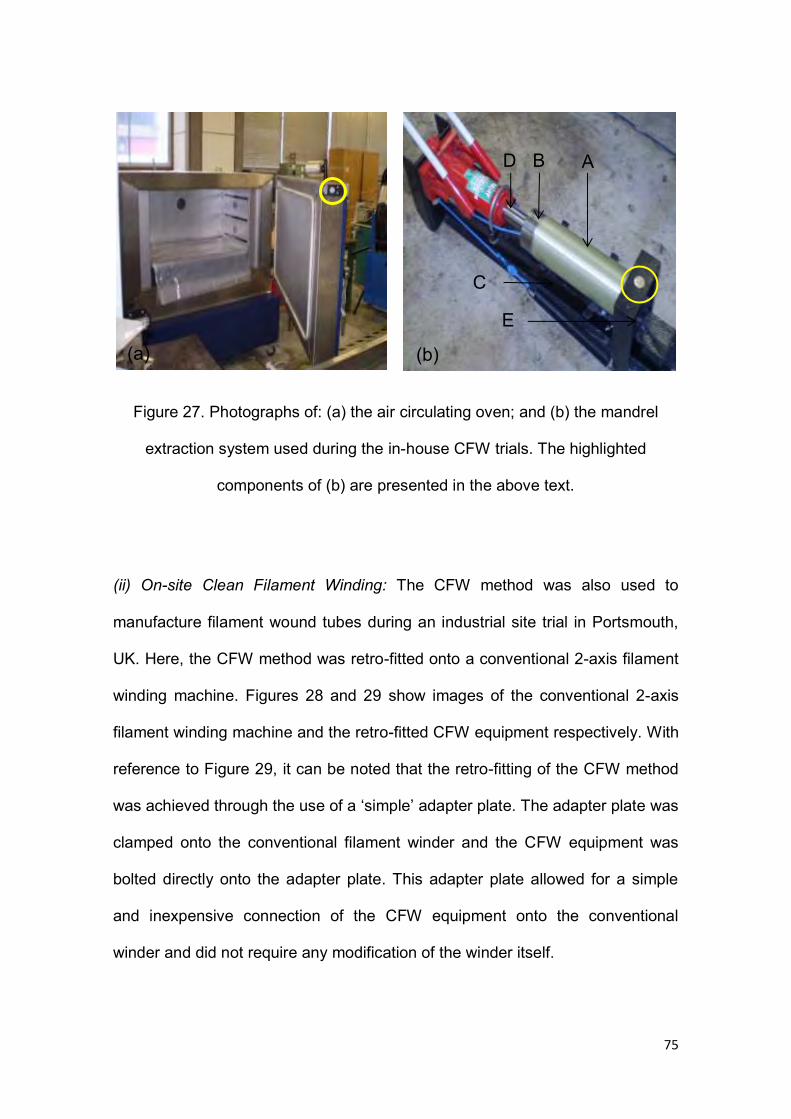
75
Figure 27. Photographs of: (a) the air circulating oven; and (b) the mandrel
extraction system used during the in-house CFW trials. The highlighted
components of (b) are presented in the above text.
(ii) On-site Clean Filament Winding: The CFW method was also used to
manufacture filament wound tubes during an industrial site trial in Portsmouth,
UK. Here, the CFW method was retro-fitted onto a conventional 2-axis filament
winding machine. Figures 28 and 29 show images of the conventional 2-axis
filament winding machine and the retro-fitted CFW equipment respectively. With
reference to Figure 29, it can be noted that the retro-fitting of the CFW method
was achieved through the use of a ‘simple’ adapter plate. The adapter plate was
clamped onto the conventional filament winder and the CFW equipment was
bolted directly onto the adapter plate. This adapter plate allowed for a simple
and inexpensive connection of the CFW equipment onto the conventional
winder and did not require any modification of the winder itself.
(a) (b)
A
C
E
D B
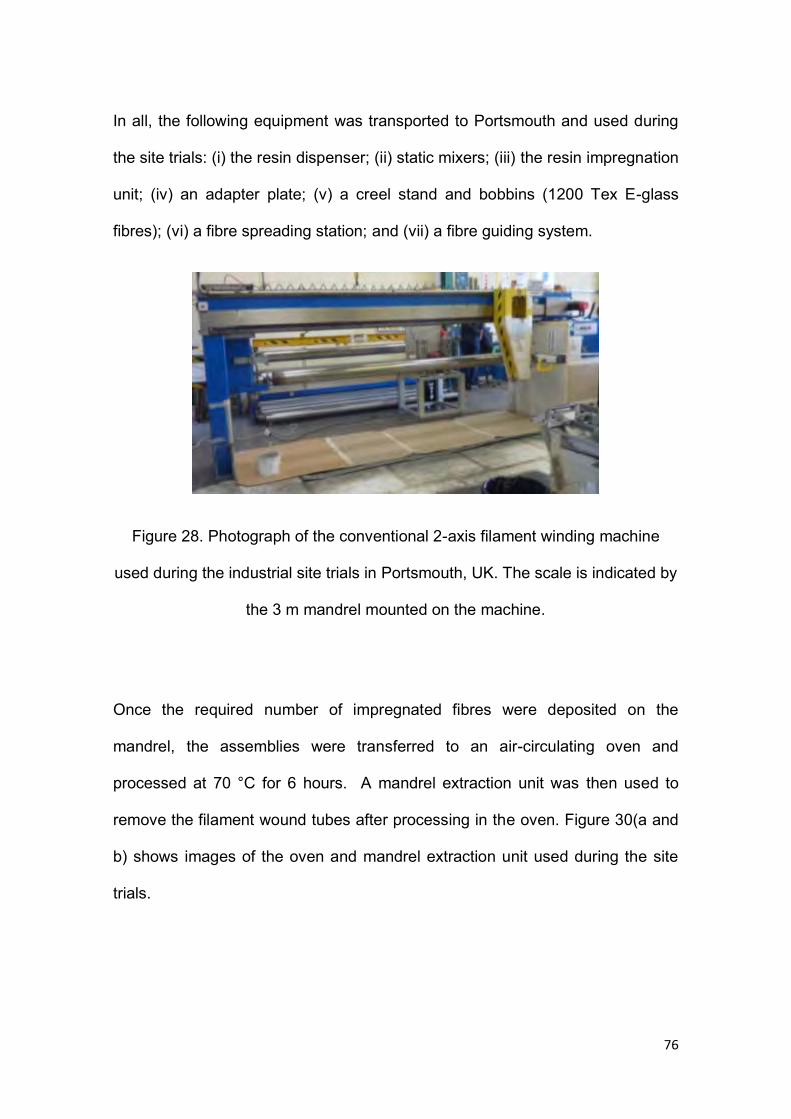
76
In all, the following equipment was transported to Portsmouth and used during
the site trials: (i) the resin dispenser; (ii) static mixers; (iii) the resin impregnation
unit; (iv) an adapter plate; (v) a creel stand and bobbins (1200 Tex E-glass
fibres); (vi) a fibre spreading station; and (vii) a fibre guiding system.
Figure 28. Photograph of the conventional 2-axis filament winding machine
used during the industrial site trials in Portsmouth, UK. The scale is indicated by
the 3 m mandrel mounted on the machine.
Once the required number of impregnated fibres were deposited on the
mandrel, the assemblies were transferred to an air-circulating oven and
processed at 70 °C for 6 hours. A mandrel extraction unit was then used to
remove the filament wound tubes after processing in the oven. Figure 30(a and
b) shows images of the oven and mandrel extraction unit used during the site
trials.
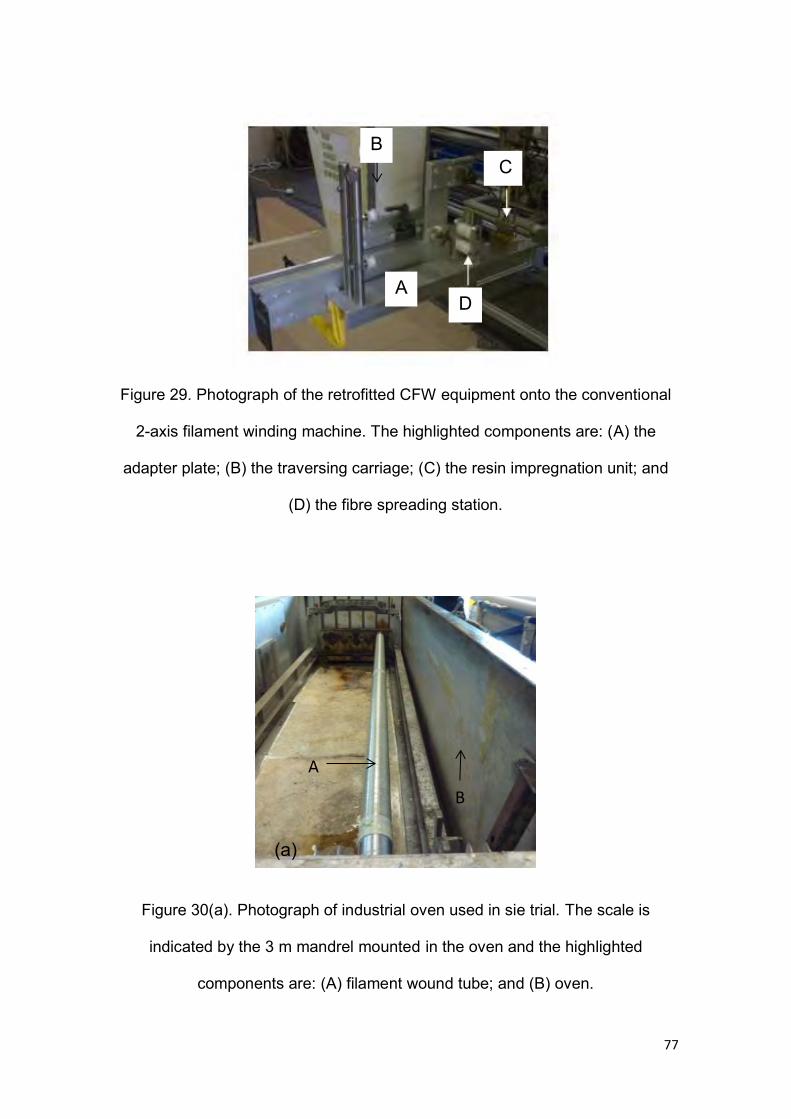
77
Figure 29. Photograph of the retrofitted CFW equipment onto the conventional
2-axis filament winding machine. The highlighted components are: (A) the
adapter plate; (B) the traversing carriage; (C) the resin impregnation unit; and
(D) the fibre spreading station.
Figure 30(a). Photograph of industrial oven used in sie trial. The scale is
indicated by the 3 m mandrel mounted in the oven and the highlighted
components are: (A) filament wound tube; and (B) oven.
(a)
A D
C B
A
B
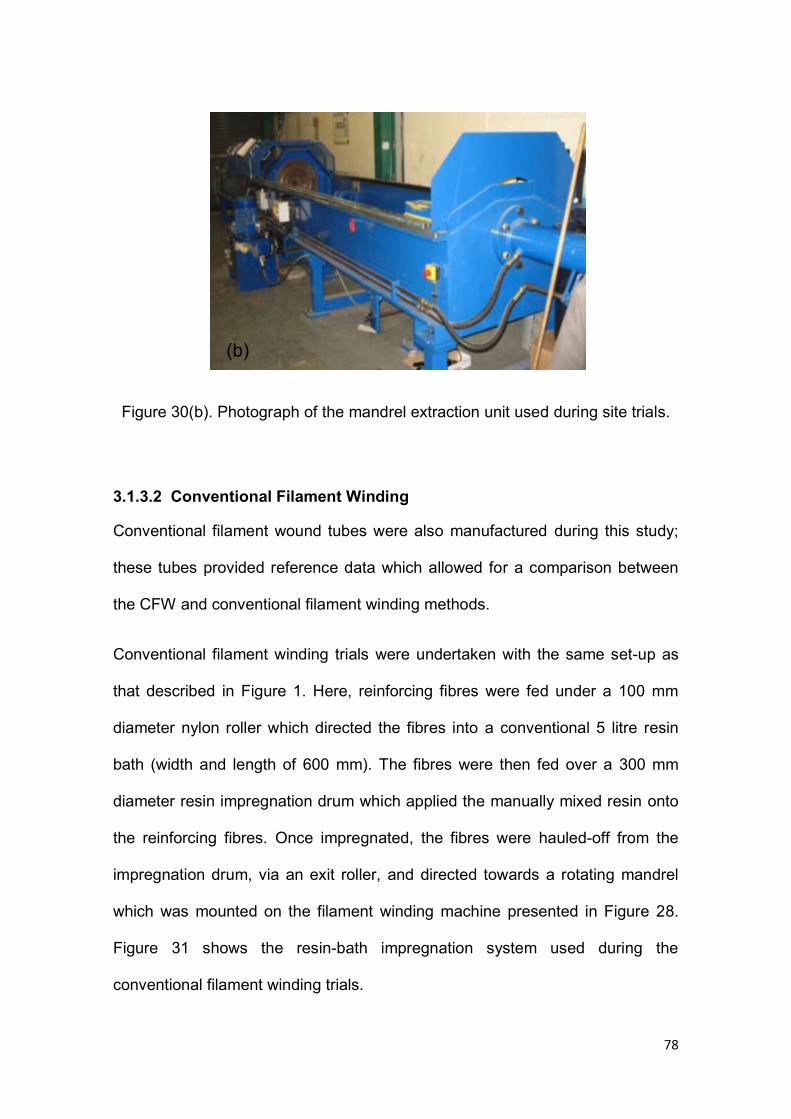
78
Figure 30(b). Photograph of the mandrel extraction unit used during site trials.
3.1.3.2 Conventional Filament Winding
Conventional filament wound tubes were also manufactured during this study;
these tubes provided reference data which allowed for a comparison between
the CFW and conventional filament winding methods.
Conventional filament winding trials were undertaken with the same set-up as
that described in Figure 1. Here, reinforcing fibres were fed under a 100 mm
diameter nylon roller which directed the fibres into a conventional 5 litre resin
bath (width and length of 600 mm). The fibres were then fed over a 300 mm
diameter resin impregnation drum which applied the manually mixed resin onto
the reinforcing fibres. Once impregnated, the fibres were hauled-off from the
impregnation drum, via an exit roller, and directed towards a rotating mandrel
which was mounted on the filament winding machine presented in Figure 28.
Figure 31 shows the resin-bath impregnation system used during the
conventional filament winding trials.
(b)
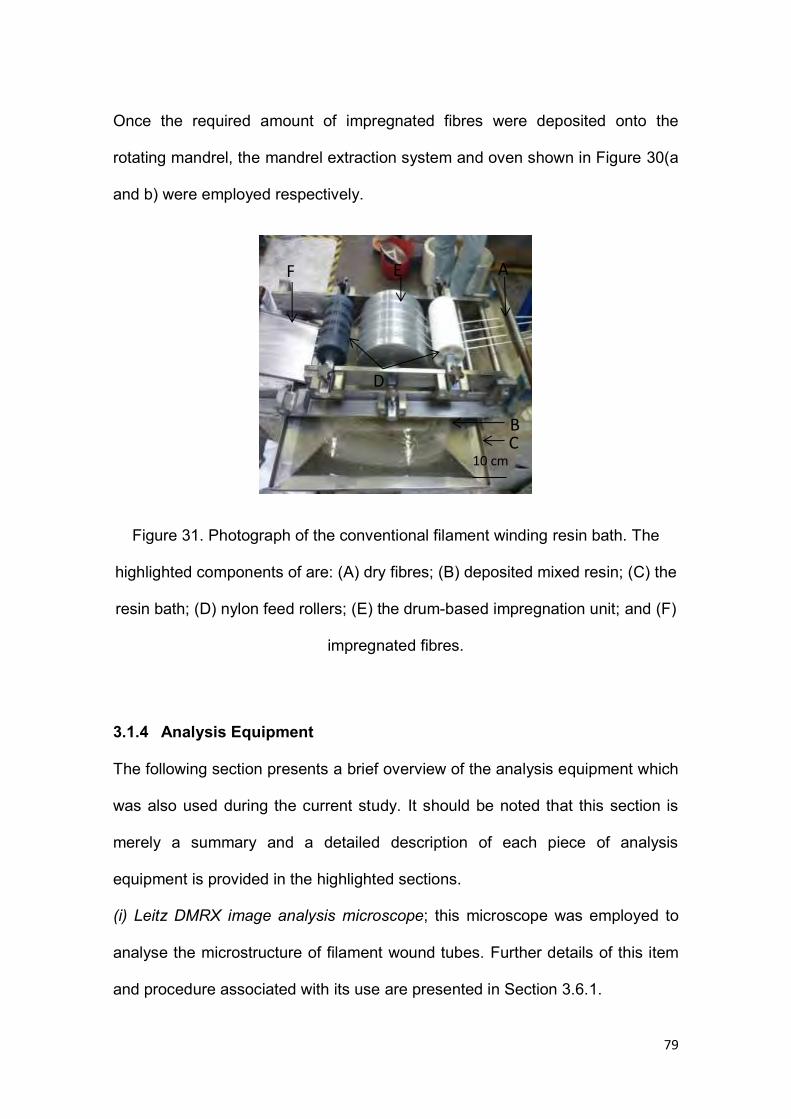
79
Once the required amount of impregnated fibres were deposited onto the
rotating mandrel, the mandrel extraction system and oven shown in Figure 30(a
and b) were employed respectively.
Figure 31. Photograph of the conventional filament winding resin bath. The
highlighted components of are: (A) dry fibres; (B) deposited mixed resin; (C) the
resin bath; (D) nylon feed rollers; (E) the drum-based impregnation unit; and (F)
impregnated fibres.
3.1.4 Analysis Equipment
The following section presents a brief overview of the analysis equipment which
was also used during the current study. It should be noted that this section is
merely a summary and a detailed description of each piece of analysis
equipment is provided in the highlighted sections.
(i) Leitz DMRX image analysis microscope; this microscope was employed to
analyse the microstructure of filament wound tubes. Further details of this item
and procedure associated with its use are presented in Section 3.6.1.
10 cm
F
C B
E
D
A
80
(ii) JEOL 6060 scanning electron microscope; this microscope was incorporated
to acquire magnified images of the waste-fibre materials and aid in fractography
analyses. Here, samples were mounted on conventional scanning electron
microscopy (SEM) stubs and were viewed.
(iii) Zwick-1484 mechanical test machine; this testing machine (described in
greater detail in Section 3.6.3) offered a 100 kN loading capacity and was
utilised to complete hoop-tensile (split-disk) testing.
(iv) Instron-5566 mechanical test machine; this 10 kN capacity machine was
employed to complete the inter-laminar shear and lateral compression testing
presented in Sections 3.6.4 and 3.6.5 respectively (greater detail provided in the
highlighted sections).
(v) TQC hydrostatic testing machine; this external testing facility was situated in
Nottingham, UK and was used to complete pressure burst testing of composite
overwrapped pressure vessels (equipment described in-detail in Section 3.6.6).
(vi) Muffle-furnace; to complete resin burn-off procedures (described in greater
detail in Section 3.6.2) a muffle-furnace was employed.
3.2 Calibration of the Resin Dispensing Unit
The following calibration experiments were undertaken before any filament
winding trials were completed. This calibration ensured that accurate and
consistent resin dispensing rates were achieved.
The resin dispensing unit was assessed for its ability to: (i) independently
dispense epoxy resin (LY3505); (ii) independently dispense amine hardener
81
(XB3403); and (iii) dispense a mixed epoxy resin system (LY3505/XB3403) in
the required stoichiometric ratio.
To undertake the first two phases of this calibration, the volume of the
dispensed liquid (LY3505 resin or XB3403 hardener) was measured by setting
the relevant pump to 4.5 cm3/min (5 rpm), 9 cm3/min (10 rpm), 13.5 cm3/min (15
rpm) and 18 cm3/min (20 rpm). (Note: for independent dispensing, only one
pump was turned-on and allowed to dispense). The epoxy or amine was then
pumped for two minutes, prior to its collection in a glass beaker for thirty
seconds, and the mass of the dispensed liquid was determined by using a four-
digit analytical balance. The measured masses were then compared to pre-
calculated theoretical values for five calibration measurements across five static
mixers.
To carry out the final calibration phase, the throughput of the resin dispensing
unit at 11.25 cm3/min (12.5 rpm) (normal dispensing rate for a mixed resin
system) was assessed. Here, a similar methodology to that presented above
was employed; this ensured that mixed resin was also dispensed at the
required rate.
3.3 Development of a Clean Filament Winding Resin Impregnation Unit
A schematic illustration of the prototype resin impregnation unit which was
developed during this study is presented in Figure 32. With reference to Figure
32, a cross-sectional schematic illustration of the fibre ‘path’ through the resin
impregnation unit is show in the expanded view and the key components are
described as:
82
(i) A primary spreading pin (A): a single pin (15 mm diameter) was used to
induce further spreading of the fibre tows. The reader is reminded that rollers
were also used to induce fibre spreading ahead of the resin impregnation unit.
(ii) A miniature resin reservoir (B): this was a rectangular excavation (12 ml
capacity) and it served as a miniature reservoir for the mixed resin system.
(iii) A resin supply channel for the injector pin and resin bath (C): the static
mixer was directly attached to the resin supply channel.
(iv) A resin injector housing (D): the resin injector housing was adjustable to
enable the fibre tows to be plunged to the desired depth within the miniature
resin reservoir.
(v) A resin injector pin (E): this was a pin with a 2 mm slot at the bottom to
enable the mixed resin to be injected into the fibre tows. The depth to which the
resin injector housing was plunged into the mixed resin system dictated the
contact-length and the overall trajectory of the fibre tows.
(vi) A resin impregnation roller (F): this was a cylindrical pin (30 mm diameter)
which was placed inside the miniature resin bath (B) to aid with impregnation.
This pin caused a resin ‘wedge’ action to occur between the fibre tow and resin
and, as a result, a ‘squeezing’ action of the resin into the fibre tows was
produced.
(vii) An exit pin (G): this pin (15 mm diameter) served as a doctor-blade but it
also acted to control the contact-length of the fibre tow with the resin injector pin
(E).
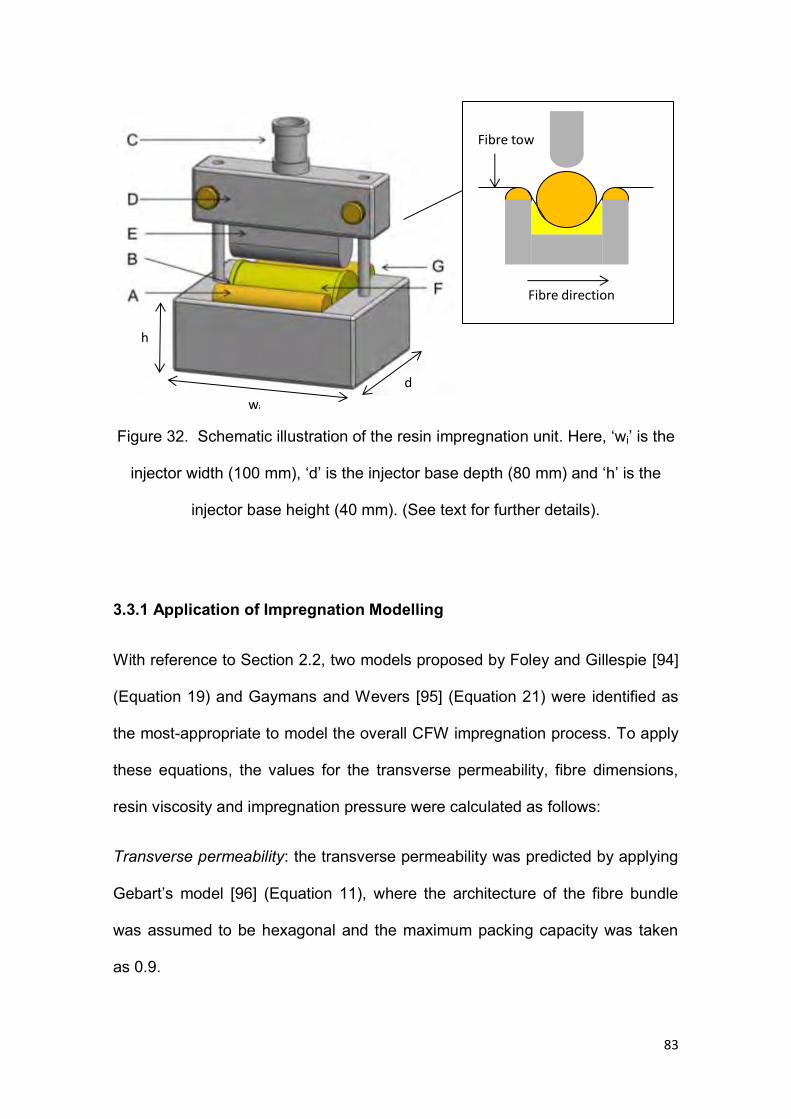
83
Figure 32. Schematic illustration of the resin impregnation unit. Here, ‘wi’ is the
injector width (100 mm), ‘d’ is the injector base depth (80 mm) and ‘h’ is the
injector base height (40 mm). (See text for further details).
3.3.1 Application of Impregnation Modelling
With reference to Section 2.2, two models proposed by Foley and Gillespie [94]
(Equation 19) and Gaymans and Wevers [95] (Equation 21) were identified as
the most-appropriate to model the overall CFW impregnation process. To apply
these equations, the values for the transverse permeability, fibre dimensions,
resin viscosity and impregnation pressure were calculated as follows:
Transverse permeability: the transverse permeability was predicted by applying
Gebart’s model [96] (Equation 11), where the architecture of the fibre bundle
was assumed to be hexagonal and the maximum packing capacity was taken
as 0.9.
d
h
wi
Fibre tow
Fibre direction
84
Fibre dimensions: the ‘fibre volume fraction’ and bundle width were defined as
72% and 7 mm respectively. The fibre volume fraction and bundle width were
calculated from initial image analysis and fibre spreading investigations.
Resin viscosity: as mentioned previously, the resin system used during this
study had a viscosity in the range of 0.3 – 0.4 Pa.s at 23 oC.
Impregnation pressure; capillary pressure and pressure generated by the fibre
traversing over a pin. With reference to the CFW technique, the capillary and
fibre pressure values were calculated using Equations 16 and 18 respectively.
Here, the contact time between the pin and the fibre bundles was calculated
using a curvature length of 15 mm and a winding rate of 10 m/minute. The
contact time was calculated to be 0.09 seconds and the fibre tension was 10 N.
Once the above-mentioned variables were defined they were then applied to
the models proposed by Foley and Gillespie [94] (Equation 19) and Gaymans
and Wevers [95] (Equation 21).
With reference to the model proposed by Foley and Gillespie [94], the shape of
the fibre bundle was assumed to be circular. However, in the CFW technique,
the shape of the fibre bundle at the point of resin injection was a rectangular
ribbon; the original equation proposed by Foley and Gillespie [94] was modified
accordingly. Furthermore, the impregnation process was assumed to take
place over an arbitrary change in the infiltration thickness Ti=T1=c1T0 to T2=c2T0,
where Ti is the infiltration thickness and T1 and T2 are arbitrary steps of
infiltration thickness. The infiltration time, ti, was reformulated as:
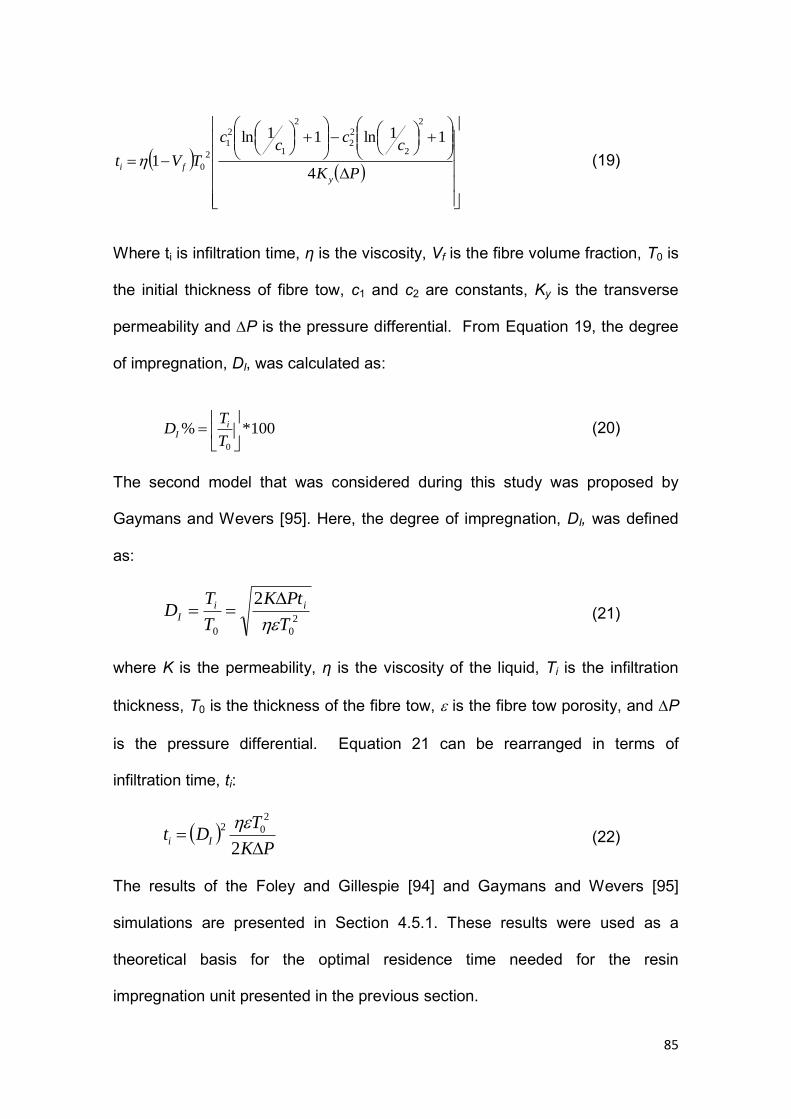
85
PK
cc
cc
TVty
fi4
11ln11ln
1
2
2
2
2
2
1
2
1
2
0 (19)
Where ti is infiltration time, η is the viscosity, Vf is the fibre volume fraction, T0 is
the initial thickness of fibre tow, c1 and c2 are constants, Ky is the transverse
permeability and ∆P is the pressure differential. From Equation 19, the degree
of impregnation, DI, was calculated as:
100*%0
T
TD i
I
(20)
The second model that was considered during this study was proposed by
Gaymans and Wevers [95]. Here, the degree of impregnation, DI, was defined
as:
2
00
2
T
PtK
T
TD ii
I
(21)
where K is the permeability, η is the viscosity of the liquid, Ti is the infiltration
thickness, T0 is the thickness of the fibre tow, is the fibre tow porosity, and P
is the pressure differential. Equation 21 can be rearranged in terms of
infiltration time, ti:
PK
TDt Ii
2
2
02 (22)
The results of the Foley and Gillespie [94] and Gaymans and Wevers [95]
simulations are presented in Section 4.5.1. These results were used as a
theoretical basis for the optimal residence time needed for the resin
impregnation unit presented in the previous section.
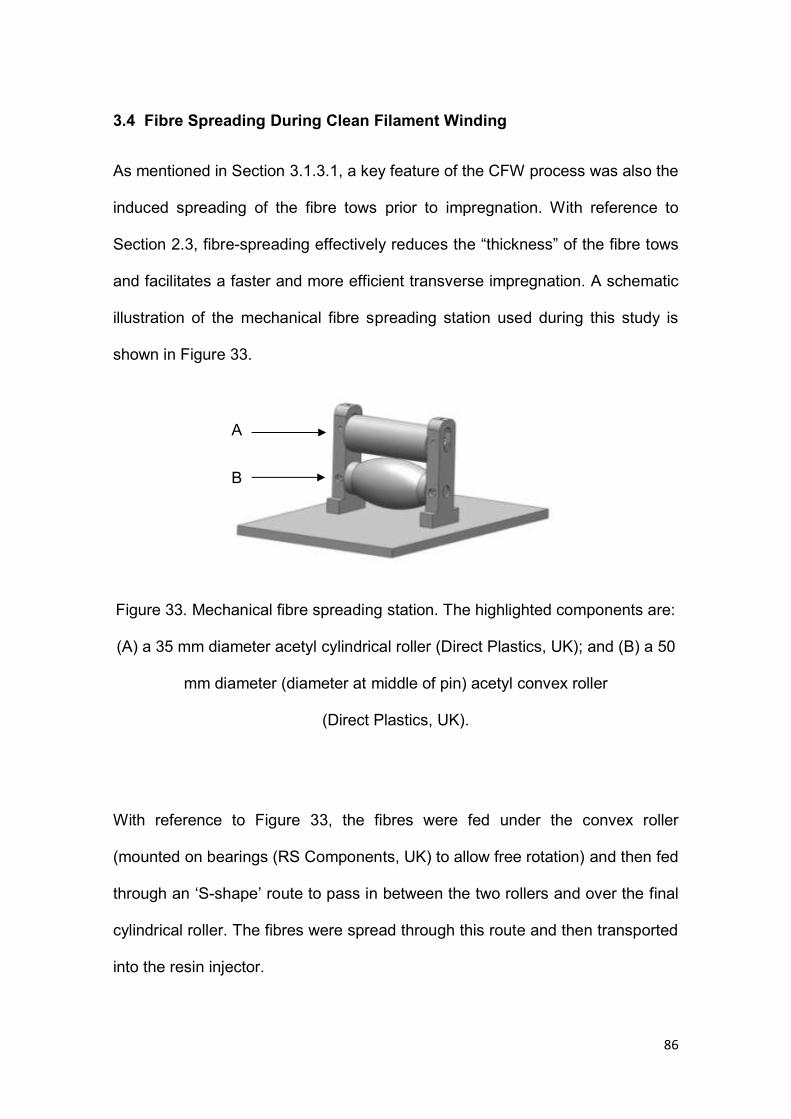
86
3.4 Fibre Spreading During Clean Filament Winding
As mentioned in Section 3.1.3.1, a key feature of the CFW process was also the
induced spreading of the fibre tows prior to impregnation. With reference to
Section 2.3, fibre-spreading effectively reduces the “thickness” of the fibre tows
and facilitates a faster and more efficient transverse impregnation. A schematic
illustration of the mechanical fibre spreading station used during this study is
shown in Figure 33.
Figure 33. Mechanical fibre spreading station. The highlighted components are:
(A) a 35 mm diameter acetyl cylindrical roller (Direct Plastics, UK); and (B) a 50
mm diameter (diameter at middle of pin) acetyl convex roller
(Direct Plastics, UK).
With reference to Figure 33, the fibres were fed under the convex roller
(mounted on bearings (RS Components, UK) to allow free rotation) and then fed
through an ‘S-shape’ route to pass in between the two rollers and over the final
cylindrical roller. The fibres were spread through this route and then transported
into the resin injector.
A
B
87
The “Taguchi method” [218] was then used to assess the relevance of the
following parameters to aid fibre spreading: (i) contact length between the fibre
tows and the fixtures of the fibre spreading station; (ii) winding speed; (iii) fixture
configuration (pin or roller); and (iv) the number of fibre spreading fixtures.
These input factors are summarised in Table 15 where two levels have been
specified per parameter corresponding to a minimum (Level 1) and maximum
(Level 2). For example, the filament winding speeds at Levels 1 and 2 were set
at 2.5 m/min (minimum) and 10 m/min (maximum) respectively.
As four input factors with two level variations were investigated, a 24 Taguchi
matrix (known as L16) was used for this study. This matrix produced a set of 16
experiments which allowed for an analysis of each input factor for the two level
variations. Table 16 shows the Taguchi matrix used during this study. The
important columns of Table 16 are A, B, D and H, these columns defined the
level settings for the four factors of each experiment. For example, the
conditions of experiment 1 are: 2.5 cm contact length (Level 1, shown in column
A); 2.5 m/min winding speed (Level 1, shown in column B); roller fixture (Level
1, shown in column D); and 1 pin (Level 1, shown in column H). The other
remaining columns of Table 16 i.e. C, E, F, G, I and J, were interactions of the
four investigated parameters; these interaction columns were not addressed
during this study and only the direct results of columns A, B, D and H were
evaluated and discussed. Each experiment was repeated five times and an
average degree of fibre spreading for the experiments was taken. The resin
impregnation unit and fibre spreading station, shown in Figures 32 and 33
respectively, were used in this study. The degree of fibre spreading was
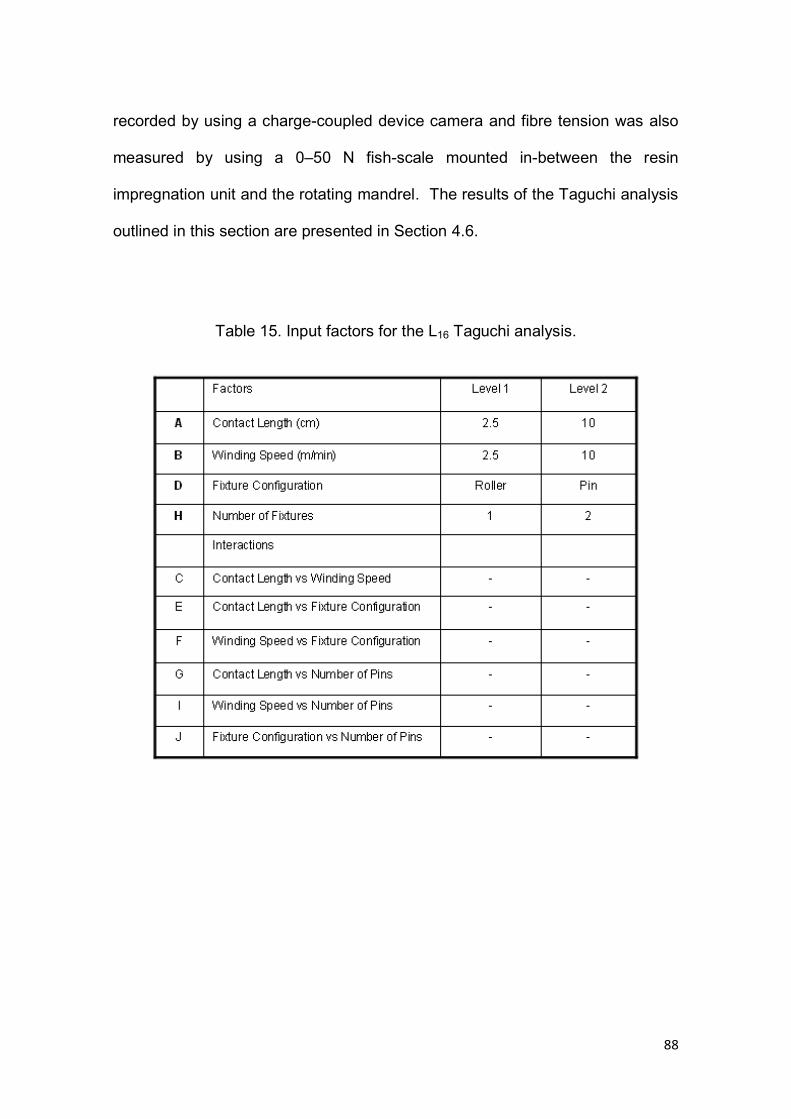
88
recorded by using a charge-coupled device camera and fibre tension was also
measured by using a 0–50 N fish-scale mounted in-between the resin
impregnation unit and the rotating mandrel. The results of the Taguchi analysis
outlined in this section are presented in Section 4.6.
Table 15. Input factors for the L16 Taguchi analysis.
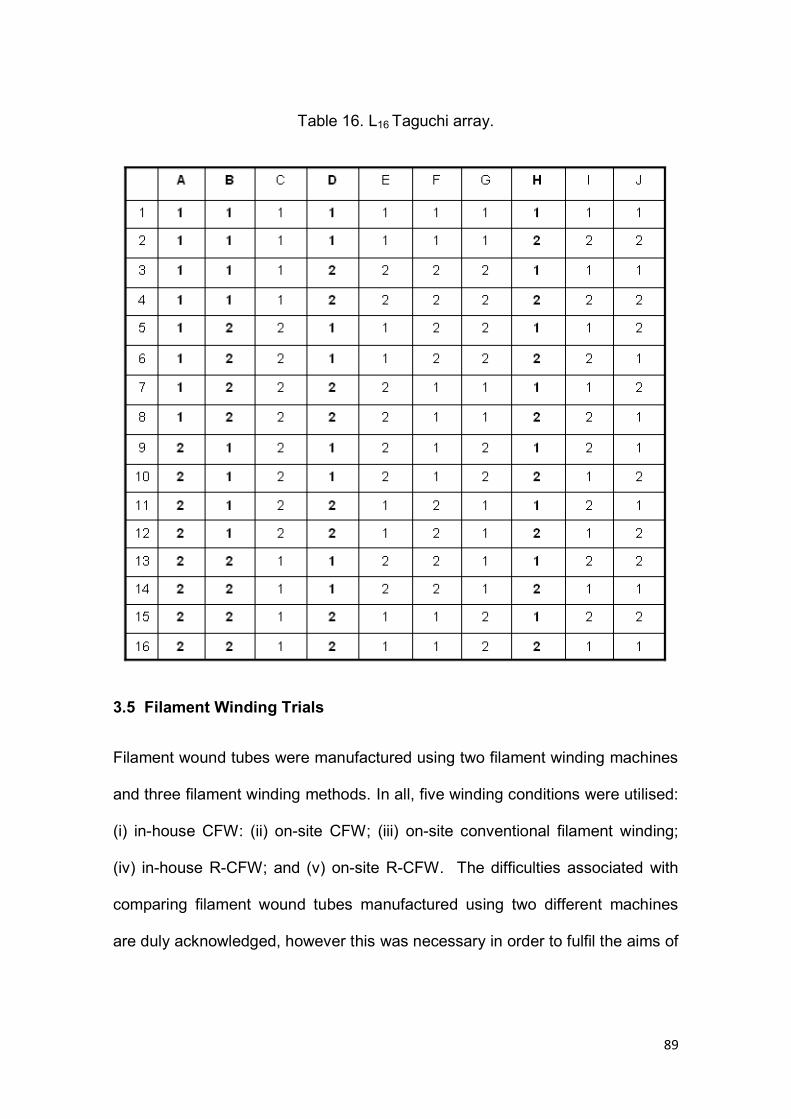
89
Table 16. L16 Taguchi array.
3.5 Filament Winding Trials
Filament wound tubes were manufactured using two filament winding machines
and three filament winding methods. In all, five winding conditions were utilised:
(i) in-house CFW: (ii) on-site CFW; (iii) on-site conventional filament winding;
(iv) in-house R-CFW; and (v) on-site R-CFW. The difficulties associated with
comparing filament wound tubes manufactured using two different machines
are duly acknowledged, however this was necessary in order to fulfil the aims of
90
this study highlighted in Section 1.3. Details of the five winding conditions are
presented in the following sections.
3.5.1 In-house Clean Filament Winding
In the first instance, in-house CFW trials were carried out on a custom-modified
lathe (Coil Winding Technology, UK). Here, a winding speed of 10 m/minute,
with a pitch (traverse distance per mandrel revolution) of 4 mm and a
dispensing rate of 11.25 cm3/min (12.5 rpm) were used to deposit the
impregnated glass-fibres onto a 100 mm outer-diameter steel mandrel. Note; all
mandrels used during this study were pre-coated with a release agent (Wurtz,
PAT/607 PCM) to aid with extraction after winding. Once the required number of
impregnated fibre tows were laid on the mandrel, the assembly was transferred
to an air-circulating oven (shown in Figure 27) and processed at 70 °C for 6
hours. A mandrel extraction unit (also shown in Figure 27) was then used to
remove the filament wound tubes after processing in the oven.
The method outlined in this section was used to manufacture six 4-layered
hoop-wound glass-fibre tubes with a wall thickness of ~ 2 mm. The methods
used to evaluate the properties of the tubes fabricated during this study are
described in greater detail in Section 3.6.
3.5.2 On-site Clean Filament Winding
The CFW method was also used to manufacture filament wound tubes during
an industrial site trial in Portsmouth, UK.
91
The retro-fitted CFW equipment was used to fabricate two 1.5 m glass-fibre
filament wound tubes. The first tube was fabricated by winding the impregnated
glass-fibres at 7 m/min onto a 106 mm outer-diameter steel mandrel. The
winding speed (7 m/min) and mandrel diameter (106 mm) were used as these
were the most comparable to the winding conditions used during the in-house
winding trials.
The second tube was fabricated by winding the impregnated fibres at 21 m/min
(maximum winding speed of machine) onto a 106 mm outer-diameter steel
mandrel. During manufacture, the 7 m/min tube was fabricated with a resin
throughput rate of 13.5 cm3/min (15 rpm) and the 21 m/min tube was fabricated
with the resin dispenser’s maximum resin throughput rate of 18 cm3/min (20
rpm). Once the required numbers of impregnated fibre tows were laid on the
mandrel, the assemblies were transferred to an air-circulating oven and
processed at 70 °C for 6 hours.
3.5.3 Conventional Filament Winding
Conventional filament winding trials were completed with the manufacture of a
1.5 m glass-fibre tube which was also fabricated during the site trials at
Portsmouth, UK. During these trials, a winding rate of 21 m/min was used to
deposit the impregnated fibres onto a 106 mm outer-diameter steel mandrel.
The resin-bath (60 cm width and 60 cm length) was filled with 5 L of mixed resin
and, as shown in Figure 31, incorporated a drum-based impregnation system.
Once the required number of impregnated fibre tows were laid on the mandrel,
92
the assembly was subjected to the same curing and extraction methods as
outlined in Section 3.5.2.
3.5.4 In-house Recycled-Clean Filament Winding
The CFW method was also developed to manufacture recycled glass-fibre
thermoset composites. This method, termed Recycled-Clean filament winding
(R-CFW), was developed to incorporate the loom-waste materials (waste
slittings and direct-loom waste) which were produced from an industrial weaving
process (mentioned in Section 3.1.1). These waste-fibres were used as a fibre
feed-stock instead of virgin glass-fibres.
With reference to the manufacture of waste slitting tubes, a winding speed of 5
m/min, with a pitch of 7 mm, was used to deposit the required number of resin-
impregnated fibres onto the rotating mandrel (100 mm OD). Here a resin
delivery rate of 13.5 cm3/min (15 rpm) was used. With reference to the
manufacture of direct-loom waste tubes, a winding speed of 2.5 m/min, with a
pitch of 15 mm was used. Here resin was injected into the waste fibres at a rate
of 13.5 cm3/min (15 rpm). With regards to the relatively slow winding speeds of
2.5 and 5 m/min, these speeds were used in order to minimise any damage of
the relatively delicate waste fibres during processing. Once wound, each waste
fibre tube was also processed with the same curing and extraction processes as
shown in Section 3.5.1.
The method outlined in this section was used to manufacture six waste slitting
and six direct-loom waste hoop-wound tubes. These tubes were then assessed
93
for their physical and mechanical properties via the methods outlined in later
sections.
3.5.5 On-site Recycled-Clean Filament Winding
The R-CFW method was also used during the previously described industrial
site trial in Portsmouth, UK (site trial detailed in Section 3.5.2). The R-CFW
method was used to manufacture waste-fibre filament wound tubes using the
waste slittings material. The use of the waste slittings, as opposed to the direct-
loom waste, was based on the preliminary testing data provided by the waste-
fibre tubes which were manufactured in Section 3.5.4. This preliminary data
showed that the waste slittings were able to offer considerably higher
mechanical properties than the direct-loom waste; detailed results are
presented in a later section. The higher mechanical properties of the waste
slittings, along with its relatively ‘easier’ handling and processing capabilities
(faster winding speeds etc), made it an obvious choice for use during the site
trial.
During the site trial, two waste-fibre tubes were manufactured: (i) a hoop-wound
waste slittings tube; and (ii) an angle-wound (+48 o) waste slittings tube. Here
both tubes were fabricated with a winding rate of 7 m/min and a resin
dispensing rate of 13.5 cm3/min (15 rpm). The impregnated fibres were then
deposited onto a 169 mm outer-diameter steel mandrel; the justification for
using a 169 mm outer-diameter steel mandrel is explained in detail in Section
4.3.
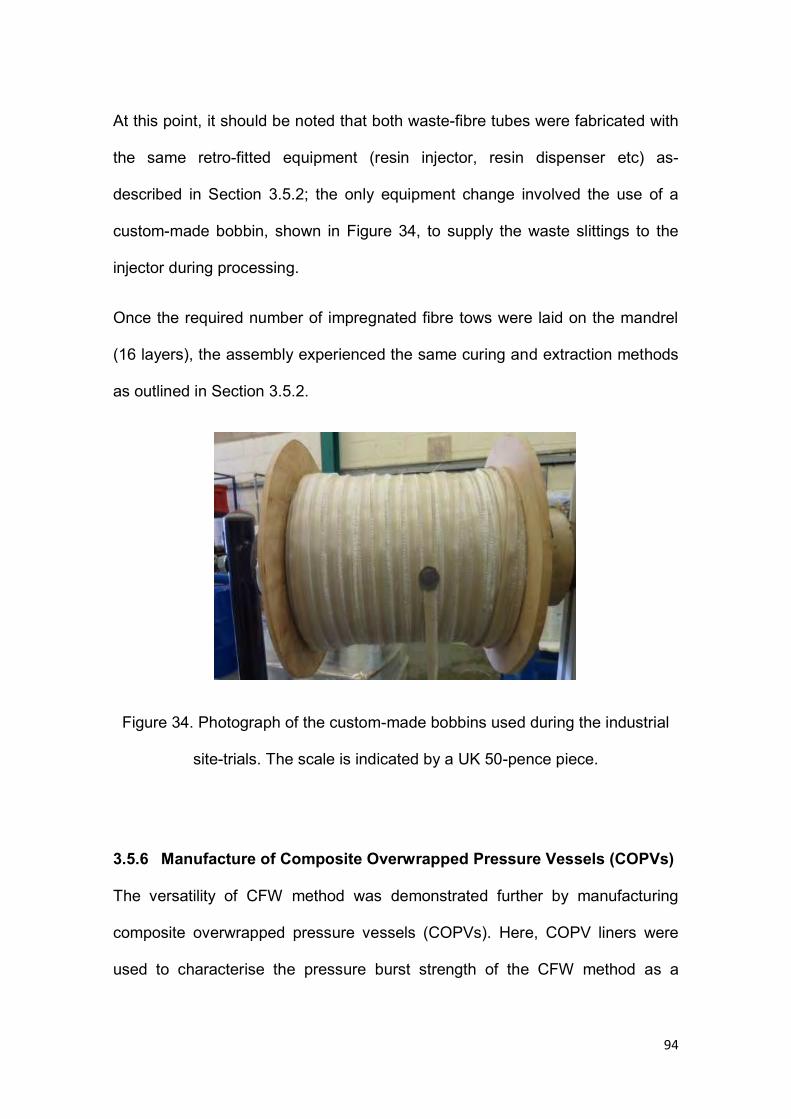
94
At this point, it should be noted that both waste-fibre tubes were fabricated with
the same retro-fitted equipment (resin injector, resin dispenser etc) as-
described in Section 3.5.2; the only equipment change involved the use of a
custom-made bobbin, shown in Figure 34, to supply the waste slittings to the
injector during processing.
Once the required number of impregnated fibre tows were laid on the mandrel
(16 layers), the assembly experienced the same curing and extraction methods
as outlined in Section 3.5.2.
Figure 34. Photograph of the custom-made bobbins used during the industrial
site-trials. The scale is indicated by a UK 50-pence piece.
3.5.6 Manufacture of Composite Overwrapped Pressure Vessels (COPVs)
The versatility of CFW method was demonstrated further by manufacturing
composite overwrapped pressure vessels (COPVs). Here, COPV liners were
used to characterise the pressure burst strength of the CFW method as a
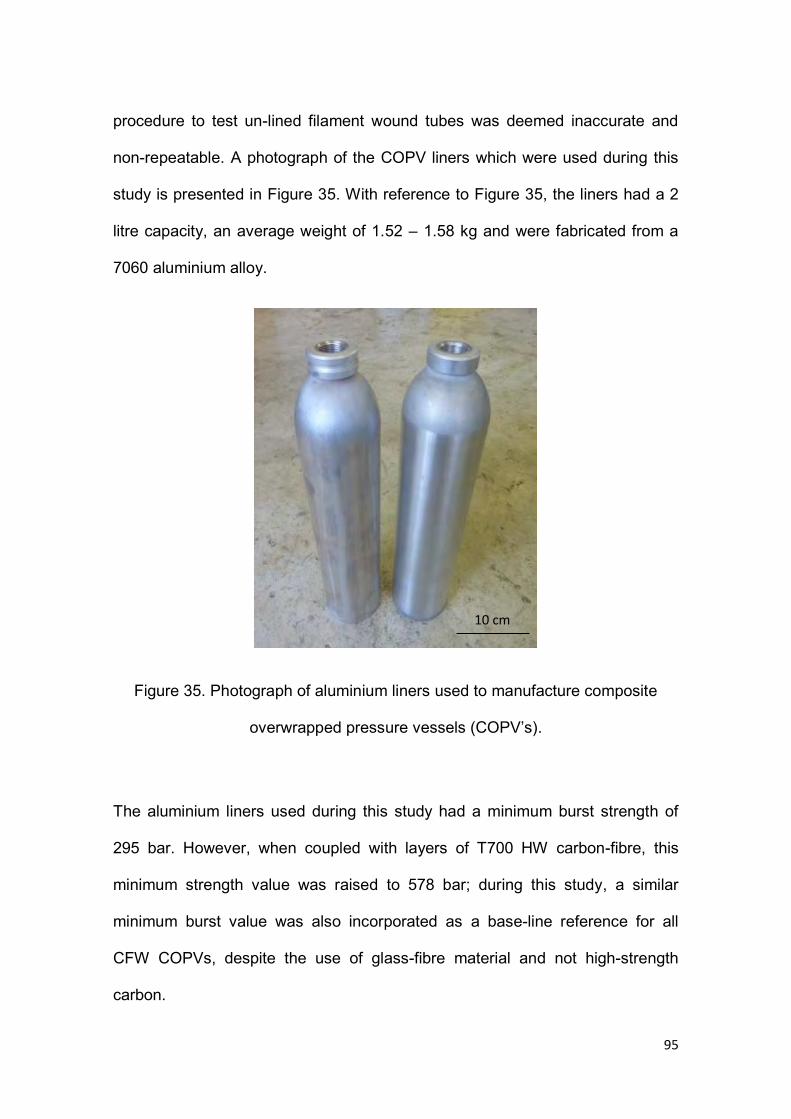
95
procedure to test un-lined filament wound tubes was deemed inaccurate and
non-repeatable. A photograph of the COPV liners which were used during this
study is presented in Figure 35. With reference to Figure 35, the liners had a 2
litre capacity, an average weight of 1.52 – 1.58 kg and were fabricated from a
7060 aluminium alloy.
Figure 35. Photograph of aluminium liners used to manufacture composite
overwrapped pressure vessels (COPV’s).
The aluminium liners used during this study had a minimum burst strength of
295 bar. However, when coupled with layers of T700 HW carbon-fibre, this
minimum strength value was raised to 578 bar; during this study, a similar
minimum burst value was also incorporated as a base-line reference for all
CFW COPVs, despite the use of glass-fibre material and not high-strength
carbon.
10 cm
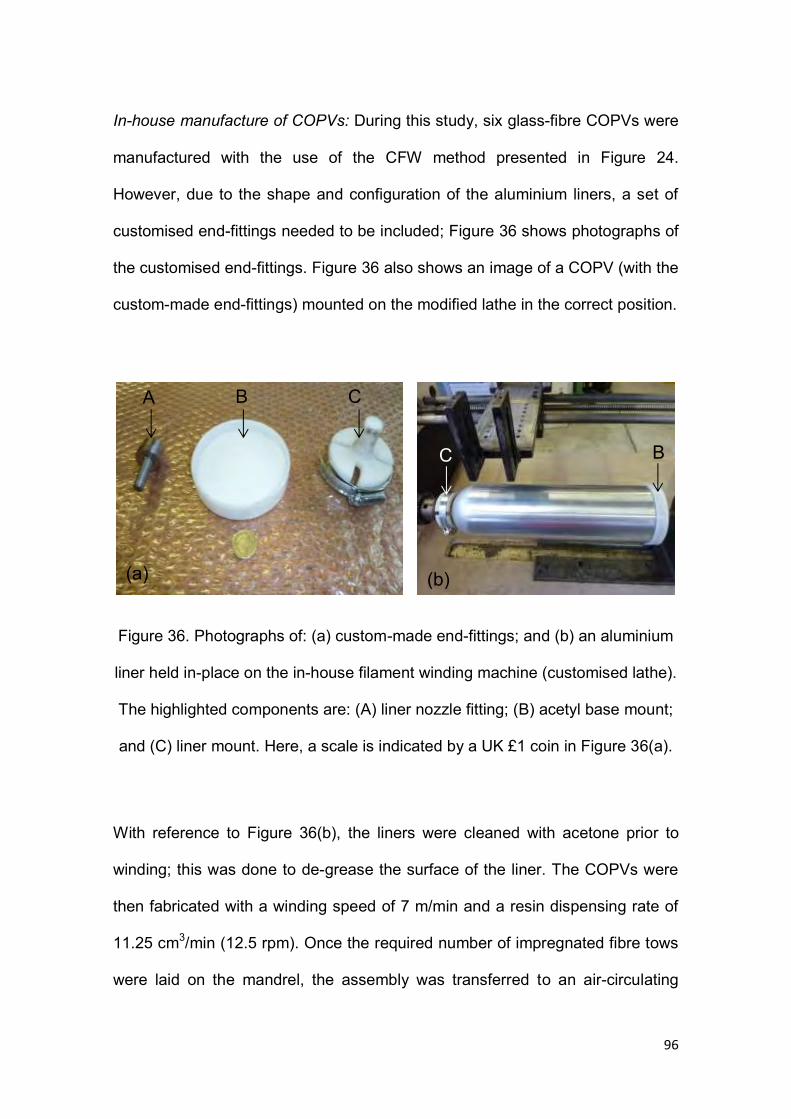
96
In-house manufacture of COPVs: During this study, six glass-fibre COPVs were
manufactured with the use of the CFW method presented in Figure 24.
However, due to the shape and configuration of the aluminium liners, a set of
customised end-fittings needed to be included; Figure 36 shows photographs of
the customised end-fittings. Figure 36 also shows an image of a COPV (with the
custom-made end-fittings) mounted on the modified lathe in the correct position.
Figure 36. Photographs of: (a) custom-made end-fittings; and (b) an aluminium
liner held in-place on the in-house filament winding machine (customised lathe).
The highlighted components are: (A) liner nozzle fitting; (B) acetyl base mount;
and (C) liner mount. Here, a scale is indicated by a UK £1 coin in Figure 36(a).
With reference to Figure 36(b), the liners were cleaned with acetone prior to
winding; this was done to de-grease the surface of the liner. The COPVs were
then fabricated with a winding speed of 7 m/min and a resin dispensing rate of
11.25 cm3/min (12.5 rpm). Once the required number of impregnated fibre tows
were laid on the mandrel, the assembly was transferred to an air-circulating
(a) (b)
A B C
C B
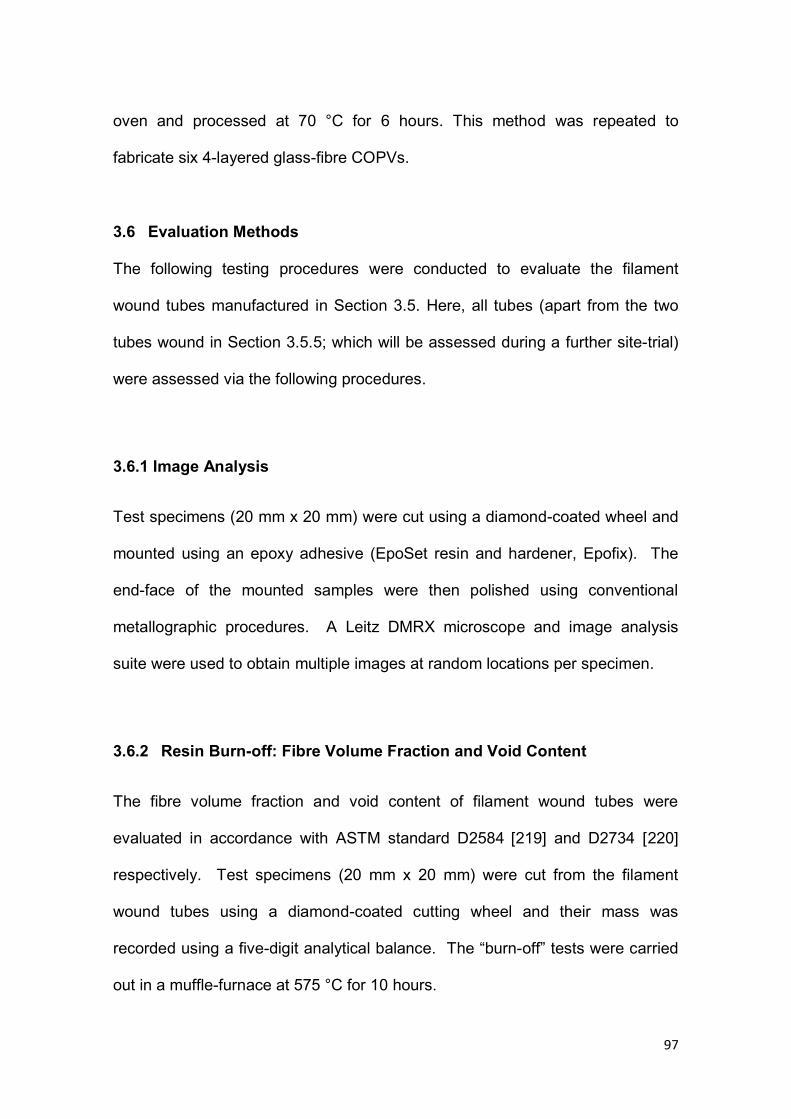
97
oven and processed at 70 °C for 6 hours. This method was repeated to
fabricate six 4-layered glass-fibre COPVs.
3.6 Evaluation Methods
The following testing procedures were conducted to evaluate the filament
wound tubes manufactured in Section 3.5. Here, all tubes (apart from the two
tubes wound in Section 3.5.5; which will be assessed during a further site-trial)
were assessed via the following procedures.
3.6.1 Image Analysis
Test specimens (20 mm x 20 mm) were cut using a diamond-coated wheel and
mounted using an epoxy adhesive (EpoSet resin and hardener, Epofix). The
end-face of the mounted samples were then polished using conventional
metallographic procedures. A Leitz DMRX microscope and image analysis
suite were used to obtain multiple images at random locations per specimen.
3.6.2 Resin Burn-off: Fibre Volume Fraction and Void Content
The fibre volume fraction and void content of filament wound tubes were
evaluated in accordance with ASTM standard D2584 [219] and D2734 [220]
respectively. Test specimens (20 mm x 20 mm) were cut from the filament
wound tubes using a diamond-coated cutting wheel and their mass was
recorded using a five-digit analytical balance. The “burn-off” tests were carried
out in a muffle-furnace at 575 °C for 10 hours.
98
3.6.3 Hoop Tensile (Split Disk) Strength
The procedures stipulated in ASTM D2290 [221] were used to obtain the hoop-
tensile strengths of the filament wound tubes manufactured during this study.
Rings of 20 mm width were cut from the filament wound tubes and notches of
3.2 mm radius were introduced. A photograph of the test fixture is shown in
Figure 37. These tests were carried out at room temperature on a Zwick-1484
mechanical test machine using a cross-head displacement rate of 2 mm/min.
Figure 37. Photograph of the hoop-tensile test fixture. The highlighted
components are: (A) a 20 mm wide composite ring; (B) two centrally mounted
semi-circular disks; and (C) two metallic jigs connected to the testing machine.
10 cm
C A
B
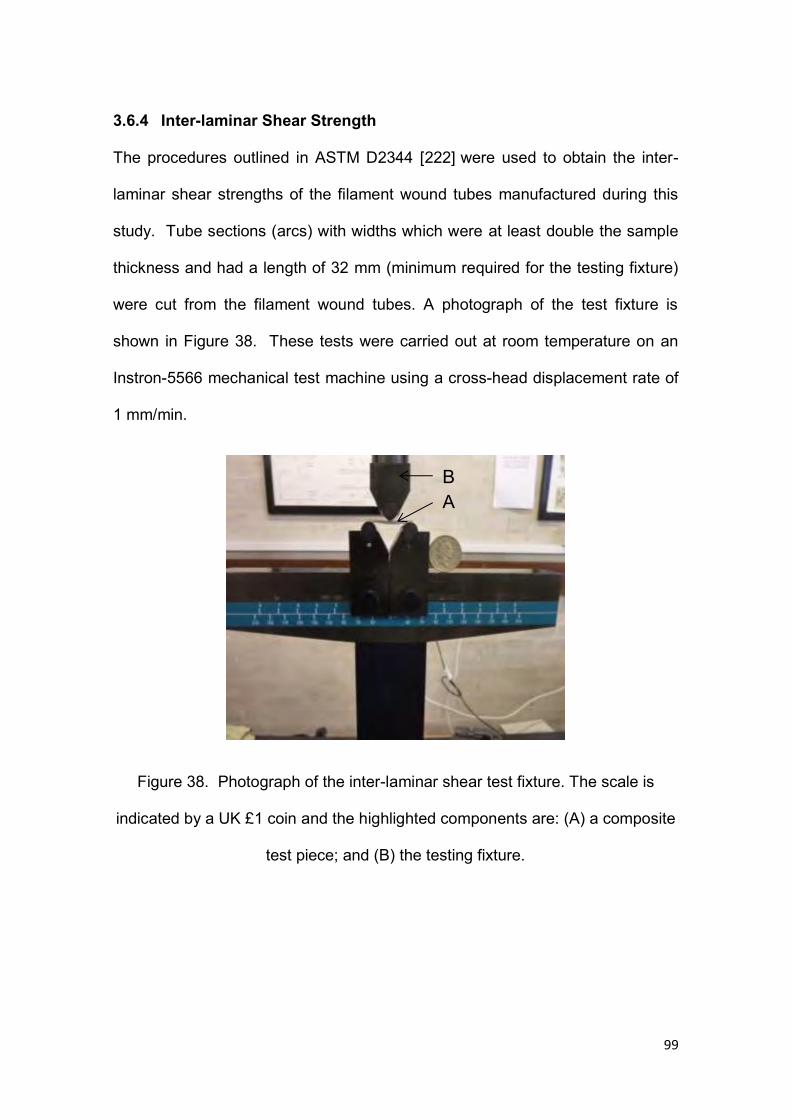
99
3.6.4 Inter-laminar Shear Strength
The procedures outlined in ASTM D2344 [222] were used to obtain the inter-
laminar shear strengths of the filament wound tubes manufactured during this
study. Tube sections (arcs) with widths which were at least double the sample
thickness and had a length of 32 mm (minimum required for the testing fixture)
were cut from the filament wound tubes. A photograph of the test fixture is
shown in Figure 38. These tests were carried out at room temperature on an
Instron-5566 mechanical test machine using a cross-head displacement rate of
1 mm/min.
Figure 38. Photograph of the inter-laminar shear test fixture. The scale is
indicated by a UK £1 coin and the highlighted components are: (A) a composite
test piece; and (B) the testing fixture.
B A
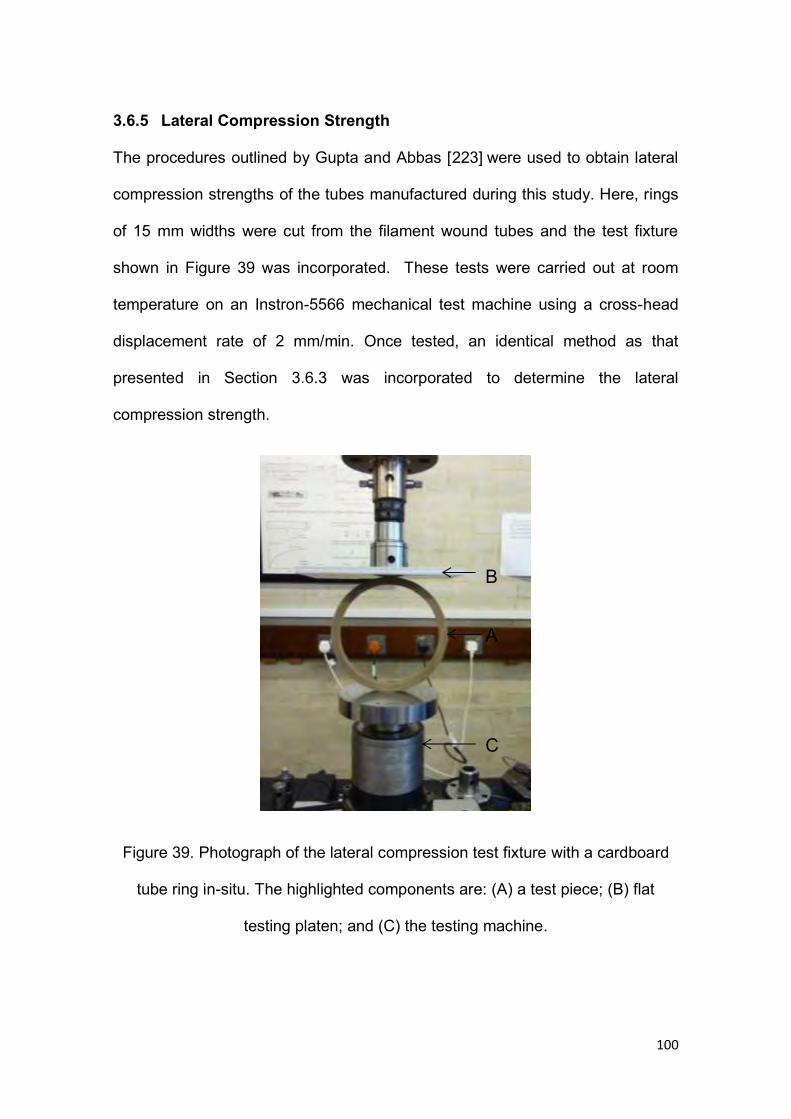
100
3.6.5 Lateral Compression Strength
The procedures outlined by Gupta and Abbas [223] were used to obtain lateral
compression strengths of the tubes manufactured during this study. Here, rings
of 15 mm widths were cut from the filament wound tubes and the test fixture
shown in Figure 39 was incorporated. These tests were carried out at room
temperature on an Instron-5566 mechanical test machine using a cross-head
displacement rate of 2 mm/min. Once tested, an identical method as that
presented in Section 3.6.3 was incorporated to determine the lateral
compression strength.
Figure 39. Photograph of the lateral compression test fixture with a cardboard
tube ring in-situ. The highlighted components are: (A) a test piece; (B) flat
testing platen; and (C) the testing machine.
B
C
A
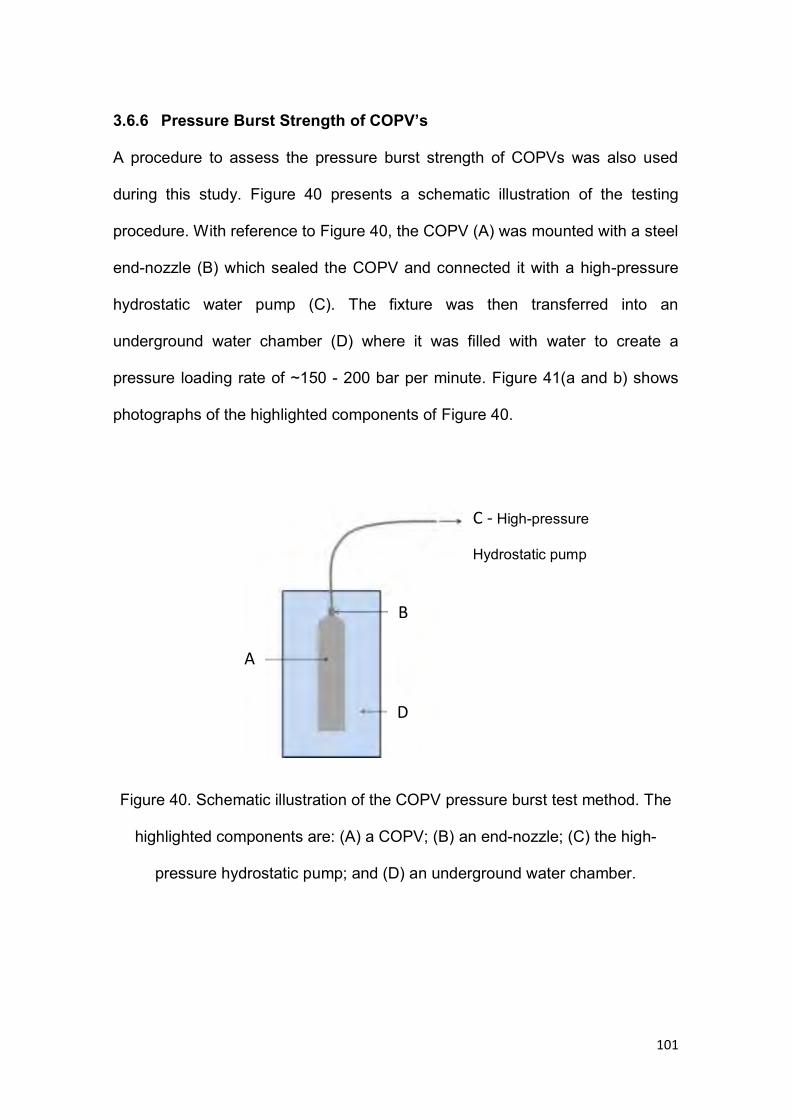
101
3.6.6 Pressure Burst Strength of COPV’s
A procedure to assess the pressure burst strength of COPVs was also used
during this study. Figure 40 presents a schematic illustration of the testing
procedure. With reference to Figure 40, the COPV (A) was mounted with a steel
end-nozzle (B) which sealed the COPV and connected it with a high-pressure
hydrostatic water pump (C). The fixture was then transferred into an
underground water chamber (D) where it was filled with water to create a
pressure loading rate of ~150 - 200 bar per minute. Figure 41(a and b) shows
photographs of the highlighted components of Figure 40.
Figure 40. Schematic illustration of the COPV pressure burst test method. The
highlighted components are: (A) a COPV; (B) an end-nozzle; (C) the high-
pressure hydrostatic pump; and (D) an underground water chamber.
A
D
B
C - High-pressure
Hydrostatic pump
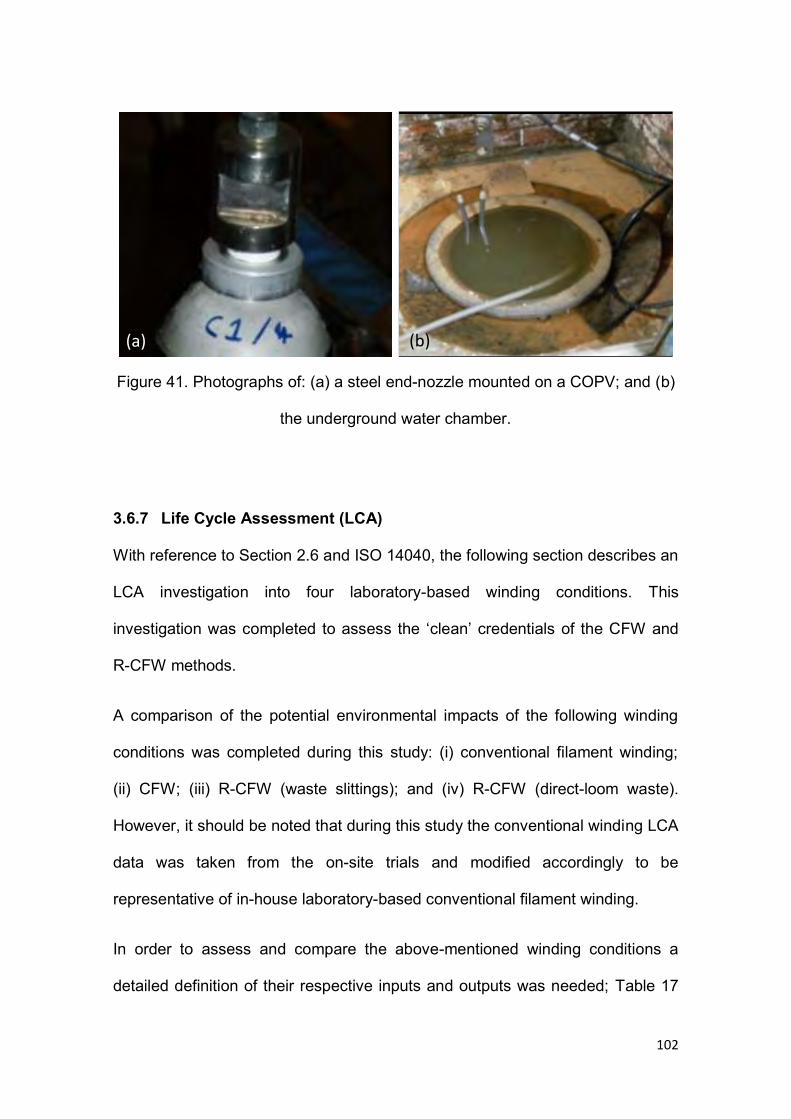
102
Figure 41. Photographs of: (a) a steel end-nozzle mounted on a COPV; and (b)
the underground water chamber.
3.6.7 Life Cycle Assessment (LCA)
With reference to Section 2.6 and ISO 14040, the following section describes an
LCA investigation into four laboratory-based winding conditions. This
investigation was completed to assess the ‘clean’ credentials of the CFW and
R-CFW methods.
A comparison of the potential environmental impacts of the following winding
conditions was completed during this study: (i) conventional filament winding;
(ii) CFW; (iii) R-CFW (waste slittings); and (iv) R-CFW (direct-loom waste).
However, it should be noted that during this study the conventional winding LCA
data was taken from the on-site trials and modified accordingly to be
representative of in-house laboratory-based conventional filament winding.
In order to assess and compare the above-mentioned winding conditions a
detailed definition of their respective inputs and outputs was needed; Table 17
(a) (b)
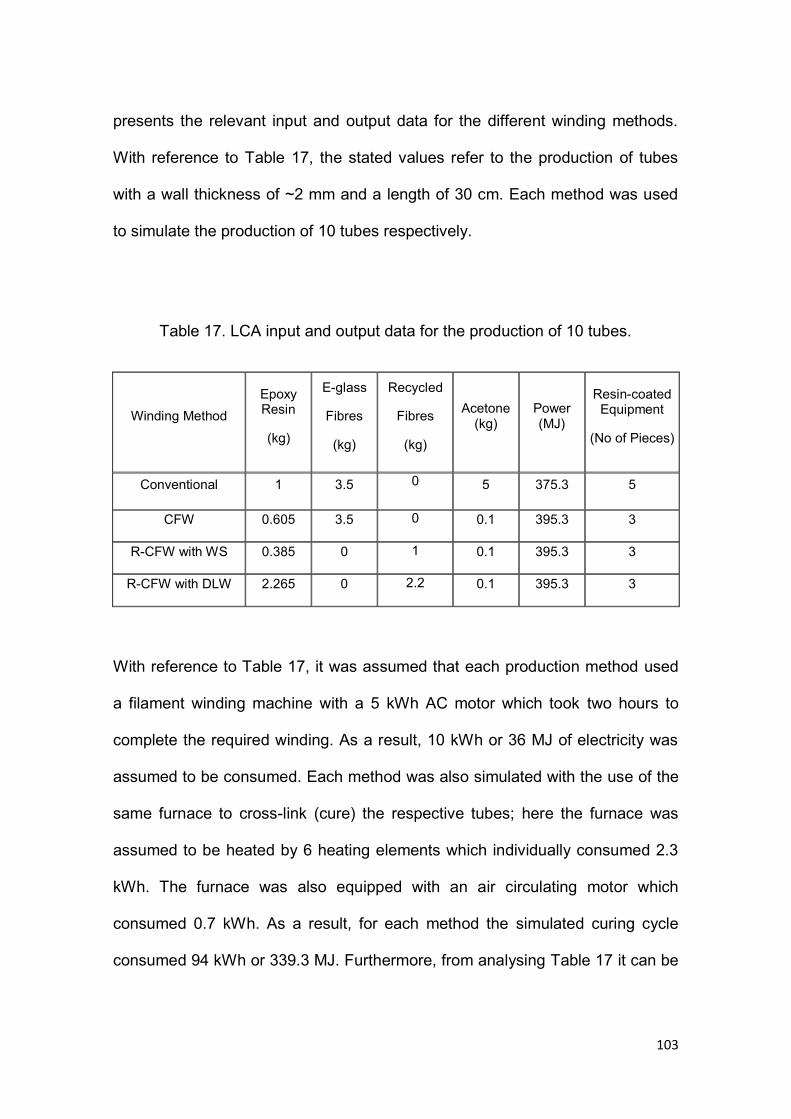
103
presents the relevant input and output data for the different winding methods.
With reference to Table 17, the stated values refer to the production of tubes
with a wall thickness of ~2 mm and a length of 30 cm. Each method was used
to simulate the production of 10 tubes respectively.
Table 17. LCA input and output data for the production of 10 tubes.
Winding Method Epoxy Resin
(kg)
E-glass
Fibres
(kg)
Recycled
Fibres
(kg)
Acetone (kg)
Power (MJ)
Resin-coated Equipment
(No of Pieces)
Conventional 1 3.5 0 5 375.3 5
CFW 0.605 3.5 0 0.1 395.3 3
R-CFW with WS 0.385 0 1 0.1 395.3 3
R-CFW with DLW 2.265 0 2.2 0.1 395.3 3
With reference to Table 17, it was assumed that each production method used
a filament winding machine with a 5 kWh AC motor which took two hours to
complete the required winding. As a result, 10 kWh or 36 MJ of electricity was
assumed to be consumed. Each method was also simulated with the use of the
same furnace to cross-link (cure) the respective tubes; here the furnace was
assumed to be heated by 6 heating elements which individually consumed 2.3
kWh. The furnace was also equipped with an air circulating motor which
consumed 0.7 kWh. As a result, for each method the simulated curing cycle
consumed 94 kWh or 339.3 MJ. Furthermore, from analysing Table 17 it can be
104
noted that the CFW technologies consumed 20 MJ more energy than their
conventional predecessor; this was attributed to the use of the resin dispensing
unit.
The consumption of epoxy resin during each production method was a function
of many factors, such as: (i) impregnation method i.e. resin bath or resin
impregnation unit; (ii) winding speed; and (iii) resin dispensing rate. An in depth
analysis of these factors is presented in the following results and discussion
section.
From analysing Table 17, it can also be noted that the consumption of
reinforcing E-glass fibres during the R-CFW methods was defined as zero. As a
result, the potential environmental impact from using the recycled reinforcing
fibres was also set as zero. This was deemed adequate as the recycled fibres
used during the R-CFW method were 100% recycled i.e. if they were not used
during this study then 100% of the fibres would have been deposited into a
landfill.
The ‘acetone’ and ‘resin coated equipment’ factors of Table 17 could also be
noted as interconnected factors. Here any decreases in acetone consumption
produced from the CFW and R-CFW methods were attributed to the reduction
of resin coated surfaces during manufacture.
The input and output data presented in Table 17 was then applied to a filament
winding LCA template; this template was developed during this study and is
presented in the following section.
105
With regards to the LCA template, this was used as a generic platform for all
winding conditions and the relevant input and output data was then entered into
this template for each independent winding method. It should also be noted that
the LCA template was restricted to just the assessment of the production of
filament wound tubes i.e. the system boundary confined the LCA to just the
production phase and was not able to take all life-cycle phases into account i.e.
material extraction or use phase.
3.6.7.1 Filament Winding LCA Template
An overview of the LCA template developed during this study is presented in
Figure 42. With reference to Figure 42, the LCA template was developed with
the use of a commercially available LCA software package (GaBi 4) and
consisted of three levels; (i) a Level-3 plan (Input transportation); (ii) a Level-2
plan (Production); and (iii) a Top-level plan (Overview). As demonstrated in
Figure 42, the LCA template was produced from independently completing each
consecutive level; this produced an overall filament winding template which
could be appropriately modified according to the input and output data
presented in Table 17.
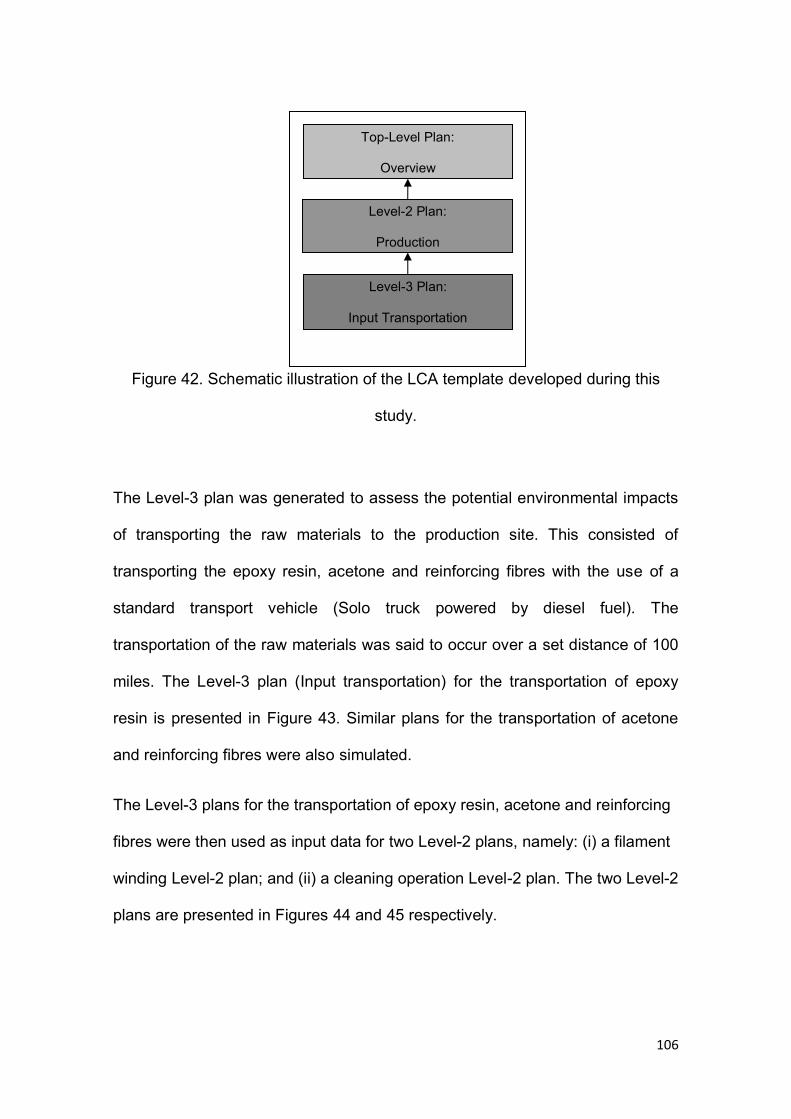
106
Figure 42. Schematic illustration of the LCA template developed during this
study.
The Level-3 plan was generated to assess the potential environmental impacts
of transporting the raw materials to the production site. This consisted of
transporting the epoxy resin, acetone and reinforcing fibres with the use of a
standard transport vehicle (Solo truck powered by diesel fuel). The
transportation of the raw materials was said to occur over a set distance of 100
miles. The Level-3 plan (Input transportation) for the transportation of epoxy
resin is presented in Figure 43. Similar plans for the transportation of acetone
and reinforcing fibres were also simulated.
The Level-3 plans for the transportation of epoxy resin, acetone and reinforcing
fibres were then used as input data for two Level-2 plans, namely: (i) a filament
winding Level-2 plan; and (ii) a cleaning operation Level-2 plan. The two Level-2
plans are presented in Figures 44 and 45 respectively.
Level-2 Plan:
Production
Top-Level Plan:
Overview
Level-3 Plan:
Input Transportation
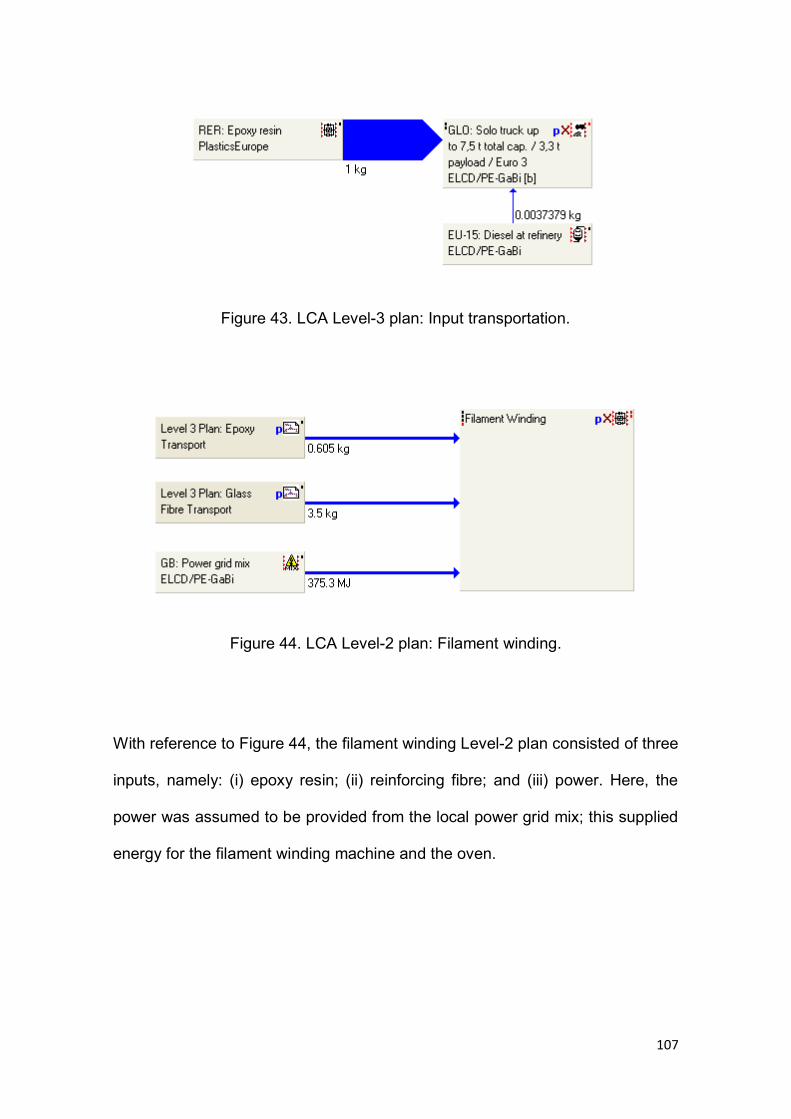
107
Figure 43. LCA Level-3 plan: Input transportation.
Figure 44. LCA Level-2 plan: Filament winding.
With reference to Figure 44, the filament winding Level-2 plan consisted of three
inputs, namely: (i) epoxy resin; (ii) reinforcing fibre; and (iii) power. Here, the
power was assumed to be provided from the local power grid mix; this supplied
energy for the filament winding machine and the oven.
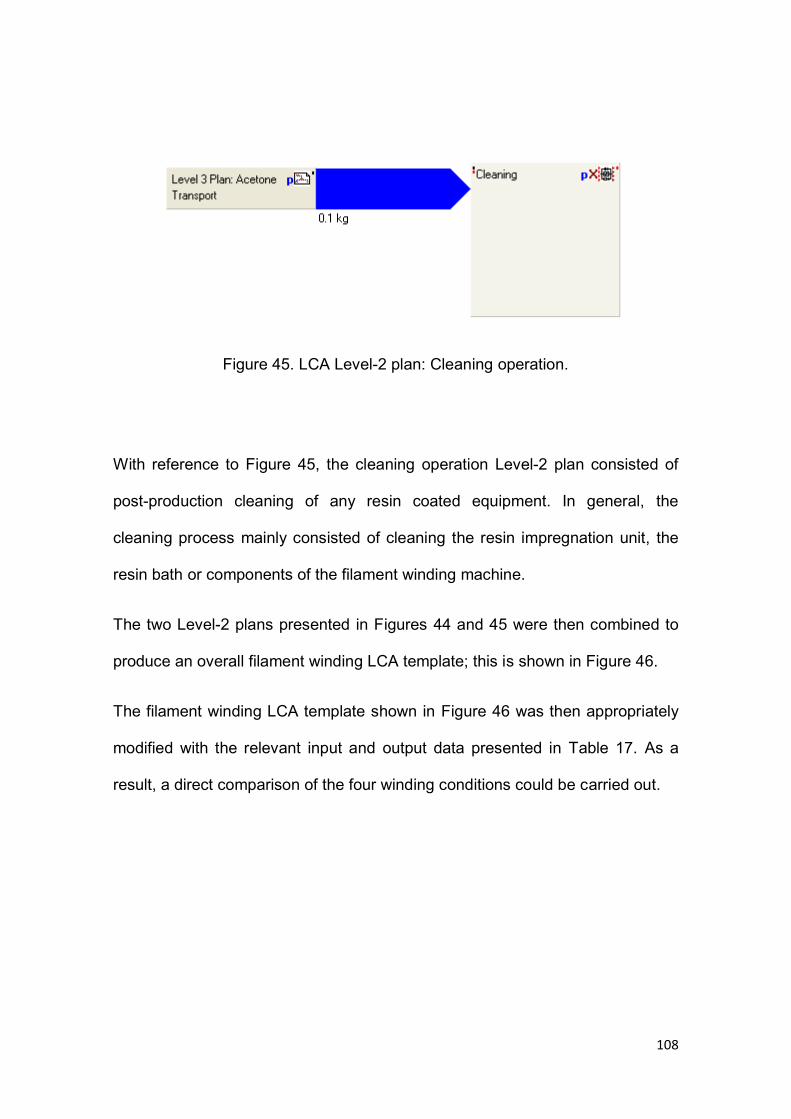
108
Figure 45. LCA Level-2 plan: Cleaning operation.
With reference to Figure 45, the cleaning operation Level-2 plan consisted of
post-production cleaning of any resin coated equipment. In general, the
cleaning process mainly consisted of cleaning the resin impregnation unit, the
resin bath or components of the filament winding machine.
The two Level-2 plans presented in Figures 44 and 45 were then combined to
produce an overall filament winding LCA template; this is shown in Figure 46.
The filament winding LCA template shown in Figure 46 was then appropriately
modified with the relevant input and output data presented in Table 17. As a
result, a direct comparison of the four winding conditions could be carried out.
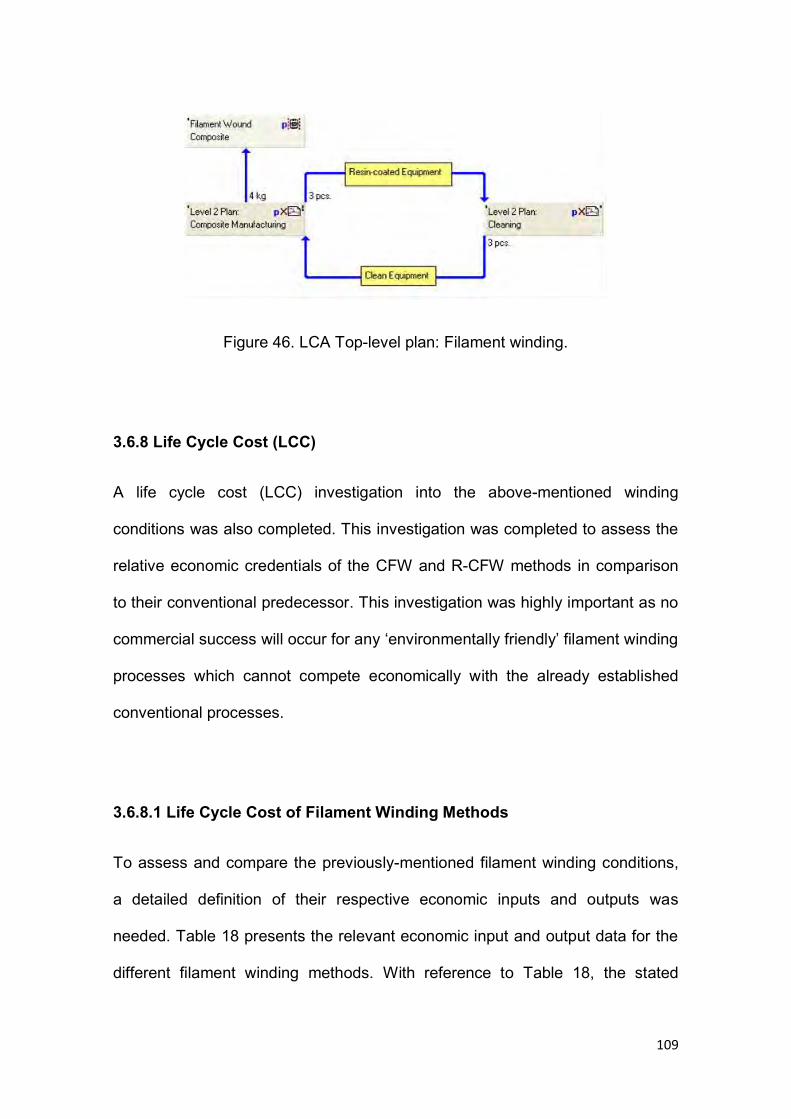
109
Figure 46. LCA Top-level plan: Filament winding.
3.6.8 Life Cycle Cost (LCC)
A life cycle cost (LCC) investigation into the above-mentioned winding
conditions was also completed. This investigation was completed to assess the
relative economic credentials of the CFW and R-CFW methods in comparison
to their conventional predecessor. This investigation was highly important as no
commercial success will occur for any ‘environmentally friendly’ filament winding
processes which cannot compete economically with the already established
conventional processes.
3.6.8.1 Life Cycle Cost of Filament Winding Methods
To assess and compare the previously-mentioned filament winding conditions,
a detailed definition of their respective economic inputs and outputs was
needed. Table 18 presents the relevant economic input and output data for the
different filament winding methods. With reference to Table 18, the stated
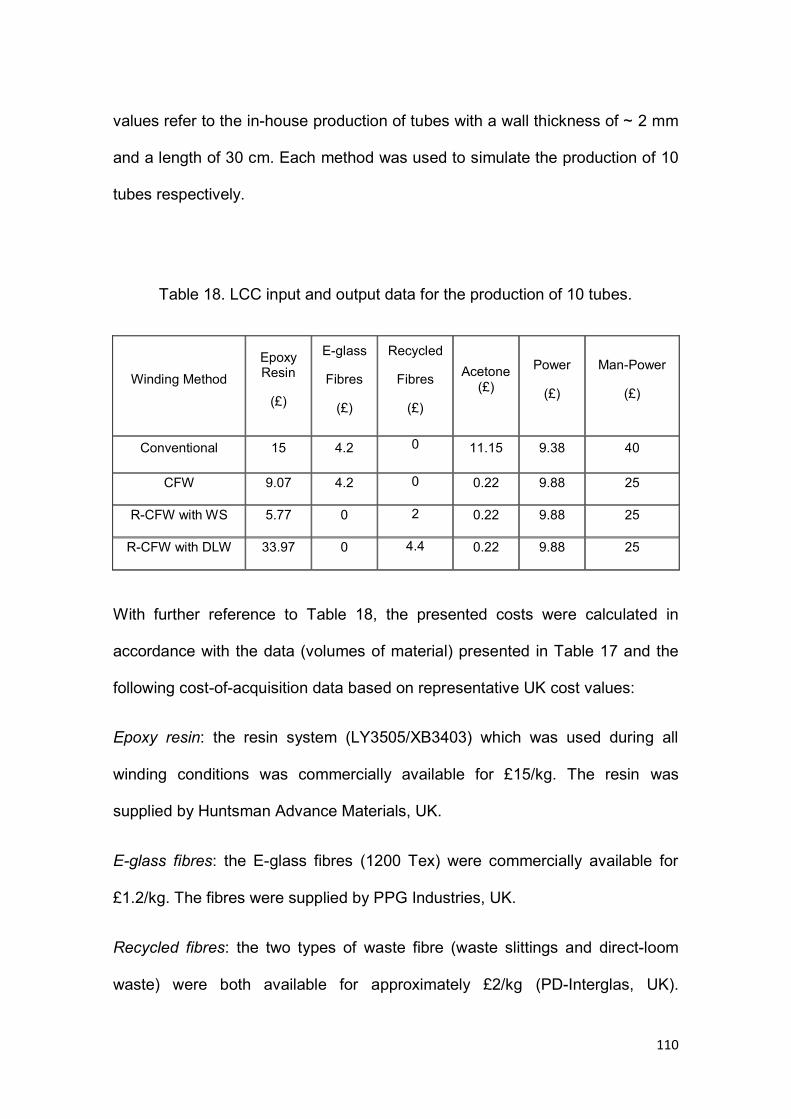
110
values refer to the in-house production of tubes with a wall thickness of ~ 2 mm
and a length of 30 cm. Each method was used to simulate the production of 10
tubes respectively.
Table 18. LCC input and output data for the production of 10 tubes.
Winding Method Epoxy Resin
(£)
E-glass
Fibres
(£)
Recycled
Fibres
(£)
Acetone (£)
Power
(£)
Man-Power
(£)
Conventional 15 4.2 0 11.15 9.38 40
CFW 9.07 4.2 0 0.22 9.88 25
R-CFW with WS 5.77 0 2 0.22 9.88 25
R-CFW with DLW 33.97 0 4.4 0.22 9.88 25
With further reference to Table 18, the presented costs were calculated in
accordance with the data (volumes of material) presented in Table 17 and the
following cost-of-acquisition data based on representative UK cost values:
Epoxy resin: the resin system (LY3505/XB3403) which was used during all
winding conditions was commercially available for £15/kg. The resin was
supplied by Huntsman Advance Materials, UK.
E-glass fibres: the E-glass fibres (1200 Tex) were commercially available for
£1.2/kg. The fibres were supplied by PPG Industries, UK.
Recycled fibres: the two types of waste fibre (waste slittings and direct-loom
waste) were both available for approximately £2/kg (PD-Interglas, UK).

111
However, it was proposed that if large-scale volumes could be used then the
price of the waste-fibres could be waved i.e. reduced to zero; this was based on
the savings the supplying company would make on reduced storage and
disposal costs.
Acetone: the Acetone solvent which was used for post-production cleaning was
commercially available for £2.23/kg.
Power: the power which was consumed during all winding conditions was
supplied by the power grid-mix at a cost of approximately £0.09/kWh.
Man-power: during all winding trials a minimum of one machine operator was
needed. Here a constant hourly-rate of £10 per operator was used to account
for the man-power needed for each trial.
From knowing the above-mentioned data it was then possible to calculate and
compare LCC data for each manufacturing process. The results of this analysis
are presented in Section 4.8.7.
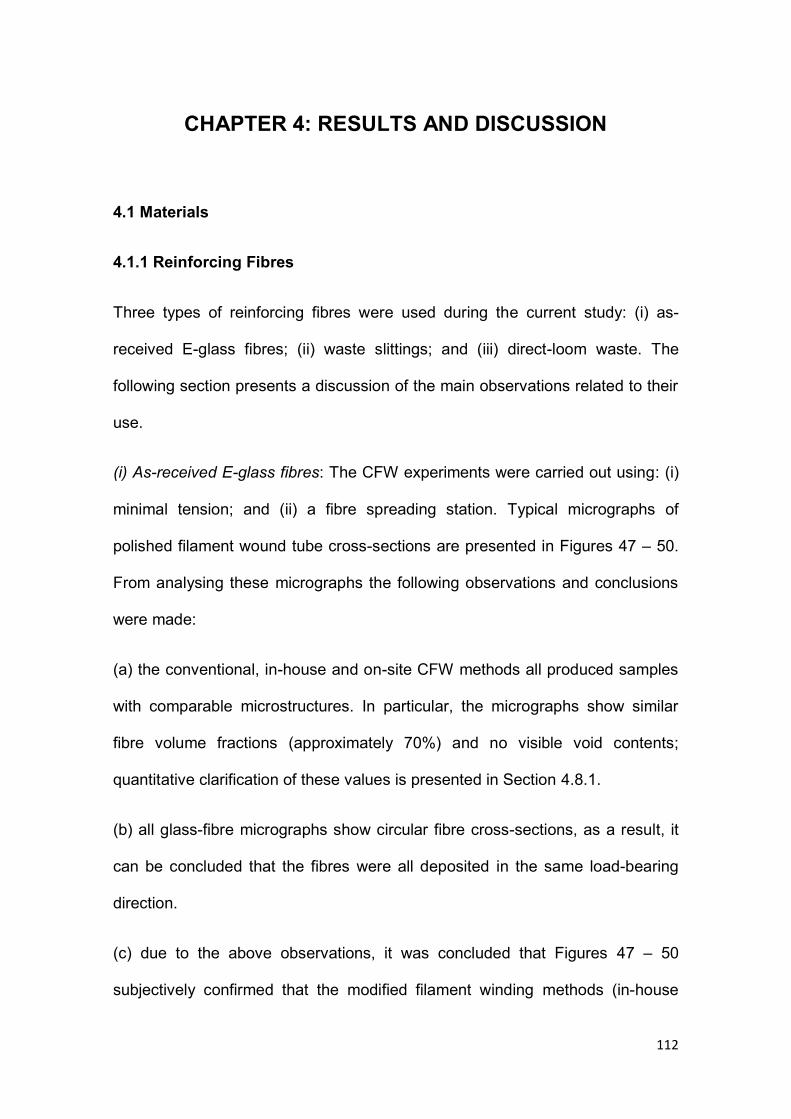
112
CHAPTER 4: RESULTS AND DISCUSSION
4.1 Materials
4.1.1 Reinforcing Fibres
Three types of reinforcing fibres were used during the current study: (i) as-
received E-glass fibres; (ii) waste slittings; and (iii) direct-loom waste. The
following section presents a discussion of the main observations related to their
use.
(i) As-received E-glass fibres: The CFW experiments were carried out using: (i)
minimal tension; and (ii) a fibre spreading station. Typical micrographs of
polished filament wound tube cross-sections are presented in Figures 47 – 50.
From analysing these micrographs the following observations and conclusions
were made:
(a) the conventional, in-house and on-site CFW methods all produced samples
with comparable microstructures. In particular, the micrographs show similar
fibre volume fractions (approximately 70%) and no visible void contents;
quantitative clarification of these values is presented in Section 4.8.1.
(b) all glass-fibre micrographs show circular fibre cross-sections, as a result, it
can be concluded that the fibres were all deposited in the same load-bearing
direction.
(c) due to the above observations, it was concluded that Figures 47 – 50
subjectively confirmed that the modified filament winding methods (in-house
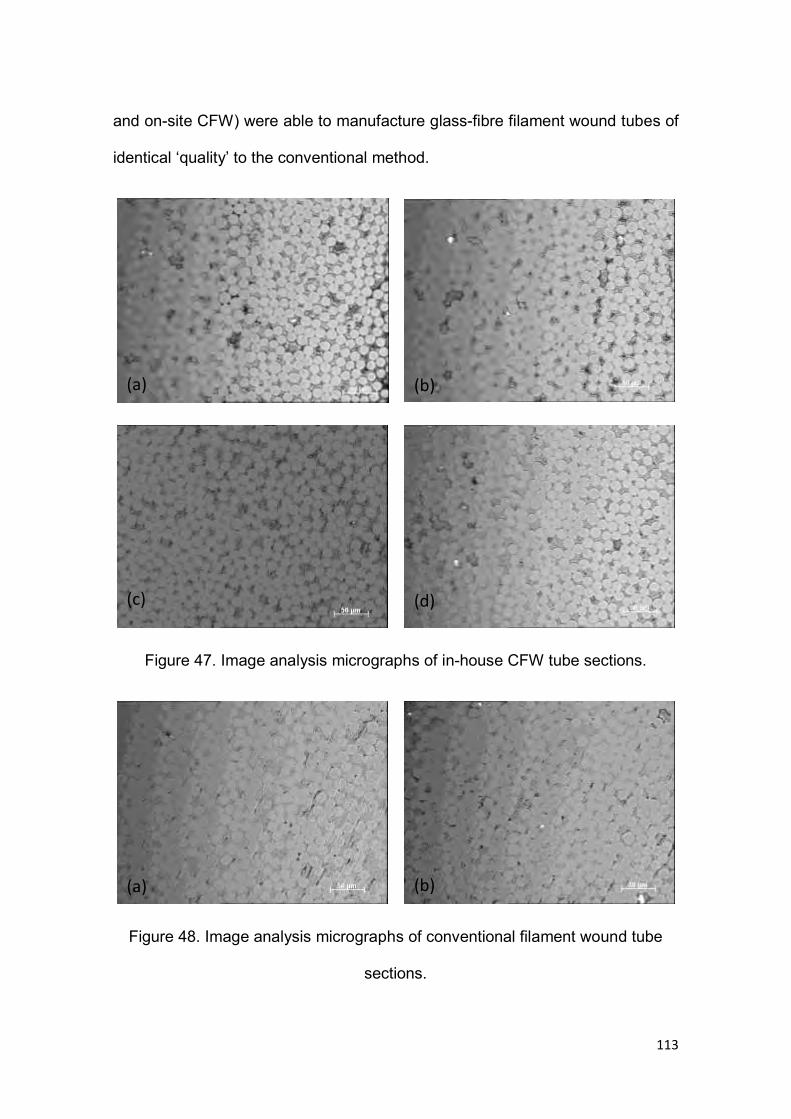
113
and on-site CFW) were able to manufacture glass-fibre filament wound tubes of
identical ‘quality’ to the conventional method.
Figure 47. Image analysis micrographs of in-house CFW tube sections.
Figure 48. Image analysis micrographs of conventional filament wound tube
sections.
(a)
(d) (c)
(b)
(a) (b)
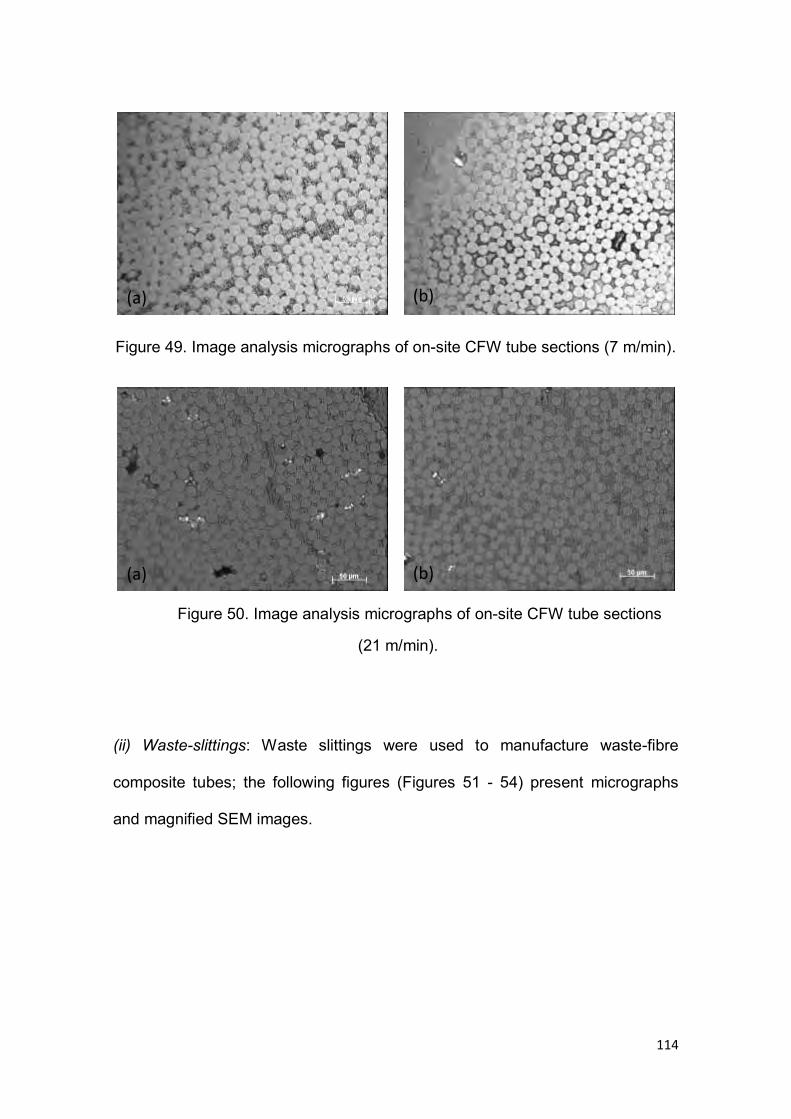
114
Figure 49. Image analysis micrographs of on-site CFW tube sections (7 m/min).
Figure 50. Image analysis micrographs of on-site CFW tube sections
(21 m/min).
(ii) Waste-slittings: Waste slittings were used to manufacture waste-fibre
composite tubes; the following figures (Figures 51 - 54) present micrographs
and magnified SEM images.
(a) (b)
(a) (b)
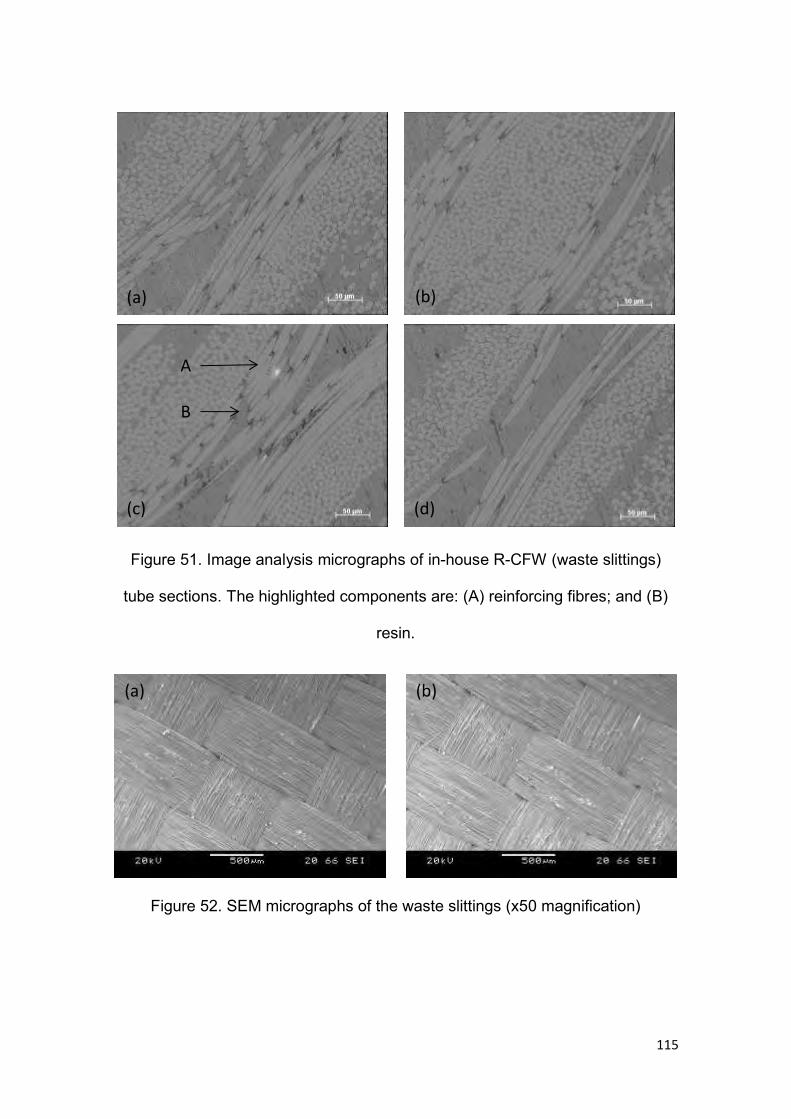
115
Figure 51. Image analysis micrographs of in-house R-CFW (waste slittings)
tube sections. The highlighted components are: (A) reinforcing fibres; and (B)
resin.
Figure 52. SEM micrographs of the waste slittings (x50 magnification)
(a)
(c) (d)
(b)
(a) (b)
A
B
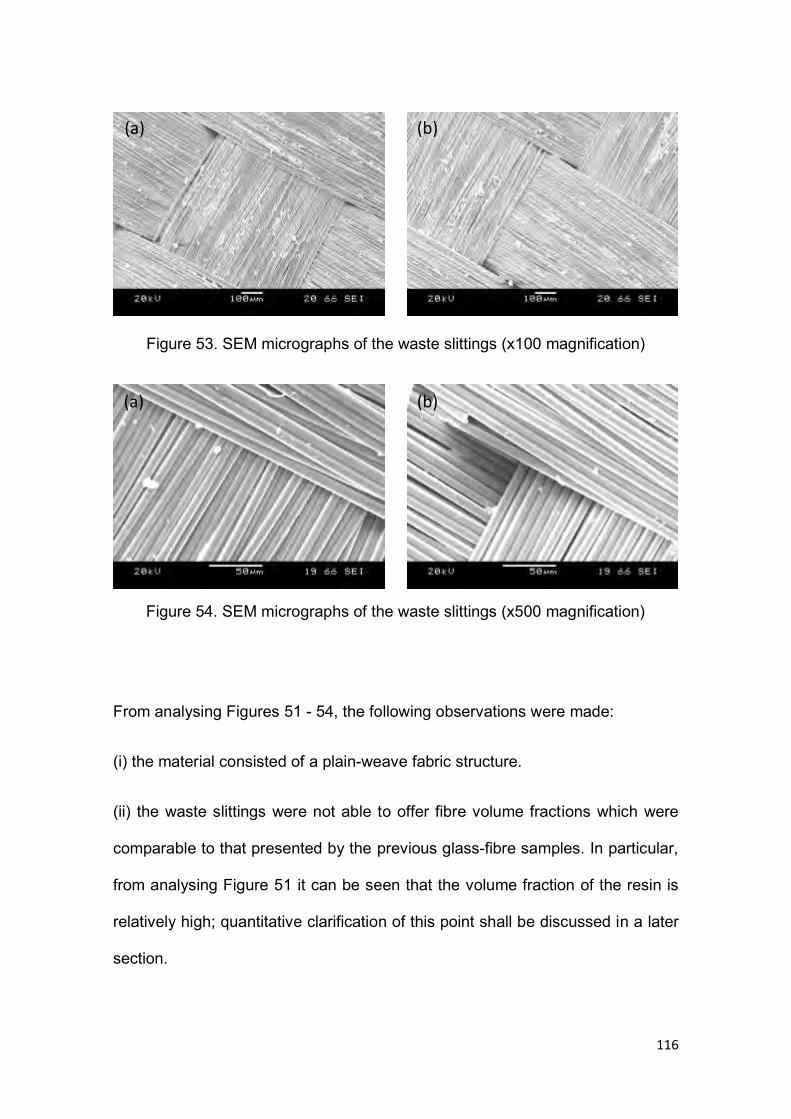
116
Figure 53. SEM micrographs of the waste slittings (x100 magnification)
Figure 54. SEM micrographs of the waste slittings (x500 magnification)
From analysing Figures 51 - 54, the following observations were made:
(i) the material consisted of a plain-weave fabric structure.
(ii) the waste slittings were not able to offer fibre volume fractions which were
comparable to that presented by the previous glass-fibre samples. In particular,
from analysing Figure 51 it can be seen that the volume fraction of the resin is
relatively high; quantitative clarification of this point shall be discussed in a later
section.
(a) (b)
(b) (a)
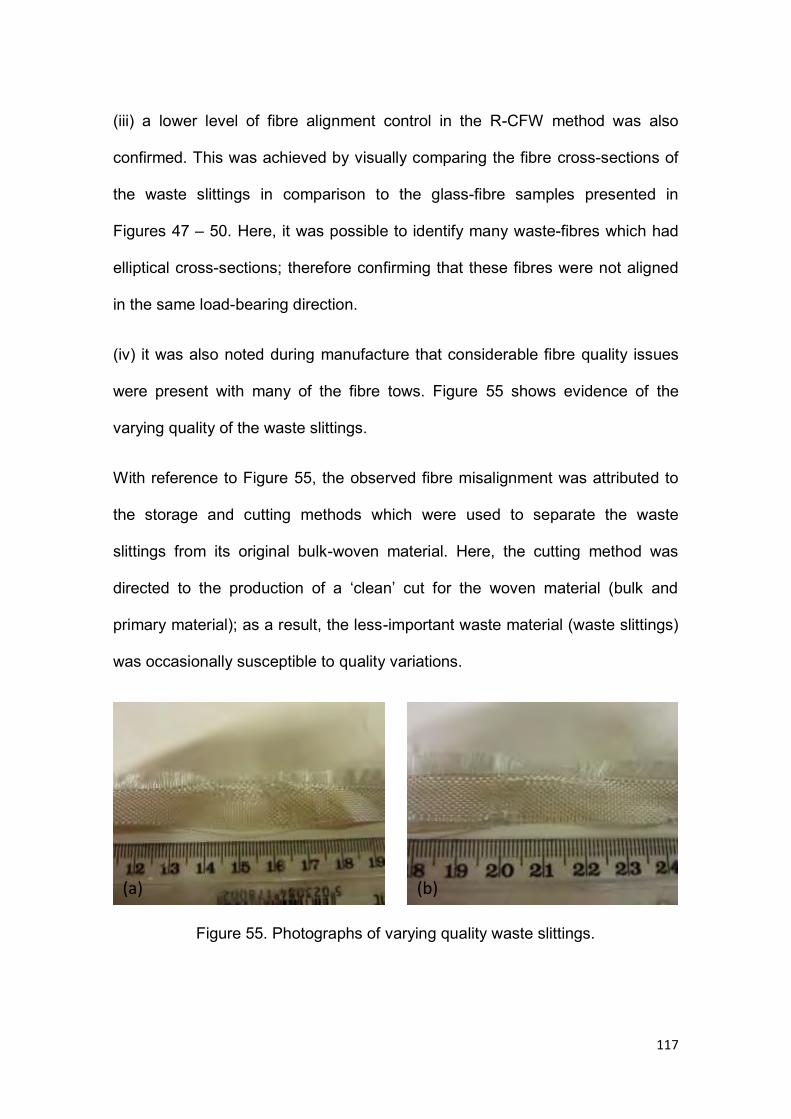
117
(iii) a lower level of fibre alignment control in the R-CFW method was also
confirmed. This was achieved by visually comparing the fibre cross-sections of
the waste slittings in comparison to the glass-fibre samples presented in
Figures 47 – 50. Here, it was possible to identify many waste-fibres which had
elliptical cross-sections; therefore confirming that these fibres were not aligned
in the same load-bearing direction.
(iv) it was also noted during manufacture that considerable fibre quality issues
were present with many of the fibre tows. Figure 55 shows evidence of the
varying quality of the waste slittings.
With reference to Figure 55, the observed fibre misalignment was attributed to
the storage and cutting methods which were used to separate the waste
slittings from its original bulk-woven material. Here, the cutting method was
directed to the production of a ‘clean’ cut for the woven material (bulk and
primary material); as a result, the less-important waste material (waste slittings)
was occasionally susceptible to quality variations.
Figure 55. Photographs of varying quality waste slittings.
(a) (b)
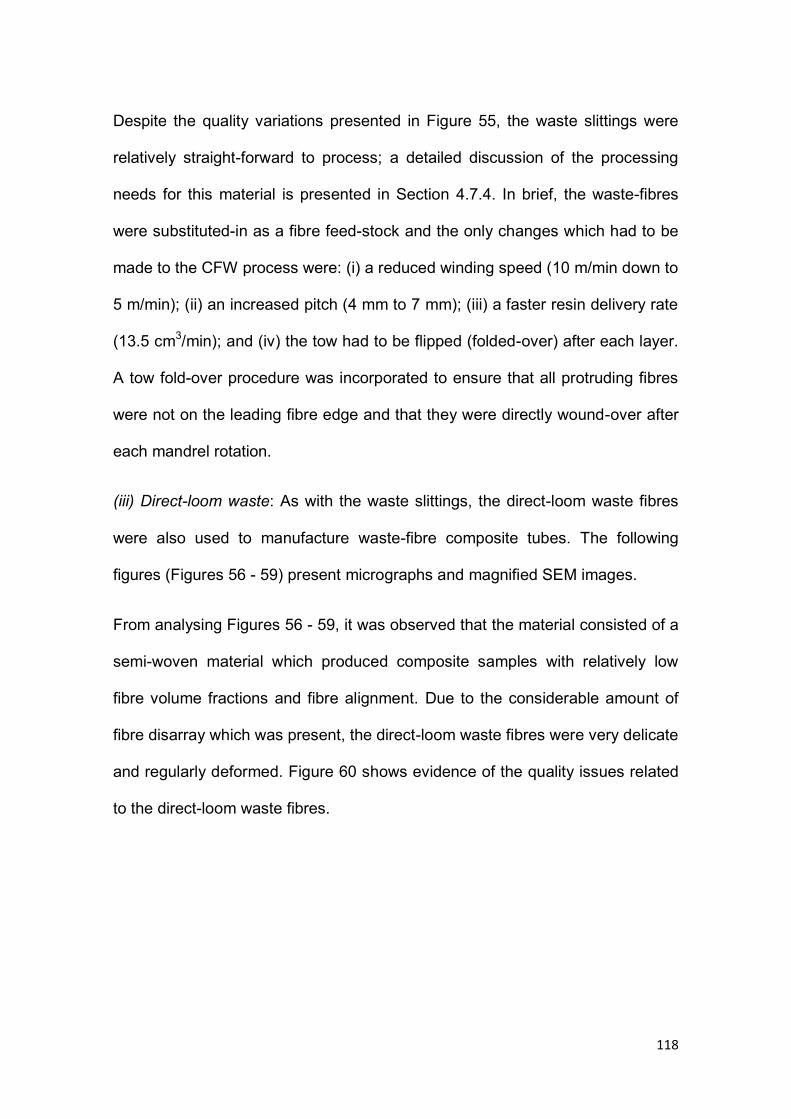
118
Despite the quality variations presented in Figure 55, the waste slittings were
relatively straight-forward to process; a detailed discussion of the processing
needs for this material is presented in Section 4.7.4. In brief, the waste-fibres
were substituted-in as a fibre feed-stock and the only changes which had to be
made to the CFW process were: (i) a reduced winding speed (10 m/min down to
5 m/min); (ii) an increased pitch (4 mm to 7 mm); (iii) a faster resin delivery rate
(13.5 cm3/min); and (iv) the tow had to be flipped (folded-over) after each layer.
A tow fold-over procedure was incorporated to ensure that all protruding fibres
were not on the leading fibre edge and that they were directly wound-over after
each mandrel rotation.
(iii) Direct-loom waste: As with the waste slittings, the direct-loom waste fibres
were also used to manufacture waste-fibre composite tubes. The following
figures (Figures 56 - 59) present micrographs and magnified SEM images.
From analysing Figures 56 - 59, it was observed that the material consisted of a
semi-woven material which produced composite samples with relatively low
fibre volume fractions and fibre alignment. Due to the considerable amount of
fibre disarray which was present, the direct-loom waste fibres were very delicate
and regularly deformed. Figure 60 shows evidence of the quality issues related
to the direct-loom waste fibres.
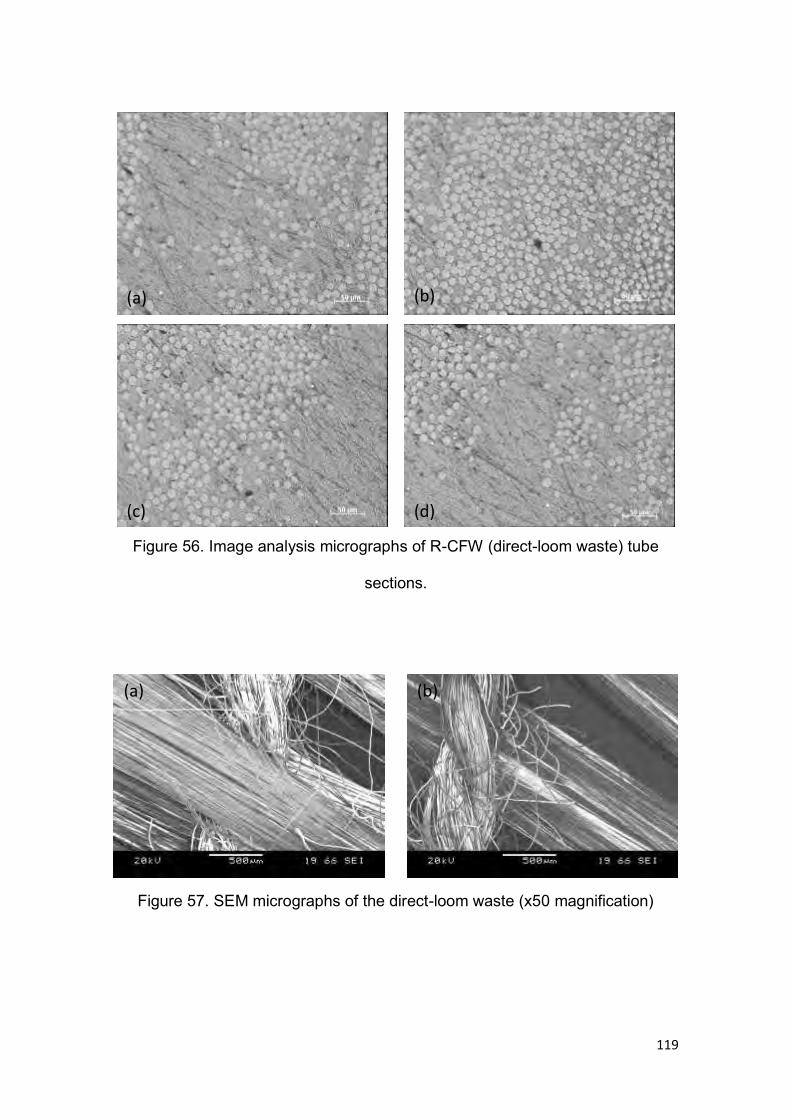
119
Figure 56. Image analysis micrographs of R-CFW (direct-loom waste) tube
sections.
Figure 57. SEM micrographs of the direct-loom waste (x50 magnification)
(a)
(d) (c)
(b)
(b) (a)
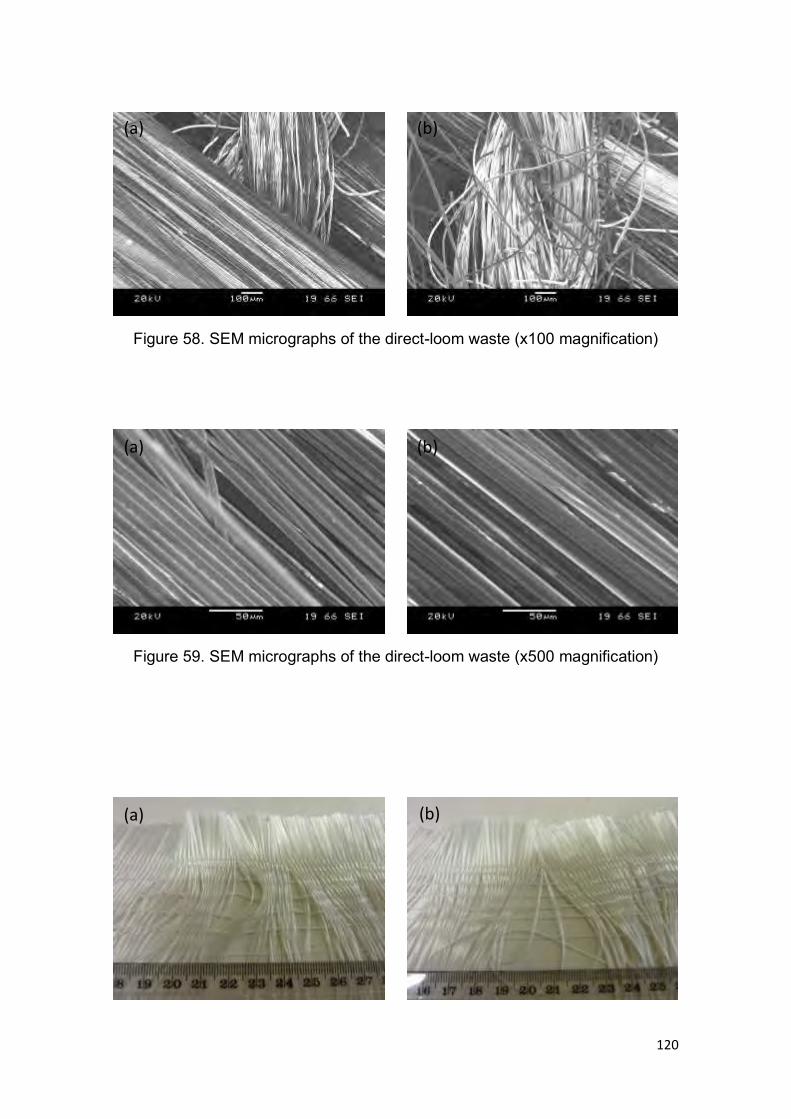
120
Figure 58. SEM micrographs of the direct-loom waste (x100 magnification)
Figure 59. SEM micrographs of the direct-loom waste (x500 magnification)
(a) (b)
(a) (b)
(a) (b)
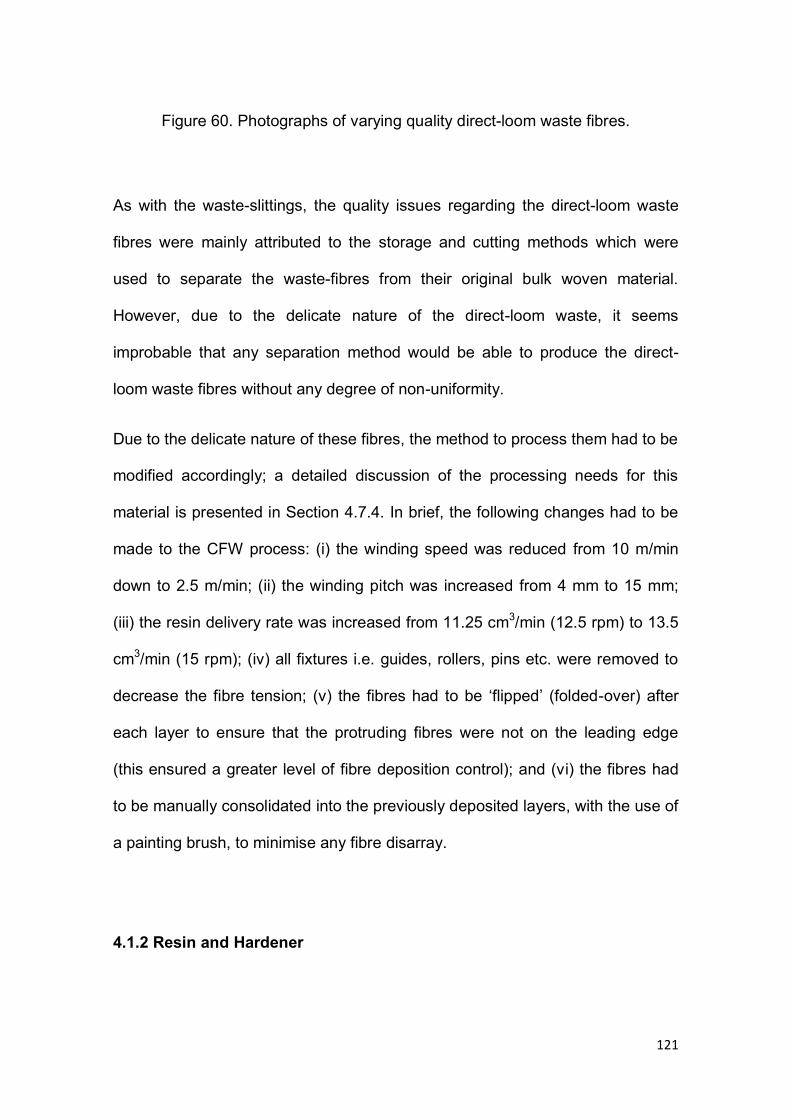
121
Figure 60. Photographs of varying quality direct-loom waste fibres.
As with the waste-slittings, the quality issues regarding the direct-loom waste
fibres were mainly attributed to the storage and cutting methods which were
used to separate the waste-fibres from their original bulk woven material.
However, due to the delicate nature of the direct-loom waste, it seems
improbable that any separation method would be able to produce the direct-
loom waste fibres without any degree of non-uniformity.
Due to the delicate nature of these fibres, the method to process them had to be
modified accordingly; a detailed discussion of the processing needs for this
material is presented in Section 4.7.4. In brief, the following changes had to be
made to the CFW process: (i) the winding speed was reduced from 10 m/min
down to 2.5 m/min; (ii) the winding pitch was increased from 4 mm to 15 mm;
(iii) the resin delivery rate was increased from 11.25 cm3/min (12.5 rpm) to 13.5
cm3/min (15 rpm); (iv) all fixtures i.e. guides, rollers, pins etc. were removed to
decrease the fibre tension; (v) the fibres had to be ‘flipped’ (folded-over) after
each layer to ensure that the protruding fibres were not on the leading edge
(this ensured a greater level of fibre deposition control); and (vi) the fibres had
to be manually consolidated into the previously deposited layers, with the use of
a painting brush, to minimise any fibre disarray.
4.1.2 Resin and Hardener
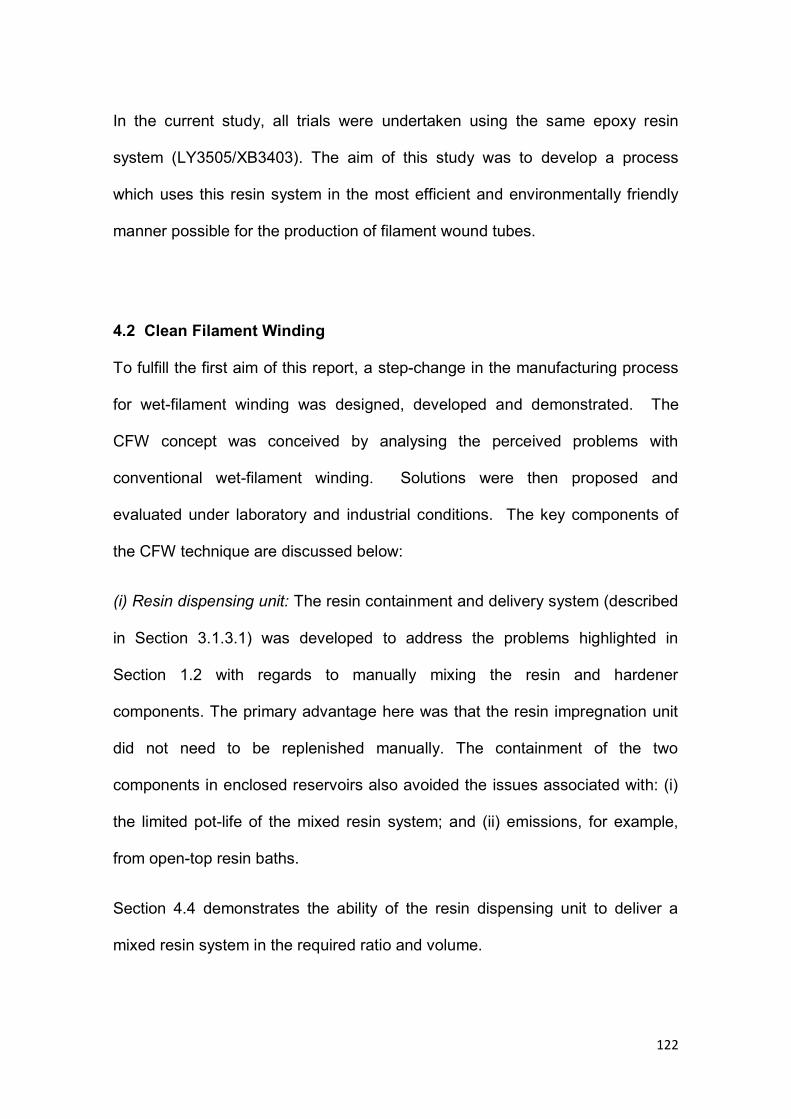
122
In the current study, all trials were undertaken using the same epoxy resin
system (LY3505/XB3403). The aim of this study was to develop a process
which uses this resin system in the most efficient and environmentally friendly
manner possible for the production of filament wound tubes.
4.2 Clean Filament Winding
To fulfill the first aim of this report, a step-change in the manufacturing process
for wet-filament winding was designed, developed and demonstrated. The
CFW concept was conceived by analysing the perceived problems with
conventional wet-filament winding. Solutions were then proposed and
evaluated under laboratory and industrial conditions. The key components of
the CFW technique are discussed below:
(i) Resin dispensing unit: The resin containment and delivery system (described
in Section 3.1.3.1) was developed to address the problems highlighted in
Section 1.2 with regards to manually mixing the resin and hardener
components. The primary advantage here was that the resin impregnation unit
did not need to be replenished manually. The containment of the two
components in enclosed reservoirs also avoided the issues associated with: (i)
the limited pot-life of the mixed resin system; and (ii) emissions, for example,
from open-top resin baths.
Section 4.4 demonstrates the ability of the resin dispensing unit to deliver a
mixed resin system in the required ratio and volume.
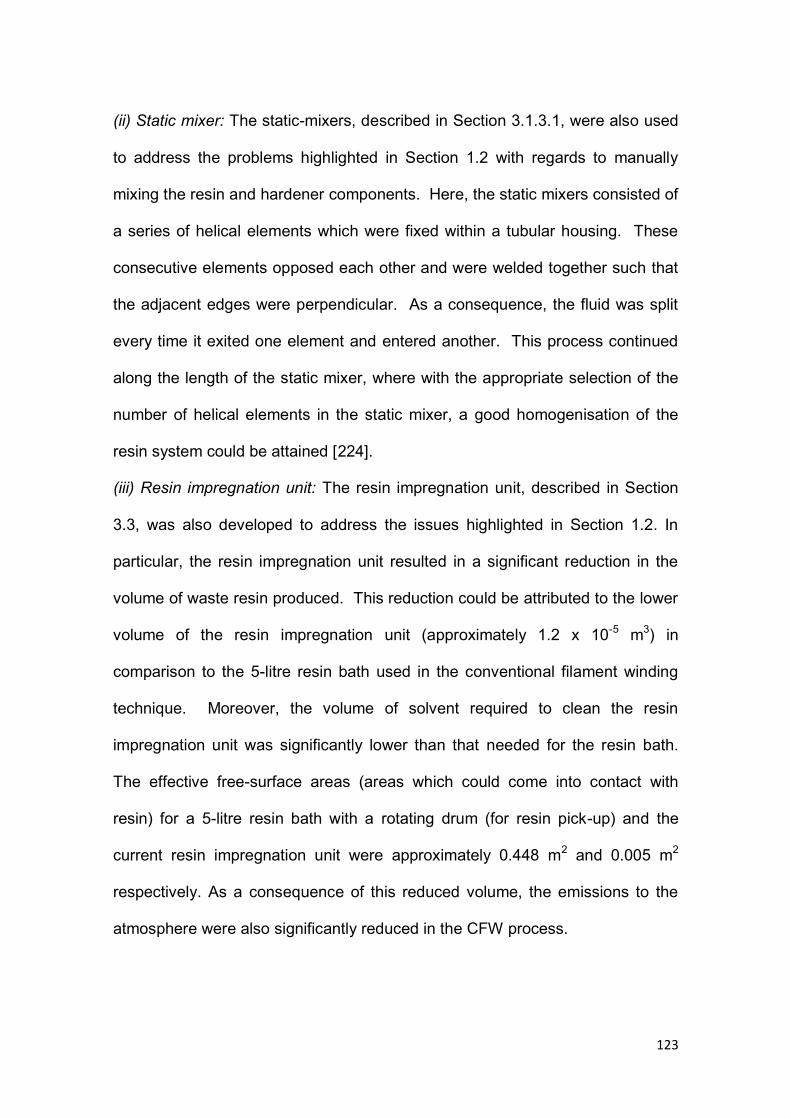
123
(ii) Static mixer: The static-mixers, described in Section 3.1.3.1, were also used
to address the problems highlighted in Section 1.2 with regards to manually
mixing the resin and hardener components. Here, the static mixers consisted of
a series of helical elements which were fixed within a tubular housing. These
consecutive elements opposed each other and were welded together such that
the adjacent edges were perpendicular. As a consequence, the fluid was split
every time it exited one element and entered another. This process continued
along the length of the static mixer, where with the appropriate selection of the
number of helical elements in the static mixer, a good homogenisation of the
resin system could be attained [224].
(iii) Resin impregnation unit: The resin impregnation unit, described in Section
3.3, was also developed to address the issues highlighted in Section 1.2. In
particular, the resin impregnation unit resulted in a significant reduction in the
volume of waste resin produced. This reduction could be attributed to the lower
volume of the resin impregnation unit (approximately 1.2 x 10⁻⁵ m3) in
comparison to the 5-litre resin bath used in the conventional filament winding
technique. Moreover, the volume of solvent required to clean the resin
impregnation unit was significantly lower than that needed for the resin bath.
The effective free-surface areas (areas which could come into contact with
resin) for a 5-litre resin bath with a rotating drum (for resin pick-up) and the
current resin impregnation unit were approximately 0.448 m2 and 0.005 m2
respectively. As a consequence of this reduced volume, the emissions to the
atmosphere were also significantly reduced in the CFW process.
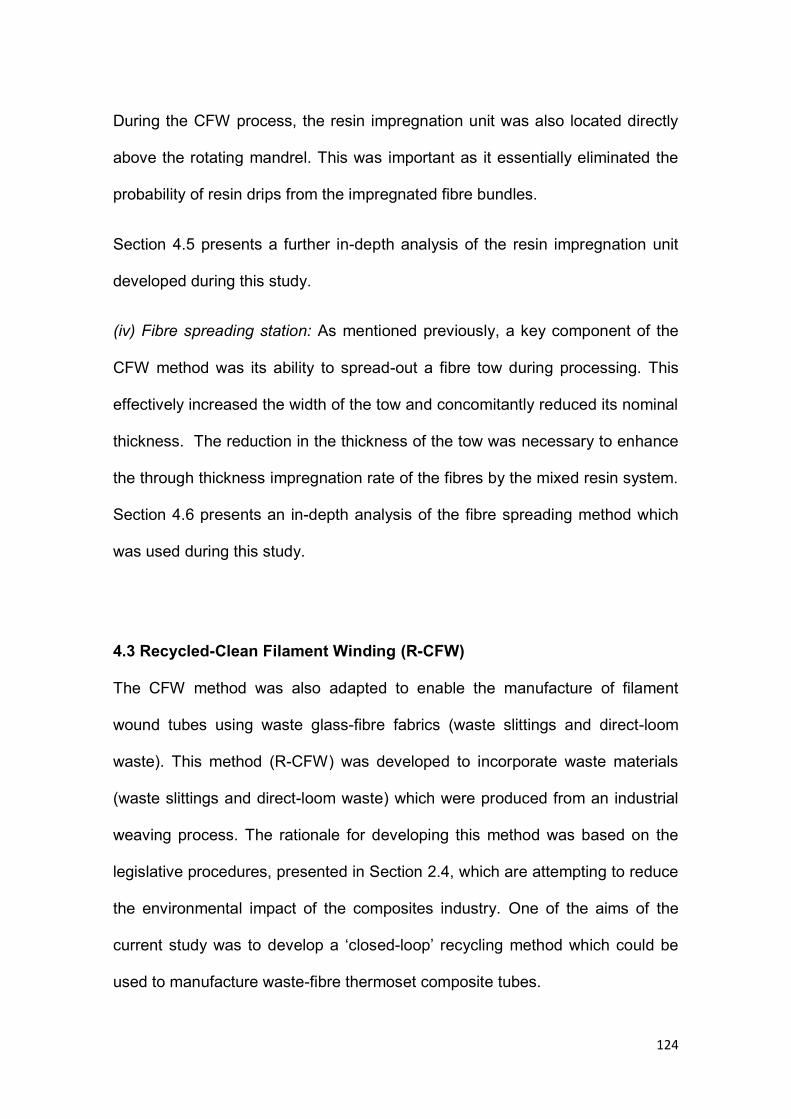
124
During the CFW process, the resin impregnation unit was also located directly
above the rotating mandrel. This was important as it essentially eliminated the
probability of resin drips from the impregnated fibre bundles.
Section 4.5 presents a further in-depth analysis of the resin impregnation unit
developed during this study.
(iv) Fibre spreading station: As mentioned previously, a key component of the
CFW method was its ability to spread-out a fibre tow during processing. This
effectively increased the width of the tow and concomitantly reduced its nominal
thickness. The reduction in the thickness of the tow was necessary to enhance
the through thickness impregnation rate of the fibres by the mixed resin system.
Section 4.6 presents an in-depth analysis of the fibre spreading method which
was used during this study.
4.3 Recycled-Clean Filament Winding (R-CFW)
The CFW method was also adapted to enable the manufacture of filament
wound tubes using waste glass-fibre fabrics (waste slittings and direct-loom
waste). This method (R-CFW) was developed to incorporate waste materials
(waste slittings and direct-loom waste) which were produced from an industrial
weaving process. The rationale for developing this method was based on the
legislative procedures, presented in Section 2.4, which are attempting to reduce
the environmental impact of the composites industry. One of the aims of the
current study was to develop a ‘closed-loop’ recycling method which could be
used to manufacture waste-fibre thermoset composite tubes.
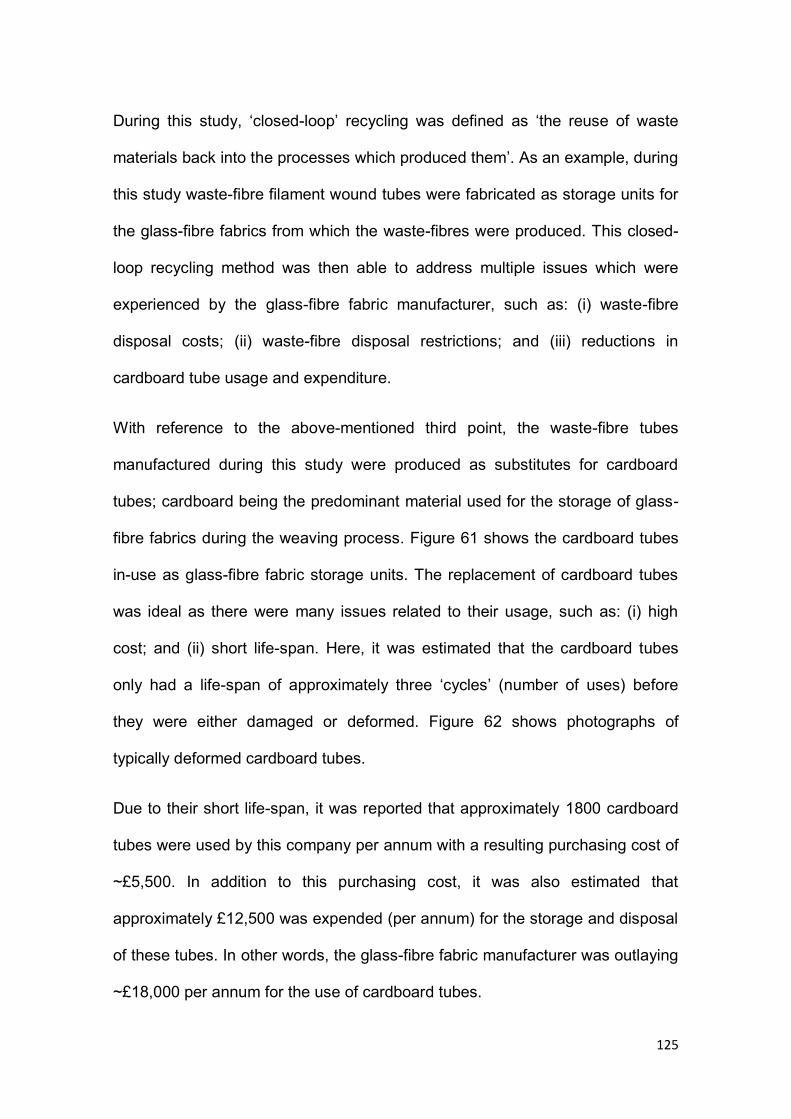
125
During this study, ‘closed-loop’ recycling was defined as ‘the reuse of waste
materials back into the processes which produced them’. As an example, during
this study waste-fibre filament wound tubes were fabricated as storage units for
the glass-fibre fabrics from which the waste-fibres were produced. This closed-
loop recycling method was then able to address multiple issues which were
experienced by the glass-fibre fabric manufacturer, such as: (i) waste-fibre
disposal costs; (ii) waste-fibre disposal restrictions; and (iii) reductions in
cardboard tube usage and expenditure.
With reference to the above-mentioned third point, the waste-fibre tubes
manufactured during this study were produced as substitutes for cardboard
tubes; cardboard being the predominant material used for the storage of glass-
fibre fabrics during the weaving process. Figure 61 shows the cardboard tubes
in-use as glass-fibre fabric storage units. The replacement of cardboard tubes
was ideal as there were many issues related to their usage, such as: (i) high
cost; and (ii) short life-span. Here, it was estimated that the cardboard tubes
only had a life-span of approximately three ‘cycles’ (number of uses) before
they were either damaged or deformed. Figure 62 shows photographs of
typically deformed cardboard tubes.
Due to their short life-span, it was reported that approximately 1800 cardboard
tubes were used by this company per annum with a resulting purchasing cost of
~£5,500. In addition to this purchasing cost, it was also estimated that
approximately £12,500 was expended (per annum) for the storage and disposal
of these tubes. In other words, the glass-fibre fabric manufacturer was outlaying
~£18,000 per annum for the use of cardboard tubes.
126
Figure 61. Cardboard tube in-use. The highlighted components are: (A) a
cardboard tube; and (B) glass-fibre fabric.
Figure 62. Photographs of end-of-life deformed cardboard tubes with: (a) lateral
compressive deformation; and (b) edge-damage due to moisture ingression. A
scale is provided by a UK £1 and 50p coin respectively.
(b)
A
B
(a)
127
Due to the above-mentioned costs, there was a clear incentive to manufacture
waste-fibre tubes which could replace cardboard tubes and hence reduce
processing costs. To replace the cardboard tubes, the waste-fibre tubes had to
offer: (i) an economically-viable long life-span; (ii) relatively high mechanical
properties, in particular lateral compression strength (as this will be the main
loading direction when in-use); and (iii) a smooth outer surface (smooth surface
required so no glass-fibre fabric damage could occur). Sections 4.7.4 and 4.7.5
of this study discuss the ability of the R-CFW method to fabricate waste-fibre
composite tubes in-line with the above specification.
4.4 Calibration of the Resin Dispensing Unit
As mentioned in Section 3.2, the resin dispensing unit, which was a key
component of the CFW process, was calibrated before any winding trials were
undertaken. A summary of the results from this calibration study are presented
in Table 19. With reference to Table 19: (i) the densities of the epoxy resin
(LY3505) and amine hardener (XB3403) were measured to be 1.2 g/cm-3 and 1
g/cm-3 respectively; and (ii) a 95% confidence interval for each measurement
was presented. Here, the confidence intervals aided in statistically analysing the
accuracy of the resin dispensing unit.
The calibration results presented in Table 19 were compared to their
theoretically ‘predicted’ volumes in Figures 63 - 65. Here, the ‘predicted’
volumes were the theoretical values which should have been dispensed if the
geared pumps were working appropriately.
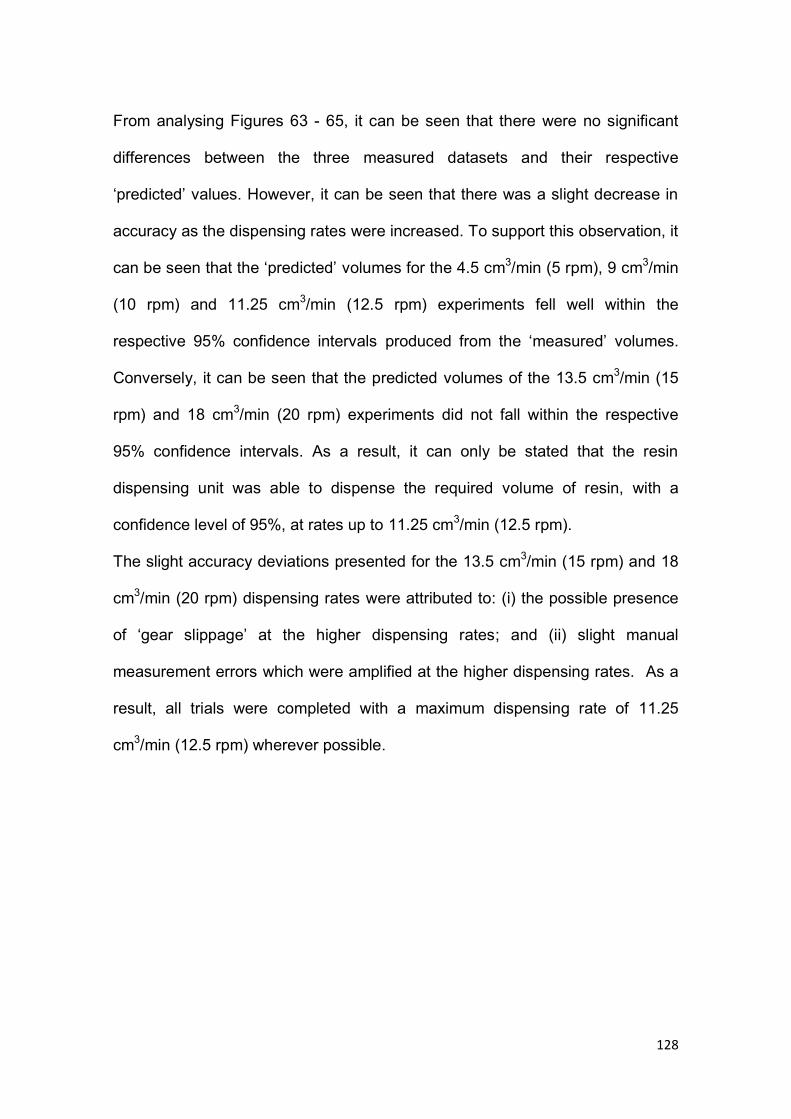
128
From analysing Figures 63 - 65, it can be seen that there were no significant
differences between the three measured datasets and their respective
‘predicted’ values. However, it can be seen that there was a slight decrease in
accuracy as the dispensing rates were increased. To support this observation, it
can be seen that the ‘predicted’ volumes for the 4.5 cm3/min (5 rpm), 9 cm3/min
(10 rpm) and 11.25 cm3/min (12.5 rpm) experiments fell well within the
respective 95% confidence intervals produced from the ‘measured’ volumes.
Conversely, it can be seen that the predicted volumes of the 13.5 cm3/min (15
rpm) and 18 cm3/min (20 rpm) experiments did not fall within the respective
95% confidence intervals. As a result, it can only be stated that the resin
dispensing unit was able to dispense the required volume of resin, with a
confidence level of 95%, at rates up to 11.25 cm3/min (12.5 rpm).
The slight accuracy deviations presented for the 13.5 cm3/min (15 rpm) and 18
cm3/min (20 rpm) dispensing rates were attributed to: (i) the possible presence
of ‘gear slippage’ at the higher dispensing rates; and (ii) slight manual
measurement errors which were amplified at the higher dispensing rates. As a
result, all trials were completed with a maximum dispensing rate of 11.25
cm3/min (12.5 rpm) wherever possible.
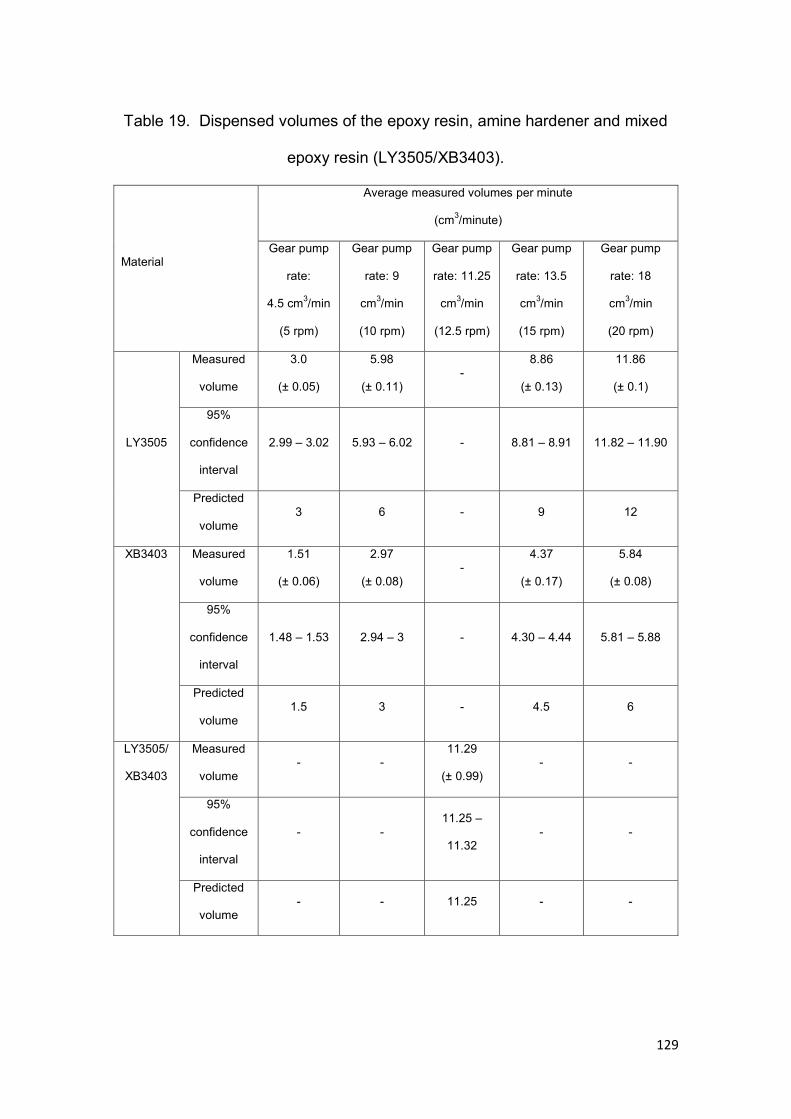
129
Table 19. Dispensed volumes of the epoxy resin, amine hardener and mixed
epoxy resin (LY3505/XB3403).
Material
Average measured volumes per minute
(cm3/minute)
Gear pump
rate:
4.5 cm3/min
(5 rpm)
Gear pump
rate: 9
cm3/min
(10 rpm)
Gear pump
rate: 11.25
cm3/min
(12.5 rpm)
Gear pump
rate: 13.5
cm3/min
(15 rpm)
Gear pump
rate: 18
cm3/min
(20 rpm)
LY3505
Measured
volume
3.0
(± 0.05)
5.98
(± 0.11) -
8.86
(± 0.13)
11.86
(± 0.1)
95%
confidence
interval
2.99 – 3.02 5.93 – 6.02 - 8.81 – 8.91 11.82 – 11.90
Predicted
volume 3 6 - 9 12
XB3403 Measured
volume
1.51
(± 0.06)
2.97
(± 0.08) -
4.37
(± 0.17)
5.84
(± 0.08)
95%
confidence
interval
1.48 – 1.53 2.94 – 3 - 4.30 – 4.44 5.81 – 5.88
Predicted
volume 1.5 3 - 4.5 6
LY3505/
XB3403
Measured
volume - -
11.29
(± 0.99) - -
95%
confidence
interval
- - 11.25 –
11.32 - -
Predicted
volume - - 11.25 - -
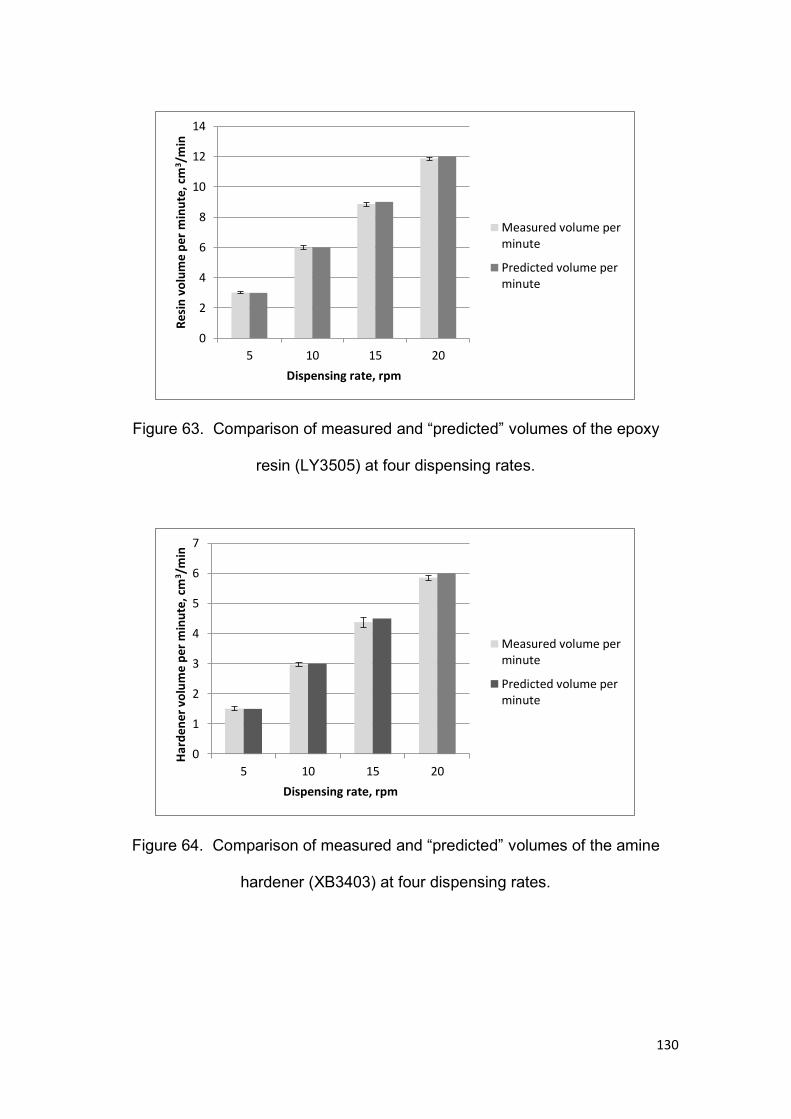
130
Figure 63. Comparison of measured and “predicted” volumes of the epoxy
resin (LY3505) at four dispensing rates.
Figure 64. Comparison of measured and “predicted” volumes of the amine
hardener (XB3403) at four dispensing rates.
0
2
4
6
8
10
12
14
5 10 15 20
Res
in v
olu
me
per
min
ute
, cm
3/m
in
Dispensing rate, rpm
Measured volume perminute
Predicted volume perminute
0
1
2
3
4
5
6
7
5 10 15 20
Har
den
er v
olu
me
per
min
ute
, cm
3/m
in
Dispensing rate, rpm
Measured volume perminute
Predicted volume perminute
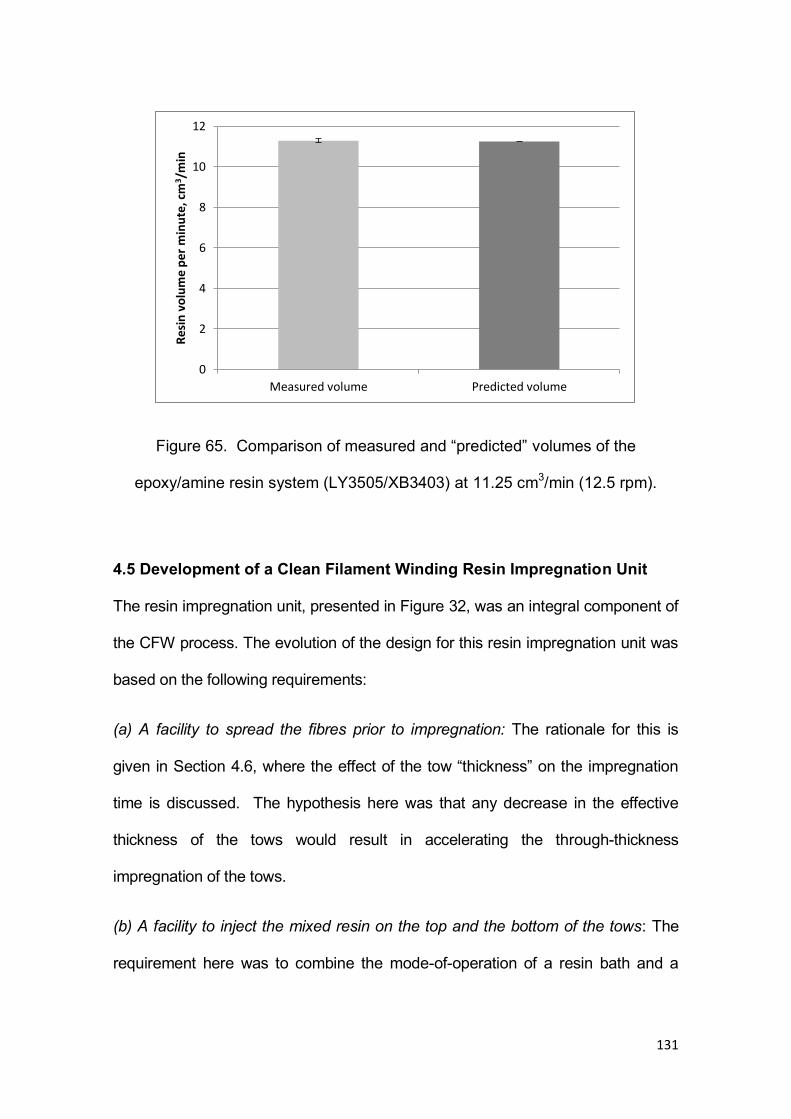
131
Figure 65. Comparison of measured and “predicted” volumes of the
epoxy/amine resin system (LY3505/XB3403) at 11.25 cm3/min (12.5 rpm).
4.5 Development of a Clean Filament Winding Resin Impregnation Unit
The resin impregnation unit, presented in Figure 32, was an integral component of
the CFW process. The evolution of the design for this resin impregnation unit was
based on the following requirements:
(a) A facility to spread the fibres prior to impregnation: The rationale for this is
given in Section 4.6, where the effect of the tow “thickness” on the impregnation
time is discussed. The hypothesis here was that any decrease in the effective
thickness of the tows would result in accelerating the through-thickness
impregnation of the tows.
(b) A facility to inject the mixed resin on the top and the bottom of the tows: The
requirement here was to combine the mode-of-operation of a resin bath and a
0
2
4
6
8
10
12
Measured volume Predicted volume
Res
in v
olu
me
per
min
ute
, cm
3/m
in
132
resin injection system within the resin impregnation unit. In other words, in the
case of the resin bath, the resin system on the drum is squeezed into the tows; in
the resin injection method, the mixed resin is injected under low-pressure into the
tows. The desired outcome was to enhance the through-thickness impregnation
rate.
(c) Minimising the volume of the resin impregnation unit: The rationale here was
that a reduction in the volume of the resin impregnation unit would mean that the
volume of solvent required to clean the equipment at the end of a production run
would be significantly lower. In the case of conventional resin baths, the “dead-
volume” was significantly large and hence the volume of solvent required to clean
the equipment was also high.
Another reason for minimising the volume of the resin impregnation unit was to
reduce its overall mass. This was desirable as it would make it easier for the resin
impregnation unit to be mounted onto a traversing carriage of a filament winding
machine; this meant that it would be relatively simple to retrofit the resin
impregnation unit onto any existing commercial filament winding machines.
(d) Locating the resin impregnation unit near the mandrel: In the conventional
wet-filament winding process, the resin bath is generally located at a distance
from the mandrel and there is a high probability of the resin system dripping
from the impregnated tows before they are wound onto the rotating mandrel. In
the CFW process, the resin impregnation unit was placed in close proximity to
the mandrel. As a result, the possibility of the resin dripping onto the floor does
not arise.
133
(e) A modular design for the resin impregnation unit: This was deemed desirable
to enable relatively simple assembly/disassembly and flexibility in accommodating
different fibre types and number of tows.
The resin impregnation unit used during this study was shown to satisfy the
above criteria and hence aim one of Section 1.3. Furthermore, this impregnation
unit also successfully allowed for an extensive and robust set of filament
winding trials to be carried out in a user-friendly manner on two filament winding
machines.
4.5.1 Application of Impregnation Modelling
The impregnation modelling variables presented in Section 3.3.1 were
calculated and applied to the models proposed by Foley and Gillespie [94] and
Gaymans and Wevers [95]. By applying these models using the appropriate
values, it was possible to calculate the impregnation time (and hence minimum
residence time) for the resin impregnation unit.
With reference to the model proposed by Foley and Gillespie [94], Equation 19
was used to predict the impregnation time for the CFW process. Here, each
fibre tow was assumed to consist of 2000 filaments with a 1200 Tex and a width
of 7 mm. The impregnation time (Equation 19) and the degree of impregnation
(Equation 20) were calculated and are presented in Figure 66.
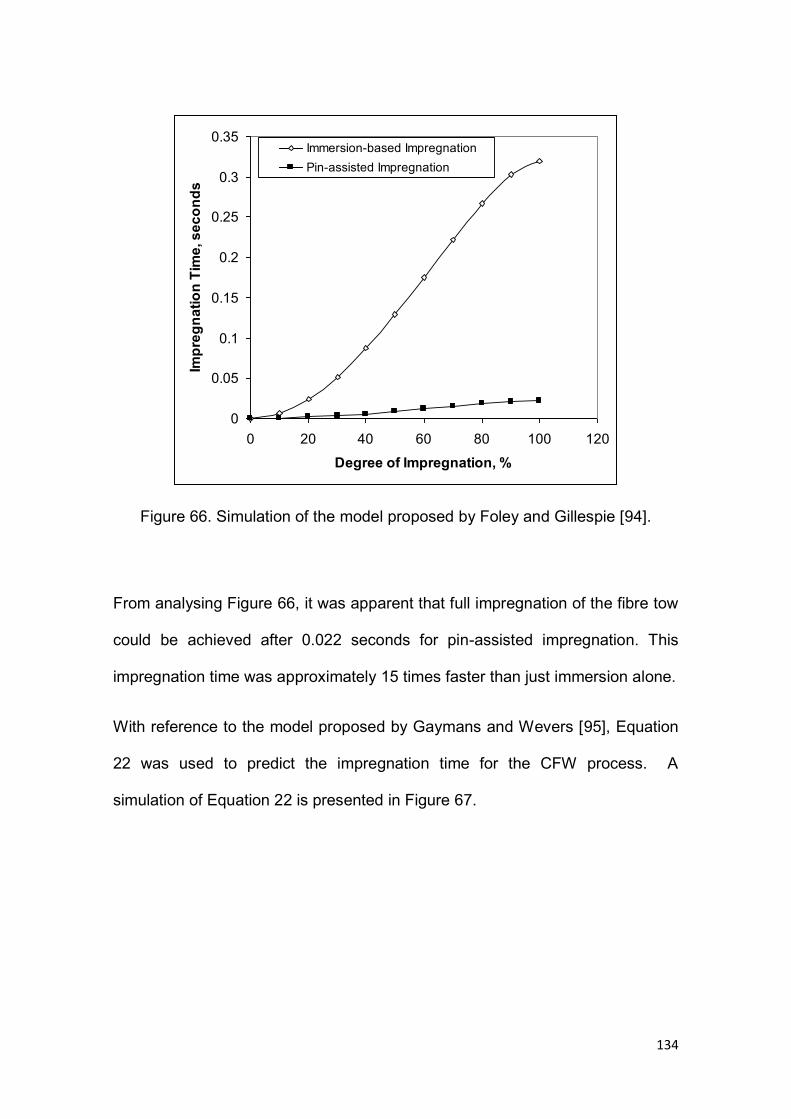
134
Figure 66. Simulation of the model proposed by Foley and Gillespie [94].
From analysing Figure 66, it was apparent that full impregnation of the fibre tow
could be achieved after 0.022 seconds for pin-assisted impregnation. This
impregnation time was approximately 15 times faster than just immersion alone.
With reference to the model proposed by Gaymans and Wevers [95], Equation
22 was used to predict the impregnation time for the CFW process. A
simulation of Equation 22 is presented in Figure 67.
0
0.05
0.1
0.15
0.2
0.25
0.3
0.35
0 20 40 60 80 100 120
Degree of Impregnation, %
Impr
egna
tion
Tim
e, s
econ
ds
Immersion-based ImpregnationPin-assisted Impregnation
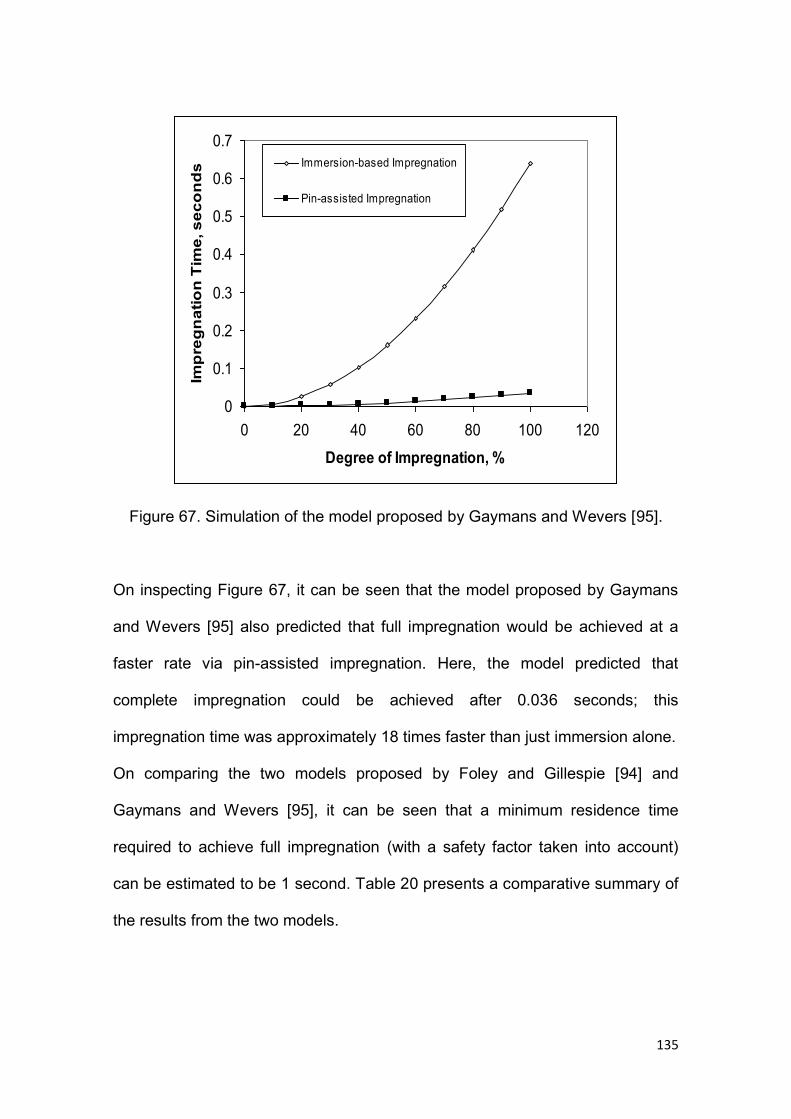
135
Figure 67. Simulation of the model proposed by Gaymans and Wevers [95].
On inspecting Figure 67, it can be seen that the model proposed by Gaymans
and Wevers [95] also predicted that full impregnation would be achieved at a
faster rate via pin-assisted impregnation. Here, the model predicted that
complete impregnation could be achieved after 0.036 seconds; this
impregnation time was approximately 18 times faster than just immersion alone.
On comparing the two models proposed by Foley and Gillespie [94] and
Gaymans and Wevers [95], it can be seen that a minimum residence time
required to achieve full impregnation (with a safety factor taken into account)
can be estimated to be 1 second. Table 20 presents a comparative summary of
the results from the two models.
0
0.1
0.2
0.3
0.4
0.5
0.6
0.7
0 20 40 60 80 100 120
Degree of Impregnation, %
Imp
reg
nat
ion
Tim
e, s
eco
nd
s Immersion-based Impregnation
Pin-assisted Impregnation
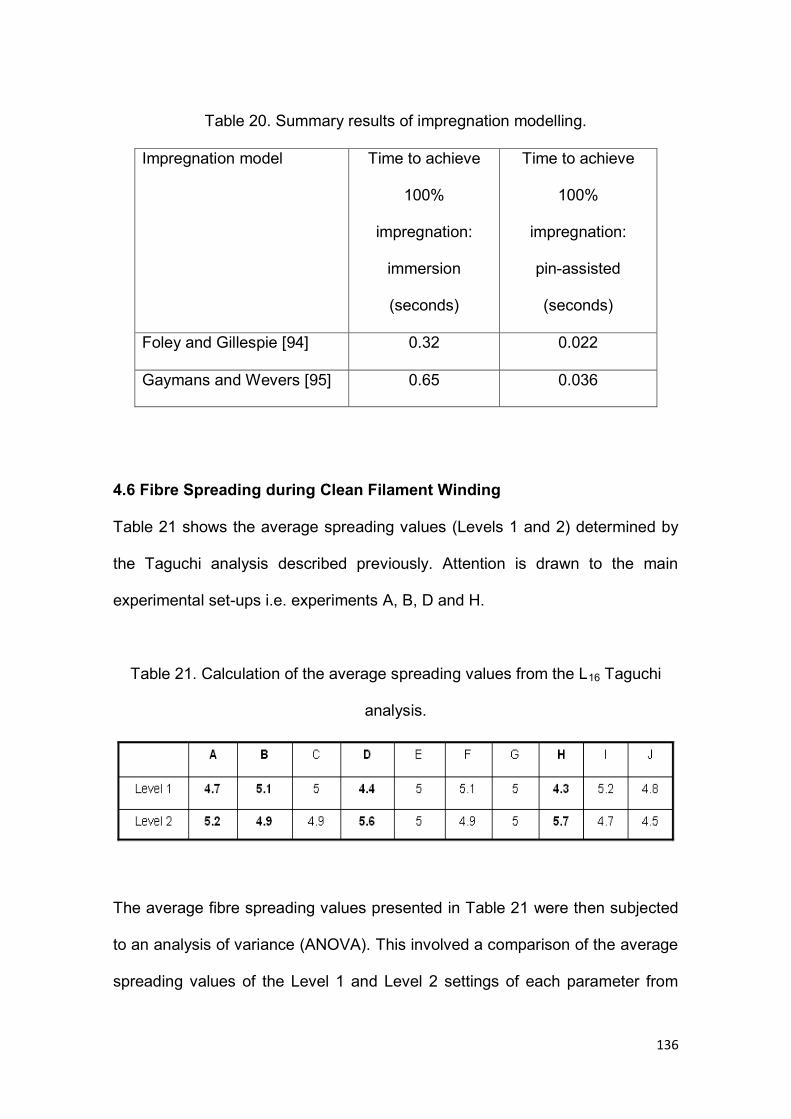
136
Table 20. Summary results of impregnation modelling.
Impregnation model Time to achieve
100%
impregnation:
immersion
(seconds)
Time to achieve
100%
impregnation:
pin-assisted
(seconds)
Foley and Gillespie [94] 0.32 0.022
Gaymans and Wevers [95] 0.65 0.036
4.6 Fibre Spreading during Clean Filament Winding
Table 21 shows the average spreading values (Levels 1 and 2) determined by
the Taguchi analysis described previously. Attention is drawn to the main
experimental set-ups i.e. experiments A, B, D and H.
Table 21. Calculation of the average spreading values from the L16 Taguchi
analysis.
The average fibre spreading values presented in Table 21 were then subjected
to an analysis of variance (ANOVA). This involved a comparison of the average
spreading values of the Level 1 and Level 2 settings of each parameter from
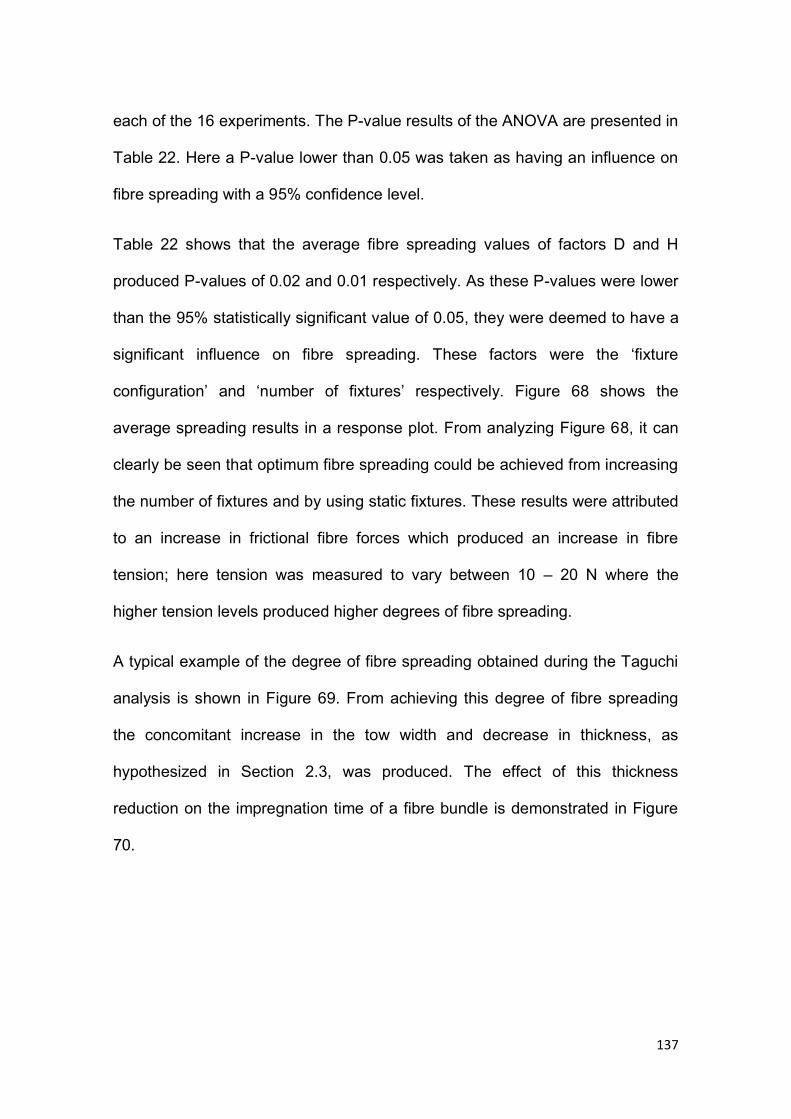
137
each of the 16 experiments. The P-value results of the ANOVA are presented in
Table 22. Here a P-value lower than 0.05 was taken as having an influence on
fibre spreading with a 95% confidence level.
Table 22 shows that the average fibre spreading values of factors D and H
produced P-values of 0.02 and 0.01 respectively. As these P-values were lower
than the 95% statistically significant value of 0.05, they were deemed to have a
significant influence on fibre spreading. These factors were the ‘fixture
configuration’ and ‘number of fixtures’ respectively. Figure 68 shows the
average spreading results in a response plot. From analyzing Figure 68, it can
clearly be seen that optimum fibre spreading could be achieved from increasing
the number of fixtures and by using static fixtures. These results were attributed
to an increase in frictional fibre forces which produced an increase in fibre
tension; here tension was measured to vary between 10 – 20 N where the
higher tension levels produced higher degrees of fibre spreading.
A typical example of the degree of fibre spreading obtained during the Taguchi
analysis is shown in Figure 69. From achieving this degree of fibre spreading
the concomitant increase in the tow width and decrease in thickness, as
hypothesized in Section 2.3, was produced. The effect of this thickness
reduction on the impregnation time of a fibre bundle is demonstrated in Figure
70.
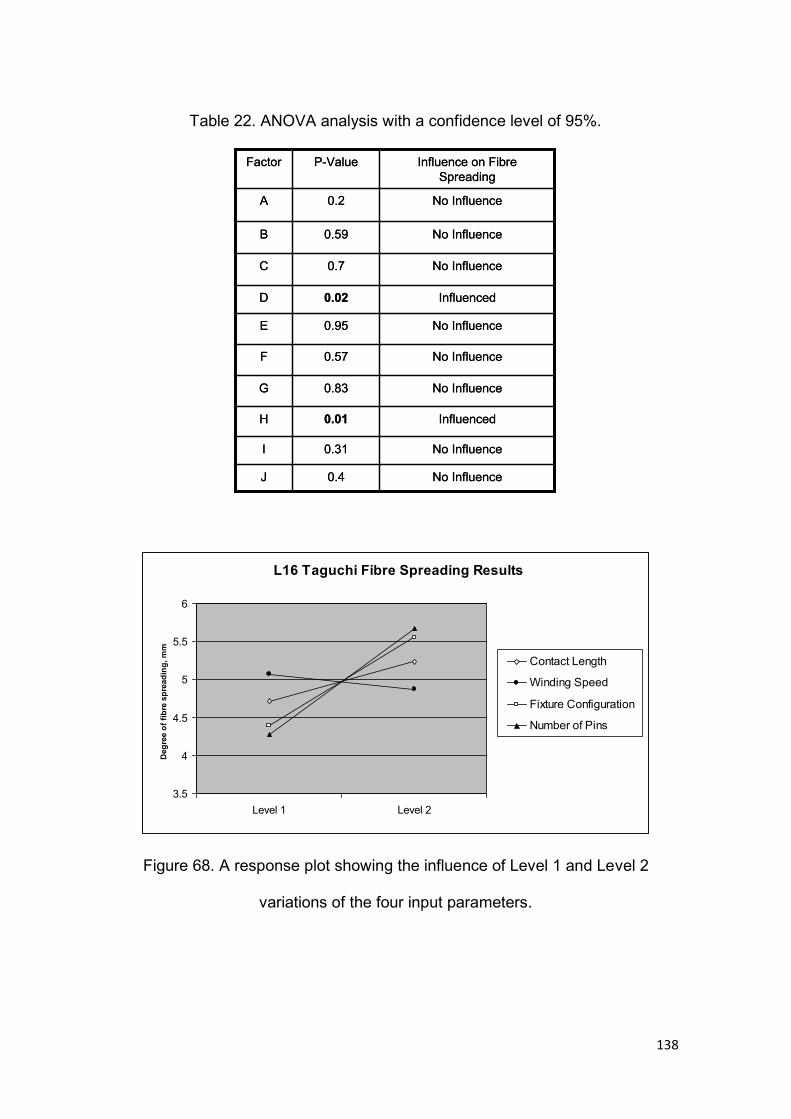
138
Table 22. ANOVA analysis with a confidence level of 95%.
Figure 68. A response plot showing the influence of Level 1 and Level 2
variations of the four input parameters.
No Influence0.31I
No Influence0.4J
Influenced0.01H
No Influence0.83G
No Influence0.57F
No Influence0.95E
Influenced0.02D
No Influence0.7C
No Influence0.59B
No Influence0.2A
Influence on Fibre Spreading
P-ValueFactor
No Influence0.31I
No Influence0.4J
Influenced0.01H
No Influence0.83G
No Influence0.57F
No Influence0.95E
Influenced0.02D
No Influence0.7C
No Influence0.59B
No Influence0.2A
Influence on Fibre Spreading
P-ValueFactor
L16 Taguchi Fibre Spreading Results
3.5
4
4.5
5
5.5
6
Level 1 Level 2
Deg
ree
of fi
bre
spre
adin
g, m
m
Contact Length
Winding Speed
Fixture Configuration
Number of Pins
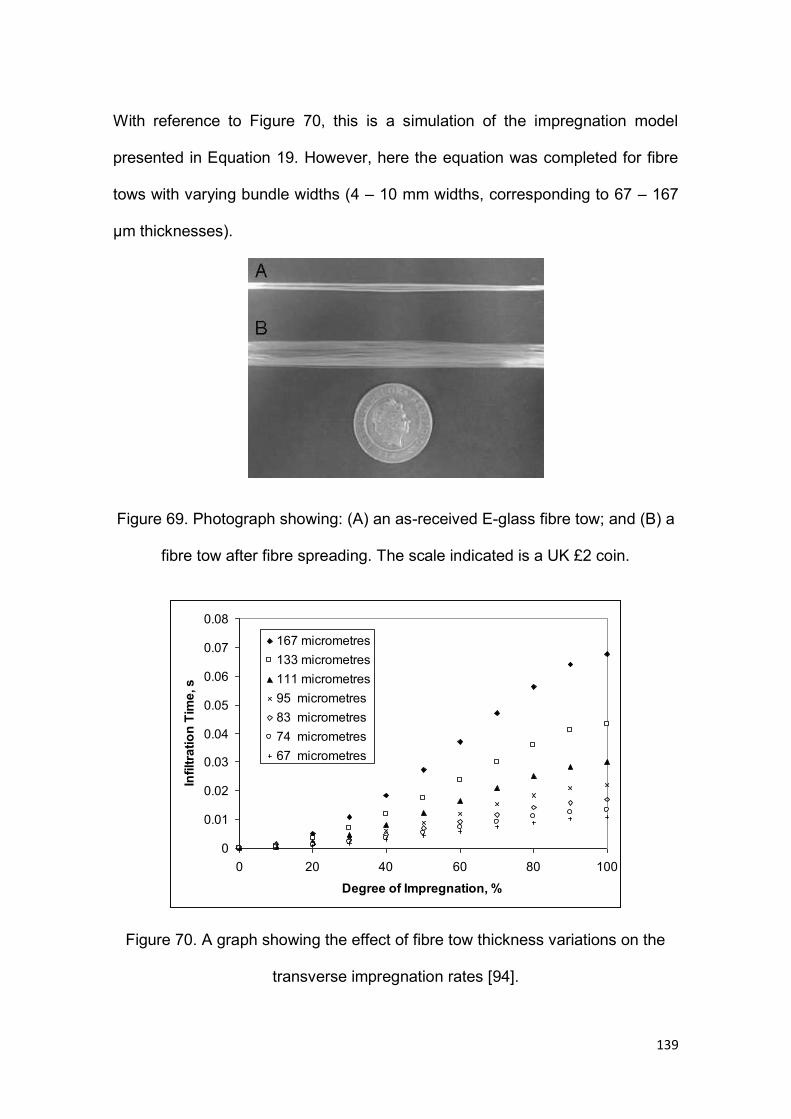
139
With reference to Figure 70, this is a simulation of the impregnation model
presented in Equation 19. However, here the equation was completed for fibre
tows with varying bundle widths (4 – 10 mm widths, corresponding to 67 – 167
µm thicknesses).
Figure 69. Photograph showing: (A) an as-received E-glass fibre tow; and (B) a
fibre tow after fibre spreading. The scale indicated is a UK £2 coin.
Figure 70. A graph showing the effect of fibre tow thickness variations on the
transverse impregnation rates [94].
0
0.01
0.02
0.03
0.04
0.05
0.06
0.07
0.08
0 20 40 60 80 100
Degree of Impregnation, %
Infil
tratio
n Ti
me,
s
167 micrometres133 micrometres111 micrometres95 micrometres83 micrometres74 micrometres67 micrometres
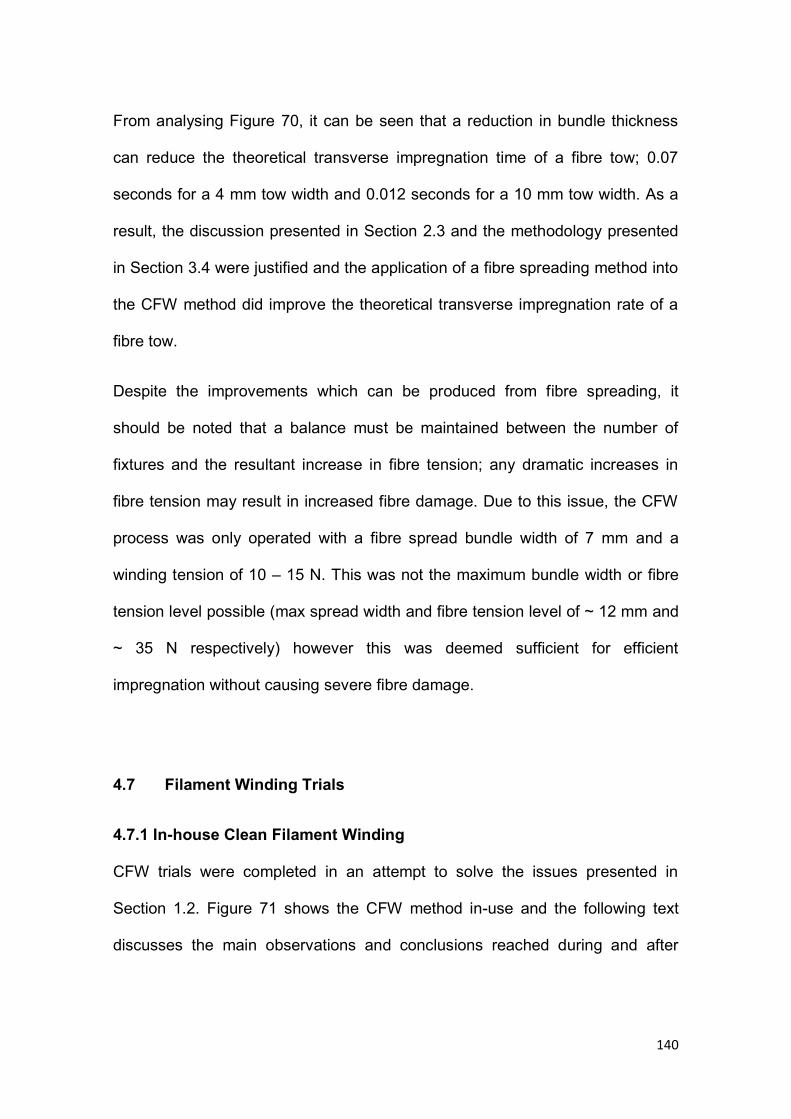
140
From analysing Figure 70, it can be seen that a reduction in bundle thickness
can reduce the theoretical transverse impregnation time of a fibre tow; 0.07
seconds for a 4 mm tow width and 0.012 seconds for a 10 mm tow width. As a
result, the discussion presented in Section 2.3 and the methodology presented
in Section 3.4 were justified and the application of a fibre spreading method into
the CFW method did improve the theoretical transverse impregnation rate of a
fibre tow.
Despite the improvements which can be produced from fibre spreading, it
should be noted that a balance must be maintained between the number of
fixtures and the resultant increase in fibre tension; any dramatic increases in
fibre tension may result in increased fibre damage. Due to this issue, the CFW
process was only operated with a fibre spread bundle width of 7 mm and a
winding tension of 10 – 15 N. This was not the maximum bundle width or fibre
tension level possible (max spread width and fibre tension level of ~ 12 mm and
~ 35 N respectively) however this was deemed sufficient for efficient
impregnation without causing severe fibre damage.
4.7 Filament Winding Trials
4.7.1 In-house Clean Filament Winding
CFW trials were completed in an attempt to solve the issues presented in
Section 1.2. Figure 71 shows the CFW method in-use and the following text
discusses the main observations and conclusions reached during and after
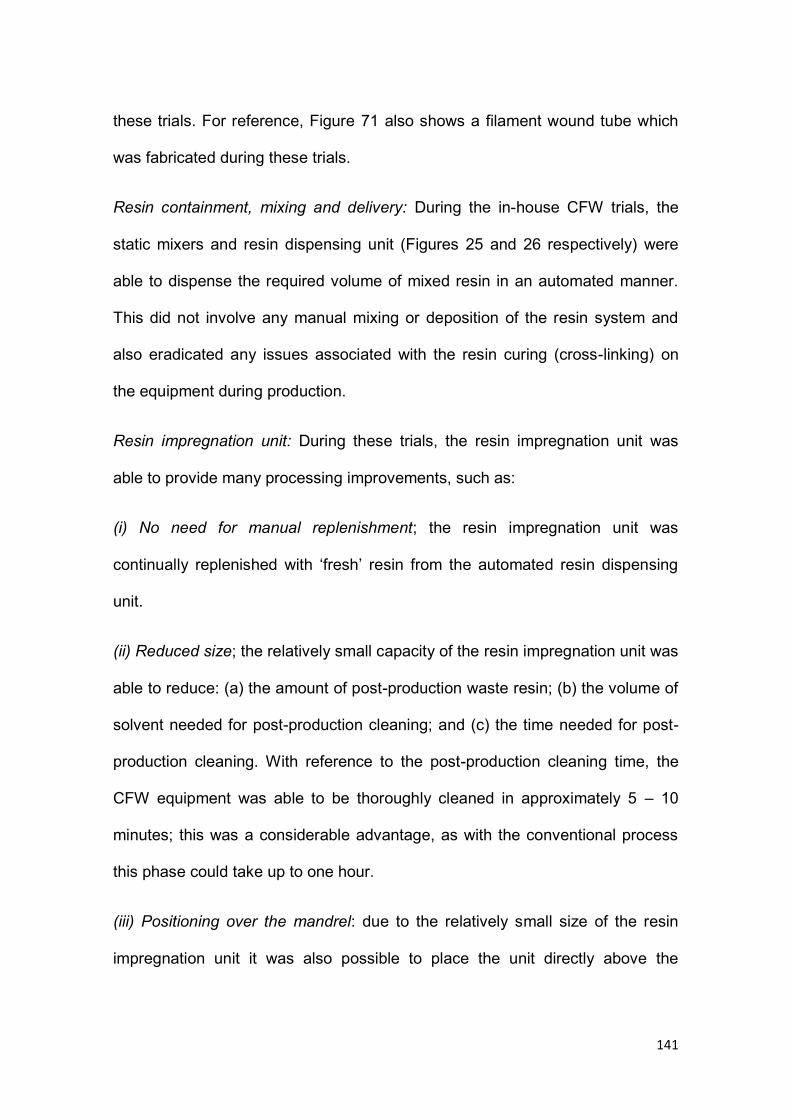
141
these trials. For reference, Figure 71 also shows a filament wound tube which
was fabricated during these trials.
Resin containment, mixing and delivery: During the in-house CFW trials, the
static mixers and resin dispensing unit (Figures 25 and 26 respectively) were
able to dispense the required volume of mixed resin in an automated manner.
This did not involve any manual mixing or deposition of the resin system and
also eradicated any issues associated with the resin curing (cross-linking) on
the equipment during production.
Resin impregnation unit: During these trials, the resin impregnation unit was
able to provide many processing improvements, such as:
(i) No need for manual replenishment; the resin impregnation unit was
continually replenished with ‘fresh’ resin from the automated resin dispensing
unit.
(ii) Reduced size; the relatively small capacity of the resin impregnation unit was
able to reduce: (a) the amount of post-production waste resin; (b) the volume of
solvent needed for post-production cleaning; and (c) the time needed for post-
production cleaning. With reference to the post-production cleaning time, the
CFW equipment was able to be thoroughly cleaned in approximately 5 – 10
minutes; this was a considerable advantage, as with the conventional process
this phase could take up to one hour.
(iii) Positioning over the mandrel: due to the relatively small size of the resin
impregnation unit it was also possible to place the unit directly above the
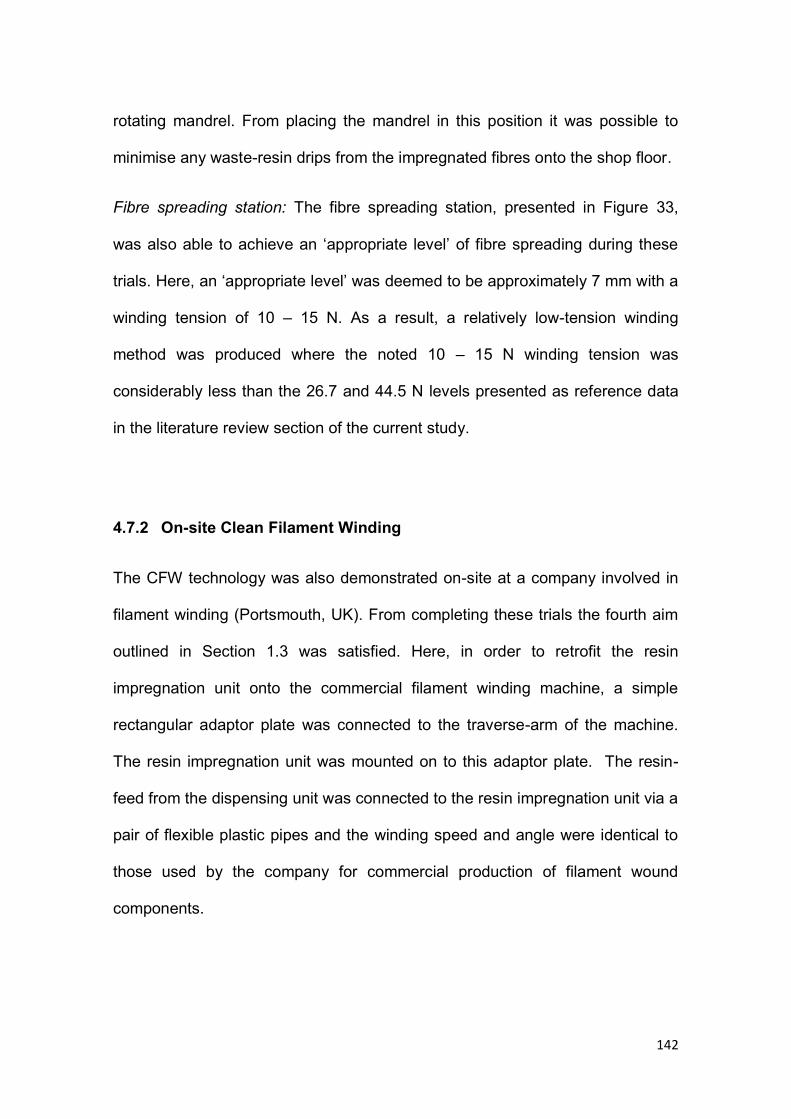
142
rotating mandrel. From placing the mandrel in this position it was possible to
minimise any waste-resin drips from the impregnated fibres onto the shop floor.
Fibre spreading station: The fibre spreading station, presented in Figure 33,
was also able to achieve an ‘appropriate level’ of fibre spreading during these
trials. Here, an ‘appropriate level’ was deemed to be approximately 7 mm with a
winding tension of 10 – 15 N. As a result, a relatively low-tension winding
method was produced where the noted 10 – 15 N winding tension was
considerably less than the 26.7 and 44.5 N levels presented as reference data
in the literature review section of the current study.
4.7.2 On-site Clean Filament Winding
The CFW technology was also demonstrated on-site at a company involved in
filament winding (Portsmouth, UK). From completing these trials the fourth aim
outlined in Section 1.3 was satisfied. Here, in order to retrofit the resin
impregnation unit onto the commercial filament winding machine, a simple
rectangular adaptor plate was connected to the traverse-arm of the machine.
The resin impregnation unit was mounted on to this adaptor plate. The resin-
feed from the dispensing unit was connected to the resin impregnation unit via a
pair of flexible plastic pipes and the winding speed and angle were identical to
those used by the company for commercial production of filament wound
components.
143
Figure 71. Photographs of: (a) a filament wound tube in production via the in-
house CFW method; and (b) an example CFW tube. The highlighted
components are: (A) a 100 mm OD mandrel; and (B) impregnated tows.
The key observations and conclusions reached during and after the site trial
were as follows:
(i) The retrofitting procedure was relatively straightforward and involved the
construction of an adaptor plate that was bolted onto the arm of the traverse-
carriage on the commercial filament winding machine.
(ii) The retrofitting of the resin impregnation unit onto the commercial filament
winding machine did not interfere or affect the normal usage of the machine or
commercial manufacturing practices; the same winding speeds and angles
were used when the resin impregnation unit was introduced.
(b) (a)
A
B
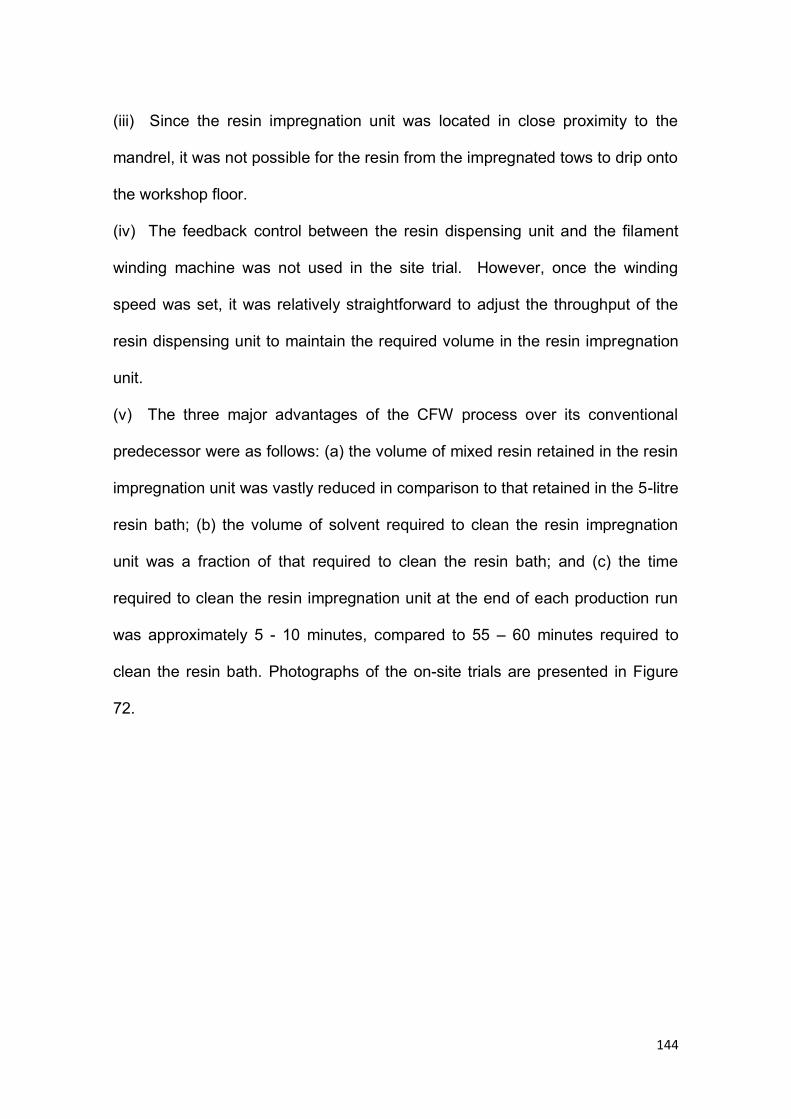
144
(iii) Since the resin impregnation unit was located in close proximity to the
mandrel, it was not possible for the resin from the impregnated tows to drip onto
the workshop floor.
(iv) The feedback control between the resin dispensing unit and the filament
winding machine was not used in the site trial. However, once the winding
speed was set, it was relatively straightforward to adjust the throughput of the
resin dispensing unit to maintain the required volume in the resin impregnation
unit.
(v) The three major advantages of the CFW process over its conventional
predecessor were as follows: (a) the volume of mixed resin retained in the resin
impregnation unit was vastly reduced in comparison to that retained in the 5-litre
resin bath; (b) the volume of solvent required to clean the resin impregnation
unit was a fraction of that required to clean the resin bath; and (c) the time
required to clean the resin impregnation unit at the end of each production run
was approximately 5 - 10 minutes, compared to 55 – 60 minutes required to
clean the resin bath. Photographs of the on-site trials are presented in Figure
72.
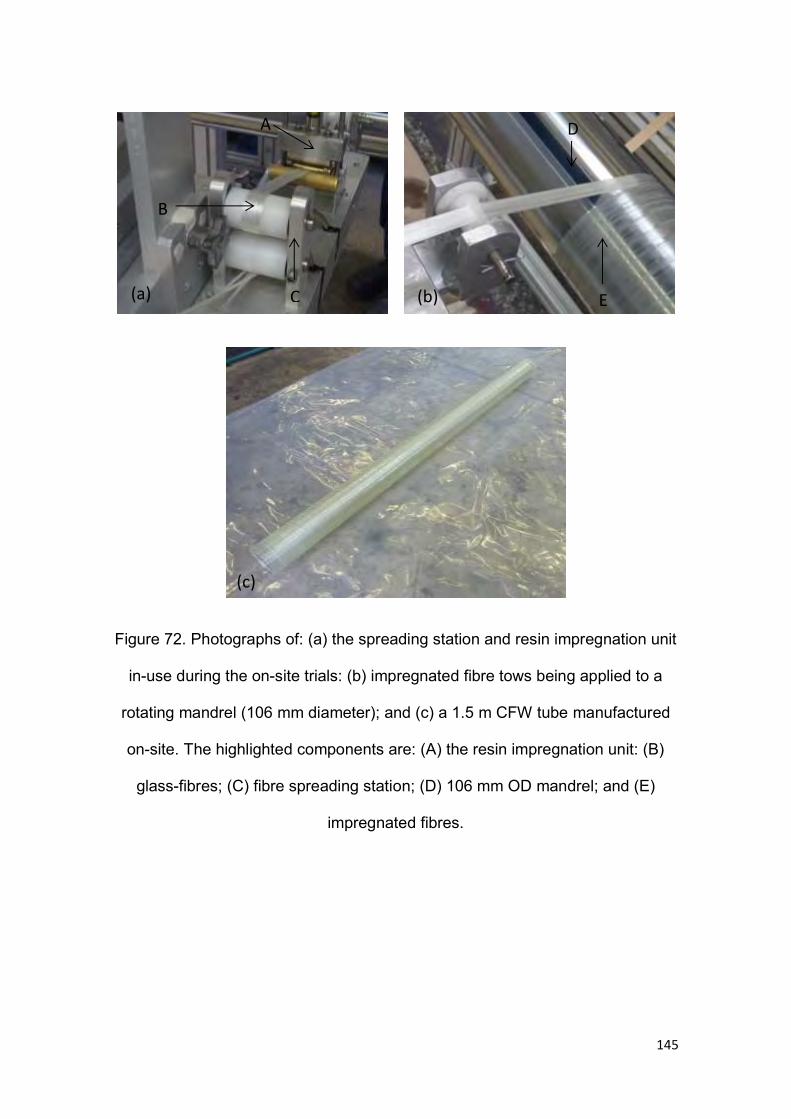
145
Figure 72. Photographs of: (a) the spreading station and resin impregnation unit
in-use during the on-site trials: (b) impregnated fibre tows being applied to a
rotating mandrel (106 mm diameter); and (c) a 1.5 m CFW tube manufactured
on-site. The highlighted components are: (A) the resin impregnation unit: (B)
glass-fibres; (C) fibre spreading station; (D) 106 mm OD mandrel; and (E)
impregnated fibres.
(a) (b)
(c)
C
A
B
E
D
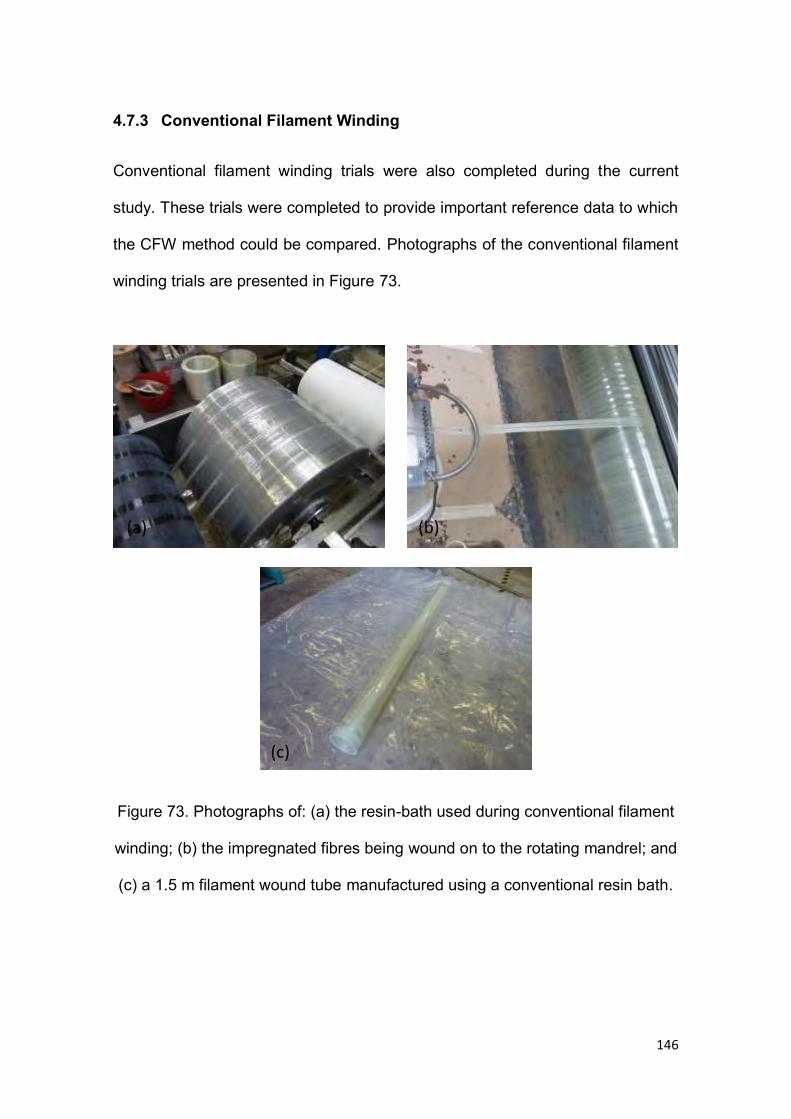
146
4.7.3 Conventional Filament Winding
Conventional filament winding trials were also completed during the current
study. These trials were completed to provide important reference data to which
the CFW method could be compared. Photographs of the conventional filament
winding trials are presented in Figure 73.
Figure 73. Photographs of: (a) the resin-bath used during conventional filament
winding; (b) the impregnated fibres being wound on to the rotating mandrel; and
(c) a 1.5 m filament wound tube manufactured using a conventional resin bath.
(a)
(c)
(b)
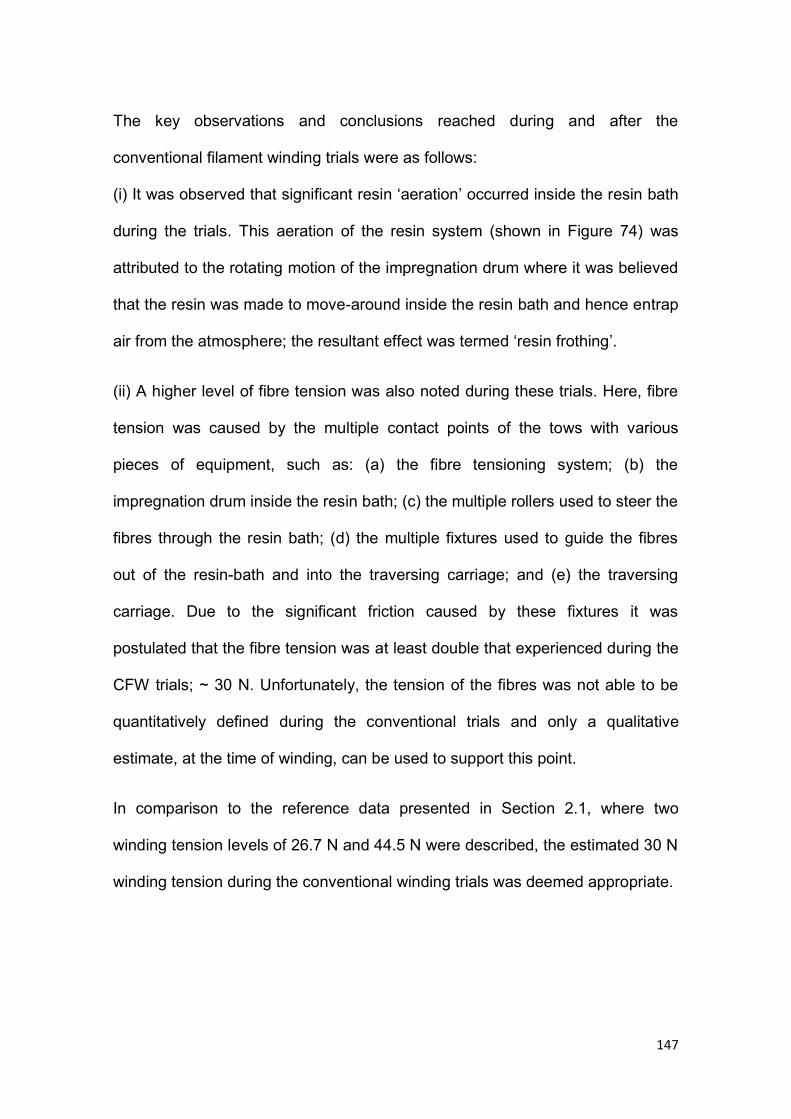
147
The key observations and conclusions reached during and after the
conventional filament winding trials were as follows:
(i) It was observed that significant resin ‘aeration’ occurred inside the resin bath
during the trials. This aeration of the resin system (shown in Figure 74) was
attributed to the rotating motion of the impregnation drum where it was believed
that the resin was made to move-around inside the resin bath and hence entrap
air from the atmosphere; the resultant effect was termed ‘resin frothing’.
(ii) A higher level of fibre tension was also noted during these trials. Here, fibre
tension was caused by the multiple contact points of the tows with various
pieces of equipment, such as: (a) the fibre tensioning system; (b) the
impregnation drum inside the resin bath; (c) the multiple rollers used to steer the
fibres through the resin bath; (d) the multiple fixtures used to guide the fibres
out of the resin-bath and into the traversing carriage; and (e) the traversing
carriage. Due to the significant friction caused by these fixtures it was
postulated that the fibre tension was at least double that experienced during the
CFW trials; ~ 30 N. Unfortunately, the tension of the fibres was not able to be
quantitatively defined during the conventional trials and only a qualitative
estimate, at the time of winding, can be used to support this point.
In comparison to the reference data presented in Section 2.1, where two
winding tension levels of 26.7 N and 44.5 N were described, the estimated 30 N
winding tension during the conventional winding trials was deemed appropriate.
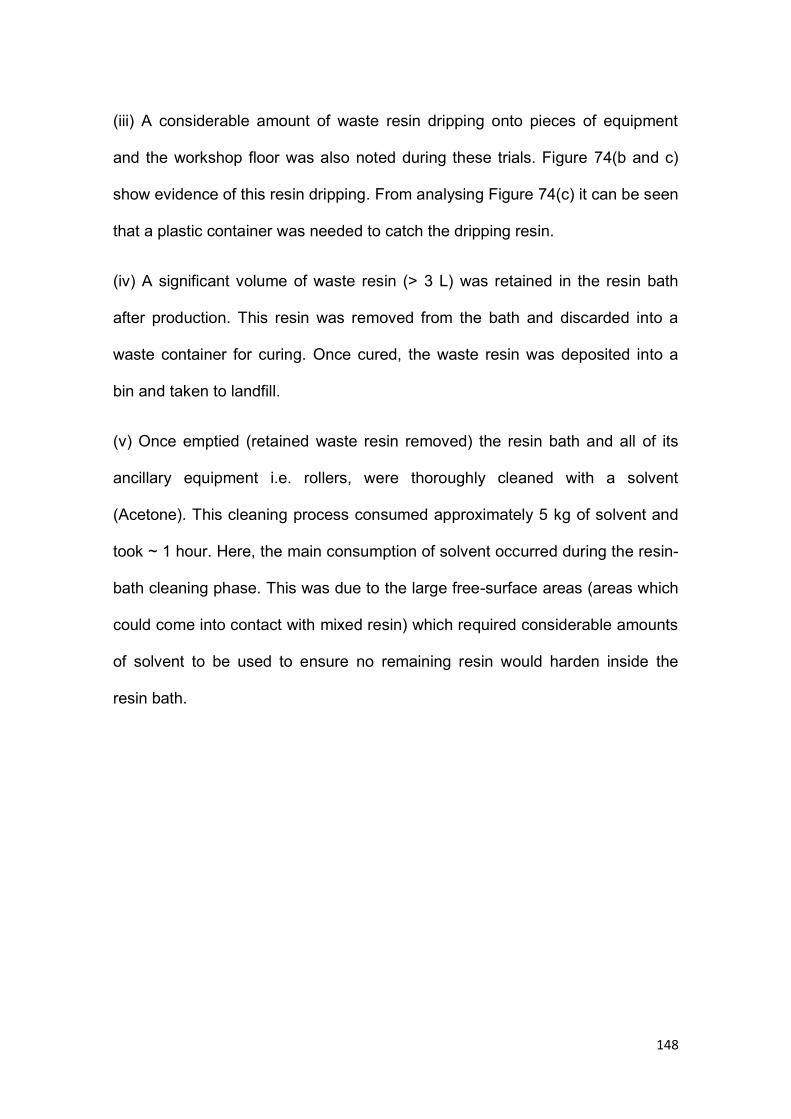
148
(iii) A considerable amount of waste resin dripping onto pieces of equipment
and the workshop floor was also noted during these trials. Figure 74(b and c)
show evidence of this resin dripping. From analysing Figure 74(c) it can be seen
that a plastic container was needed to catch the dripping resin.
(iv) A significant volume of waste resin (> 3 L) was retained in the resin bath
after production. This resin was removed from the bath and discarded into a
waste container for curing. Once cured, the waste resin was deposited into a
bin and taken to landfill.
(v) Once emptied (retained waste resin removed) the resin bath and all of its
ancillary equipment i.e. rollers, were thoroughly cleaned with a solvent
(Acetone). This cleaning process consumed approximately 5 kg of solvent and
took ~ 1 hour. Here, the main consumption of solvent occurred during the resin-
bath cleaning phase. This was due to the large free-surface areas (areas which
could come into contact with mixed resin) which required considerable amounts
of solvent to be used to ensure no remaining resin would harden inside the
resin bath.
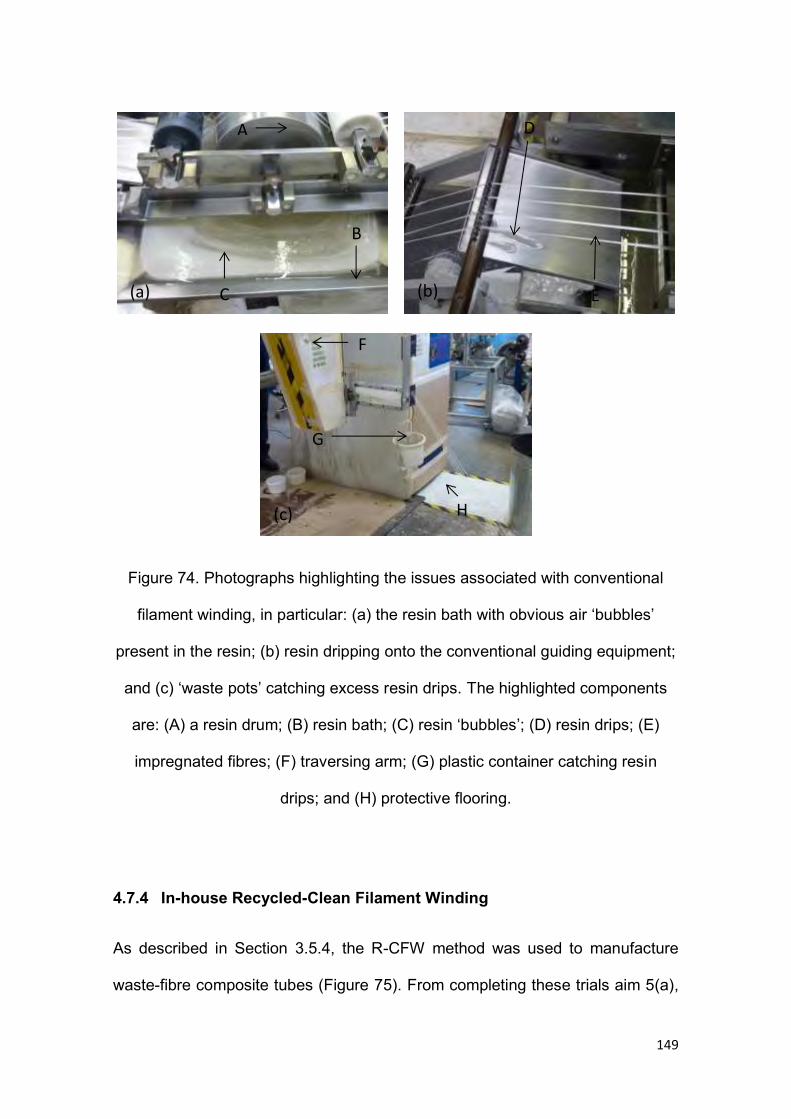
149
Figure 74. Photographs highlighting the issues associated with conventional
filament winding, in particular: (a) the resin bath with obvious air ‘bubbles’
present in the resin; (b) resin dripping onto the conventional guiding equipment;
and (c) ‘waste pots’ catching excess resin drips. The highlighted components
are: (A) a resin drum; (B) resin bath; (C) resin ‘bubbles’; (D) resin drips; (E)
impregnated fibres; (F) traversing arm; (G) plastic container catching resin
drips; and (H) protective flooring.
4.7.4 In-house Recycled-Clean Filament Winding
As described in Section 3.5.4, the R-CFW method was used to manufacture
waste-fibre composite tubes (Figure 75). From completing these trials aim 5(a),
(a)
(c)
(b)
A
B
C
D
E
F
G
H
150
regarding the application of the CFW method into industrial applications, was
fulfilled.
The justification for using these waste materials (waste slittings and direct-loom
waste) was presented in Section 4.3 and the following section summarises the
key aspects of the R-CFW method.
(i) Both types of waste-fibre (waste slittings and direct-loom waste) were able to
be used as fibre feed-stock; the waste-fibres (on bobbins) were used in the
same manner as that shown in Figure 24.
(ii) The waste-slittings were able to be processed in an identical manner to the
glass-fibre trials presented in Section 4.7.1. The only changes of note were: (a)
a slower winding speed; (b) a larger pitch; (c) a faster resin delivery rate; and
(d) the tows had to be flipped (folded) at the end of each layer. These minor
changes were mainly implemented to ensure that sufficient impregnation of the
waste slittings could be achieved. Impregnation assurance was desired here as
initial trials showed that the presence of a resin sealant seemed to hinder the
impregnation process.
(iii) The waste slittings were far more ‘suitable’ for processing than the direct-
loom waste fibres. Here, the direct-loom waste fibres were able to be
manufactured into waste-fibre composite tubes, but the following changes had
to be made:
(a) A slower winding speed (2.5 m/min) was used; this aided in maintaining the
fibres in their original form and minimised fibre disarray/damage.
151
(b) A larger pitch (15 mm) was used; this was needed to allow for the width of
the direct-loom waste.
(c) All fixtures (points of contact) i.e. rollers, guides or pulleys, were removed;
this assisted with reducing the fibre tension and decreased the level of fibre
disarray/damage.
(d) The fibres were flipped (folded) manually after every layer; this ensured: (i)
that protruding fibres were not on the lead-edge; and (ii) the protruding fibres
were immediately over-wound after one full mandrel rotation.
(e) A manual consolidation procedure was also needed to minimise any fibre
disarray which invariably occurred during processing. Here, a brush was used
to ‘flatten down’ the impregnated waste fibres as they were wound on to the
rotating mandrel. This procedure was incorporated to help produce a tube with
more consistent fibre alignment and outer-diameter dimensions. This was
obviously not ideal and this served as the main issue during processing.
(iv) The waste slitting tubes were able to satisfy one of the criteria specified in
Section 4.3. From viewing Figure 75, it can be seen that the R-CFW process
was able to produce waste slitting tubes with a smooth outer-diameter. To
confirm this point, Table 23 shows the relatively consistent wall thickness
dimensions which were present in the waste slittings tubes. Here, the waste
slittings were shown to be able to produce a tube with an average wall
thickness of 3.31 mm (+0.1). From satisfying this criterion, the waste slitting
tubes were then used during the on-site R-CFW trials.
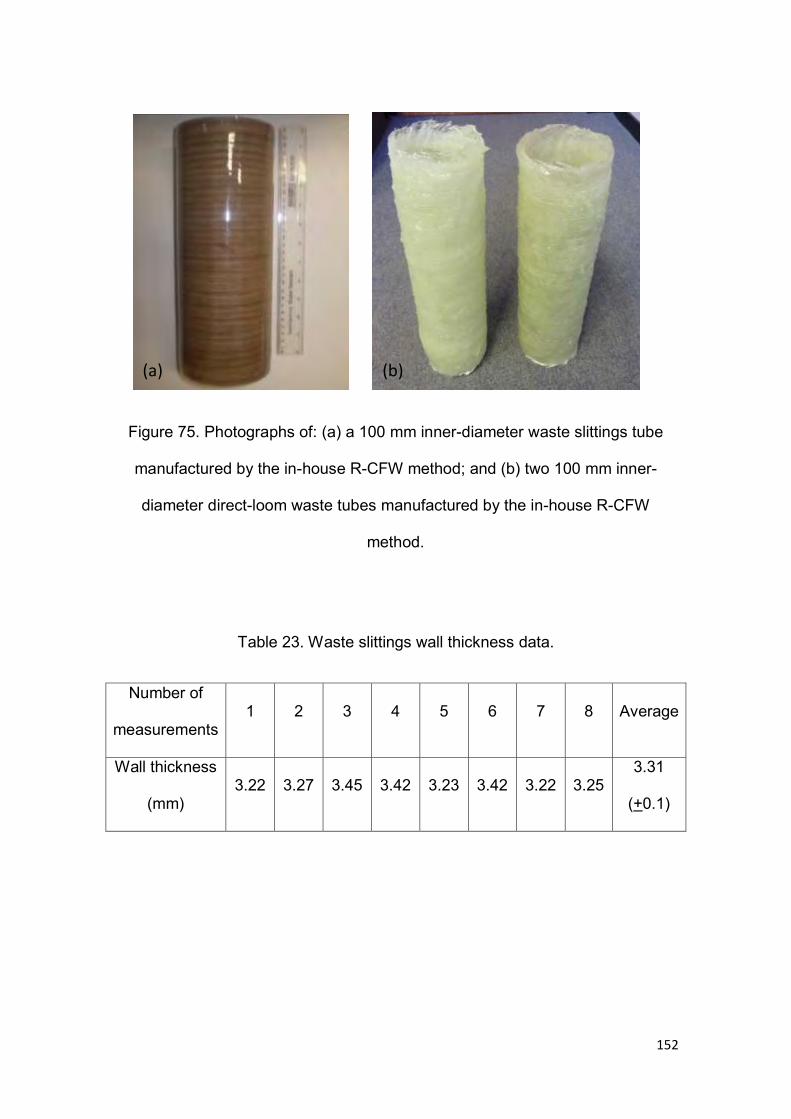
152
Figure 75. Photographs of: (a) a 100 mm inner-diameter waste slittings tube
manufactured by the in-house R-CFW method; and (b) two 100 mm inner-
diameter direct-loom waste tubes manufactured by the in-house R-CFW
method.
Table 23. Waste slittings wall thickness data.
Number of
measurements 1 2 3 4 5 6 7 8 Average
Wall thickness
(mm) 3.22 3.27 3.45 3.42 3.23 3.42 3.22 3.25
3.31
(+0.1)
(a) (b)
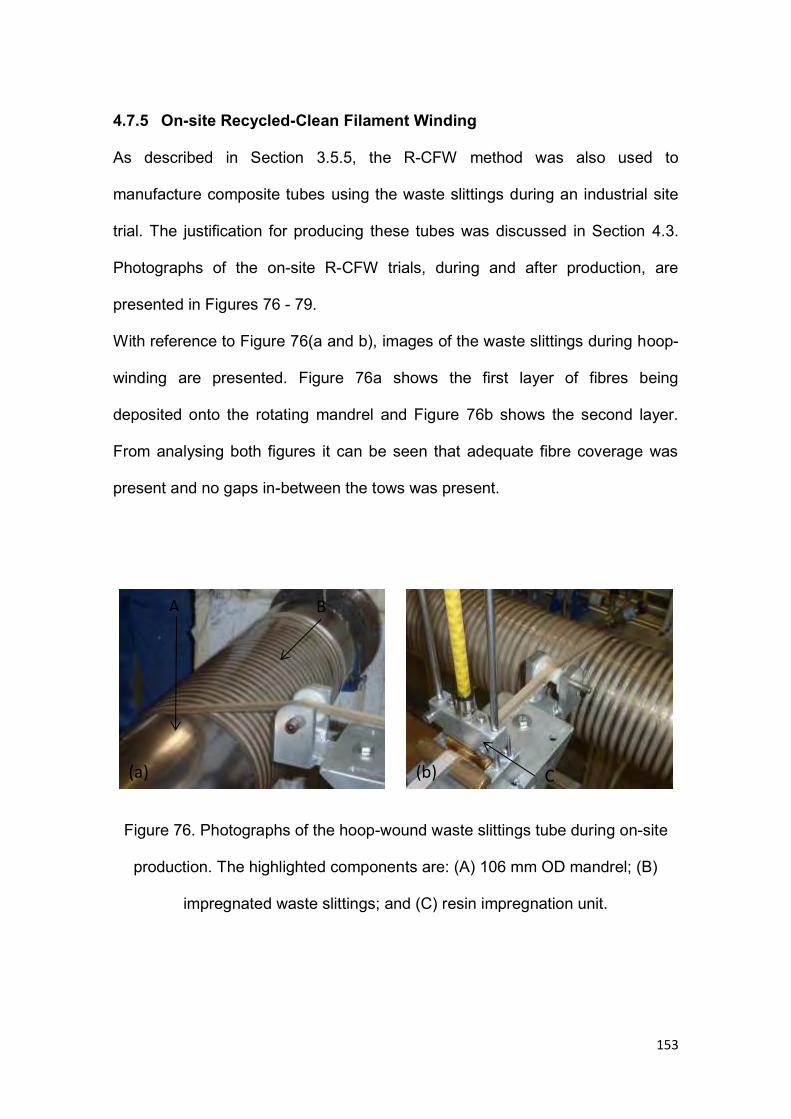
153
4.7.5 On-site Recycled-Clean Filament Winding
As described in Section 3.5.5, the R-CFW method was also used to
manufacture composite tubes using the waste slittings during an industrial site
trial. The justification for producing these tubes was discussed in Section 4.3.
Photographs of the on-site R-CFW trials, during and after production, are
presented in Figures 76 - 79.
With reference to Figure 76(a and b), images of the waste slittings during hoop-
winding are presented. Figure 76a shows the first layer of fibres being
deposited onto the rotating mandrel and Figure 76b shows the second layer.
From analysing both figures it can be seen that adequate fibre coverage was
present and no gaps in-between the tows was present.
Figure 76. Photographs of the hoop-wound waste slittings tube during on-site
production. The highlighted components are: (A) 106 mm OD mandrel; (B)
impregnated waste slittings; and (C) resin impregnation unit.
A B
C (a) (b)
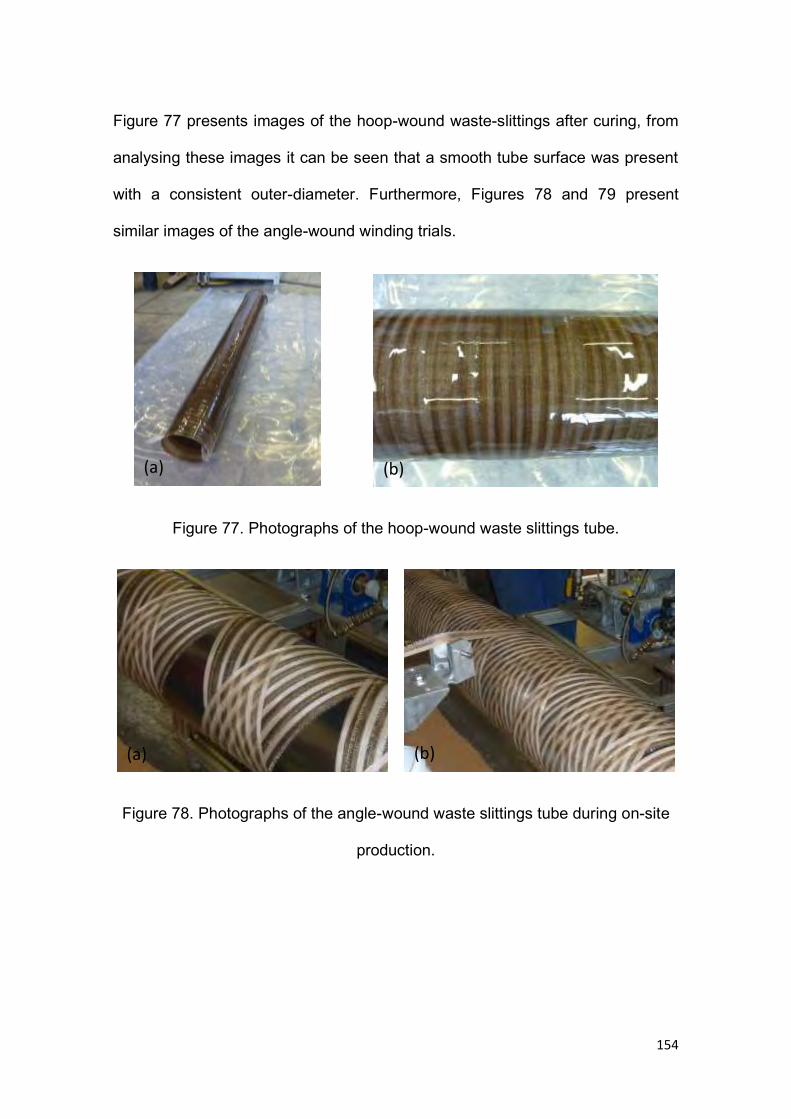
154
Figure 77 presents images of the hoop-wound waste-slittings after curing, from
analysing these images it can be seen that a smooth tube surface was present
with a consistent outer-diameter. Furthermore, Figures 78 and 79 present
similar images of the angle-wound winding trials.
Figure 77. Photographs of the hoop-wound waste slittings tube.
Figure 78. Photographs of the angle-wound waste slittings tube during on-site
production.
(a) (b)
(a) (b)
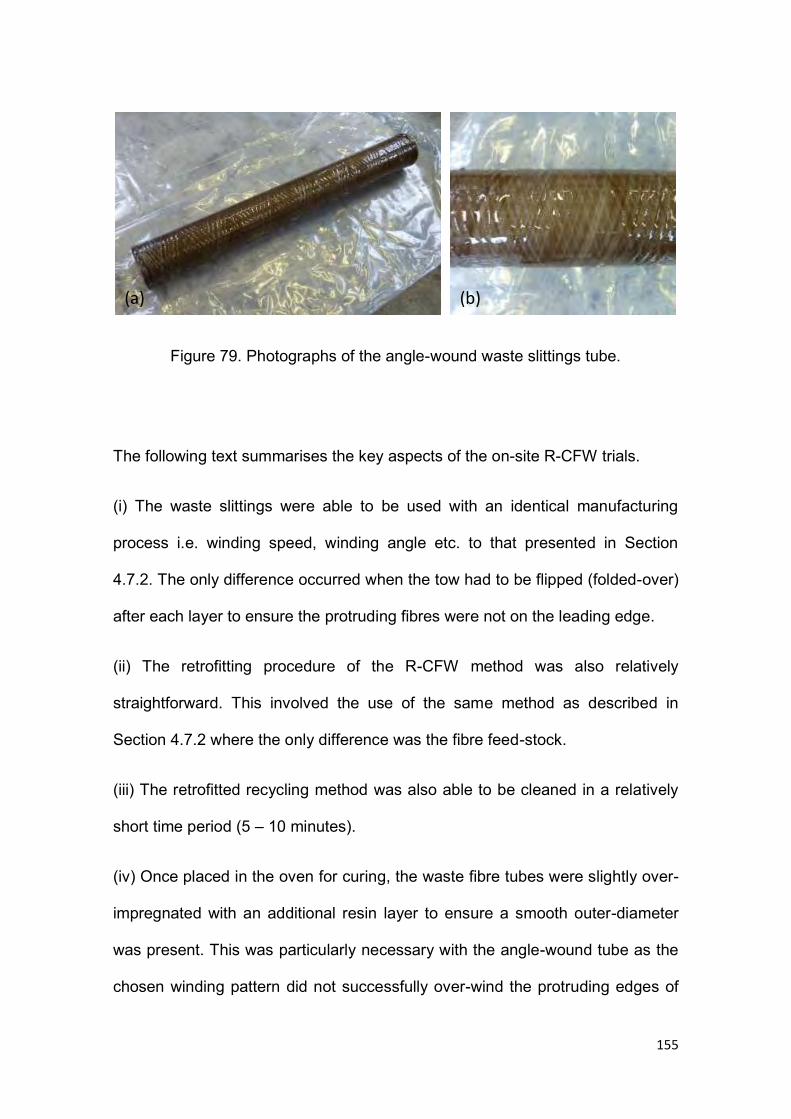
155
Figure 79. Photographs of the angle-wound waste slittings tube.
The following text summarises the key aspects of the on-site R-CFW trials.
(i) The waste slittings were able to be used with an identical manufacturing
process i.e. winding speed, winding angle etc. to that presented in Section
4.7.2. The only difference occurred when the tow had to be flipped (folded-over)
after each layer to ensure the protruding fibres were not on the leading edge.
(ii) The retrofitting procedure of the R-CFW method was also relatively
straightforward. This involved the use of the same method as described in
Section 4.7.2 where the only difference was the fibre feed-stock.
(iii) The retrofitted recycling method was also able to be cleaned in a relatively
short time period (5 – 10 minutes).
(iv) Once placed in the oven for curing, the waste fibre tubes were slightly over-
impregnated with an additional resin layer to ensure a smooth outer-diameter
was present. This was particularly necessary with the angle-wound tube as the
chosen winding pattern did not successfully over-wind the protruding edges of
(b) (a)
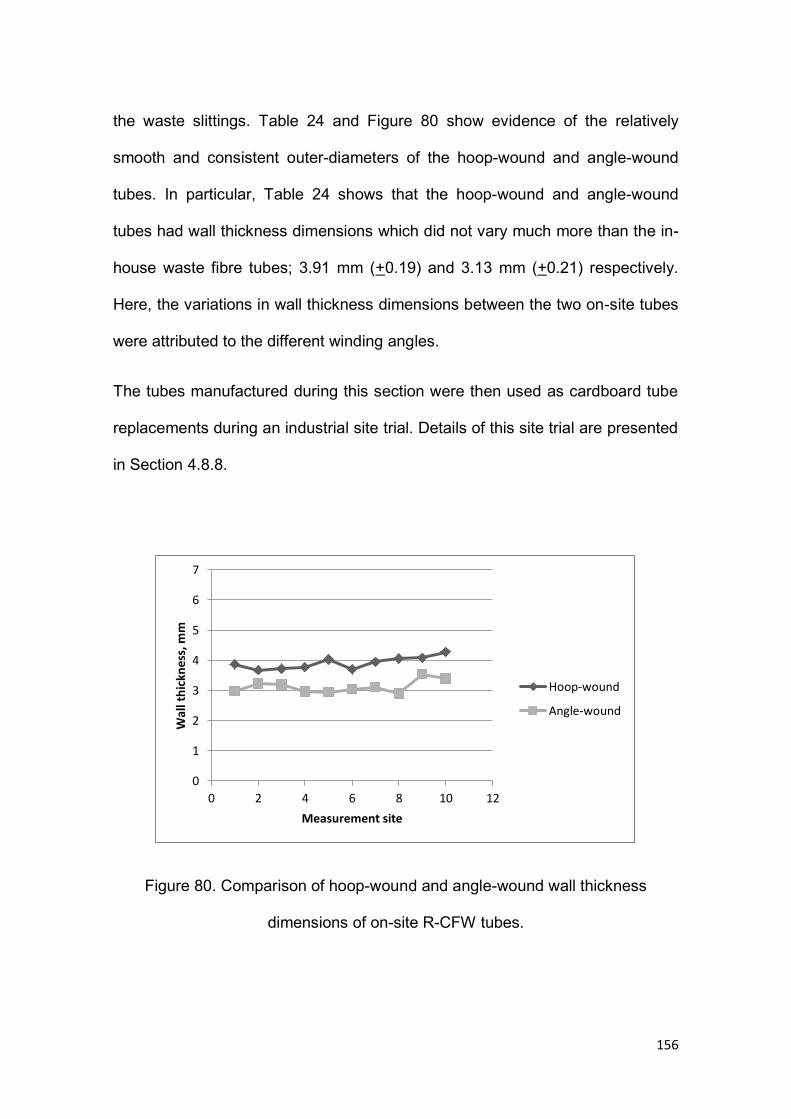
156
the waste slittings. Table 24 and Figure 80 show evidence of the relatively
smooth and consistent outer-diameters of the hoop-wound and angle-wound
tubes. In particular, Table 24 shows that the hoop-wound and angle-wound
tubes had wall thickness dimensions which did not vary much more than the in-
house waste fibre tubes; 3.91 mm (+0.19) and 3.13 mm (+0.21) respectively.
Here, the variations in wall thickness dimensions between the two on-site tubes
were attributed to the different winding angles.
The tubes manufactured during this section were then used as cardboard tube
replacements during an industrial site trial. Details of this site trial are presented
in Section 4.8.8.
Figure 80. Comparison of hoop-wound and angle-wound wall thickness
dimensions of on-site R-CFW tubes.
0
1
2
3
4
5
6
7
0 2 4 6 8 10 12
Wal
l th
ickn
ess,
mm
Measurement site
Hoop-wound
Angle-wound
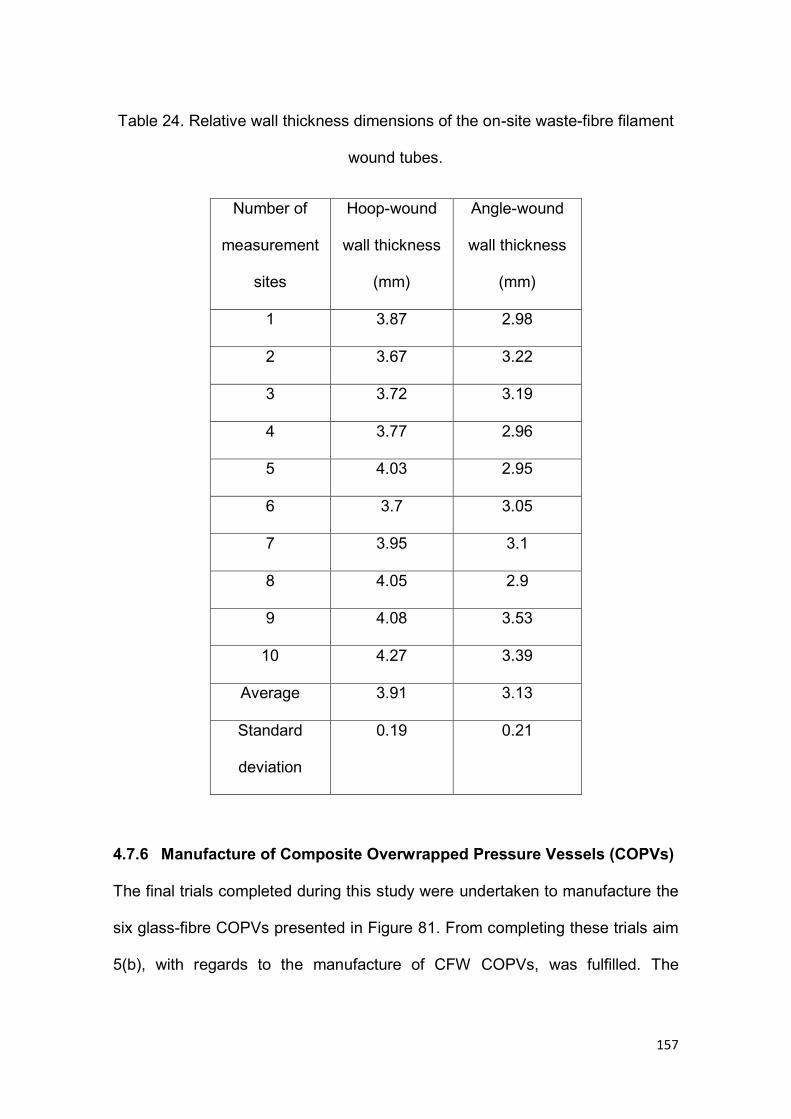
157
Table 24. Relative wall thickness dimensions of the on-site waste-fibre filament
wound tubes.
Number of
measurement
sites
Hoop-wound
wall thickness
(mm)
Angle-wound
wall thickness
(mm)
1 3.87 2.98
2 3.67 3.22
3 3.72 3.19
4 3.77 2.96
5 4.03 2.95
6 3.7 3.05
7 3.95 3.1
8 4.05 2.9
9 4.08 3.53
10 4.27 3.39
Average 3.91 3.13
Standard
deviation
0.19 0.21
4.7.6 Manufacture of Composite Overwrapped Pressure Vessels (COPVs)
The final trials completed during this study were undertaken to manufacture the
six glass-fibre COPVs presented in Figure 81. From completing these trials aim
5(b), with regards to the manufacture of CFW COPVs, was fulfilled. The
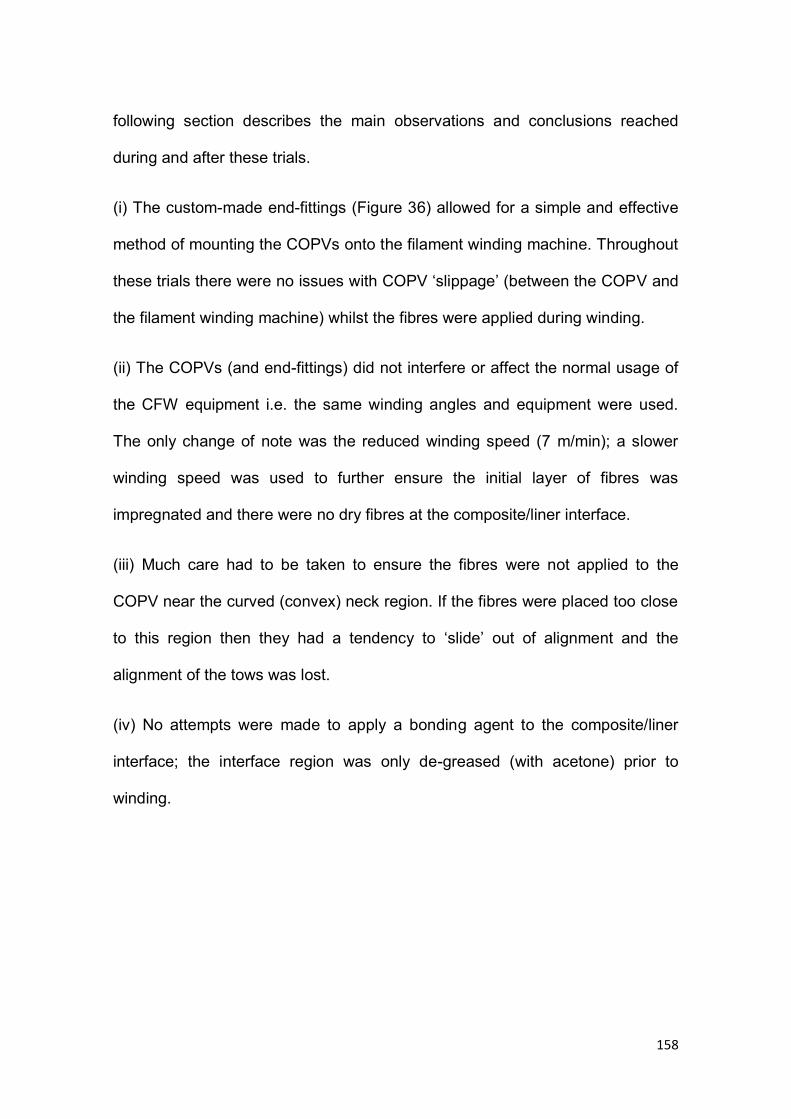
158
following section describes the main observations and conclusions reached
during and after these trials.
(i) The custom-made end-fittings (Figure 36) allowed for a simple and effective
method of mounting the COPVs onto the filament winding machine. Throughout
these trials there were no issues with COPV ‘slippage’ (between the COPV and
the filament winding machine) whilst the fibres were applied during winding.
(ii) The COPVs (and end-fittings) did not interfere or affect the normal usage of
the CFW equipment i.e. the same winding angles and equipment were used.
The only change of note was the reduced winding speed (7 m/min); a slower
winding speed was used to further ensure the initial layer of fibres was
impregnated and there were no dry fibres at the composite/liner interface.
(iii) Much care had to be taken to ensure the fibres were not applied to the
COPV near the curved (convex) neck region. If the fibres were placed too close
to this region then they had a tendency to ‘slide’ out of alignment and the
alignment of the tows was lost.
(iv) No attempts were made to apply a bonding agent to the composite/liner
interface; the interface region was only de-greased (with acetone) prior to
winding.
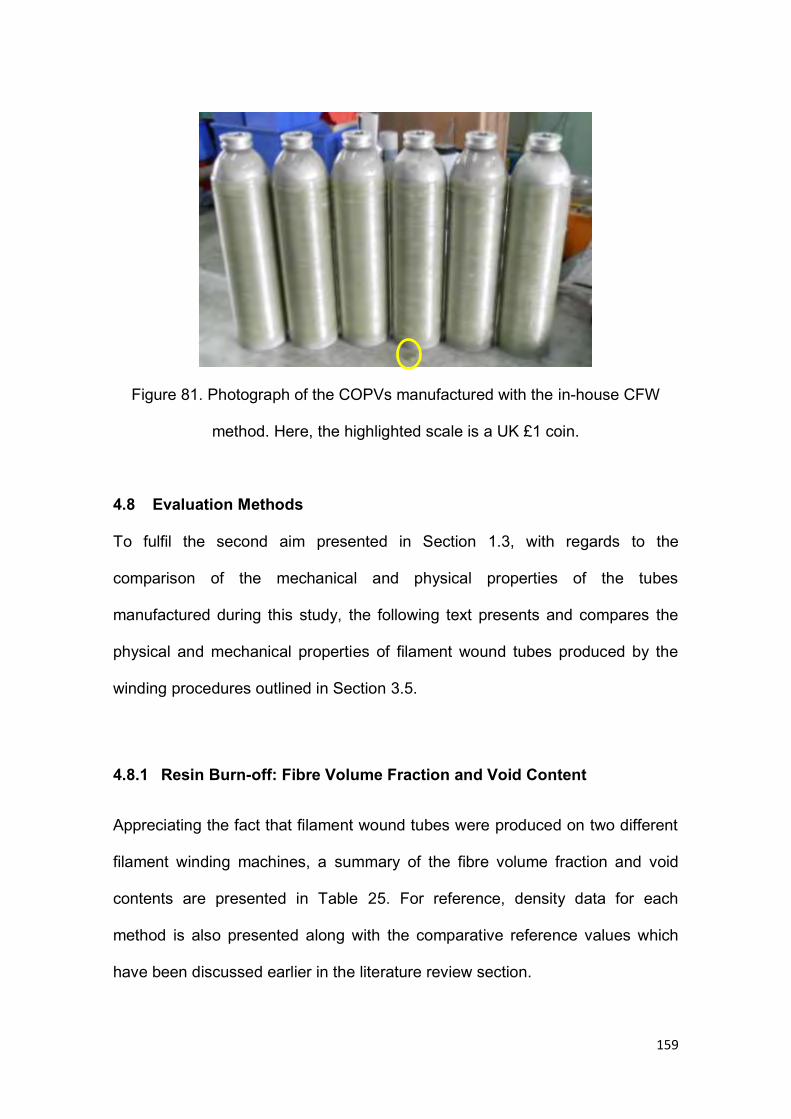
159
Figure 81. Photograph of the COPVs manufactured with the in-house CFW
method. Here, the highlighted scale is a UK £1 coin.
4.8 Evaluation Methods
To fulfil the second aim presented in Section 1.3, with regards to the
comparison of the mechanical and physical properties of the tubes
manufactured during this study, the following text presents and compares the
physical and mechanical properties of filament wound tubes produced by the
winding procedures outlined in Section 3.5.
4.8.1 Resin Burn-off: Fibre Volume Fraction and Void Content
Appreciating the fact that filament wound tubes were produced on two different
filament winding machines, a summary of the fibre volume fraction and void
contents are presented in Table 25. For reference, density data for each
method is also presented along with the comparative reference values which
have been discussed earlier in the literature review section.
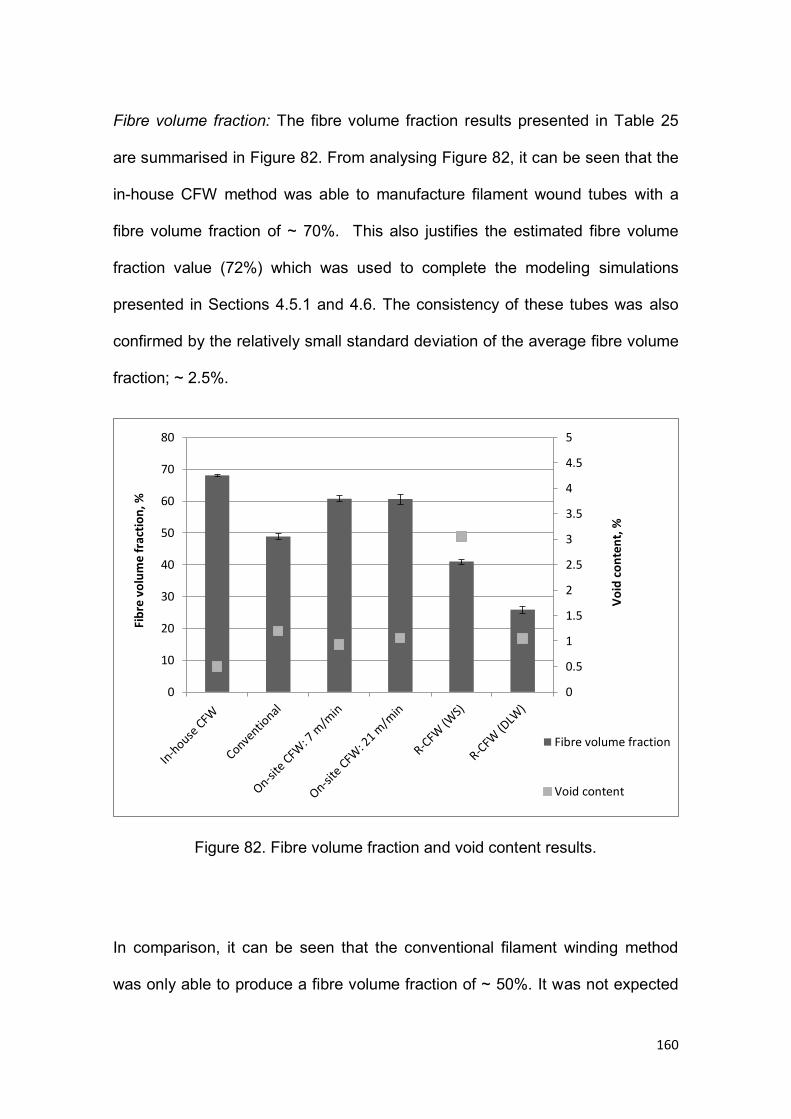
160
Fibre volume fraction: The fibre volume fraction results presented in Table 25
are summarised in Figure 82. From analysing Figure 82, it can be seen that the
in-house CFW method was able to manufacture filament wound tubes with a
fibre volume fraction of ~ 70%. This also justifies the estimated fibre volume
fraction value (72%) which was used to complete the modeling simulations
presented in Sections 4.5.1 and 4.6. The consistency of these tubes was also
confirmed by the relatively small standard deviation of the average fibre volume
fraction; ~ 2.5%.
Figure 82. Fibre volume fraction and void content results.
In comparison, it can be seen that the conventional filament winding method
was only able to produce a fibre volume fraction of ~ 50%. It was not expected
0
0.5
1
1.5
2
2.5
3
3.5
4
4.5
5
0
10
20
30
40
50
60
70
80
Vo
id c
on
ten
t, %
Fib
re v
olu
me
frac
tio
n, %
Fibre volume fraction
Void content
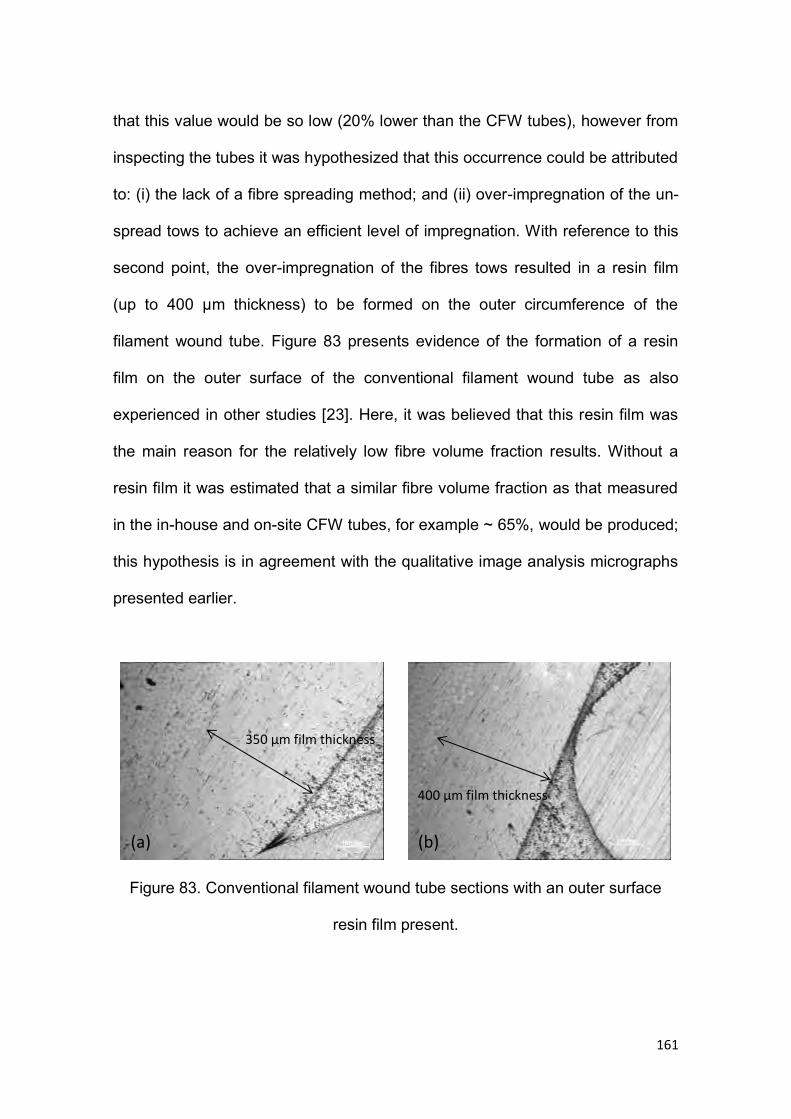
161
that this value would be so low (20% lower than the CFW tubes), however from
inspecting the tubes it was hypothesized that this occurrence could be attributed
to: (i) the lack of a fibre spreading method; and (ii) over-impregnation of the un-
spread tows to achieve an efficient level of impregnation. With reference to this
second point, the over-impregnation of the fibres tows resulted in a resin film
(up to 400 µm thickness) to be formed on the outer circumference of the
filament wound tube. Figure 83 presents evidence of the formation of a resin
film on the outer surface of the conventional filament wound tube as also
experienced in other studies [23]. Here, it was believed that this resin film was
the main reason for the relatively low fibre volume fraction results. Without a
resin film it was estimated that a similar fibre volume fraction as that measured
in the in-house and on-site CFW tubes, for example ~ 65%, would be produced;
this hypothesis is in agreement with the qualitative image analysis micrographs
presented earlier.
Figure 83. Conventional filament wound tube sections with an outer surface
resin film present.
350 µm film thickness
400 µm film thickness
(a) (b)
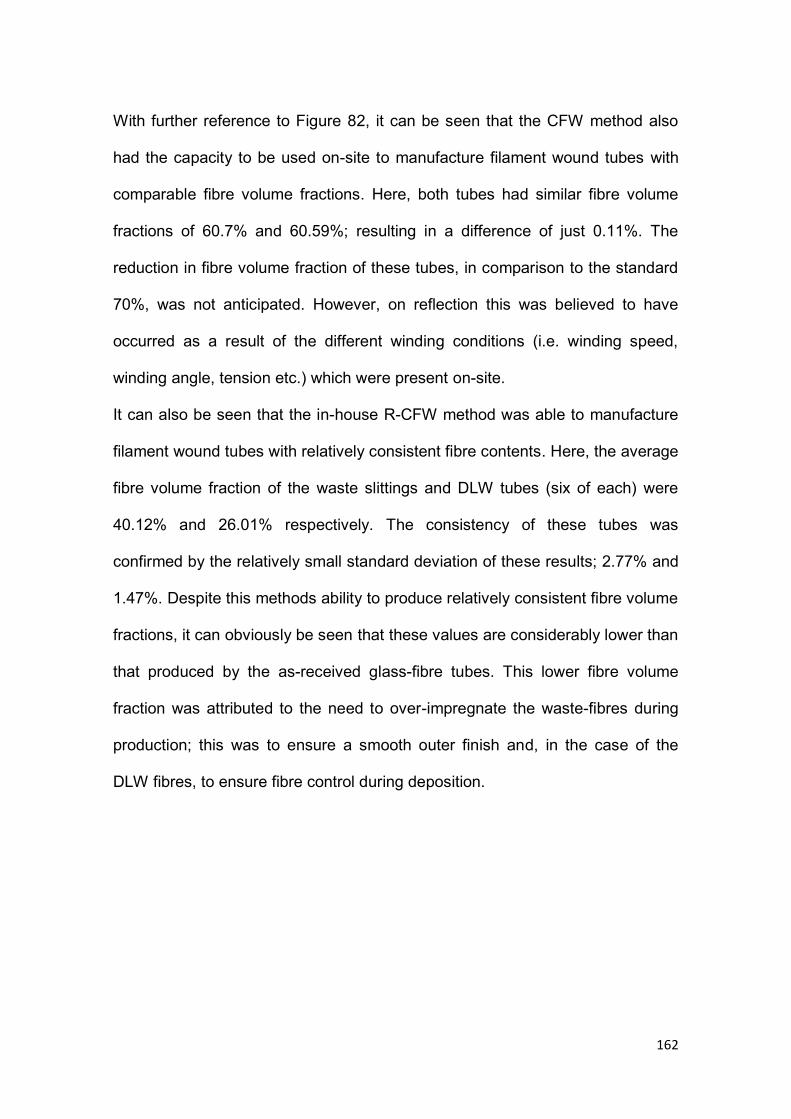
162
With further reference to Figure 82, it can be seen that the CFW method also
had the capacity to be used on-site to manufacture filament wound tubes with
comparable fibre volume fractions. Here, both tubes had similar fibre volume
fractions of 60.7% and 60.59%; resulting in a difference of just 0.11%. The
reduction in fibre volume fraction of these tubes, in comparison to the standard
70%, was not anticipated. However, on reflection this was believed to have
occurred as a result of the different winding conditions (i.e. winding speed,
winding angle, tension etc.) which were present on-site.
It can also be seen that the in-house R-CFW method was able to manufacture
filament wound tubes with relatively consistent fibre contents. Here, the average
fibre volume fraction of the waste slittings and DLW tubes (six of each) were
40.12% and 26.01% respectively. The consistency of these tubes was
confirmed by the relatively small standard deviation of these results; 2.77% and
1.47%. Despite this methods ability to produce relatively consistent fibre volume
fractions, it can obviously be seen that these values are considerably lower than
that produced by the as-received glass-fibre tubes. This lower fibre volume
fraction was attributed to the need to over-impregnate the waste-fibres during
production; this was to ensure a smooth outer finish and, in the case of the
DLW fibres, to ensure fibre control during deposition.
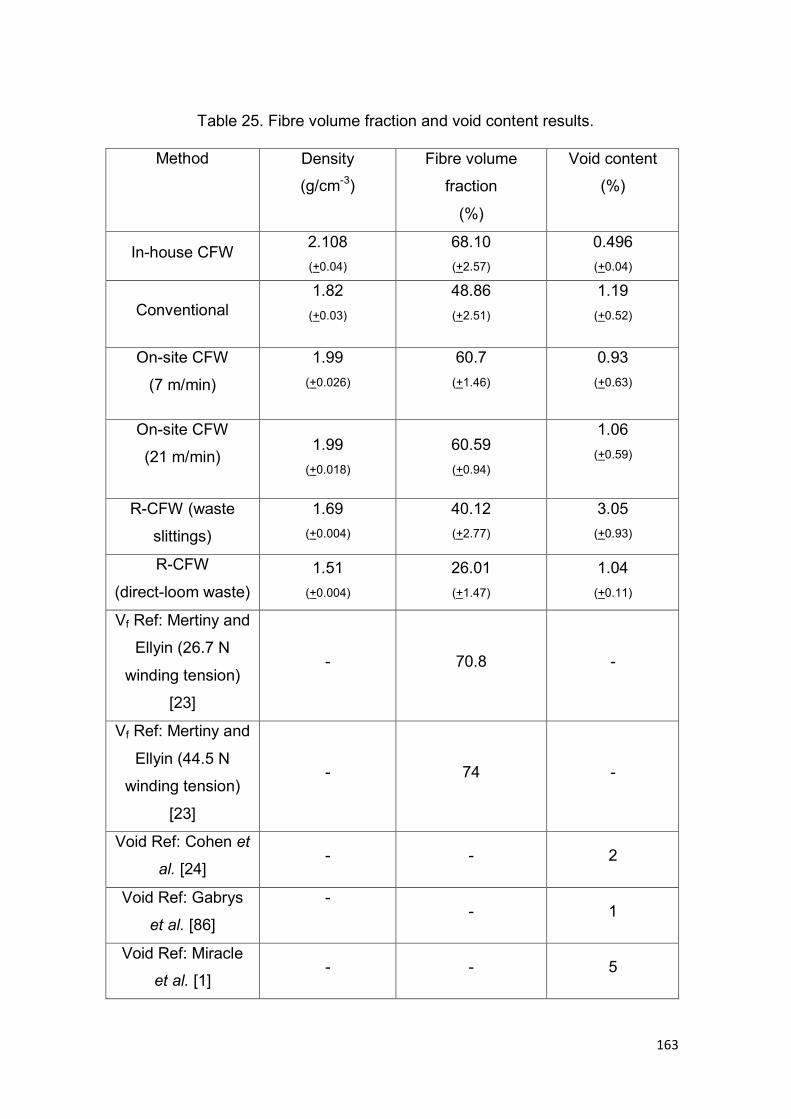
163
Table 25. Fibre volume fraction and void content results.
Method Density
(g/cm-3)
Fibre volume
fraction
(%)
Void content
(%)
In-house CFW 2.108 (+0.04)
68.10 (+2.57)
0.496 (+0.04)
Conventional 1.82
(+0.03) 48.86 (+2.51)
1.19 (+0.52)
On-site CFW
(7 m/min)
1.99 (+0.026)
60.7 (+1.46)
0.93 (+0.63)
On-site CFW
(21 m/min) 1.99
(+0.018) 60.59 (+0.94)
1.06 (+0.59)
R-CFW (waste
slittings)
1.69 (+0.004)
40.12 (+2.77)
3.05 (+0.93)
R-CFW
(direct-loom waste) 1.51
(+0.004)
26.01 (+1.47)
1.04 (+0.11)
Vf Ref: Mertiny and
Ellyin (26.7 N
winding tension)
[23]
- 70.8 -
Vf Ref: Mertiny and
Ellyin (44.5 N
winding tension)
[23]
- 74 -
Void Ref: Cohen et
al. [24] - - 2
Void Ref: Gabrys
et al. [86]
- - 1
Void Ref: Miracle
et al. [1] - - 5
164
Void content: With regards to the void content results presented in Figure 82, it
can be seen that the CFW method was also able to produce filament wound
tubes with consistently low void contents. Here, the average void content was
0.49 % with a standard deviation of just 0.18%. These void contents can also be
put into perspective when compared to the reference values (1 to 5%) which
were also presented in Table 25.
With further reference to Figure 82, it can be seen that the CFW method also
had the capacity to be used on-site to manufacture tubes with relatively low void
contents. Here, both on-site CFW tubes had similar void contents of 0.93% and
1.06%; this resulted in a variation of just 0.13%.
The ability of the CFW method to produce high fibre volume fractions and low
void contents was attributed to:
(i) The use of a resin dispensing unit to deliver the exact amount of resin to the
fibres at any one time. From using this method there was no over-impregnation
of the fibre tows and a ‘fresh’ batch of mixed resin was constantly supplied; as
opposed to a pre-deposited batch of mixed resin which may have been in the
bath for up to 1 hour.
(ii) The incorporation of a static mixer to intimately mix the two components of
the resin system. From incorporating this method it was possible to ensure that
the resin system supplied was homogenous.
165
(iii) The use of a resin impregnation unit to impregnate the fibre tows. Here, top
and bottom impregnation was used to ensure that efficient impregnation of the
entire tow was achieved.
(iv) The inclusion of two fibre spreading mechanisms (spreading station and
resin impregnation unit) to reduce the thickness of the tows. The reduction in
tow thickness aided in improving it’s through thickness permeability.
(v) The relatively low level of fibre tension was present throughout the trials.
This minimised tow damage whilst still allowing a certain degree of tow porosity
to be present; the presence of tow porosity aided with efficient impregnation.
Finally, from reviewing Figure 82, it can also be seen that the R-CFW method
achieved varying levels of success in manufacturing filament wound tubes with
consistently low void contents. Here, the aforementioned presence of a resin
sealant on the waste slittings inhibited the impregnation process; producing a
void content of ~ 3%. Conversely, the low void contents produced with the
direct-loom waste were attributed to the use of an over-impregnation and
‘brushing’ procedure. It was acknowledged that these void contents were
considerably low; however these were not achieved in a consistent and
repeatable manner. The issue of achieving efficient impregnation of the direct-
loom waste in a repeatable, simple and effective manner was identified as a
significant area for future research.
166
4.8.2 Hoop Tensile (Split-Disk) Strength
A summary of the hoop tensile (split-disk) strength results are presented in
Table 26. With reference to the following section, results were presented with
regards to: (i) failure load (N); (ii) hoop-tensile (split-disk) strength; and (iii)
normalised hoop tensile (split-disk) strength. For reference, example hoop
tensile (split-disk) testing load/displacement curves are presented in the
appendix.
Here, normalised results were presented in an attempt to account for the
differing fibre volume fractions which were presented in Section 4.8.1. All
normalised results were calculated with regards to a 69% fibre volume fraction.
However, it should be noted that: (i) due to the discussion presented in Section
4.1.1 and 4.8.1 all conventional filament wound tube sections were normalised
from a fibre volume fraction of 65% (and not the ~ 50% which was presented in
Table 25). This was deemed appropriate as the image analysis results
presented in Section 4.1.1 confirmed that the measured fibre volume fraction
results of the conventionally wound sections may have been affected by the
presence of a resin film. (ii) The waste-fibre results were not normalised, this
was due to the relative misalignment of many of these fibres which meant that
they were not in the load bearing direction and therefore any normalised results
would be inaccurate.
It should also be noted that in the following section the failure load data was
only provided for reference and the main discussion was based on the
normalised hoop tensile (split-disk) strength results.
167
The results presented in Table 26 are summarised in Figure 84. With reference
to Figure 84, and comparing it to the data presented in Section 2.1, it can be
seen that the in-house CFW method was able to produce relatively high
normalised hoop (split-disk) tensile strengths. In particular, the in-house CFW
method produced an average strength which: (i) was within 10% of that
reported by Kaynak et al. [34]; and (ii) offered a 95% confidence interval
(705.82 – 844.34 MPa) which encapsulated the normalised hoop tensile
strength produced by the conventional filament winding method (842.63 MPa).
This production of glass-fibre tubes with comparative normalised hoop tensile
strengths was also achieved in a consistent and repeatable manner. To prove
this point, it can be seen that a relatively small standard deviation was produced
(65.99 MPa); this equated to a variation of just 8.5% for the six CFW tubes.
Figure 84 also presents the normalised hoop tensile strengths of the on-site
CFW method. Here, relatively high strengths of 902.71 MPa (+46.82 MPa) and
983.17 MPa (+36.51 MPa) were produced by the 7 m/min and 21 m/min
winding trials respectively. To put these values in perspective, the 21 m/min
winding method was able to produce a normalised hoop tensile strength value
which was 15% higher than that presented by the conventional filament winding
method. The presence of the high hoop-tensile (split-disk) strengths produced
by the CFW methods was attributed to the combination of a low void content,
fibre spreading and the relatively low fibre tension.
Finally, with reference to Figure 84, it can be seen that the waste slittings were
able to produce a considerably higher hoop tensile (split-disk) strengths than
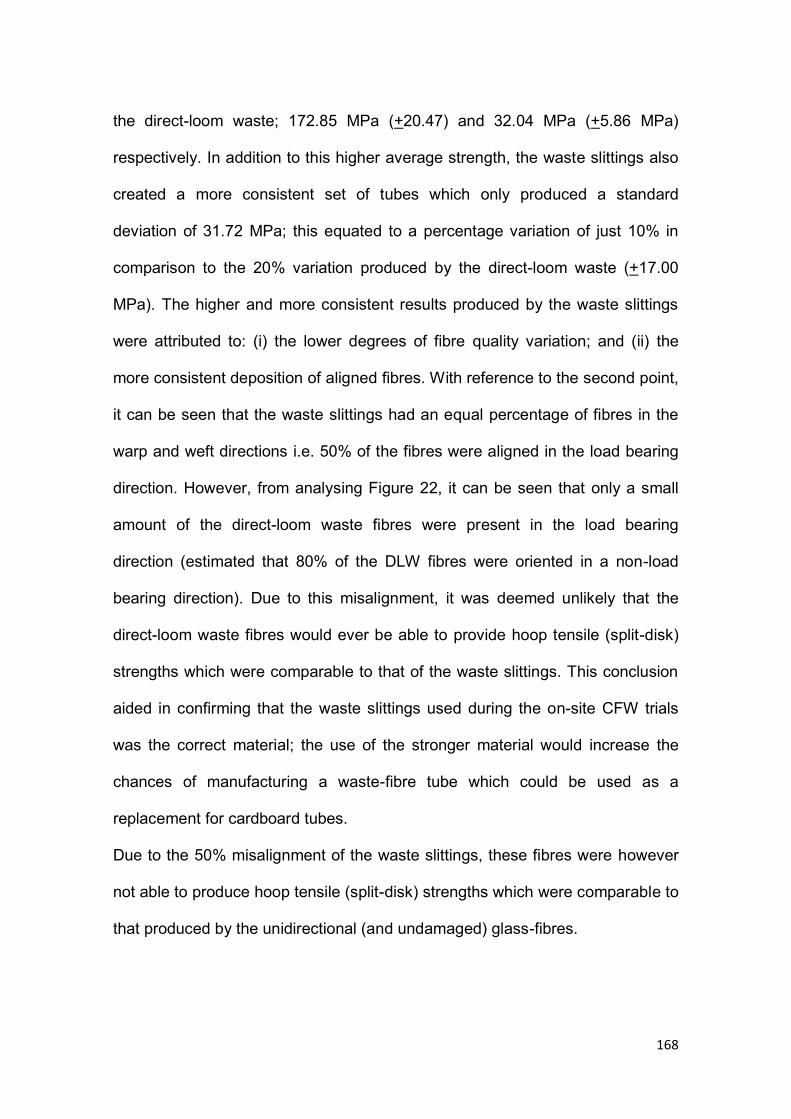
168
the direct-loom waste; 172.85 MPa (+20.47) and 32.04 MPa (+5.86 MPa)
respectively. In addition to this higher average strength, the waste slittings also
created a more consistent set of tubes which only produced a standard
deviation of 31.72 MPa; this equated to a percentage variation of just 10% in
comparison to the 20% variation produced by the direct-loom waste (+17.00
MPa). The higher and more consistent results produced by the waste slittings
were attributed to: (i) the lower degrees of fibre quality variation; and (ii) the
more consistent deposition of aligned fibres. With reference to the second point,
it can be seen that the waste slittings had an equal percentage of fibres in the
warp and weft directions i.e. 50% of the fibres were aligned in the load bearing
direction. However, from analysing Figure 22, it can be seen that only a small
amount of the direct-loom waste fibres were present in the load bearing
direction (estimated that 80% of the DLW fibres were oriented in a non-load
bearing direction). Due to this misalignment, it was deemed unlikely that the
direct-loom waste fibres would ever be able to provide hoop tensile (split-disk)
strengths which were comparable to that of the waste slittings. This conclusion
aided in confirming that the waste slittings used during the on-site CFW trials
was the correct material; the use of the stronger material would increase the
chances of manufacturing a waste-fibre tube which could be used as a
replacement for cardboard tubes.
Due to the 50% misalignment of the waste slittings, these fibres were however
not able to produce hoop tensile (split-disk) strengths which were comparable to
that produced by the unidirectional (and undamaged) glass-fibres.
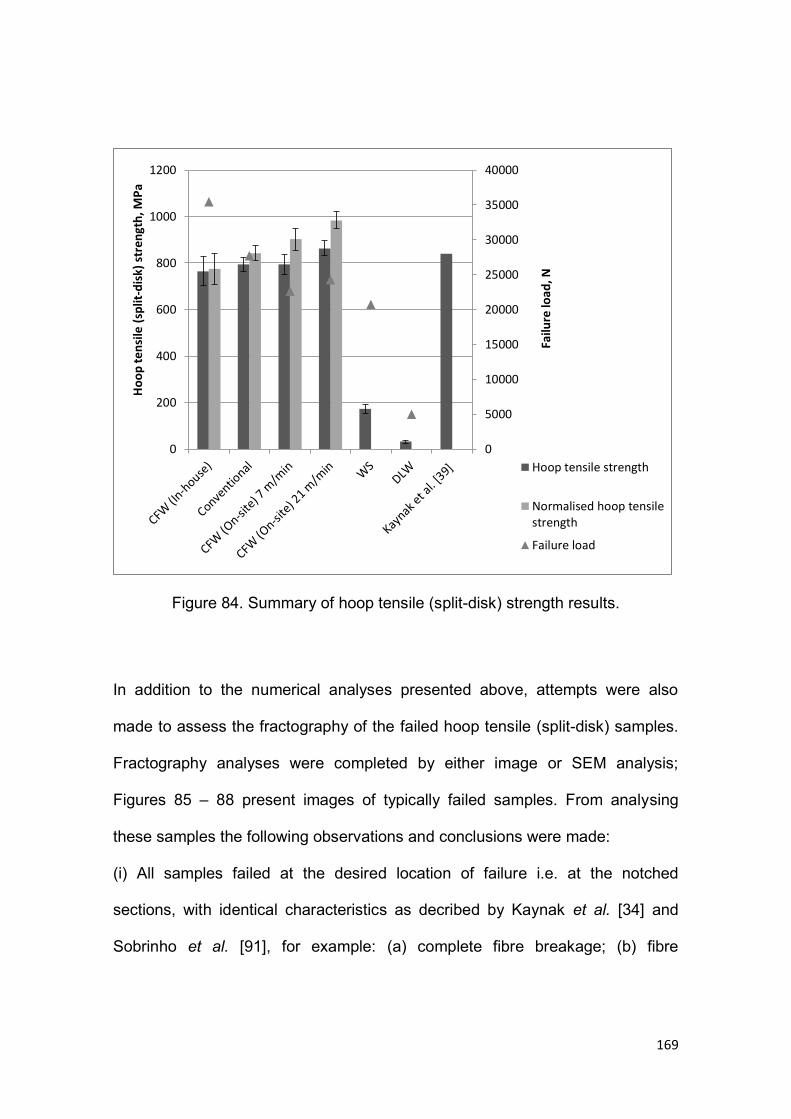
169
Figure 84. Summary of hoop tensile (split-disk) strength results.
In addition to the numerical analyses presented above, attempts were also
made to assess the fractography of the failed hoop tensile (split-disk) samples.
Fractography analyses were completed by either image or SEM analysis;
Figures 85 – 88 present images of typically failed samples. From analysing
these samples the following observations and conclusions were made:
(i) All samples failed at the desired location of failure i.e. at the notched
sections, with identical characteristics as decribed by Kaynak et al. [34] and
Sobrinho et al. [91], for example: (a) complete fibre breakage; (b) fibre
0
5000
10000
15000
20000
25000
30000
35000
40000
0
200
400
600
800
1000
1200
Failu
re lo
ad
, N
Ho
op
ten
sile
(sp
lit-d
isk)
str
engt
h, M
Pa
Hoop tensile strength
Normalised hoop tensilestrength
Failure load
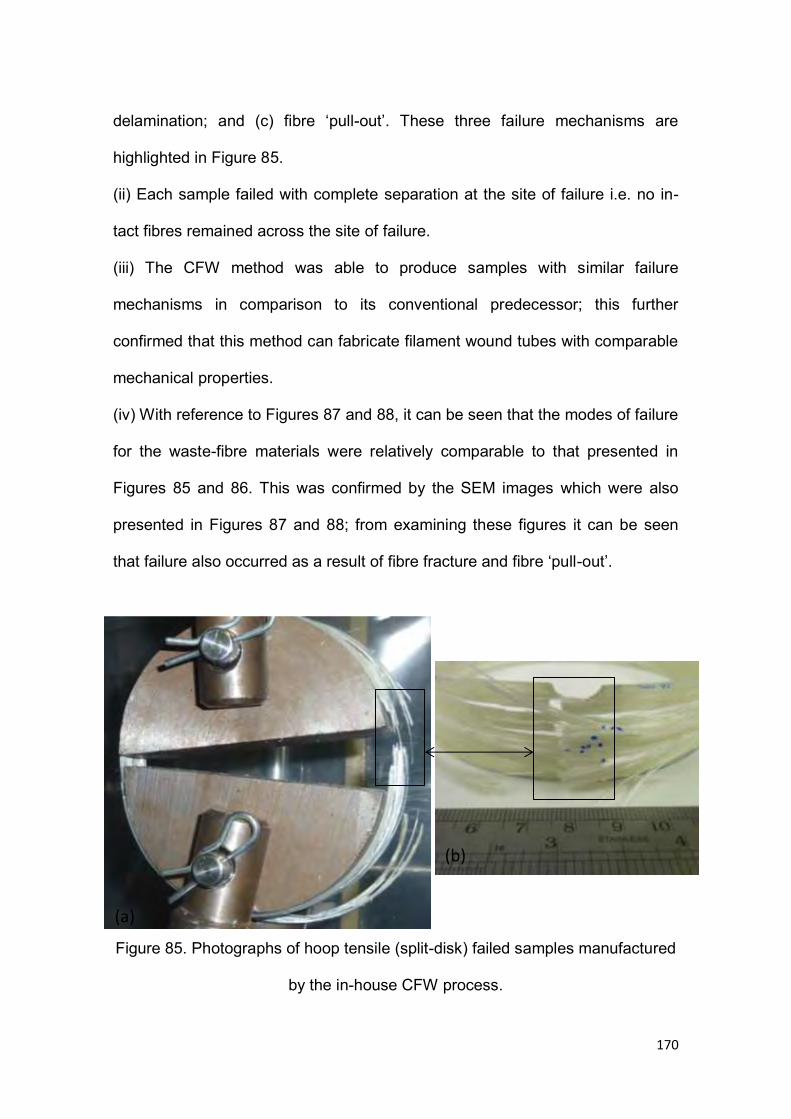
170
delamination; and (c) fibre ‘pull-out’. These three failure mechanisms are
highlighted in Figure 85.
(ii) Each sample failed with complete separation at the site of failure i.e. no in-
tact fibres remained across the site of failure.
(iii) The CFW method was able to produce samples with similar failure
mechanisms in comparison to its conventional predecessor; this further
confirmed that this method can fabricate filament wound tubes with comparable
mechanical properties.
(iv) With reference to Figures 87 and 88, it can be seen that the modes of failure
for the waste-fibre materials were relatively comparable to that presented in
Figures 85 and 86. This was confirmed by the SEM images which were also
presented in Figures 87 and 88; from examining these figures it can be seen
that failure also occurred as a result of fibre fracture and fibre ‘pull-out’.
Figure 85. Photographs of hoop tensile (split-disk) failed samples manufactured
by the in-house CFW process.
(a)
(b)
171
Table 26. Hoop tensile (split-disk) strength results.
Method Failure load
(N)
Hoop tensile (split
disk) strength
(MPa)
Normalised
hoop tensile
(split-disk)
strength
(MPa)
95%
confidence
interval
(Normalised
strength)
(MPa)
In-house CFW 35459.8 (+2222)
764.29 (+43.96)
775.08 (+65.99)
705.82 –
844.34
Conventional 27730.1 (+1438)
793.78 (+29.9)
842.63 (+31.74)
809.31 –
875.94
On-site CFW
(7 m/min) 22644 (+1887)
794.13 (+41.19)
902.71 (+46.82)
853.57 –
951.86
On-site CFW
(21 m/min) 24267.6 (+643)
863.33 (+32.06)
983.17 (+36.51)
944.84 –
1021.49
R-CFW
(waste slittings) 20723.5 (+1302)
172.85 (+20.47)
- -
R-CFW
(direct-loom
waste)
4961.7 (+1078)
32.04 (+5.86)
- -
Kaynak reference
[34] - 840 - -
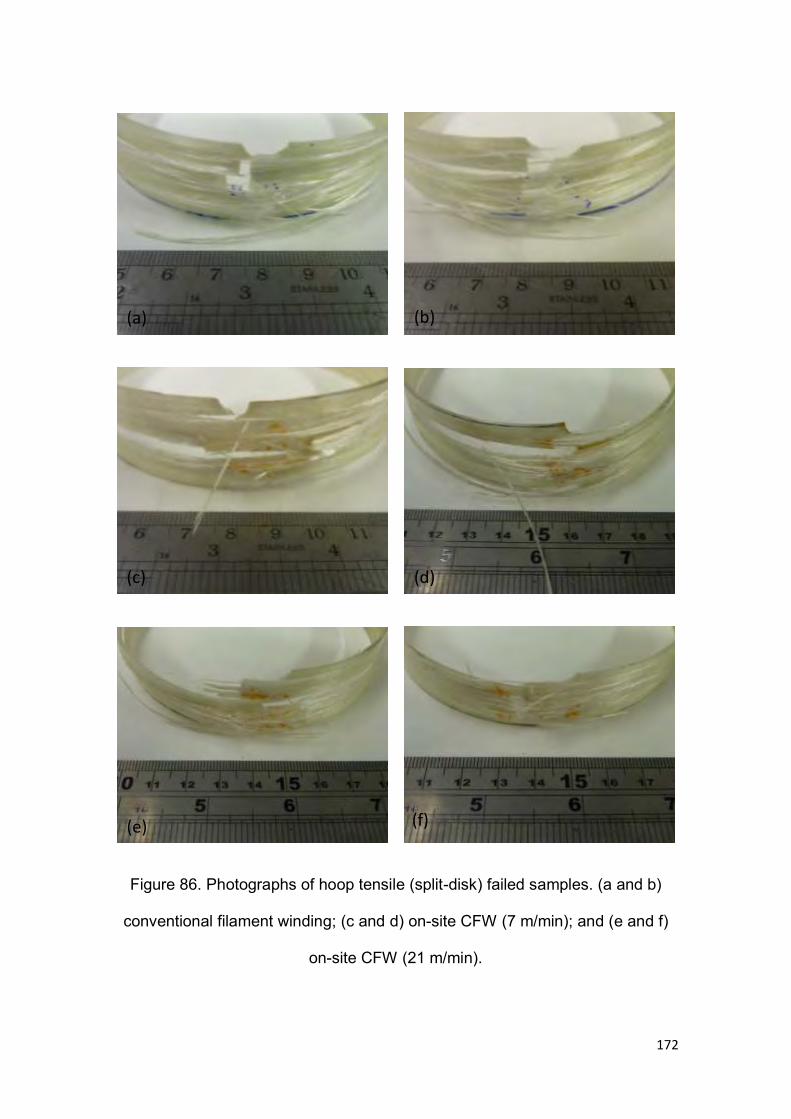
172
Figure 86. Photographs of hoop tensile (split-disk) failed samples. (a and b)
conventional filament winding; (c and d) on-site CFW (7 m/min); and (e and f)
on-site CFW (21 m/min).
(a) (b)
(c) (d)
(e) (f)
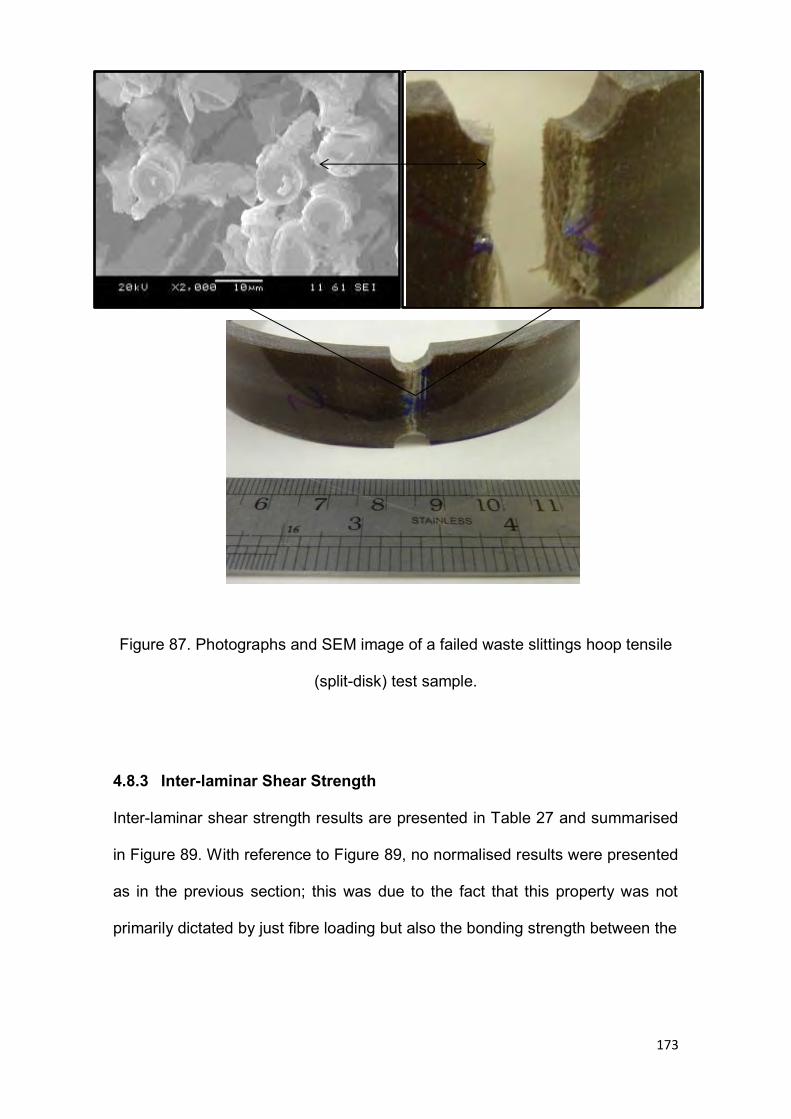
173
Figure 87. Photographs and SEM image of a failed waste slittings hoop tensile
(split-disk) test sample.
4.8.3 Inter-laminar Shear Strength
Inter-laminar shear strength results are presented in Table 27 and summarised
in Figure 89. With reference to Figure 89, no normalised results were presented
as in the previous section; this was due to the fact that this property was not
primarily dictated by just fibre loading but also the bonding strength between the
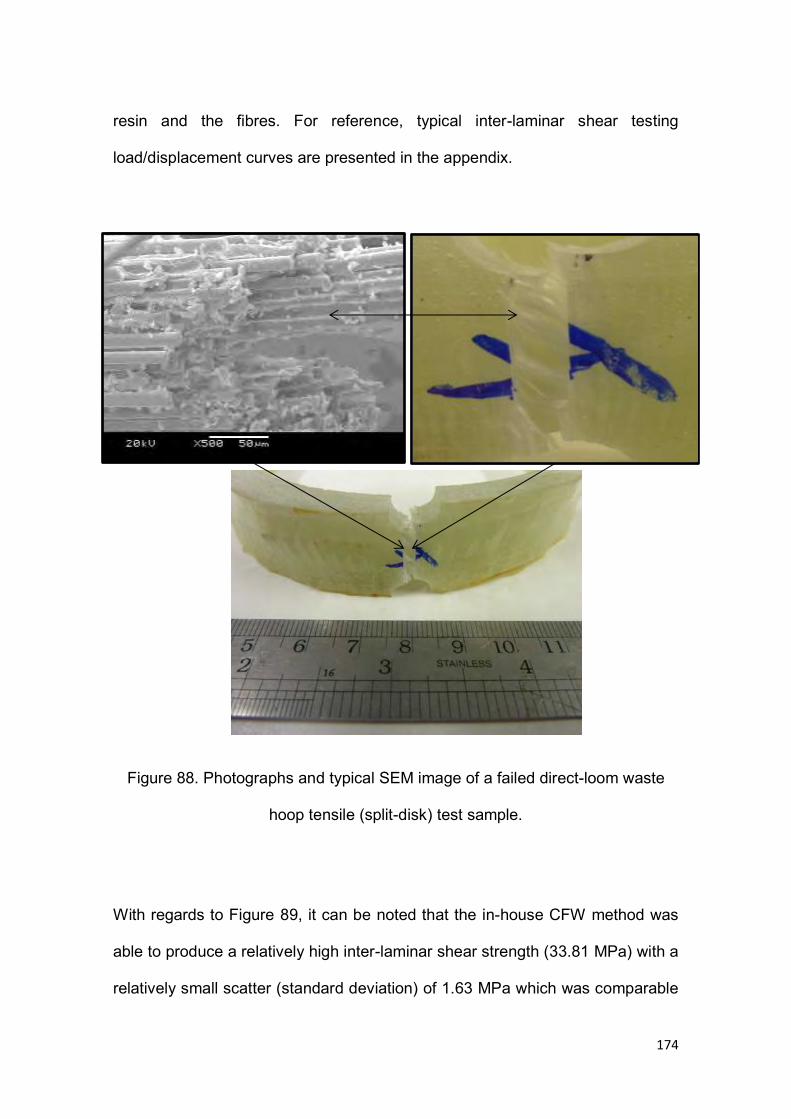
174
resin and the fibres. For reference, typical inter-laminar shear testing
load/displacement curves are presented in the appendix.
Figure 88. Photographs and typical SEM image of a failed direct-loom waste
hoop tensile (split-disk) test sample.
With regards to Figure 89, it can be noted that the in-house CFW method was
able to produce a relatively high inter-laminar shear strength (33.81 MPa) with a
relatively small scatter (standard deviation) of 1.63 MPa which was comparable
175
to that presented as reference data in Section 2.1. Here a reference value for a
carbon-fibre sample was defined as ~ 60 MPa, however owing to the
considerable strength differences between glass- and carbon-fibre, it was
concluded that the presented 33.81 MPa inter-laminar shear strength was
acceptable. For reference, a typical load/displacement curve of an in-house
CFW tube is presented in Appendix B.
To further reinforce the above point, it can also be noted that the CFW method
was able to produce an inter-laminar shear strength which was higher than the
upper limit of the 95% confidence interval (26.72 to 31.86 MPa) offered by the
conventional method. These results were attributed to the use of: (i) the resin
impregnation unit; and (ii) the fibre spreading station. It was postulated that both
of these facilities aided in achieving efficient tow impregnation (<1% void
content); this then produced a high degree of bonding between the multiple
glass-fibre layers.
Figure 89 also presents the inter-laminar shear strength results of the on-site
CFW method. Here, relatively high strengths of 26.11 MPa (+2.25) and 24.14
MPa (+2.51) were produced for the 7 m/min and the 21 m/min winding speeds
respectively. These results confirmed that the CFW method was able to offer
comparable inter-laminar shear strengths both on-site and in-house.
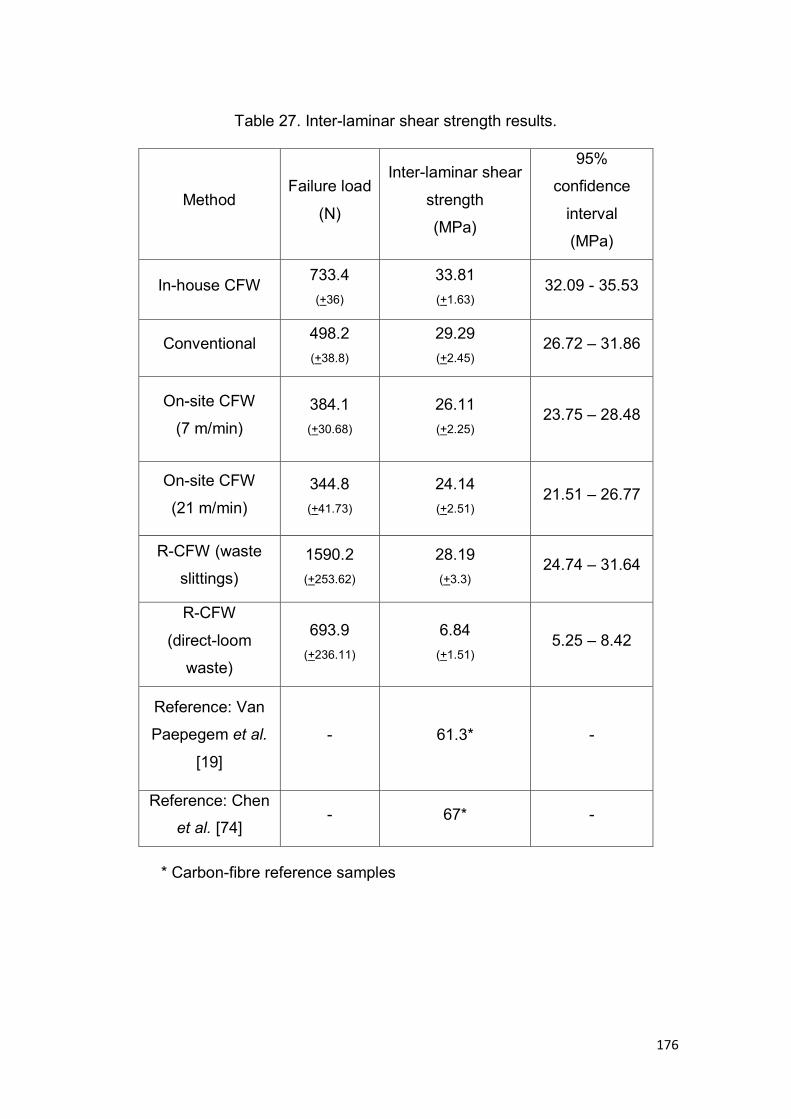
176
Table 27. Inter-laminar shear strength results.
Method Failure load
(N)
Inter-laminar shear
strength
(MPa)
95%
confidence
interval
(MPa)
In-house CFW 733.4 (+36)
33.81 (+1.63)
32.09 - 35.53
Conventional 498.2 (+38.8)
29.29 (+2.45)
26.72 – 31.86
On-site CFW
(7 m/min) 384.1 (+30.68)
26.11 (+2.25)
23.75 – 28.48
On-site CFW
(21 m/min) 344.8 (+41.73)
24.14 (+2.51)
21.51 – 26.77
R-CFW (waste
slittings) 1590.2 (+253.62)
28.19 (+3.3)
24.74 – 31.64
R-CFW
(direct-loom
waste)
693.9 (+236.11)
6.84 (+1.51)
5.25 – 8.42
Reference: Van
Paepegem et al.
[19]
- 61.3* -
Reference: Chen
et al. [74] - 67* -
* Carbon-fibre reference samples
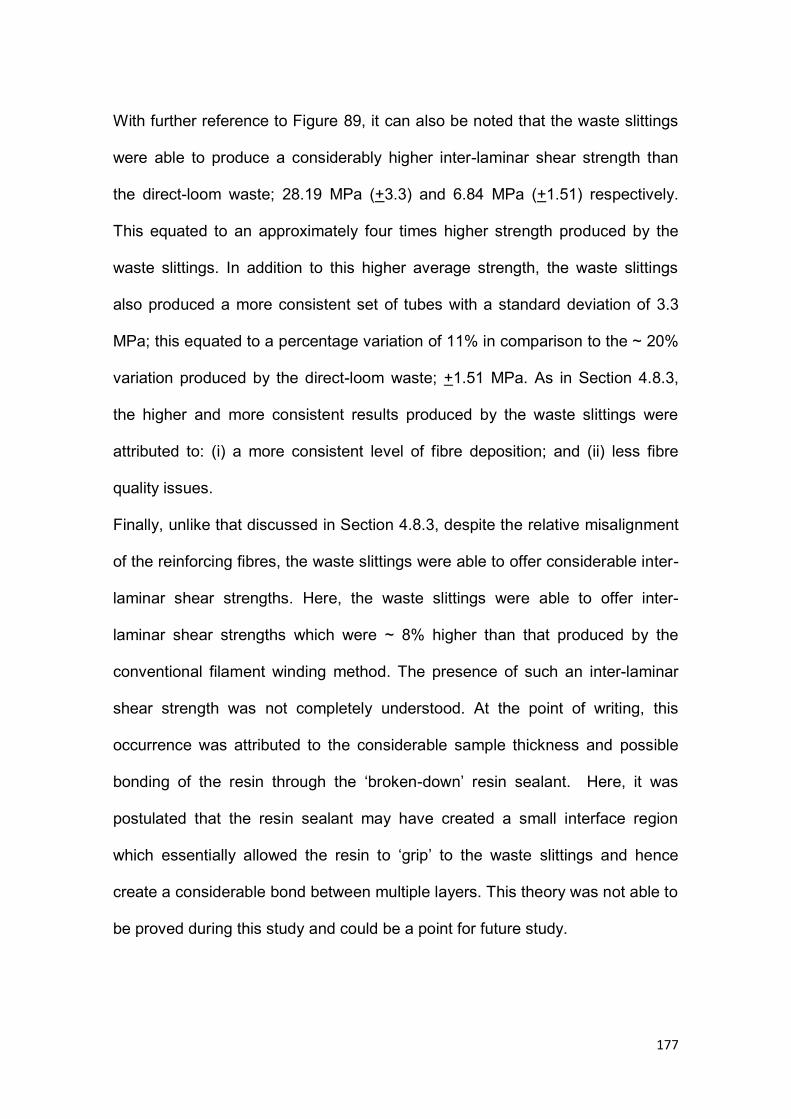
177
With further reference to Figure 89, it can also be noted that the waste slittings
were able to produce a considerably higher inter-laminar shear strength than
the direct-loom waste; 28.19 MPa (+3.3) and 6.84 MPa (+1.51) respectively.
This equated to an approximately four times higher strength produced by the
waste slittings. In addition to this higher average strength, the waste slittings
also produced a more consistent set of tubes with a standard deviation of 3.3
MPa; this equated to a percentage variation of 11% in comparison to the ~ 20%
variation produced by the direct-loom waste; +1.51 MPa. As in Section 4.8.3,
the higher and more consistent results produced by the waste slittings were
attributed to: (i) a more consistent level of fibre deposition; and (ii) less fibre
quality issues.
Finally, unlike that discussed in Section 4.8.3, despite the relative misalignment
of the reinforcing fibres, the waste slittings were able to offer considerable inter-
laminar shear strengths. Here, the waste slittings were able to offer inter-
laminar shear strengths which were ~ 8% higher than that produced by the
conventional filament winding method. The presence of such an inter-laminar
shear strength was not completely understood. At the point of writing, this
occurrence was attributed to the considerable sample thickness and possible
bonding of the resin through the ‘broken-down’ resin sealant. Here, it was
postulated that the resin sealant may have created a small interface region
which essentially allowed the resin to ‘grip’ to the waste slittings and hence
create a considerable bond between multiple layers. This theory was not able to
be proved during this study and could be a point for future study.
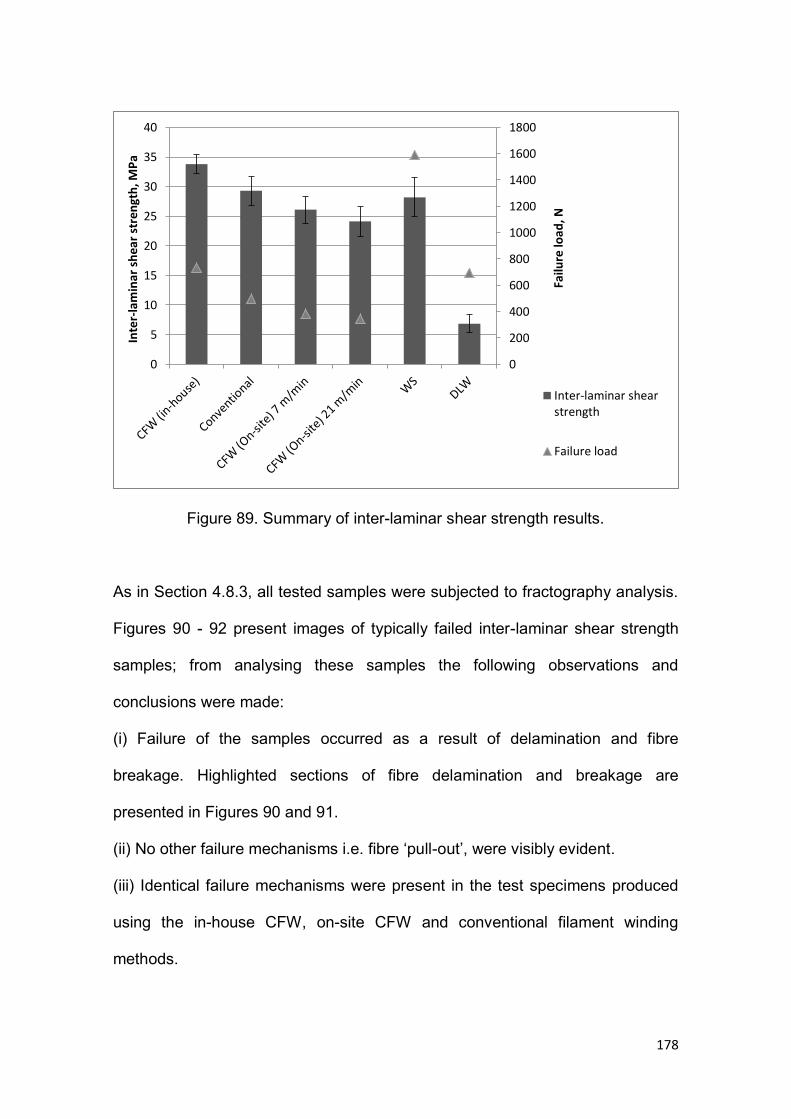
178
Figure 89. Summary of inter-laminar shear strength results.
As in Section 4.8.3, all tested samples were subjected to fractography analysis.
Figures 90 - 92 present images of typically failed inter-laminar shear strength
samples; from analysing these samples the following observations and
conclusions were made:
(i) Failure of the samples occurred as a result of delamination and fibre
breakage. Highlighted sections of fibre delamination and breakage are
presented in Figures 90 and 91.
(ii) No other failure mechanisms i.e. fibre ‘pull-out’, were visibly evident.
(iii) Identical failure mechanisms were present in the test specimens produced
using the in-house CFW, on-site CFW and conventional filament winding
methods.
0
200
400
600
800
1000
1200
1400
1600
1800
0
5
10
15
20
25
30
35
40
Failu
re lo
ad
, N
Inte
r-la
min
ar s
hea
r st
ren
gth
, MP
a
Inter-laminar shearstrength
Failure load
179
(iv) The non-uniform nature of the DLW samples can be seen in Figure 92.
Here, it can be noticed that sample failure did not occur in a straight line in the
loading direction (as in Figures 90 and 91) and in fact many of the fibres were
loaded and failed in +0o, +45o and +90o orientations.
Figure 90. Photographs of inter-laminar shear failed samples; in-house CFW
samples. The highlighted section (A) are areas of delamination.
4.8.4 Lateral Compression Strength
Table 28 and Figure 93 present a summary of the lateral compression strength
results. Here, it should be noted that lateral compression strength results for the
cardboard tubes discussed in Section 4.3 were presented and typical
load/displacement curves are presented in the appendix.
From studying Figure 93, it can be noted that the in-house CFW method was
able to produce considerably high lateral compression strengths. Here, the
average strength was 18.49 MPa and the scatter (standard deviation) was just
0.84 MPa; this small scatter equated to a variation of just approximately 5%. For
(a) (b)
A
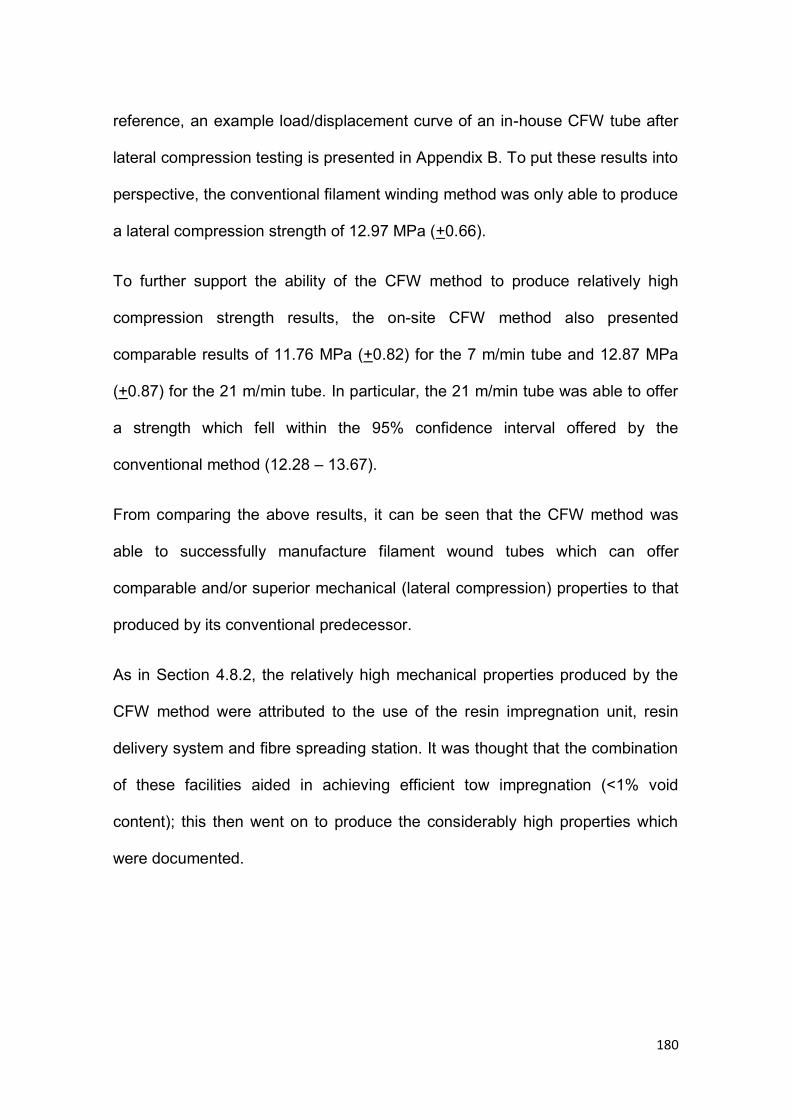
180
reference, an example load/displacement curve of an in-house CFW tube after
lateral compression testing is presented in Appendix B. To put these results into
perspective, the conventional filament winding method was only able to produce
a lateral compression strength of 12.97 MPa (+0.66).
To further support the ability of the CFW method to produce relatively high
compression strength results, the on-site CFW method also presented
comparable results of 11.76 MPa (+0.82) for the 7 m/min tube and 12.87 MPa
(+0.87) for the 21 m/min tube. In particular, the 21 m/min tube was able to offer
a strength which fell within the 95% confidence interval offered by the
conventional method (12.28 – 13.67).
From comparing the above results, it can be seen that the CFW method was
able to successfully manufacture filament wound tubes which can offer
comparable and/or superior mechanical (lateral compression) properties to that
produced by its conventional predecessor.
As in Section 4.8.2, the relatively high mechanical properties produced by the
CFW method were attributed to the use of the resin impregnation unit, resin
delivery system and fibre spreading station. It was thought that the combination
of these facilities aided in achieving efficient tow impregnation (<1% void
content); this then went on to produce the considerably high properties which
were documented.
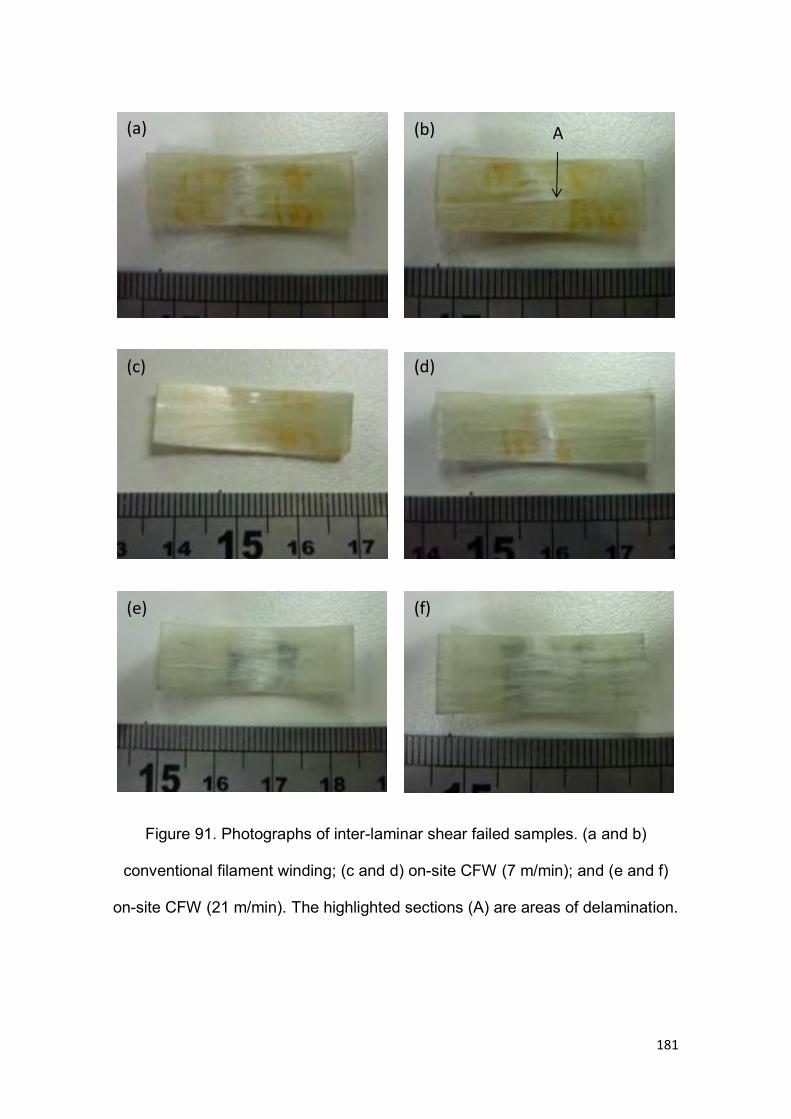
181
Figure 91. Photographs of inter-laminar shear failed samples. (a and b)
conventional filament winding; (c and d) on-site CFW (7 m/min); and (e and f)
on-site CFW (21 m/min). The highlighted sections (A) are areas of delamination.
(a)
(d) (c)
(f) (e)
(b) A
182
Figure 92. Photographs of inter-laminar shear failed samples; (a and b) R-CFW
(waste slittings) samples; and (c and d) R-CFW (direct-loom waste) samples.
In a similar fashion to that discussed in multiple sections above, the waste
slittings were also able to produce considerably higher mechanical properties
than the direct-loom waste; 7.07 MPa (+0.59) and 2.14 MPa (+0.27)
respectively. This equated to an approximately three times higher strength
produced by the waste slittings. As in Sections 4.8.2 and 4.8.3, the higher and
more consistent results produced by the waste slittings were attributed to: (i) a
more consistent level of fibre deposition; and (ii) fewer fibre quality variations.
(a) (b)
(c) (d)
183
Finally, in addition to the above comparisons, the waste slitting tubes were also
shown to offer considerably higher strengths than the cardboard tubes which
were also presented in Figure 93. Here, it can be seen that the waste slittings
tubes were able to offer lateral compression strengths which were
approximately seventeen times stronger than the comparative cardboard tubes.
The considerably higher mechanical properties provided by the waste slittings
over the cardboard tubes aided in satisfying the criteria outlined in Section 4.3.
Figures 94 - 96 present typical images of fractured lateral compression
samples. From analysing these figures, the following fractography observations
and conclusions were made:
(i) Sample failure occurred as a result of fibre delamination. Highlighted sections
of fibre delamination are presented in multiple figures below.
(ii) No other failure mechanisms i.e. fibre ‘pull-out’ or breakage, were visibly
evident.
(iii) Fibre failure occurred at the extreme edges i.e. east and west edges, of the
sample. Figure 97 presents clarification of the observed sites of failure.
(iv) From reviewing Figures 94 - 96, it was concluded that identical failure
mechanisms were present. This similarity confirmed that the CFW and R-CFW
methods were able to produce filament wound tubes which could offer
comparable lateral compression loading characteristics.
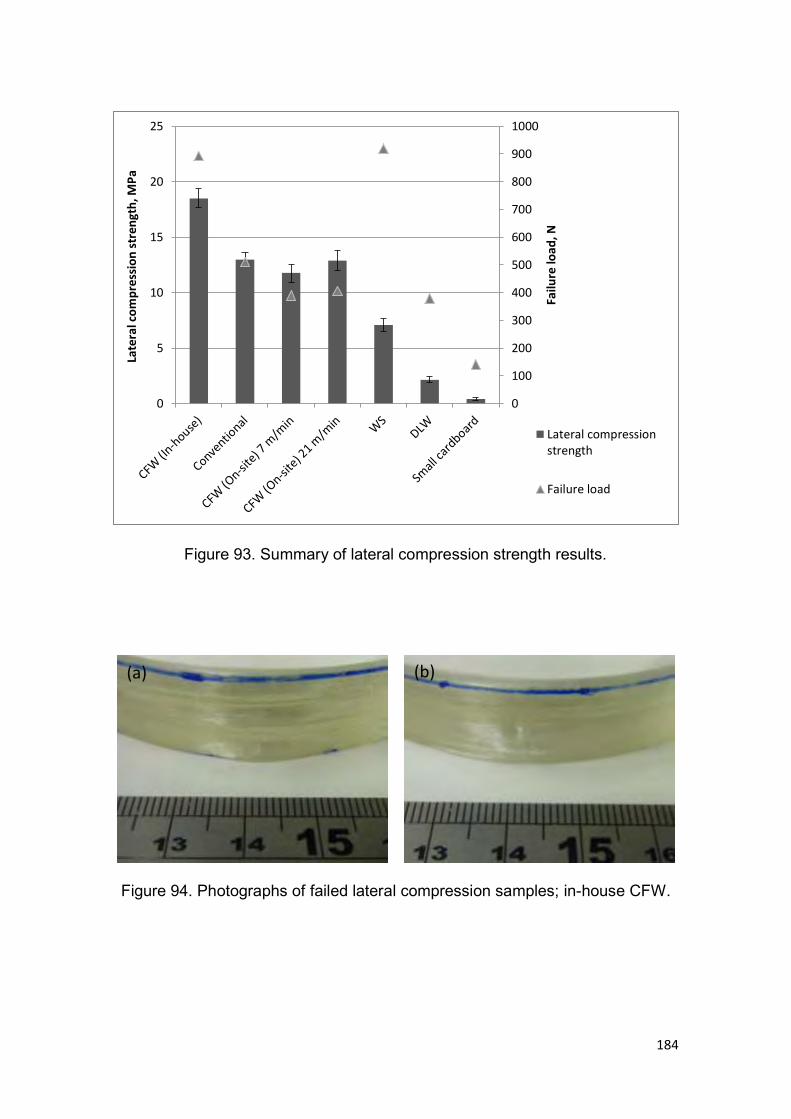
184
Figure 93. Summary of lateral compression strength results.
Figure 94. Photographs of failed lateral compression samples; in-house CFW.
0
100
200
300
400
500
600
700
800
900
1000
0
5
10
15
20
25
Failu
re lo
ad
, N
Late
ral c
om
pre
ssio
n s
tren
gth
, MP
a
Lateral compressionstrength
Failure load
(a) (b)
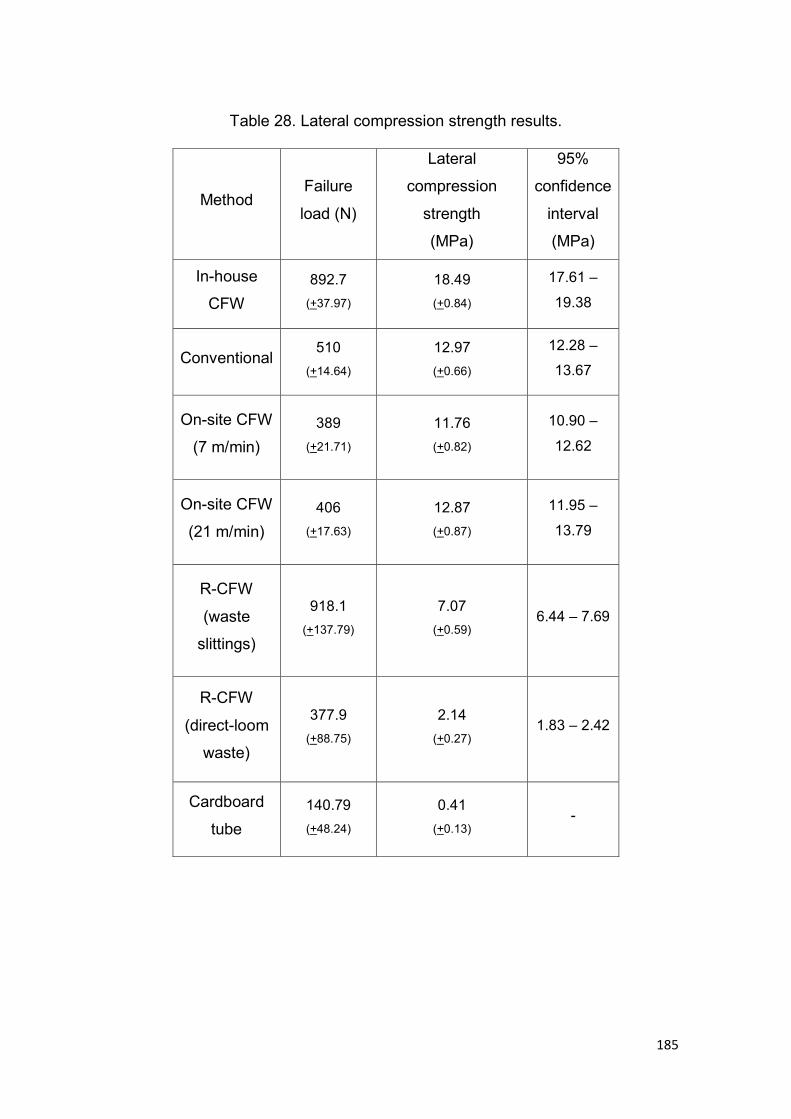
185
Table 28. Lateral compression strength results.
Method Failure
load (N)
Lateral
compression
strength
(MPa)
95%
confidence
interval
(MPa)
In-house
CFW 892.7
(+37.97)
18.49 (+0.84)
17.61 –
19.38
Conventional 510
(+14.64)
12.97 (+0.66)
12.28 –
13.67
On-site CFW
(7 m/min) 389
(+21.71) 11.76 (+0.82)
10.90 –
12.62
On-site CFW
(21 m/min) 406
(+17.63) 12.87 (+0.87)
11.95 –
13.79
R-CFW
(waste
slittings)
918.1 (+137.79)
7.07 (+0.59)
6.44 – 7.69
R-CFW
(direct-loom
waste)
377.9 (+88.75)
2.14 (+0.27)
1.83 – 2.42
Cardboard
tube 140.79 (+48.24)
0.41 (+0.13)
-
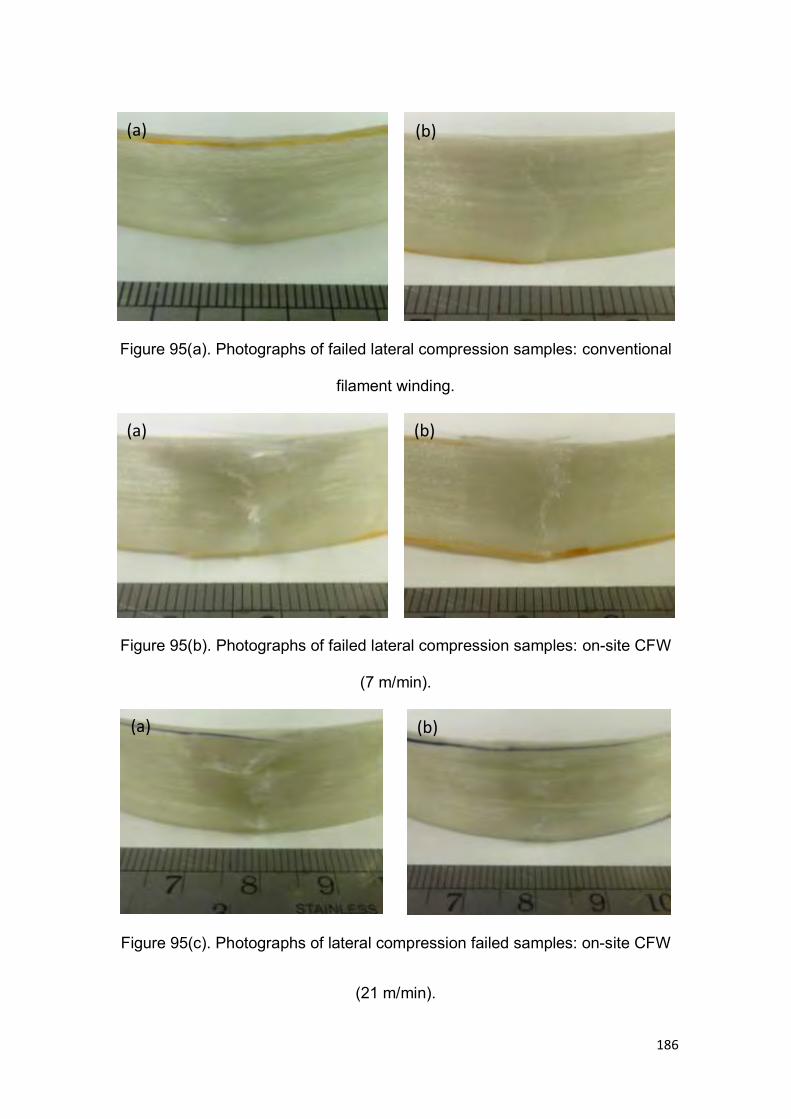
186
Figure 95(a). Photographs of failed lateral compression samples: conventional
filament winding.
Figure 95(b). Photographs of failed lateral compression samples: on-site CFW
(7 m/min).
Figure 95(c). Photographs of lateral compression failed samples: on-site CFW
(21 m/min).
(a)
(a) (b)
(a) (b)
(b)
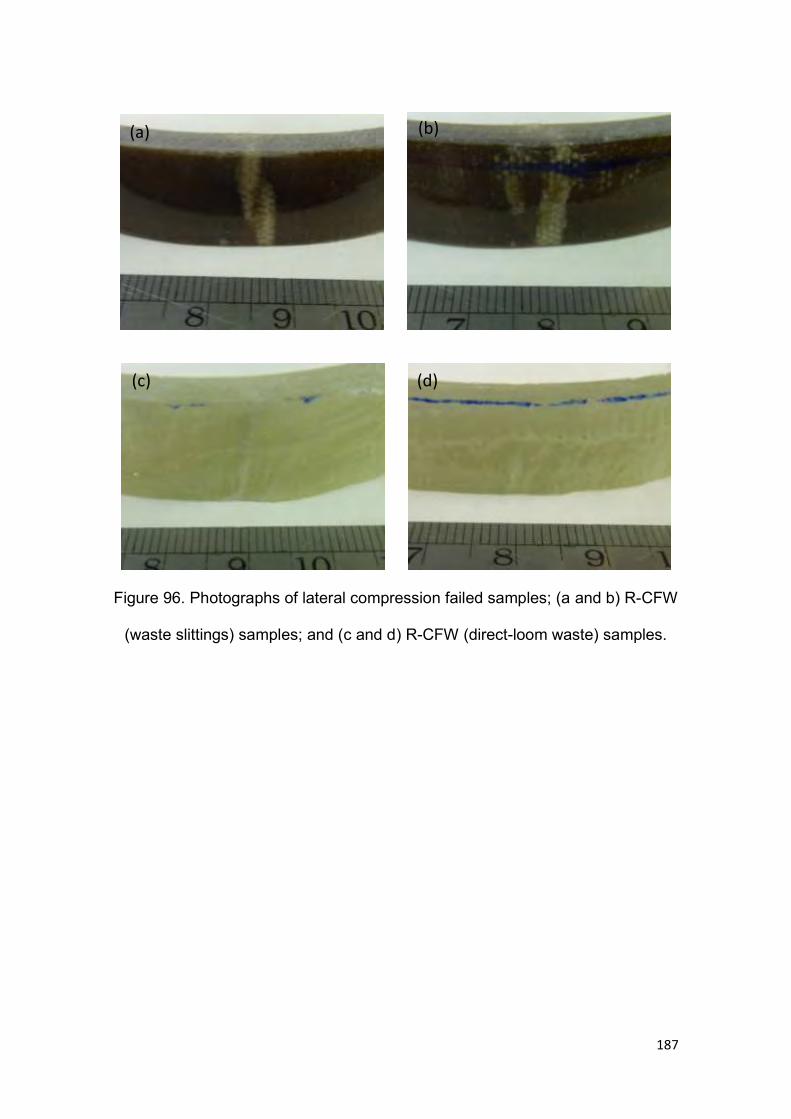
187
Figure 96. Photographs of lateral compression failed samples; (a and b) R-CFW
(waste slittings) samples; and (c and d) R-CFW (direct-loom waste) samples.
(a) (b)
(c) (d)
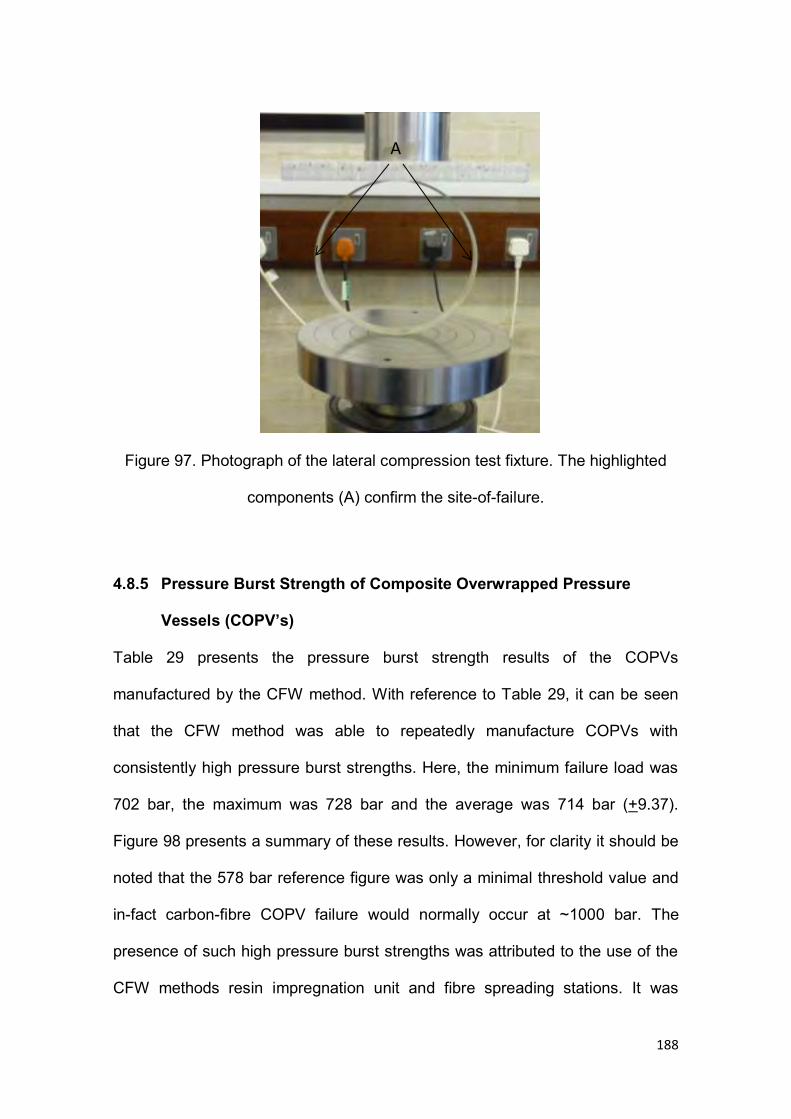
188
Figure 97. Photograph of the lateral compression test fixture. The highlighted
components (A) confirm the site-of-failure.
4.8.5 Pressure Burst Strength of Composite Overwrapped Pressure
Vessels (COPV’s)
Table 29 presents the pressure burst strength results of the COPVs
manufactured by the CFW method. With reference to Table 29, it can be seen
that the CFW method was able to repeatedly manufacture COPVs with
consistently high pressure burst strengths. Here, the minimum failure load was
702 bar, the maximum was 728 bar and the average was 714 bar (+9.37).
Figure 98 presents a summary of these results. However, for clarity it should be
noted that the 578 bar reference figure was only a minimal threshold value and
in-fact carbon-fibre COPV failure would normally occur at ~1000 bar. The
presence of such high pressure burst strengths was attributed to the use of the
CFW methods resin impregnation unit and fibre spreading stations. It was
A
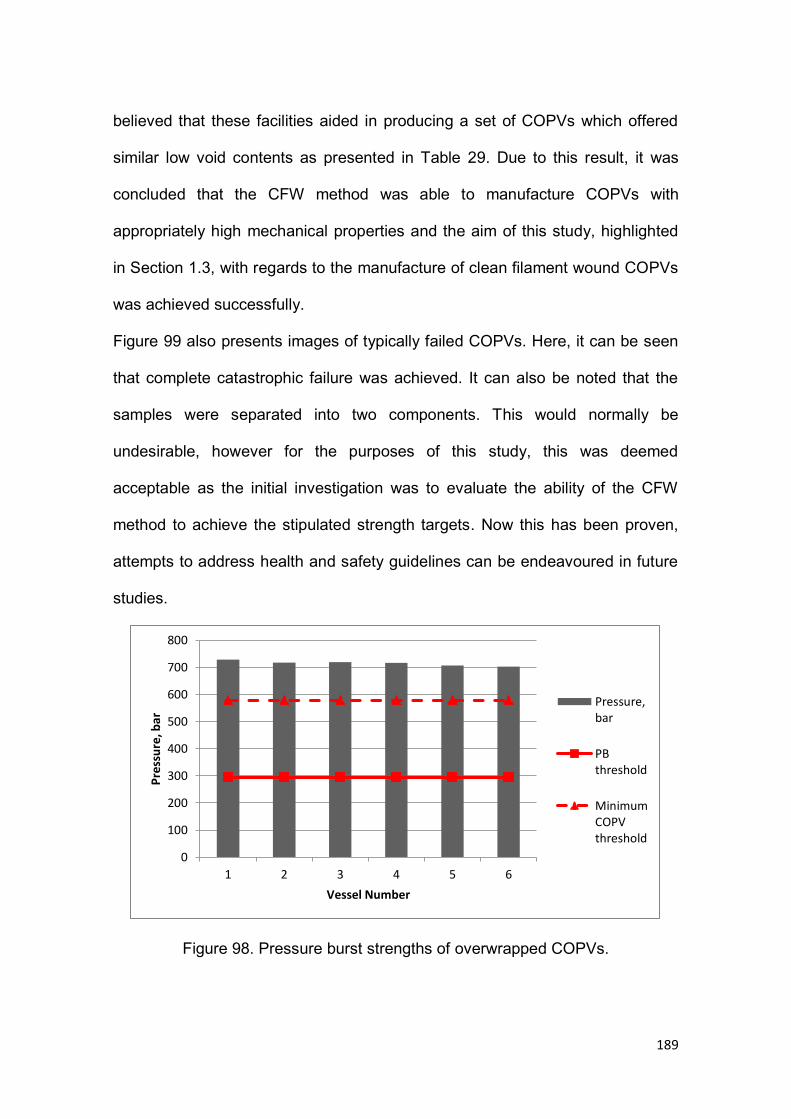
189
believed that these facilities aided in producing a set of COPVs which offered
similar low void contents as presented in Table 29. Due to this result, it was
concluded that the CFW method was able to manufacture COPVs with
appropriately high mechanical properties and the aim of this study, highlighted
in Section 1.3, with regards to the manufacture of clean filament wound COPVs
was achieved successfully.
Figure 99 also presents images of typically failed COPVs. Here, it can be seen
that complete catastrophic failure was achieved. It can also be noted that the
samples were separated into two components. This would normally be
undesirable, however for the purposes of this study, this was deemed
acceptable as the initial investigation was to evaluate the ability of the CFW
method to achieve the stipulated strength targets. Now this has been proven,
attempts to address health and safety guidelines can be endeavoured in future
studies.
Figure 98. Pressure burst strengths of overwrapped COPVs.
0
100
200
300
400
500
600
700
800
1 2 3 4 5 6
Pre
ssu
re, b
ar
Vessel Number
Pressure,bar
PBthreshold
MinimumCOPVthreshold
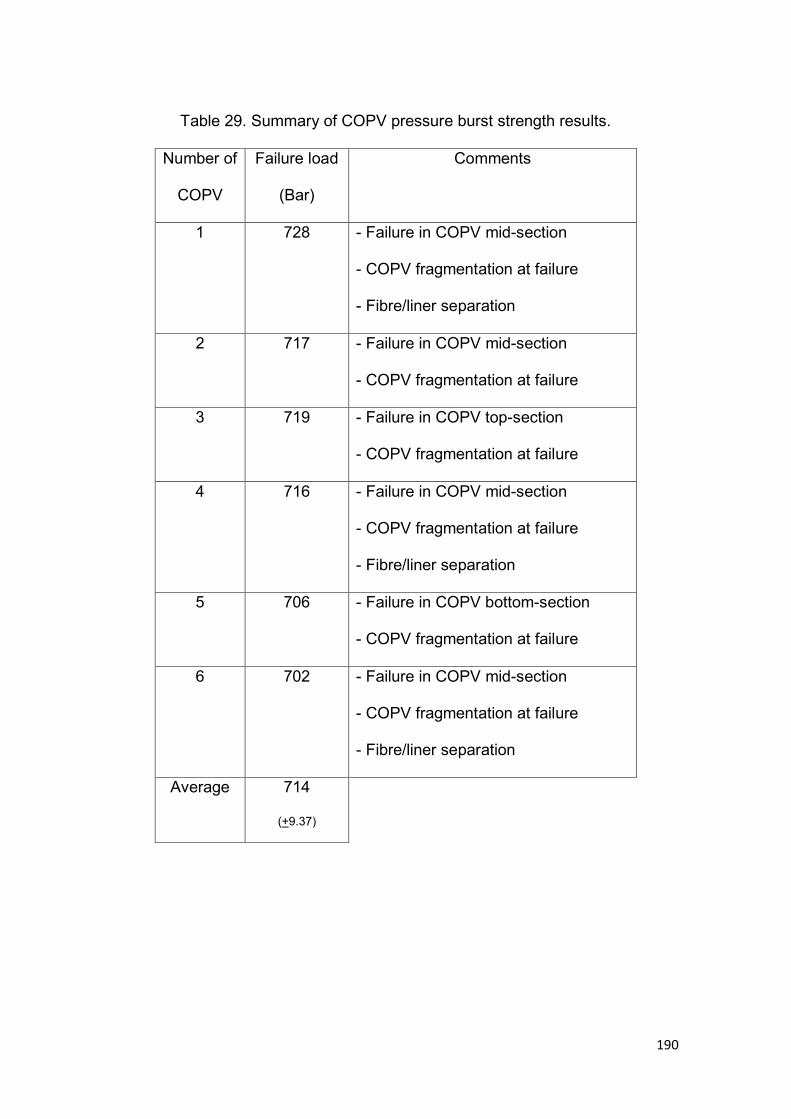
190
Table 29. Summary of COPV pressure burst strength results.
Number of
COPV
Failure load
(Bar)
Comments
1 728 - Failure in COPV mid-section
- COPV fragmentation at failure
- Fibre/liner separation
2 717 - Failure in COPV mid-section
- COPV fragmentation at failure
3 719 - Failure in COPV top-section
- COPV fragmentation at failure
4 716 - Failure in COPV mid-section
- COPV fragmentation at failure
- Fibre/liner separation
5 706 - Failure in COPV bottom-section
- COPV fragmentation at failure
6 702 - Failure in COPV mid-section
- COPV fragmentation at failure
- Fibre/liner separation
Average 714
(+9.37)
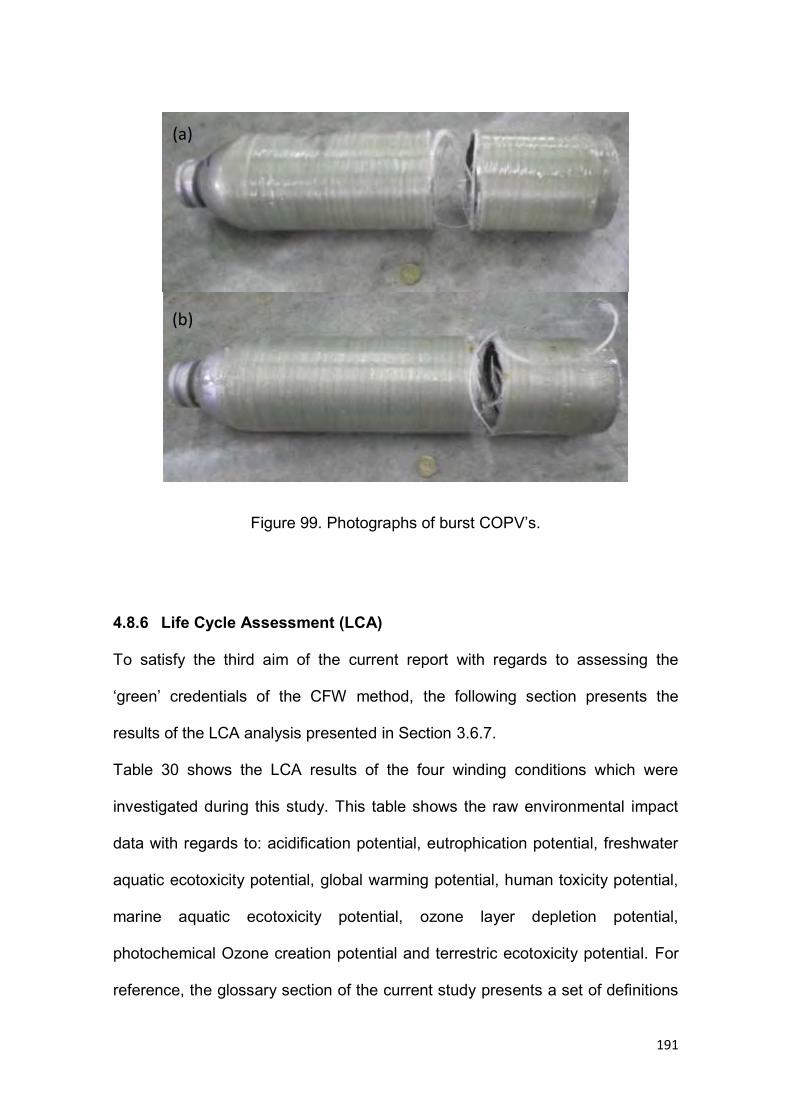
191
Figure 99. Photographs of burst COPV’s.
4.8.6 Life Cycle Assessment (LCA)
To satisfy the third aim of the current report with regards to assessing the
‘green’ credentials of the CFW method, the following section presents the
results of the LCA analysis presented in Section 3.6.7.
Table 30 shows the LCA results of the four winding conditions which were
investigated during this study. This table shows the raw environmental impact
data with regards to: acidification potential, eutrophication potential, freshwater
aquatic ecotoxicity potential, global warming potential, human toxicity potential,
marine aquatic ecotoxicity potential, ozone layer depletion potential,
photochemical Ozone creation potential and terrestric ecotoxicity potential. For
reference, the glossary section of the current study presents a set of definitions
(a)
(b)
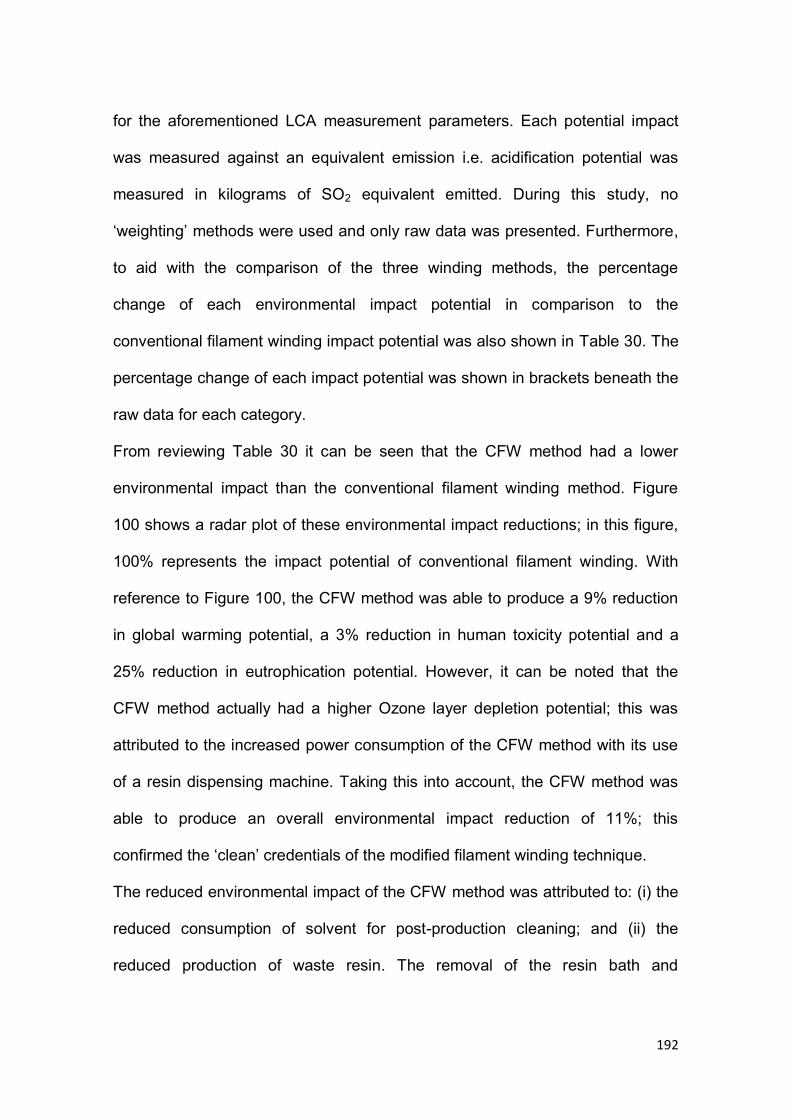
192
for the aforementioned LCA measurement parameters. Each potential impact
was measured against an equivalent emission i.e. acidification potential was
measured in kilograms of SO2 equivalent emitted. During this study, no
‘weighting’ methods were used and only raw data was presented. Furthermore,
to aid with the comparison of the three winding methods, the percentage
change of each environmental impact potential in comparison to the
conventional filament winding impact potential was also shown in Table 30. The
percentage change of each impact potential was shown in brackets beneath the
raw data for each category.
From reviewing Table 30 it can be seen that the CFW method had a lower
environmental impact than the conventional filament winding method. Figure
100 shows a radar plot of these environmental impact reductions; in this figure,
100% represents the impact potential of conventional filament winding. With
reference to Figure 100, the CFW method was able to produce a 9% reduction
in global warming potential, a 3% reduction in human toxicity potential and a
25% reduction in eutrophication potential. However, it can be noted that the
CFW method actually had a higher Ozone layer depletion potential; this was
attributed to the increased power consumption of the CFW method with its use
of a resin dispensing machine. Taking this into account, the CFW method was
able to produce an overall environmental impact reduction of 11%; this
confirmed the ‘clean’ credentials of the modified filament winding technique.
The reduced environmental impact of the CFW method was attributed to: (i) the
reduced consumption of solvent for post-production cleaning; and (ii) the
reduced production of waste resin. The removal of the resin bath and
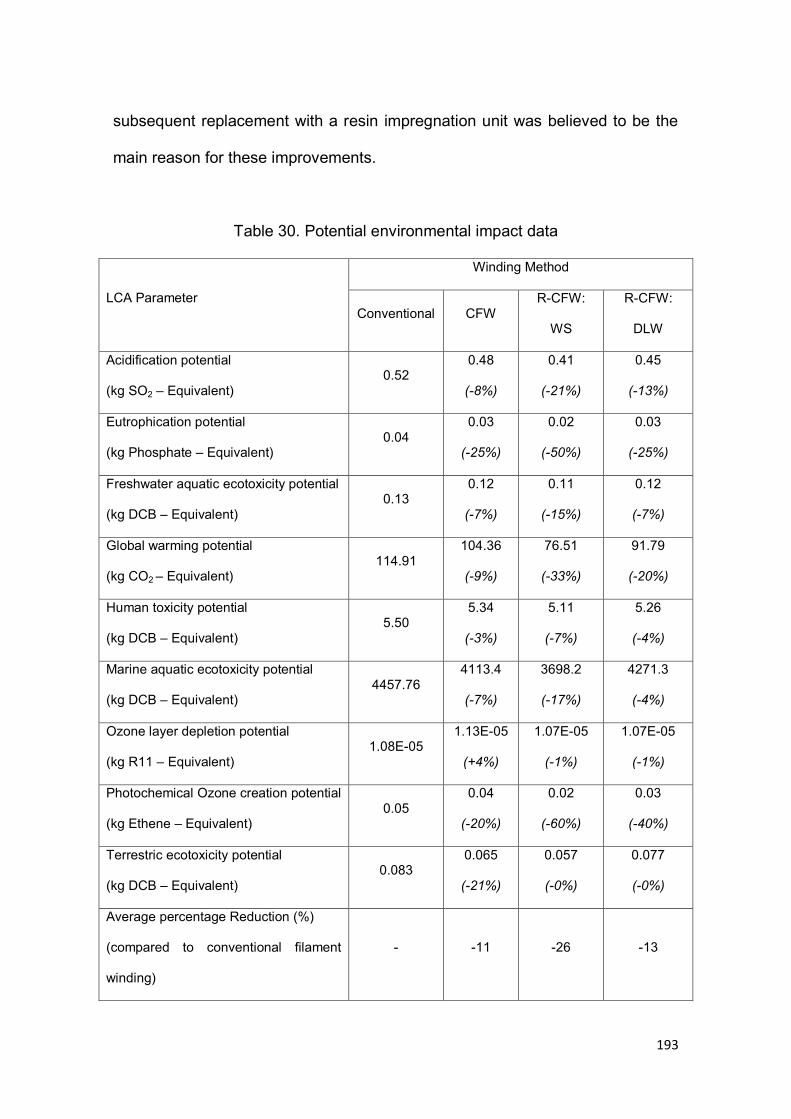
193
subsequent replacement with a resin impregnation unit was believed to be the
main reason for these improvements.
Table 30. Potential environmental impact data
LCA Parameter
Winding Method
Conventional CFW R-CFW:
WS
R-CFW:
DLW
Acidification potential
(kg SO2 – Equivalent) 0.52
0.48
(-8%)
0.41
(-21%)
0.45
(-13%)
Eutrophication potential
(kg Phosphate – Equivalent) 0.04
0.03
(-25%)
0.02
(-50%)
0.03
(-25%)
Freshwater aquatic ecotoxicity potential
(kg DCB – Equivalent) 0.13
0.12
(-7%)
0.11
(-15%)
0.12
(-7%)
Global warming potential
(kg CO2 – Equivalent) 114.91
104.36
(-9%)
76.51
(-33%)
91.79
(-20%)
Human toxicity potential
(kg DCB – Equivalent) 5.50
5.34
(-3%)
5.11
(-7%)
5.26
(-4%)
Marine aquatic ecotoxicity potential
(kg DCB – Equivalent) 4457.76
4113.4
(-7%)
3698.2
(-17%)
4271.3
(-4%)
Ozone layer depletion potential
(kg R11 – Equivalent) 1.08E-05
1.13E-05
(+4%)
1.07E-05
(-1%)
1.07E-05
(-1%)
Photochemical Ozone creation potential
(kg Ethene – Equivalent) 0.05
0.04
(-20%)
0.02
(-60%)
0.03
(-40%)
Terrestric ecotoxicity potential
(kg DCB – Equivalent) 0.083
0.065
(-21%)
0.057
(-0%)
0.077
(-0%)
Average percentage Reduction (%)
(compared to conventional filament
winding)
- -11 -26 -13
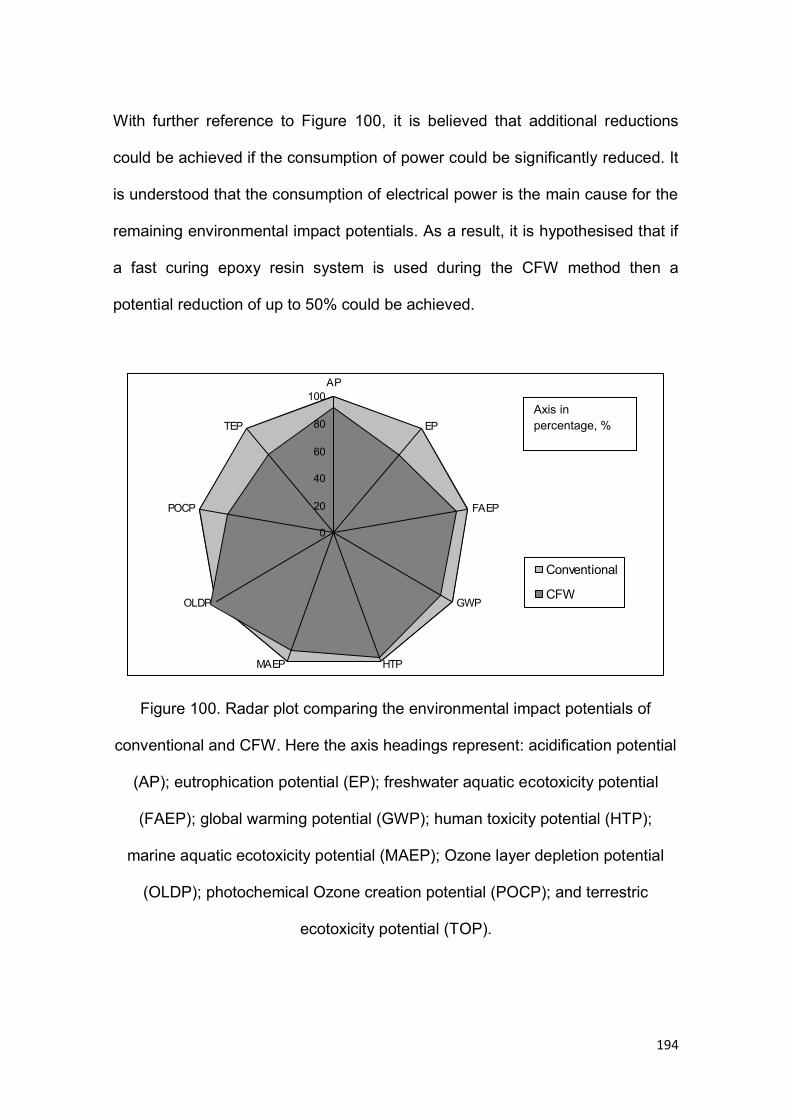
194
With further reference to Figure 100, it is believed that additional reductions
could be achieved if the consumption of power could be significantly reduced. It
is understood that the consumption of electrical power is the main cause for the
remaining environmental impact potentials. As a result, it is hypothesised that if
a fast curing epoxy resin system is used during the CFW method then a
potential reduction of up to 50% could be achieved.
Figure 100. Radar plot comparing the environmental impact potentials of
conventional and CFW. Here the axis headings represent: acidification potential
(AP); eutrophication potential (EP); freshwater aquatic ecotoxicity potential
(FAEP); global warming potential (GWP); human toxicity potential (HTP);
marine aquatic ecotoxicity potential (MAEP); Ozone layer depletion potential
(OLDP); photochemical Ozone creation potential (POCP); and terrestric
ecotoxicity potential (TOP).
0
20
40
60
80
100AP
EP
FAEP
GWP
HTPMAEP
OLDP
POCP
TEP
Conventional
CFW
Axis in percentage, %
195
The results in Table 30 also show that the R-CFW method was able to extend
the CFW environmental reductions presented in Figure 100. In comparison to
conventional filament winding, the R-CFW method with waste slittings was able
to produce a 33%, 7% and 50% reduction in global warming potential, human
toxicity potential and eutrophication potential respectively (shown in Figure
101). As a result, the R-CFW method with waste slittings was able to produce
an overall reduction of 26%. Furthermore, in comparison to CFW the waste
slittings were able to produce a 27%, 33% and 50% reduction in global warming
potential, eutrophication potential and photochemical ozone creation potential
respectively. As a result, an overall reduction of 17% could be produced; this
confirmed that the use of recycled reinforcing fibres did reduce the
environmental impact of the CFW technology.
Figure 101. Radar plot comparing the environmental impact potentials of
conventional, CFW and R-CFW (waste slittings). The axis headings in this
figure are identical to those defined in Figure 100.
0
20
40
60
80
100AP
EP
FAEP
GWP
HTPMAEP
OLDP
POCP
TEP
ConventionalCFWR-CFW with Slittings
Axis in percentage, %
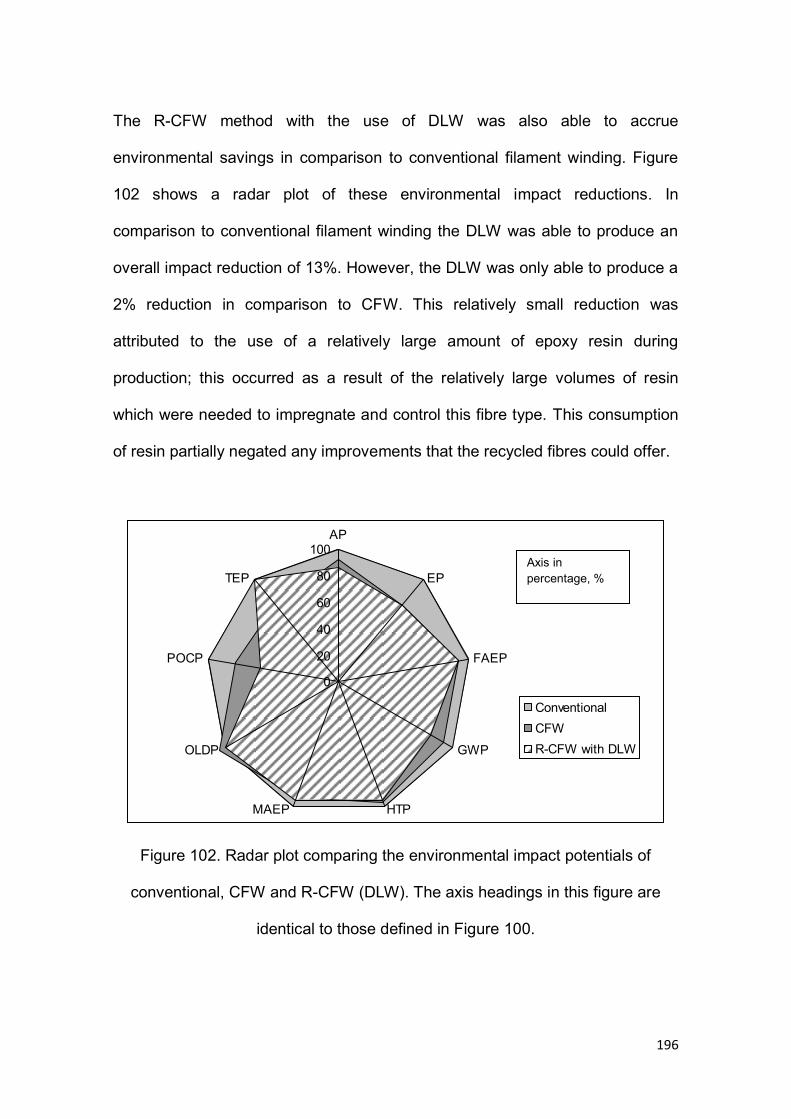
196
The R-CFW method with the use of DLW was also able to accrue
environmental savings in comparison to conventional filament winding. Figure
102 shows a radar plot of these environmental impact reductions. In
comparison to conventional filament winding the DLW was able to produce an
overall impact reduction of 13%. However, the DLW was only able to produce a
2% reduction in comparison to CFW. This relatively small reduction was
attributed to the use of a relatively large amount of epoxy resin during
production; this occurred as a result of the relatively large volumes of resin
which were needed to impregnate and control this fibre type. This consumption
of resin partially negated any improvements that the recycled fibres could offer.
Figure 102. Radar plot comparing the environmental impact potentials of
conventional, CFW and R-CFW (DLW). The axis headings in this figure are
identical to those defined in Figure 100.
0
20
40
60
80
100AP
EP
FAEP
GWP
HTPMAEP
OLDP
POCP
TEP
ConventionalCFWR-CFW with DLW
Axis in percentage, %
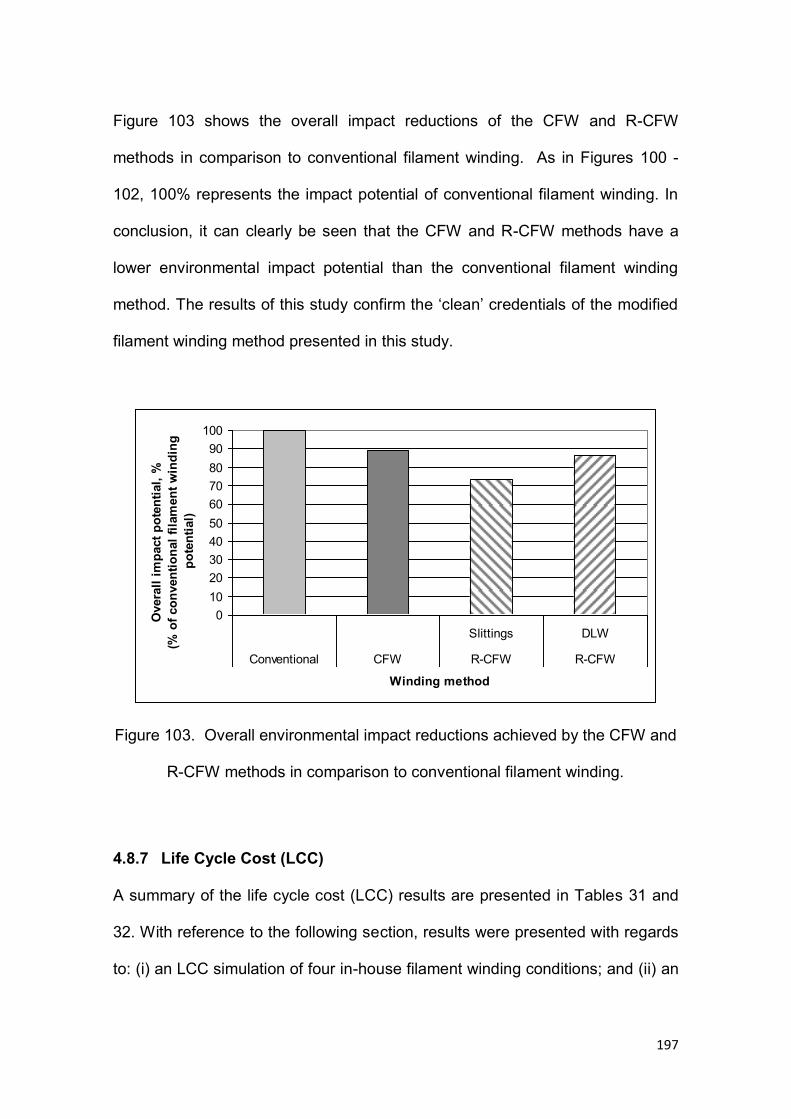
197
Figure 103 shows the overall impact reductions of the CFW and R-CFW
methods in comparison to conventional filament winding. As in Figures 100 -
102, 100% represents the impact potential of conventional filament winding. In
conclusion, it can clearly be seen that the CFW and R-CFW methods have a
lower environmental impact potential than the conventional filament winding
method. The results of this study confirm the ‘clean’ credentials of the modified
filament winding method presented in this study.
Figure 103. Overall environmental impact reductions achieved by the CFW and
R-CFW methods in comparison to conventional filament winding.
4.8.7 Life Cycle Cost (LCC)
A summary of the life cycle cost (LCC) results are presented in Tables 31 and
32. With reference to the following section, results were presented with regards
to: (i) an LCC simulation of four in-house filament winding conditions; and (ii) an
0102030405060708090
100
Slittings DLW
Conventional CFW R-CFW R-CFW
Winding method
Ove
rall
impa
ct p
oten
tial,
%(%
of c
onve
ntio
nal f
ilam
ent w
indi
ng
pote
ntia
l)
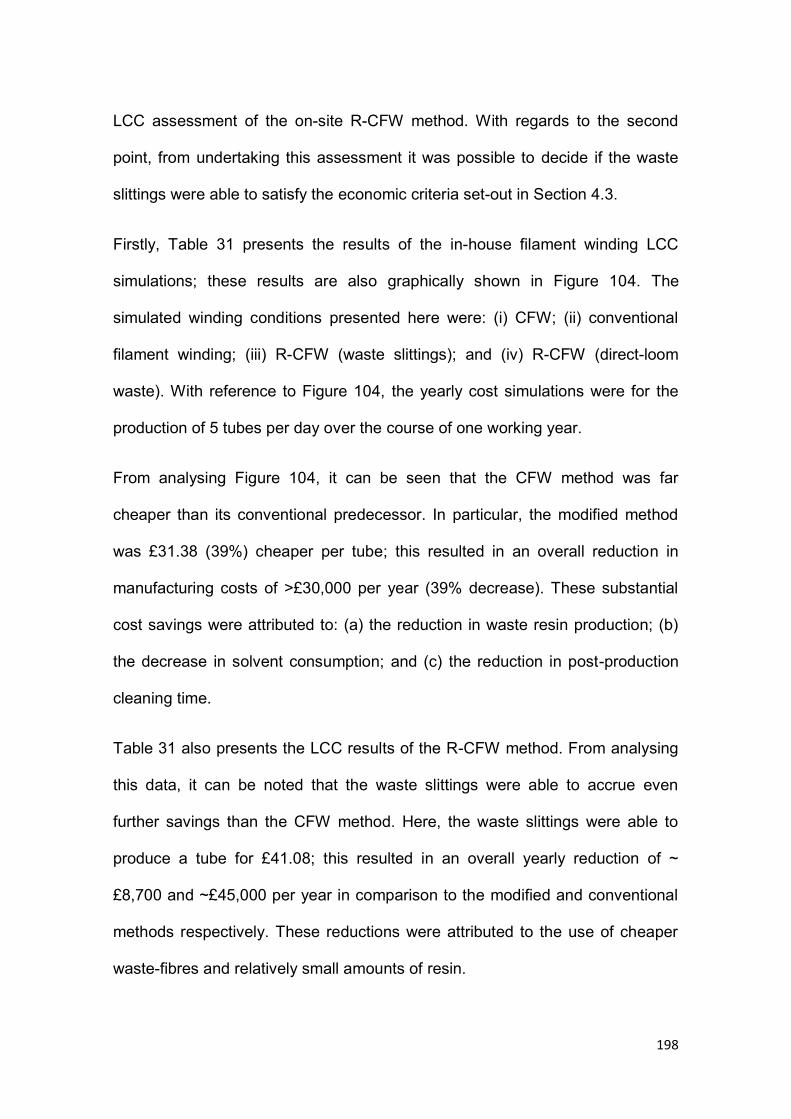
198
LCC assessment of the on-site R-CFW method. With regards to the second
point, from undertaking this assessment it was possible to decide if the waste
slittings were able to satisfy the economic criteria set-out in Section 4.3.
Firstly, Table 31 presents the results of the in-house filament winding LCC
simulations; these results are also graphically shown in Figure 104. The
simulated winding conditions presented here were: (i) CFW; (ii) conventional
filament winding; (iii) R-CFW (waste slittings); and (iv) R-CFW (direct-loom
waste). With reference to Figure 104, the yearly cost simulations were for the
production of 5 tubes per day over the course of one working year.
From analysing Figure 104, it can be seen that the CFW method was far
cheaper than its conventional predecessor. In particular, the modified method
was £31.38 (39%) cheaper per tube; this resulted in an overall reduction in
manufacturing costs of >£30,000 per year (39% decrease). These substantial
cost savings were attributed to: (a) the reduction in waste resin production; (b)
the decrease in solvent consumption; and (c) the reduction in post-production
cleaning time.
Table 31 also presents the LCC results of the R-CFW method. From analysing
this data, it can be noted that the waste slittings were able to accrue even
further savings than the CFW method. Here, the waste slittings were able to
produce a tube for £41.08; this resulted in an overall yearly reduction of ~
£8,700 and ~£45,000 per year in comparison to the modified and conventional
methods respectively. These reductions were attributed to the use of cheaper
waste-fibres and relatively small amounts of resin.
199
However, from further analysing Table 31, it can be noted that such savings
were not able to be produced by the direct-loom waste. The direct-loom waste
was only able to produce small savings in comparison to conventional filament
winding (~£10 per tube). Here, the relatively expensive production costs were
produced from the considerable consumption of resin during processing; the
need to over-impregnate these waste-fibres essentially negated any savings
which could be produced by the CFW method.
Table 31. Life cycle cost output data for the manufacture of a 3 meter filament
wound tube via: (i) in-house CFW; (ii) conventional filament winding; and (iii) in-
house R-CFW.
LCC parameter Winding method
CFW Conventional R-CFW
(WS)
R-CFW
(DLW)
Cost
(£/3 m tube)
48.38 79.73 41.08 69.52
Overall cost
(£/year)
95,679 58,056 49,296 83,424
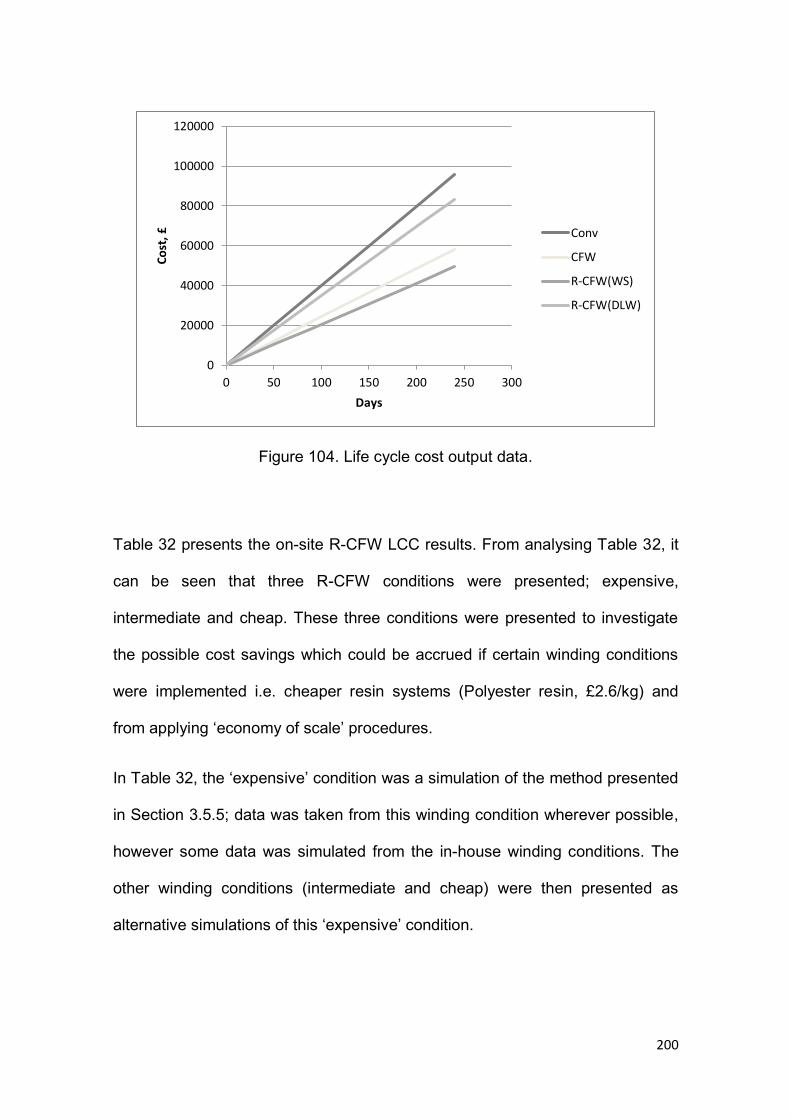
200
Figure 104. Life cycle cost output data.
Table 32 presents the on-site R-CFW LCC results. From analysing Table 32, it
can be seen that three R-CFW conditions were presented; expensive,
intermediate and cheap. These three conditions were presented to investigate
the possible cost savings which could be accrued if certain winding conditions
were implemented i.e. cheaper resin systems (Polyester resin, £2.6/kg) and
from applying ‘economy of scale’ procedures.
In Table 32, the ‘expensive’ condition was a simulation of the method presented
in Section 3.5.5; data was taken from this winding condition wherever possible,
however some data was simulated from the in-house winding conditions. The
other winding conditions (intermediate and cheap) were then presented as
alternative simulations of this ‘expensive’ condition.
0
20000
40000
60000
80000
100000
120000
0 50 100 150 200 250 300
Co
st, £
Days
Conv
CFW
R-CFW(WS)
R-CFW(DLW)
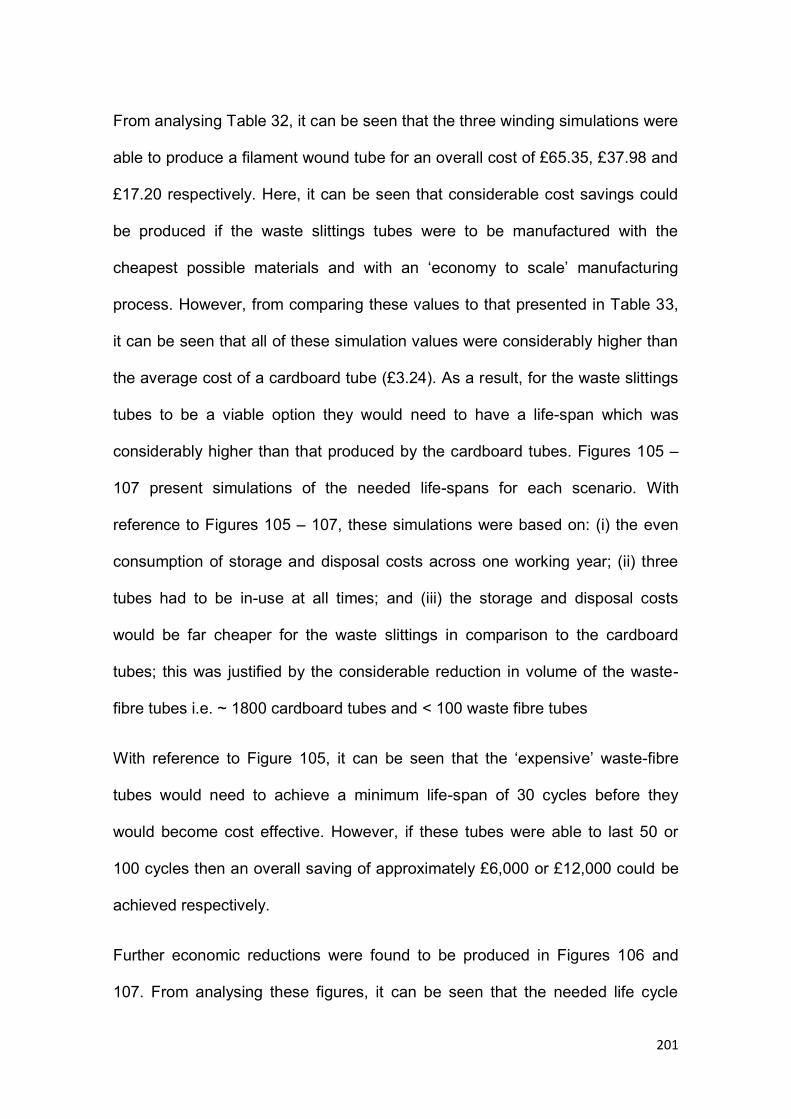
201
From analysing Table 32, it can be seen that the three winding simulations were
able to produce a filament wound tube for an overall cost of £65.35, £37.98 and
£17.20 respectively. Here, it can be seen that considerable cost savings could
be produced if the waste slittings tubes were to be manufactured with the
cheapest possible materials and with an ‘economy to scale’ manufacturing
process. However, from comparing these values to that presented in Table 33,
it can be seen that all of these simulation values were considerably higher than
the average cost of a cardboard tube (£3.24). As a result, for the waste slittings
tubes to be a viable option they would need to have a life-span which was
considerably higher than that produced by the cardboard tubes. Figures 105 –
107 present simulations of the needed life-spans for each scenario. With
reference to Figures 105 – 107, these simulations were based on: (i) the even
consumption of storage and disposal costs across one working year; (ii) three
tubes had to be in-use at all times; and (iii) the storage and disposal costs
would be far cheaper for the waste slittings in comparison to the cardboard
tubes; this was justified by the considerable reduction in volume of the waste-
fibre tubes i.e. ~ 1800 cardboard tubes and < 100 waste fibre tubes
With reference to Figure 105, it can be seen that the ‘expensive’ waste-fibre
tubes would need to achieve a minimum life-span of 30 cycles before they
would become cost effective. However, if these tubes were able to last 50 or
100 cycles then an overall saving of approximately £6,000 or £12,000 could be
achieved respectively.
Further economic reductions were found to be produced in Figures 106 and
107. From analysing these figures, it can be seen that the needed life cycle
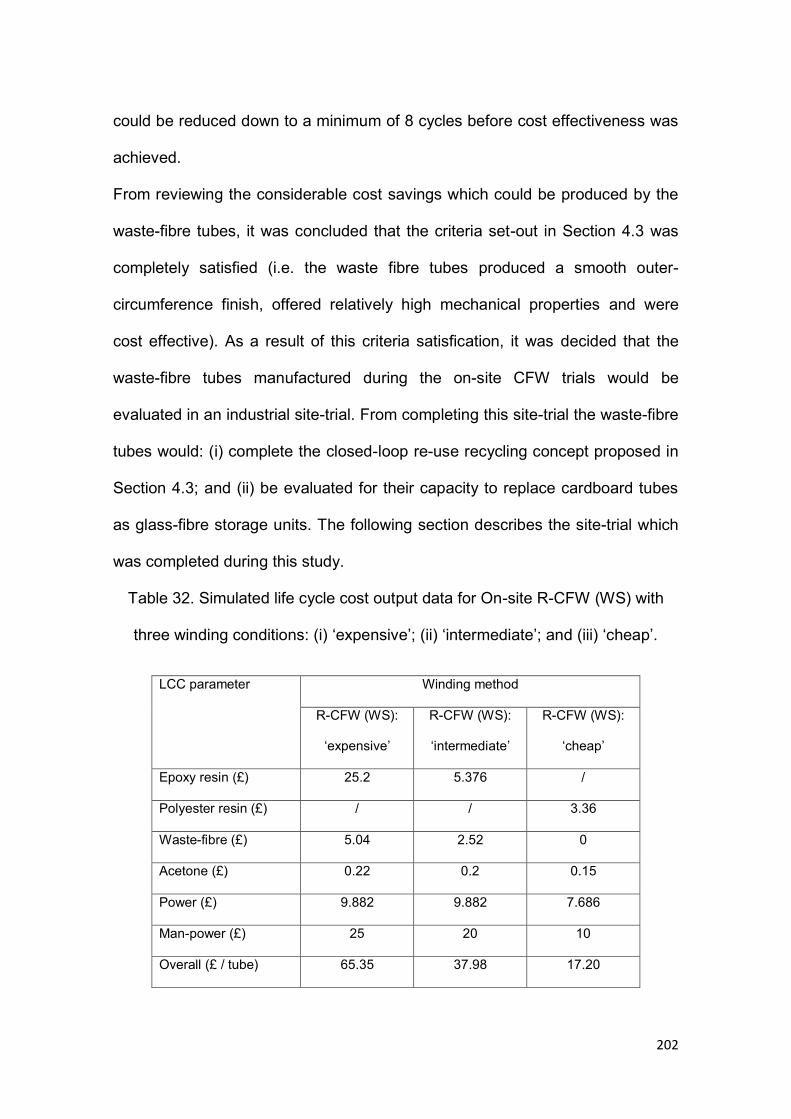
202
could be reduced down to a minimum of 8 cycles before cost effectiveness was
achieved.
From reviewing the considerable cost savings which could be produced by the
waste-fibre tubes, it was concluded that the criteria set-out in Section 4.3 was
completely satisfied (i.e. the waste fibre tubes produced a smooth outer-
circumference finish, offered relatively high mechanical properties and were
cost effective). As a result of this criteria satisfication, it was decided that the
waste-fibre tubes manufactured during the on-site CFW trials would be
evaluated in an industrial site-trial. From completing this site-trial the waste-fibre
tubes would: (i) complete the closed-loop re-use recycling concept proposed in
Section 4.3; and (ii) be evaluated for their capacity to replace cardboard tubes
as glass-fibre storage units. The following section describes the site-trial which
was completed during this study.
Table 32. Simulated life cycle cost output data for On-site R-CFW (WS) with
three winding conditions: (i) ‘expensive’; (ii) ‘intermediate’; and (iii) ‘cheap’.
LCC parameter Winding method
R-CFW (WS):
‘expensive’
R-CFW (WS):
‘intermediate’
R-CFW (WS):
‘cheap’
Epoxy resin (£) 25.2 5.376 /
Polyester resin (£) / / 3.36
Waste-fibre (£) 5.04 2.52 0
Acetone (£) 0.22 0.2 0.15
Power (£) 9.882 9.882 7.686
Man-power (£) 25 20 10
Overall (£ / tube) 65.35 37.98 17.20
203
Table 33. LCC output data for cardboard tubes.
Tube parameter Value
Cost per tube (£) 3.24
Number of tubes used per annum ~ 1800
Tube ‘life-cycle’ (number of cycles) 3 – 4
Storage costs per annum (£) 10,000
Disposal costs per annum (£) 2,661
Overall costs per annum (£) ~ 18,000
Figure 105. Life cycle cost simulations for R-CFW (WS): ‘expensive’.
0
2000
4000
6000
8000
10000
12000
14000
16000
18000
20000
0 5 10 15
Co
st, £
Number of Months
Cardboard
R-CFW tube: 1 year life-span
R-CFW tube: 100 cycles
R-CFW: 50 cycles
R-CFW: 30 cycles
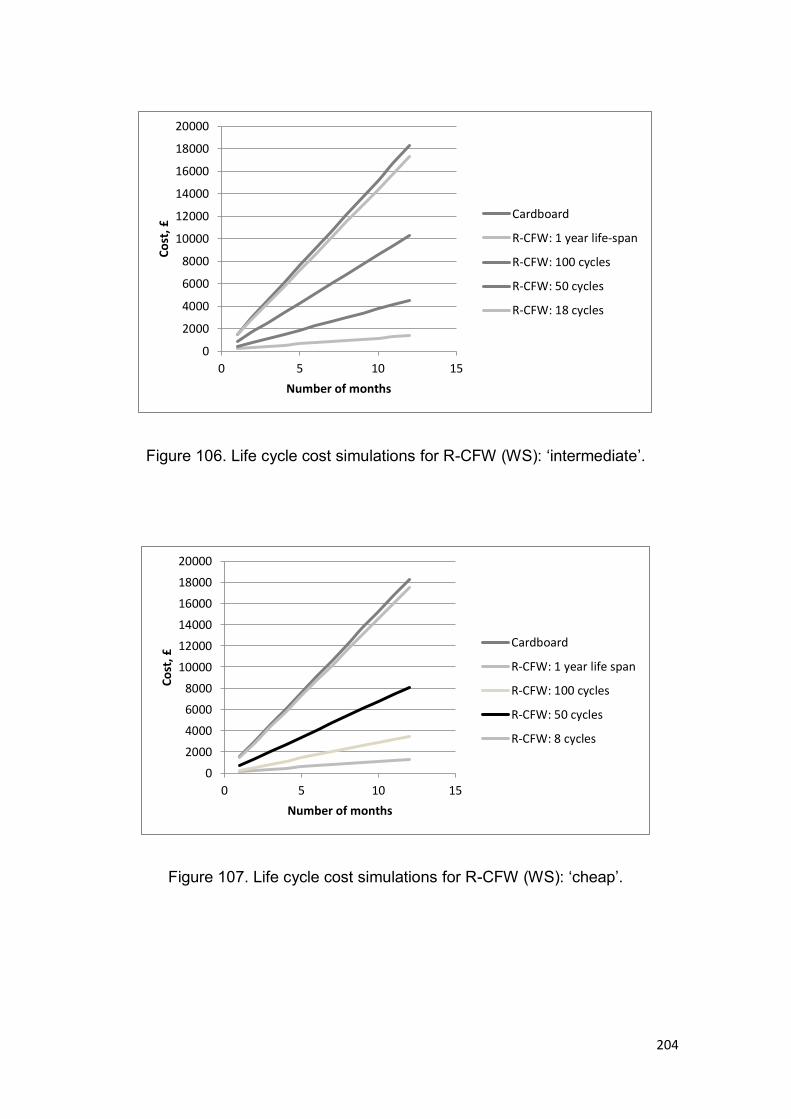
204
Figure 106. Life cycle cost simulations for R-CFW (WS): ‘intermediate’.
Figure 107. Life cycle cost simulations for R-CFW (WS): ‘cheap’.
0
2000
4000
6000
8000
10000
12000
14000
16000
18000
20000
0 5 10 15
Co
st, £
Number of months
Cardboard
R-CFW: 1 year life-span
R-CFW: 100 cycles
R-CFW: 50 cycles
R-CFW: 18 cycles
0
2000
4000
6000
8000
10000
12000
14000
16000
18000
20000
0 5 10 15
Co
st, £
Number of months
Cardboard
R-CFW: 1 year life span
R-CFW: 100 cycles
R-CFW: 50 cycles
R-CFW: 8 cycles
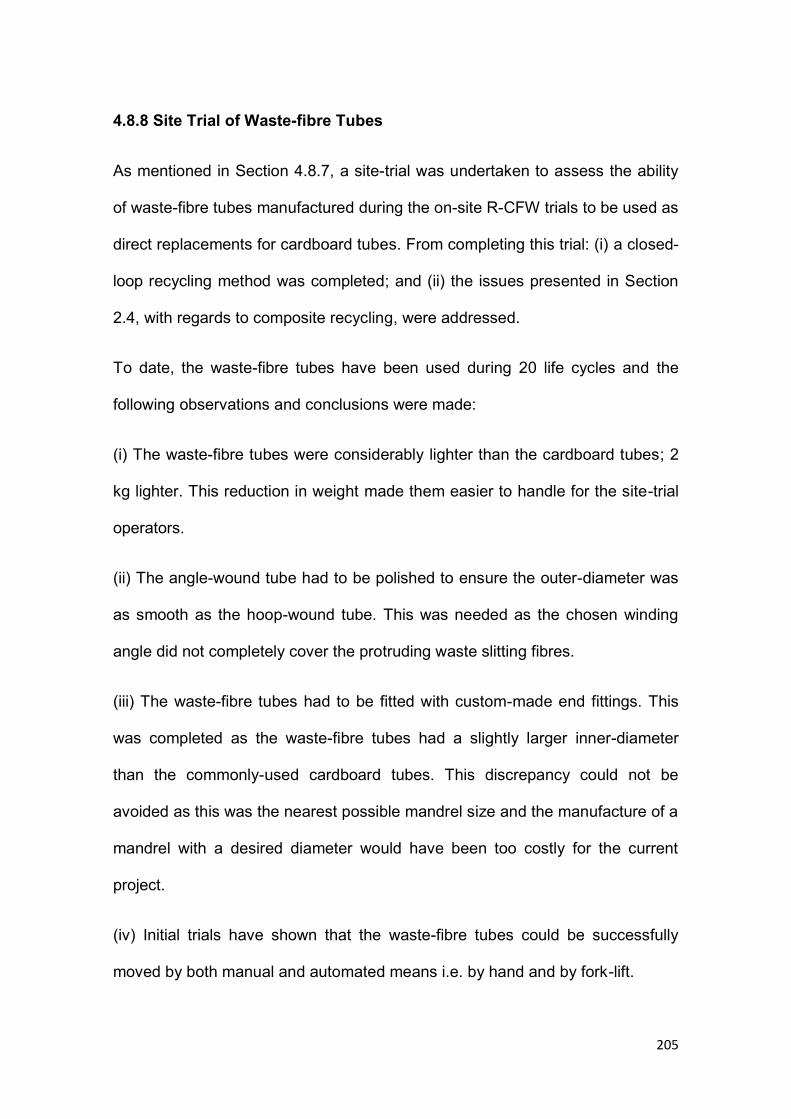
205
4.8.8 Site Trial of Waste-fibre Tubes
As mentioned in Section 4.8.7, a site-trial was undertaken to assess the ability
of waste-fibre tubes manufactured during the on-site R-CFW trials to be used as
direct replacements for cardboard tubes. From completing this trial: (i) a closed-
loop recycling method was completed; and (ii) the issues presented in Section
2.4, with regards to composite recycling, were addressed.
To date, the waste-fibre tubes have been used during 20 life cycles and the
following observations and conclusions were made:
(i) The waste-fibre tubes were considerably lighter than the cardboard tubes; 2
kg lighter. This reduction in weight made them easier to handle for the site-trial
operators.
(ii) The angle-wound tube had to be polished to ensure the outer-diameter was
as smooth as the hoop-wound tube. This was needed as the chosen winding
angle did not completely cover the protruding waste slitting fibres.
(iii) The waste-fibre tubes had to be fitted with custom-made end fittings. This
was completed as the waste-fibre tubes had a slightly larger inner-diameter
than the commonly-used cardboard tubes. This discrepancy could not be
avoided as this was the nearest possible mandrel size and the manufacture of a
mandrel with a desired diameter would have been too costly for the current
project.
(iv) Initial trials have shown that the waste-fibre tubes could be successfully
moved by both manual and automated means i.e. by hand and by fork-lift.

206
In conclusion, the waste-fibre tubes are currently not cost-effective, however the
tubes only need to complete ten more cycles to become cost-effective. It is
anticipated that this threshold will be considerably surpassed and the tubes will
become cost effective in the very near future.
207
CHAPTER 5: CONCLUSIONS
(a) Clean filament winding: A step-change in the manufacturing process for wet-
filament winding was designed, developed and demonstrated. The clean
filament winding concept was conceived by analysing the perceived problems
with conventional filament winding. Solutions were then proposed and
evaluated under laboratory and industrial (on-site) conditions. In summary, the
clean filament winding process consisted of the following components: (i) a
resin dispensing unit, which stored the resin and hardener components in
separate reservoirs. The two components were then pumped on-demand using
precision gear pumps. (ii) A conventional static mixer was used to intimately mix
the resin and hardener. (iii) A custom-designed resin impregnation unit, which
was developed on the basis of a detailed impregnation modelling study, was
used to achieve efficient impregnation of the reinforcing fibre tows instead of a
resin bath. (iv) A fibre spreading station, which was developed by reviewing
previously patented fibre spreading technologies, that was used to mechanically
spread the fibre tows prior to resin impregnation. This component was
incorporated to further improve the possible transverse impregnation rate of the
fibre tows.
The clean filament winding technique was used to facilitate a significant
reduction in the generation of waste resin. Furthermore, the site trial verified
that the volume of solvent required to clean the resin impregnation unit was a
fraction of that required for conventional filament winding. The emission of
208
solvents and low molecular weight components to the atmosphere was also
reduced significantly with clean filament winding.
(b) Recycled-Clean filament winding: The clean filament winding technique was
also shown to have the capacity to be modified to manufacture composite
components from waste glass-fibre materials. Here, two waste materials,
termed waste slittings and direct-loom waste, were used as fibre feed-stocks
and were manufactured with a comparable method to that used to manufacture
glass-fibre composites. From developing this method, a relatively simple and
cheap re-use recycling method was produced.
(c) Comparison of physical and mechanical properties: The properties of
filament wound tubes manufactured in the current study demonstrated that the
clean filament winding method was able to offer comparable or superior fibre
volume fractions and void contents as that produced by the conventionally
filament wound tubes. In particular, the modified method was able to offer
considerably low void contents; lower than 1%.
The hoop tensile (split disk), inter-laminar shear and lateral compression
strengths were also similar, or superior, for the glass-fibre tubes manufactured
using the modified and conventional filament winding techniques. The
comparable, or superior, properties provided by the modified techniques were
mainly attributed to the efficient impregnation method and hence low void
contents of the produced composites.
It was also shown that the waste-fibre composite components were generally
not able to offer comparable properties to that presented by the as-received
glass-fibre tubes. However, it was shown that the waste slittings offered
209
considerably superior properties as opposed to the direct loom waste. These
superior properties were attributed to the higher percentage of the waste slitting
reinforcing fibres being present in the load-bearing direction.
(d) Clean filament wound COPVs: The CFW method was also developed to
manufacture COPVs and from analysing the pressure burst strength results
presented in Section 4.8.5, it can be seen that the modified wet-filament winding
method was able to manufacture glass-fibre COPVs which offered
comparatively high mechanical properties.
(e) Life cycle assessment (LCA) and Life cycle cost (LCC) analysis: Due to the
results presented in Section 4.8.6 and 4.8.7, it was shown that the modified
filament winding methods were able to significantly improve the economic and
environmental impacts of filament wound components. Here, any economic or
environmental improvements were attributed to the reduced production of waste
resin and consumption of solvents for cleaning purposes and time required for
post-production cleaning.
Due to the above conclusions, it was shown that the CFW and R-CFW methods
can be favourable alternative options for the manufacture of filament wound
composite components. Furthermore, the concepts applied in this study can be
adapted and incorporated into other manufacturing methods such as pultrusion.
210
5.1 Recommendations for Future Research
In addition to the research presented in the current document, many areas for
future investigation have been identified. Firstly, attempts to apply the clean
filament winding method to different reinforcing fibre materials i.e. central-pull
fibres, carbon fibres or natural fibres. Here, it seems that an obvious
progression of the clean filament winding method would be to incorporate many
of the materials that are commonly used in the filament winding industry. This
would open the method up to wider use in many different applications.
Another obvious progression for the CFW method would be to incorporate
different resin systems which could further enhance the economic and
environmental validity of the modified method. Here, fast-curing resin systems
could now be used, owing to the fact that the resin is constantly supplied to the
resin impregnation unit, and there is a reduced possibility of the resin curing and
hardening on the filament winding equipment. From initial investigations, it is
hypothesised that the incorporation of a fast-curing resin system could produce
a 50% reduction in the environmental impact of the clean filament winding
method.
Finally, other areas of future research could include: (i) attempts to achieve
efficient impregnation of the direct-loom waste fibres, where the large volume of
waste material currently produced, could provide a valid long-term recycling
method. (ii) An investigation into hybrid composite manufacture, where the fibre
spreading station could be used to achieve efficient hybridisation of multiple
reinforcing fibre materials. (iii) On-line impregnation of short-fibre hybrid filament

211
wound tubes; and (iv) the application of the ‘clean’ methodology into other
manufacturing methods i.e. pultrusion.
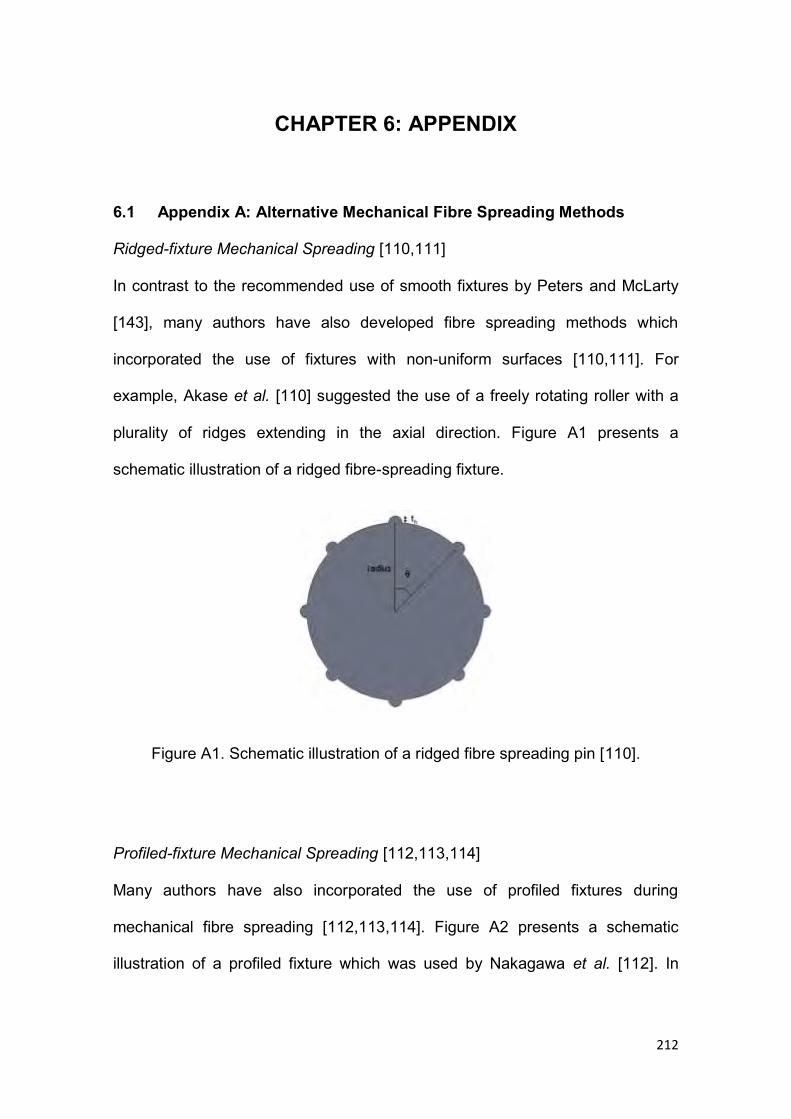
212
CHAPTER 6: APPENDIX
6.1 Appendix A: Alternative Mechanical Fibre Spreading Methods
Ridged-fixture Mechanical Spreading [110,111]
In contrast to the recommended use of smooth fixtures by Peters and McLarty
[143], many authors have also developed fibre spreading methods which
incorporated the use of fixtures with non-uniform surfaces [110,111]. For
example, Akase et al. [110] suggested the use of a freely rotating roller with a
plurality of ridges extending in the axial direction. Figure A1 presents a
schematic illustration of a ridged fibre-spreading fixture.
Figure A1. Schematic illustration of a ridged fibre spreading pin [110].
Profiled-fixture Mechanical Spreading [112,113,114]
Many authors have also incorporated the use of profiled fixtures during
mechanical fibre spreading [112,113,114]. Figure A2 presents a schematic
illustration of a profiled fixture which was used by Nakagawa et al. [112]. In
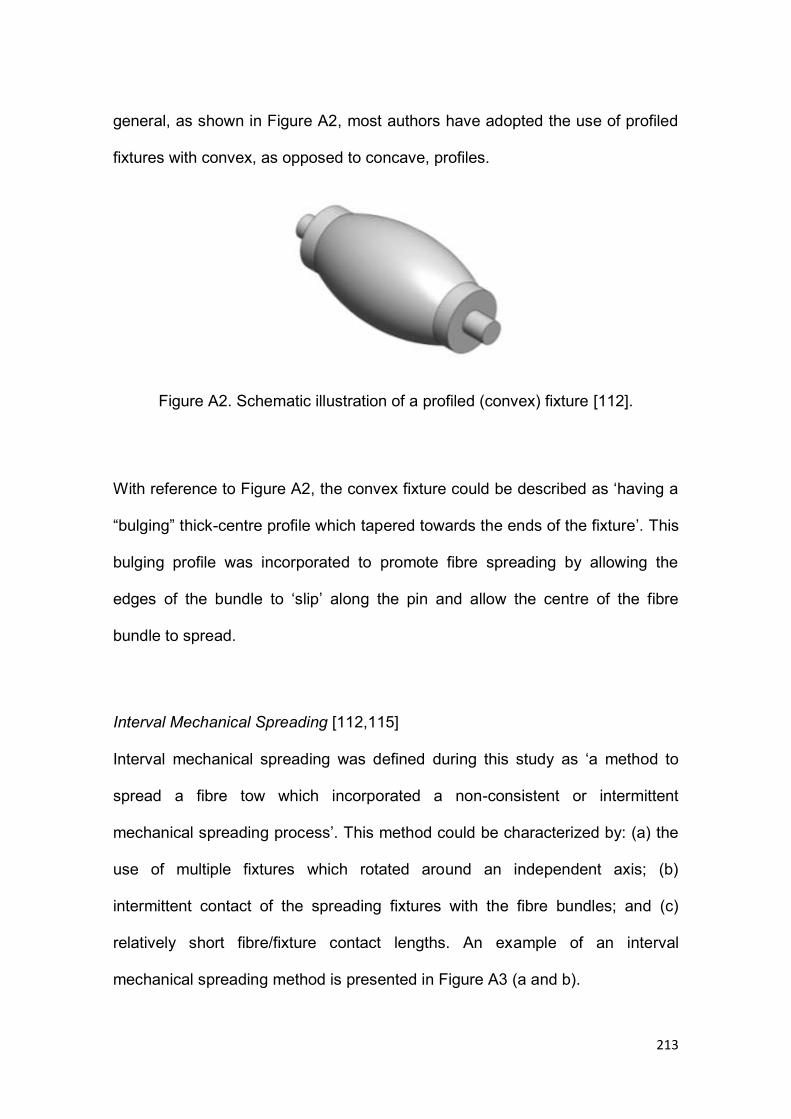
213
general, as shown in Figure A2, most authors have adopted the use of profiled
fixtures with convex, as opposed to concave, profiles.
Figure A2. Schematic illustration of a profiled (convex) fixture [112].
With reference to Figure A2, the convex fixture could be described as ‘having a
“bulging” thick-centre profile which tapered towards the ends of the fixture’. This
bulging profile was incorporated to promote fibre spreading by allowing the
edges of the bundle to ‘slip’ along the pin and allow the centre of the fibre
bundle to spread.
Interval Mechanical Spreading [112,115]
Interval mechanical spreading was defined during this study as ‘a method to
spread a fibre tow which incorporated a non-consistent or intermittent
mechanical spreading process’. This method could be characterized by: (a) the
use of multiple fixtures which rotated around an independent axis; (b)
intermittent contact of the spreading fixtures with the fibre bundles; and (c)
relatively short fibre/fixture contact lengths. An example of an interval
mechanical spreading method is presented in Figure A3 (a and b).
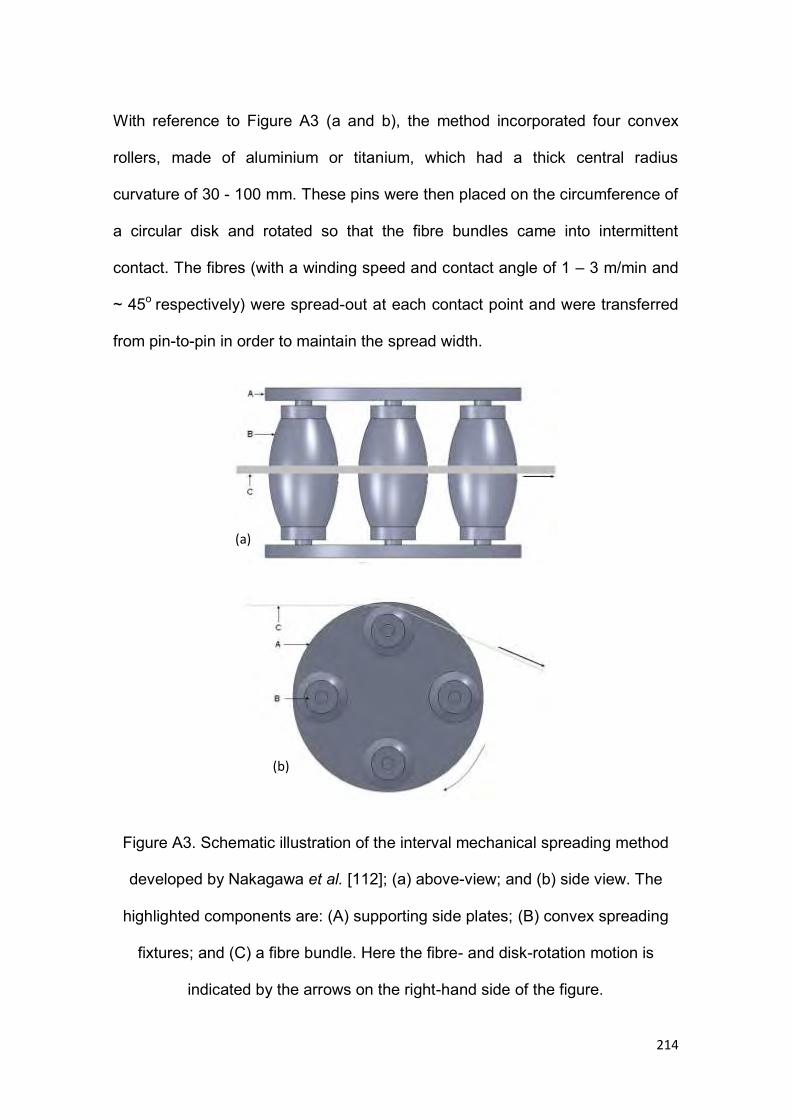
214
With reference to Figure A3 (a and b), the method incorporated four convex
rollers, made of aluminium or titanium, which had a thick central radius
curvature of 30 - 100 mm. These pins were then placed on the circumference of
a circular disk and rotated so that the fibre bundles came into intermittent
contact. The fibres (with a winding speed and contact angle of 1 – 3 m/min and
~ 45o respectively) were spread-out at each contact point and were transferred
from pin-to-pin in order to maintain the spread width.
Figure A3. Schematic illustration of the interval mechanical spreading method
developed by Nakagawa et al. [112]; (a) above-view; and (b) side view. The
highlighted components are: (A) supporting side plates; (B) convex spreading
fixtures; and (C) a fibre bundle. Here the fibre- and disk-rotation motion is
indicated by the arrows on the right-hand side of the figure.
(a)
(b)
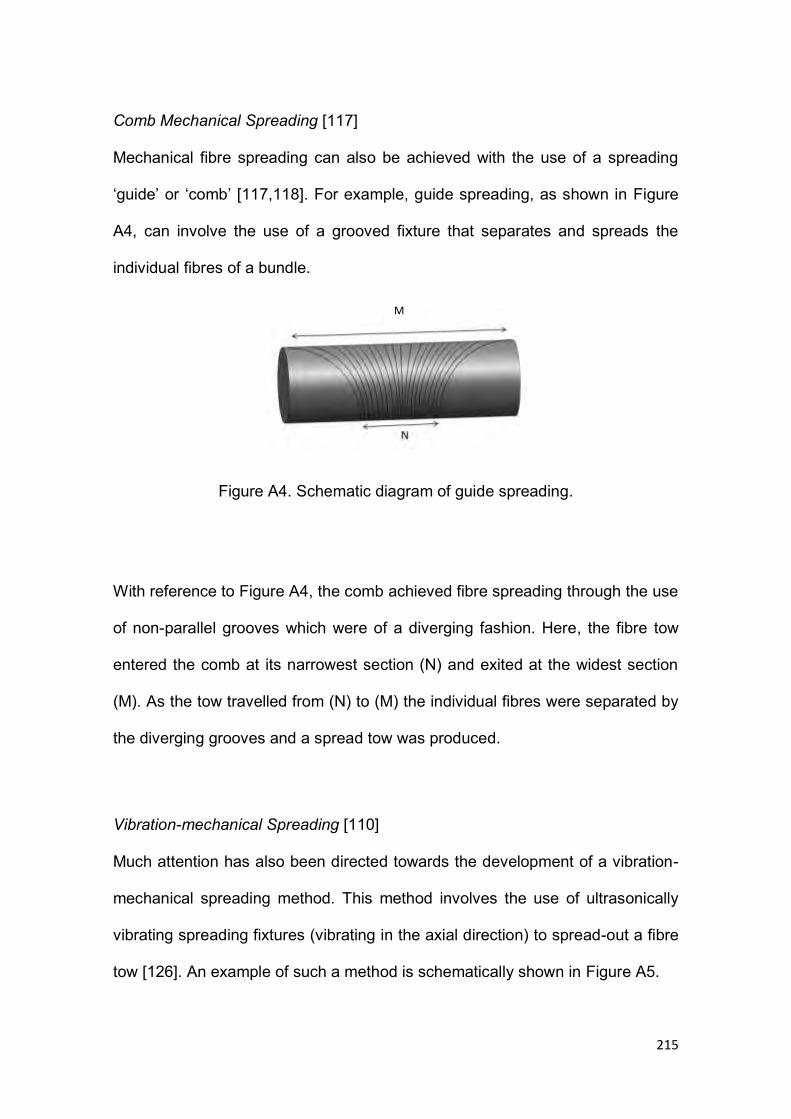
215
Comb Mechanical Spreading [117]
Mechanical fibre spreading can also be achieved with the use of a spreading
‘guide’ or ‘comb’ [117,118]. For example, guide spreading, as shown in Figure
A4, can involve the use of a grooved fixture that separates and spreads the
individual fibres of a bundle.
Figure A4. Schematic diagram of guide spreading.
With reference to Figure A4, the comb achieved fibre spreading through the use
of non-parallel grooves which were of a diverging fashion. Here, the fibre tow
entered the comb at its narrowest section (N) and exited at the widest section
(M). As the tow travelled from (N) to (M) the individual fibres were separated by
the diverging grooves and a spread tow was produced.
Vibration-mechanical Spreading [110]
Much attention has also been directed towards the development of a vibration-
mechanical spreading method. This method involves the use of ultrasonically
vibrating spreading fixtures (vibrating in the axial direction) to spread-out a fibre
tow [126]. An example of such a method is schematically shown in Figure A5.
M
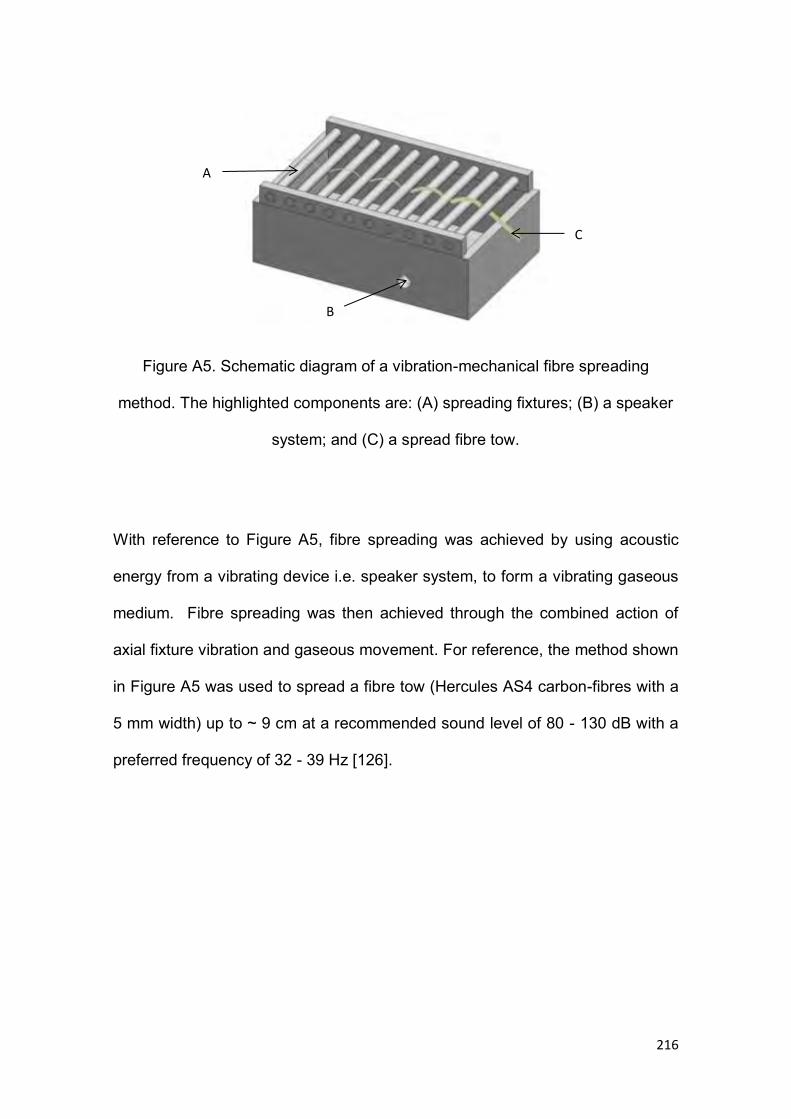
216
Figure A5. Schematic diagram of a vibration-mechanical fibre spreading
method. The highlighted components are: (A) spreading fixtures; (B) a speaker
system; and (C) a spread fibre tow.
With reference to Figure A5, fibre spreading was achieved by using acoustic
energy from a vibrating device i.e. speaker system, to form a vibrating gaseous
medium. Fibre spreading was then achieved through the combined action of
axial fixture vibration and gaseous movement. For reference, the method shown
in Figure A5 was used to spread a fibre tow (Hercules AS4 carbon-fibres with a
5 mm width) up to ~ 9 cm at a recommended sound level of 80 - 130 dB with a
preferred frequency of 32 - 39 Hz [126].
A
B
C
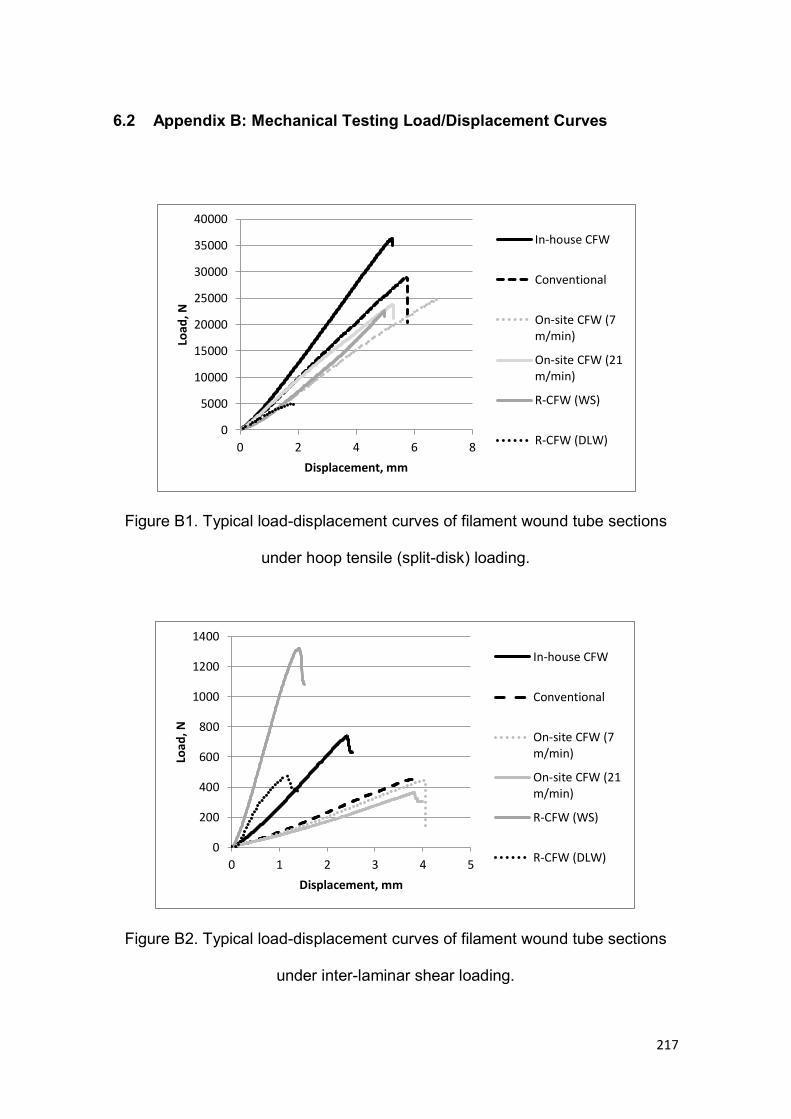
217
6.2 Appendix B: Mechanical Testing Load/Displacement Curves
Figure B1. Typical load-displacement curves of filament wound tube sections
under hoop tensile (split-disk) loading.
Figure B2. Typical load-displacement curves of filament wound tube sections
under inter-laminar shear loading.
0
5000
10000
15000
20000
25000
30000
35000
40000
0 2 4 6 8
Load
, N
Displacement, mm
In-house CFW
Conventional
On-site CFW (7m/min)
On-site CFW (21m/min)
R-CFW (WS)
R-CFW (DLW)
0
200
400
600
800
1000
1200
1400
0 1 2 3 4 5
Loa
d, N
Displacement, mm
In-house CFW
Conventional
On-site CFW (7m/min)
On-site CFW (21m/min)
R-CFW (WS)
R-CFW (DLW)
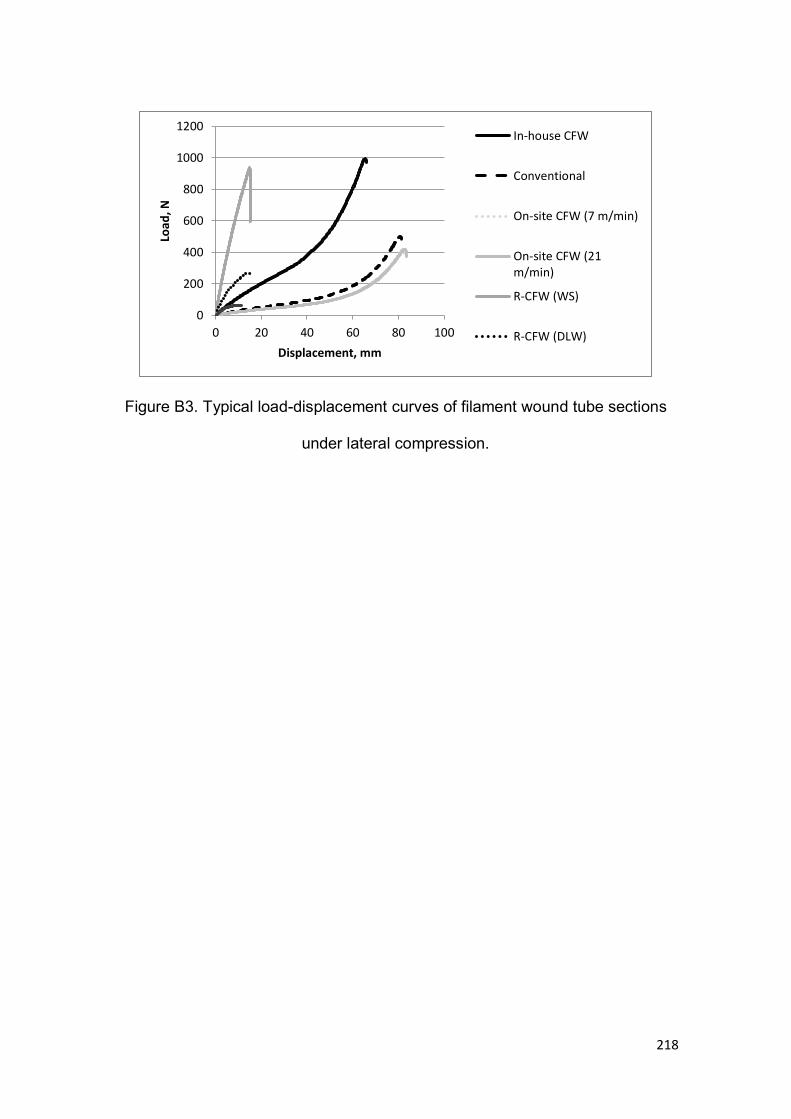
218
Figure B3. Typical load-displacement curves of filament wound tube sections
under lateral compression.
0
200
400
600
800
1000
1200
0 20 40 60 80 100
Loa
d, N
Displacement, mm
In-house CFW
Conventional
On-site CFW (7 m/min)
On-site CFW (21m/min)
R-CFW (WS)
R-CFW (DLW)

219
CHAPTER 7: LIST OF DEFINITIONS AND/OR
ABBREVIATIONS
A : Pin radius
ah : Gradient of velocity ( v ) against distance (L)
ANOVA : Analysis of variance
BRE : Building research establishment
B(VA) : Curve-fitting constant as a function of maximum packing capacity
C : Radius of curvature of the roving
c : Dimensionless shape factor
CAD : Computer aided design
CFW : Clean filament winding
COPV : Composite overwrapped pressure vessel
CSM : Chopped strand mat
C(VA) : Curve-fitting constant as a function of maximum packing capacity
c1, c2 : Constants
d : Injector depth
DE : Equivalent diameter of pores in a fibre bundle
Dh : Hydraulic diameter
DI : Degree of impregnation
DLW : Direct loom waste
EAP : Environmental action program
F : Form factor
h : Injector height

220
HAP : Hazardous atmospheric pollutants
H(1/2) : Channel half-height
H0 : Resin/film thickness at the beginning of the impregnation region
H1 : Resin/film thickness at the end of the impregnation region
ID : Inner-diameter
k : Kozeny constant
K : Permeability of the porous medium
Kx : Axial permeability
Ky : Transverse permeability
Ky.quadratic : Transverse permeability assuming a quadratic fibre architecture
Ky.hexagonal : Tansverse permeability assuming a hexagonal fibre architecture
LCA : Life cycle assessment
LCC : Life cycle cost
L1 : Impregnation length
L16 : Taguchi array
m(VA) : Curve-fitting constant as a function of maximum packing capacity
N : Number of individual filaments in a fibre tow
OD : Outer diameter
P : Pressure generated by a fibre traversing over a pin
Pc : Capillary pressure
R-CFW : Recycled-Clean filament winding
Re : Reynolds number
rf : Fibre radius
rpm : Revolutions per minute

221
SEM : Scanning electron microscopy
SMC : Sheet moulded compound
Te : Fibre tension
Te0 : Initial fibre tension
Te1 : Tension per width in the impregnation region
ti : Infiltration time
Ti : Infiltration thickness
To : Fibre tow thickness
T1, T2 : Arbitrary steps of infiltration thickness
U : Mean resin velocity over the fibre cross-section
V : Velocity of fibre movement
VA : Maximum packing capacity
Vf : Fibre volume fraction
Vp : Velocity profile
v : Superficial velocity
w : Fibre tow width
wi : Injector width
WS : Waste slittings
x : Horizontal coordinate
y : Vertical coordinate
Z : Cross-sectional area of the fibre tow
: Porosity
ƞ : Viscosity of the resin
ΔP : Pressure differential

222
ΔP/L : Pressure gradient over a characteristic dimension, L
: Frictional factor
ρ : Resin density
ψ : Lateral distance between two cylindrical spreading bars
ζ : Surface tension of the resin
ɵ : Contact angle between the resin and fibre
223
CHAPTER 8: REFERENCES
1. Miracle, D. and Donaldson, L. (2001) ASM Handbook, 21, ASM
International.
2. Biron, M. (2003) Thermosets and Composites, Elsevier Science and
Technology Books.
3. AVK, (2010) ‘Sustainability of fibre-reinforced plastics; An assessment
based on selected examples of application’ AVK Federation of
Reinforced Plastics.
4. Abdalla, F., Mutasher, S., Khalid, S., Sapuan, S., Hamouda, A., Sahari,
B. and Hamdan, M. (2005) ‘Design and fabrication of low cost filament
winding machine’ Journal of Materials and Design.
5. Peters, S.T. and McLarty, L. (2001) ‘Filament Winding’ ASM Handbook,
21, ASM International.
6. Bechtold, G. and Ye, L. (2003) ‘Influence of fibre distribution on the
transverse flow permeability in fibre bundles’ Journal of Composites
Science and Technology, Vol 63, pp. 2069-2079.
7. Reynolds, N. and Pharaoh, M. (2010) ‘An introduction to composites
recycling’ Management, Recycling and Reuse of Waste Composites,
Woodhead Publishing in Materials, Chapter 1, pp. 3-19.
8. Witten, E. and Schuster, A. (2010) ‘Composites market report; Market
developments, challenges and chances’ AVK Federation of Reinforced
Plastics.
9. Composites Europe 2009 Newsletter, (2009) Reinforced Plastics,
November/December.
224
10. Green, J.E. (2001) ‘Overview of Filament Winding’ SAMPE Journal, Vol
37, pp. 7-11.
11. Funck, R. and Neitzel, M. (1995) ‘Improved thermoplastic tape winding
using laser or direct-flame heating’ Journal of Composite Manufacturing,
Vol 6, pp. 3-4.
12. Toso, Y.M.P., Ermanni, P. and Poulikakos, D. (2004) ‘Thermal
phenomena in fiber-reinforced thermoplastic tape winding process:
computational simulations and experimental validations’ Journal of
Composite Materials, Vol 38, pp. 107-135.
13. Kim, J., Moon, T.J. and Howell, J.R. (2003) ‘Transient thermal modelling
of in-situ curing during tape winding of composite cylinders’ Journal of
Heat Transfer, Vol 125, pp. 137 -146.
14. Duvall, M., Ramani, K., Bays, M. and Caillat, F. (1996) ‘In-situ composite
manufacture using an electrostatic powder spray process and filament
winding’ Journal of Polymers and Polymer Composites, Vol 4, pp. 325-
334.
15. Ramani, K., Wooland, D.D. and Duvall, M.S. (1995) ‘An electrostatic
powder spray process for manufacturing thermoplastic composites’
Journal of Polymer Composites, Vol 16, pp. 459-469.
16. DuVall, F.W. (2001), ‘Comparisons of wet filament winding versus
prepreg filament winding for type II and type IV CNG cylinders’, SAMPE
Journal, Vol 37, No 1, pp. 38-42.
225
17. Pistor, C.M., Yardiminci, M.A. and Gucery, S.I. (1999) ‘On line
consolidation of thermoplastic composites using laser scanning’ Journal
of Composites: Part A, Vol 30, pp. 1149-1157.
18. Agarwal, V., McCullough, R.L. and Schultz, J.M. (1996) ‘The
thermoplastic laser assisted consolidation process: mechanical and
microstructure characterization’ Journal of Thermoplastic Composite
Materials, Vol 9, pp. 365-380.
19. Van Paepegem, W., Van Schepdael, L., Degrieck, J., Samyn, P., De
Baets, P., Suister, E. and Leendertz, J.S. (2005) ‘Fast characterisation of
carbon/epoxy rings for use in ball-joints of the maeslant storm surge
barrier’ Journal of Composite Structures.
20. Otstavnov, A.A., Pavlov, L.D., Sladkov, A.V., Ustyugov, V.A., Braslavskii,
V.A., Loenko, V.A. and Yantsev, V.M. (2006) ‘Determining the annual
rigidty of wound, hollow-walled polyethylene pipes of up to 2m diameter’
International Polymer Science and Technology, Vol 33, No 5.
21. PPG Industries (UK) Ltd, Fibre Glass Division, Wigan, Lancashire, WN2
4XZ.
22. Kugler, D. and Moon, T.J. (2002) ‘Effects of mandrel material and tow
tension on defects and compressive strength of hoop-wound, on-line
consolidated, composite rings’ Journal of Composites: Part A, Vol 33A,
pp. 861-876.
23. Mertiny, P. and Ellyin, F. (2002) ‘Influence of the filament winding tension
on physical and mechanical properties of reinforced composites’ Journal
of Composites: Part A, Vol 33, pp. 1615-1622.
226
24. Cohen, D. and Lowe, K.A. (1991) ‘The influence of epoxy matrix
properties on delivered fibre strength in filament wound composite
pressure vessels’ Journal of Reinforced Plastics and Composites, Vol 10,
pp. 112-131.
25. Samanci, A., Avci, A., Tarakcioglu, N. and Sahin, O.S. (2008) ‘Fatigue
crack growth of filament wound GRP pipes with a surface crack under
cyclic internal pressure’ Journal of Materials Science, Vol 43, pp. 5569-
5573.
26. Kharat, D.K. and Kumar, S. (2008) ‘Quality ascertaining procedures for
composite barrel’ Business Office, Paper 15.
27. Masmoudi, R., Mohamed, H. and Metiche, S. (2008) ‘Finite element
modelling for deflection and bending responses of GFRP poles’ Journal
of Reinforced Plastics and Composites, Vol 27, pp. 639-658.
28. Helmi, K., Fam, A. and Mufti, A. (2008) ‘Fatigue life assessment and
static testing of structural GFRP tubes based on coupon tests’ Journal of
Composites for Construction, Vol 12, pp. 212-223.
29. Mertiny, P., Ellyin, F. and Hothan, A. (2004) ‘An experimental
investigation on the effect of multi-stage filament winding on the strength
of tubular composite structures’ Journal of Composites Science and
Technology, Vol 64, pp. 1-9.
30. Natsuki, T., Takayanagi, H., Tsuda, H. and Kemmochi, K. (2003)
‘Prediction of bending strength for filament-wound composite pipes’
Journal of Reinforced Plastics and Composites, Vol 22, pp. 695-710.
227
31. Haftchenari, H., Al-Salehi, F.A.R., Al-Hassani, S.T.S. and Hinton, M.J.
(2002) ‘Effect of temperature on the tensile strength and failure modes of
angle ply aramid fibre (KRP) tubes under hoop loading’ Journal of
Applied Composite Materials, Vol 9, pp. 99-115.
32. Xia, M., Kemmochi, K. and Takayanagi, H. (2001) ‘Analysis of filament-
wound fiber-reinforced sandwich pipe under combined internal pressure
and thermomechanical loading’ Journal of Composite Structures, Vol 51,
pp. 273-283.
33. Ha, S.K. and Jeong, J.Y. (2005) ‘Effects of winding angles on through-
thickness properties and residual strains of thick filament wound
composite rings’ Journal of Composites Science and Technology, Vol 65,
pp. 27-35.
34. Kaynak, C., Erdiller, E.S., Parnas, L. and Senel, F. (2005) ‘Use of split-
disk tests for the process parameters of filament wound epoxy composite
tubes’ Journal of Polymer Testing, Vol 24, pp. 648-655.
35. Carrino, L., Polini, W. and Sorrentino, L. (2003) ‘Modular structure of a
new feed-deposition head for a robotised filament winding cell’ Journal of
Composites Science and Technology, Vol 63, pp. 2255-2263.
36. Polini, W. and Sorrentino, L. (2005) ‘Influence of winding speed and
winding trajectory on tension in robotised filament winding of full section
parts’ Journal of Composites Science and Technology, Vol 65, pp. 1574-
1581.
37. Scholliers, J. and Van Brussel, H. (1994) ‘Computer-integrated filament
winding: Computer-integrated design, robotic filament winding and
228
robotic quality control’ Journal of Composites Manufacturing, Vol 5, No 1,
pp. 15-23.
38. Halyard Precision Composites, Limberline Spur, Portsmouth, PO3 5HJ,
UK.
39. Silencer marine, Via Trieste, 1/C – 31057, Silea Treviso, Italy.
40. J.A. Chamberlain, Longwood, Florida, USA.
41. Crompton Technology Group Ltd, Thorpe Park, Banbury, Oxfordshire,
OX16 4SU, UK.
42. Tianjin, CTiHuatai Composites Co. Ltd, Leo Creative Industry Precinct,
Xiqing District, China.
43. FWT Wickeltechnik, Werner von Siemens, Str. 7, Neunkirchen, Austria.
44. BAC Technologies Ltd, West Liberty, Ohio, USA.
45. Structural Composite Solutions Ltd, Bothwell, Scotland, G71 8BS, UK.
46. Tata Advanced Materials, Jigani, India.
47. WindTec Winding Technology AS, Hareid, Norway.
48. Luxfer Gas Cylinders, Gerzat, France.
49. S.A. Composites, Loveland, Colorado, CO 80537, USA
50. Qinetiq, Cody Technology Park, Ively Road, Farnborough, Hampshire,
GU14 OLX, UK.
51. C.K. Composites Inc, 361 Bridgeport Street, Mount Pleasant,
Pennsylvania, USA.
52. Plymouth University, Advanced Composites Manufacturing Centre,
Plymouth, UK.
53. C.P.L, 168 Z.A. des aubrieres, Cedex, France.
229
54. Erschings Inc, USA.
55. CST composites, Caringbah, Australia.
56. Laval, C. (2006) ‘CADWIND 2006 – 20 years of filament winding
experience’ Reinforced Plastics, Vol 50, pp. 34-37.
57. Vieira, P., Tenreiro, A. and Oliveira, T. (2009) ‘The increase of
sustainability in cylinder manufacture’ Journal of Clean Technology and
Environmental Policy, original paper.
58. Palmer, R.J., Bonnar, G.R. and Moore, W.E. (1990), US patent
4,942,013.
59. Vaidyanthan, R., Campbell, J., Lopez, R., Halloran, J., Yarlagadda, S.
and Gillespie, J.W. (2005) ‘Water soluble tooling materials for filament
winding and VARTM’ SAMPE ’05: New Horizons for Materials and
Processing Technologies, Paper 34.
60. Everhart, M.C., Harris, D.L., Nickerson, D.M. and Hreha, R.D. (2006)
‘High-temperature reusable shape memory polymer mandrels’ SAMPE
’06: Creating New Opportunities for the World Economy, Vol 51, Paper
245.
61. Koury, A. (2005) ‘Composite tooling reusable mandrel’, SAMPE Journal,
Vol 41, pp. 36-39.
62. Bunsell, A.R. (2006) ‘Composite pressure vessels supply an answer to
transport problems’ Reinforced Plastics, Vol 50, pp. 38-41.
63. Abdalla, F.H., Megat, M.H., Sapuan, M.S. and Sahari, B.B. (2008)
‘Determination of volume fraction values of filament wound glass and
230
carbon fiber reinforced composites’ ARPN Journal of Engineering and
Applied Sciences, Vol 3, pp. 7-11.
64. Buarque, E.N. and d’Almeida, J.R.M. (2006) ’The effect of cylindrical
defects on the tensile strength of fibre/vinyl-ester matrix reinforced
composite pipes’ Journal of Composite Structures, Vol 79, Issue 2, pp.
270-279.
65. Kim, C.U., Kang, J.H., Hong, C.S. and Kim, C.G. (2005) ‘Optimal design
of filament wound structures under internal pressure based on the semi-
geodesic path algorithm’ Journal of Composite Structures, Vol 67, pp.
443-452.
66. Wakayama, S., Kobayashi, S., Imai, T. and Matsumoto, T. (2006)
‘Evaluation of burst strength of FW-FRP composite pipes after impact
using pitch-based low-modulus carbon fiber’ Journal of Composites: Part
A, Vol 37, pp. 2002-2010.
67. Hocine, A., Chapelle, D., Boubakar, M.I., Benamar, A. and Bezazi, A.
(2009) ‘Experimental and analytical investigation of the cylindrical part of
a metallic vessel reinforced by filament winding while submitted to
internal pressure’ International Journal of Pressure Vessels and Piping,
Vol 86, pp. 649-655.
68. Huang, Y.K., Frings, P.H. and Hennes, E. (2002) ‘Exploding pressure
vessel test on zylon/epoxy composite’ Journal of Composites: Part B, Vol
33, pp. 117-123.
231
69. Hwang, T.K., Hong, C.S. and Kim, C.G. (2003) ‘Probabilistic deformation
and strength prediction for a filament wound pressure vessel’ Journal of
Composites: Part B, Vol 34, pp. 481-497.
70. Chapelle, D. and Perreux, D. (2006) ‘Optimal design of a Type 3
hydrogen vessel: Part I – Analytical modelling of the cylindrical section’
International Journal of Hydrogen Energy, Vol 31, pp. 627-638.
71. Parnas, L. and Katirci, N. (2002), ‘Design of fibre-reinforced composite
pressure vessels under various loading conditions’ Journal of Composite
Structures, Vol 58, pp. 83-95.
72. Jones, I.A., Middleton, V. and Owen, M.J. (1996) ‘Roller-assisted variant
of the split disc test for filament-wound composites’ Journal of
Composites: Part A, Vol 27A, pp. 287-294.
73. Naruse, T., Hattori, T., Miura, H. and Takahashi, K. (2001) ‘Evaluation of
thermal degradation of unidirectional CFRP rings’ Journal of Composite
Structures, Vol 52, pp. 533-538.
74. Chen, W., Yu, Y., Li, P., Wang, C., Zhou, T. and Yang, X. (2007) ‘Effect
of new epoxy matrix for T800 carbon fibre/epoxy filament wound
composites’ Journal of Composites Science and Technology, Vol 67, pp.
2261-2270.
75. Hernandez-Moreno, H., Douchin, B., Collombet, F., Choqueuse, D. and
Davies, P. (2008) ‘Influence of winding pattern on the mechanical
behaviour of filament wound composite cylinders under external
pressures’ Journal of Composites Science and Technology, Vol 68, pp.
1015-1024.
232
76. Mistry, J. (1992) ‘Theoretical investigation into the effect of the winding
angle of the fibres on the strength of filament wound GRP pipes
subjected to combined external pressure and axial loading’ Journal of
Composite Structures, Vol 20, pp. 83-90.
77. Moon, C.J., Kim, I.H., Choi, B.H., Kweon, J.H. and Choi, J.H. (2010)
‘Buckling of filament-wound composite cylinders subjected to hydrostatic
pressure for underwater vehicle applications’ Journal of Composite
Structures, Vol 92, pp. 2241-2251.
78. Carroll, M., Ellyin, F., Kujawski, D. and Chiu, A.S. (1995) ‘The rate-
dependent behaviour of + 55o filament-wound glass-fibre/epoxy tubes
under biaxial loading’ Journal of Composites Science and Technology,
Vol 55, pp. 391-403.
79. Ellyin, F., Carroll, M., Kujawski, D. and Chiu, A.S. (1997) ‘The behaviour
of multidirectional filament wound fiberglass/epoxy tubulars under biaxial
loading’ Journal of Composites: Part A, Vol 28A, pp. 781-790.
80. Kaddour, A.S., Hinton, M.J. and Soden, P.D. (2003) ‘Behaviour of + 45o
glass/epoxy filament wound composite tubes under quasi-static equal
biaxial tension – Compression loading: Experimental results’ Journal of
Composites: Part B, Vol 34, pp. 689-704.
81. Liao, W.C., Liu, H.K. and Tseng, L. (2004) ‘Effect of fatigue stress
amplitude on the 500 cycle residual strength of non-adhesive filament
wound concrete composites under compression’ Journal of Composites
Science and Technology, Vol 64, pp. 2547-2556.
233
82. Tarakcioglu, N., Akdemir, A. and Avci, A. (2001) ‘Strength of filament
wound GRP pipes with surface crack’ Journal of Composites: Part B, Vol
32, pp. 131-138.
83. Gemi, L., Tarakciouglu, N., Akdemir, A. and Sahin, O.S. (2009)
‘Progressive fatigue failure behaviour of glass/epoxy (+ 75)2 filament-
wound pipes under pure internal pressure’ Journal of Materials and
Design, Vol 30, pp. 4293-4298.
84. Lee, D.H., Kim, S.K., Lee, W.I., Ha, S.K. and Tsai, S.W. (2006) ‘Smart
cure of thick composite filament wound structures to minimise the
development of residual stresses’ Journal of Composites: Part A, Vol 37,
pp. 530-537.
85. Qing, X.P., Beard, S.J., Kumar, A., Ooi, T.K. and Change, F.K. (2007)
‘Built-in sensor network for structural health monitoring of composite
structure’ Journal of Intelligent Material Systems and Structures, Vol 18,
pp. 39-49.
86. Gabrys, C.W. and Bakis, C.E. (1997) ‘Design and manufacturing of
filament wound elastomeric matrix composite flywheels’ Journal of
Reinforced Plastics and Composites, Vol 16, pp. 488-502.
87. Correia, J.R., Branco, F.R. and Ferreira, J.G. (2009) ‘The effect of
different passive fire protection systems on the fire reaction properties of
GFRP pultruded profiles for civil construction’ Accepted manuscript for
Journal of Composites: Part A.
88. Gadam, S.U.K., Roux, J.A., McCarty, T.A. and Vaughan, J.G. (2000)
‘The impact of pultrusion processing parameters on resin pressure rise
234
inside a tapered cylindrical die for glass-fibre/epoxy composites’ Journal
of Composites Science and Technology, Vol 60, pp. 945-958.
89. Binetruy, C., Hilaire, B. and Pabiot, J. (1998) ‘Tow impregnation model
and void formation mechanisms during RTM’ Journal of Composite
Materials, Vol 32, pp. 223-245.
90. Erdiller, E.S. (2004) ‘Experimental investigation for mechanical properties
of filament wound composite tubes’ Master of Science in Mechanical
Engineering Thesis, Middle East Technical University, Turkey.
91. Sobrinho, L.L, Colado, V.M.A. and Bastian, F.L. (2011) ‘Development
and characterisation of composite materials for production of composite
risers by filament winding’ Journal of Materials Research, Vol 14(3), pp.
287-298.
94. Foley, M.E. and Gillespie, J.W. (2005) ‘Modelling the effect of fibre
diameter and fibre bundle count on tow impregnation during liquid
moulding processes’ Journal of Composite Materials, Vol 39, No 12, pp.
1045-1065.
95. Gaymans, R.J. and Wevers, E. (1998) ‘Impregnation of a glass fibre
roving with a polypropylene melt in a pin assisted process’ Journal of
Composites: Part A, Vol 29, pp. 663-670.
96. Gebart, B.R. (1992) ‘Permeability of Unidirectional Reinforcements for
RTM’ Journal of Composite Materials, Vol 26, No 8, pp. 1100-1133.
97. Amico, S.C. and Lekakou, C. (2002) ‘Axial impregnation of a fiber bundle
Part 1: capillary experiments’ Journal of Polymer Composites, Vol 12,
Issue 2, pp. 249-263.
235
98. Carman, P.C. (1937) ‘Fluid flow through granular beds’ Transactions of
the Institution of Chemical Engineers, Vol 15, pp. 150-156.
99. Cai, Z. and Berdichevsky, A.L. (1993) ‘An improved self-consistent
method for estimating the permeability of a fibre assembly, Journal of
Polymer Composites, Vol 14, Issue 4, pp. 314-323.
100. Berdichevsky, A.L. and Cai, Z. (1993) ‘Preform permeability prediction by
self consistent method and finite element simulation’ Journal of Polymer
Composites, Vol 14, Issue 2, pp. 132-143.
105. Bruschke, M.V. and Advani, S.G. (1993) ‘Flow of generalised Newtonian
fluids across a periodic array of cylinders’ Journal of Rheology, Vol 37,
Issue 3, pp. 479-498.
106. Ahn, K.J. and Seferis, J.C. (1991) ‘Simultaneous measurements of
permeability and capillary pressure of thermosetting matrices in woven
fabric reinforcements’ Journal of Polymer Composites, Vol 12, No 3, pp.
146-152.
107. Bates, P.J. and Charrier J.M. (1999) ‘Effect of process parameters on
melt impregnation of glass roving’ Journal of Thermoplastic Composite
Materials, Vol 12, pp. 276-294.
108. Chandler, H.W., Devlin, B.J. and Gibson, A.G. (1992) ‘A model for the
continuous impregnation of fibre tows in resin baths with pins’ Journal of
Plastics, Rubber, and Composites Processing and Application, Vol 18,
Issue 4, pp. 215-220.
236
109. Ames, T., Kenley, R.L., Powers, E.J., West, W., Wydand, W.T. and
Lomax, B.R. (2007) ‘Method and apparatus for making an absorbent
composite’ US Patent: 7,181,817.
110. Akase, D., Matsumae, H., Hanano, T. and Sekido, T. (2000) ‘Method and
apparatus for opening reinforcing fibre bundle and method of
manufacturing prepreg’, US Patent: 6,094,791.
111. Tanaka, K., Ohtani, H., Matsumae, H., Tsuji, S. and Akase, D. (2004)
‘Production device and method for opened fibre bundle and prepreg
production method’ US Patent: 6,743,392.
112. Nakagawa, N. and Ohsora, Y. (1992) ‘Fibre seperator for producing fibre
reinforced metallic or resin body’, US Patent: 5,101,542.
113. Guirman, J.M., Lecerf, B. and Memphis A. (2005) ‘Method and device for
producing a textile web by spreading tows’ US Patent: 6,836,939.
114. Marissen, R., Van Der Drift, L.T. and Sterk, J. (2000) ‘Technology for
impregnation of fibre bundles with a molten thermoplastic polymer’
Journal of Composites Science and Technology, Vol 60, pp. 2029-2034.
115. Lifke, J.L., Busselle, I.D., Finley, D.J. and Gordon, B.W. (2000) ‘Method
and apparatus for spreading fibre bundles’ US Patent: 5,310,582.
116. Pryor, J.W. (1985) ‘Method and apparatus for conveying filter tow’, US
Patent: 4,537,583.
117. Van den Hoven, G. (1981) ‘Widening-narrowing guide for textile filament
bundle’ US Patent: 4,301,579.
118. Kiss, P.A., Deaton, J.M., Parsons, M.S. and Coffey, D. (2002) ‘Apparatus
and method for splitting a tow of fibres’, US Patent: 6,385,828.
237
119. Blackburn, R.M. (1979) ‘Fibre opening apparatus for an open-end
spinning machine’ US Patent: 4,169,348.
120. Krueger, R.G. (2001) ‘Apparatus and method for spreading fibrous tows
into linear arrays of generally uniform density and products made
thereby’ US Patent: 6,311,377.
121. Belvin, H.L., Cano, R.J., Johnston, N.J. and Marchello, J.M. (2002)
‘Process of making boron-fibre reinforced composite tape’, US Patent:
6,500,370.
122. Neuert, R. and Huber, B. (1993) ‘Process and apparatus for guiding a
tow’ US Patent: 5,214,828.
123. Yamaguchi, M., Yamaguchi, S. and Ohokubo, T. (1978) ‘Tow opening
apparatus’ US Patent: 4,120,079.
124. Yawaza, M., Kurihara, K., Tani, H. and Matsumoto, M. (1976) ‘Method for
producing laterally spread reticular web of split fibers’ US Patent:
3,953,909.
125. Vyakarnam, M.N. and Drzal, L.T. (1994) ‘Apparatus and high speed
method for coating elongated fibers’ US Patent: 5,310,582.
126. Iyer, S. and Drzal, L.T. (1991) ‘Method and system for spreading a tow of
fibres’ US Patent 5,042,122.
127. Chen, J.C. and Chao, C.G. (2001) ‘Numerical and experimental study of
internal flow field for a carbon fibre tow pneumatic spreader’, Journal of
Metallurgical and Materials Transactions B, Vol 32B, pp. 329-339.
238
128. Sihn, S., Kim, R.Y., Kawabe, K. and Tsai, S.W. (2006) ‘Experimental
studies of thin-ply laminated composites’ Journal of Composites Science
and Technology, Vol 67, pp. 996-1008.
129. Chung, T.S., Furst, H., Gurion, Z., McMahon, P.E., Orwoll, R.D. and
Palangio, D. (1986) ’Process for preparing tapes from thermoplastic
polymers and carbon fibres’ US Patent: 4,588,538.
130. McMahon, P.E., Chung, T.S. and Ying, L. (1989) ‘Process for preparing
composite articles from composite fibre blends’ US Patent: 4,871,491.
131. Newell, J.A. and Puzianowski, A.A. (1999) ‘Development of a pneumatic
spreading system for Kevlar-based SiC-precursor carbon fibre tows,
Journal of High Performance Polymer, Vol 11, pp. 197-203.
132. Daniels, C.G. (1974) ‘Pneumatic spreading of filaments’, US Patent:
3,795,944.
133. Klett, J.W. and Edie, D.D. (1995) ‘Flexible towpreg for the fabrication of
high thermal conductivity carbon/carbon composites’ Journal of Carbon,
Vol 33, No 10, pp. 1485-1503.
134. Street, R.L. (1991) ‘Process and apparatus for blowing continuous
filament tow’ US Patent: 5,060,351.
135. Holliday, R.C. (1994) ‘Process of preparing engineered fiber blend’ US
Patent: 5,355,567.
136. Hall, J.N. (1972) ‘Apparatus for spreading a graphite fibre tow into a
ribbon of graphite filaments’ US Patent: 3,704,485.
239
137. Kawabe, K. and Tomoda, S. (2006) ‘Method of producing a spread multi-
filament bundle and an apparatus used in the same’ US Patent: 0137156
A1.
138. Baucom, R., Snoha, J.J. and Marchello, J.M. (1991) ‘Process for
application of powder particles to filamentary materials’ US Patent:
5,057,338.
139. Niina, G., Sasaki, Y. and Takahashi, M. (1967) ‘Process for spreading of
dividing textile materials’ US Patent: 3,358,436.
140. Peritt, J.M., Everett, R. and Edelstein, A. (1993) ’Electrostatic fiber
spreader including a corona discharge device’,US Patent: 5,200,620.
141. Stenberg, E.M. (1976) ‘Method and apparatus for charging a bundle of
filaments’ US Patent: 3,967,118.
142. Nestler, J., Vettermann, F. and Reuchsel, D. (2007) ‘Device and method
from spreading a carbon fiber hank’ US Patent Application Publication:
0101564 A1.
143. Peters, S.T. and McLarty, J.L. (2001) ‘Filament winding’, ASM
Handbook, 21, ASM.
144. Duflou, J.R., De Moor, J., Verpoest, I. and Dewulf, W. (2009)
‘Environmental impact analysis of composite use in car manufacturing’
Journal of Manufacturing Technology, Vol 58, pp. 9-12.
145. Stewart, R. (2010) ‘Legislation for recycling waste composites’,
Management, Recycling and Reuse of Waste Composites, Woodhead
Publishing in Materials, Chapter 2, pp. 20-38.
146. The Environmental permitting (England and Wales) Regulations (2010).
240
147. European composite recycling services company, (2010) ‘The green FRP
recycling label’.
148. Directive 2008/98/EC of the European Parliament and of the Council,
(2008), Official Journal of the European Union.
149. Directive 2003/33/EC of the European Parliament and of the Council,
(2003) Official Journal of the European Union.
150. Directive 2005/673/EC of the European Parliament and of the Council on
end-of-life vehicles, (2005) Official Journal of the European Union.
151. The Environmental permitting (England and Wales) Regulations (2007).
152. Stewart, R. (2010) ‘Waste management’ Management, Recycling and
Reuse of Waste Composites, Woodhead Publishing in Materials, Chapter
3, pp. 39-62.
153. Council directive 96/61/EC concerning integrated pollution prevention and
control, (1996) EC Regulation.
154. Pickering, S.J. (2006) ‘Recycling technologies for thermoset composite
materials – current status’ Journal of Composites: Part A, Vol 37, pp.
1206-1215.
155. Otheguy, M.E., Gibson, A.G., Findon, E., Cripps, R.M., Ochoa Mendoza,
A. and Aguinaco Castro, M.T. (2009) ‘Recycling of end-of-life
thermoplastic composite boats’, Journal of Plastics, Rubber and
Composites, Vol 38, No 9/10, pp. 406-411.
156. Pickering, S.J., Kelly, R.M., Kennerley, J.R., Rudd, C.D. and Fenwick,
N.J. (2000) ‘A fluidized-bed process for the recovery of glass fibres from
241
scrap thermoset composites’ Journal of Composites Science and
Technology, Vol 60, pp. 509-523.
157. Lester, E., Kingman, S., Wong, K.H., Rudd, C., Pickering, S. and Hilal, N.
(2004) ‘Microwave heating as a means for carbon fibre recovery from
polymer composites: a technical feasibility study’ Materials Research
Bulletin, Vol 39, pp. 1549.
158. Cunliffe, A.M., Jones, N. and Williams, P.T. (2003) ‘Recycling of fibre-
reinforced polymeric waste by pyrolysis: thermo-gravimetric and bench-
scale investigations’ Journal of Analytical and Applied Pyrolysis, Vol 70,
pp. 315-338.
159. Torres, A., de Marco, I., Caballero, B.M., Laresgoiti, M.F., Legaretta, J.A.,
Cabrero, M.A., Gonzalez, A., Chomon, M.J. and Gondra, K. (2000)
‘Recycling by pyrolysis of thermoset composites: characteristics of the
liquid and gaseous fuels obtained’ Journal of Fuel, Vol 79, pp. 897-902.
160. Lee, C.K., Kim, Y.K., Phirada, P., Kim, J.S., Lee, K.M. and Ju, C,S.
(2010) Journal of Transportation Research, Part D.
161. Soh, S.K., Lee, D.K., Cho, Q., and Rag, Q. (1994) ‘Low temperature
pyrolysis of SMC scrap’ Proceedings of 10th Annual ASM/ESD Advanced
Composites Conference, pp. 47-52.
162. Pickering, S.J. (2010) ‘Thermal methods for recycling waste composites’,
Management, Recycling and Reuse of Waste Composites, Woodhead
Publishing in Materials, Chapter 4, pp. 63-101.
163. Kaminsky, W. (2010) ‘Fluidised bed pyrolysis of waste polymer
composites for oil and gas recovery’, Management, Recycling and Reuse
242
of Waste Composites, Woodhead Publishing in Materials, Chapter 8, pp.
192-214.
164. Kennerley, J.R., Kelly, R.M., Fenwick, N.J., Pickering, S.J. and Rudd,
C.D. (1998) ‘The characterization and reuse of glass fibres recycled from
scrap composites by the action of a fluidized bed process’ Journal of
Composites: Part A: Appplied Science and Manufacturing, Vol 29A, pp.
839-845.
165. Yip, H.L.H., Pickering, S. and Rudd, C. (2002) ’Characterisation of carbon
fibres recycled from scrap composites using a fluidised bed process’
Journal of Plastics, Rubbers and Composites, Vol 31, pp. 278-282.
166. Fenwick, N.J. and Pickering, S.J. (1994) ‘Using waste materials to reduce
emissions – combustion of glass reinforced plastic with coal in a fluidized
bed’ Conference on Engineering Profit from Waste IV, International
Mechanical Engineering, Conference C493, pp. 157-166.
167. Wong, K.H., Pickering, S.J. and Rudd, C.D. (2010) ‘Recycled carbon
fibre reinforced polymer composite for electromagnetic interference
shielding’ Journal of Composites: Part A, Vol 41, pp. 693-702.
168. Turner, T.A., Harper, L.T., Warrior, N.A. and Rudd, C.D. (2008) ‘Low-cost
carbon-fibre-based automotive body panel systems: a performance and
manufacturing cost comparison’ Proceedings of the Institution of
Mechanical Engineers - Part D, Journal of Automobile Engineering, Vol
222(D1), pp. 53-63.
243
169. Ushikoshi, K., Komatsu, N. and Sugino, M. (1995) ‘Recycling of CFRP by
pyrolysis method’, Journal of the Society of Materials Science, Vol 44,
pp. 428-431.
170. Norris, D.R. (1990) ‘Development of the pyrolysis process for recycling of
SMC’ Proceedings of the 8th Annual ASM/ESD Advanced Composites
Conference.
171. Meyer, L.O., Schulte, K. and Grove-Nielsen, E. (2009) ‘CFRP –
Recycling following a pyrolysis route: Process optimization and
potentials’ Journal of Composite Materials, Vol 43, pp. 1121-1132.
172. Blazso, M. (2010) ‘Pyrolysis for recycling waste composites’
Management, Recycling and Reuse of Waste Composites, Woodhead
Publishing in Materials, Chapter 5, pp. 102-121.
173. Palmer, J., Ghita, O.R., Savage, L. and Evans, K.E. (2009) ‘Successful
closed-loop recycling of thermoset composites’ Journal of Composites:
Part A, Vol 40, pp. 490-498.
174. Recycled Carbon Fibre, Cannon Business Park, Gough Road, Coseley,
West Midlands, WV14 8XR, UK.
175. Curcuras, C.N., Flax, A.M., Graham, W.D. and Hartt, G.N. (1991)
‘Recycling of thermoset automotive components’ SAE Technical Paper
Series.
176. Jutte, R.B. and Graham, W.D. (1991) ‘Recycling SMC scrap as a
reinforcement’ Journal of Plastics Engineering, Vol 47, pp. 13-16.
177. DeRosa, R., Tefeyan, E. and Mayes, S. (2004) ‘Expanding the use of
recycled SMC in BMC’s’ Global Plastics Environmental Conference 2004
244
– plastics: helping grow a greener environment, GPEC 2004, Society of
Plastics Engineers, pp. 371-383.
178. Bledzki, A.K., Kurek, K. and Barth, C.H. (1992) ‘Development of a
thermoset part with SMC reclaim’ Proceedings of ANTEC’92, Society of
Plastics Engineers, pp. 1558-1560.
179. Schaefer, P. and Plowgian, A.G. (1994) ‘SMC recycling: an update-
ERCOM's experience in production and application’ 49th Annual
Conference, Composites Institute, The Society of the Plastics Industry.
180. Jiang, G., Pickering, S.J., Lester, E., Turner, T.A., Wong, K.H. and
Warrior, N.A. (2009) ‘Characterisation of carbon fibres recycled from
carbon-fibre/epoxy resin composites using supercritical n-propanol’
Journal of Composites Science and Technology, Vol 69, pp. 192-198.
181. Pinero-Hernanz, R., Dodds, C., Hyde, J., Garcia-Serna, J., Poliakoff, M.,
Lester, E., Cocero, M., Kingman, S., Pickering, S. and Wong, K. (2008)
‘Chemical recycling of carbon fibre reinforced composites in near-critical
and supercritical water’, Journal of Composites: Part A, Vol 39, pp. 454-
461.
182. Belingardi, G., Koricho, E.G. and Martorana, B. (2011) ‘Design
optimisation and implementation of composite and recyclable
thermoplastic materials for automotive bumper’, Fifth International
Conference on Advanced Computational Methods in Engineering, Liege,
Belgium.
245
183. Conroy, A., Halliwell, S. and Reynolds, T. (2006) ‘Composite recycling in
the construction industry’, Journal of Composites: Part A, Vol 37, pp.
1216-1222.
184. Yuyan, L., Guohua, S. and Linghui, M. (2009) ‘Recycling of carbon fibre
reinforced composites using water in subcritical conditions’, Journal of
Materials Science and Engineering A, Vol 52, pp. 179-183.
185. Pinhero-Hernanz, R., Garcia-Serna, J., Dodds, C., Hyde, J., Poliakoff,
M., Cocero, M., Kingman, S., Pickering, S. and Lester, E. (2008)
‘Chemical recycling of carbon fibre composites using alcohols under
subcritical and supercritical conditions’, Journal of Supercritical Fluids,
Vol 46, pp. 83-92.
186. Bai, Y., Wang, Z. and Feng, L. (2010) ‘Chemical recycling of carbon
fibres reinforced epoxy resin composites in oxygen in supercritical water’
Journal of Materials and Design, Vol 31, pp. 999-1002.
187. Buggy, M., Farragher, L. and Madden, W. (1995) ‘Recycling of composite
materials’ Journal of Materials Processing Technology, Vol 55, pp. 448-
456.
188. Yoshiki, S., Yasuhiko, K., Koji, T. and Noboru, K. (2005) ‘Degradation
behavior and recovery of bisphenol-A from epoxy resin and
polycarbonate resin by liquid-phase chemical recycling’ Journal of
Polymer Degradation and Stability, Vol 89, pp. 317-326.
189. Hyde, J.R., Lester, E., Kingman, S., Pickering, S. and Wong, K.H. (2006)
‘Supercritical propanol, a possible route to composite carbon fibre
246
recovery: A viability study’ Journal of Composites: Part A, Vol 37, pp.
2171-2175.
190. Guinee, J.B., Gorree, M., Heijungs, R., Huppes, G., Kleijn, R., de Koning,
A., van Oers, L., Sleeswijk, A.W., Suh, S., Udo de Haes, H.A., de Bruijn,
H., van Duin, R. and Huijbregts, M.A.J. (2001) ‘Life cycle assessment: An
operational guide to the ISO standards’ published report.
191. International Organization for standardization, ISO 14040, Environmental
Management – Life Cycle Assessment – Principles and Framework,
(1997).
192 Djekic, I. (2006) ‘New approach to life cycle analysis of self-propelled
agricultural machines’ Agricultural Engineering International: the CIGR
Ejournal, Invited overview No 9, Vol 8.
193. Rebitzer, G. and Buxmann, K. (2005) ‘The role and implementation of
LCA within life cycle management at Alcan’ Journal of Cleaner
Production, Vol 13, pp. 1327-1335.
194. ISO 14040, (1997), ‘Environmental Management – Life Cycle
Assessment – Principles and Framework’, International Organisation for
Standardisation.
195. ISO 14041, (1998) ‘Environmental Management – Life Cycle
Assessment: Goal and scope definition and inventory analysis’
International Organisation for Standardisation.
196. ISO 14042, (2000) ‘Environmental Management – Life Cycle
Assessment: Life cycle impact assessment’, International Organisation
for Standardisation.
247
197. ISO 14043, (2000) ‘Environmental Management – Life Cycle
Assessment: Life cycle interpretation’ International Organisation for
Standardisation.
198. Joshi, S.V., Drzal, L.T., Mohanty, A.K. and Arora, S. (2004) ‘Are natural
fibre composites superior to glass fiber resinforced composites?’ Journal
of Composites: Part A, Vol 35, pp. 371-376.
199. Pervaiz, M. and Sain M.M. (2003) ‘Carbon storage potential in natural
fibre composites’ Journal of Resources, Conservation and Recycling, Vol
39, pp. 325-340.
200. Kasai, J. (1999) ‘Life cycle assessment, evaluation method for
sustainable development’ JSAE Review, Vol 20, pp. 387-393.
201. Song, Y.S., Youn, J.R. and Gutowski, T.G. (2009) ‘Life cycle energy
analysis of fibre-reinforced composites’ Journal of Composites: Part A,
Vol 40, pp. 1257-1265.
202. Keoleian, G.A. and Kar, K. (2003) ‘Elucidating complex design and
management tradeoffs through life cycle design: air intake manifold
demonstration project’ Journal of Cleaner Production, Vol 11, pp. 61-77.
203. Wotzel, K., Wirth, R. and Flake, R. (1999) ‘Life cycle studies on hemp
fibre reinforced components and ABS for automotive parts’ Angew
Makromol Chem: Vol 272, pp. 121-127.
204. Schmidt, W.P. and Beyer, H.M. (1998) ‘Life cycle study on a natural fibre
reinforced component, SAE Technical paper 982195, SAE total life cycle
conference, Graz, Austria.
248
205. Ardente, F., Beccali, M., Cellura, M. and Mistretta, M. (2008) ‘Building
energy performance: A LCA case study of kenaf-fibres insulation board’
Journal of Energy and Buildings, Vol 40, pp. 1-10.
206. Corbiere-Nicollier, T., Gfeller-Laban, B., Lundquist, L., Leterrier, Y.,
Manson, J.A.E. and Jolliet, O. (2001) ‘Life Cycle Assessment of Biofibers
Replacing Glass Fibers as Reinforcement in Plastics’ Resources,
Conservation, Recycling, Vol 33, pp. 267-287.
207. Luz, S.M., Caldeira-Pires, A. and Ferrao, P.M.C. (2010) ‘Environmental
benefits of substituting talc by sugarcane bargasse fibres as
reinforcement in polypropylene composites: Ecodesign and LCA as
strategy for automotive components’ Journal of Resources, Conservation
and Recycling, Vol 54, pp. 1135-1144.
208. Vidal, R., Martinez, P. and Garrain, D. (2009) ‘Life cycle assessment of
composite materials made of recycled thermoplastics combined with rice
husks and cotton linters’ International Journal of Life Cycle Assessment,
Vol 14, pp. 73-82.
209. Alves, C., Ferrao, P.M.C., Silva, A.J., Reis, L.G., Freitas, M., Rodrigues,
L.B. and Alves, D.E. (2010) ‘Ecodesign of automotive components
making use of natural jute fibre composites’, Journal of Cleaner
Production, Vol 18, pp. 313-327.
210. White, N.M. and Ansell, M. (1983) ‘Straw reinforced polyester
composites’, Journal of Materials Science, Vol 18, pp. 1549-1556.
249
211. Zah, R., Hischier, R., Leao, A.L. and Braun, I. (2007) ‘Curaua fibres in the
automobile industry – a sustainability assessment’, Journal of Cleaner
Production, Vol 15, pp. 1032-1040.
212. Marsh, G. (2004), ‘The green guide to composites: An environmental
profiling system for composite materials and products’, Reinforced
Plastics, pp. 18-26.
213. Suzuki, T. and Takahashi, J. (2005) ‘Prediction of energy intensity of
carbon fibre reinforced plastics for mass-produced passenger cars’ Ninth
Japan International SAMPE Symposia.
214. Tonn, B.E., Schexnayder, S.M., Peretz, J.H., Das, S. and Waidley, G.
(2003) ‘An assessment of waste issues associated with the production of
new, lightweight, fuel-efficient vehicles’ Journal of Cleaner Production,
Vol 11, pp. 753-765.
215. Shotton-Gale, N., Harris, D., Pandita, S.D., Paget, M.A., Allen, J.A. and
Fernando, G.F. (2010) ‘Clean and environmentally friendly wet-filament
winding’ Management, Recycling and Reuse of Waste Composites.
Woodhead Publishing in Materials, Chapter 13, pp. 329-368.
216. Shotton-Gale, N., Pandita, S.D., Paget, M., Wait, C., Allen, J.A., Harris,
D. and Fernando, G.F. (2009), ‘An environmentally friendly modified wet-
filament winding process’, ICCM Conference.
217. Liu, T. and Fernando, G.F. (2001) ‘Processing of polymer composites: an
optical fibre-based sensor system for on-line amine monitoring’, Journal
of Composites: Part A, Vol 32, pp. 1561-1572.
250
218. Ghani, J., Choudhury, I. and Hassan, H., (2004) ‘Application of Taguchi
method in the optimisation of end milling parameters’ Journal of Materials
Processing Technology, Vol 145, pp. 84-92.
219. ASTM D2584, (2002) ‘Standard test methods for ignition loss of cured
reinforced plastics’.
220. ASTM D2734, (2003) ‘Standard test methods for void content of
reinforced plastics’.
221. ASTM D2290, (2004) ‘Apparent tensile strength of ring or tubular plastics
by split disk method’.
222. ASTM D2344, (2006) ‘Short-beam strength of polymer matrix composite
materials and their laminates’.
223. Gupta, N.K. and Abbas, H. (2000) ‘Lateral collapse of composite
cylindrical tubes between flat platens’ International Journal of Impact
Engineering, Vol 24, pp. 329-346.
224. Liu, T., Mohamed, R. and Fernando, G.F. (1998) ‘Optical sensor system
for monitoring the extent of mixing in thermosetting resins’ Smart
Structures and Materials, SPIE, San Diego, USA, pp. 154-162.