clean security cover - j.p. morgan asset management · 4 jpmorgan emerging markets investment trust...
TRANSCRIPT

Half Year Report2013/14JPMorgan Emerging Markets
Investment Trust plcHalf Year Report & Accounts for the six months ended 31st December 2013

Features
Contents
About the Company
1 Half Year Performance2 Chairman’s Statement4 Investment Manager’s Report
Investment Review
5 List of Investments7 Portfolio Analyses
Accounts
8 Income Statement9 Reconciliation of Movements inShareholders’ Funds
10 Balance Sheet11 Cash Flow Statement12 Notes to the Accounts
Shareholder Information
14 Interim Management Report15 Subscription Shares16 Glossary of Terms and Definitions17 Information about the Company
Objective
Capital growth from emerging markets worldwide.
Investment Policies
- To invest in a diversified portfolio, concentrating on countries and shares with themost attractive prospects. To have no more than 50% of the Company’s assetsinvested in any one region.
- To invest no more than 15% of gross assets in other UK listed investment companies(including investment trusts).
Benchmark
The MSCI Emerging Markets Index with net dividends reinvested, in sterling terms.
Share Capital
At 31st December 2013, the Company’s issued share capital comprised 122,205,251Ordinary shares of 25p each, including 2,946,122 shares held in Treasury, and10,158,274 Subscription shares of 1p each.
Continuation Vote
At the Annual General Meeting held on 14th November 2011 an ordinary resolution ofthe shareholders approved the continuation of the Company until the Annual GeneralMeeting in November 2014 and at three yearly intervals thereafter.
Management Company
The Company employs JPMorgan Asset Management (UK) Limited (‘JPMAM’ or the‘Manager’) to manage its assets.

JPMorgan Emerging Markets Investment Trust plc. Half Year Report & Accounts 2013 1
Half Year PerformanceTotal returns (includes dividends reinvested)
–2.9%Return to Ordinary
shareholders5
–5.3%Fully diluted return on net
assets1,4
–1.4%Benchmark3
–5.7%Portfolio return net of fees
and expenses1,2
Financial Data31st December 30th June %
2013 2013 change
Shareholders’ funds (£’000) 734,202 785,778 –6.6
Ordinary shares in issue (excluding shares held in Treasury) 119,259,129 119,353,816 –0.1
Ordinary share price 545.5p 567.0p –3.8
Ordinary share price discount to fully diluted net assetvalue per Ordinary share 10.3% 11.8%
Subscription share price 42.5p 76.5p –44.4
Subscription shares in issue 10,158,274 10,170,292
A glossary of terms and definitions is provided on page 16.
1Source: J.P. Morgan.2Return on net assets, net of management and performance fees and administration expenses, but excluding both the effect of Subscription shares whichhave been converted during the period and the dilutive impact of Subscription shares in issue at the period end.3Source: Datastream. The Company’s benchmark is the MSCI Emerging Market Index with net dividends reinvested, in sterling terms. 4Return on net assets calculated using the diluted net asset value, which assumes that all outstanding Subscription shares were converted into Ordinaryshares at the period end.
5Source: Morningstar. The return to Ordinary Shareholders assumes that the dividend paid by the Company was reinvested, at the prevailing share price,on the ex-dividend date.
JPMorgan Emerging Markets Investment Trust plc. Half Year Report & Accounts 20132
Chairman’s Statement
Performance
Following the strong positive returns enjoyed in the previous financial year to30th June 2013, the first half of the Company’s financial year was a difficult period foremerging markets and your Company underperformed its benchmark index. In thesix months to 31st December 2013, the portfolio return net of fees and expenseswas — 5.7%, as compared to the total return from our benchmark index, the MSCIEmerging Markets Index (in sterling terms) of –1.4%. The fully diluted total return onnet assets, which assumes that all of the Company’s Subscription shares wereexercised at the price of 543 pence per share, was –5.3%. Over the same period, thereturn to Ordinary shareholders was -2.9%. Whilst this is disappointing, theCompany’s long term record remains very strong. A review of the Company’sperformance for the first six months and the outlook for the remainder of the yearis provided in the Investment Manager’s Report.
Discount
During the first six months of this financial year, the discount on the Company’sOrdinary shares to their fully diluted net asset value (‘NAV’) ranged between 8.1% and11.6%, averaging 9.8%. At the period end, the discount was 10.3%. As I have explainedin previous reports, the Board is prepared to take action to ensure that the fully diluteddiscount does not exceed 10% for an extended period, but only if the discount is out ofline with our peer group and market conditions are orderly. We are prepared to buyshares in at discounts wider than 8% in order to achieve this, subject to those caveats,and have done so during the period. During the six months the Company repurchaseda total of 106,705 Ordinary shares into Treasury at an average 10.3% discount to NAV.Shares will only be reissued from Treasury at a premium to net asset value.
Subscription shares
During the six months to 31st December 2013 and up to the date of this report, theCompany has issued a total of 12,348 Ordinary shares following the exercise ofSubscription shares, amounting to proceeds of £67,050. Further details of theSubscription shares can be found on page 15 of this half year report and on theCompany’s website at www.jpmemergingmarkets.co.uk but I would remindSubscription shareholders that the final opportunity to convert their Subscriptionshares into Ordinary shares at a price of 543p per share is on 31st July 2014, afterwhich they will expire.
The Alternative Investment Fund Managers Directive (‘AIFMD’)
As I reported at the last year end, the AIFMD represents new regulation forinvestment trust companies and your Company must comply by 22nd July 2014.Your Board is taking independent legal advice on this matter, but has agreed toappoint JPMorgan as its AIFM and Bank of New York (‘BoNY’) as its depositary underthe new regime. JPMorgan has submitted its application to be authorised as an AIFMwhich it expects to be confirmed in the coming weeks, at which time the Companywill enter into a new management agreement with JPMorgan Funds Limited and adepositary agreement with BoNY. Whilst compliance with the new regime will entailsome additional disclosure, it is not expected to change materially the manner inwhich your Company is managed and will not impact the independence of yourBoard.

JPMorgan Emerging Markets Investment Trust plc. Half Year Report & Accounts 2013 3
Management Fee
The Company’s management fee is currently charged at the rate of 1.0% per annumof total assets less current liabilities. The Board has agreed with JPMAM that, witheffect from 1st July 2014, a sliding scale will apply to the management fee such thatthe charge will be reduced to 0.75% on assets above £800 million.
Outlook
The difficulties experienced by emerging markets in recent months may continue inthe short term, but lower valuations offer opportunities and we are confident in ourManager’s ability to identify and exploit those opportunities to generateoutperformance and continue the Company’s strong long term record.
Alan SaundersChairman 24th February 2014
JPMorgan Emerging Markets Investment Trust plc. Half Year Report & Accounts 20134
Investment Manager’s Report
It has been a challenging six months for emerging markets and for your manager.Although markets declined only modestly (–1.4%), we failed to keep pace with thebenchmark and the fully diluted net asset value per share of your portfolio fell by5.3% over the same period; this effectively cancelled out the outperformance of thefirst six months of 2013. The principal causes of this disappointing outcome werecurrency weakness during the late summer, especially in India, where we had a largeexposure and some individual effects in stock selection. As we head in to 2014,market conditions are not recovering and currency weakness in emerging marketshas again moved to centre stage.
After two already dull years for emerging markets, this is not cheery news for us toreport; but it should not hugely surprise us that as developed economies recover, theflow of money seeking returns should change direction. At such a time, it is especiallyimportant to be careful about balance sheets and to think carefully about how wellplaced businesses are to take advantage of more challenging conditions. Thenon-financial investments in your portfolio conform very much to this line of thinking.Financial self-reliance may prove very important in an era in which the cost of moneyis rising.
Looking forward, we see continuing headwinds from the recovery of the developedworld and the likely eventual increase in interest rates; but it is encouraging thatexchange rates are already acting as an adjustment mechanism. Not only is this muchless damaging than a system which puts all the stress on adjustment of internal pricesin an economy (as was seen in the Asian crisis in 1998, and in Eurozone countries likeGreece after the financial crisis); but it also means that stocks are getting cheaper.Low valuations must mitigate a lot of the current pessimism about emerging marketsand one thing we know from the past is that the world does not end when gloom andpessimism are widespread; instead, it offers better value; and currencies will revert tothe mean, in real terms, in the long run. While it may be too early to call a definitiveupturn in the asset class, we are seeing increasing numbers of interestingopportunities at the stock level, which has always been our principal focus asinvestors.
Austin ForeyInvestment Manager 24th February 2014

JPMorgan Emerging Markets Investment Trust plc. Half Year Report & Accounts 2013 5
ValuationCompany Country of Listing £’000 %
Housing Development Finance India 24,227 3.30
Magnit Russia 23,008 3.10
Taiwan Semiconductor Manufacturing1 Taiwan 21,845 3.00
Tata Consultancy Services India 20,538 2.80
Hyundai Motor South Korea 19,915 2.70
AIA Hong Kong 19,072 2.60
International Personal Finance UK 18,902 2.60
Ultrapar Participações Brazil 17,088 2.30
Infosys Technologies1 India 16,613 2.30
Grupo Financiero Banorte Mexico 15,928 2.20
Mahindra & Mahindra Financial Service India 15,759 2.10
WEG Brazil 15,298 2.10
China Mobile Hong Kong 14,982 2.00
Ambev1 Brazil 14,383 2.00
Tsingtao Brewery China 13,963 1.90
Compartamos Mexico 13,802 1.90
Vale1 Brazil 13,521 1.80
Yes Bank India 13,346 1.80
Jardine Matheson Hong Kong 12,841 1.70
Delta Electronics Taiwan 12,757 1.70
Cielo Brazil 12,605 1.70
China Merchants Bank China 12,500 1.70
Capitec Bank South Africa 12,214 1.70
Wumart Stores China 11,250 1.50
MTN South Africa 11,221 1.50
ITC India 10,908 1.50
United Breweries India 10,715 1.50
Bidvest Group South Africa 10,577 1.40
Petroleo Brasileiro1 Brazil 10,449 1.40
Wal-Mart De Mexico Mexico 10,384 1.40
Tenaris1 Argentina 10,296 1.40
Discovery South Africa 9,986 1.40
Itau Unibanco Brazil 9,928 1.40
Sberbank Russia 9,661 1.30
Clicks South Africa 9,524 1.30
Ping An Insurance China 9,329 1.30
President Chain Store Taiwan 9,156 1.20
Astra International Indonesia 8,932 1.20
List of Investmentsat 31st December 2013
JPMorgan Emerging Markets Investment Trust plc. Half Year Report & Accounts 20136
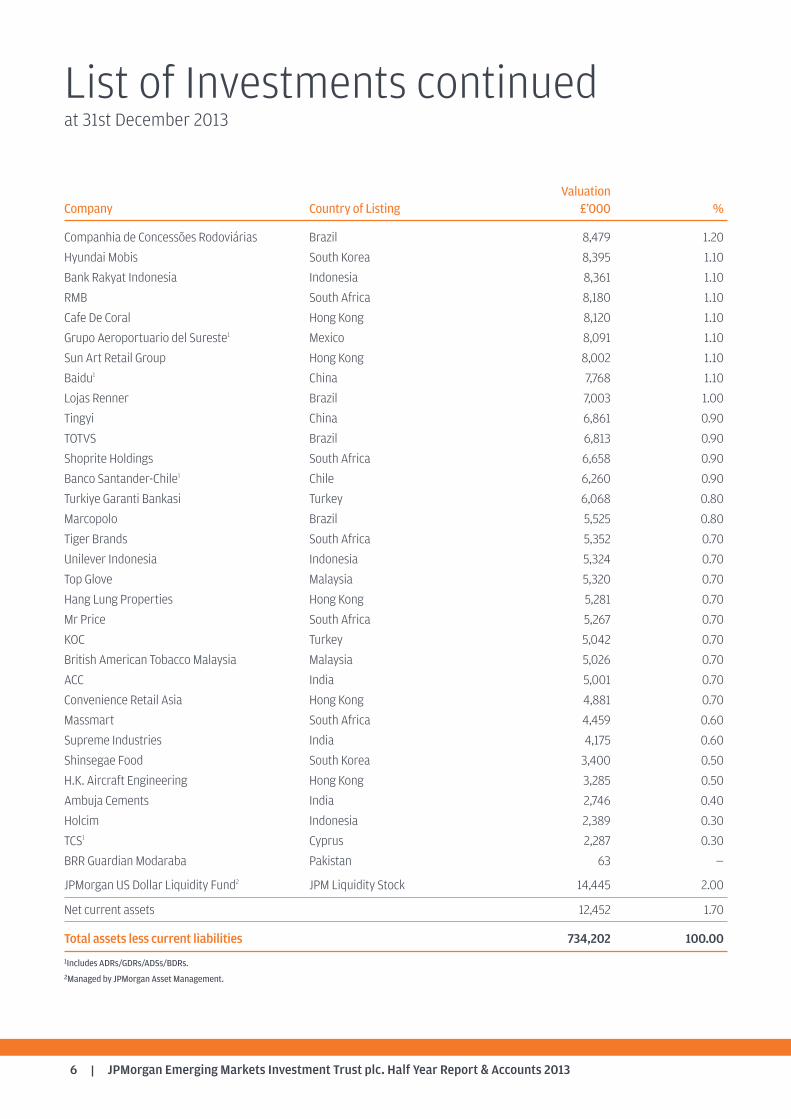
ValuationCompany Country of Listing £’000 %
Companhia de Concessões Rodoviárias Brazil 8,479 1.20
Hyundai Mobis South Korea 8,395 1.10
Bank Rakyat Indonesia Indonesia 8,361 1.10
RMB South Africa 8,180 1.10
Cafe De Coral Hong Kong 8,120 1.10
Grupo Aeroportuario del Sureste1 Mexico 8,091 1.10
Sun Art Retail Group Hong Kong 8,002 1.10
Baidu1 China 7,768 1.10
Lojas Renner Brazil 7,003 1.00
Tingyi China 6,861 0.90
TOTVS Brazil 6,813 0.90
Shoprite Holdings South Africa 6,658 0.90
Banco Santander-Chile1 Chile 6,260 0.90
Turkiye Garanti Bankasi Turkey 6,068 0.80
Marcopolo Brazil 5,525 0.80
Tiger Brands South Africa 5,352 0.70
Unilever Indonesia Indonesia 5,324 0.70
Top Glove Malaysia 5,320 0.70
Hang Lung Properties Hong Kong 5,281 0.70
Mr Price South Africa 5,267 0.70
KOC Turkey 5,042 0.70
British American Tobacco Malaysia Malaysia 5,026 0.70
ACC India 5,001 0.70
Convenience Retail Asia Hong Kong 4,881 0.70
Massmart South Africa 4,459 0.60
Supreme Industries India 4,175 0.60
Shinsegae Food South Korea 3,400 0.50
H.K. Aircraft Engineering Hong Kong 3,285 0.50
Ambuja Cements India 2,746 0.40
Holcim Indonesia 2,389 0.30
TCS1 Cyprus 2,287 0.30
BRR Guardian Modaraba Pakistan 63 —
JPMorgan US Dollar Liquidity Fund2 JPM Liquidity Stock 14,445 2.00
Net current assets 12,452 1.70
Total assets less current liabilities 734,202 100.00
1Includes ADRs/GDRs/ADSs/BDRs.2Managed by JPMorgan Asset Management.
List of Investments continuedat 31st December 2013
JPMorgan Emerging Markets Investment Trust plc. Half Year Report & Accounts 2013 7
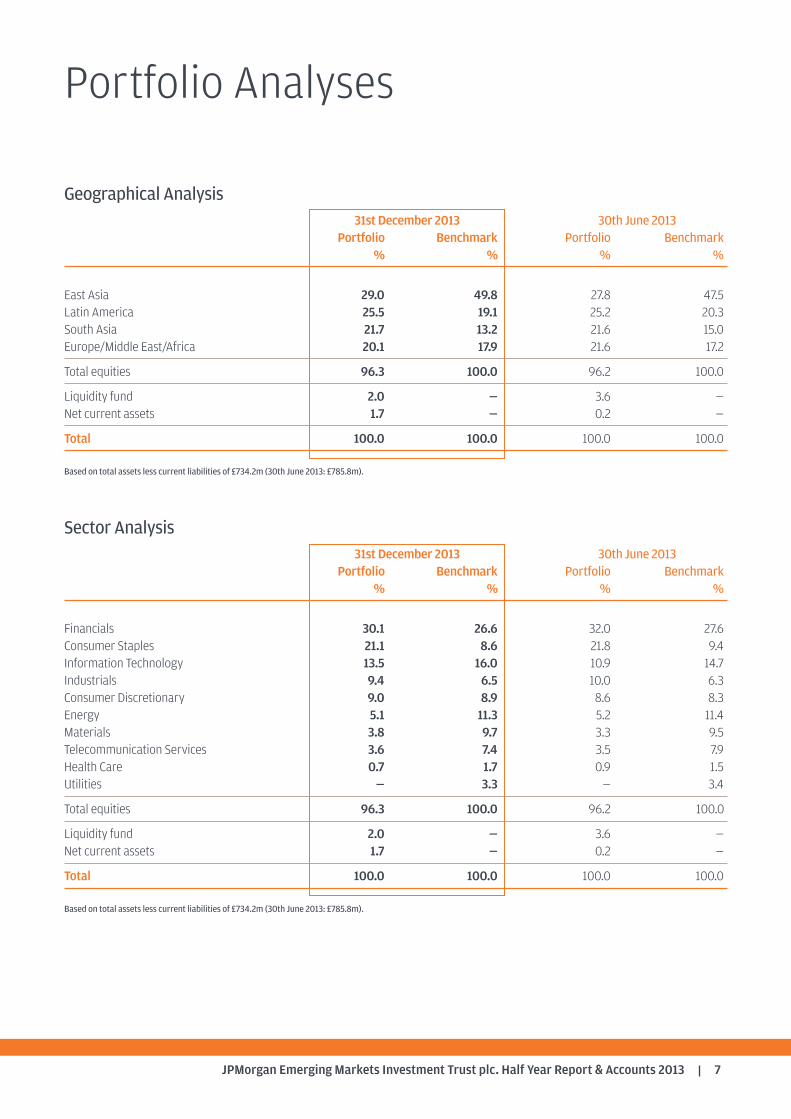
Geographical Analysis31st December 2013 30th June 2013
Portfolio Benchmark Portfolio Benchmark% % % %
East Asia 29.0 49.8 27.8 47.5Latin America 25.5 19.1 25.2 20.3South Asia 21.7 13.2 21.6 15.0Europe/Middle East/Africa 20.1 17.9 21.6 17.2
Total equities 96.3 100.0 96.2 100.0
Liquidity fund 2.0 — 3.6 —Net current assets 1.7 — 0.2 —
Total 100.0 100.0 100.0 100.0
Based on total assets less current liabilities of £734.2m (30th June 2013: £785.8m).
Sector Analysis31st December 2013 30th June 2013
Portfolio Benchmark Portfolio Benchmark% % % %
Financials 30.1 26.6 32.0 27.6Consumer Staples 21.1 8.6 21.8 9.4Information Technology 13.5 16.0 10.9 14.7Industrials 9.4 6.5 10.0 6.3Consumer Discretionary 9.0 8.9 8.6 8.3Energy 5.1 11.3 5.2 11.4Materials 3.8 9.7 3.3 9.5Telecommunication Services 3.6 7.4 3.5 7.9Health Care 0.7 1.7 0.9 1.5Utilities — 3.3 — 3.4
Total equities 96.3 100.0 96.2 100.0
Liquidity fund 2.0 — 3.6 —Net current assets 1.7 — 0.2 —
Total 100.0 100.0 100.0 100.0
Based on total assets less current liabilities of £734.2m (30th June 2013: £785.8m).
Portfolio Analyses
JPMorgan Emerging Markets Investment Trust plc. Half Year Report & Accounts 20138
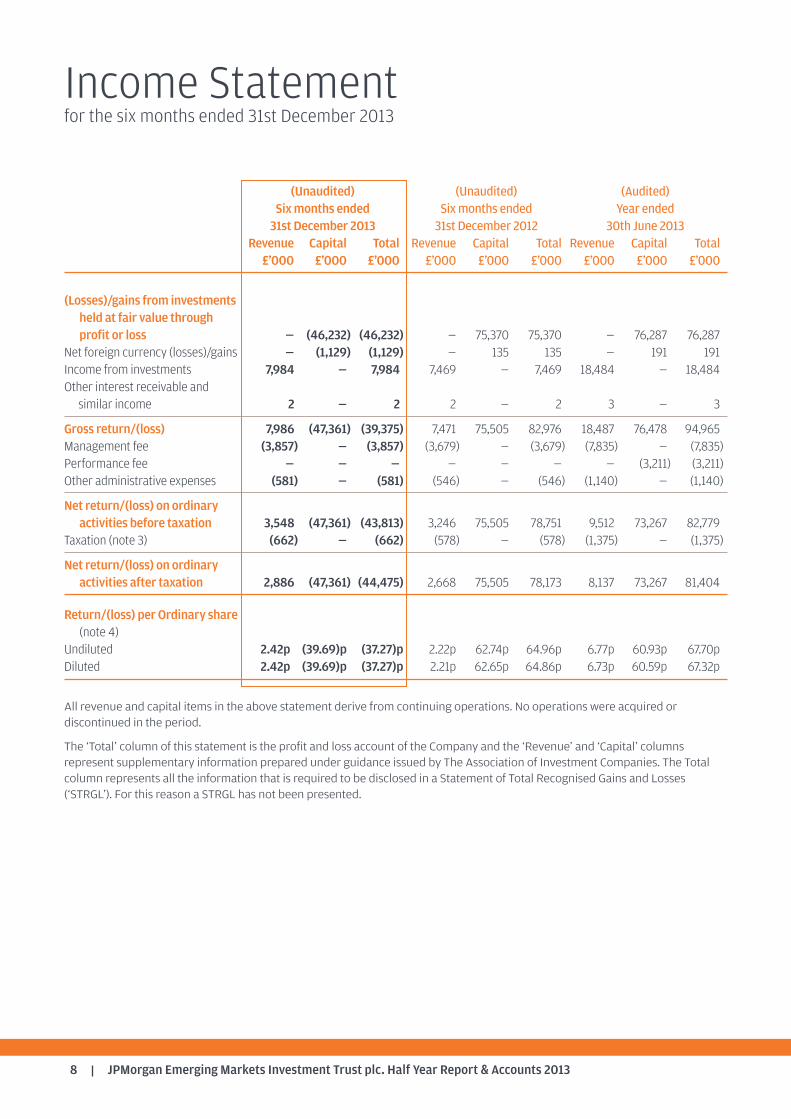
Income Statementfor the six months ended 31st December 2013
(Unaudited) (Unaudited) (Audited)Six months ended Six months ended Year ended31st December 2013 31st December 2012 30th June 2013
Revenue Capital Total Revenue Capital Total Revenue Capital Total£’000 £’000 £’000 £’000 £’000 £’000 £’000 £’000 £’000
(Losses)/gains from investments held at fair value through profit or loss — (46,232) (46,232) — 75,370 75,370 — 76,287 76,287
Net foreign currency (losses)/gains — (1,129) (1,129) — 135 135 — 191 191Income from investments 7,984 — 7,984 7,469 — 7,469 18,484 — 18,484Other interest receivable and similar income 2 — 2 2 — 2 3 — 3
Gross return/(loss) 7,986 (47,361) (39,375) 7,471 75,505 82,976 18,487 76,478 94,965Management fee (3,857) — (3,857) (3,679) — (3,679) (7,835) — (7,835)Performance fee — — — — — — — (3,211) (3,211)Other administrative expenses (581) — (581) (546) — (546) (1,140) — (1,140)
Net return/(loss) on ordinary activities before taxation 3,548 (47,361) (43,813) 3,246 75,505 78,751 9,512 73,267 82,779
Taxation (note 3) (662) — (662) (578) — (578) (1,375) — (1,375)
Net return/(loss) on ordinary activities after taxation 2,886 (47,361) (44,475) 2,668 75,505 78,173 8,137 73,267 81,404
Return/(loss) per Ordinary share(note 4)
Undiluted 2.42p (39.69)p (37.27)p 2.22p 62.74p 64.96p 6.77p 60.93p 67.70pDiluted 2.42p (39.69)p (37.27)p 2.21p 62.65p 64.86p 6.73p 60.59p 67.32p
All revenue and capital items in the above statement derive from continuing operations. No operations were acquired ordiscontinued in the period.
The ‘Total’ column of this statement is the profit and loss account of the Company and the ‘Revenue’ and ‘Capital’ columnsrepresent supplementary information prepared under guidance issued by The Association of Investment Companies. The Totalcolumn represents all the information that is required to be disclosed in a Statement of Total Recognised Gains and Losses(‘STRGL’). For this reason a STRGL has not been presented.
JPMorgan Emerging Markets Investment Trust plc. Half Year Report & Accounts 2013 9
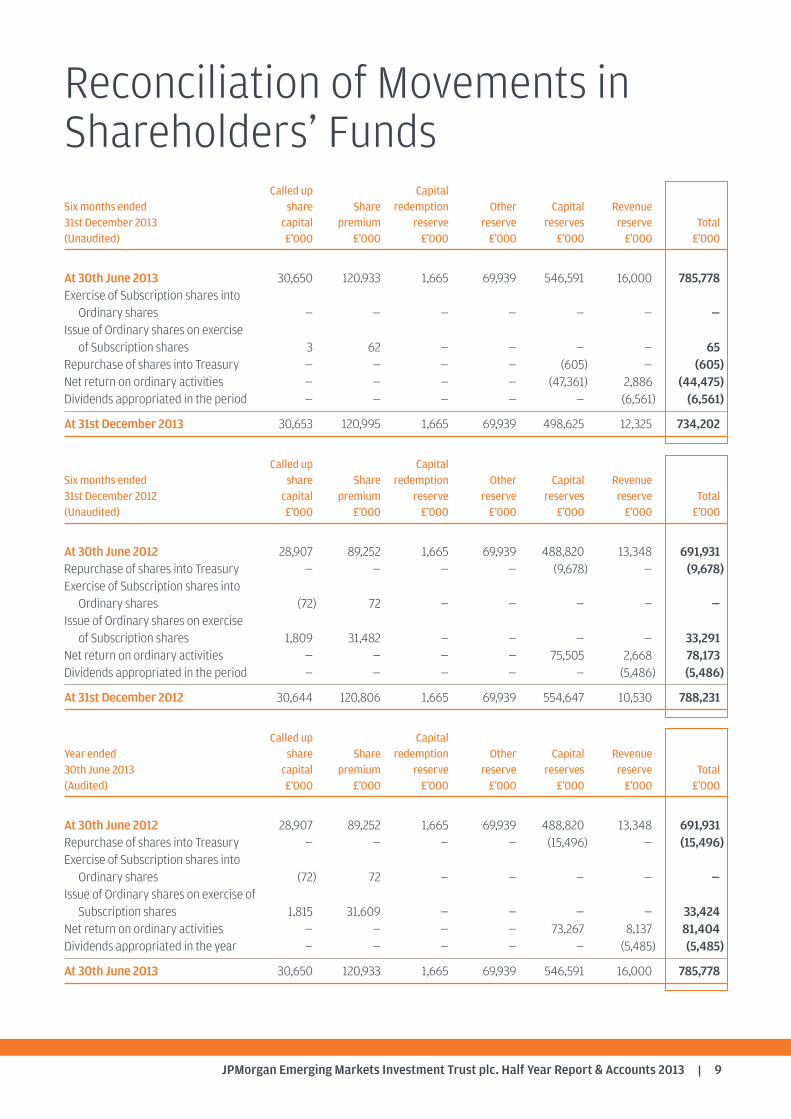
Reconciliation of Movements inShareholders’ Funds
Called up CapitalSix months ended share Share redemption Other Capital Revenue31st December 2013 capital premium reserve reserve reserves reserve Total(Unaudited) £’000 £’000 £’000 £’000 £’000 £’000 £’000
At 30th June 2013 30,650 120,933 1,665 69,939 546,591 16,000 785,778Exercise of Subscription shares into Ordinary shares — — — — — — —
Issue of Ordinary shares on exerciseof Subscription shares 3 62 — — — — 65
Repurchase of shares into Treasury — — — — (605) — (605)Net return on ordinary activities — — — — (47,361) 2,886 (44,475)Dividends appropriated in the period — — — — — (6,561) (6,561)
At 31st December 2013 30,653 120,995 1,665 69,939 498,625 12,325 734,202
Called up CapitalSix months ended share Share redemption Other Capital Revenue31st December 2012 capital premium reserve reserve reserves reserve Total(Unaudited) £’000 £’000 £’000 £’000 £’000 £’000 £’000
At 30th June 2012 28,907 89,252 1,665 69,939 488,820 13,348 691,931Repurchase of shares into Treasury — — — — (9,678) — (9,678)Exercise of Subscription shares into Ordinary shares (72) 72 — — — — —
Issue of Ordinary shares on exerciseof Subscription shares 1,809 31,482 — — — — 33,291
Net return on ordinary activities — — — — 75,505 2,668 78,173Dividends appropriated in the period — — — — — (5,486) (5,486)
At 31st December 2012 30,644 120,806 1,665 69,939 554,647 10,530 788,231
Called up CapitalYear ended share Share redemption Other Capital Revenue30th June 2013 capital premium reserve reserve reserves reserve Total(Audited) £’000 £’000 £’000 £’000 £’000 £’000 £’000
At 30th June 2012 28,907 89,252 1,665 69,939 488,820 13,348 691,931Repurchase of shares into Treasury — — — — (15,496) — (15,496)Exercise of Subscription shares into Ordinary shares (72) 72 — — — — —
Issue of Ordinary shares on exercise of Subscription shares 1,815 31,609 — — — — 33,424
Net return on ordinary activities — — — — 73,267 8,137 81,404Dividends appropriated in the year — — — — — (5,485) (5,485)
At 30th June 2013 30,650 120,933 1,665 69,939 546,591 16,000 785,778
JPMorgan Emerging Markets Investment Trust plc. Half Year Report & Accounts 201310
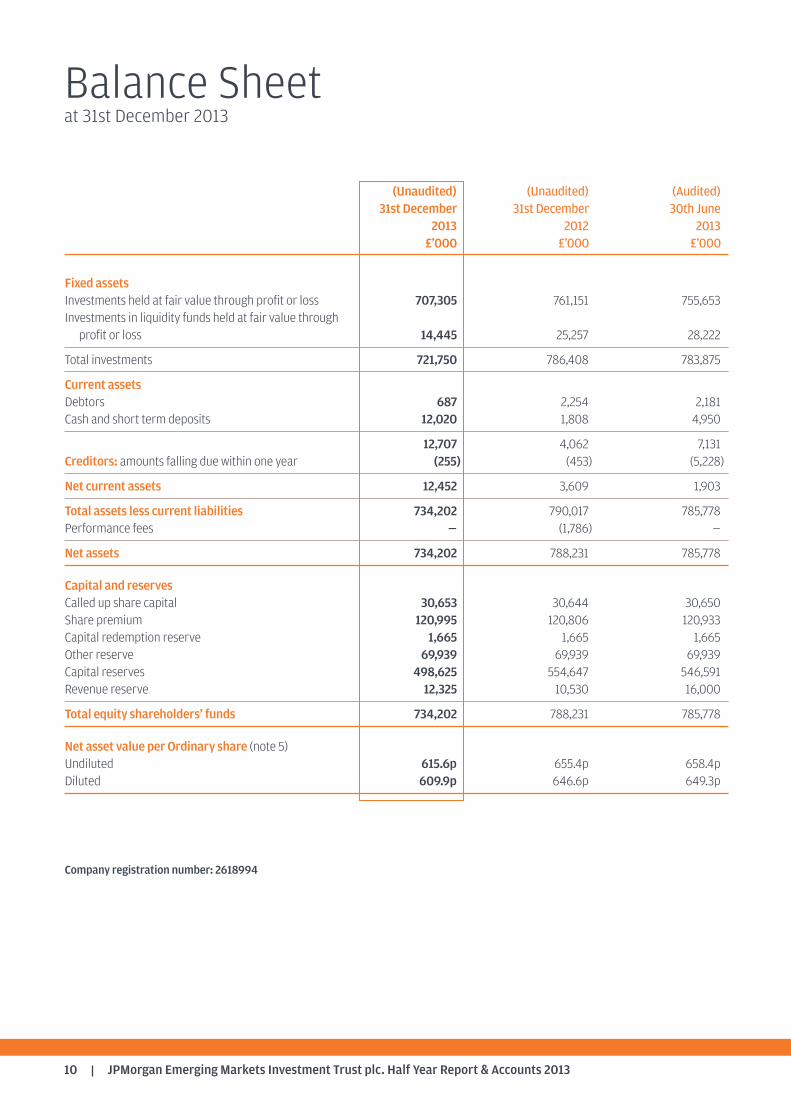
Balance Sheetat 31st December 2013
(Unaudited) (Unaudited) (Audited)31st December 31st December 30th June
2013 2012 2013£’000 £’000 £’000
Fixed assetsInvestments held at fair value through profit or loss 707,305 761,151 755,653Investments in liquidity funds held at fair value through profit or loss 14,445 25,257 28,222
Total investments 721,750 786,408 783,875
Current assetsDebtors 687 2,254 2,181Cash and short term deposits 12,020 1,808 4,950
12,707 4,062 7,131Creditors: amounts falling due within one year (255) (453) (5,228)
Net current assets 12,452 3,609 1,903
Total assets less current liabilities 734,202 790,017 785,778Performance fees — (1,786) —
Net assets 734,202 788,231 785,778
Capital and reservesCalled up share capital 30,653 30,644 30,650Share premium 120,995 120,806 120,933Capital redemption reserve 1,665 1,665 1,665Other reserve 69,939 69,939 69,939Capital reserves 498,625 554,647 546,591Revenue reserve 12,325 10,530 16,000
Total equity shareholders’ funds 734,202 788,231 785,778
Net asset value per Ordinary share (note 5)Undiluted 615.6p 655.4p 658.4pDiluted 609.9p 646.6p 649.3p
Company registration number: 2618994
JPMorgan Emerging Markets Investment Trust plc. Half Year Report & Accounts 2013 11
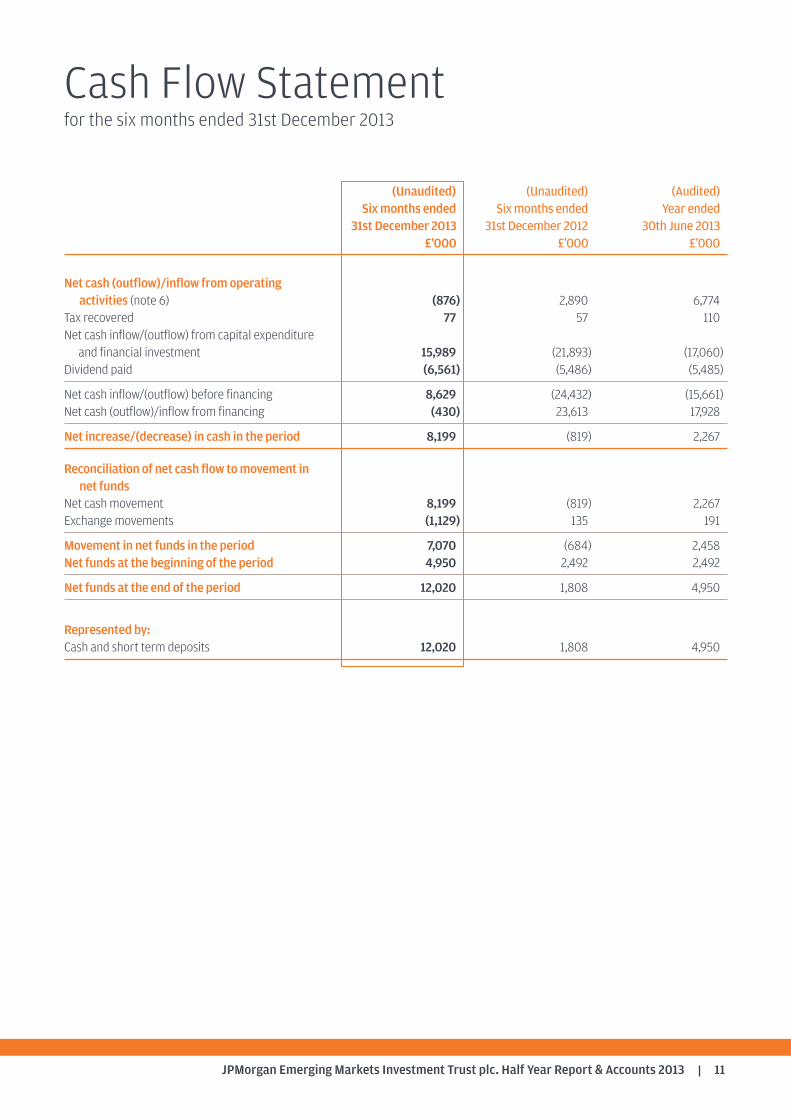
Cash Flow Statementfor the six months ended 31st December 2013
(Unaudited) (Unaudited) (Audited)Six months ended Six months ended Year ended
31st December 2013 31st December 2012 30th June 2013£’000 £’000 £’000
Net cash (outflow)/inflow from operatingactivities (note 6) (876) 2,890 6,774
Tax recovered 77 57 110Net cash inflow/(outflow) from capital expenditureand financial investment 15,989 (21,893) (17,060)
Dividend paid (6,561) (5,486) (5,485)
Net cash inflow/(outflow) before financing 8,629 (24,432) (15,661)Net cash (outflow)/inflow from financing (430) 23,613 17,928
Net increase/(decrease) in cash in the period 8,199 (819) 2,267
Reconciliation of net cash flow to movement in net funds
Net cash movement 8,199 (819) 2,267Exchange movements (1,129) 135 191
Movement in net funds in the period 7,070 (684) 2,458Net funds at the beginning of the period 4,950 2,492 2,492
Net funds at the end of the period 12,020 1,808 4,950
Represented by:Cash and short term deposits 12,020 1,808 4,950
JPMorgan Emerging Markets Investment Trust plc. Half Year Report & Accounts 201312
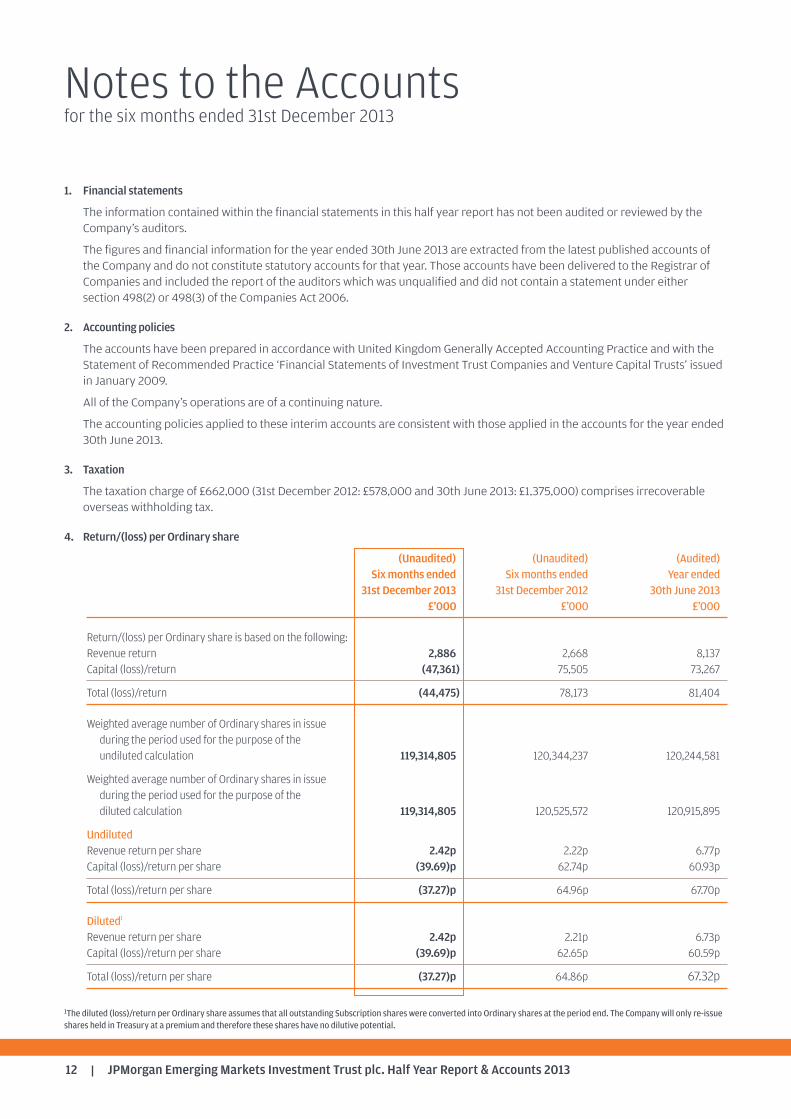
1. Financial statements
The information contained within the financial statements in this half year report has not been audited or reviewed by theCompany’s auditors.
The figures and financial information for the year ended 30th June 2013 are extracted from the latest published accounts ofthe Company and do not constitute statutory accounts for that year. Those accounts have been delivered to the Registrar ofCompanies and included the report of the auditors which was unqualified and did not contain a statement under eithersection 498(2) or 498(3) of the Companies Act 2006.
2. Accounting policies
The accounts have been prepared in accordance with United Kingdom Generally Accepted Accounting Practice and with theStatement of Recommended Practice ‘Financial Statements of Investment Trust Companies and Venture Capital Trusts’ issuedin January 2009.
All of the Company’s operations are of a continuing nature.
The accounting policies applied to these interim accounts are consistent with those applied in the accounts for the year ended30th June 2013.
3. Taxation
The taxation charge of £662,000 (31st December 2012: £578,000 and 30th June 2013: £1,375,000) comprises irrecoverableoverseas withholding tax.
4. Return/(loss) per Ordinary share
(Unaudited) (Unaudited) (Audited)Six months ended Six months ended Year ended
31st December 2013 31st December 2012 30th June 2013£’000 £’000 £’000
Return/(loss) per Ordinary share is based on the following:Revenue return 2,886 2,668 8,137Capital (loss)/return (47,361) 75,505 73,267
Total (loss)/return (44,475) 78,173 81,404
Weighted average number of Ordinary shares in issue during the period used for the purpose of the undiluted calculation 119,314,805 120,344,237 120,244,581
Weighted average number of Ordinary shares in issue during the period used for the purpose of the diluted calculation 119,314,805 120,525,572 120,915,895
UndilutedRevenue return per share 2.42p 2.22p 6.77pCapital (loss)/return per share (39.69)p 62.74p 60.93p
Total (loss)/return per share (37.27)p 64.96p 67.70p
Diluted1
Revenue return per share 2.42p 2.21p 6.73pCapital (loss)/return per share (39.69)p 62.65p 60.59p
Total (loss)/return per share (37.27)p 64.86p 67.32p
1The diluted (loss)/return per Ordinary share assumes that all outstanding Subscription shares were converted into Ordinary shares at the period end. The Company will only re-issueshares held in Treasury at a premium and therefore these shares have no dilutive potential.
Notes to the Accountsfor the six months ended 31st December 2013
JPMorgan Emerging Markets Investment Trust plc. Half Year Report & Accounts 2013 13
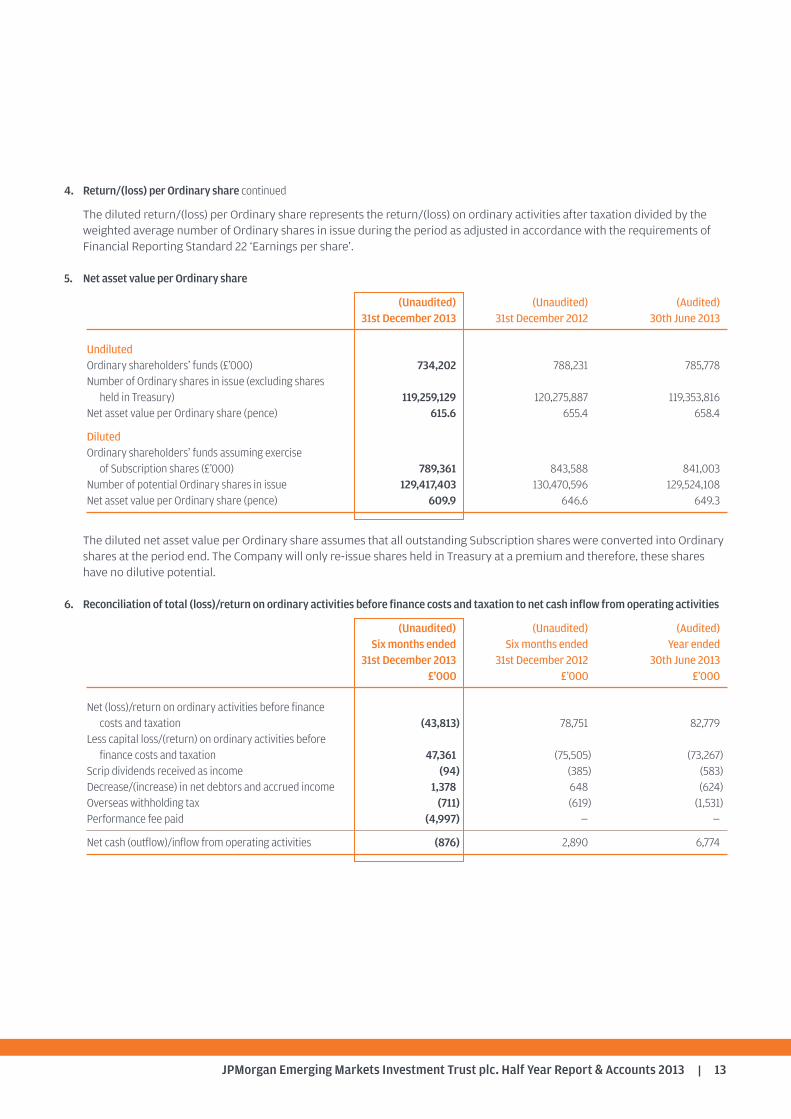
4. Return/(loss) per Ordinary share continued
The diluted return/(loss) per Ordinary share represents the return/(loss) on ordinary activities after taxation divided by theweighted average number of Ordinary shares in issue during the period as adjusted in accordance with the requirements ofFinancial Reporting Standard 22 ‘Earnings per share’.
5. Net asset value per Ordinary share
(Unaudited) (Unaudited) (Audited)31st December 2013 31st December 2012 30th June 2013
UndilutedOrdinary shareholders’ funds (£’000) 734,202 788,231 785,778Number of Ordinary shares in issue (excluding shares held in Treasury) 119,259,129 120,275,887 119,353,816
Net asset value per Ordinary share (pence) 615.6 655.4 658.4
DilutedOrdinary shareholders’ funds assuming exerciseof Subscription shares (£’000) 789,361 843,588 841,003
Number of potential Ordinary shares in issue 129,417,403 130,470,596 129,524,108Net asset value per Ordinary share (pence) 609.9 646.6 649.3
The diluted net asset value per Ordinary share assumes that all outstanding Subscription shares were converted into Ordinaryshares at the period end. The Company will only re-issue shares held in Treasury at a premium and therefore, these shareshave no dilutive potential.
6. Reconciliation of total (loss)/return on ordinary activities before finance costs and taxation to net cash inflow from operating activities
(Unaudited) (Unaudited) (Audited)Six months ended Six months ended Year ended
31st December 2013 31st December 2012 30th June 2013£’000 £’000 £’000
Net (loss)/return on ordinary activities before finance costs and taxation (43,813) 78,751 82,779
Less capital loss/(return) on ordinary activities before finance costs and taxation 47,361 (75,505) (73,267)
Scrip dividends received as income (94) (385) (583)Decrease/(increase) in net debtors and accrued income 1,378 648 (624)Overseas withholding tax (711) (619) (1,531)Performance fee paid (4,997) — —
Net cash (outflow)/inflow from operating activities (876) 2,890 6,774
JPMorgan Emerging Markets Investment Trust plc. Half Year Report & Accounts 201314
Interim Management Report
The Company is required to make the following disclosures inits half year report:
Principal Risks and Uncertainties
The principal risks and uncertainties faced by the Companyhave not changed and fall into the following broad categories:investment underperformance; political and economic; loss ofinvestment team or investment manager; discount; change ofcorporate control of the manager; accounting, legal andregulatory; corporate governance and shareholder relations;operational and financial. Information on each of these areas isgiven in the Business Review within the Annual Report andAccounts for the year ended 30th June 2013.
Related Parties Transactions
During the first six months of the current financial year, notransactions with related parties have taken place which havematerially affected the financial position or the performance ofthe Company during the period.
Going Concern
The Directors believe, having considered the Company’sinvestment objectives, risk management policies, capitalmanagement policies and procedures, nature of the portfolioand expenditure projections, that the Company has adequateresources, an appropriate financial structure and suitablemanagement arrangements in place to continue in operationalexistence for the foreseeable future. For these reasons, theyconsider there is reasonable evidence to continue to adopt thegoing concern basis in preparing the accounts.
Directors’ Responsibilities
The Board of Directors confirms that, to the best of itsknowledge:
(i) the condensed set of financial statements containedwithin the half yearly financial report has beenprepared in accordance with the Accounting StandardsBoard’s Statement ‘Half Yearly Financial Reports’ andgives a true and fair view of the state of affairs of theCompany and of the assets, liabilities, financial positionand net return of the Company, as at 31st December2013, as required by the UK Listing Authority Disclosureand Transparency Rules 4.2.4R; and
(ii) the interim management report includes a fair review ofthe information required by 4.2.7R and 4.2.8R of the UKListing Authority Disclosure and Transparency Rules.
In order to provide these confirmations, and in preparing thesefinancial statements, the Directors are required to:
• select suitable accounting policies and then apply themconsistently;
• make judgements and accounting estimates that arereasonable and prudent;
• state whether applicable UK Accounting Standards havebeen followed, subject to any material departures disclosedand explained in the financial statements; and
• prepare the financial statements on the going concern basisunless it is inappropriate to presume that the Company willcontinue in business;
and the Directors confirm that they have done so.
For and on behalf of the Board
Alan SaundersChairman 24th February 2014
JPMorgan Emerging Markets Investment Trust plc. Half Year Report & Accounts 2013 15
Subscription Shares
On 11th June 2009 the Company issued Subscription shares asa bonus issue to the Ordinary shareholders on the basis of oneSubscription share for every five Ordinary shares held. EachSubscription share confers the right (but not the obligation) tosubscribe for one Ordinary share on any business day duringthe period from 1st August 2009 to 31st July 2014, after whichthe rights on the Subscription shares will lapse.
During the period, shareholders exercised their right to convert7,236,663 Subscription shares into Ordinary shares for a totalconsideration of £33.3 million. Since the period end and at thetime of writing, shareholders have exercised their right toconvert a further 2,408 Subscription shares into Ordinaryshares for a total consideration of £13,100.
The Subscription shares are exercisable between 1st August2012 and 31st July 2014 at a price of 543 pence.
Notice of the exercise of the Subscription rights may be givenat any time until 31st July 2014 and the Ordinary shares arisingon conversion will be issued within ten business days of thefirst business day of the calendar month following the month inwhich the relevant notices are received by the registrars.For further details on how to exercise the Subscription sharerights please refer to the Company’s website atwww.jpmemergingmarkets.co.uk or contact the CompanySecretary on 020 7742 4000.
For the purposes of UK taxation, the issue of Subscriptionshares is treated as a reorganisation of the Company’s sharecapital. Whereas such reorganisations do not trigger achargeable disposal for the purposes of the taxation of capitalgains, they do require shareholders to reallocate the base costsof their Ordinary shares between Ordinary shares andSubscription shares received.
At the close of business on 11th June 2009 the middle marketprices of the Company’s Ordinary shares and Subscriptionshares were as follows:
Ordinary shares: 392pSubscription shares: 57p
Accordingly an individual investor who on 10th June 2009 heldfive Ordinary shares (or a multiple thereof) would havereceived a bonus issue of one Subscription share (or therelevant multiple thereof) and would apportion the base cost ofsuch holding 97.17% to the five Ordinary shares and 2.83% tothe Subscription share.

JPMorgan Emerging Markets Investment Trust plc. Half Year Report & Accounts 201316
Glossary of Terms and Definitions
Portfolio return net of fees and expenses
Return on net assets, net of management and performancefees and administration expenses, but excluding both theeffect of Subscription shares which have been convertedduring the period and the dilutive impact of Subscriptionshares in issue at the period end.
Return to Ordinary shareholders
Total return to the Ordinary shareholder on a mid-marketprice to mid-market price basis, assuming that all dividendsreceived were reinvested, without transaction costs, into theOrdinary shares of the Company at the time the shares werequoted ex-dividend.
Fully diluted net asset value (‘NAV’) per Ordinary share
The NAV per Ordinary share assuming that all Subscriptionshares in issue were converted into Ordinary shares at theperiod end at the current exercise price of 460 pence pershare.
Fully diluted return on net assets
Return on the diluted net asset value (‘NAV’) per share, on abid value to bid value basis, assuming that all dividends paidout by the Company were reinvested, without transactioncosts, into the shares of the Company at the NAV per share atthe time the shares were quoted ex-dividend.
In accordance with industry practice, dividends payablewhich have been declared but which are unpaid at thebalance sheet date are deducted from the NAV whencalculating the return on net assets.
Benchmark return
Total return on the benchmark, on a mid-market value tomid-market value basis, assuming that all dividends receivedwere reinvested into the shares of the underlying companiesat the time the shares were quoted ex-dividend.
The benchmark is a recognised index of stocks which shouldnot be taken as wholly representative of the Company’sinvestment universe. The Company’s investment strategydoes not ‘track’ this index and consequently, there may besome divergence between the Company’s performance andthat of the benchmark.
Ordinary share price discount to fully diluted net asset vale(‘NAV’) per Ordinary share
If the share price of an investment trust is lower than the NAVper share, the shares are said to be trading at a discount. Thediscount is shown as a percentage of the NAV per share. Theopposite of a discount is a premium. It is more common foran investment trust’s shares to trade at a discount than at apremium.
Return per Ordinary share – Undiluted
The undiluted return per Ordinary share represents thereturn on ordinary activities after taxation divided by theweighted average number of Ordinary shares in issue duringthe period.
Return per Ordinary share – Diluted
The diluted return per Ordinary share represents the returnon ordinary activities after taxation divided by the weightedaverage number of Ordinary shares in issue during the periodas adjusted in accordance with the requirements of FinancialReporting Standard 22 ‘Earnings per share’.
Fraudsters use persuasive and high-pressure tactics to lure investors into scams. They may offer to sell shares that turn out to beworthless or non-existent, or to buy shares at an inflated price in return for an upfront payment. While high profits are promised, ifyou buy or sell shares in this way you will probably lose your money.
Keep in mind that firms authorised by the FCAare unlikely to contact you out of the blue withan offer to buy or sell shares.
Do not get into a conversation, note the nameof the person and firm contacting you and thenend the call.
Check the Financial Services Register fromwww.fca.org.uk to see if the person and firmcontacting you is authorised by the FCA.
Beware of fraudsters claiming to be from anauthorised firm, copying its website or givingyou false contact details.
Use the firm’s contact details listed on theRegister if you want to call it back.
Call the FCA on 0800 111 6768 if the firm doesnot have contact details on the Register or youare told they are out of date.
Search the list of unauthorised firms to avoid atwww.fca.org.uk/scams.
Consider that if you buy or sell shares from anunauthorised firm you will not have access to theFinancial Ombudsman Service or FinancialServices Compensation Scheme.
Think about getting independent financial andprofessional advice before you hand over anymoney.
Remember: if it sounds too good to be true, itprobably is!
If you are approached by fraudsters please tell theFCA using the share fraud reporting form atwww.fca.org.uk/scams, where you can find outmore about investment scams.
You can also call the FCA Consumer Helpline on0800 111 6768.
If you have already paid money to share fraudstersyou should contact Action Fraud on 0300 123 2040.
5,000 people contact the Financial ConductAuthority about share fraud each year,with victims losing an average of £20,000
1 6
7
8
9
10
2
3
4
5
Beware of share fraud
How to avoid share fraud
Report a scam
In association with:
Financial Conduct Authority
HistoryThe Company was launched in July 1991 with assets of £60 million. InMarch 1993 the Company raised a further £50 million by an issue ofconversion shares. On 13th April 2006, an additional £76 million wasraised by an issue of shares following the reconstruction of F&C EmergingMarkets Investment Trust plc. The Company adopted its current name inNovember 2005.
DirectorsAlan Saunders (Chairman)Sarah Arkle David GambleAnatole KaletskyNigel KennyPercy Mistry
Company NumbersCompany registration number: 2618994
Ordinary sharesLondon Stock Exchange number: 0341895ISIN: GB0003418950Bloomberg code: JMG LN
Subscription sharesLondon Stock Exchange number: B3V4X02ISIN: GB00B3V4X029Bloomberg code: JMGS LN
Market InformationThe Company’s net asset value (‘NAV’) per share is published daily via theLondon Stock Exchange. The Company’s Ordinary shares are listed on theLondon Stock Exchange and quoted daily in the Financial Times, TheTimes, the Daily Telegraph, The Scotsman and on the J.P. Morgan websiteat www.jpmemergingmarkets.co.uk, where the Ordinary share priceis updated every fifteen minutes during trading hours.The Company’s Subscription share price is listed on the London StockExchange and quoted daily in the Financial Times and on the J.P. Morganwebsite at www.jpmemergingmarkets.co.uk, where the Subscriptionshare price is updated every fifteen minutes during trading hours.
Websitewww.jpmemergingmarkets.co.uk
Share TransactionsThe Company’s shares may be dealt in directly through a stockbroker orprofessional adviser acting on an investor’s behalf. They may alsobe purchased and held through the J.P. Morgan Investment Account,J.P. Morgan ISA and J.P. Morgan SIPP. These products are all available on theonline wealth manager service, J.P. Morgan WealthManager+ available atwww.jpmorganwealthmanagerplus.co.uk
Manager and Company SecretaryJPMorgan Asset Management (UK) Limited
Company’s Registered OfficeFinsbury Dials20 Finsbury StreetLondon EC2Y 9AQTelephone: 020 7742 4000For company secretarial and administrative matters, please contactJonathan Latter.
CustodianJPMorgan Chase Bank, N.A.25 Bank StreetCanary WharfLondon E14 5JP
RegistrarsEquiniti LimitedReference 1081Aspect HouseSpencer RoadLancingWest Sussex BN99 6DATelephone: 0871 384 2320Calls to this number cost 8p per minute from a BT landline. Other providers’costs may vary. Lines open 8.30 a.m. to 5.30 p.m., Monday to Friday. Theoverseas helpline number is +44 (0)121 415 7047.Notifications of changes of address and enquiries regarding sharecertificates or dividend cheques should be made in writing to theRegistrar quoting reference 1081. Registered shareholders can obtain further details on their holdings onthe internet by visiting www.shareview.co.uk
Independent AuditorsPricewaterhouseCoopers LLPChartered Accountants and Statutory Auditors7 More London RiversideLondon SE1 2RT
BrokersWinterflood Securities LimitedThe Atrium Building Cannon Bridge25 Dowgate HillLondon EC4R 2GATelephone number: 020 3100 0000
Savings Product AdministratorsFor queries on the J.P. Morgan Investment Account, J.P. Morgan ISA andJ.P. Morgan SIPP, please see the contact details on the back cover of thisreport.
Information about the Company
Financial CalendarFinancial year end 30th JuneFinal results announced SeptemberHalf year end DecemberHalf year results announced FebruaryInterim Management Statements announced May and November Final dividend on Ordinary shares paid NovemberSubscription share exercise dates 1st August 2009 to 31st July 2014Annual General Meeting November
A member of the AIC
JPMorgan Emerging Markets Investment Trust plc. Half Year Report & Accounts 2013 17

J.P. Morgan HelplineFreephone 0800 20 40 20 or +44 (0)20 7742 9995
Your telephone call may be recorded for your security
www.jpmemergingmarkets.co.uk