clean water act section 319 nonpoint …denr.sd.gov/dfta/wp/wqprojects/grasslandseg2fnlrpt.pdf ·...
TRANSCRIPT

CLEAN WATER ACT SECTION 319
NONPOINT SOURCE CONTROL PROGRAM
FINAL REPORT
GRASSLANDS MANAGEMENT AND PLANNING PROJECT
SEGMENT 2
SPONSOR
SOUTH DAKOTA GRASSLANDS COALTION
PROJECT COORDINATOR
JUSTIN JESSOP
DECEMBER 2010
This project was conducted in cooperation with the State of South Dakota and the United
States Environmental Protection Agency, Region VIII.
Grants C9998185-03, C9998185-04 andC9998185-07
i
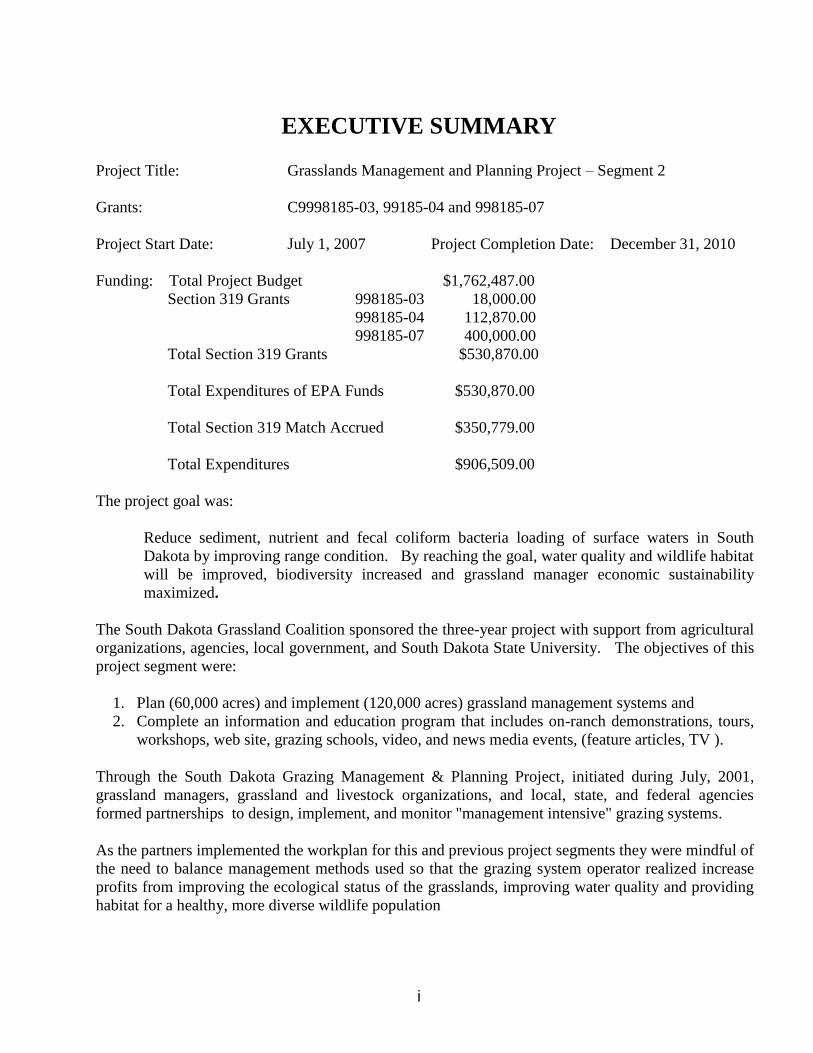
EXECUTIVE SUMMARY
Project Title: Grasslands Management and Planning Project – Segment 2
Grants: C9998185-03, 99185-04 and 998185-07
Project Start Date: July 1, 2007 Project Completion Date: December 31, 2010
Funding: Total Project Budget $1,762,487.00
Section 319 Grants 998185-03 18,000.00
998185-04 112,870.00
998185-07 400,000.00
Total Section 319 Grants $530,870.00
Total Expenditures of EPA Funds $530,870.00
Total Section 319 Match Accrued $350,779.00
Total Expenditures $906,509.00
The project goal was:
Reduce sediment, nutrient and fecal coliform bacteria loading of surface waters in South
Dakota by improving range condition. By reaching the goal, water quality and wildlife habitat
will be improved, biodiversity increased and grassland manager economic sustainability
maximized.
The South Dakota Grassland Coalition sponsored the three-year project with support from agricultural
organizations, agencies, local government, and South Dakota State University. The objectives of this
project segment were:
1. Plan (60,000 acres) and implement (120,000 acres) grassland management systems and
2. Complete an information and education program that includes on-ranch demonstrations, tours,
workshops, web site, grazing schools, video, and news media events, (feature articles, TV ).
Through the South Dakota Grazing Management & Planning Project, initiated during July, 2001,
grassland managers, grassland and livestock organizations, and local, state, and federal agencies
formed partnerships to design, implement, and monitor "management intensive" grazing systems.
As the partners implemented the workplan for this and previous project segments they were mindful of
the need to balance management methods used so that the grazing system operator realized increase
profits from improving the ecological status of the grasslands, improving water quality and providing
habitat for a healthy, more diverse wildlife population

ii
When the project began, an estimated 83 percent of South Dakota’s grasslands were rated in poor, fair,
or good condition (ecological status) providing less than optimum environmental and economic
benefits. Since 2001, 140 livestock producers who manage nearly 550,000 acres of grassland in 36
counties have received assistance for the development and implementation of managed grazing
systems that range from 30 to over 31,500 acres in size. Of the total, 53 producers who manage
approximately 166,000 acres were provided assistance during project segment 2. The practices
installed and management techniques adopted have resulted in improved range condition by at least
one ecological class condition level, primarily from fair to good.
In addition designing and installing managed grazing systems, information learned from on-ranch
demonstrations and other producers was shared with other grassland managers, researchers, agency
specialists, and the public. Information about the sites and the lessons learned is available by visiting:
http://www.sdconservation.org/grassland/managing/gmd/index.html
According to an evaluation conducted by South Dakota State University of two demonstration sites,
“good grassland management stabilized forage production and thereby improved efficiency of the
water cycle by reducing runoff”.
Opportunities to learn about the project and the environmental and economic benefits of managed
grazing were provided to over 2,000,000 individuals. The total includes estimated booth traffic at
events (conferences, trade shows, etc.); attendance at field days, workshops, and meetings; circulation
of periodicals and radio station market share.
An unexpected outcome of the grassland project was the development of working relationships with
nature and environmental groups or members of groups such as the South Dakota Ornithologist Union
and the Sand County Foundation. These alliances have generated support of managed grazing as not
only a water quality best management practice (BMP) that has a positive impact for producers
installing the practice, but also a practice that promotes preservation of grasslands and therefore
habitat for game and non game species of animals and the preservation of native vegetation. It is
suggested that this support maybe a critical factor in generating support for programs that will slow the
conversion of grass to crop land that is taking place in the Prairie Pothole region. Central SD is an
area where the rate of conversion is especially high.
The Sand County foundation sponsors the Leopold Conservation Award. The award recognizes
leadership in voluntary conservation and ethical land management. During 2010, because of the SD
Grasslands Coalition’s demonstrated success with the implementation of grassland conservation
practices, the foundation partnered with the coalition to serve as the sponsor for the Leopold
Conservation Award in South Dakota. The coalition is in the process of identifying additional partners
and sponsorships for the awards program.
Using the activities developed, program efforts are expected to continue to bring grassland acres under
active grazing management plans, resulting in improved range conditions that will lead to improved
water quality across the state.
The project goal was attained.

iii
TABLE OF CONTENTS
EXECUTIVE SUMMARY ................................................................................................................... i
TABLE OF CONTENTS ..................................................................................................................... iii
List of Tables ....................................................................................................................................... iii
List of Figures ...................................................................................................................................... iv
List of Appendices ............................................................................................................................... iv
INTRODUCTION ................................................................................................................................ 1
Project Goals, Objectives, and Activities ............................................................................................. 5
Project Goal ...................................................................................................................................... 5
MONITORING AND EVALUATION .............................................................................................. 42
Monitoring Activities ...................................................................................................................... 42
Evaluation ....................................................................................................................................... 43
LOAD REDUCTIONS ....................................................................................................................... 45
BEST MANAGEMENT PRACTICES DEVELOPED OR REVISED ............................................. 46
RELATIONSHIP TO MANAGEMENT PLAN ................................................................................ 47
COORDINATION AND PUBLIC PARTICIPATION ...................................................................... 49
Coordination ................................................................................................................................... 49
Public Participation ......................................................................................................................... 49
RECOMMENDATIONS .................................................................................................................... 51
Aspects of the Project That Did Not Work Well ............................................................................ 51
Recommendations ........................................................................................................................... 51
PROJECT BUDGET AND EXPENDITURES .................................................................................. 52
CONCLUSIONS................................................................................................................................. 55
List of Tables
Table 1. Managed Grazing Plans Developed By Project Staff. .......................................................... 6
Table 2. Grazing Plans Developed As A Result of Project Activities. ................................................ 6
Table 3. Practices used to Install Managed Grazing Systems. ............................................................ 7
Table 4. Managed Grazing Systems Installed Using Plans Developed By The Project. .................... 11
Table 5. Managed Grazing Systems Resulting From Project Related Activities. ............................. 12
Table 6. NPS Load Reductions Realized From Rotational Grazing Systems Installed..................... 15
Table 7. Practices Used to Install the Big Sioux Grazing System Demonstration Site. .................... 16
Table 8. Website "Hits" During Project Segment 2. .......................................................................... 18
Table 9. Information Transfer - Educational Outreach Activities Milestone Comparison................ 19
Table 10. Tours and Field Days. ........................................................................................................ 21
Table 11. Attendance at Grazing Schools. ......................................................................................... 27
Table 12. Summary of Events at Which the Project Display was used. ............................................ 31
Table 13. Project Related Presentations. ............................................................................................ 34
Table 14. Project Related News Articles. .......................................................................................... 36
Table 15. Summary of Outreach Activities. ...................................................................................... 38
Table 16. Load Reductions Realized From Grazing Systems Installed............................................. 45
Table 17. Project Partners Contributions. .......................................................................................... 50

iv
Table 18. Project Budget - Expenditures Comparison....................................................................... 53
Table 19. Comparison of Planned vs. Accomplished Milestones. .................................................... 55
List of Figures
Figure 1. Managed grazing system design. .......................................................................................... 8
Figure 2. Grazing stick. ........................................................................................................................ 9
Figure 3. Grassland managers and producers learning to use a grazing stick. .................................... 9
Figure 4. Above ground pipe with quick coupler. ............................................................................. 13
Figure 5. Locations of managed grazing systems installed. ............................................................... 14
Figure 6. Project display at the 2010 Beef Day at the Capitol in Pierre, SD. .................................... 18
Figure 7. Brown and Fuhrer explain the use of cover crops during the 2008 grazing tour. .............. 22
Figure 8. Highlander Cattle move to a new paddock as tour participants watch. .............................. 23
Figure 9. 2009 Bird Tour participants............................................................................................... 24
Figure 10. Grassland managers learn to use transects to determine available forage. ....................... 28
Figure 11. Bannister addressing the South Dakota Grazing School Alumni Event. ......................... 29
Figure 12. 2009 Grazing School students learn pasture allocation. ................................................... 30
Figure 13. "Rangeland Cafe" activity at the 2008 Washington Pavilion Ag Day. ............................ 32
Figure 14. "Plant a Brand" activity at the 2009 Washington Pavilion Ag Day. ................................ 32
List of Appendices
Appendix 1 – Eastern South Dakota Riparian Demonstration Project
Appendix 2 – Riparian Demonstration Sites
Appendix 3 - 2008 Bus Tour
Appendix 4 - 2009 Bird Tour
Appendix 5 - 2007 West River/Lyman-Jones Rural Water System annual meeting
Appendix 6 - Range & Pasture Journal insert

1
INTRODUCTION
The Grasslands Management and Planning Project was developed to continue the implementation of
grazing management practices that reduce NPS by improving range condition initiated during 2001
by the Grazing Management & Planning Project (formerly the Management Intensive Grazing
Systems (MIG) Project). The project was funded in part by Environmental Protection Agency
(EPA) Clean Water Act Section 319 Project Grant numbers C9981850-3, C9981850-4 C9981850-7
awarded through the South Dakota Department of Environment and Natural Resources (DENR).
The current, as well as the previously referenced projects, were completed by the South Dakota
Grasslands Coalition (SDGLC) in partnership with agricultural organizations; local, state, and
federal agencies and the academic community. Since the coalition was formed during 1998, its
principle project partners have included the:
South Dakota Association of Conservation Districts (SDACD),
United States Department of Agriculture (USDA) Natural Resource Conservation Service
(NRCS),
South Dakota State University (SDSU),
South Dakota Department of Game, Fish & Parks (GF&P),
United States Department of Interior-Fish and Wildlife Service (USFWS)-South Dakota
Partners for Fish and Wildlife (US FWS), and
DENR
Each project partner contributed financial and/or technical assistance that generated the synergy
which resulted in project acceptance by a wide range of interests and the level of success achieved.
A complete list of project partners and their contributions to project success is located in
coordination section of this report.
SDGLC is part of the Natural Resources Conservation Service (NRCS) Grazing Lands Conservation
Initiative (GLCI). The initiative is a nationwide effort designed to provide technical assistance to
private grazing land operators and increase the awareness of the importance of grazing land
resources. For additional information about the SDGLC visit:
http://www.sdgrass.org/
During completion of the Managed Intensive Grazing Project Implementation Plan (PIP) from 1999
to 2001, project activities centered primarily on establishing demonstration sites to showcase the
grazing system alternatives that grassland managers could employ to improve forage production by
improving range condition. The improved range condition and associated forage production
increase would, in turn, increase the pounds of livestock produced on a per acre basis while at the
same time improving range condition and thereby reducing NPS.
A map showing the locations of the demonstration sites established is available by visiting:
http://www.sdconservation.org/grassland/managing/gmd/projects.html

2
Accomplishments realized and challenges encountered during the MIG and Segment One projects
are summarized below.
For a more complete description of the activities and outcomes visit the web sites listed below:
http://denr.sd.gov/dfta/wp/WQProjects/Grasslands.pdf
http://www.sdgrass.org/
http://www.sdconservation.org/grassland/managing/gmd/index.html
During the implementation of the South Dakota Grazing Management & Planning Project (MIG)
grassland managers, grassland and livestock organizations, and local, state, and federal agencies
partnered to design, implement, and monitor six managed grazing demonstration sites totaling 7,681
acres. Information gained from the on-ranch demonstrations and other producers was shared with
grassland managers, researchers, agency specialists, and the public.
The successes realized from the activities completed during the MIG Project were used to develop
the initial Grasslands Management and Planning Project workplan implemented during 2001 – 2007.
Financial assistance for the project was provided by a Section 319 Implementation Project Grant
number C9998185-01 secured through DENR. During completion of the project, here-in-after
referred to as project segment 1, SDGLC and its project partners installed or were responsible for the
installation of grazing management practices on more than 380,000 acres that resulted in the
reduction of Nitrogen, Phosphorous and fecal coliform bacteria entering South Dakota’s lakes and
streams by 166,974 lbs, 32,227 lbs and 19,484 tons respectively,
Conservation practices used to install the grazing systems included:
water development – wells, pipeline tanks, pasture pumps and dams and dugouts,
fence - cross, perimeter and riparian exclusion,
managed /rotational grazing,
stream crossings, and
grass seeding
Information and education (I&E)/outreach activities completed during Segment one that provided
managed grazing information and opportunities to more than 2,200,000 people included:
4 grazing schools – total attendance = 78 ranchers and resource managers,
15 ranch tours including 3 bird tours – total attendance = approximately 800 individuals,
21 media events (number includes news release booths and the Range & Pasture Journal
insert in the Cattle Business Weekly) – total circulation/listeners = more than 1,517,000,
12 workshops, including holistic resource management workshops (HRM), total
attendance = 345, and
continuation/expansion of the demonstration sites established during the MIG Project.

3
Project segment 2 was designed to continue the implementation of NPS reduction BMPs on
grasslands initiated during the MIG and project segment 1. During the completion of the two
and one-half year project period, The SD Grassland Coalition and its project partners:
provided 29 livestock producers who manage over 79,952 acres of South Dakota
grasslands with the assistance needed to design and install grazing systems that ranged in
size from 22 to more than 17,750 acres and assisted 23 producers who manage 86,043
acres with the installation of grazing systems planned by other agencies,
maintained two of the demonstration sites developed during the MIG and project segment
1 and developed an additional three demonstration sites to showcase managed grazing
alternatives and evaluate the economic and environmental benefits provided by the
systems,
sponsored field days and tours attended by more than 1,500 producers and resource
managers,
conducted three Grazing schools attended by 78 ranchers and resource managers,
maintained the project website which was visited 112,700 times,
Presented project related information at 27 workshops/conferences attended by
approximately 5,600 individuals,
hosted seven exhibits/displays at livestock shows, conventions, and workshops, and
distributed 10 news releases to local media outlets.
During all project phases, there was a trend for producers requesting assistance to be those whose
grazing lands were rated in the fair, good and excellent categories while those with lands rated as
poor were less likely to participate.
Based on information provided by resource inventories and follow-up activities with producers who
installed grazing systems, it is proposed that the practices installed resulted in 75 percent of
participant’s grasslands improving by one ecological class.
The completion of activities planned at the demonstration sites encountered several challenges.
Many of the challenges were related to a less than expected level of producer “buy-in” and
difficulties with attracting summer interns. The latter difficulty was determined related to challenges
SDSU encountered with maintaining continuity in the liaison assigned to coordinate activities with
the University. In summary:
several producers chose to end participation after college interns were not available to assist
with the monitoring activities,
one producer withdrew because of multi-generational farming/family related issues, and
another producer changed his grazing management program to the extent it did not
demonstrate managed grazing practices; which resulted in the SD Grassland Coalition
withdrawing the site from the project.
An unexpected outcome of the grassland project was the development of working relationships with
nature and environmental groups or members of groups such as the South Dakota Ornithologist
Union, Sand County Foundation and North Dakota and Nebraska Grasslands programs.

4
These alliances have generated support of managed grazing as not only a water quality best
management practice (BMP) that has a positive impact for producers installing the practice, but also
a practice that promotes preservation of grasslands and therefore habitat for game and non game
species of animals and the preservation of native vegetation. It is suggested that this support maybe
a critical factor in generating support for programs that will slow the conversion of grassland to
croplands that is taking place in the Prairie Pothole region. Central SD is an area where the rate of
conversion is especially high.
The Sand County foundation sponsors the Leopold Conservation Award. The award recognizes
leadership in voluntary conservation and ethical land management. During 2010, because of the SD
Grasslands Coalition’s demonstrated success with the implementation of grassland conservation
practices, the foundation partnered with the coalition to serve as the sponsor for the Leopold
Conservation Award in South Dakota. The coalition is in the process of identifying additional
partners and sponsorships for the awards program.
http://www.sandcounty.net/initiatives/lca/southdakota/
SD managed grazers recognized for their environmental stewardship accomplishments by other
organizations are profiled below.
Bill and Pennie Slovek, who ranch northwest of Philip, SD, were the recipients of the 2006 South
Dakota Section of Society of Range Management Excellence in Grazing Management Award. The
Sloveks were also nominated National Cattlemen’s Beef Association’s (NCBA) Environmental
Stewardship Achievement Program (ESAP) award during 2009 and 2010. The Environmental
Stewardship Award Program recognizes the outstanding stewardship practices and conservation
achievements of United States cattle producers from across the nation each year.
Jim and Carol Faulstich along with their daughter and son-in-law Jacquie and Adam Roth were the
2009 Region VII National Cattlemen’s Beef Association’s Environmental Stewardship Award
winners. They were nominated by the South Dakota Grasslands Coalition, and endorsed by United
States Fish and Wildlife Service-South Dakota Partners for Fish and Wildlife Program, South
Dakota Section-Society of Range Management, and the South Dakota Natural Resources
Conservation Service. For additional information visit:
http://www.youtube.com/watch?v=RaT1RHilg_U
During the segment 2 project period, the PIP was amended four times. Two of the amendments
were to the project budget. See the budget section of this report for specific information. The
third and fourth amendments extended the project period.
A descriptive summary of the activities completed during project segment 2 to achieve the
results summarized above, a comparison of planned versus accomplished milestones and an
evaluation of the accomplishments in relation to attaining the project goal is provided in the
report sections that follow.
5
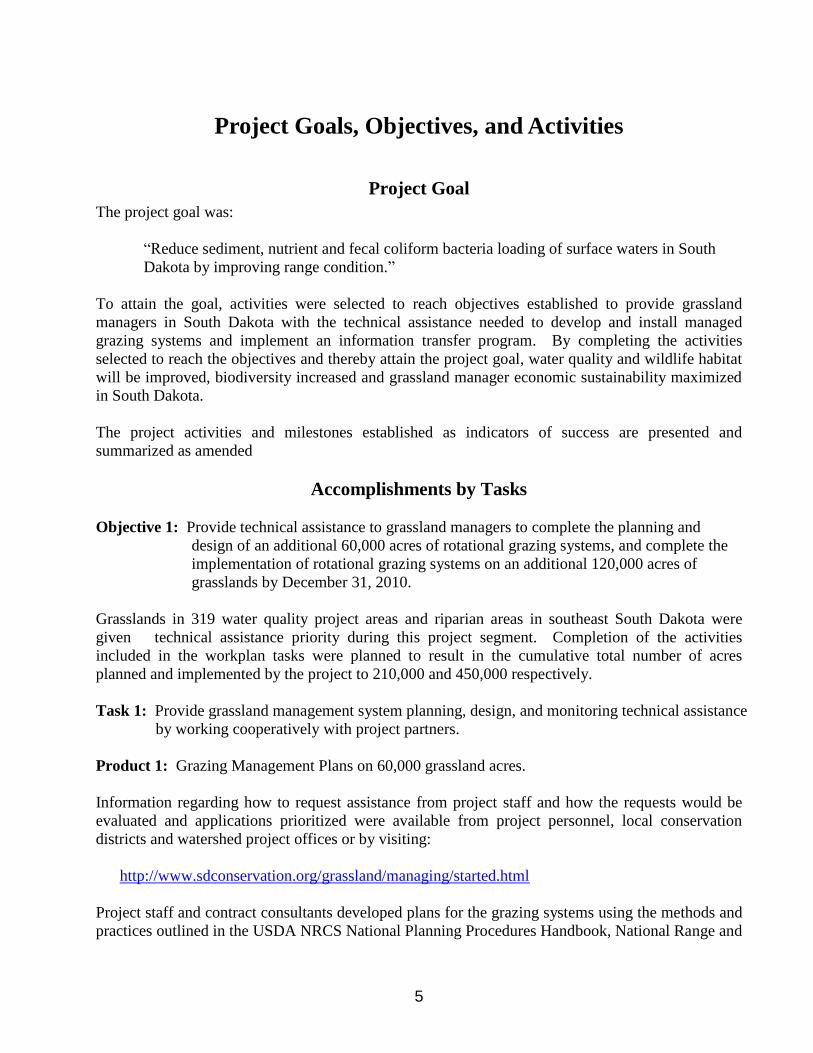
Project Goals, Objectives, and Activities
Project Goal
The project goal was:
“Reduce sediment, nutrient and fecal coliform bacteria loading of surface waters in South
Dakota by improving range condition.”
To attain the goal, activities were selected to reach objectives established to provide grassland
managers in South Dakota with the technical assistance needed to develop and install managed
grazing systems and implement an information transfer program. By completing the activities
selected to reach the objectives and thereby attain the project goal, water quality and wildlife habitat
will be improved, biodiversity increased and grassland manager economic sustainability maximized
in South Dakota.
The project activities and milestones established as indicators of success are presented and
summarized as amended
Accomplishments by Tasks
Objective 1: Provide technical assistance to grassland managers to complete the planning and
design of an additional 60,000 acres of rotational grazing systems, and complete the
implementation of rotational grazing systems on an additional 120,000 acres of
grasslands by December 31, 2010.
Grasslands in 319 water quality project areas and riparian areas in southeast South Dakota were
given technical assistance priority during this project segment. Completion of the activities
included in the workplan tasks were planned to result in the cumulative total number of acres
planned and implemented by the project to 210,000 and 450,000 respectively.
Task 1: Provide grassland management system planning, design, and monitoring technical assistance
by working cooperatively with project partners.
Product 1: Grazing Management Plans on 60,000 grassland acres.
Information regarding how to request assistance from project staff and how the requests would be
evaluated and applications prioritized were available from project personnel, local conservation
districts and watershed project offices or by visiting:
http://www.sdconservation.org/grassland/managing/started.html
Project staff and contract consultants developed plans for the grazing systems using the methods and
practices outlined in the USDA NRCS National Planning Procedures Handbook, National Range and

6
Pasture Handbook, and the South Dakota Technical Guide. Refer to USDA FSA standards for
Conservation Practices or the USDA NRCS electronic Field Office Technical Guide (efotg) for a
description of the methods and practices.
Both of the USDA publications are available by accessing: the following web sites:
http://www.fsa.usda.gov/FSA/webapp?area=fsahome&subject=landing&topic=landing
http://www.nrcs.usda.gov/technical/efotg/.
Plans for 29 producers from 11 Counties who manage 79,952 acres (Table 1) were developed by
project staff during project segment two. This number plus those plans developed by other agencies
and project partners (Table 2) as a result of project activities equals plans for 52 producers in 16
Counties and encompass 167,995 acres.
Table 1. Managed Grazing Plans Developed By Project Staff.
County Number of Producers Acres
Aurora 2 1,615
Brule 6 6,318
Buffalo 6 16,442
Butte 3 12,818
Faulk 1 6,000
Hand 1 4,791
Jerauld 3 4,096
Meade 1 17,756
Miner 1 487
Moody 4 529
Walworth 1 9,100
Total 29 79,952
Table 2. Grazing Plans Developed As A Result of Project Activities.
County Number of Producers Acres
Aurora 1 640
Brookings 1 1,036
Brule 2 4,600
Butte 1 6,734
Campbell 1 4,000
Charles Mix 1 2,000
Clark 1 2,212
Haakon 1 7,000
Harding 1 3,384
Hyde 4 10,468
Jerauld 2 2,733
Jones 1 2,512
Lyman 1 2,611
Meade 2 21,676

7
Potter 2 5,237
Walworth 1 9,100
Total 23 86,043
Criteria used to select the source(s) of funds to be accessed to install the grazing systems included:
“fit-to-program”,
availability in a timely manner,
the operator’s preference, and
compatibility of the program to system manager’s operation.
The practices used and a comparison of those used to planned for both this and previous project
segments are shown in Table 3.
Table 3. Practices used to Install Managed Grazing Systems.
An example of a grazing plan developed is shown in Figure 1. The system is divided into 10
paddocks using cross fence. Water is supplied using a pipeline and three tanks with each tank
positioned to serve multiple paddocks.
Practice Practice Code Units
Project Segment 2 Cumulative
Planned Installed Planned Installed
Planned Grazing (Acres) 528 Prescribed Grazing 120,000 167,995 420,000 574,526
Fence -Cross &Riparian
Exclusion (linear Feet)
382 Fence & 390
Riparian Exclusion
100,000 128,635 205,000 459,850
Pipeline (Linear Feet) 516 Pipeline 80,000 104,476 130,000 396,080
Rural Water Hook-ups
(Number)
516 pipeline 2 0 2 2
Tanks (Number) 614 Watering Facility 25 39 55 148
Dams/Dugouts (Number) 378 Pond 2 6 12 6
Grass Seeding (Acres) 512 Introduced Species
& 550-Native Species
100 . 505 350 732
Stream Crossings
(Number)
578 1 0 1 0
Wells (Number) 642 Water Well 0 4 10 5

8
Figure 1. Managed grazing system design.
Funds to provide the technical assistance needed to develop the grazing plans were provided by:
NRCS – Environmental Quality Incentives Program (EQIP),
FSA- Continuous Conservation Reserve Program-(CCRP) and
US FWS-SD Partners for Fish & Wildlife Program italics is what they call the program in
SD.
Livestock producers who developed a grazing system were provided with tools to aid in managing
and monitoring the systems. The tools included a copy of Grassland Plants of South Dakota and the
Northern Great Plains and a grazing stick. Grasslands Plants of South Dakota and the Northern
Great Plains published with support from the South Dakota Department of Environment and Natural
Resource’s 1998 Clean Water Act Section 319 NPS Grant from EPA (C9998185-98) and the 319
NPS Grant awarded to SDACD through DENR for the Bootstraps Inventory and Coordination
Project (C9990185-97).
A grazing stick, Figures 2 and 3, is a specially designed yardstick with formulas, tips and guidelines
printed on the sticks four sides to help manage forage production relative to animal units using the
pasture or paddock. Funds to purchase 4,000 grazing sticks were provided by the United States Fish
and Wildlife Service-South Dakota Partners for Fish and Wildlife program and this project. An
additional 2,000 grazing sticks were purchased using funds provided by SDGF&P, US FWS’ SD
Pipeline
Tanks
Cross Fence
Perimeter Fence
Dam - original water source

9
Partners for Wildlife Program, and the North Central Resource Conservation and Development
Association (NC RC&D)
Figure 2. Grazing stick.
Figure 3. Grassland managers and producers learning to use a grazing stick.
Milestones:
Project Segment 2 - Planned - 15 grassland grazing system plans/year @ 2000 ac/plan = 30,000 acres; 30
plans/2 years @ 2,000 ac/plan = 60,000 acres.

10
Accomplished – 29 plans-encompassing 79,952 acres developed by project staff;
23 plans encompassing 86,043 by project partners. Total = 52
plans encompassing 167,995
Cumulative – Planned – 61 plans encompassing 207,622 acres plus eight demo sites encompassing
7,681 acres
Accomplished – 140 plans encompassing nearly 550,000 acres planned by project staff
and project partners.
Product 2: Implement improved grassland management systems on 120,000 acres of grasslands.
The total includes the 60,000 acres planned by the project, and 60,000 acres planned
and implemented with significant technical assistance from partnering agencies.
Technical assistance to install the practices selected (Table 3) to construct grazing systems that
encompass 165,995 acres in 36 counties for 53 producers (Tables 4 and 5) was provided during
project segment 2. The assistance was provided by project staff and:
NRCS,
SD GF&P,
US FWS, and
Local conservation districts.
The Tables 4 and 5 also include cumulative total of acres of managed grazing systems installed since
the project’s inception during 1999. When totaled, the acres of managed grazing installed using
plans developed by the project and its partners equals 454,890 managed by 140 producers.
Financial assistance to install the practices was provided by local, state and federal organizations and
agencies which included:
US Fish and Wildlife Service (USFWS) South Dakota Partners for Fish and Wildlife using
the North American Wetlands Conservation Act Grants (NAWCA),
NRCS - EQIP,
South Dakota Game, Fish and Parks (GFP) – SD GF&P Private Lands Habitat program,
SD Conservation Commission – Soil and Water Conservation Fund and
DENR – Section 319 Project Grants (Bachelor Creek, and Lake Faulkton watershed projects)
The practices used to install the systems during this project segment and the cumulative total
installed during all project segments are listed in Table 3 (Product 1)
The fences installed include single wire, three wire high tensile electric or poly wire. Three wires
were most often used for an exterior fence; the single wire is used for cross fence within a system.
Grass seedings were used to convert cropland to native vegetation. Occasionally a producer
included a non native species such as alfalfa in the seed mixture planted to provide greater forage
value in the event a paddock was harvested for hay.

11
While steam crossings were included in the practices planned, none were determined to be necessary
at the locations where systems designed were installed.
Options to supply water to a grazing system included rural water systems, wells and dams/dugouts.
Rural water systems were the method of choice because rural water provides:
a reliable source of water,
clean water which promotes improved herd health,
reduced the incidences of livestock entering surface water bodies, and
the most consistent positive environmental and economic benefits.
Table 4. Managed Grazing Systems Installed Using Plans Developed By The Project. County Number of Producers Acres
Project-
Segment 2
Project-
Segment .1
Cumulative Project-
Segment 2
Project-
Segment 1
Cumulative
Aurora 2 1 3 1,615 2,376 3,991
Beadle 1 1 2,895 2,895
Brookings 1 1 2,429 2,429
Brule 6 6 12 6,318 12,645 18,963
Buffalo 6 7 13 16,442 76,455 92,897
Butte 3 3 6 12,818 16,322 29,140
Charles Mix 1 1 2,040 2,040
Clay 1 1 300 300
Faulk 1 10 11 6,000 9,089 15,089
Haakon 1 1 13,000 13,000
Hand 1 1 2 4,791 320 5,111
Hyde 3 3 7,620 7,620
Jerauld 3 3 4,096 4,096
Kingsbury 1 1 720 720
Lincoln 1 1 217 217
Lyman 3 3 20,319 20,319
McPherson 1 1 5,360 5,360
Meade 1 1 17,756
Mellette 1 1 2,400 2,400
Miner 1 1 2 487 120 607
Minnehaha 2 2 290 290
Moody 4 6 10 529 3,269 3,798
Pennington 1 1 6,400 6,400
Potter 1 1 2,300 2,300
Sanborn 1 1 585 585
Stanley 1 1 13,398 13,398
Tripp 1 1 179 179
Turner 2 2 191 191
Walworth 1 2 3 9,100 6,383 15,483
Total 29 61 90 79,952 207,622 287,574

12
Table 5. Managed Grazing Systems Resulting From Project Related Activities. County Number of Applicants Acres
Project
Segment 2
Project
Segment 1
Cumulative Project
Segment 2
Project
Segment 1
Cumulative
Aurora 1 1 640 640
Brown 1 1 800 800
Brookings 1 1 1,036 1,036
Brule 2 2 4,700 4,700
Buffalo 1 1 86,500 86,500
Butte 1 1 6,734 6,734
Campbell 1 1 4,000 4,000
Charles Mix 1 1 2 2,000 5,000 7,000
Clark 1 1 2,212 2,212
Haakon 1 2 3 7,000 5,500 12,500
Hand 1 1 480 480
Harding 1 1 3,384 3,384
Hyde 4 2 6 10,468 5,077 15,545
Jerauld 2 2 2,733 2,733
Jones 1 3 4 2,512 880 3,392
Lyman 1 7 8 2,611 20,590 23,201
Marshall 1 1 160 160
Meade 3 3 21,676 21,676
Mellette 2 2 31,246 31,246
Minnehaha 2 2 1,301 1,301
Moody 1 1 3,500 3,500
Potter 2 2 5,237 5,237
Sanborn 1 1 240 240
Todd 1 1 12,635 12,635
Walworth 1 1 9,100 9,100
TOTAL 24 26 50 86,043 173,909 259,952
The source of water to a grazing system was the determining factor relative “delivery” to the
livestock within the system. When wells and rural water were the source, pipeline delivered the
water to tanks. Thirty nine water tanks were installed within the systems during project segment
two; 148 total during all project segments.
Pipeline installed included both above and below ground (buried). While the project does not sell
pipe, project staff assisted producers with placing orders for the one inch above ground polyethylene
pipe (Figure 4). The pipe is inexpensive, lightweight, and flexible and affords the system manager
advantages over installing buried pipe. Using above ground pipe, producers can supply water to
paddocks to pasture subdivisions at a lower cost than when using buried pipe. In addition, the
portability of above ground pipe allows the producer to try water placement in an area before making
the decision to put in a permanent system. Using easy to install quick couplers (Figure 4) to tap the
above ground pipe allows grass managers a source of water wherever they determine a tank should
be placed. Once the key is inserted into the coupler the water is free flowing.
Aboveground pipe was installed during project segment 2 to provide water to 2,000 acres. Added to
the above ground line installed to serve 25,000 acres during segment 1, a total of more than 100

13
grazing systems covering 27,000 acres installed above ground pipeline to supply water within a
grazing system.
While there was interest in using portable water systems there was producer reluctance to adapting
this alternative.
Although not in the workplan four wells were drilled. The use of a well was sometimes the best
option because:
access to a rural water system was not available or
economics associated with the size of the system served favored wells over other options.
For large grazing systems (> 5,000 acres), the cost of a well versus other methods of supplying water
is less on a cost/acre served basis than from other sources. Financial assistance for the four wells
drilled during project segment 2 was provided using EQIP funds made available through NRCS.
Figure 4. Above ground pipe with quick coupler.
Figure 5 shows the location of grazing systems installed during project segments 1 and 2 and the
MIG Project. Systems installed during project segment 1 are coded green those installed during
project segment 2 blue and demonstration sites red. For additional information regarding the
location of the demonstration sites visit:
http://www.sdconservation.org/grassland/managing/gmd/projects.html
Quick
Coupler
Key

14
Observations relative to the grazing systems planned and installed include:
in general, the size of a system and paddocks within the system increases from east to west
across the state,
most of the land in the Buffalo County is owned by the Crow Creek Sioux Tribe,
after the Crow Creek resource inventory was completed, The Lower Brule Sioux Tribe
whose lands are across the river from Crow Creek engaged a private contractor to complete
and inventory of their lands,
the grasslands project and, therefore, many of the systems installed are a direct result of
Bootstraps, a holistic farm ranch program developed with financial assistance from EPA 319
and Pollution Prevention Grants awarded through DENR, and
the use of managed grazing as a water quality BMP has been incorporated into watershed
project workplans, i. e., the Bachelor Creek Project in the east central area of the state.
The concentration of managed grazing systems installed in central SD can be attributed to this being
the area in which the grasslands project started following a Bootstraps meeting. Since this time,
grasslands project has been provided predominately by Bootstraps Program participants working in
partnership with natural resource organizations and agencies.
Figure 5. Locations of managed grazing systems installed.

15
Load reductions realized from the systems installed were determined using the Spreadsheet Tool for
Estimating Pollutant Loads (STEPL) developed by EPA Region 5. The load reductions achieved
during each project year were provided to DENR in partial fulfillment of reporting requirements.
The data was included in annual reports prepared using the format provided by DENR to facilitate
entry into EPA’s Grants Reporting and Tracking System (GRTS).
NPS pollution load reductions to SD lakes and streams realized from grazing systems installed
during this and previous project segments are listed in Table 6.
Table 6. NPS Load Reductions Realized From Rotational Grazing Systems Installed.
NPS Pollutant Load Reduction
Project Segment 2 Cumulative
Nitrogen (lbs) 142,723 309,697
Phosphorus (lbs) 23,765 55,992
Sediment (tons) 13,153 32,637
Milestones:
Project Segment 2 - Planned - 60,000 acres planned by project staff + 60,000 acres planned by
project partners - 120,000 acres installed.
Accomplished - Planned –79,952 acres planned by project staff + 86,043 acres planned by project
partners = 165,995 acres
Cumulative – 287,574 acres planned by project staff + 286,952 acres planned by
project partners = 547,526 acres
Objective 2: Transfer grassland management information to a minimum of 10,000 South Dakota
producers, 20 researchers, 40 grassland specialists, and the public (400,000).
Task 2: Maintain two existing and establish one new on-ranch demonstration site, monitor the
sites to document BMP effectiveness, and evaluate the impacts of improved grassland
management on water quality and sustainability of the operation.
Product 3: Two previously developed on-ranch grassland management demonstration sites and
one new on-ranch demonstration site monitored and evaluated.
The two demonstration sites developed during previous project segments selected to be retained
during segment 2 were the Faulstich and Sip systems developed during 2000 and, 2001 respectively.
The new demonstration site was established near the City of Elkton. The system is located in
northeastern portion of the Central Big Sioux 319 Water Quality Implementation Project in
accordance with the location priority established during project planning to demonstrate the positive
economic and NPS pollution benefits of managed grazing in this area of the state effectiveness of
managed grazing.

16
The practices used to install the new demonstration site with a comparison to the planned are shown
in Table 7. The costs associated with installing the practices were shared by the landowner, East
Dakota Water Development District, Moody County Conservation District using funds provided by
the 319 funded Bachelor Creek Project and USFWS.
Table 7. Practices Used to Install the Big Sioux Grazing System Demonstration Site.
Practice Conservation Practice Planned Actual
Fence 382 Fence
390 Riparian Exclusion 6,000 LF 15,000 LF
Pipeline 516 Pipeline 4,000 LF 3,053 LF
Tanks 614 Watering Facility 2 each 1 each
For information relative to the three sites visit: http://www.sdgrass.org/views/SDSU%202008%20riparian%20demonstration%20project%20report%20(3).pdf
Monitoring activities at the sites were completed by summer interns. The data collected was
evaluated by a range specialist from SDSU whose services were made available through a
contractual agreement.
Activities completed relative to the sites was modified during the initial portion of the project period
when it became evident that producer involvement and availability of interns would not meet that
anticipated during project planning.
Because of the change, the information presented for products 3 and 4 is consolidated and reported
primarily using reports prepared by SDSU Range Management specialist in Appendices 1 and 2.
The monitoring plan for the demonstration site in and riparian demonstration sites was modified as
outlined in Product 9.
Data relative to the impact of livestock grazing and on litter cover, vegetation cover and plant height
was collected at was collected at five sites in eastern SD and two in the western portion of the state.
The data indicates that grazing management systems are beneficial to water quality. Reports
summarizing data collection by site and conclusion made based on the data is located in Appendix 1
(Eastern South Dakota Riparian Demonstration Site) and Appendix 2 (Riparian Demonstration
Sites).
Milestones:
Project Segment 2 - Planned - Continue two existing demonstration sites and establish one new
site in SE SD.
Accomplished - Monitoring and evaluation of three sites for two years (see
product 9 - Monitoring) as amended.
Cumulative –Planned – 8 sites – 6 sites established during previous project segments and one
during segment 2; monitoring data collected and reported for all active sites.

17
Accomplished – Total sites developed = 7; three maintained and monitored during
segment 2; vegetation use and run off data collected at 5 sites in
eastern SD and 2 in western SD.
Task 3: Complete information and education activities on grassland management and water quality
impacts of improved grassland management targeted towards 319 water quality project
areas, riparian grassland areas, and grasslands in South Dakota.
Product 4: Two grassland riparian area demonstration sites established by landowners located
in existing 319 water quality areas.
See product 3 for information relative to riparian demonstration sites.
Product 5: Maintain the grazing management web site in partnership with the SD Association
of Conservation Districts (SDACD), and update the Grassland Coalitions Display on
South Dakota Grassland resources and management.
Activities completed as part of Product 5 were coordinated by the project coordinator.
The web site and display were developed and maintained to provide farmers/ranchers, resource
managers, the research community, university students, and the general public information about
managed grazing, project activities and opportunities for involvement in the project or other grazing
related activities.
The grazing management web site established within the SDACD site during 2000 was expanded
and maintained during the current project period. The site is available by visiting:
http://www.sdconservation.org/grassland/managing/gmd/index.html
Site features include:
information about SD grasslands, grassland health and management
descriptions and journals of demonstration site activities,
interactive technical assistance bulletin board, and
links to other grazing information resources.
The site was periodically updated and expanded to better serve producer and resource manager
grassland information needs with operation and maintenance of the site being accomplished using
services provided by the SDACD web master.
The number of site visits peaked at nearly 60,000 (Table 8) during calendar year 2008 The total
number of “hits” exceeds the project milestone by nearly 3 times – 112,686 versus 30,000 and the
commutative by more than twice the milestone - 180,400 versus -80,000.
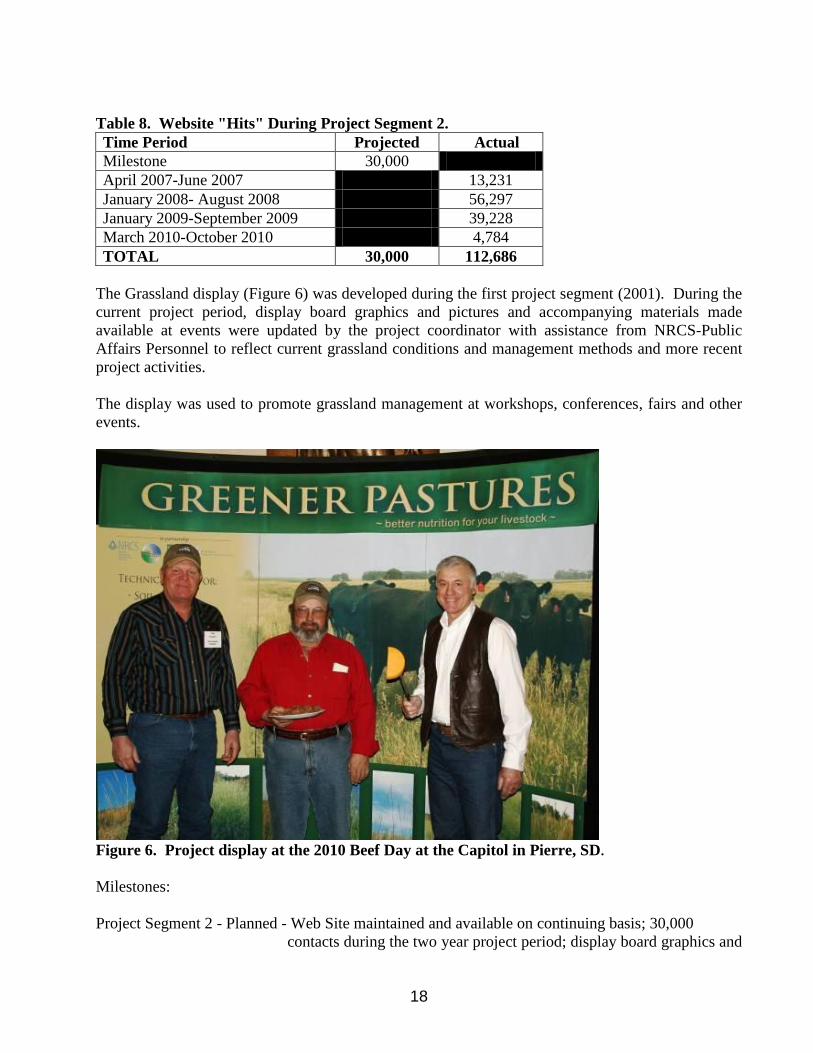
18
Table 8. Website "Hits" During Project Segment 2.
Time Period Projected Actual
Milestone 30,000
April 2007-June 2007 13,231
January 2008- August 2008 56,297
January 2009-September 2009 39,228
March 2010-October 2010 4,784
TOTAL 30,000 112,686
The Grassland display (Figure 6) was developed during the first project segment (2001). During the
current project period, display board graphics and pictures and accompanying materials made
available at events were updated by the project coordinator with assistance from NRCS-Public
Affairs Personnel to reflect current grassland conditions and management methods and more recent
project activities.
The display was used to promote grassland management at workshops, conferences, fairs and other
events.
Figure 6. Project display at the 2010 Beef Day at the Capitol in Pierre, SD.
Milestones:
Project Segment 2 - Planned - Web Site maintained and available on continuing basis; 30,000
contacts during the two year project period; display board graphics and

19
pictures updated with 50 percent plus new material describing current
grassland conditions, and management methods.
Accomplished – Web site maintained and available on a continuing basis;
112,686 hits during the project period; display board updated
with new graphics and plant mounts both provided by NRCS.
Cumulative –Planned - 80,000
Accomplished – 293,092
Product 6: Complete information transfer and educational outreach activities on grassland
management.
The project coordinator working in partnership with SDSU Range Science outreach staff and
conservation district personnel continued to provide livestock producers, resource managers, the
research community, students, and the general public with opportunities to learn about grassland
management at workshops, tours and through the media. Project activities planned versus
accomplished are summarized in Table 10. The table also includes a comparison of the cumulative
activities completed to those planned.
The activities listed in Table 9 provided opportunities to learn about the project and the
environmental and economic benefits of managed grazing to nearly 4,000,000 individuals since the
project were initiated during 2001. The total includes estimated booth traffic at events such as
conferences, and trade shows, attendance at field days, workshops, and meetings; circulation of
periodicals and radio station market size
Table 9. Information Transfer - Educational Outreach Activities Milestone Comparison.
Activity Project Segment 2 Cumulative
Planned Completed Individuals
Reached
Planned Completed Individuals
Reached
Workshops 6 26 1,256 9 53 >2,000
Grazing Schools 2 3 118 4 8 247
News Releases-print
media
4 14 699,219 15 34 1,246,543
News Releases-electronic
media
150 5 >800,000 Not Available 15 >2,490,000
Tours/Field Days 2 15 833 15 47 2,350
Riparian-Tours 4 1 4
Totals 1,501,426 >3,741,140
News releases and radio ads were not completed as planned. The decision not to issue releases as
such was made when it was determined that inviting the media to project sponsored functions
resulted in lead stories in the reporters publication versus a less visible location given a media
releases.
Many of the activities completed during this project segment were a continuation of activities
initiated during previous project segments and build on previous success. Therefore, the descriptive

20
information that follows is a summary of outreach and educational activities completed during all
project segments.
Milestones:
Project Segment 2 - Planned – Workshops- 6
Grazing Schools - 2 schools, 50 students
News releases print media – 4
News releases electronic media - 150
Tours/field days - 2 events, 100 participants
Riparian Tours - 4
Accomplished - Workshops-26
Grazing Schools -3 schools; 118 students
News releases pint media – 14; 699,219 individuals reached
News release/radio – 5; >800,000 individuals reached
Tours - 15 events; 833 participants
Riparian Tours - 1
Cumulative –Planned - Workshops- 9
Grazing Schools –4 schools; 100 students
News releases print media - 15
News release electronic media – Not available
Tours - 15
Riparian Tours - 4
Accomplished – Workshops- 53; >2,000 individuals attending
Grazing Schools - 8 schools; 247 students
News releases print media – 34, 1,246,543 individuals reached
News release electronic media – number not available; >2,490,000
individuals reached
Tours - 15
Riparian Tours - 4
Tours and Field Days
More than 800 farmers, ranchers, and resource managers attended the 15 tours and field days held
during the project period (Table 11) to transfer information to producers and resource managers
about the benefits of managed grazing. The tours and field days hosted during the current project
period bring the total number hosted and attendance to 47 tours and 2,350 respectively.
The South Dakota Grasslands Coalition and the South Dakota Section of Society of Range
Management partnered to host the July 2007 tour. The tour was held at the Bill and Pennie Slovek
ranch located northwest of Philip, SD. The Sloveks were recipients of the 2006 South Dakota
Section of Society of Range Management Excellence in Grazing Management Award. The South

21
Dakota Grasslands Coalition sponsored Gabe Brown, Bismarck, ND, to speak at the tour. Brown is
a grazer and no-till farmer. His presentation described the cover crops he plants for feed or grazing
as well as his watering system.
Table 10. Tours and Field Days. Tour Site Date Participants Comments
Slovek, Philip, SD July, 2007 102 SD Grasslands Bus Tour
CLC Ranch September, 2007 30 SD Grazing School Tour
Martin, SD June 2008 10 Pasture Walk-Terry Gompert
Bristol, SD June 2008 52 Bird Tour – Peckham Ranch
Sturgis, SD June 2008 25 Pasture Walk-Terry Gompert
Bismarck, ND July 2008 46 SD Grasslands Bus Tour
Valentine, NE October 2008 80 Joint NE/SD SRM & NE Grazing Lands
Coalition & SD Grasslands Coalition Tour
Belvidere, SD June 2009 90 Bird Tour – Rasmussen – Lehman 33 Ranch
Leola, SD July 2009 65 McPherson County Range Day with SDSU
Extension Service& NRCS
Clear Lake, SD July 2009 25 Coteau Hills Cattlemen’s Tour/workshop
with & SDSU Extension Service
Yankton,
SD/Plainview, NE
July 2009 85 Joint NE Grazing Lands Coalition/SD
Grasslands Bus Tour
Quinn, SD August 2009 60 Pasture Walk-Terry Gompert
Chamberlain, SD August 2009 60 Pasture Walk-Terry Gompert
Wessington, SD June 2010 64 Bird Tour – Paulson Ranch
White River, SD July, 2010 39 Pasture Walk-LeAnna & Kevin Green
Total 833
Based on the positive feedback to Brown’s presentation at Slovek ranch, the South Dakota
Grasslands Coalition sponsored the 2008 bus tour to the Gabe Brown’s ranch located near Bismarck,
ND. During the tour, Brown (Figure 7) emphasized that since he started planting cover crops, his
fertilizer and herbicide use has decreased. In addition, Brown spoke about the importance of soil
microbial activity.
During the second day of the tour, participants visited the Kenny Miller Ranch located south of
Mandan, ND. Miller, an employee of the Burleigh County Soil Conservation District and a rancher,
plants cover crops for grazing. During his presentation he discussed the soil health benefits of
grazing.
A brochure announcing the bus tour and a copy of the handout that the Burleigh County Soil Conservation
District provided during the tour is located in Appendix 3.

22
Figure 7. Brown and Fuhrer explain the use of cover crops during the 2008 grazing tour.
The 2009 bus tour visited two operations in the Yankton, SD, area July 21 and 22. During day one,
the 46 participants toured two certified organic ranches located near Fordyce, NE. The first was a
ranch that raises Scottish Highland cattle for grass finished beef (Figure 8); the second at an
operation that has converted land with a center pivot irrigation system from cropland to pasture. That
evening the participants heard a producer panel discuss extending the grazing season, swath grazing,
and grass finished beef. During day two, participants toured a ranch near Plainview, NE, that had
also converted a center pivot irrigated field from cropland to pasture. The operator uses stored
forages to finish cattle and plants corn to graze instead of harvest for grain thereby reducing fuel and
machinery expense.
The partnership with members of the SD Ornithological Society initiated during the first project
segment was continued. Since the partnership was formed during 2008, society members and the
project have cooperated to host three field days at managed grazing sites. Individuals attending the
tours are eligible to received continuing education credits Dakota State University. During 2008, the
South Dakota Grasslands Coalition and the Grasslands Management and Planning Project hosted a
bird tour at the Darwin Peckham ranch south of Bristol, SD. Peckham is a member of the South
Dakota Grasslands Coalition Board of Directors. Fifty-two individuals participated. Sixty-one bird
species, including a Northern Mockingbird, were recorded on the tour. An article about the tour was
printed in the June 27, 2008, issue the Aberdeen American News.

23
Figure 8. Highlander Cattle move to a new paddock as tour participants watch.
The South Dakota Grasslands Coalition and the GMPCP hosted a third bird tour at the Rasmussen-
Lehman 33 Ranch south of Belvidere, SD, during 2009. Dan Rasmussen, co-owner of the ranch, is a
South Dakota Grasslands Coalition Board of Directors member. Ninety individuals (Figure 9)
participated. Forty-four bird species were recorded during the tour. Fourteen individuals registered
for continuing education credits took advantage of the opportunity. A brochure and a list of the
bird species recorded are located in Appendix 4.

24
Figure 9. 2009 Bird Tour participants.
June 9 - 11, 2009, the South Dakota Grasslands Coalition hosted the National Riparian Team. The
team includes representatives from several agency disciplines who work cooperatively to promote
training on riparian management issues. Twenty five people attended the event which was
headquartered at Sturgis SD. The total included: ranchers and representatives from:
Bureau of Land Management (BLM)
USDA Forest Service
US Fish & Wildlife Service,
United States Geologic Survey (USGS).
Employees from the City of Rapid City,
319 project personnel,
SD GF&P,
SD Cooperative Extension Service
conservation district personnel,
RESPEC, 319 project personnel
National Wild Turkey Federation biologist,
NRCS personnel
SD DENR,
Tatanka RC&D and
Ranchers .
Workshops
During December 2007, the South Dakota Grasslands Coalition; Brule, Buffalo, and Lyman
Counties Bootstraps; Brule/Buffalo Conservation District and the GMPCP hosted Fred Provenza at a
workshop held in Oacoma, SD. Provenza's research focuses on understanding behavioral processes
and using that understanding to make management decisions. For more than two decades, his
research emphasis has centered on understanding the role of learning herbivore food and habitat
selection. Provenza has written 51 synthesis papers for peer-reviewed journals, books, and
proceedings; and has 120 papers published in peer-reviewed journals. Provenza has been invited to

25
speak on more than 40 occasions at national and international symposia. Click on the link below to
access a copy of Provenza’s PowerPoint.
http://www.sdgrass.org/ItemsOfInterest/ProvenzaPresentation2007.pdf
During December 2008, the South Dakota Grasslands Coalition; Brule, Buffalo, and Lyman
Counties Bootstraps; Brule/Buffalo Conservation District and the GMPCP hosted a workshop
featuring Jim Gerrish at Oacoma, SD. Gerrish’s experience includes more than 20 years of beef-
forage systems research and outreach while on the faculty of the University of Missouri, as well as
20 years of commercial cattle and sheep production on his family farm located in northern Missouri.
The University of Missouri Forage Systems Research Center (FSRC) rose to national prominence as
a result of his research leadership. His research encompasses many aspects of plant-soil-animal
interactions and provided foundation for the basic principles of management-intensive grazing.
Gerrish was co-founder of the 3-day grazing management school program at FSRC. Since their
inception during 1990, these schools have been attended by more than 3,000 producers and
educators from 39 states and 4 Canadian provinces.
Before moving to Idaho, Gerrish was involved with the Green Hills Farm Project, a grassroots
producer group centered in north-central Missouri which promotes sustainability of family farms.
His research and outreach efforts have been recognized by the American Forage and Grassland
Council, Missouri Forage and Grassland Council, National Center for Appropriate Technology,
USDA-NRCS, the Soil and Water Conservation Society, and Progressive Farmer.
A South Dakota Grassland’s Coalition’s December 2008 newsletter article featuring Jim Gerrish’s
presentation is available by visiting:
http://www.sdgrass.org/nwsltrs/2008%20Newsletters/December%202008%20newsletter.pdf
January 6, 2009, the South Dakota Grasslands Coalition hosted Kirk Gadzia. Gadzia, who is from
New Mexico, is a Certified Educator with the Holistic Management International Center. He has
more than 20 years of experience teaching the concepts of Holistic Management® worldwide.
Gadzia is co-author of the National Academy of Sciences book Rangeland Health. He holds a BS
degree in Wildlife Biology and an MS in Range Science. He works directly with producers to
achieve profitability in their operations and also provides customized training and consulting to a
wide variety of conservation organizations. Years of assisting people on the land helps Gadzia
approach the course in an interactive, hands-on style. His courses are known for a relaxed
atmosphere, open dialogue and practical real-life examples.
The workshop was held at the Cedar Shores Resort located in Oacoma, SD. Forty-nine livestock
producers and resource manager attended the workshop. Click on the link below to access an article
about Kirk Gadzia’s presentation which was printed in the South Dakota Grassland’s Coalition’s
December 2009 newsletter.
http://www.sdgrass.org/nwsltrs/2009%20Newsletters/February%202009%20newsletter.pdf

26
During project segment 2, the South Dakota Grasslands Coalition and the Grasslands Management
and Planning Project sponsored nine Holistic Resource Management (HRM) courses attended by a
total of 414 livestock producers and resource managers.
The three 2008 courses were taught by Terry Gompert a University of Nebraska Extension Educator
with expertise in grazing education. Gompert who is working toward holistically management of his
cow herd and ranch located near Center, Nebraska, is enrolled in the Holistic Management Certified
Educator Training Program. The workshop locations and attendance at each were:
Watertown, SD – 91,
Platte, SD - 45 and
Parkston, SD – 52.
Five HRM courses were taught during 2009. Four of the courses were taught by Terry Gompert, a
University of Nebraska Extension Educator with expertise in grazing education. Gompert is
working toward holistically managing his cow herd and land base near Center, Nebraska, and is a
Holistic Management Certified Educator. The fifth course, in Bison, SD, was taught by Wayne
Berry, Holistic Management Certified Educator, from Williston, ND. The location and attendance at
the five sites were:
Mobridge, SD - 24,
Ipswich, SD – 35,
Miller, SD - 36 ,
Forestburg, SD – 26 and
Bison, SD - 50.
Added to the 12 HRM workshops sponsored during the first project segment, attended by 345
participants, the cumulative total HRM sessions and attendance equals 21 and 759 respectively
Grazing Schools
The South Dakota Grazing School was developed and the first school held during 2003. The
workgroup that developed the school and hosted the event included representatives from several natural
resource agencies and organizations Agencies and organization involved included the:
SD Grasslands Coalition,
SDACD,
SDSU and the SD Cooperative Extension Service
DENR
SD Department of Agriculture,
NRCS and
US Fish & Wildlife Service-South Dakota Partners for Fish & Wildlife.
The goal statement established by the 2003 workgroup (see below) guided the school’s curriculum
through the 2006 event.

27
“Through an annual Grazing School provide grassland management training to grassland
managers and grassland specialists to increase acres of sustainable grassland management
resulting in the reduction of sediment, nutrient, and bacterial contamination of South Dakota
waterbodies.”
During December 2006, the South Dakota grazing school instructors and the Grasslands Coalition
Board met to review and improve the grazing school. An outcome of the meeting was a vision
statement for the school:
“Give the grazing lands managers of South Dakota the tools to maintain healthy prosperous
families, and diverse ecosystems, and profitable livestock operations while contributing to
the well-being of communities.”
The committee also determined that speakers would be asked to submit an outline of their
presentations so consistency could be maintained among the speakers and that presenters should be
encouraged to be at the school as long as their schedule allows, thereby being available for further
questions
To meet the needs of livestock producers and resource management agency personnel who attend the
schools, the curriculum is evaluated and updated annually.
The importance of the school to ranchers and agencies that send their employees to the school are
exemplified by the following:
NRCS requires attendance for participation in the agency’s Grazing Sustainability Incentive
Program (GSI),
individuals who attended a school requested the addition of an alumni event to provide
“graduates” with the opportunity to have the skills learned refreshed and acquire information
to further improve their grazing management capabilities, and
Attendance at the school has, with the exception of 2006, essentially equaled or exceeded the
target level (Table 11).
Table 11. Attendance at Grazing Schools.
School Number Date Attendance
1 September 2003 36
2 September 2004 28
3 September 2005 23
4 September 2006 18
5 September 2007 24
6 September 2008 26
7 September 2009 28
8 September 2010 64
Total 247

28
The Sixth South Dakota Grazing School was held in Oacoma, SD, September 8-10, 2008. The
school field site was relocated to Lower Brule Sioux Tribe Trust Land near Oacoma, SD. Twenty-
seven grasslands managers participated in the two and one-half day school. Students learned pasture
allocation (Figure 10), grassland and natural resources management, grazing and watering systems,
year-long grazing and nutritional needs of livestock.
Figure 10. Grassland managers learn to use transects to determine available forage.
An alumni event was added to the 2008 grazing school. The grazing school committee invited Ray
Bannister, Wibaux (pronounced Weebo) (Figure 11), from Montana, to speak to the group. Bannister
has developed a unique grazing system which uses herd effect to promote forage health. Bannister is
known for his “out of the box” approach to grazing management and for his humorous presentations.

29
Figure 11. Bannister addressing the South Dakota Grazing School Alumni Event.
Twenty-five school alumni and current grazing school participants and instructors attend the
presentation.
The Seventh South Dakota Grazing School was held in Oacoma, SD, September 14 -16, 2009. Thirty
grasslands managers participated in the two and one-half day school. Grassland managers learned
pasture allocation (Figure 12), grassland and natural resources management, grazing and watering
systems, year-long grazing, and nutritional needs of livestock. An alumni event was included in the
2009 school offering
Natural Resources Conservation Service (NRCS) of South Dakota has made attendance at the South
Dakota Grazing School a requirement for participation in their Grazing Sustainability Incentive
program (GSI). Because of increased attendance stemming from increased participation in GSI
program, two grazing schools were held during 2010.

30
Figure 12. 2009 Grazing School students learn pasture allocation.
The grazing school alumni event was concurrent with the 2009 grazing school. Dr. Barry Dunn,
then Executive Director King Ranch Institute of Ranch Management, now SDSU Dean of
Agriculture, was the keynote speaker for the grazing school and a guest speaker at the alumni
gathering. Twenty five alumni plus the current students and instructors attended the event.
Displays
The project’s updated display was used at six events during the project period bringing the total
events at which the display was used to 18 since it was developed during the initial project segment.

31
A cumulative list of the events at which the display was used to promote the project and managed
grazing and summaries of selected events where used during this project segment follows (Table
12).
Table 12. Summary of Events at Which the Project Display was used. Years Event Location Estimated Booth
Traffic/Attendance
(Total all yrs.)
20021, 2002 and 2003 SD Cattleman’s Assoc. Convention Huron, SD 625
2002, 2004, 2005 and 2006 Black Hills Stock Show and Rodeo Rapid City, SD 1,200,000
2002 SDACD Convention Pierre, SD 296
Rancher Workshops
2002, 2007 and 2009 White River,
S D
774 2002 Presho, SD
2004 Mission, SD
2004 Miller, SD
2005 Vermillion, SD
2003 and 2006 National GLI Convention Nashville, TN &
St. Louis, MI
2,100
2003 - 2010 Grazing School Oacoma/Chamb
erlain, SD
247
2004 - 2005 and 2007 DakotaFest Mitchell, SD 100,,000
2008 SD Math/Science Teacher’s
Convention
Huron, SD 40
2008, -2009 and 2010 Washington Pavilion of Arts and
Science Ag Day
Sioux Falls, SD 3,500
2009 and 2010 Beef Day at the Capital Pierre, SD 600
Total 1,308,182
The Washington Pavilion of Arts and Science located in Sioux Falls, SD, an entertainment, cultural
and educational facility hosts an Ag Day each year. The event highlights the role agriculture plays
in the economy and people’s everyday lives. During the event, exhibitors provide family oriented
hands-on activities and education. During the 2008 and 2009 events, the project’s display featured
SD grasses.
In addition, at the 2008 and 2009 events, project staff provided display visitors an opportunity to
complete the “Rangeland Café” and “Plant a Brand” activities (Figures 13a and 13b) included in the
South Dakota Ag in the Classroom “Mother Nature’s Recycling Machines” unit. When participating
in the Rangeland Café activity, students guess which grass is ice cream and which broccoli to
grazing animals. Plant a Brand includes drawing a livestock brand on construction paper applying
glue to the brand and spreading grass seed over the glue. The students were encouraged to plant the
“brand” once they arrived home. More than 1,500 individuals attended the 2008 event; 1,000 the
2009.

32
Figure 13. "Rangeland Cafe" activity at the 2008 Washington Pavilion Ag Day.
Figure 14. "Plant a Brand" activity at the 2009 Washington Pavilion Ag Day.

33
During March 2009, the South Dakota Cattlewomen hosted Beef Day at the State Capitol in Pierre,
SD, during the SD legislative session. NRCS, Ag in the Classroom, SD Cattlemen’s Association, the
SD Beef Industry Council and the South Dakota Grassland Coalition joined the event to share
information about the state’s beef industry and its importance it is to South Dakota’s
economy. Groups partnering with the cattlewomen served beef tortilla roll-ups, beef jerky, “grass-fed
beef” mini-hamburgers and over 400 beef salad silver dollar sandwiches to legislators and lobbyists.
Presentations
During project segment 2, project staff made 21 project related presentations (Table 13) to a total
audience of 1,370 bringing the cumulative total presentations and audience to 35 and 2,075
respectively.
As most of the events at which many of the presentations were made were described previously in
this section of the report, the descriptions of presentations listed in the table is limited to two selected
to serve as examples of those not otherwise described.
A copy of the presentation made at the 2007 West River/Lyman-Jones Rural Water System annual
meeting is profiled as an example of a presentation made by project staff. To review the
presentation, see Appendix 5.
A presentation made at the 2007 South Dakota Cattlemen’s Association convention by Gabe Brown
serves as an example of a managed grazing related presentation sponsored by the project and
SDGLC. Brown, a grazer and no-till farmer, uses cover crops for feed or grazing. To view Brown’s
presentation and the PowerPoint presentation given at the Society of Range Management July 2007
tour referenced previously click on the links that follow:
Gabe Brown presentation at SD Cattlemen's Association Convention, Watertown, SD
Brown's PowerPoint presentation
Publications/ News Articles
The project sponsor continued the use of print as a medium to convey information about managed
grazing and opportunities for involvement in project activities. While the use of news releases was
continued as mechanism conveying opportunities for involvement to a wider audience, the use of other
publications was initiated to reach livestock producers, the projects primary customers.
The publications completed during project segment 2 include an insert in an industry weekly publication
and publication in the. Range & Pasture Journal
Project staff and the South Dakota Grasslands Coalition Board of Directors were contacted by Trailhead
Promotions, reporters for the Cattle Business Weekly during 2008. The firm proposed, that with
financial assistance from the South Dakota Grasslands Coalition, writing a 12-16 page insert for
distribution in an issue of Cattle Business Weekly. The insert, published in the March 2009 issue,
included an article about the South Dakota Grasslands Coalition, a biography of the current SDGLC
chairperson, a calendar listing pasture and range events, and grazing tips. A copy of the Range &
Pasture Journal insert is located in Appendix 6.

34
During 2010, South Dakota Grasslands Coalition partnered with the Nebraska Grazing Lands Coalition
to publish the Range & Pasture Journal. Four issues have been published.
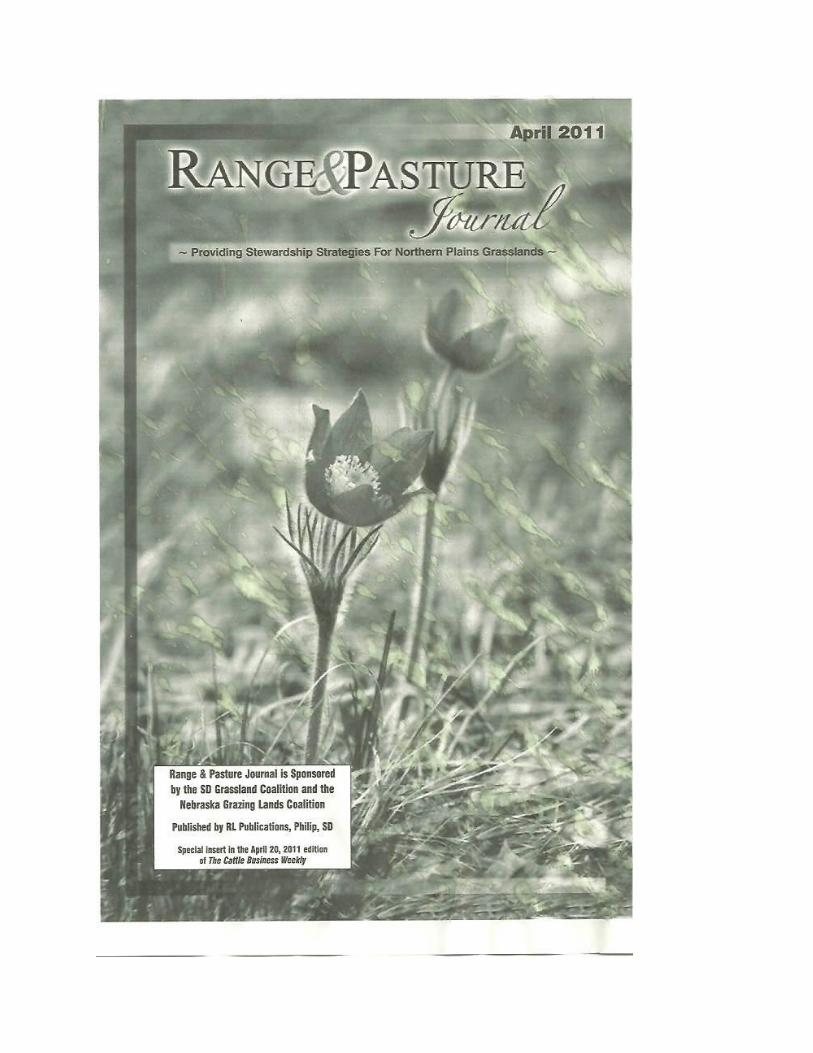
Table 13. Project Related Presentations. Year Event Location Attendance
2002 USDA-Forest Service Range Conservationists meeting Pierre, SD 109
South Dakota Association of Conservation Districts convention Pierre, SD 40
South Dakota Ornithological Society meeting Rapid City, SD 40
Tatanka RC&D meeting Bison, SD 26
2003 Bootstraps meeting Chamberlain, SD 20
2004 North Dakota/South Dakota Joint Projects Coordinator meeting Bismarck, ND 20
Bootstraps meeting Highmore, SD 20
South Dakota Project Coordinators meeting Pierre, SD 25
Lake Faulkton watershed meeting Faulkton, SD 30
2005 Rancher’s Workshop Highmore, SD 30
Rancher’s Workshop Gettysburg, SD 30
Rancher’s Workshop Vermillion, SD 25
Nonpoint Source Task Force meeting Pierre, SD 40
2006 Bootstraps meeting Oacoma, SD 55
2007 West River/Lyman Jones Rural Water
Annual Meting
Kadoka, SD 300
SD Cattleman’s Convention Watertown, SD 25
Provenza Workshop Oacoma, SD 76
2008 HRM Workshops Watertown
Platte
Parkston
91
45
52
SD Math/Science Teacher’s Convention Huron, SD 40
Gerrish Workshop Oacoma, SD 54
2009
Gadzia Workshop Oacoma, SD 56
HRM Workshops Mobridge
Ipswich
Miller
Forestburg
Bison
24
35
36
26
50
Wildlife Society - SD Section Oacoma 130
HRM Workshop Bison 50
Pratt Workshop Kadoka, SD 60
2010 Rancher’s Workshop Mission, SD 145
Farm/Home Show Webster, SD 35
GLC Annual Meeting Oacoma, SD 57
Winter Range Camp Isabel/Bison, SD 70
Sisseton-Wahpeton Oyate Grazing Workshop Sisseton, SD 53
Innes Workshop Chamberlain, SD 55
Total 2,075

35
The South Dakota Grasslands Coalition, in cooperation with its project partners, published Greener
Pastures (Figure 14), a grazing guidebook during project segment 1. Sections included in the guide are:
Why managed grazing?
General principles
Choosing a grass species
Water quality
Grazing riparian areas
Native and introduced grasses
Cool and warm season grasses
Wildlife
Grazing systems
Designing a program
When and how much to graze
Monitoring success
Demonstration sites
Contact information
Project staff continues to distribute copies of the guide at events such as grazing school, workshops,
grassland and bird tours and to applicants for technical assistance.
The publication is also available upon request by contacting project staff at:
News releases, articles and inserts about the project and project related activities have been printed
by nearly 20 newspapers and agricultural trade papers with a combined circulation of more than
730,000 since the project was initiated during 2001. See Table 14 for a comprehensive list of the
releases, articles and inserts. The month, publication, subject and circulation are included in the
table.
15. Greener Pastures.

36
Table 14. Project Related News Articles.
Date Publication Subject Circulation
June 21, 2002 Tri-State Neighbor Sip Tour 28,000
August 1, 2003 Charles Mix News 2003 Bus Tour 686
August 2, 2003 Gregory Times 2003 Bus Tour 2,132
August 3, 2003 Huron Plainsmen 2003 Bus Tour 6,000
August 4, 2003 Mitchell Daily Republic 2003 Bus Tour 12,447
August 5, 2003 Pierre Capitol Journal 2003 Bus Tour 3,979
August 6, 2003 Platte Enterprise 2003 Bus Tour 1,954
August 8, 2003 Sioux Falls Argus Leader 2003 Bus Tour 60,000
March 25, 2004 Dakota Farmer
Article About Lavern Koch &
Mark Kieffer, SD Grasslands
Board Members 30,000
July 26, 2005 Sioux Falls Argus Leader 2005 Bus Tour 60,000
September 1,
2005
Beef Magazine Amazing Grazing Efforts 100,000
April 22, 2006 Sioux Falls Argus Leader Larry Wagner, Grass Fed Beef 60,000
May, 2006 Cattle Business Weekly Changes for the Better 13,000
July, 2006 Sioux Falls Argus Leader 2006 Bus Tour 60,000
August, 2006 Tri-State Neighbor 2006 Bus Tour 28,000
August, 2007 Agweek 2006 Bus Tour 26,000
May, 2007 Cattle Business Weekly NRCS Award 13,000
May, 2007 Farm Forum NRCS Award 26,000
May, 2007
Farm Market News and
Auctions
Organic Grass Feed Beef
3,126
June 2007 Cattle Business Weekly 2007 Bird Tour 13,000
August 2007 Cattle Business Weekly Slovek Ranch Tour 13,000
June 2008 Aberdeen American News Bird Tour at Peckham’s 15,874
August 2008 Cattle Business Weekly Range and Pasture Insert 13,000
October 2008 Stockman Grass Farmer SDGLC Board Member article
- Larry Wagner
11,000
November 2008 Dakota Farmer SDGLC Board Member article
- Larry Wagner
30,000
December 2008 Dakota Farmer Pasture Management for horses 30,000
December 2008 Cattle Business Weekly Range and Pasture Insert 13,000
January 2009 Cattle Business Weekly Garza Presentation 13,000
March 2009 Cattle Business Weekly Range and Pasture Insert 13,000
June 2009 Cattle Business Weekly Range and Pasture Insert 13,000
June 2009 Dakota Farmer Faulstich Receives ESAP
Award
30,000
July 2009 Farm Forum Faulstich Receives ESAP
Award
36,345
September 2009 Tri-State Neighbor Grazing School 28,000
January 2010 Successful Farming Swath Grazing 440,000
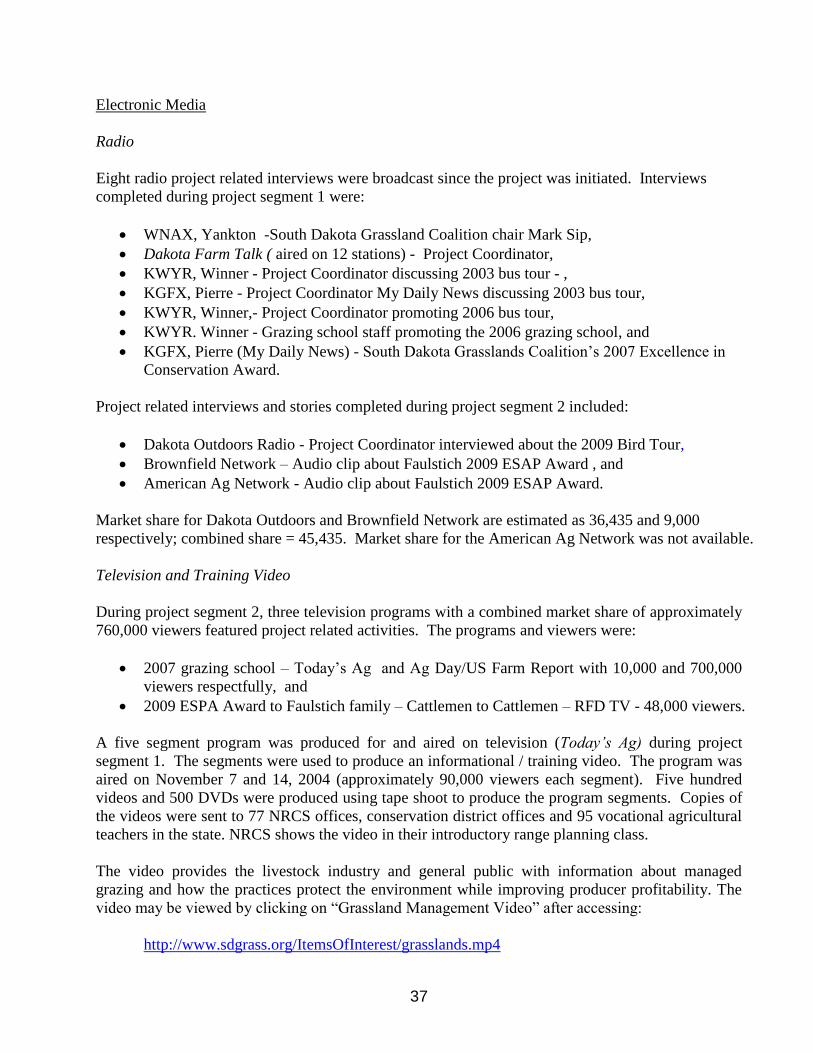
37
Electronic Media
Radio
Eight radio project related interviews were broadcast since the project was initiated. Interviews
completed during project segment 1 were:
WNAX, Yankton -South Dakota Grassland Coalition chair Mark Sip,
Dakota Farm Talk ( aired on 12 stations) - Project Coordinator,
KWYR, Winner - Project Coordinator discussing 2003 bus tour - ,
KGFX, Pierre - Project Coordinator My Daily News discussing 2003 bus tour,
KWYR, Winner,- Project Coordinator promoting 2006 bus tour,
KWYR. Winner - Grazing school staff promoting the 2006 grazing school, and
KGFX, Pierre (My Daily News) - South Dakota Grasslands Coalition’s 2007 Excellence in
Conservation Award.
Project related interviews and stories completed during project segment 2 included:
Dakota Outdoors Radio - Project Coordinator interviewed about the 2009 Bird Tour,
Brownfield Network – Audio clip about Faulstich 2009 ESAP Award , and
American Ag Network - Audio clip about Faulstich 2009 ESAP Award.
Market share for Dakota Outdoors and Brownfield Network are estimated as 36,435 and 9,000
respectively; combined share = 45,435. Market share for the American Ag Network was not available.
Television and Training Video
During project segment 2, three television programs with a combined market share of approximately
760,000 viewers featured project related activities. The programs and viewers were:
2007 grazing school – Today’s Ag and Ag Day/US Farm Report with 10,000 and 700,000
viewers respectfully, and
2009 ESPA Award to Faulstich family – Cattlemen to Cattlemen – RFD TV - 48,000 viewers.
A five segment program was produced for and aired on television (Today’s Ag) during project
segment 1. The segments were used to produce an informational / training video. The program was
aired on November 7 and 14, 2004 (approximately 90,000 viewers each segment). Five hundred
videos and 500 DVDs were produced using tape shoot to produce the program segments. Copies of
the videos were sent to 77 NRCS offices, conservation district offices and 95 vocational agricultural
teachers in the state. NRCS shows the video in their introductory range planning class.
The video provides the livestock industry and general public with information about managed
grazing and how the practices protect the environment while improving producer profitability. The
video may be viewed by clicking on “Grassland Management Video” after accessing:
http://www.sdgrass.org/ItemsOfInterest/grasslands.mp4

38
A summary of outreach activities completed during project segment 2 with a comparison of the
purpose for the activity versus the result is shown in Table 15.
Table 15. Summary of Outreach Activities.
Objective 3: Monitor and evaluate the two on-ranch demonstrations, two riparian demonstration
sites, complete the load reduction study, and provide for the day-to-day project
administration and project management to complete project goal, objectives, tasks, and
products by July 1, 2009.
Task 4: Ensure all activities, reporting requirements, personnel actions and financial obligations
associated with the project are completed, and terms of all agreements complied with as
outlined in implementation plans, grant and contractual agreements, memoranda of
understandings, any state and federal reporting requirements, and the Coalition’s by-laws.
Product 7: Reporting and project management will be completed using a management
agreement with the SD Association of Conservation Districts for project management and
administration.
Activity Coverage/Distribution Purpose Result Existing Demonstration
sites
Sites at Highmore and
Geddes maintained;
Continue to showcase
grazing alternative and
promote project
involvement
Continue opportunities for project
outreach through tours and the
media, i. e. Dakota Outdoors
Radio.
New demonstration and
Riparian site
Southeastern SD Expand opportunities for
livestock producer to visit a
system and highlight
grazing impacts and riparian
management
New demonstration site in eastern
SD; Data acquired to evaluate
grazing impacts on vegetation and
NPS.
Website State Wide Project awareness Project awareness increased;
recognition of SDGLC as the voice
for grazing lands in SD; SDGLC
invited to join Ag Unity.
Display Board Shows and workshops To highlight Project and
Coalition activities
Display used at 11 events – 7 by
project 4 by NRCS.
Grazing School Statewide Grass management ideas
and networking worth other
producers and grass
managers
78 Systems installed or improved
Print and Electronic
Media
Statewide
Project awareness &
happenings
Increased project awareness and
attendance at project sponsored
events such as tours and grazing
schools which resulted in
development of grazing systems
and installation of grazing related
practices/BMPs.
Tours Statewide
Increase project awareness,
ownership, support, and
participation; availability of
cost share for BMP
installation
Antidotal information indicates a
positive effect relative to
increasing participation in other
project sponsored events or the
installation of grazing practices.
39
The management agreement with SDACD initiated during 2001 was continued through the project
period. Under terms of the agreement, SDACD provides administrative, financial, and personnel
management services. A project advisory committee with representation from each party to the
agreement meets periodically to review project progress, rank requests for assistance, and provide
direction to the Association.
The functions of the advisory committee formed during project segment 1 to keep the coalition’s
project partner agencies and organizations appraised of project activities, recommend future
activities and coordinate joint efforts was assumed by the coalition board of directors during project
segment 2. The decision to accomplish the committee functions in this manner was made based on
several considerations which were all related to the questionable need to bring the group together for
a meeting to discuss what had already been accomplished at another meeting involving the same
organizations and agencies. Examples of such meetings are the partner’s meetings hosted by the
NRCS state director and meetings of the grazing school planning group.
Milestones:
Project Segment 2- Planned – Hire and supervise employees and consultants.
Accounting completed to meet federal grant requirements
2 mid-year project progress reports (April 08, and April 09).
2 Annual project progress reports (October 07, October 08).
1 Final project progress report (July 2009).
Accomplished - Employees and consultants hired and supervised.
Accounting completed and requirements met as notified by DENR and the grant
agreement.
4 Annual project progress reports completed (October2007,2008, 2009, 2010).
1 Final project report completed (August 2011).
Task 5: Complete the monitoring of the three on-ranch rotational grazing system demonstrations,
the two on-ranch grassland riparian demonstrations, and monitor vegetation and infiltration
on 60 cooperating ranches for input and validation of the Annualized Agricultural
Nonpoint source (AnnAGNPS) model to estimate load reductions, provide vegetation data
for EROS for remote sensing capabilities, and complete written reports on evaluating
efforts.
Product 8: Complete monitoring of the on-ranch rotational grazing demonstrations and riparian
grassland on-ranch demonstrations.
Monitoring was accomplished by seasonal employees, the project coordinator, and SDSU range
department staff. See Products 3 and 9 and Appendices 1 and 2 for information regarding
amendment of Task 5 related products

40
Milestones:
Project Segment 2 – Planned - Data collected through monitoring of the two grassland riparian area on-
ranch demonstration sites, and evaluated to include a written report by a
certified range specialist. Data collected through monitoring on the three
rotational grazing demonstration sites, and evaluated to include a written
report by a certified range specialist.
Accomplished - See Products 3 and 9
Product 9: Complete monitoring of the on-ranch vegetation and infiltration sites used to develop the
AnnAGNPS model for making estimations of sediment, N, and P load reductions.
Monitoring was completed under the leadership of SDSU Plant Science Department and Animal and
Range Science Department faculty, the outreach coordinator, research associate, and student hourly
employees. The SDSU team collected Cornell sprinkle infiltrometer measurements with the
vegetation data on the on-ranch sites. The infiltrometer measurements were correlated with small
plot sprinkle runoff, sediment, N, and P measurements with this and other 319 projects. Water
quality samples collected from these measurements were analyzed at SDSU laboratories.
The amended monitoring plan follows.
Western South Dakota Riparian demonstration site
In partnership with USFS and others, SDSU is a participant a cottonwood revegetation project on the
Lower Grand River north of Bison, SD. Livestock impacts on vegetation and cottonwood survival
from off-site watering points and watering from the river will be compared. Visual obstruction
measurements and cottonwood sapling counts will be made each year to determine the effects of
grazing and watering source. Samples will be collected in the fall of each year during the project
period.
Eastern South Dakota Riparian demonstration sites
Several riparian pastures that differ in management practices will be monitored. The management
practices vary from total exclusion, rotational grazing, and continuous grazing. Visual obstruction
measurements using the Robel pole technique will be made several times during the grazing season
on each site. Infiltration, runoff and sediment yield will be measured at each site using the Cornell
sprinkler infiltrometer technique. Water quality samples will also be collected and analyzed for
phosphorus. Vegetation parameters such as plant height, vegetative cover, litter cover, and
aboveground biomass will also be measured.
Eastern South Dakota Riparian research sites
Infiltration, runoff, sediment yield, and vegetation parameters from riparian pastures that differ in
grazing management from poor to excellent condition will be monitored Sampling will be
accomplished working cooperatively with the SDSU researchers who are documenting stream

41
characteristics and water quality at 60 sites in eastern SD. The cooperative effort will facilitate
identifying relationship between upland infiltration and vegetation with stream characterization and
water quality data. The data will be used to develop AGNPS models for these small watersheds.
All data collection was completed during the 2008 and 2009
AGNPS modeling planned as a cooperative activity with DENR was not completed during the
project period.
Milestones:
Project Segment 2 – Planned -Vegetation data and infiltration data collected by NRCS NRI and SDSU
team at 30 locations each year.
Training on AGNIPS for SDSU soils research associate by SD DENR
staff during first year.
Collection of runoff and sediment and analyzing for N and P each year
at the RESPEC sites on the Belle Fourche watershed district. Running
model simulations with first year’s vegetation data and validation
through runoff and sediment collected at the RESPEC sites
Estimate sediment, N, and P load reductions from AnnAGNPS of the
570,000 planned acres by the past and current Grassland and Planning
project.
Accomplished –See Product 3 and Appendices 1 and 2

42
MONITORING AND EVALUATION
Project monitoring will be completed by a team consisting of:
the project coordinator,
seasonal employees and/or interns working during the summer,
grassland managers/producers,
SDSU, Animal and Range Science Department staff (Outreach Coordinator) and
other Advisory Team members and other project partners.
The data collected was stored and managed by the project staff under the direction of the project
coordinator. The project used participating producer and partners’ expertise and equipment for
data storage and analysis. Water quality data was forwarded to DENR or the volunteer
monitoring program for entry in the STORET database. QAQC for all water quality monitoring
aspects of the project will be provided by DENR.
The information collected was used by the SD Grassland Coalition to complete mid –year (April)
and annual (October) reports of project activities, provide a copy to all project partners and
funders and prepare the final report.
Mid-year reports included current activities and an evaluation relative to project milestones, as
well as cumulative progress toward reaching the project goal.
Evaluation of success in reaching the project goal was accomplished by monitoring project
activities to measure:
meeting established milestones,
effects on water quality and vegetation parameters, and
contributions to improving sustainability of grassland managers operations.
Overall, project success was evaluated based on the monitoring data as an indicator of grassland
improvement as an effective BMP to protect/improve water quality and the profitability of the
owner's operation.
Monitoring Activities
Project activities were monitored and evaluated relative to project milestones. The information
collected included:
number of on-farm visits and landowner/operator contacts – acres of grazing plans
developed,
acres of grassland management plans implemented,
units of conservation practices installed to develop the grazing systems,
project accounting (expenditures, receipts, matching funds and their sources),

43
location of operations assisted and demonstrations sites using GPS and entry into a
GIS data base,
load reductions realized from the systems developed,, and
evaluation of workshops/schools sponsored to determine if the activity in helping
attain the overall project goal.
The data collected is included in the Project Goals, Objectives and Tasks Section of this report
by product.
Water quality, vegetation soil characteristics and litter and were monitored at five sites in eastern
SD; two in western. See Appendices 1 and 2 for location and data.
Evaluation
The data collected through monitoring activities indicate that:
most project milestones were met or exceeded,
the outreach component of the PIP was successful in transferring information about
and increasing participation in the project,
there is support for managed grazing as an effective environmental practice by
conservation nature groups such as the Leopold foundation and Ornithologists, and
managed grazing practices reduce NPS pollution to surface waterbodies.
See next section for load reduction information.
Data collected at riparian demonstration sites in eastern and western South Dakota provided
evidence that management practices that entice livestock to drink from sources other than the
riparian area are beneficial to water quality.
Results from rainfall simulation show that:
runoff, sediment yield and nutrients entering eastern South Dakota streams from
pasturelands is likely quite low whereas in western South Dakota, runoff and sediment
can be significant during intense rainfall periods leading to gulley erosion, and that
proper stocking rates leading to good vegetation and litter cover are important to enhance
infiltration and reduce runoff.
Data collected at eastern SD demonstration sites suggest that;
livestock grazing of riparian pastures in eastern South Dakota, does not impact sediment
loading from the surrounding uplands,
the use of vegetation is was fairly even across the pasture monitored as indicated fusing
vegetation measurements at different distances from the stream,

44
as riparian pasture size was relatively small at the eastern South Dakota locations,
livestock distribution tends to be even across the pasture, and
cattle tend to not overgraze near the stream, possibly because vegetation is not as
palatable and/or hummocky terrain deters livestock from over using these areas,
To minimize stream bank erosion and reduce direct access to streams by livestock, alternative
water sources, rock crossings, and fencing could be effective strategies. Fencing out wide
buffers alongside the stream may not be necessary.

45
LOAD REDUCTIONS
Load reductions realized from the systems grazing installed (Table 16) were determined using
the Spreadsheet Tool for Estimating Pollutant Loads (STEPL) developed by EPA Region 5. The
load reductions achieved were:
entered in the DENR project management system (Tracker),
provided to watershed project coordinators for use in determining total daily maximum
load (TMDL) implementation and
included in annual reports prepared using the format provided by DENR to facilitate
entry into EPA’s Grants Reporting and Tracking System (GRTS).
Table 16. Load Reductions Realized From Grazing Systems Installed.
NPS Pollutant Load Reduction
Project Segment 2 Cumulative
Nitrogen 142,723 309,697
Phosphorus 23,765 55,992
Sediment 13,153 32,637
TMDL watershed assessment and implementation projects (HUC 12 name) provided load reduction data
included:
Lower West Fork Elm Creek
Johnny Creek-White River
Deer Creek-Belle Fourche River
Upper Hermaphrodite Creek
Center Pearl Creek
Lower Fourmile Creek
Duck Creek
Jamesville Colony-James River
Lower South Chapelle Creek
Mule Creek
Upper Spring Creek
Powell Creek
Alkali Creek
Kennebec Lake-Medicine Creek
Park Slough
Spring Creek-Red Owl Creek
Deer Creek-Belle Fourche River
Lower Shaefer Creek

46
BEST MANAGEMENT PRACTICES DEVELOPED OR REVISED
While the development and/or revision of best management practices was not included in or
added to the project implementation plan, monitoring activities:
documented the effectiveness of the BMP as a NPS reduction tool for livestock producers
and
provided information regarding the placement of practices to achieve reduction of
nutrients, sediment and fecal coliform bacteria loads to TMDL waterbodies, and
increased the acceptance of managed grazing by not only livestock producers but also
environmental organization such as the teachers, birders, wildlife community.

47
RELATIONSHIP TO MANAGEMENT PLAN
Activities completed during the project period supported attaining the goal of the SD NPS
Program as outlined in the SD NPS Management Plan. Examples of support provided by the
Segment 2 and the cumulative activities of all project segments of the Grazing Management and
Planning Project include but are not limited to the following SD NPS Management Tasks:
Task 4 – Implement TMDLs within two years of completion.
The Grassland Management and Planning Project is a statewide effort that
provides grazing management BMPs planning and implementation assistance in
watersheds where TMDLs are being implemented and developed. The technical
assistance and outreach activities provided by the Grasslands project is a resource
local TMDL project planners and implementation coordinators can use to move
their projects toward completion within the two year window.
Tasks 5 – Maintain working relations with financial and technical assistance partners.
The project PIP is structured to promote the development and use of partnerships
that include resource management agencies, industry and environmental
organizations and the academic community to include the cooperative extension
service to plan and implement BMPs.
Task 8 – Implement clusters of TMDLs on a 12 or 8 digit Hydrologic Unit Codes
(HUCs).
The project provides services across eight digit Hydrologic Unit (HUC)
boundaries irregardless of size. Therefore, the project supports the
implementation of TMDLS in 8 and 12 digit clusters.
Task 10 – Implement multiple TMDLs for several waterbodies across county and
conservation district boundaries using financial and technical assistance from
federal, state and local project partners to expand the TMDL implementation
capabilities of the SD NPS Program.
The Grassland Management and Planning Project implemented grazing
management BMPs in 36 counties in partnership with local, state and federal
agencies and organizations. (See Tables 1, 2, 4 and 5).
Task 12 – Develop and implement an outreach program that provides information and
participation opportunities through partnership.
The project implemented an outreach and education program (Table 14) that
resulted in acceptance of managed grazing as BMP livestock producers can use to

48
reduce NPS pollution while increasing profitability. The program has gained
recognition of environmental organizations as a program that provides habitat for
game and nongame species.
Task 14. –Annual GRTS reports with load reduction data.
GRTS reports with load reduction data were provided to DENR for use in
meeting 319 Program reporting requirements. The reductions were calculated
using the Spreadsheet Tool for Estimating Pollutant Loads (STEPL)

49
COORDINATION AND PUBLIC PARTICIPATION
Coordination
Project activities were directed by a project coordinator provided through a management
agreement with SDACD. The coordinator was responsible for producer assistance, tour
leadership, and assistance at the grazing school. The coordinator’s activities were completed
with supervision provided by SDACD and policy direction from the SDGLC board of directors.
In setting policy and program direction, the coalition board used input from partner agencies and
organization. As indicated previously in this report, input and coordination of efforts between the
partners was accomplished at resource meetings scheduled by partner agencies for similar
purposes.
Coordination efforts to develop and review the accomplishments of cooperative agreements with
partner agencies and groups were completed by direct interaction with the partner(s) who were
party to the agreements. Among the partners with which the coalition had formal or informal
cooperative agreements during the project period were:
NRSC,
USFWS,
SD GF&P,
SDSU,
Lower Brule Sioux Tribe (Grazing School location) and
Crow Creek Sioux Tribe (grazing system development on lease land).
See Table 17 for a more comprehensive list of project partners and their contributions to project
success.
Public Participation
Public participation was encouraged using the activities completed to implement the project information
transfer program (Objective 2). The activities included:
workshops,
grazing schools,
news releases,
tours and
field days
Refer to Tables 9 – 15 for summaries of the activities listed above.

50
Table 17. Project Partners Contributions.
Agency/Organization Contribution Nongovernmental
SD Association of Conservation Districts Provided interim coordinator through contractual services;
technical assistance for administration and BMP planning
through the 319 funded Watershed Planning and Assistance
Project.
SD Ornitholical Society Organization and hosting bird tours.
Governmental
Local
Moody, Brule, Faulk American Creek Conservation
Districts
BMP planning and installation.
State
SD Department of Agriculture Financial assistance for BMP installation and technical
assistance to conservation districts.
SD DENR Technical assistance and training with water quality sampling
and data interpretation, project management and BMP
installation through the 319 Program. Financial assistance for
water quality sampling through the use of fee funds;
Consolidated Water Facilities Construction Fund grant for
AWMs.
SDSU and SDSU Cooperative Extension Service Project management and coordination; demonstration site
establishment and monitoring and outreach activities.
Federal
North Central RC&D Funds to purchase grazing sticks.
Crow Creek Sioux Tribe Project participation
Lower Brule Sioux Tribe Grazing School Field Exercise Location.
US EPA Financial through Clean Water Act Section 319
USDA FSA Financial assistance for BMP installation through the CRP
Program.
USDA NRCS Financial and technical assistance for BMP installation through
the EQIP Program.
USDI FWS Technical assistance for implementation of grassland seeding,
grazing systems, multiple purpose ponds and riparian fencing
Partners for Fish and Wildlife Program.

51
RECOMMENDATIONS
Aspects of the Project That Did Not Work Well
There were several challenges encountered with maintaining the demonstration sites. While the
producers offering the use of their operation for the sites were initially enthusiastic and actively
involved, commitment of several of the cooperators waned when student interns were not
available to assist with the monitoring activities. Much of the difficulty with hiring interns was
attributed; in part, to lack of continuity of SDSU liaison staff tasked with hiring and supervising
student interns.
The challenges referenced above required amending the monitoring plan.
Recommendations
As evidenced by the increasing number of participants in outreach activities and demand for the
technical assistance to provide grazing management inventories and plans listed below, it is
recommended theses activities should be continued.
Persons attending the grazing school uniformly recommended continuing the activity and
indicated they would encourage others to attend.
The project conducted twice as many tours as planned with double the attendance.
Workshops tripled from what was planned with triple the planned attendance.
During the initial stages of the project, i. e. 2002, it was necessary to solicit producer
participation whereas as the project matured toward the end of Project segment 1 and
during the Segment 2 project period, unsolicited producer requests for assistance and
attendance at outreach events often exceeded expectations and often capacity to
provided requested services..
Based on the positive environmental and economic benefits realized from the activities
completed during this and previous project segments, the continuation of support for the
development and installation of managed grazing systems in SD is recommended.

52
PROJECT BUDGET AND EXPENDITURES
The project budget was amended twice during the project period. The first amendment was
made to reflect changes in the PIP with respect to demonstration site establishment and
monitoring... The second budget amendment increased the project grant award by $18,000 to
provide additional funding to cover the costs associated with hiring rangeland consultants needed
to accommodate the requests for assistance for the project beyond the anticipated level.
The budget as amended with a comparison to actual expenditures appears in Table 18.
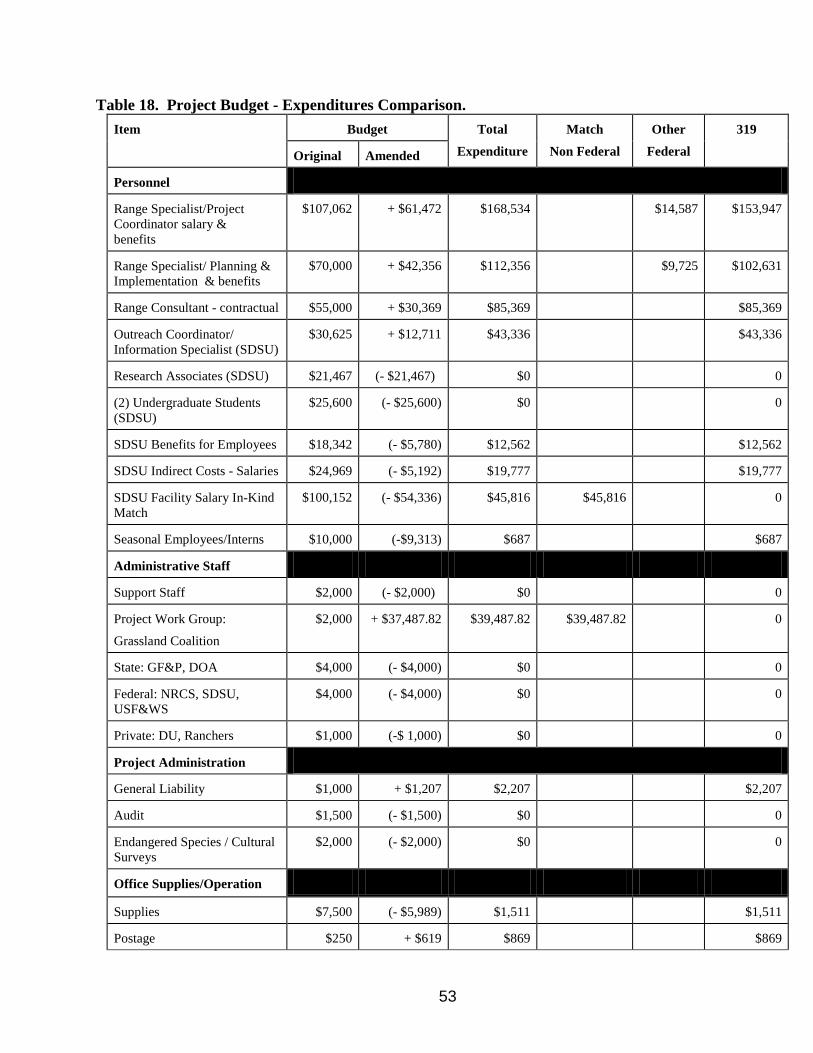
53
Table 18. Project Budget - Expenditures Comparison.
Item Budget Total
Expenditure
Match
Non Federal
Other
Federal
319
Original Amended
Personnel
Range Specialist/Project
Coordinator salary &
benefits
$107,062 + $61,472 $168,534 $14,587 $153,947
Range Specialist/ Planning &
Implementation & benefits
$70,000 + $42,356 $112,356 $9,725 $102,631
Range Consultant - contractual $55,000 + $30,369 $85,369 $85,369
Outreach Coordinator/
Information Specialist (SDSU)
$30,625 + $12,711 $43,336 $43,336
Research Associates (SDSU) $21,467 (- $21,467) $0 0
(2) Undergraduate Students
(SDSU)
$25,600 (- $25,600) $0 0
SDSU Benefits for Employees $18,342 (- $5,780) $12,562 $12,562
SDSU Indirect Costs - Salaries $24,969 (- $5,192) $19,777 $19,777
SDSU Facility Salary In-Kind
Match
$100,152 (- $54,336) $45,816 $45,816 0
Seasonal Employees/Interns $10,000 (-$9,313) $687 $687
Administrative Staff
Support Staff $2,000 (- $2,000) $0 0
Project Work Group:
Grassland Coalition
$2,000 + $37,487.82 $39,487.82 $39,487.82 0
State: GF&P, DOA $4,000 (- $4,000) $0 0
Federal: NRCS, SDSU,
USF&WS
$4,000 (- $4,000) $0 0
Private: DU, Ranchers $1,000 (-$ 1,000) $0 0
Project Administration
General Liability $1,000 + $1,207 $2,207 $2,207
Audit $1,500 (- $1,500) $0 0
Endangered Species / Cultural
Surveys
$2,000 (- $2,000) $0 0
Office Supplies/Operation
Supplies $7,500 (- $5,989) $1,511 $1,511
Postage $250 + $619 $869 $869

54
Table 18 Continued
Item Budget
Original
Budget
Adjustment
Total
Expenditure
s
Match Non
Federal
Other
Federal
319
Cell Phone $1,250 + $1,530 $2,780 $2,780
Computer Maintenance/Lease $1,400 + $4,000 $5,400 $5,400
Computer Software $600 (- $600) $0 0
Office Space + $1,153 $1,153 $1,153
Travel 0
Vehicle Lease $7,500 + $15,600 $23,100 $23,100
Vehicle Mileage $6,400 + $12,776 $19,176 $491 $18,685
Vehicle Insurance $1,750 + $3,018 $4,768 $4,768
Lodging / Meals $900 + $2,962 $3,862 $58 $3,804
SDSU Travel / Lodging /
Meals
$24,000 (-$24,000) $0 0
SDSU Indirect costs for Travel $6,240 + $805 $7,045 $7,045
Subtotal Personnel,
Administration, supplies,
Travel
0
Rotational Grazing Plans
Implemented
$288,500 (-
$126,844.06)
$161,655.94 $161,655.94 0
Maintain 2 and Establish 1
New Demonstration
$17,150 (-$17,150) $0 0
Riparian Demonstration Sites $21,650 (-$21,650) $0 0
Website/Grassland Display $2,500 (- $1,640) $860 $860
Radio Ads, Tours Workshops,
Grazing Schools, News
Releases
$54,500 + $73,356.45 $127,856.45 $103,819.45 $24,037
Reports/Project Management $21,875 (-$5,570) $16,305 $16,305
Monitoring $9,710 (-$9,674) $36 $36
Modeling SDSU $11,340 (-$11,340) $0 0
Match from Range
Consultants $0 0
Subtotal Activities
Total $965,732 (- $59,223) $906,509 $350,779 $24,861 $530,870
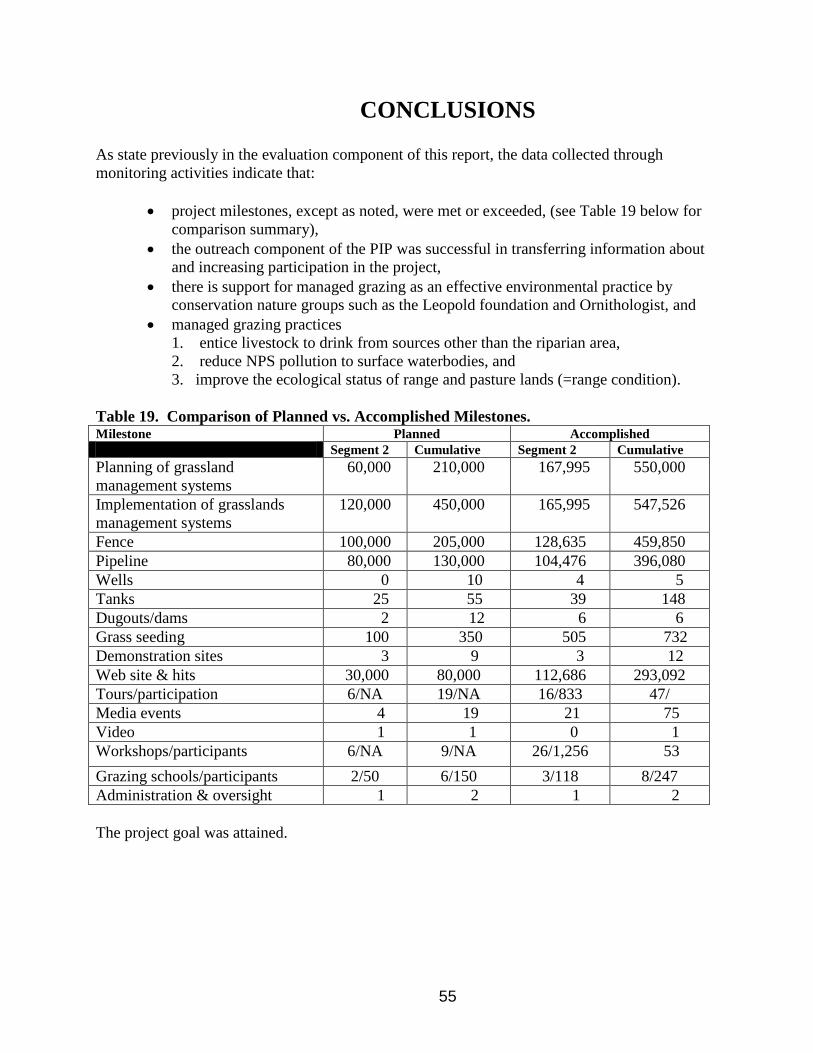
55
CONCLUSIONS
As state previously in the evaluation component of this report, the data collected through
monitoring activities indicate that:
project milestones, except as noted, were met or exceeded, (see Table 19 below for
comparison summary),
the outreach component of the PIP was successful in transferring information about
and increasing participation in the project,
there is support for managed grazing as an effective environmental practice by
conservation nature groups such as the Leopold foundation and Ornithologist, and
managed grazing practices
1. entice livestock to drink from sources other than the riparian area,
2. reduce NPS pollution to surface waterbodies, and
3. improve the ecological status of range and pasture lands (=range condition).
Table 19. Comparison of Planned vs. Accomplished Milestones. Milestone Planned Accomplished
Segment 2 Cumulative Segment 2 Cumulative
Planning of grassland
management systems
60,000 210,000 167,995 550,000
Implementation of grasslands
management systems
120,000 450,000 165,995 547,526
Fence 100,000 205,000 128,635 459,850
Pipeline 80,000 130,000 104,476 396,080
Wells 0 10 4 5
Tanks 25 55 39 148
Dugouts/dams 2 12 6 6
Grass seeding 100 350 505 732
Demonstration sites 3 9 3 12
Web site & hits 30,000 80,000 112,686 293,092
Tours/participation 6/NA 19/NA 16/833 47/
Media events 4 19 21 75
Video 1 1 0 1
Workshops/participants 6/NA 9/NA 26/1,256 53
Grazing schools/participants 2/50 6/150 3/118 8/247
Administration & oversight 1 2 1 2
The project goal was attained.

APPENDIX 1

319 Non-point Source Pollution Program
Eastern South Dakota Riparian Demonstration Project
South Dakota State University
2008 Report
Alexander J. Smart
Vegetation use of riparian pastures
Seven riparian pastures along tributaries of the Big Sioux River in eastern South Dakota were monitored
for the impact of livestock grazing on litter cover, vegetative cover, plant height, and visual obstruction
measurements. Transects running parallel to streams at a distance of 5, 25, 50, 75, and 100 m away
from the streams were established at 3 to 4 sites per pasture. All sites were monitored in spring (June)
and late summer (August) of 2008. Three of the sites were rotationally grazed and 4 sites were
continuously grazed. Table 1 and 2 describes the effect of livestock distribution across the pasture as a
function of transect distance from the stream in the spring and summer. Plant height and visual
obstruction were significantly different at distances from the stream. These data show that cattle did not
overgraze the areas adjacent to the stream (5 m away), but tended to graze more between 25 and 50 m
away from the stream. There were no differences in percent litter or vegetative cover at different
distances away from the stream. The cover of litter and vegetation was higher as the season progressed
(Tables 1 and 2). There was no difference in any of the measurements between rotational grazing and
season long continuous grazing systems. This was likely due to the fact that pasture size at these
locations were generally less than 100 acres and distances to water or other parts of the pasture was
never greater than 0.5 miles.
Runoff and sediment yield
Sprinkle infiltrometer measurements were made during the summer of 2007 and 2008 at two western
and five eastern sites in South Dakota. Runoff and sediment yield were estimated using a Cornell
sprinkle infiltrometer (Fig. 1). Infiltration runs were made on dry field conditions. Rate of application
was approximately 0.5 cm/min for 45 minute runs. This was equivalent to applying at a rate of 11.8
inches/hr. Additional vegetation measurements of plant height, vegetative cover, litter cover, and
vegetative weight were made for the modeling purposes. Soil moisture, bulk density, and slope also
were made. Average runoff ranged from 0.08 cm/min at Summit to 0.36 cm/min at Sturgis (Table 3).
Average sediment yield was greater for the two western South Dakota sites compared to the five eastern
sites. This was supported by the fact that vegetative and litter cover tended to be less at sites from the
mixed-grass prairie in western South Dakota compared to tallgrass prairie sites in eastern South Dakota.
In addition, western South Dakota sites were comprised of clayey or dense clay ecological sites
compared to silty and thin upland ecological sites in the east which would have coarser soil textures.
These infiltration runs would mimic intense, short-lived rainfall events. The fact that very little
sediment yield was produced from the eastern South Dakota sites suggests that erosion from these
grasslands is actually quite low. Sedimentation of streams feeding into the Big Sioux River would more
likely be due to the process of natural stream bank erosion or sediment entering the stream from hoof
action of livestock activity and not from overland flow. In western South Dakota, sedimentation of
streams could come from soil erosion from uplands as indicated by our sediment yield estimates.

Another mechanism of sediment loadings that our measurements technique does not explain is the
process of overland flow resulting in gully formation. During intense rainfall events, overland flow
could create cutting and gulley erosion. At the high experimental application rates, 66 and 72% of the
water applied ran off at Cottonwood and Sturgis, respectively. At the eastern South Dakota locations,
runoff rate accounted for 16 to 64% of the application rate.
Conclusion
These data suggest that livestock grazing of riparian pastures in eastern South Dakota, does not impact
sediment loading from the surrounding uplands. Use of vegetation was fairly even across the pasture as
indicated from the vegetation measurements at different distances from the stream. Since riparian
pasture size was relatively small at the eastern South Dakota locations, livestock distribution was even.
Cattle tend to not overgraze near the stream. One reason might be the fact that vegetation is not as
palatable and/or hummocky terrain deters livestock from over using these areas. To minimize stream
bank erosion and reduce direct access to streams by livestock, alternative water sources, rock crossings,
and fencing could be effective strategies. Fencing out wide buffers alongside the stream may not be
necessary.
Table 1. Litter cover, vegetative cover, plant height, and visual obstruction
measured at seven sites in eastern South Dakota, June 2008.
Distance from stream (m)
5 25 50 75 100
Litter, % 27.9 28.2 29.0 30.3 30.8
Vegetative cover, % 45.2 43.1 40.1 42.7 48
Plant height, cm 13.5 a 11.4 b 12.0 ab 13.1 ab 14.5 a
Visual obstruction, cm 10.3 a 8.7 b 9.1 b 10.1 a 10.7 a a,b
Means followed by a similar letter are not significantly different (P>0.05).
Table 2. Litter cover, vegetative cover, plant height, and visual obstruction
measured at seven sites in eastern South Dakota, August 2008.
Distance from stream (m)
5 25 50 75 100
Litter, % 72.6 73.6 77.1 75.9 78.4
Vegetative cover, % 59.6 55.9 57.9 59.8 63.4
Plant height, cm 13.8 11.1 13.2 14.6 15.0
Visual obstruction, cm 11.9 ab 10.6 b 11.2 b 13.1 a 13.8 a a,b
Means followed by a similar letter are not significantly different (P>0.05).
Table 3. Summary statistics of runoff, sediment yield, vegetation and soil
parameters adjusted to a constant sprinkler application rate of 0.5 cm/min.
Site Parameter Mean Stdev Min Max
Brookings runoff (cm/min) 0.11 0.07 0.02 0.24
n=24 sediment (kg/ha) 13.01 18.73 0.14 65.88
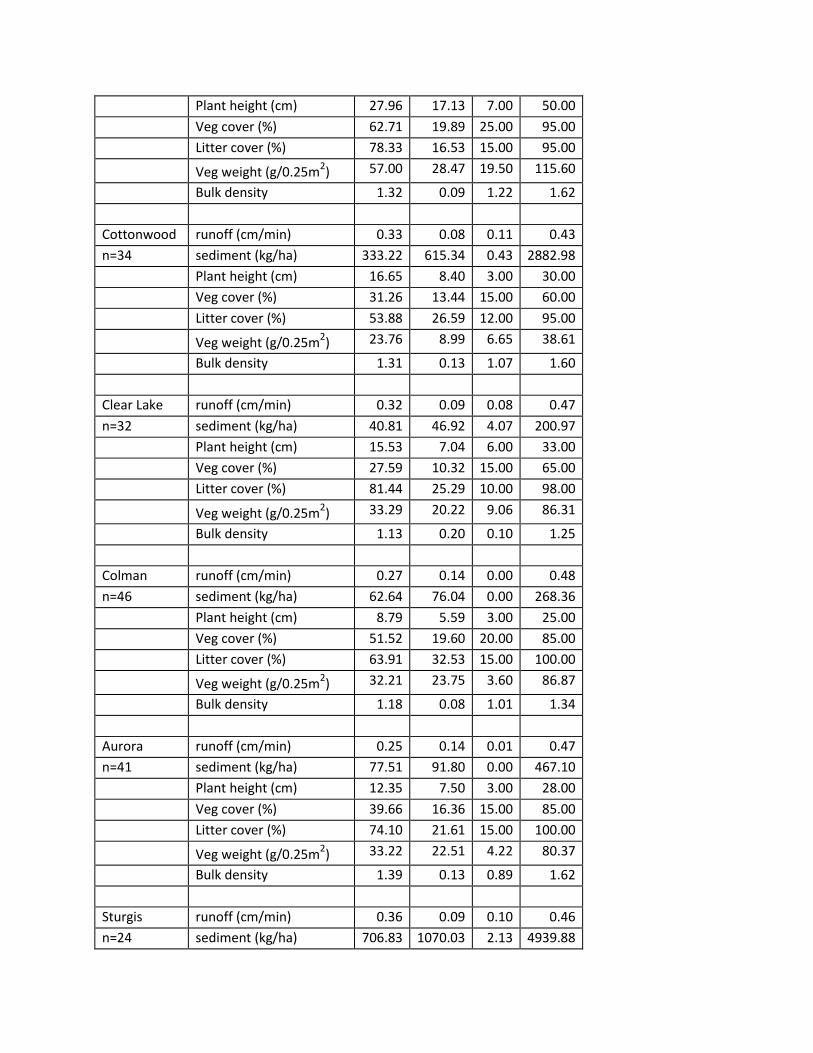
Plant height (cm) 27.96 17.13 7.00 50.00
Veg cover (%) 62.71 19.89 25.00 95.00
Litter cover (%) 78.33 16.53 15.00 95.00
Veg weight (g/0.25m2) 57.00 28.47 19.50 115.60
Bulk density 1.32 0.09 1.22 1.62
Cottonwood runoff (cm/min) 0.33 0.08 0.11 0.43
n=34 sediment (kg/ha) 333.22 615.34 0.43 2882.98
Plant height (cm) 16.65 8.40 3.00 30.00
Veg cover (%) 31.26 13.44 15.00 60.00
Litter cover (%) 53.88 26.59 12.00 95.00
Veg weight (g/0.25m2) 23.76 8.99 6.65 38.61
Bulk density 1.31 0.13 1.07 1.60
Clear Lake runoff (cm/min) 0.32 0.09 0.08 0.47
n=32 sediment (kg/ha) 40.81 46.92 4.07 200.97
Plant height (cm) 15.53 7.04 6.00 33.00
Veg cover (%) 27.59 10.32 15.00 65.00
Litter cover (%) 81.44 25.29 10.00 98.00
Veg weight (g/0.25m2) 33.29 20.22 9.06 86.31
Bulk density 1.13 0.20 0.10 1.25
Colman runoff (cm/min) 0.27 0.14 0.00 0.48
n=46 sediment (kg/ha) 62.64 76.04 0.00 268.36
Plant height (cm) 8.79 5.59 3.00 25.00
Veg cover (%) 51.52 19.60 20.00 85.00
Litter cover (%) 63.91 32.53 15.00 100.00
Veg weight (g/0.25m2) 32.21 23.75 3.60 86.87
Bulk density 1.18 0.08 1.01 1.34
Aurora runoff (cm/min) 0.25 0.14 0.01 0.47
n=41 sediment (kg/ha) 77.51 91.80 0.00 467.10
Plant height (cm) 12.35 7.50 3.00 28.00
Veg cover (%) 39.66 16.36 15.00 85.00
Litter cover (%) 74.10 21.61 15.00 100.00
Veg weight (g/0.25m2) 33.22 22.51 4.22 80.37
Bulk density 1.39 0.13 0.89 1.62
Sturgis runoff (cm/min) 0.36 0.09 0.10 0.46
n=24 sediment (kg/ha) 706.83 1070.03 2.13 4939.88

Plant height (cm) 23.00 6.52 13.00 35.00
Veg cover (%) 39.92 15.26 15.00 70.00
Litter cover (%) 27.00 34.81 1.00 90.00
Veg weight (g/0.25m2) 47.83 23.63 20.50 104.55
Bulk density 1.50 0.12 1.28 1.70
Summit runoff (cm/min) 0.08 0.09 0.00 0.34
n=28 sediment (kg/ha) 25.58 30.71 0.00 135.18
Plant height (cm) 18.07 6.43 4.00 27.00
Veg cover (%) 38.96 18.72 15.00 85.00
Litter cover (%) 84.04 17.24 40.00 98.00
Veg weight (g/0.25m2) 40.30 23.74 12.75 94.00
Bulk density 1.08 0.09 0.88 1.32
Figure 1. Cornell sprinkler infiltrometer.

APPENDIX 2

RIPARIAN DEMONSTRATION SITES
Modification to the riparian demonstration project as part of the Grasslands Project Monitoring Plan was
necessary because of discontinued producer involvement. We modified the eastern South Dakota
riparian site project to include a set of riparian pastures where we measured vegetation structure,
infiltration and runoff using a sprinkler infiltrometer, and collected water quality samples at points up
and downstream of land ownership during two high flow events in 2008.
The western South Dakota demonstration site included a comparison of vegetation structure measured
along the lower branch of the Grand River on two US Forest Service allotments where one pasture had
an alternative water source and the other did not.
RESULTS
Vegetation use of riparian pastures
Seven riparian pastures along tributaries of the Big Sioux River in eastern South Dakota were monitored
for the impact of livestock grazing on litter cover, vegetative cover, plant height, and visual obstruction
measurements. Transects running parallel to streams at a distance of 5, 25, 50, 75, and 100 m away
from the streams were established at 3 to 4 sites per pasture. All sites were monitored in spring (June)
and late summer (August) of 2008. Three of the sites were rotationally grazed and 4 sites were
continuously grazed. Tables 1 and 2 describe the effect of livestock distribution across the pasture as a
function of transect distance from the stream in the spring and summer. Plant height and visual
obstruction were significantly different at distances from the stream. These data show that cattle did not
overgraze the areas adjacent to the stream (5 m away), but tended to graze more between 25 and 50 m
away from the stream. There were no differences in percent litter or vegetative cover at different
distances away from the stream. The cover of litter and vegetation was higher as the season progressed
(Tables 1 and 2). There was no difference in any of the measurements between rotational grazing and
season long continuous grazing systems. This was likely due to the fact that pasture size at these
locations were generally less than 100 acres and distances to water or other parts of the pasture was
never greater than 0.5 miles.
Table 1. Litter cover, vegetative cover, plant height, and visual obstruction measured
at seven sites in eastern South Dakota, June 2008.
Distance from stream (m)
5 25 50 75 100
Litter, % 27.9 28.2 29.0 30.3 30.8
Vegetative cover, % 45.2 43.1 40.1 42.7 48
Plant height, cm 13.5 a 11.4 b 12.0 ab 13.1 ab 14.5 a
Visual obstruction, cm 10.3 a 8.7 b 9.1 b 10.1 a 10.7 a a,b
Means followed by a similar letter are not significantly different (P>0.05).
Table 2. Litter cover, vegetative cover, plant height, and visual obstruction measured
at seven sites in eastern South Dakota, August 2008.

Distance from stream (m)
5 25 50 75 100
Litter, % 72.6 73.6 77.1 75.9 78.4
Vegetative cover, % 59.6 55.9 57.9 59.8 63.4
Plant height, cm 13.8 11.1 13.2 14.6 15.0
Visual obstruction, cm 11.9 ab 10.6 b 11.2 b 13.1 a 13.8 a a,b
Means followed by a similar letter are not significantly different (P>0.05).
Runoff and sediment yield
Sprinkle infiltrometer measurements were made during the summer of 2007 and 2008 at two western
and five eastern sites in South Dakota. Runoff and sediment yield were estimated using a Cornell
sprinkle infiltrometer (Fig. 1). Infiltration runs were made on dry field conditions. Rate of application
was approximately 0.5 cm/min for 45 minute runs. This was equivalent to applying at a rate of 11.8
inches/hr.
.
Figure 1. Cornell sprinkler infiltrometer
Additional vegetation measurements of plant height, vegetative cover, litter cover, and vegetative weight
were made for the modeling purposes. Soil moisture, bulk density, and slope also were made. Average
runoff ranged from 0.08 cm/min at Summit to 0.36 cm/min at Sturgis (Table 3). Average sediment yield
was greater for the two western South Dakota sites compared to the five eastern sites. This was
supported by the fact that vegetative and litter cover tended to be less at sites from the mixed-grass
prairie in western South Dakota compared to tallgrass prairie sites in eastern South Dakota. In addition,
western South Dakota sites were comprised of clayey or dense clay ecological sites compared to silty
and thin upland ecological sites in the east which would have coarser soil textures.
Table 3. Summary statistics of runoff, sediment yield, vegetation and soil
parameters adjusted to a constant sprinkler application rate of 0.5 cm/min.
Site Parameter Mean Stdev Min Max
Brookings runoff (cm/min) 0.11 0.07 0.02 0.24

n=24 sediment (kg/ha) 13.01 18.73 0.14 65.88
Plant height (cm) 27.96 17.13 7.00 50.00
Veg cover (%) 62.71 19.89 25.00 95.00
Litter cover (%) 78.33 16.53 15.00 95.00
Veg weight (g/0.25m2) 57.00 28.47 19.50 115.60
Bulk density 1.32 0.09 1.22 1.62
Cottonwood runoff (cm/min) 0.33 0.08 0.11 0.43
n=34 sediment (kg/ha) 333.22 615.34 0.43 2882.98
Plant height (cm) 16.65 8.40 3.00 30.00
Veg cover (%) 31.26 13.44 15.00 60.00
Litter cover (%) 53.88 26.59 12.00 95.00
Veg weight (g/0.25m2) 23.76 8.99 6.65 38.61
Bulk density 1.31 0.13 1.07 1.60
Clear Lake runoff (cm/min) 0.32 0.09 0.08 0.47
n=32 sediment (kg/ha) 40.81 46.92 4.07 200.97
Plant height (cm) 15.53 7.04 6.00 33.00
Veg cover (%) 27.59 10.32 15.00 65.00
Litter cover (%) 81.44 25.29 10.00 98.00
Veg weight (g/0.25m2) 33.29 20.22 9.06 86.31
Bulk density 1.13 0.20 0.10 1.25
Colman runoff (cm/min) 0.27 0.14 0.00 0.48
n=46 sediment (kg/ha) 62.64 76.04 0.00 268.36
Plant height (cm) 8.79 5.59 3.00 25.00
Veg cover (%) 51.52 19.60 20.00 85.00
Litter cover (%) 63.91 32.53 15.00 100.00
Veg weight (g/0.25m2) 32.21 23.75 3.60 86.87
Bulk density 1.18 0.08 1.01 1.34
Aurora runoff (cm/min) 0.25 0.14 0.01 0.47
n=41 sediment (kg/ha) 77.51 91.80 0.00 467.10
Plant height (cm) 12.35 7.50 3.00 28.00
Veg cover (%) 39.66 16.36 15.00 85.00
Litter cover (%) 74.10 21.61 15.00 100.00
Veg weight (g/0.25m2) 33.22 22.51 4.22 80.37
Bulk density 1.39 0.13 0.89 1.62
Sturgis runoff (cm/min) 0.36 0.09 0.10 0.46
n=24 sediment (kg/ha) 706.83 1070.03 2.13 4939.88
Plant height (cm) 23.00 6.52 13.00 35.00
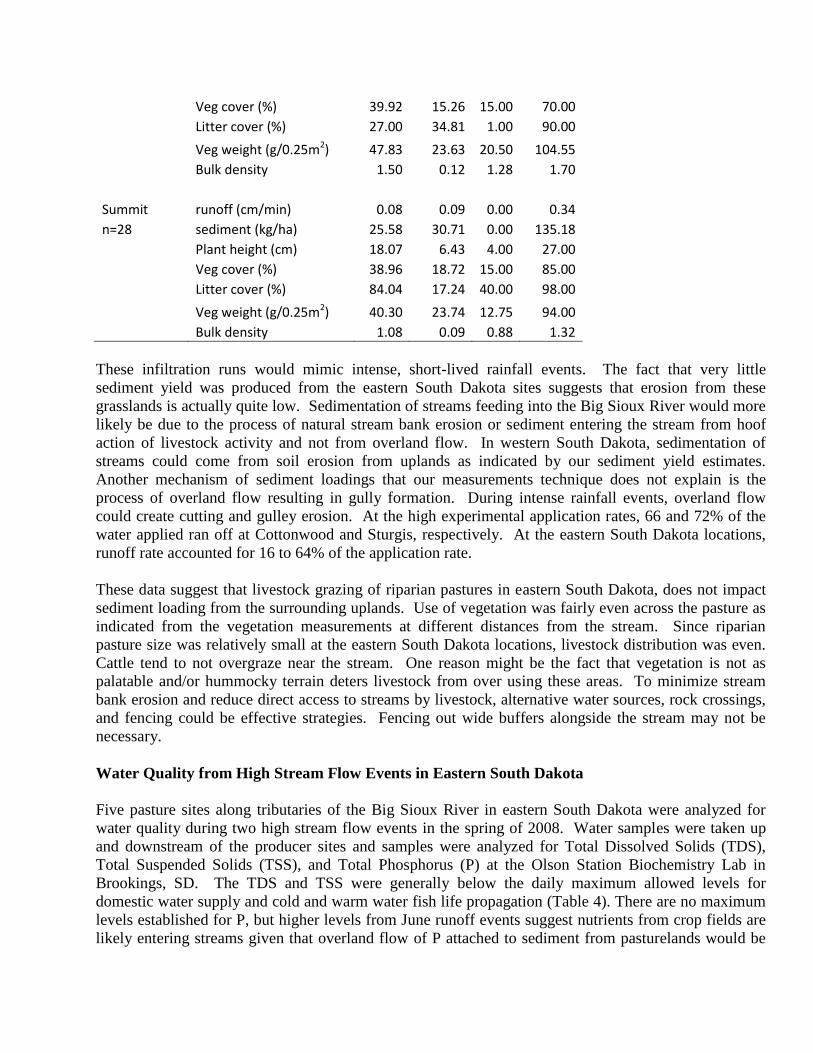
Veg cover (%) 39.92 15.26 15.00 70.00
Litter cover (%) 27.00 34.81 1.00 90.00
Veg weight (g/0.25m2) 47.83 23.63 20.50 104.55
Bulk density 1.50 0.12 1.28 1.70
Summit runoff (cm/min) 0.08 0.09 0.00 0.34
n=28 sediment (kg/ha) 25.58 30.71 0.00 135.18
Plant height (cm) 18.07 6.43 4.00 27.00
Veg cover (%) 38.96 18.72 15.00 85.00
Litter cover (%) 84.04 17.24 40.00 98.00
Veg weight (g/0.25m2) 40.30 23.74 12.75 94.00
Bulk density 1.08 0.09 0.88 1.32
These infiltration runs would mimic intense, short-lived rainfall events. The fact that very little
sediment yield was produced from the eastern South Dakota sites suggests that erosion from these
grasslands is actually quite low. Sedimentation of streams feeding into the Big Sioux River would more
likely be due to the process of natural stream bank erosion or sediment entering the stream from hoof
action of livestock activity and not from overland flow. In western South Dakota, sedimentation of
streams could come from soil erosion from uplands as indicated by our sediment yield estimates.
Another mechanism of sediment loadings that our measurements technique does not explain is the
process of overland flow resulting in gully formation. During intense rainfall events, overland flow
could create cutting and gulley erosion. At the high experimental application rates, 66 and 72% of the
water applied ran off at Cottonwood and Sturgis, respectively. At the eastern South Dakota locations,
runoff rate accounted for 16 to 64% of the application rate.
These data suggest that livestock grazing of riparian pastures in eastern South Dakota, does not impact
sediment loading from the surrounding uplands. Use of vegetation was fairly even across the pasture as
indicated from the vegetation measurements at different distances from the stream. Since riparian
pasture size was relatively small at the eastern South Dakota locations, livestock distribution was even.
Cattle tend to not overgraze near the stream. One reason might be the fact that vegetation is not as
palatable and/or hummocky terrain deters livestock from over using these areas. To minimize stream
bank erosion and reduce direct access to streams by livestock, alternative water sources, rock crossings,
and fencing could be effective strategies. Fencing out wide buffers alongside the stream may not be
necessary.
Water Quality from High Stream Flow Events in Eastern South Dakota
Five pasture sites along tributaries of the Big Sioux River in eastern South Dakota were analyzed for
water quality during two high stream flow events in the spring of 2008. Water samples were taken up
and downstream of the producer sites and samples were analyzed for Total Dissolved Solids (TDS),
Total Suspended Solids (TSS), and Total Phosphorus (P) at the Olson Station Biochemistry Lab in
Brookings, SD. The TDS and TSS were generally below the daily maximum allowed levels for
domestic water supply and cold and warm water fish life propagation (Table 4). There are no maximum
levels established for P, but higher levels from June runoff events suggest nutrients from crop fields are
likely entering streams given that overland flow of P attached to sediment from pasturelands would be

very minimal in eastern South Dakota (Table 3). Generally all parameters changed very little from up
and downstream monitoring points (Table 4).
Table 4. Water quality parameters from five pasture sites on tributaries of the Big Sioux River in
Brookings and Moody Counties during two high stream flow events in the spring of 2008.
Tributary Site Up/down
river Date TDS
(ppm) TSS
(ppm)
Total Phosphorus
(ppm)
Spring Creek A up 5/13/2008 480 11 0.061
Spring Creek A down 5/13/2008 484 15 0.081
Spring Creek A up 6/6/2008 512 15 0.241
Spring Creek A down 6/6/2008 472 23 0.301
Bachelor Creek B up 5/13/2008 1502 18 0.152
Bachelor Creek B down 5/13/2008 1432 31.5 0.172
Bachelor Creek B up 6/6/2008 1012 160 0.787
Bachelor Creek B down 6/6/2008 1028 198 0.764
Unnammed C up 5/13/2008 704 2.5 0.36
Unnammed C down 5/13/2008 748 2.5 0.044
Unnammed C up 6/6/2008 444 37 0.425
Unnammed C down 6/6/2008 428 38 0.439
Bachelor Creek D up 5/13/2008 1596 24 0.154
Bachelor Creek D down 5/13/2008 1492 21 0.152
Bachelor Creek D up 6/6/2008 1100 54 0.597
Bachelor Creek D down 6/6/2008 980 151 0.742
Medary Creek E up 5/13/2008 694 32 0.133
Medary Creek E down 5/13/2008 628 30 0.137
Medary Creek E up 6/6/2008 312 88 0.423
Medary Creek E down 6/6/2008 360 82 0.417
Alternative Water Source
The western South Dakota riparian demonstration site compared vegetation structure along the lower
fork of the Grand River. Transects running parallel to the river at a distance of 10, 50, and 100 m away
were established at 3 sites per pasture. Vegetation structure using the Robel Pole method was made 20
times per transect in October 2008. One pasture had an alternative water source that consisted of piped
water to a livestock tank approximately one quarter mile from the river, while the control pasture did not
have an alternative water source. The pastures were continuously grazed from June to August.
The results showed that cattle tended to graze more heavily close to the river in the pasture without the
alternative water source (Fig. 2) compared with pasture that had the alternative water source (Fig. 3).

Figure 2. Visual obstruction (cm) measured in October 2008 from three transects running parallel to
the lower fork of the Grand River in a pasture grazed from June-August without an
alternative water source.
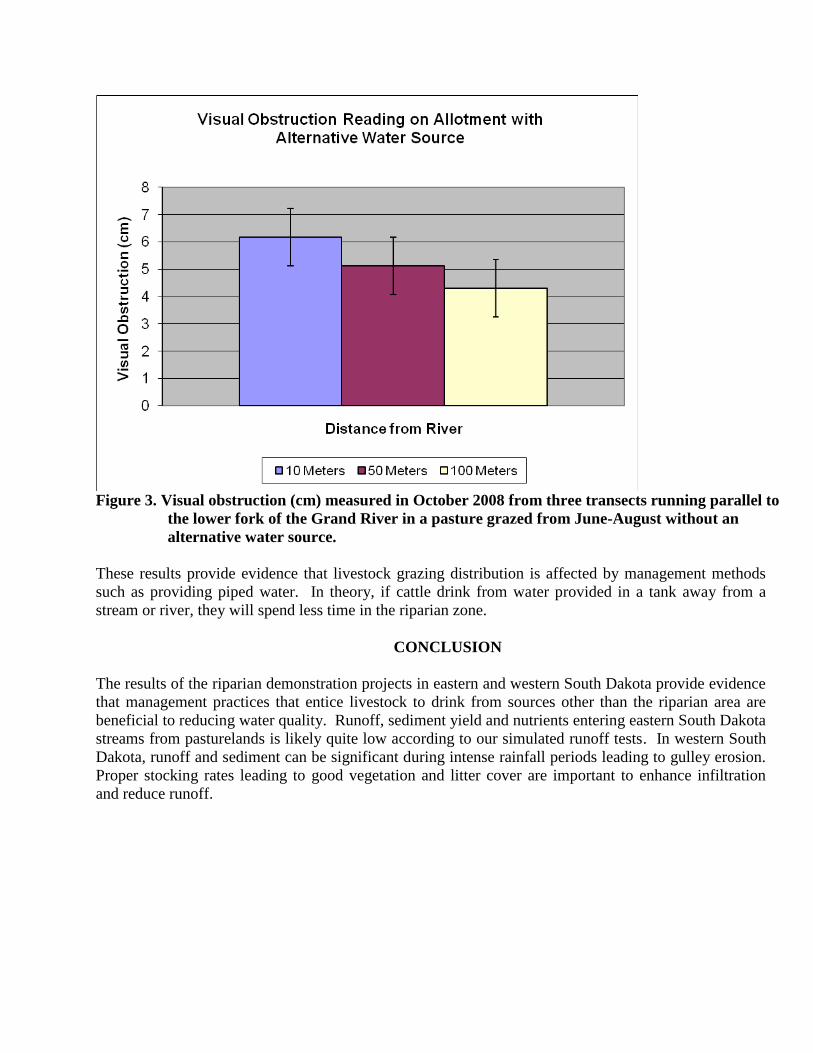
Figure 3. Visual obstruction (cm) measured in October 2008 from three transects running parallel to
the lower fork of the Grand River in a pasture grazed from June-August without an
alternative water source.
These results provide evidence that livestock grazing distribution is affected by management methods
such as providing piped water. In theory, if cattle drink from water provided in a tank away from a
stream or river, they will spend less time in the riparian zone.
CONCLUSION
The results of the riparian demonstration projects in eastern and western South Dakota provide evidence
that management practices that entice livestock to drink from sources other than the riparian area are
beneficial to reducing water quality. Runoff, sediment yield and nutrients entering eastern South Dakota
streams from pasturelands is likely quite low according to our simulated runoff tests. In western South
Dakota, runoff and sediment can be significant during intense rainfall periods leading to gulley erosion.
Proper stocking rates leading to good vegetation and litter cover are important to enhance infiltration
and reduce runoff.

APPENDIX 3
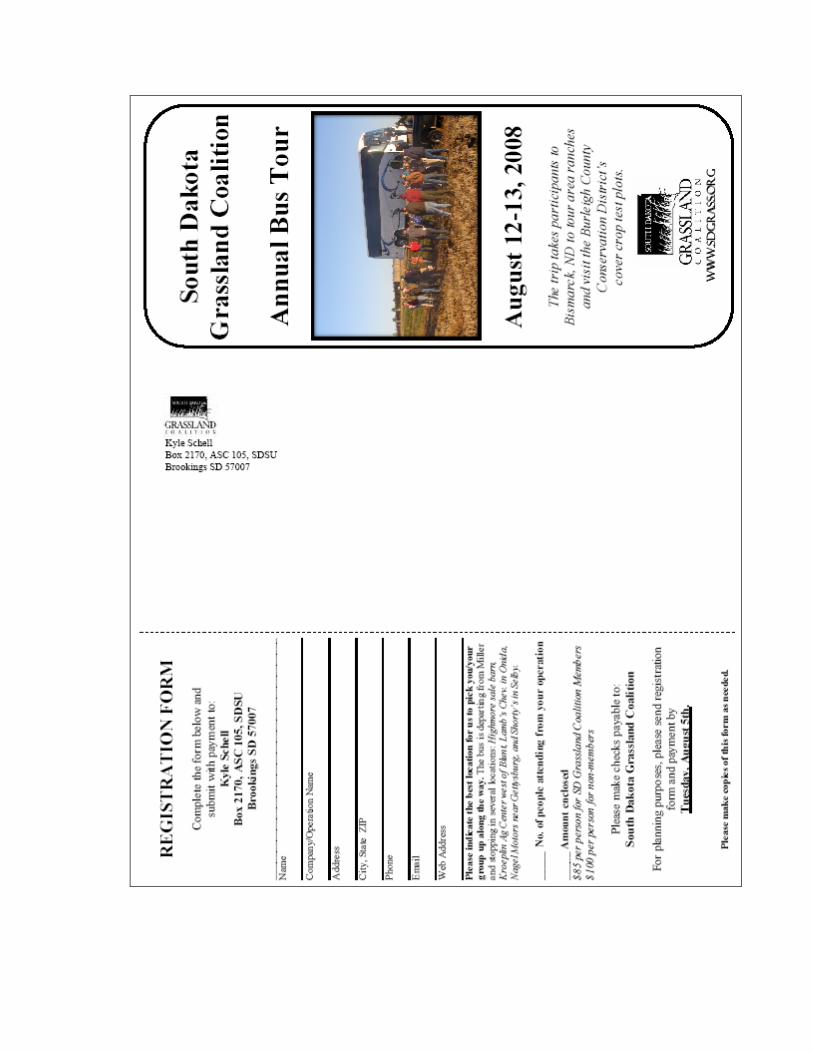


APPENDIX 4

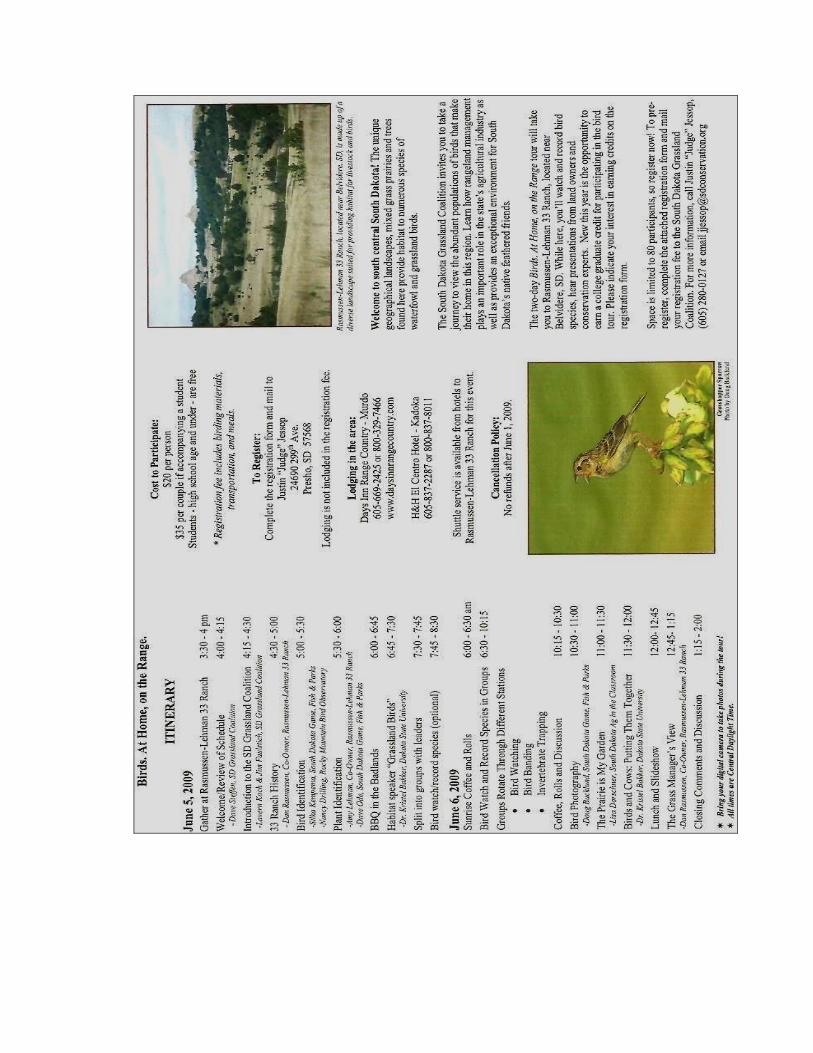

APPENDIX 5


APPENDIX 6