cleaner production audit in the pulp and paper
TRANSCRIPT

CLEANER PRODUCTION AUDIT IN THE PULP AND PAPER INDUSTRY: A CASE STUDY IN VIETNAM
by
Vu Tuong Anh
A thesis submitted in partial fulfillment of the requirement for the degree of Master of Science Examination Committee : Dr. C. Visvanathan (Chairman) Mrs. Samorn Muttamara Dr. Nguyen Thi Kim Oanh Vu Tuong Anh Nationality : Vietnamese Previous Degree : B.Sc. (Chemistry) Hanoi University Scholarship Donor : Ecumenical Scholarship Program (ESP)
Asian Institute of Technology Bangkok, Thailand
August, 1996

ii
ACKNOWLEDGMENT First of all I would like to express my profound gratitude and sincerest appreciation to my advisor, Dr. C. Visvanathan for his encouragement, unending support and valuable advice throughout the study period. My gratitude is extended to Mrs. Samorn Muttamara and Dr. Nguyen Thi Kim Oanh for their valuable advice and kindly serving as committee members. Appreciation is greatly extended to the Ecumenical Scholarship Program (ESP) for providing financial support for my study at AIT, and to the DANIDA for supporting research grant. Sincere thanks are due to Dr. Tran Van Nhan and the Center for Environmental Science and Technology, Hanoi University of Technology for their help and support during my field study in Vietnam. I would like to express my sincere thanks to Dr. Mark Radka of UNEP for providing necessary information and sharing his experience with me. My thanks is extended to all staff in the Technical Department of the Van Diem mill for their help in my field study in the mill. I would like to thank all faculty, staff and friends of EEP (SERD) at AIT for their help and cooperation. Finally, I wish to express my extreme gratefulness to my beloved parents and my brother for their unending love and encouragement. My sincere thanks is extended to my husband for his helpfulness, encouragement and moral support during my research period. I would like to dedicate this piece of work to my beloved parents.

iii
ABSTRACT
Van Diem Paper Mill is a small integrated paper mill that uses bagasse and waste paper as raw material. The mill manufactures carton board, cover paper, pupil note-book cover. It was found that upsets and spills occurred frequently as a result of the old process. The production capacity was found to be 9 tons/day when the mill was running normally. Water balance, material balance and energy balance were drawn for the mill. The water consumption on an overall basis was found to be 376 m3 per ton of product. The suspended solid (SS) in the wastewater was 431.8 kg/ton of product. The fiber loss from the paper machines was considerable with the value of 20.8%. The total of SS and SS70 (parameter used to assess the fiber loss of a paper mill) discharged to the Red river was 369.7 kg/ton and 211.7 kg/ton respectively. The high concentration of alkaline vapour (0.187 mg/L) in the digestor plant was a severe source of air pollution in the mill. The cleaner production opportunities for the mill were studied. Stream segregation with black liquor collection could reduce pollution load. Good-housekeeping was especially recommended such as repairing all leakage, keeping taps closed when they are not in use and cleaning rolls in paper machines.

TABLE OF CONTENTS
CHAPTER TITLE PAGE Title Page i Acknowledgment ii Abstract iii Table of Contents iv List of Figures v List of Tables vi List of Illustration vii I. INTRODUCTION 1 1.1 General 1 1.2 Objective 2 1.3 Scope and Limitation of the Study 2 II. LITERATURE REVIEW 3 2.1 General Production Process of Pulp and Paper Industry 3 2.2 Source of Water Pollution and Its Characteristic 10 2.3 Environmental Problem from Pulping Processes 11 2.4 Raw Material for Pulping 12 2.5 Cleaner Production for Small Pulp and Paper Mills 15 2.6 An Overview of the Pulp and Paper Industry in Vietnam and Related Environmental Issues 16 2.7 Bench Marks in Pulp and Paper Industry 17 III. BACKGROUND INFORMATION OF THE RESEARCH SITE 3.1 General Information 19 3.2 Production Processing 19 3.3 Existing Water Supplied 22 3.4 Existing Wastewater System 22 3.5 Existing Fiber Recovery Unit 26 3.6 Working Environment and Environmental Issues of the Mill 26 3.7 Energy Consumption 26 IV. METHODOLOGY 4.1 Study Program 30 4.2 Data Collection 30 4.3 Inplant Monitoring 30 4.4 Material Balance and Energy Balance 30

4.5 Water Balance 30 4.5.1 Water Supplied Measurement 30 4.5.2 Wastewater Measurement 31 4.5.3 Sampling 32 4.5.4 Water and Wastewater Characterization 33 4.6 Fiber Recovery Unit Study 33 4.7 Physical Agents in Working Environment 4.7.1 Noise Measurement 33 4.7.2 Particulate Matter 36 V RESULTS AND DISCUSSIONS 5.1 Bench Mark of Pulp and Paper Mill 38 5.1.1 Raw Water Used in the Pulp and Paper Mill 38 5.1.2 Wastewater from Production Process 39 5.1.3 Energy Consumption of the Mill 40 5.2 Waste Auditing of Pulp and Paper Mill 40 5.2.1 Unit Operation of the Mill 40 5.2.2 Water Consumption 42 5.2.3 Accounting for Total Wastewater 44 5.2.4 Evaluating Material Balance 48 5.2.5 Summary 52 5.3 Energy Auditing of the Mill 53 5.3.1 Energy Consumption 53 5.3.2 Summary 54 5.4 Fiber Recovery Unit Study 54 5.4.1 Wastewater Quality and Fiber Recovery Efficiency 54 5.4.2 Determination of Settleable Solid of the Effluent 55 5.5 Noise and Air Pollution in the Work Environment 56 5.5.1 Noise 57 5.5.2 Particulate Matter 55 5.6 Identification for Cleaner Production Oppotunities 58 5.6.1 Causes of Waste Generation 58 5.6.2 Cleaner Production Oppotunities 59 5.7 Options of Cleaner Production Opportunities 60
IV CONCLUSIONS AND RECOMMENDATIONS 6.1 Water and Energy of the Mill 64 6.2 Noise and Air Pollution in the Mill 65 6.3 Recommendation on Cleaner Production Opportunities 65 REFERENCES APPENDICES

LIST OF FIGURES FIGURE TITLE PAGE 2.1 Simplified Diagram of Pulp and Paper Process 4 2.2 Flowchart of Mechanical Pulping Process 5 2.3 Sulphite Pulping Process 7 2.4 Semichemical Pulping Process 9 2.5 Cleaner Production Techniques 15 3.1 Location of the Van Diem Paper Mill 20 3.2 Layout of the Van Diem Paper Mill 21 3.3 Simplified Diagram of Pulp and Paper Production of the Mill 23 3.4 Pulp Production Diagram of the Mill 24 3.5 Paper Production Diagram of the Mill 25 3.6 Water Supplied System of the Mill 26 3.7 Wastewater Drainage System of the Mill 27 3.8 Steam Distribution System of the Mill 29 4.1 General Methodology Outline 31 4.2 Flowrate Measurement Equipment 32 4.3 Wastewater Sampling Points and Wastewater Flow Measurement Points 33 4.4 Raw Water Sampling Points and Water Supplied Flow Measurement Points 34 4.5 Settleable Solid Measurement Using Imhoff Cone 37 4.6 Sound Level Meter Used for Noise Measurement 37

LIST OF TABLES
TABLE TITLE PAGE 2.1 Typical Analytical results for Pulp and Paper Mill Waste 10 2.2 Chemical Composition and Fiber Dimension of Agricultural Residue-based and Wood Based Raw Material 13 2.3 Wash Filter Loading and Dewatering Properties of Various Sulphate and Soda Pulp 14 2.4 Bench Marks for Pulp and Paper Production 17 2.5 Wastewater Pollution Load in Agricultural Residue-based Mill 18 4.1 Analytical Parameters, Locations and Methods Used during the Study 35

ix
ABBREVIATION BL : Black Liquor BOD : Biochemical Oxygen Demand COD : Chemical Oxygen Demand Cond. : Conductivity CP : Cleaner Production I : Investment Costs kg/ton : kg/ton of product L : Litre L/s : Litre per second Lpm : Litre per minute P : Pay Back Period PM : Paper Machine RM : Raw Material Preparation S : Saving Money SS : Suspended Solid SS70 : Suspended Solid (filter 70 µm) Temp. : Temperature TS : Total Solid

CHAPTER 1
INTRODUCTION
1. General Paper is becoming an essential commodity of today’s society. The pulp and paper industry has been growing with demand of paper. The capita consumption has also been steadily increasing over the world. The pulp and paper industry is considered as one of the major potential sources of pollution in the environment. There are two segments, pulping and paper making in the manufacturing process. Pulping is the major source of environmental pollution. Black liquor from chemical pulping processes is the most significant and troublesome source of pollution. Effluent from these pulping processes contains chemicals which are known to cause damage to the flora and fauna . Also, bottom deposits of lignin cellulose material near the point of discharge undergoes slow decomposition that leads to depletion of dissolved oxygen in the receiving body. The raw materials for pulp production are those containing cellulose fibers. They are divided into two main types: wood and non-wood materials. Environmental problems on a global scale of deforestation is occurring. Therefore, using non-wood fiber material for paper production is encouraging. Although non-wood fibrous raw material based account for only about 5% of the raw material for pulp and paper manufacture today it is one of the major sources of fibrous raw material for many developing countries (GIERTZ, 1993). Agricultural residues are the most important raw materials of non-wood group that were used in agriculture countries. In developing countries, the small scale mills are more popular than large ones. Small scale mills usually cause high level of environmental pollution because of outdated technologies, poor operational and maintenance practices and others. On the other hand agricultural residues are especially suitable for small scale mills as their raw materials. However, using agricultural residues satisfies in terms of reducing the burden on forest wood, it has its adverse environmental impacts in term of pollutant discharge. Pulp and paper production is an important contributor to the economy of many nations. In Vietnam, the industry accounted for 1.8 per cent of the output value of the manufacturing sectors. Despite its increase in production capacity, it has not met the domestic consumption demand. The utilization of sugar cane bagasse as raw material for the pulp and paper industry needs some attention in sugar cane producing countries such as Vienam. It contributes to reducing deforestation as well as using by-product from the sugar industry. However, small paper mills using sugar cane bagasse as raw material have caused environmental pollution at high levels.

-2-
Therefore, cleaner production study in the small mill using sugar cane bagasse as raw material for pulp and paper production is useful in terms of economy as well as environmental protection aspect.
An essential step in implementing cleaner production is waste audit as it gives a comprehensive look at production process to facilitate the understanding of material flows and to show pollution sources within the process. A waste audit points out the points specific area where pollution reduction may be achieved and helps to implement maximum resource optimization and improved process performance (UNEP/IEO and UNIDO,1991). This study investigated the current environmental status of a pulp and paper mill in small scale in Vietnam and recommended cleaner production practices for the mill. 2. Objectives The objectives of the study are:
1. To identify and evaluate sources and causes of waste generation of the pulping and paper making processes with a view to find out the extent of all environmental pollution problems, major focus on waste stream.
2. To determine the quantity and characteristic of wastewater discharges in pulp and
paper mill which use non-wood material as raw material. 3. To identify possibilities to conserve water and to minimize pollution load. 4. To recommend cleaner production practices to the mill.
3. Scope and Limitation of the Study This study was limited only to a small scale pulp and paper industry using sugar cane bagasse as raw material. Initial investigation of environmental status of the mill included water, air and noise pollution but the major task focused on wastewater. The study on implementing cleaner production was concentrated on process effluent reduction and recovery as well as recycling rather than the process modification.

CHAPTER II
LITERATURE REVIEW
2.1 General Production Process of Pulp and Paper Industry The manufacture of paper can be divided into two phases: the pulping and the paper making. In the pulping phase the cellulose raw material must be processed to free fibers with suitable properties for paper product. The paper making is the continuous process consisting of forming slurried pulp in sheet form then pressing, drying, calendering. The simplified flow diagram of pulp and paper production process is shown in Figure 2.1. 2.1.1 Pulping The pulping process can be divided into three categories: chemical pulping, mechanical pulping, and semi-chemical pulping (combination of two above categories). Mechanical pulping Mechanical pulp is produced by grinding or shredding the wood or non-wood materials to free the fibers. In addition heat and pressure may be applied to assist the process. Mechanical pulping provides low grade pulps with high color and short fibers, but with a high yield converting 95% of the wood into pulp and produces minimal on-site air pollution and relatively water loads (ANONYMOUS 1981). The mechanical pulping process is presented in Figure 2.2. 1) Stone Groundwood Pulping The first grinders were built by Voith in 1852. In this method logs of wood are ground against a stone wheel to produce clumps of fiber. Stone groundwood does have some favourable characteristics : low energy costs and high fines content which is desirable for printing characteristics. 2) Refiner pulping The first attempt to use disc refiners to produce mechanical pulps was made in the 1950's. This demonstrated that it was possible to produce pulp which was stronger than stone groundwood (Mc CUBBIN, 1984). Thermo-mechanical pulping (TMP) process was developed.

-4-
This technique involves presteaming of chips for a short period, typically about three minutes, at a 110-130oC and 150-210kPa and then performing the first stage of refining under pressure (Mc CUBBIN, 1984). 3) Pressurized Groundwood Pressurized Groundwood (PGW) is a relatively new development. It is similar to the stone groundwood process but logs is ground under pressure. Generally speaking, the production of mechanical pulps has been limited to the use of soft woods preferably spruce, balsam and hemlock and , to a lesser extent, jack pine(due to a lower pulp quality). TMP has pulp yield of approximately 94% and the published data on BOD discharge varies from about 15 kg/t to 35 kg/t.(MCCUBBIN, 1984) Mechanical pulping provides a short pulp fiber due to the considerable fiber damage caused by grinding. Chemical pulping Chemical pulping is done by digesting to free fibers from the wood chips, non-wood materials such as bamboo, straw, grass, cotton, in chemical solutions that help to dissolve the lignin binding material. Pulp yield is normally in the range of 35 to 57% and about 95% of the lignin is removed in pulping (MCCUBBIN, 1983). Chemical pulps may be subdivided into Kraft (sulphate), sulphite, semi-chemical and soda. Soda pulping The soda pulping was the first chemical process applied in pulp manufacture. In the process, sodium hydroxide is used as cooking liquor with adding a mixture of soda ash (Na2CO3) and lime Ca(OH)2 to the digester. This process is most suitable for agricultural residues pulping (PALMER et al., 1983). Sulphite Pulping Process The sulphite pulping process is one of the major pulping methods. This process is most suitable for non-resinous softwood. In this method, the fibre-binding lignin is softened and dissolved to a considerable extent in a solution containing dissolved SO2, hydrogen sulphite ions with pH value between 1.5-12. Depending on the cooking degree, the yield varies from 45 to 65%, but normally the yield is about 50% for standard non-bleached pulps. If the pulp is bleached, another 4 to 5% of the original wood weight may be lost in the process. (ANONYMOUS, 1982). An advantage of the kraft pulping process is the possibility of recovering both process chemicals and the heat content of the dissolved lignin. One drawback is that the process results in pulps with a high kappa number which thus require bleaching for many applications. The sulphite pulping process is illustrated in Figure 2.3. 3/ Kraft Pulping Process

-5-
Kraft pulping, first used in 1879, is a modification of the caustic soda process in that sodium sulphite (Na2S) is added to the cooking liquor. The presence of caustic soda in the cooking liquor is suitable for use of practically all wood species. Sodium sulphate is on duty of buffering, that digestion can be implemented at a lower OH- ion concentration. Thus damage to the fibers is reduced and high strength pulps is produced (UNEP, 1977) 4/ Semi-chemical Pulping In this process the pulping of wood raw material pulp is obtained by a series of chemical and mechanical wood treatments. The main semi-chemical pulping process are:
• Neutral sulphite, in which the active chemical is sodium sulphite, sufficient alkali ( usually sodium carbonate or sodium bicarbonate) is used to keep the digestion liquor alkaline.
• Cold soda, in which chips are soaked for several hours in sodium hydroxide at atmospheric pressure without heating.
The simplified flow sheet of semi-chemical pulping process is presented in Figure 2.4. 5/ Other processes According to PALMER (1983) recognizing the difficulties of using established processes on a small scale, a number of alternative processes are being developed which are claimed to be specially suitable for small-scale operation either because they are non-polluting (in at least one case it is claimed that digestion liquor can be used as fertilizer) or because the recovery process is relatively simple. Examples of these processes are:
• Ammonia-based pulping. • Oxygen (air) and alkali processes. • Universal process (acid based).
2.1.2 Paper making In the paper making process pulp is converted into paper. Normally, the process consists of four main steps: stock preparation, sheet preparation, water removal and sheet finishing. Pulp in the stock is heated and mixed. Some different chemicals and fillers like alum, clay, and starch are added to the pulp stock for enhancement of certain paper properties. Next, the pulp is evenly distributed over a travelling belt of fine wire screening, and carried to rolls. A small portion of the water contained in the pulp passes through the screen, while the longer fiber are laid down on the wire , pressed through a series of rolls then air dried in a steam-heated dryer section. After drying, the sheet may be surface treated and then finished. A considerable portion of the fine fibers and some

-6-
fillers also pass through the screen wire with water . Because of its colour, this wastewater is called "white water". The main sources of waste from paper mills are beaters and paper machines. 2.2 Sources of Water Pollution and Its Characteristics The pulp and paper industry is one of the largest water- using industries, not only in terms of the volume specific water use, but also in terms of the volume of output. The sources of the wastewater in the pulp and paper industry come from chipping, pulping, rinsing, chemical recovery, bleaching and paper making process ( STOLL, 1995). NEMEROW (1978) reviewed the major origins and characteristics of wastes from different pulping processes and paper making. Since different types of pulping processes generate somewhat different wastes, each type should be considered separately . Typical analytical results of different types of pulp and paper wastes are presented in Table 2.1
Table 2.1 Typical analytical results for pulp and paper mill waste (NEMEROW, 1978)
Product
BOD, mg/L Suspended solid, mg/L
Pulp Groundwood Soda Sulphate (kraft) Sulphite Miscellaneous paper No bleach With bleach Paperboard Strawboard Deinking used paper
645 110 123 443
19 24 121 965 300
1720
452 156 660 1790
The characteristics of pulp and paper industry effluents causing environmental problem are suspended solid, representing undissolved substances including lignin and hemicellulose, which are not biodegradable (persistent) and high COD in the wastewater.

-7-
Toxicity of pulp and paper mill effluent may be caused by sulphur compounds introduced into the pulping process, dissolved organic compounds of the raw materials, resin and fatty acids and some cases heavy metal ( which are used for wood preservation or raising paper quality). More recent questions have been raised regarding chlorinated dioxins, formed during the bleaching process, that effect water quality for human consumption and other purposes (GELLMAN, 1988). Colour and turbidity of effluents cause aesthetic problems. Colour of the pulp and paper industry's wastewater is caused mainly by lignins of the wood as well as in some cases by dye. 2.3 Environmental Problems from Pulp and Paper Production Preparation of Fibrous Raw Material There are two types of fibrous raw materials: wood and non-wood material. The wood material preparation at mill site include weighing, storage, washing, debarking and chipping. The debarking method and equipment is determined by the type of wood, the pulping process, the pulp quality and the debarking capacity. The major source of water pollution from the wood preparation is debarking, specially when wet debarking is used. The effluent contains large amounts of dissolved as well as suspended pollutants. In general, wood has to be washed before chipping to prevent damaging the knives by sand and other impurities. Therefore, the wastewater from the process contains coarse materials. For the non-wood material (such as bagasse, bamboo, reed, or cereal and rice straw) preparation, the major source of water pollution is crushing and chipping (bamboo), depithing (bagasse), wet cleaning (rice straw). Pulping In this stage, either mechanical or chemical methods are used to produce fibers. In the chemical method , fibrous raw material is treated with chemical cooking liquor which used to dissolve most of lignin and liberate the fibers. The effluent is called black liquor containing lignin and hemicellulose as well as toxic waste material like dimethyl sulphite, methyl mercaptan etc. The wastewater is highly polluted with brown color and high COD. Bottom deposits of lignin cellulosic materials near the discharge point will lead to a DO depletion at the discharge point. Washing and Screening From an environmental point of view the pulp rinsing after the cooking is one of the most important operations in a pulp mill. The rinsing operation aims to separate pulp fiber from spent cooking liquor that contains inorganic cooking chemicals and organic substances dissolved from the fibrous raw materials. A thorough washing, that leaves a low residue of black liquor in the washed pulp is also decisive for the amount of polluting discharges from the following process department, i.e. screening and bleaching.

-8-
The screening operation which remove knots, shives, and other impurities is usually integrated in the washing system. The water used for dilution in the screens is discharged together with fiber losses and dissolved substance(PER ALSEFELT et al., 1991). Bleaching In order to obtain good properties like white and strong paper it must remove remaining lignin and resinous bark as well as knot particles. This process is called bleaching. The effluent of kraft pulp mill affects spinal deformation in fourhorn sculpin. The changes of skeletal composition and strength show a disturbance in the metabolism and onto genetic growth of fish (BENGTSSON, 1988). SODERGREN (1993) indicated that there are two general types of bleaching sequences: C-E-H-D-E-D and oxygen delignification O-D-EPO-D-EP-D (O=oxygen, C=chlorine, D=chlorine dioxide, H=hypochlorite, E=alkaline extraction, P=hydrogen peroxide). The effluent from a bleaching plant contains large amount of lignin-related chlorinated compounds which have a negative impact on environment in receiving area and further more they are "persistent"/ or degrade very slowly. The effluent of bleached pulp affects the diversity, biomass and distribution of fish, invertebrates and plants (SODERGREN et al.1989) BONSOR et al. (1988) reported that kraft mill effluent interacts with a low DO (dissolved oxygen) content and produces synergism effect. 2.4 Raw Material for Pulp Production The fibrous raw materials can be classified as follows: Wood
• Softwood (spruce, pine, fir, hemlock etc.) • Hardwood (birch, eucalyptus, mixed tropical hardwoods etc.)
Non-wood • Agricultural and other residues such as straw from cereals, rice and sorghum
as well as sugar cane bagasse • Naturally grown plants such as bamboo, reeds, papyrus, esparto and other
grasses • Crops primary grown for their fibers content such as juite, hemp, kenaft,
ramie, flax (bast or stem fibers); abaca or Manila hemp, sisal (leaf fibers); cotton (seed hair)
Of these, bagasse, reed, bamboo, cereal (wheat, rye) and rice straw are the most important non-wood fiber raw materials for paper making.

-9-
Non-wood raw materials The chemical composition does not differ much between different types of non-wood fiber and the lignin content is largely the same as that of hardwood. The cellulose content and the fibers length vary relatively little between the wood based and non-wood based raw materials. However, the ash content of agricultural residues is much higher than that of the wood based raw materials. Chemical characteristics and fiber dimension of different raw materials including hardwood (common raw material for large mills) and non-wood (raw material for small mills) are given in Table 2.2 Table 2.2 Chemical Composition and Fiber Dimension of Agricultural Residues and
Wood Based Raw Materials (PANNEERSELVAM, 1988)
Raw Material
Cellulose
(Alpha) (%)
Lignin
(%)
Ash (%)
Fiber Length
(Av. mm)
Fiber Diameter
(Av. µm)
Rice straw Wheat straw Bagasse Reeds Hardwoods Softwoods
28-41 30-40 26-39 33-43 35-49 41-44
10-17 16-20 19-22 18-23 22-32 25-28
14-22 4-11 1-5 3-6
0.5-3 0.4
1.5 1.5 1.6 1.2 1.0 3.5
9 13 20 12
17-32 35-40
Non-wood fibers are easy to be delignified by chemical pulping. It is noted that non-wood fiber are delignified much faster than wood. This can be explained by the reason of the more open structure of the fiber tissue. (UNEP,1986) GIERTZ (1993) reported that the most widely used pulping method for non-wood raw materials are the soda and the sulphate processes. These processes have a relatively short cooking cycle either applied in continuous or in a batch system. This means the digester volume can be rather small. Bagasse fairly resembles hardwood in chemical composition and this is reflected in the yield which is largely the same as that of hardwood but not in cooking time. Generally speaking, further processing in the fiber production line such as screening, bleaching and drying is largely the same for the non-wood fibers as for wood. a) Advantages of non-wood pulp: Non-wood raw materials are cheap.

-10-
Non-wood fibers are delignified much faster than wood. The material is satisfactorily delignified and the pulp obtained is of high quality and can be easily bleached to an acceptable brightness . The cooking time of non-wood raw material is shorter than that of the hardwood. Therefore the bagasse cooking time is very short with low alkali requirements and results in a pulp with low yield. b) Disadvantages of non-wood pulping - Preparation of fibrous raw material The problem lies in the preparation of fibrous raw material including collection, transportation, and storage. These are bulky material. One important thing to note is its seasonal delivery. They might deteriorate during storage. The dust loads in the handling, storage and cleaning of bagasse, bamboo and straw is high. -Washing The design of washing equipment has to be more elaborate than for wood pulps due to a slow drainage property of non-wood pulps. This is illustrated in the Table 2.3
Table 2.4 Wash filter loadings and dewatering properties of various sulphate and soda pulps (UNEP, 1986)
Pulp type
Wash filter loading t 100/m2d
Freeness* o SR
Softwood Hardwood birch eucalyptus globulus Bagasse Bamboo Rice straw Wheat straw
5-7
4-6 6-9
2-4 4
1.5-2 0.5-2
12-13
15-16
20-25 14-16
40 30
o SR is degree Schopper Riegler (unit for pulp freeness which represents drainage of property of fiber) * Assuming chemical pulp yields and no refining

-11-
Chemical recovery In comparison with wood pulping, chemical recovery in non-wood pulping have some drawbacks:
♦ High content of silica which dissolve in the black liquor as silicate that lead to serious scaling during evaporation. The concentrations of silica in different raw materials are reviewed: rice straw (10-13%), bamboo (4-6% ), soft wood (0.8-2%) (UNEP 1981).
♦ High viscosity ♦ Low heat value because of lower lignin content and higher carbohydrates content
2.5 Cleaner Production for Small Non-wood Pulp and Paper Mill 2.5.1 Cleaner Production United Nations Environment Program defines Cleaner Production as following (NATIONAL PRODUCTIVITY COUNCIL NPC, 1996) Cleaner Production is the continuous application of an intergrated preventive environmental strategy to processes and products to reduce risk to humans and the environment. -For production process, Cleaner Production includes conserving raw materials and energy, eliminating toxic raw materials, and reducing the quantity and toxicity of all emissions and wastes before they leave a process. Cleaner Production techniques are shown in Figure 2.5
CLEANER PRODUCTIONTECHNIQUES
RECYCLING PRODUCT MODIFICATION
SOURCE REDUCTION
GOOD HOUSEKEEPING
PROCESS CHANGE
Figure 2.5 Cleaner Production Techniques (NPC, 1995)

-12-
The very essential step in implementing cleaner production is waste audit. This management tool has been developed to respond to the new environmental management philosophy that of waste prevention and reduction. In UNEP(1991) it is reported that a waste audit enable one to take a comprehensive look at a site or process to facilitate one's understanding of material flows and to focus one's attention on areas where waste reduction and therefore cost saving is possible. 2.5.2 Cleaner Production for Small Non-wood Pulp and Paper Mill It is noted that in the case of small pulp mills a chemical recovery system is uneconomical. PANNERSELVAM, (1988) suggested certain simple pollution abatement measures for small mills. Such internal process modifications are less capital intensive and the small mills can more easily afford them, particularly when the associated benefits are considered. Water conservation is performed by using intermittent high pressure, high volume showers or continuous high pressure, low volume showers for felt shower. Felt showers provide water for paper machine at the time paper mat is sent to press rolls. It is necessary to develop appropriate inexpensive fiber recovery systems to promote the fiber recovery among small mill. It is uneconomical for the small mill to run a conventional chemical recovery system. Thus it is essential to develop an alternative simple inexpensive chemical recovery method. In tropical countries with very high solar intensity, the feasibility of separating the black liquor and increasing its solid content in a series of solar evaporation ponds should be considered (PANNERSELVAM, 1988) 2.6 An Overview on the Pulp and Paper Industry in Vietnam and Related
Environmental Issues 2.6.1 Overview on Pulp and Paper Industry The number of pulp and paper mill and designed capacity of existing enterprise establishment in Vietnam are presented in Table 1- and Table -2 Appendix A, respectively. The largest mill is Vinh Phu Paper Union (BAPACO) with a production capacity of 55,000 tons per year (t/y). The two intergrated pulp and paper mills Tan Mai (COGIVINA) and COGIDO with production capacities of 45,000 t/y and 15,000 t/y respectively are ranked after BAFACO. The other mill are small with capacity varying from 300 t/y to 10,000 t/y. At present, there has 9 key-mills which produce 65% of total paper production of the industry. The general information of these mill is shown in Table -3 Appendix A.

-13-
The major pulping process in Vietnam is the soda. The soda pulping process is mainly applied for mills which use non-wood as raw material. This method is applied to produce more than 50% of the pulp production. The pulping methods used in BAPACO, COGIVINA and COGIDO are Kraft, thermo-mechanical and modified soda (cooking liquor is sodium adding 1% of sulphur) respectively. SANH (1996) reported that pulp and paper industry is still in small scale with capacity of 3 kg per capita per year. In 1995, pulp and paper production reached 120,000 tons and 200,000 tons respectively. Paper demand has increased in Vietnam. It is estimated that paper demand will be around 500,000-700,000 tons by the year 2000 (an increasing of 2.5-3 times). 2.6.2 The Related Environmental Issues Most of the pulp and paper mills in Vietnam are in small scale. It is uneconomical if chemical recovery systems are applied in small mill (with capacity less than 50,000 t/y). Therefore, all the pulp and paper mills have no chemical recovery system except for BAPACO. Pollution control facilities for the industry are very poor. There are some environmental researches on pulp and paper industry in Vietnam. TRUNG (1990) studied the reuse of black liquor from pulp production to produce construction material (concrete). This kind of additive makes stress intensity of cement increasing to 1.5-3 times and reduces 5-10% of water consumption in concrete production. KIM OANH (1994) did a wastewater management in BAPACO. The study showed that the effluent of this intergrated kraft pulp and paper mill is mildly acute toxic. A monitoring program for environmental audit of the pulp and paper mill was proposed. DAN (1990) carried out experiments on wastewater treatment of Long Binh pulp and paper mill. Physical treatment method (sedimentation), physico-chemical method (neutralization, coagulation, absorbed filtration) and biological method (water hyacinth pond) were studied. The results showed that 80-90% of can be removed by settling method, color and turbidity can be decreased by coagulation method with alum coagulant (140 mg/L) and 90% of COD and 80% of lignin was removed in water hyacinth pond. 2.7 Bench Marks in Pulp and Paper Industry WHO, (1993) indicated a bench mark in order to assess the waste discharge of pulp, paper and paperboard manufacturing as in Table 2.4
Table 2.4 Bench mark for Pulp and Paper Production (WHO, 1993)
BOD 5 TSS Manufacture Unit (U) Waste Volume
m3/U Kg/U kg/U
Pulp mills Wood Pulp Mechanical
tn of product tn of product tn of product

-14-
Sulfate(Kraft) Sulfite Semi chemical
tn of product tn of product tn of product
61.3 92.4 47
31 130 27
18 26
12.5 Paper mills Newsprint paper Kraft coarse paper Cigarette paper Paperboard/Simple finish Graphic paper
tn of product tn of product tn of product tn of product tn of product
190 125 100 200
7.5 5.5 11.5 15
10.5
2
10.5 37.5 30 6.5
Wastewater pollution load of pulp mill section, paper machine and combined these of agicultural residue-based mill is presented in Table 2.7. The total requirement of raw water is about 200-300 m3.
Table 2.5: Wastewater Pollution Load in agricutural residue-based mill (CHANDAK et al., 1993)
Parameter
Pulp mill section
Paper machine Factory combined
Wastewater flow rate (m3/t) BOD (kg/t) COD (kg/t) TSS (kg/t) TS (kg/t)
110-168 128-210 705-1140 118-262 872-1292
60-80 27-41 80-140 61-109 205-394
162-230 161-245 865-1215 192-362 993-1408

CHAPTER III
BACKGROUND INFORMATION OF THE RESEARCH SITE 3.1 General Information Van Diem Paper Mill is a small paper mill. It was established in 1962 at Phu Minh district Ha Tay province. The mill is bordered by the Red river dike in the East and a Sugar Mill in the South. Figure 3.1 and Figure A-1 in Appendix A shown the location of Van Diem Paper mill. The layout of the mill is shown in Figure 3.2. It shows the location of office, digestor house, depithing house, paper processing, finishing, fiber recovery unit, sedimentation unit for water supply and bagasse storage ground area. Products of the mill are carton board, cover paper and pupil note-book cover. All of them are unbleached products. The designed capacity is 3000 tons product per year. In 1995 the capacity was 2700 tons of paper. The mill uses sugar cane residue bagasse as raw material based for pulp production. Bagasse is bought from neighbour Sugar Mill and transported to bagasse storage ground of the mill through a belt conveyer. The mill has 300 employees. Generally, production activities are carried out in 3 shifts (24 hours per day). During the month of December, the mill is closed for machine maintenance. 3.2 Production Processing Production process of the mill is changed depending on raw material state. The main raw material of the mill is bagasse which is supplied seasonally. During the sugar cane season, bagasse is transported from the sugar cane mill on belt conveyers to material storage site of the pulp mill. It has moisture content of 50%. Bagasse is incubated in ponds to reduce chemical consumed in cooking process. Rest of the bagasse is heap up in trapezium form on the ground when the ponds are full. Therefore, there are two periods of production. From January to May (sugar cane season) the mill uses bagasse which is not incubated. The bagasse is depithed before cooking. In the rest time, the incubated bagasse is used without depithing. Incubated bagasse consumes less caustic soda than unincubated bagasse. In the first period, bagasse is fed into depithing machine where it is cut into small pieces. The piths are carried away by air blower into a pipe going outside. The depithed bagasse is transported to the spherical digestors, where caustic soda solution (white liquor ) with a concentration of 120g/L, water and steam is added. The digestors are turn round with a speed of 2.5 circles per minute. The delignifying is carried out at approximately 110-125oC and at a pressure of 2.5 atm. The cooking is performed by a batch process and the cooking time is 5 hours. Charging and discharging takes

-20-
Rai
lway
Figure 3.1 Location of the Van Diem Paper Mill

Fiber Recovering Unit
BagasseD GroundD
DOffice D Depithing
D HousePM 1 B B D
PM 2 B B B B B3
Store
Toile
t
4 Steam Boiler
Entrance
PM Paper Machine 1 Wastewater Pump StationB Beater 2 Water Supplied Pump StationP Pump 3 Belt Conveyor of BagasseD Digester 4 Water Treatment for Steam BoilerC Cutting 5 Dilution Tank
Figure 3.2 Layout of the Van Diem Paper Mill
Sedi
men
tatio
n U
nit
C
C 5 5
C BBBPM 3 5
Sedimentation12
SUMP
Pum
p st
atio
n
Stor
e
Office
Gar
age
Red
Riv
er
P
P
P
Dyk
e

-22-
1 hour and 0.5 hour, respectively. Spent liquor and pulp are sent to washing bath. In this washing stage ligninand remaining chemicals are removed. The depithed pulp is transported to the storage tank then pumped to a beater. Waste paper and water are added into beater. Here pulp and waste paper is beaten into fine fiber. Then it is transported to a sedimentation tank where sand and other coarse materials are removed owing to slope of the tank bottom. Rosin and aluminum sulfate are added in beating stage and during the production of pupil note-book cover paper dye is also added. After beating, pulp is sent to a tank for dilution to a consistency of 0.3%. and finally fed to three paper machines through a head box. Then pulp is passed through a refiner where sand is removed. Next, pulp is distributed over a traveling belt of fine wire screening where paper mat is created. The paper mat then pass through press rolls and to the vacuum box to remove water and pass drying roll where paper is dried indirectly by steam. Finally paper comes to paper rolls. Paper then is cut and becomes finished products. A simplified diagram of pulp and paper production process, pulp production, paper production of the mill are presented in Figure 3.3, Figure 3.4, Figure 3.5 respectively. 3.3 Existing Water Supply System Raw water used in this mill is taken from Red river. It is pumped from the river into two natural sedimentation tanks then pumped into the mill. There are 3 pumps with capacity of 100m3 per hour. Normally, only one pump is used. This water is used, in all processes, except for the water used in steam boiler and domestic purpose, it is treated with alum and de-hardness is obtained by using chemicals. The treated water is also pump to staff housing for domestic used. Currently, the amount of water consumption in the mills is not monitored. Water supply system is shown in Figure 3.6 3.4 Existing wastewater system Wastewater drainage system of the mill is presented in Figure 3.7. There are two wastewater stream: 1. the storm water and domestic wastewater run around the mill wall then come to channel outside the mill; 2. the wastewater from the process is collected into a sump from which wastewater is pump to Red river. A part of wastewater flows through a fiber recovery unit before going to the sump. In many parts drain is underground. The wastewater from staff housing is discharged directly to the cannal located outside the mill. Currently, the wastewater characteristic in the mill is not monitored

23
RAW MATERIALPREPARATION Depithing Solid Waste
PULP MAKING Gas emissionDigestion Black Liquor
Washing Wastewater
PAPER MAKING Beating Wastewater
Dilution
Paper Machine Wastewater
Finishing Waste Paper
PAPER
H2O, Steam, Electricity Boiler Flue GasUtilities Boiler Ash (Coal Dust)
Figure 3.3 Simplified Diagram of Pulp and Paper Process in Van Diem Paper Mill

24
Bagasse
Air Dust (Sugar cane pith)Electricity Depithing Spillage of bagasse in conveying
Caustic soda Wastewater (black liquor)NaOH 12% Spherical
Water Digester Flue gas from digesterSteam (NaOH steam, H2S, CH3SH)
WastewaterWater Washing
Spillage
To Paper Plant
WASTE STREAMINPUT PROCESS STEP
Figure 3.4 Pulp Production Diagram of the Van Diem Mill

Fiber Recovering Unit
BagasseD GroundD
DOffice D Depithing
D HousePM 1 B B D
PM 2 B B B B B3
Store
Toile
t
S 4 Steam Boiler
Entrance
PM Paper Machine 1 Wastewater Pump Station S Sedimentation UnitB Beater 2 Water Supply Pump Station Domestic Water Pipeline SystemP Pump 3 Belt Conveyor of BagasseD Digester 4 Water Treatment for Steam BoilerC Cutting 5 Dilution Tank
Sedi
men
tatio
n U
nit
C
C 5 5
C BBBPM 3 5
Sedimentation12
SUMP
Pum
p st
atio
n
Stor
e
Office
Gar
age
Red
Riv
er
P
P
P
Dyk
e
Toile
t
Staff Housing

-26-
3.5 Existing Fiber Recovery Unit Fiber recovery unit is a simple sedimentation unit. Its dimension is shown in Figure B-1 AppendixB. Wastewater flows naturally through the unit before come to collection well. The fiber is settled then recovered fiber is used for cover paper production. 3.6 Working Environment and Environmental Issues of the Mill In general, the working environment of the mill is not clean. Sugar cane pith dust from depithing unit, fly ash and coal dust surrounding steam boiler, especially black liquor and caustic soda steam from cooking unit are the major environmental problems . Based on production process data, the significant environmental pollutants in the mill can be classified as follows: - Wastewater - Solid waste - Noise - Dust 3.7 Energy Consumption The two major energy forms consumed in the mill are steam and electricity. There are two boilers for producing steam with a capacity of 4 tons of steam per hour. The steam distribution system is shown in Figure 3.8. These boilers use coal as fuel for steam production. Steam is supplied to cooking units and paper machines. Only one boiler is operated during the other break down. Electricity is supplied to unit operations of production process, utilities, and domestic using. - Production process (raw material preparation, pulp mill, paper mill) - Utilities (steam boiler room, electro-mechanical workshop, wood workshop, lighting) - Domestic using (using in office and worker living quater). The average electricity demand of the factory is 200,000-250,000 kW per month. Electricity loading for the mill is shown in Table 1- Appendix B

Fiber Recovering Unit
BagasseD GroundD
DOffice D Depithing
D HousePM 1 D
B B B B B3
Store
Toile
t
4 Steam Boiler
Entrance
Note
PM Paper Machine 1 Wastewater Pump StationB Beater 2 Water Supplied Pump StationP Pump 3 Belt Conveyor of BagasseD Digester 4 Water Treatment for Steam BoilerC Cutting 5 Dilution Tank
LegendStorm WaterProcess Wastewater
Figure 3.7 Wastewater Drainage System
Sedi
men
tatio
n U
nit
C
C 5 5
C BBBPM 3 5
Sedimentation12
SUMP
Pum
p st
atio
n
Stor
e
Office
Gar
age
Red
Riv
er
P
PP
Dyk
e
PM 2
B B
Toile

1C PM 3 D B BBS
D
D
D
D
D
D
WB B B B B
B B
P D
S
P
D
PD
PM 2
PM 1C
C
Depithing House
Steam BoilerS : Sampling Point
P D
S
5
Figure 3.8 Air Sampling Point in the Mill
1
2
3
4D
D
D
B B
P D
S
P
PD
PM 2
PM 1C
C
House

-29-
C PM 3 D B BBS
D
D
D
D
D
D
WB B B B B
B B
P D
S
P
D
PD
PM 2
PM 1C
C
Depithing House
Steam BoilerS
Figure 3.8 Steam Distribution System of the Van Diem Paper Mill
P D
S
1

CHAPTER IV
METHODOLOGY
4.1 Study Program The general research methodology is outlined in Figure 4.1 4.2 Data collection Documents and information are necessary to implement an audit. Available information of the mill was tried to collect as much as possible. However, in this small mill only few records are available. 4.3. Inplant monitoring The initial mill survey needed observation entire the mill to understand the processing operations, utility sections, type of raw material used. Then description the existing production process flow diagrams, water supply and wastewater systems was implemented. Inputs and outputs of each production process was identified. 4.4 Material and Energy Balance Material balance was carried out for each unit process. Since measurement the input raw material quantity was impossible, it was obtained basing on product after each unit operation. Energy balance only was carried out for steam component. Measurement of steam amount was also not possible. It was calculated from material operation balance. 4.5 Water Balance There is no available record of the water supply as well as wastewater discharge volume of the mill. Therefore water balance was carried out in detail. It was assumed that water used for office, floor cleaning, hand washing is equal to wastewater generation from those. The total water consumption and wastewater generation were compared with the bench mark available in the literature. 4.5.1 Water Supplied Measurement The mill has not measured the total amount of water used. The total water supplied volume only estimated through pump capacity is not accurate because the pump capacity

-31-
through pump capacity is not accurate because the pump capacity is not a constant. It was decided that the water supplied amount be determined by total water used at all unit operations and domestic used. The first step was understanding the water supplied system of the whole mill to find out appropriate water supplied volume measurement points and raw water sampling points. Water supplied to each unit of the pulping process was measured in each batch because the process is batch process. Water used at each unit operation was measured by bucket and stop watch using container method (a known volume container to receive the water input during time measurement). 4.5.2 Wastewater Measurement There are two drain lines leading to collection well (sump). One is open drain line with rectangular shape. Another is underground drain line with round shape but its end can be seen at the sump. It was very difficult to measure wastewater flow rate in the mill because of the poor drainage system. Using weir to measure wastewater flow rate was impossible. The following methods were applied to determine wastewater flowrate -Using flow meter to measure in short drainage parts with constant cross section. -Using bucket and stopwatch system. The wastewater volume was measured for each batch operation. The total wastewater flow of the mill was total of two branch flows. The flowrate of each branch was measured by container method. A flow meter UKING ”OTT” MOLEN 10615 (Figure. 4.2) with calibration curves was used to measure flow rate of the wastewater generated from paper machines. Wastewater generation from other units were measured by using bucket and stop watch. Wastewater flow measurement locations are illustrated in Figure 4.3.
Figure 4.2 Flow Rate Measurement Equipment 4.5.3 Sampling

-32-
Raw water sampling was done at before sedimentation unit (Red river water), after sedimentation unit, and after treatment tank for boiler domestic used to obtain water supplied quality. Raw water sampling points is presented in Figure 4.4. Wastewater samples were taken at each unit operations. Figure 4.3 show sampling location.
PM 2
PM 1B
B
B
B
B
B
B
D
S
B
BB
PM 3
R
LEGEND:B: Beater PM: Paper machineD: Digestor S : Sump R: Fiber Recovery Unit
: Wastewater Sampling Points
Figure 4.3: Wastewater Sampling Points
1
2
34
5
6
7
6 8
D D
D D D

-33-
Grab sampling was obtained at cooking unit, paper machines. Composite samples were taken at washing, beating unit, and point before the sump. Water samples were collected in sampling bottles, put in ice boxes and transported to the laboratory at Hanoi University of Technology for analysis. All the appropriate techniques to preserve the samples were implemented such as refrigeration without freezing and others. 4.5.4 Water and Wastewater Characterization The water samples taken from each unit as mentioned in 4.5.3 were analyzed on site for pH, temperature and conductivity parameters. The other parameters : turbidity, SS, TS, SS70, BOD, COD, Total N , total P were analyzed in the laboratory. All the analysis was conducted according to the techniques provided in the “Standard methods” of examination for the water and wastewater (APHA, AWWA, WPCF, 1985). Method determined suspended solid by using filter wire of 70 µm pore size (SS70) was applied to characterize a large size part of solids consisting of long fiber in the effluent (Bildberg, G. and Rao, 1991). The parameters analyzed and the corresponding methods used for determination of water characteristics were shown in Table 4.1 . 4.6 Fiber Recovery Unit Study Observation and analysis were done on fiber recovery unit. Samples at before and after fiber recovery unit were taken to understand its current problems and the system efficiency. In addition to that the settleable solids were determined using Imhoff cone (Figure4.5). Alum was selected as the coagulant for the settleability study. The Jar test was used experimentally to determined the optimum pH and dosage of Alum. The wastewater before adding coagulant and the supernatant obtained after experiment from both Imhoff cone test and Jar test were analyzed for COD and SS. 4.7 Physical Agents in Working Environment 4.7.1 Noise Measurement Digital sound level meter FRAGILE-UK D1422C (Figure 4.6) was used to determine sound pressure level. Sampling points for noise measurement are shown in Figure 4.7. Measurement was carried out at points caused noise such as depithing machine, beating unit, paper machines, cutting, steam boiler. Table 4.1 Analytical Parameters, Locations and Methods Used during the Study

-34-
Parameters
Method
Equipment and Analytical Location
COD Dichromate open reflux
Reflux apparatus at Lab.
BOD5 Azid Modification Incubation chamber 20oC at Lab.
SS Filtration and gravimetry Filtration paper, oven at Lab.
TS Dried at 103oC Oven, dried at 103oC at Lab.
SS70 Filtration and gravimetry Filter wire 70µm pore (at Lab.)
pH pH meter TOA Water quality checker WQC-20A. ( at Lab)
Temperature. Thermometry TOA Water quality checker WQC-20A (at site).
Turbidity TOA Water quality checker at site (at site).
Total Hardness
Titration at Lab
Fe2+ Spectrophotometry
Spectrophoptometer (at Lab)
Mn2+ Spectrophotometry
Spectrophotometer (at Lab)
Settleable Solid
Volumetric test Imhoff cone (at Lab)
Optimum pH and Alum dosage for Coagulation
Jar test Imhoff cone (at Lab)

-35-
Figure 4.5 Settleable Solids Measurement Using Imhoff Cone
Figure 4.6 Sound Level Meter Used for Noise Measurement

-36-
4.7.2 Particulate Matter Particulate matter measurement was performed for cooking , cutting and depithing unit, steam boiler. Total dust concentration (mg/m3) in the air of particles with size under 75µm was determined by using dust sampling equipment SKAN-Swiss and dust sampling filter GF/A-USA filter. Sampling flow was 18L/minute. Polluted dust index (particle/minute) was determined by measuring and counting number of particle with size under 10µm. Digital Dust Indicator Model P5-H-Japan was used. Sampling points are presented in Figure 4.7

CHAPTER V
RESULTS AND DISCUSSION
5.1 Bench Marks for Pulp and Paper Mill Bench marks used in this case mainly refer those of the small Indian paper mills which use agricultural residues as raw material. 5.1.1 Raw Water Used in the Paper Mill There are following types of raw water used in the mill: • River water • Reused water River water after being settled is used as raw water in the mill. This water is used in pulp production and paper machines as water process and water feed to the treatment tank for steam boiler water. Reused water coming from paper the machine is used for pulp diluting . Characteristics of raw water of the mill are presented in table 5.1 Table 5.1 Physical and Chemical Characteristics of Raw Water in Van Diem and
Standard Values
Type
pH TS (mg/L)
Turbidity (mg/L)
Mn2+ Fe2+ Hardness (mg/L)
VD S VD S VD S VD S VD S VD S Red River Water
7.97
-
520.
1
-
121.
5
-
0.29
-
0.05
-
193.1
-
Red River Water after Sedimentation Unit
7.9
-
11.2
-
75.9
-
0.15
-
0.04
-
183.9
-
Water for Domestic
Use
7.3
6.5-8.5
4.5
5.0
4.1
-
0.09
0.1
0.03
0.3
172.2
500
Boiler Feed Water 7.36
8.00 3.5 - 3.9 - 0 - 0.03 - 155.6 80
Legend: VD- The Van Diem Mill S: The Standard Boiler Feed Water standard (American Water Works, Water Quality and Treatment, New York, 1950, Water Quality Control California State of Water Quality Control Board, Second Edition, 1963.

-39-
Table C-1 in Appendix C shows the drinking and domestic used water quality standard in physical and chemical aspects issued by Ministry of Health. It has been found that total hardness of boiler feed water nearly 2 times higher than standard. The high hardness boiler of feed water may increase scaling of boiler tubes that make boiler efficiency low. In terms of chemical and physical characteristics the water for domestic use in the mill meet the require standard. According to CHANDAK et al. (1995) the requirement of raw water is about 200-300 m3 per ton of paper. From the results it seems that the water consumption of the mill is higher than that of the Indian mills. The reason might be caused by the fact that the technology is obsolete and the bad house keeping status is very poor. 5.1.2 Wastewater from Production Process WHO (1993) defined the bench mark in the manufacture of pulp and paper as presented in Table 2.4. It shows that the volume of wastewater generated and resulting wastewater BOD, total suspended solid in pulp mill and paper mill which used wood as raw material are small. The comparison of waste volume and waste load of Van Diem with Indian mills standards are shown in Table 5.2. The wastewater from each unit operation was measured qualitatively as well as quantitatively.
Table 5.2 Comparison of Wastewater Discharge and Waste Load with Standard
Van Diem Mill CHANDAK et al (1995)
Location Wastewater
Volume (m3/ton of product)
COD (kg/ton of product)
SS (kg/ton of product)
Wastewater Volume
(m3/ton of product)
COD (kg/ton of product)
SS (kg/ton of
product)
Pulp mill section
Paper mill
section
Factory Combine
68.9 109.6 205.6
806.5 228.6 995.2
251.4 184.4 431.8
110-168 60-80 162-230
705-1140 80-140 865-1215
118-262 61-109 192-362
5.1.3 Energy Consumption of the Mill

-40-
The two main energy types consumed in the mill are electricity and steam. Coal is used to produce steam in the boiler. The energy consumption data of the mill was obtained by using available data in the mill. The comparison of energy consumption of the mill with standards are presented in table 5.3. The results indicated that the energy consumption for production is higher than the standard. Electricity consumption is little higher than that of the general performance consumption range while steam consumption is much higher than general standards. The major reason is that all of the equipment are old and outdated.
Table 5.3 Comparison of Energy Consumption with Standards Item
Van Diem Mill General Performance Consumption Range
(CHANDAK et al, 1995) Electricity Energy (kW/ton of product)
994
850-980
Steam (ton/ton of product)
8.9
4.5-6.5
5.2 Waste Auditing of the Mill The study mill is a small mill therefore upsets are common such as break-down of equipment, stop working to repair equipment leading production conditions are not stable. It was decided that audit was conducted in days the mill is running normally manufacturing 9 tons of product per day. 5.2.1 Unit Operation of the Mill Figure 5.1 illustrated the schematic manufacturing process flow diagram of the pulp and paper production. The main processing sections consuming water are washing, diluting pulp before pumped to beaters, beating and paper making. Actually, in this mill beating unit operation is the process combining beating and washing. It was found out that the wastewater from office section discharged to storm drainage system surrounding the mill which connected to the canal outside the factory.

-41-
Input Process Step Waste Generating Process Waste
Raw Material Preparation
Pulping
Finishing
Paper Machine
Bagasse Depithing
Water
Caustic Soda
Steam
Alum
Dyes
Rosin
Pulp WashingBeatingFloor CleaningBeater WashingImpurities RemoveSpillageOverflow
Piths, Dust
Wire Pit Excess WaterWire WashingBlanket WashingFloor CleaningSpillageOverflow
Water
Steam
RollingCutting
Wastewater
Wastewater
Impurities, Coarse Material
Waste Paper
Paper ProductLEGEND: Recycle
Figure 5.1 Schematic Diagram of Pulp and Paper Processing Indicating Raw Material Input and Waster OutputR M i l I d W O
There are following main source of solid waste generation from production process : • Piths generated from depithing unit operation. The amount of pith separated is accounted for 20% of the bagasse amount. Since depithing machine is only operated in the sugar cane season ( four months) then the mill consumes 8,300 tons of sugar cane bagasse per year results in generating 553 tons of piths.

-42-
• Cinder generated from coal burning from the steam boiler. It is estimated that the cinder amount is accounted for 30% of the amount of coal consumed. About 4400 tons of coal is used per year leading to discharging 1320 tons of cinder. • Waste paper (low quality product) come from finishing and cutting. At present, this waste paper amount is about 15% of total paper amount from paper machine. The amount of waste paper here seems to be high. The reason leading this might be that the rolls in the paper machines were not clean resulting in paper is broken. Another reason might be the edge for cutting too large. The raw materials consumption and their cost are presented in Table B2- Appendix B. In order to know the production status, production output of different type of product in a month was recorded and presented in table B1- Appendix B. For the year 1995 the capacity of the mill was 2700 tons of production with average production was 7.29 tons/day of carton and 1.71 tons/day of note-book cover paper. The grammage of production varied depending on the market requirements. The average grammage of carton and note-book cover is 250g/m2 and 100g/m2 respectively. Paper machine 1 (PM 1) and paper machine 2 (PM 2) manufacture carton product while paper machine 3 (PM3) produces note-book cover. Figure 5.2 illustrates the simplified process flow diagram indicating allocation of water for one use to another and wastewater discharged in this mill. According to theory of production process bagasse pulp and waste paper amount in paper production is accounted for 70% and 30% respectively. Actually it is 55% and 45%. 5.2.2 Water Consumption River water from sedimentation unit is pumped to the production area of the mill. A part of the raw water is pumped to a tank where alum is added. This water is used for two purposes: - Domestic use including staff housing and office consuming. - Steam boiler use after adding chemical to soften the water. The amount of water consumption per day primarily estimated from pump capacity was 3000m3 . Table B3 - Appendix B presented the pump operated duration. This figure is not so accurate because pump operated in unstable condition. It was necessary to measure the water amount in detail. White water from the paper machines is recycled for diluting pulp. This water flows itself through a pipe system to dilution tanks. It was difficult to measure this amount of water. It was found out that this amount of water used to dilute pulp from consistency of 2% to 0.5% before coming into paper machine. Therefore it was calculated and found to be 1350 m3/day in case of 9 tons of paper production per day. The average daily river water was found to be 2036 m3/day. Therefore, the total water usage of the mill is 3386 m3/day resulting in water

-43-
consumption per ton of product is 376m3. This amount of water consumption is higher in comparison to the Indian mills.
Sedimentation Unit
Alum Adding
Staff Housing
Office Use
Chemicals adding
Steam Boiler
D D DD D D
B
B
B
B
B
B
B
B
B
B
PM 3PM 1
PM 2Public Canal
Fiber Recovery Sump Pump Station
Red River
Dilution Tank
Dilution Tank
Dilution Tank
LEGEND: Raw Water Wastewater
Steam Recycle Water
Figure 5.2 Flow Diagram for Water Usage and Wastewater Discharge in the Mill
In this study the water consumption for each unit operation such as cooking, washing, diluting, beating and paper machine were measured separately. Cooking, washing and beating are batch processes. Therefore it was decided that the water consumption amount was measured for each batch operation. The amount of water consumption per day was that of each batch multiplied by the number of batch. From the results it can be seen that beating operation consumes 500.5 m3/day a large volume of water. The reason might be that the beating operation here is not only pulp beating but also hydra-pulping, washing and diluting pulp at the same time.

-44-
Cooking, washing and beating are batch processes except for the paper machine production process is continuous. Water supply for the paper machines including washing wire and washing blanket was measured. Then the water consumption for paper machine was calculated from flow rate, paper machine velocity and product amount. From the surveying, it was found that the water consumption per ton of production of PM1 was higher than that of PM 3. This might be explained by the fact that these paper machines produce different products. Therefore manufacturing carton product should consume more water than note-book cover paper. Since PM1 and PM2 both produce carton product, water consumption per ton of product of PM2 was estimated equal to PM1. The measurements of raw water consumption for different unit operations of the mill were presented in Table B-4 to B-14 in Appendix B. It was assumed that each person consumes 50L/d of water to estimate hand washing water usage. The steam boiler consumes 100 m3/d. The amount of water supply to staff housing is 100 m3/day. Toilets in the mill are open ditch toilet which do not consume water. Table 5.4 lists in detail water consumption per unit operation of the mill. From surveying the mill, it was noted that there is a tap which cannot be closed. Therefore water flows days and nights. It is located at digesting house.
Table 5.4 Water Consumption of the Mill
Activity Quantity (m3/day) - Cooking - Washing - Dilution to consistency of 2% - Beating - Paper Machine 1, 2 - Paper Machine 3 -Steam boiler - Staff Housing - Floor Cleaning - Hand Washing - Leaking Water
40.8 194.9 302.4 500.5 524 57 100 100 3.1 15
195.7 Total 2036
From the results it can be seen that the water losses, leaking and over flow in the mill is very high (9%) of total water input. 5.2.3 Accounting for Total Wastewater The major process output of concern was liquid waste from cooking, washing, beating and paper machine. Here the amount of wastewater from each unit operation was obtained by measuring wastewater from each batch operation. The measurement of

-45-
wastewater discharged from the process is presented in Appendix B table B-15 to table B-20. The discharges from paper machine was obtained by measuring flow rate of the effluent. The flowrate was calculated from the cross section of the flow and the velocity of flow as measured with a velocity indicating instrument (propeller) and refer calibration curve. The calibration curve using determining velocity of the effluent is presented in figure B-2 Appendix B. Paper machine 2 manufactures the same type of product as paper machine 1. Therefore it was considered that the amount of wastewater per ton of product of paper machine 2 equal to paper machine 1.
The wastewater flowrate from beater cleaning and floor cleaning was not possible to measure. In this case wastewater flowrate was assumed equal to water usage in each unit operation. The wastewater from staff housing was not accounted for because it discharges to a public canal outside the mill. For the wastewater from office section, it discharges to storm drainage system surrounding the mill then pouring to public canal outside. Hence, it also was not accounted. Estimation of hand washing wastewater in the mill is based on the assumption that each person uses 50L/d of water. The effluent wastewater from the different unit operations flows follow the two drain lines (red and green lines) then combined in collection sump (Figure 5.2). Total wastewater flow of the mill was total of branch flows. Figure 5.3 presented the effluent drainage system of the mill. Figure 5.4 (Table B-21 to B-23 in Appendix B) shows flowrate of the effluent at collection sump. Table 5.5 gives the summary of the wastewater balance. It was decided that the amount of recycle water was not taken into account of total water balance because the water input equal to the water output. Table 5.6 presents the total water balance.
Table 5.5 Wastewater Output
Activity Quantity (m3/day) - Cooking - Washing - Beating - Paper Machine 1, 2 - Paper Machine 3 - Steam Boiler (estimated) - Floor Cleaning - Beater Cleaning - Hand Washing - Leaking Water
22.1 214.4 383.3 912.9 73.3 20 3.1 2.6 15
195.7 Total 1842.1 The average amount of wastewater measured at sump was 1850.6m3/day as presented in Appendix B table B-21 to B-23 while the obtained results sum from all

-46-
sources was 1842m3/day when measuring the wastewater from each unit operation. The difference of 8 m3/day may be due to the unccountable losses, overflow and leaking water as results of poor housekeeping.
Table 5.6 Total Water Balance
Operation Water Use (m3/day) Wastewater (m3/day) Digestor Washing Pulp diluting to consistency of 2% Beating Paper Machine 1,2 Paper Machine 3
40.8 206.4 302.4 500.5 524.0 57.0
22.1 214.4
- 383.0 912.9 73.3
TOTAL 1633.1 1605.7
Drain from 3 digestors
Drain from 3 beaters
Drain fromPM 3
Drain from 3 digestors
Drain from 7 beaters
Drain from PM 1
Drain from PM 2
Sump
Fiber Recovery
Red River
Figure 5.3 Effluent Drainage System of the Paper Mill

-47-
Figure 5.4 Flowrate of Wastewater Discharging at Sump
0
5
10
15
20
25
30
35
40
8:00 10:00 12:00 14:00 16:00 18:00 20:00 22:00 24:00:00 2:00 4:00 6:00
Hours
L/sec
April 2, '96April 7, '96April 12, '96
Table 5.7 Total Water Balance
Operation Water Use (m3/day) Wastewater (m3/day) Digestor Washing Pulp diluting to consistency of 2% Beating Paper Machine 1,2 Paper Machine 3
40.8 206.4 302.4 500.5 524.0 57.0
22.1 214.4
- 383.0 912.9 73.3
TOTAL 1633.1 1605.7 The difference in water use and wastewater generated was due to - Steam vent from digestors

-48-
- Steam vapours formed during paper drying - Moisture in finished paper (moisture content of product is 13 %) - Unaccountable losses such as evaporation , accidental losses. The quality of wastewater measured at different points of process are given in appendix B Table B-24 to B-31 . The waste stream analysis is summary in table 5.8. From the results, it was seen that the effluent quality has not met the requirements of the Vietnamese standard.(Table C-5 in appendix C presents the maximum limit of wastewater’s constituent discharging into water sources).
Table 5.8 Waste Stream Analysis Section Flow
(m3/day) Temp (oC)
pH SS (g/L)
TS (g/L)
SS70 (g/L)
COD (g/L)
Cooking Washing Beating PM 1 PM3 Sump
22.1
214.4
383.3
912.9
73.3
1850.6
64.9
26.7
22.8
22.2
22.3
23.3
12.17
10.18
8.22
7.33
7.31
7.41
2.08
3.08
4.06
1.68
1.72
2.20
10.59
6.73
7.09
2.49
3.61
4.84
-
2.58
2.47
1.54
1.26
1.49
24.35
10.91
11.43
1.88
1.90
3.92
5.2.4 Evaluating Material Balance A material balance of the input and output across the two sections of the paper production was made and shown in table 5.9. It was noted from the flow measurements in Appendix B that the wastewater generated from washing operation was higher than raw water input. This difference was due to beside the washing wastewater there was the black liquor remain from cooking discharging. In pulp and paper industry the useful component balances are : water balance, solid balance and COD balance. These balances give a direct indication of the efficiency of utilization of fibrous raw material, chemical and water. It gives the relative importance of different waste streams in term of quantity of loss (NPC, 1996) COD Balance

-49-
A diagram showing the sources and the corresponding flows and COD loads in the mill is presented in figure 5.5. The COD balance was set up for average loads (9 tons of product per day).
Cooking Washing Beating PM1,2
Fiber Recovery Sump
Wastewater flow
1.2m3
29.2kg
11.9m3
129.8 kg
1.2m3
29.2kg11.9m3
129.8kg42.6m3
486.9 kg
PM3
101.4m3
136.9 kg8.1m3
10.1kg
1
2 3 4
7194.4 m3
629.9kg
5
195.9m3
842.4kg
6 14.5m3
164.9 kg
Sampling point
Figure 5.5 Flow and COD Balance (per ton of product)
(Average for 9 ton of product per day)
These values were calculated from values of 9 tons of production day (refer table 5.7 and table B-24 to B-31 in Appendix B) and convert to the values per ton of product. There are two drain lines (red and green) running to the sump. COD balance was calculated for each drain. At the red drain line, it was found out that the sum of COD loads at sources was 729.9 kg/ton of product while the COD load at point before fiber recovery unit (point 5) was 842.4 kg/t. Hence there was a deviation of 5.9%. This deviation might be due to uncountable spills. The accidental spills occur usually in the small mills with unstable operation conditions. From the surveying the mill it was found that the spills and over flows in pulp washing unit operation is a type of a accidental spill in the mill. In addition the flow at point before fiber recovery unit (point 5) was 195.9 m3/ton of production while the flow at point before pouring into sump (point 6) only was 194.4 m3/t. This unaccountable amount might be caused by the fact that wastewater passes through a part of drain line from fiber recovery unit to the sump which is a soil drain. This resulting in amount of wastewater is absorbed into soil. At the green drain line, it was noted that the sum of COD loads at sources was 159 kg/t while at point before the sump (point 7) the COD load was 164.9 kg/t leading to

-50-
a deviation of 3.6%. The reason might be uncountable spill and over flow at unit operations. In terms of the COD load contribution it could be seen that the most important COD source was beating unit operation which contributed 486.9 kg/ton (corresponding to 58% in case no fiber recovery. This operation generated high COD load might be that it is operated for the aims of pulp beating and also pulp washing and hydra-pulping of waste paper as well. Then washing and paper machines contribute more than 30% to the total load (in case there is no fiber recovery). It can be seen that the COD load from green line accounted for 28.6% of the total COD load (in case fiber recovery operated). Suspended solid balance The suspended solid balance was conducted basing on two types of parameter (SS and SS70). In pulp and paper industry the SS70 balance is more important due to SS70 representing the discharge of long fibrous materials from pulp and paper production. The SS and SS70 balance was conducted similarly to the COD balance. Figure 5.6 illustrates the diagram of the sources and suspended solid (SS and SS70) loads.

-51-
Cooking Washing Beating PM1,2
Fiber Recovery Sump
Wastewater flow
SS2.5kg
SS36.7kg
SS2.5kg
SS36.7kg SS
172.9kg
PM3
SS170.4
kg
SS14 kg
1
2 3 4
7SS 338.2 kg
5
SS528.9kg
6 SS31.5 kg
Sampling point
SS7030.7kg
SS7030.7kg
SS70105.2kg
SS70156.2kg
SS7010.3kg
Red River
SS70325 kg
SS70 188.6 kg
SS70 23.1 kg
Figure 5.6 Balance of SS and SS70 of the Mill Similar to the case of COD, balance of SS and SS70 was conducted in each drain line. At the red drain line, it was found out that the sum of SS and SS70 loads at all the sources was 396.5 kg/ton of product and 302.4 kg/t while the SS and SS70 loads at point before fiber recovery unit (point 5) was 458.4 kg/t and 274.2 kg/t respectively. Hence there was a deviation of 13.5% and 9.3% for SS and SS70 values respectively. These deviations seem to be high that might be due to accidental unccountable spills. At the green line, it was noted that the sum of SS and SS70 loads at sources was 39.2 kg/t and 30.7 kg/t respectively while at point before the sump (point 8) the SS and SS70 load was 31.5 kg/t and 24.5 kg/t. This leads to a deviation of - 19.6 % and - 20.1% for SS and SS70 values respectively . The reason might be SS components are settled in the drain. The ratio between the amount of fiber discharged and the total paper production in percentage is used to present the fiber loss of the mill. In the Van Diem mill, this value was estimated basing on the discharge at the sump. The total SS and SS70 discharge into the sump then to Red river was 369.7 kg/t and 211.7 kg/t (22.17% fiber loss) respectively. From the results it can be seen that the fiber loss in paper machine was considerable. The total fiber loss of the three machines was found to be 16.5%.

-52-
Table 5.8 Overall Material Balance
Input Material Output Material Waste Stream Unit
Operation Name Quantity
in TPD Name Quantity
in TPD Liquid in TPD
Solid/Gas in TPD
Pulp Mill Digestor
Bagasse Caustic Soda Water Steam
22.4 1.28 40.8
5
Cooked pulp
5.84
Black liquor
22.1
Vent vapour
Washer Cooked pulp Water
5.84 206.4
Washed pulp 5.55 Wastewater 214.4
Dilution Washed pulp Water
5.55 302.4
Washed pulp 307.95
Beater Washed pulp Water Waste paper Additives
307.95 500.5 4.5 0.207
Mixed pulp 430.15 Wastewater 383
Dilution Mixed pulp Back water
430.15 1350
Mixed pulp 1780.15
Screening Mixed pulp 1780.15 Screened pulp
1780.1 Reject 0.05
Paper machine
Screened pulp Water
1780.1 581
Dewater pulp 30 White water*
2331
Dewater pulp Steam
30 2.5
Paper 9.0 Condensate 10.6
Vapour
Note: * partial recycle 5.2.5 Summary The water consumption on an overall basis was found to be 376 m3 per ton of product. In comparision with normal operations, this figure is about 1.25 times higher than the standard. Hwoever, water consumption per ton of production of the mill would be much more higher than that of the standard. This is explained by the fact that the figure given in standard refer to bleached pulp and paper production while the study mill is unbleached paper production. According to the information obtained from the mill, the percentage of bagasse and waste paper in input materials was 70% and 30% respectively. Actually these figures

-53-
was found to be 55% and 45%. The amount of bagasse consume per batch was around 1400 kg and the average cooked pulp produced was 365 kg per batch operation. The bagasse and waste paper amount used was 2.48 tons and 0.5 ton respectively per ton of product. The SS component in the wastewater was found to be higher than the bench mark. The SS load was 431.8 kg/ton of product. The range of this parameter for the Indian mills is 192-362 kg/t. As dicussions above, the pollution loads of the Van Diem would be much more than standard if it produces bleached pulp. The fiber loss from the there paper machine was considerable. It was found to be 20.8%. The total of SS and SS70 discharge to the Red river was 369.7 kg/ton and 211.7 kg/ton respectively. This means the fiber loss of the mill was 21.17% though a part of fiber was recovered by fiber recovery unit. The solid waste generated includes piths from the the depither, cinder from the steam boiler and waste paper from the finishing unit. It was accounted for 553 tons of piths, 1320 tons of cinder and per year. This amount is recycled for pulp production. 5.3 Energy Audit of the Mill 5.3.1 Energy Consumption of the Mill The data for the energy audit of the mill was obtained as much as possible from the available data in the mill. The two major energy forms consuming in the mill are steam and electricity. Coal is used to produce steam. The total cost of electricity and coal was found to be 551,180 Dong/ton of product and 459,000 Dong/ton of product respectively. Electricity energy consumption monthly of the mill is given in Table B-33 Appendix B. The figures shown an average monthly consumption is 215.06 MWh. The electricity load at different sections of the mill was presented in table 5.9. At present, the mill uses 250000 kWh monthly giving the electricity consumption per ton of paper is 994kWh/ton of product. This value was found to be higher than that of the Indian mills. The reason may be that the equipments are old and malfunction resulting in low efficiency and consuming more electricity. The monthly average load factor for the mill is 70%. It was noted that the duration of beating was long, over 2 hours, leading to consuming a large amount of electricity. Steam supply to the cooking and drying process is produced by a steam boiler. The steam boiler capacity is 4 tons/hour. Coal is used as fuel of the steam boiler. It was operated in 3 shifts (24 hrs) per day. At present, the boiler efficiency is 70%. The average steam production was found to be 2.8 tons/hour or 67.2 tons/day giving steam consumption per ton of product is 7.5 tons/ton of paper while the Indian bench marks of steam consumption is in the range of 4.5-6.5 tons/ton of product.
Table 5.9 The Electricity Loads at Different Sections of the mill.

-54-
Section Load (kW)
Material Preparation: Depithing 67.2 Cooking 73.6 Beating 333.2 PM1 112.5 PM2 90.2 PM3 75.2 Utilities for boiler 14.1 Water supply pumping 96 Wastewater pumping 24 Utilities section of the mill 12.84 Lighting 16 Total 914.84 From the surveying the mill it was found that almost of insulation of steam pipe system was malfunction. This leads to heat losses into the environment. The reduction of steam consumption could be solved by improving the insulation. The better quality of water feed boiler would save the fuel used to produce steam. 5.3.2 Summary The total electrical energy consumption of the mill is 994 kWh per ton of product. The electrical energy consumption of the mill a little high in comparision with standard. Electrical energy saving can be done by improving the technology, replacing old equipments. The steam supply to process for cooking and drying paper is. The steam produced at a rate of 2.8 ton/hour. The steam consumption was found to be 7.5 ton per ton of product. This value is higher than standard (6 ton/ton of product). 5.4 Fiber Recovery Unit Study 5.4.1 Wastewater Quality and Fiber Recovery Efficiency A large amount of wastewater generated of the mill runs to the fiber recovery unit before pouring into sump. Fiber in wastewater is settled by gravity. The flowrate were determined at the different time of the whole working day. The data of the flow measurements is shown in table B-20 Appendix B. The wastewater flow pouring into fiber recovery unit was found to be 1763 m3/day while the wastewater flow at sump was 1850.6 m3/day. Hence there were amount of 87 m3/day (a round 5% in total wastewater) of wastewater not running through fiber recovery. Composite samples were obtained from points before and after fiber recovery unit. The quality of the effluent in terms of average temperature, pH, BOD,COD, SS and TS was given in Table 5.10.
Table 5.10. Effluent Quality of the Fiber Recovery Unit

-55-
Sampling Location
Temp (oC) pH BOD
(mg/L)COD (g/L)
SS (g/L)
TS (g/L)
SS70 (g/L)
Before Fiber Recovery Unit
23.4 10.71 981.2 4.30 2.34 4.81 1.40
After Fiber Recovery Unit
23.3 10.05 771.9 3.24 1.74 3.85 0.97
From the above results it could be said that the SS component value was very high resulting in high value of COD. The high value of SS70 component shows that the high amount of fibrous materials left in the wastewater. The analysis results giving an average COD/BOD ratio is 0.24. This value proves that biodegradable organic compounds present are low. From the above results, the removal efficiency of SS, SS70, COD is 26, 31, 25 % respectively. It was seen that the efficiency of the unit is very low. Adding a coagulant into the fiber recovery unit to increase the efficiency of the unit should be done. Alum is recommended for using as a coagulant. A jar test experiment should be done in order to find out the optimum alum dosage. 5.4.2 Determination of Settleable Solid of the Effluent In order to determine the settling characteristics of the SS it was decided to carry out the following experiments: - Settleable solid by imhoff cone - Coagulation by using alum Settleable Solid by Imhoff cone Table 5.11 illustrates the COD and SS concentration before and after 1 hour settling time in imhoff cone. Wastewater from the sump was used for these studies.
Table 5.11 Settlable Solid by Imhoff Cone
Parameter Before settling (mg/L)
After settling (mg/L)
% removal
COD 4567.8 2776.7 39.2 SS 2564.0 1217.9 52.5
From the above results it can be seen that SS removal of more than 50% could be obtained by this method.

-56-
Coagulation by Using Alum Jar test was applied to determine the effective coagulation. The COD and SS concentration before and after jar test were assessed in order to determine the effect of adding different dosage of coagulant by the reduction of these parameters in wastewater. The results of jar test using alum apply to wastewater are presented in Appendix D table D-1 and D-2. From the results it can be concluded that the optimum pH and alum dosage are 5 and 400 mg/L. Table 5.12 presents the COD and SS removal at optimum point. The results shows that SS and COD reduction of 97.9 and 55.8 % removal could be obtained by coagulation.
Table 5.12 Coagulation by Using Alum
Parameter Before coagulation (mg/L)
After coagulation (mg/L)
% removal
COD 4378.6 1968.12 55.1 SS 1886 67.6 97.4
5.5 Noise and Air Pollution in the Work Environment 5.5.1 Noise In this study, noise level measurements based on area were done. The unit used was dB(A). It was noted that an intense noise source effect to the listener is an elevation of the threshold of audibility directly following the exposure. The source intensity and its operating period have not been too great then only a temporary threshold shift would have occurred. However, if intensity and duration of exposure are increased, then damage to the cell tissue of the inner ear could mean a permanent threshold shift (LARA SAENZ and STEPHENS (1986). Ministry for Science, Technology and Environment of Vietnam issued Noise Level Standards for work place. According to these standards, occupational exposure not more than 90dB(A) during the whole workshift (8 hours). The standards were presented in Table C-3 Appendix C. The results of the noise level measurements were shown in table B34 - Appendix B. These noise values are the maximum values measured at the sampling points. These figures shown the noise levels generated by surrounding unit process. In 24 sampling points, 5 exceeds the maximum noise levels according to the standards that is about 20.8% of the total sampling points. The areas are exposed to a noise level of more than 90 dBA are: -Cutting in finishing operation -Depithing house

-57-
-Steam boiler. 5.5.2 Particulate Matter Particulate matter measurements were done in following locations: - Digest house - Cutting - Depithing - Steam boiler Concentration of SO2 and CO were measured in steam boiler. Caustic soda NaOH vapour measurement was done in digest house. Table 5.11 presented the airborn particulate matter concentration in different sections. The concentration of caustic soda vapour and SO2 and CO in various areas was shown in table 5.12.
Table 5.11 Concentration of Particulate in Various Sections
No Date Section Flowrate of Sampling
(Lpm)
Particulated Concentration (mg/m3)
1 19/03/96 Digest house 18 2.51 2 19/03/96 Depithing 18 4.35 3 10/4/96 Cutting 18 0.87 4 10/4/96 Steam boiler 18 8.59 All the values measured SO2 and CO concentration in digest house, depithing, steam boiler are below the standard levels. In the digest house the caustic soda NaOH vapour emission was in high concentration when a cooking batch was finished and the digestor discharged the pulp. The caustic soda vapour concentration was found to be 0.187 mg/L (NaOH), 347 times higher than the standard values according to Vietnamese Environmental Standard. As a result, all workers working in the digest house suffer from sinusitis disease. Maximum permissible concentrations for toxic chemicals in ambient air at workplace announced by Ministry of Health of Vietnam was shown in Table C-4 in Appendix C.
Table 5.12 Concentration of air emission in various sections in the mill. No Date Section Flowrate
(Lpm) NaOH (mg/L)
SO2 (mg/L)
CO (mg/L)
1 19/3/96 Digest house 0.5 0.187 2 19/3/96 Steam boiler 0.5 0.0002 0.008

-58-
It was found that the dust concentration values measured are below the standard levels. According to table C-4 shown average amount of non-contain silica dust generated in workplace is 10 mg/m3. 5.6 Identification for Cleaner Production Opportunities In order to identify the cleaner production opportunities it is advised to identify causes of waste generation. 5.6.1 Causes of Waste Generation From the surveying the mill, it was found the causes of waste generation in pulp and paper production were : Poor Housekeeping: ∗ It was seen the spillage of the bagasse from the belt conveyors when transferring the bagasse from the depither to a digestor. ∗The leaking and overflow of water taps in the mill leading to water consumption amount was increased. ∗The insulation of steam pipeline has been in bad condition. Poor Raw Material Quality It was easy to recognize when surveying the mill that depithed bagasse was still mixed with fine piths after depithing process. Hence the input material contains amount of non-fibrous material leading to consume more chemicals and energy. Poor process and equipment design ∗The concentrated black liquor from cooking operation have not been separated and collected. ∗The spillage of pulp in washing pulp operation was seen due to inadequate size of the potcher (the tanks below the digestors) ∗Time of beating was found to be too long (more than 2 hours). ∗It was seen that edge cutter was too large. ∗Consistency indicator was absence.

-59-
∗Fiber recovery unit using for wastewater from paper machine was absence. 5.6.2 Cleaner Production Opportunities From the causes of waste generation, the cleaner production opportunities were suggested. The cleaner production opportunities were given in table 5.13
Table 5.13 Cleaner Production Opportunities
Cleaner Production Opportunities Section
Good housekeeping 1. Installation of a screen to separate fine piths and dust in the depithed bagasse. 2. Repairing the belt conveyor to prevent the bagasse spillage. 3. Replacing another types of water tap to avoid water leaking. 4. Installation of self-closing valves for the pressurized raw water to minimize water wastage 5. Insulation of the steam pipeline 6. Insulation of the digestors. 7. Cleaning the roll in the paper machines to avoid broke paper
RM
RM
All
All P
PM
Better Process Control 1. Segregation of initial concentrated black liquor . 2. Installation of consistency indicator. 3. Adjustment of edge cutter to reduce side trimming loss 4. Use of soft water as boiler feed water. 5. Installation fiber recovery unit (saveall) for whitewater from paper machines. 6. Reduce beating time 7. Multiple loading of digestor
P
All PM PM
- P P
Recycling Recovery of concentrated black liquor for use as construction material additive.
P
Note: PM: Paper Machine P : Pulping RM: Raw Material Preparation

-60-
5.7 Options of Cleaner Production Opportunities The cleaner production opportunities applied for the mill was assessed basing on the technical, economical feasibility and their environmental impacts. Information of cleaner production opportunities analysis were tabulated in table 5.14
Table 5.14 Cleaner Production Opportunities Analysis Cleaner Production Measures
Anticipated Benefits
Technical requirement
Economic Viability
Environmental Impacts
Remark
Good housekeeping 1. Screening of fine piths and dust in the depithed bagasse. 2. Repairing the belt conveyor to prevent the bagasse spillage. 3. Replacing old water taps to avoid water leaking. 4. Installation of self-closing valves for the pressurized raw water to minimize water wastage 5. Insulation of the steam pipeline and digestors. 6. Cleaning the roll in the paper machines to avoid breakage paper
-Reduction in cooking chemicals and steam. -Increase in power consumption -Reduction in input material -Reduction in water leaking - Reduction in water leaking Reduced steam requirement Reduced breakage paper amount
Equipment -Vibratory Screen Available Equipment: Water taps Not available Equipment: Amian material -
Saving 50kg NaOH/ton of product I=30,000,000 (VN dong) S=33,750,000 VN dong P= 1 month Unquantified Not quantified Not quantified I= 50,000,000 (VN dong) S=10,000,000 (VN dong) P= 5months Not quantified
Marginal reduced pollution load Reduced pollution load Reduced water consumption Reduce water consumption Reduce air pollution Reduce polution load
Easy to implement Easy to implement

-61-
Cleaner Production Opportunity
Anticipated Benefits
Technical requirement
Economic Viability
Environmental Impact
Remark
Better Process Control 7. Segregation of initial concentrated black liquor . 8. Installation of consistency indicator. 9. Adjustment of edge cutter to reduce side trimming loss 10. Use of soft water as boiler feed water. 11. Installation fiber recovery unit (saveall) for white water from paper machines. 12. Reduce beating time 13. Multiple loading of digestor
-Easy collecting concentrated black liquor. -Easy handling & treatment of remaining black liquor. -Reduction in paper breakage -Variation in grammage avoided -Reduction of paper trimming loss -reduction of reprocessing of paper trimming - Reduced scaling of boiler tube -Increased boiler efficiency and capacity -Reduced pollution load - Fiber recovery -Reduce electricity consumption -Reduced steam consumption -Increase pulp yield
-Separation drains required Equipment: -Collection sump -Pump & pipes Equipment: Consistency indicator Not available Equipment: Water softening plant Equipment: sedimentation system Equipment: -Not required Not required
I=70,000,000 (VN dong) S=14,000,000 (dong) P < 6months I= not quantified S= not quantified Not quantified I= 20,000,000 (dong) S= 22,000,000 (dong) P = <1 year I=15,000,000- 20,000,000 (dong) S=15,000,000- 20,000,000 (dong) P=1 year I=0 Saving from reduced steam consumption
Reduction in sodium load in effluent Marginal reduction in TS load Marginal reduction pollution load Reduced air pollution Reduction pollution load No direct impact -Reduction in digestor vent gas.
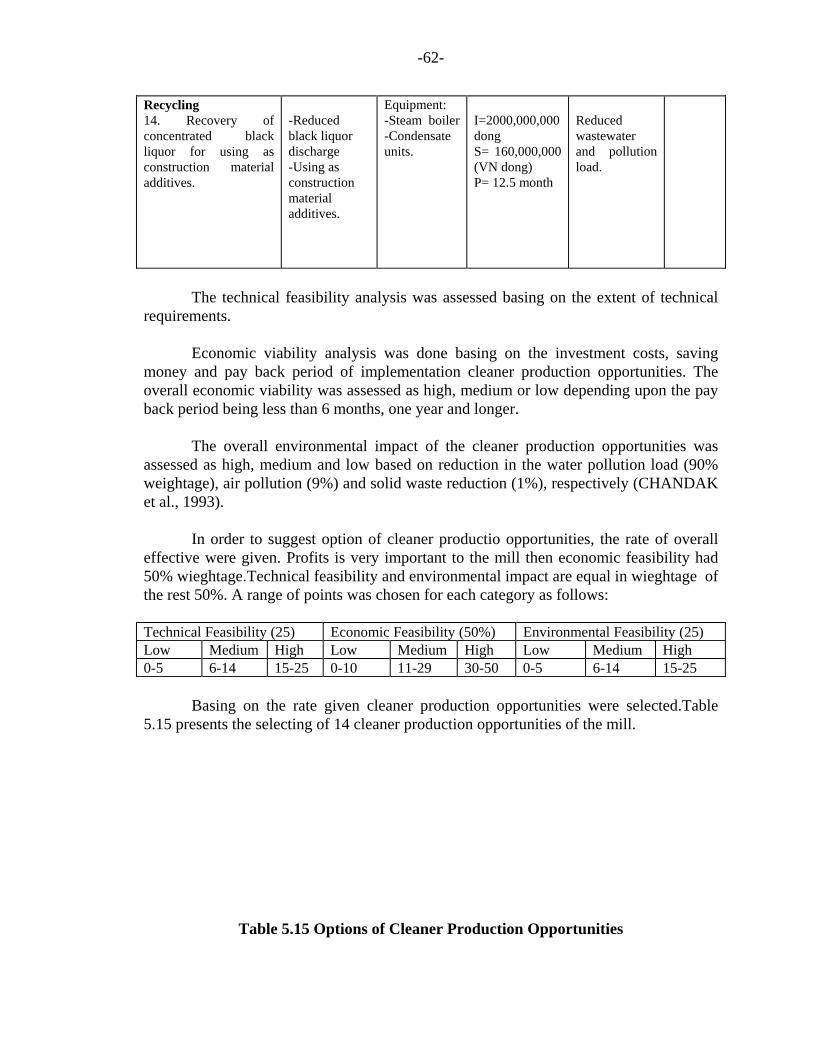
-62-
Recycling 14. Recovery of concentrated black liquor for using as construction material additives.
-Reduced black liquor discharge -Using as construction material additives.
Equipment: -Steam boiler -Condensate units.
I=2000,000,000 dong S= 160,000,000 (VN dong) P= 12.5 month
Reduced wastewater and pollution load.
The technical feasibility analysis was assessed basing on the extent of technical requirements. Economic viability analysis was done basing on the investment costs, saving money and pay back period of implementation cleaner production opportunities. The overall economic viability was assessed as high, medium or low depending upon the pay back period being less than 6 months, one year and longer. The overall environmental impact of the cleaner production opportunities was assessed as high, medium and low based on reduction in the water pollution load (90% weightage), air pollution (9%) and solid waste reduction (1%), respectively (CHANDAK et al., 1993). In order to suggest option of cleaner productio opportunities, the rate of overall effective were given. Profits is very important to the mill then economic feasibility had 50% wieghtage.Technical feasibility and environmental impact are equal in wieghtage of the rest 50%. A range of points was chosen for each category as follows: Technical Feasibility (25) Economic Feasibility (50%) Environmental Feasibility (25) Low Medium High Low Medium High Low Medium High 0-5 6-14 15-25 0-10 11-29 30-50 0-5 6-14 15-25 Basing on the rate given cleaner production opportunities were selected.Table 5.15 presents the selecting of 14 cleaner production opportunities of the mill.
Table 5.15 Options of Cleaner Production Opportunities

-63-
Cleaner Production Opportunity
Feasibility Total point
Overall Rank
Technical (25)
Economic (50)
Environmental (25)
1 2 3 4 5 6 7 8 9 10 11 12 13 14
14 24 10 0 20 25 20 15 0 13 16 24 22 12
30 0 0 0 35 0 45 0 0 18 33 0 29 28
20 7 19 21 14 23 23 5 13 6 24 4 8 25
64 31 29 21 69 48 88 20 13 30 73 28 59 65
5 8 10 11 3 7 1 12 14 9 2 13 6 4
From the above results, it can be seen the priority of the cleaner production opportunities.The segregation of the stream, installation of fiber recovery unit for wastewater from paper machine and insulation of the steam pipelines and the digestors were strongly recommended.

CHAPTER VI
CONCLUSIONS AND RECOMMENDATIONS Conclusions on waste audit, recommendations for cleaner production opportunities and waste minimization strategies at the Van Diem paper mill are as follow: 6.1 Water and Energy of the Mill Water, Wastewater and Solid Waste of the Mill • The water consumption on an overall basis was found to be 376 m3 per ton of
product. In comparison with normal operations, this figure is about 1.25 times higher than the standard. However, water consumption per ton of production of the mill would be much more higher than that of the standard. This is explained by the fact that the figure given in standard refer to bleached pulp and paper production while the study mill is unbleached paper production.
• The SS component in the wastewater was found to be higher than the bench mark.
The SS load was 431.8 kg/ton of product. The range of this parameter for the Indian mills is 192-362 kg/t. As discussions above, the pollution loads of the Van Diem would be much more than standard if it produces bleached pulp.
• The fiber loss from the there paper machine was considerable. It was found to be
20.8%. The total of SS and SS70 discharge to the Red river was 369.7 kg/ton and 211.7 kg/ton respectively. This means the fiber loss of the mill was 21.17% though a part of fiber was recovered by fiber recovery unit.
• The solid waste generated includes piths from the depither, cinder from the steam
boiler and waste paper from the finishing unit. It was accounted for 553 tons of piths, 1320 tons of cinder and per year. This amount is recycled for pulp production.
Energy Consumption of the Mill The total electrical energy consumption of the mill is 994 kWh per ton of product. The electrical energy consumption of the mill a little high in comparison with standard. Electrical energy saving can be done by improving the technology, replacing old equipments. The steam supply to process for cooking and drying paper is. The steam produced at a rate of 2.8 ton/hour. The steam consumption was found to be 7.5 ton per ton of product. This value is higher than standard (6 ton/ton of product). It was the fact that the mill consumes a large amount of water partly due to poor housekeeping practices. Poor housekeeping such as not closing of water taps after using, not to repair of leaking valves and connection was found regularly. It was found that the
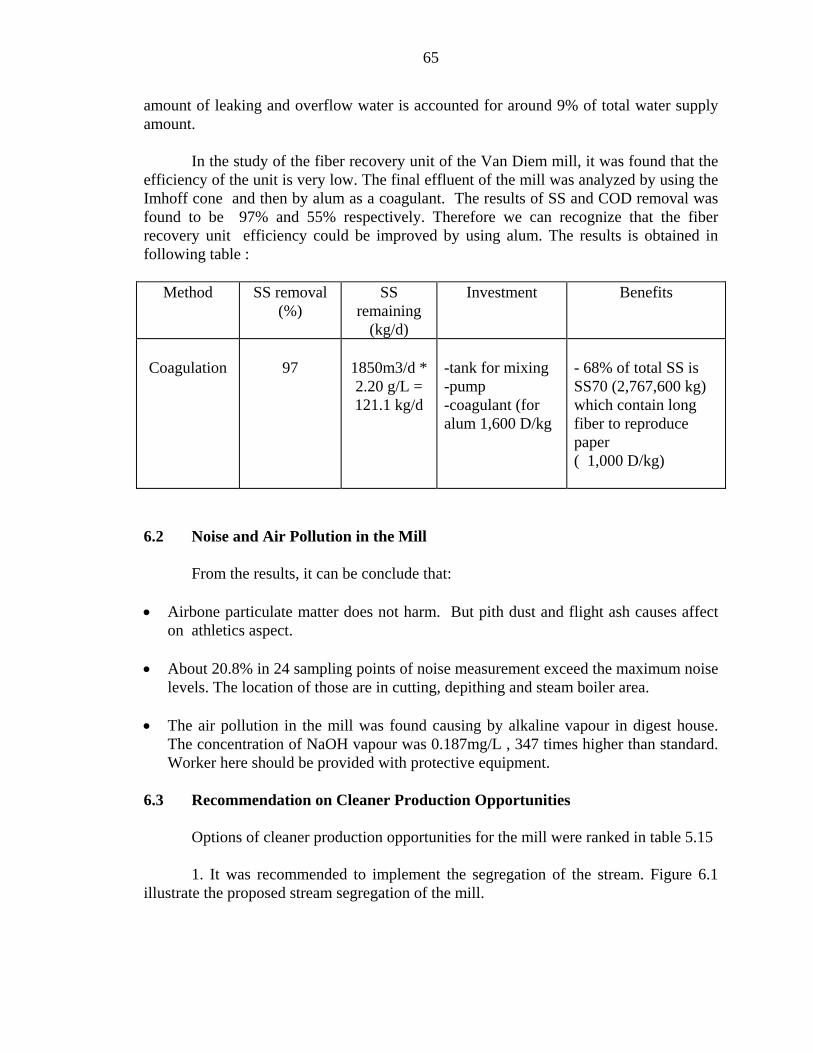
65
amount of leaking and overflow water is accounted for around 9% of total water supply amount. In the study of the fiber recovery unit of the Van Diem mill, it was found that the efficiency of the unit is very low. The final effluent of the mill was analyzed by using the Imhoff cone and then by alum as a coagulant. The results of SS and COD removal was found to be 97% and 55% respectively. Therefore we can recognize that the fiber recovery unit efficiency could be improved by using alum. The results is obtained in following table :
Method
SS removal (%)
SS remaining
(kg/d)
Investment Benefits
Coagulation
97
1850m3/d * 2.20 g/L = 121.1 kg/d
-tank for mixing -pump -coagulant (for alum 1,600 D/kg
- 68% of total SS is SS70 (2,767,600 kg) which contain long fiber to reproduce paper ( 1,000 D/kg)
6.2 Noise and Air Pollution in the Mill From the results, it can be conclude that: • Airbone particulate matter does not harm. But pith dust and flight ash causes affect
on athletics aspect. • About 20.8% in 24 sampling points of noise measurement exceed the maximum noise
levels. The location of those are in cutting, depithing and steam boiler area. • The air pollution in the mill was found causing by alkaline vapour in digest house.
The concentration of NaOH vapour was 0.187mg/L , 347 times higher than standard. Worker here should be provided with protective equipment.
6.3 Recommendation on Cleaner Production Opportunities Options of cleaner production opportunities for the mill were ranked in table 5.15 1. It was recommended to implement the segregation of the stream. Figure 6.1 illustrate the proposed stream segregation of the mill.

66
2. The concentrated black liquor collected was proposed to condensate for using as construction material additives. It both brings profit to the mill and reduces pollution load to the environment. The economic feasibility was analyze in table D-3 Appendix D. 3. Installation fiber recovery unit for paper machine was recommended. 4. Insulation for digestor and steam pipeline system was suggested. In addition, 8 another cleaner production opportunities were recommended in table 5.15.

REFERENCE
ANONYMOUS, (1981), Pollution by the Pulp and Paper Industry, Organization for Economic Cooperation and Development (OECD), Paris, France, ISBN: 9-264-11117-4. ANONYMOUS, (1982). Environmental Guidelines for Pulp and Paper Industry, Editor J.Ahmad, UNEP, Nairobi. ISBN:92-807-1054. APHA - AWWA - WPCF, (1985), Standard Method for the Examination of Water and Wastewater, 16th Edition, APHA - AWWA - WPCF. BENGTSSON, B. E., (1988), Effect of Pulp Mill Effluents on Skeletal Parameters in Fish, Water Science and Technology, Vol.20, pp.87-94. BILDBERG, G. and RAO, N.J., (1991), Discharge Characterization Training Package 1, Third Draft, Published by Swedish International Development Authority and United Nations Environment Programme Regional Office for Asia and the Pacific , Bangkok, Thailand. BONSOR, N., Mc.CUBBIN,N. and SPRAGUE, J.B., (1988), Stopping Water Pollution at its Source-Kraft Mill Effluents in Ontario, Report Prepared for the Technical Advisory Committee, Pulp and Paper Sector of MISA, Ontario Ministry of the Environment, Toronto, Ontario, Canada. CHANDAKK,S.P., GUPTA, P.K., WADHWA and SHISHIR KUMRA, (1993), From Waste To Profits. Guidelines For Waste Minimization, National Productivity Council, New Delhi, India. DAN, N. P., (1990), Wastewater Treatment for Long Binh Factory. Selected Paper on Water/Wastewater and Environment, edited by Triet,L.M., Ho ChiMinh City, Vietnam. DEPARTMENT OF SCIENCE AND TECHNOLOGY (Ministry of Light Industry) (1994), Evaluation of the Environmental Status in Vietnam’s Pulp and Paper Industry, Hanoi, Vietnam. GELLMAM, I., (1988), Environmental Effects of Paper Industry Wastewaters - An Overview, Water Science and Technology, Vol 20, No.2, pp.59-65, ISBN: 0-088-036633-3. GENERAL STATISTIC OFFICE (1995), Statistical Year Book 1994, Hanoi, Vietnam. GIERTZ, H.W., (1993), Material of EPT course for Pulp and Paper Technology, Markaryd . Sweden. KIM OANH,N.T., (1994), Wastewater Management - A Possible Tool to Optimize Production Control and Reduce Contamination from Bleached Kraft Pulp and Paper Industry - Vietnamese Case Study, Doctoral Dissertation, AIT, Bangkok, Thailand.

KLEPPE, P.J. and ROGERS, C.N., (1970), Survey of Water Utilization and Waste Control Practices in the Southern Pulp and Paper Industry, Water Resources Research Institute of the University of North Carolina, USA. McCUBBIN, N., (1983), The Basic Technology of the Pulp and Paper Industry and Its Environmental Protection Pratices. Training Manual EPS 6-EP-83-1. Environmental Protection Programs Directorate- Canada, pp 55-61. McCUBBIN,N., (1984), State-of-the-Art off the Pulp and Paper Industry and Its Environmental Protection Practices, Economic and Technical Review Report ESP 3-EP-84-2, Canada, pp.17-24. NEMEROW, N.L. (1978), Industrial Water Pollution Origins, Characteristics and Treatment, Addison-Wesley Publishing Company. ISBN: 0-201-05146-6. NPC (NATIONAL PRODUCTIVITY COUNCIL) (1996), A Practical Manual for Cleaner Production Assessment in Pulp and Paper Industry. New Delhi 110 003. PALMER, E.R. and GREENHALGH,P. (1983) The Production of Pulp and Paper on a Small Scale, Report of the Tropical Development and Research Institute, London. ISBN: 0 85954 177 0. PANNEERSELVAM, L (1988), Water Pollution Abatement in Small Paper Mills in India, Water Science and Technology, Vol.20, No.1, pp 37-48. PER ALSEFELT; RAO,N.J. ; SINGH,S.P (1991), Main Report of Training Package 1, Section B:Improved Mill Management, Published by Swedish International Development Authority and United Nations Environment Programme Regional Office for Asia and the Pacific, Bangkok, Thailand. SANH, D. S., (1996) Paper Industry and Environmental Issues. Report prepared for Training Seminar on “Cleaner Production in Textile and Paper Industry”, edited by Center for Environmental Science and Technology, Hanoi University of Technology, Hanoi, Vietnam. SODERGREN, A., (1993), Bleached Pulp Effluent, National Swedish Environmental Protection Agency, Report 4047. ISBN: 91-620-4047-2. SODERGREN, A., JONSSON, P., BENGTSSON, B-E., KRINGSTAD, K., LAGERGREN,S., OLSSON, M. and RENBERG, L., (1989), Biological Effects of Bleached Pulp Mill Effluent. National Swedish Environmental Protection Board, report 3558. ISBN: 91-620-3558-4.

STOLL, U. and AMIN, N., (1995), Environmental Impact of Pulp and Paper Industry and Pollution Control Measures, Technological Trajectories, Energy Efficiency and Environmental Externalities or Energy and Pollution Intensive Industries in Asian Industrializing Countries. Asian Institute of Technology. TRUNG, V. T., (1990), Reusing of Industrial Wastes for Production of Construction Material. Selected paper on Water/Wastewater and Environment, Water and Environment, No1, Published by Training and Information Center for Water and Environmental Sanitation, The Polytechnic Institute, Vietnam. UNEP (1977), Environmental Aspects of the Pulp and Paper Industry, An overview- Industry Programme, Paris. UNEP (1981), Environmental Management in the Pulp and Paper Industry, Volume 1, Industry and Environment Manual Series, Moscow. UNEP (1986), Environmental Consideration for Non-wood Pulping, Report Prepared for UNEP Workshop, Kina. 08-57 10 00. UNEP (1991), Audit and Reduction Manual for Industrial Emissions and Waste, Technical Report Series No7, United Nation Publication. UNEP/IEO and UNIDO, (1991). Auditing and Reduction Manual for Industrial Emissions and Waste, 1st Edition. United Nations Publishcation: 3 Vol. 24, No.3-4, pp 373-380. WHO, (1993), Assessment of Sources of Air, Water and Land Pollution, A Guideline to rapid Source Inventory Techniques and Their Use in Formulating Environmental Control Strategies, GENEVA. pp 4-20.

Table 1: Number of Cellulose and Paper Enterprises in Vietnam and
Their Product Output No Type of Enterprise Number of Enterprises 1990 1991 1992 1993 1994
1
State-owned enterprise * Central * Local
53 15 38
48 13 35
43 13 30
39 13 26
- - -
2 Industrial Coopeartives
188 154 141 100 -
3 Private Medium-scaled Enterprises
11 12 30 46 -
4 Private Household-scale Enterprises
1605 1594 1978 2222 -
Total Product Output (paper and packing materials)
thousand tons/year
79
109
118
128
145
Source: GENERAL STATICAL OFFICE (1995)
Table 2: Designed Capacity of Existing Enterprises establishment
Items Tons/year Pulp Paper Total • Central State-owned • Local State-owned • Cooperative • Private Enterprises
181,000 137,000 44,000
- -
220,300 150,700 46,500 9,700 13,450
Source: DEPARTMENT OF SCIENCE AND TECHNOLOGY (1994)
APPENDIX A INFORMATION ON PULP AND PAPER INDUSTRY IN VIETNAM

APPENDIX B DATA INFORMATION

15m
11.1m 10.7m
9.6m
2.5m
2.5m
2.5m
2.5m
2.5m
2.5m
0.2m
1.8m
Figure B-1 Fiber Recovery Unit of Van Diem Paper Mill
Outlet
Inlet

Table B1 Electricity loading of the Mill
Item Number of Item
Electricity loading (kW)
Total Electricity
Loading (kW) Cutting Machine 1
1 1
5 10 3
5.0 10.0 3.0
Main Engine of PM3 Main Engine of PM1 Main Engine of PM2
1 1 1
40/13.3 30/10 30/10
40/13.3 30/10 30/10
Vacuum Pump 2 1
20 14
40 14
Fan for de-humidity 2 2
4.5 9.5
9.0 19.0
White Water Pump 3 1
7.5 5.5
22.5 5.5
Stirrer 2 1 1 1
4.5 10 2.8 7
9.0 10.0 2.8 7.0
Fine Pulp Pump 2 1 1
7.5 13 14
15.0 13.0 14.0
Roll Machine 1 3 3.0 Beater 3
7 55 30
165.0 210.0
Raw Pulp Pump 2 2 1
10 20 14
20.0 40.0 14
Digestor 6 4.5 27

Table B1 (continue)
Item Number of Item
Electricity Loading (kW)
Total Electricity Loading (kW)
NaOH Pump 1 10.0 10.0 Belt Conveyor 4 4.5 18.0 Depithing Machine 1 55 55 Pith Blower 1 20 20 Water Supply Pump 4 30 120 Wastewater Pump 2 30 30 Steam Boiler • Engine • Water Pump • Conveyor for Coal • Cooling Fan
2 1 1 2
1.1 7.5 4.5 1.7
2.2 7.5 4.5 3.4
Utility Section • Planning Machine • Drilling Machine • Lather • Grinder • Saw Machine
1 1 1 1 1 1 1
4.5 1.7 4.5 2.8 1.7 1.7 4.5
4.5 1.7 4.5 2.8 1.7 1.7 4.5
Lighting 20

Table B2 Input Materials Consumption and Their Cost
Section/ Input Material
Cost/ton (dong)
Annual consumption
(ton/year)
Consumption (ton /ton of paper)
Bagasse Waste Paper Caustic Soda Alum Rosin Dye Coal Electricity
42,000 1,290 4,600 1,600 6,500 4,100
270,000 620/kWh
8300 1360 350 46 8
1.3 4400
2565 MWh/year
3.07 0.50 0.13 0.02 0.003 0.002 1.63
950kW/ton
Table B3 Time of Operation for Water Supply Pump
Date
Shift 1 Shift 2 Shift 3 Total Time (h)
15/3/96
Pump No1: 2:00 - 9:30 Pump No2: 2:00 - 9:00
Pump No1: 10:35 - 17:12 Pump No2: 10:15 - 16:55
Pump No1: 18:00 - 2:00 Pump No2: 18:50 - 1:40
43.61
16/3/96
Pump No1: 2:00 - 10:00 Pump No2: 2:00 - 10:00
Pump No1: 10:22 - 17:55 Pump No2: 10:05 -17:24
Pump No1: 18:00 - 1:35 Pump No2: 18:20 - 1:47
45.98
17/3/96
Pump No1: 2:00 - 9:40 Pump No2: 2:20 - 9:10
Pump No1: 10:25 - 17:27 Pump No2: 10:30 - 17:48
Pump No1: 18:53 - 1:46 Pump No2: 18:00 - 1:15
42.80
Average
44.13
Capacity of the pump is 100 m3/h.
The efficiency of the pump is 70%.
The average volume of water is pumped per day : 100 x 44.13 x 0.7 = 3089 m3.

Table B4 The Water Consumption for a Digestor by Using Bucket and Stop Watch System.
No Vol. (L) Duration (s) Flowrate (L/s) 1 8 13.7 0.58 2 8 14.2 0.56 3 8 13.0 0.62 4 8 13.5 0.59 5 8 13.8 0.58 6 8 13.6 0.59
Average 0.59
Time of taking water for a digestor is (from 10:01 - 10:59) = 58 min.
Water consumption = 2.05 m3/digestor or batch
In addition, 500 L of water in caustic soda solution is added to digestor.
Water consumption for a digestor is 2.55m3/batch
For 9 tons of paper (16 batch of cooking) per day
Total water consumption for cooking is 40.8m3/day
Table B 5 The Water Consumption for Pulp Washing
No Vol. (L) Duration (s) Flowrate (L/s)
1 8 4.0 2.00 2 8 4.2 1.90 3 8 3.8 2.11 4 8 3.9 2.05 5 8 3.8 2.11 6 8 4.3 1.86
Average 2.01
Washing time per batch of cooking is (from 3:02 - 4:49) = 107 min
Water consumption = 12.9 m3/batch
For 9 tons of paper (16 batch of cooking) per day
Total water consumption for pulp washing = 206.4 m3/day

Table B6 The Water Consumption for Beating
No Vol. (L) Duration (s) Flowrate (L/s)
1 8 3.6 2.22 2 8 3.4 2.35 3 8 3.8 2.10 4 8 3.4 2.35 5 8 3.5 2.29 6 8 3.7 2.16 Average 2.25
Time of supplying water into beater per bath is 65 min.
Water consumption = 8.78 m3 /batch
For 9 tons of paper (57 batch of beating) per day
Total water consumption for beating = 500.5 m3/day
Table B7 The Water Consumption for Wire Washing in Paper Machine 1
No Vol. (L) Duration (s) Flowrate (L/s)
1 5 2.3 2.17 2 5 2.1 2.38 3 5 2.4 2.08
Average 2.21 Table B8 The Water Consumption for Blanket Washing in Paper Machine 1
No Vol. (L) Duration (s) Flowrate (L/s)
1 8 2.0 4.00 2 8 2.2 3.62 3 8 2.4 3.33
Average 3.64 Water consumption for paper machine is total water using for wire and blanket washing. The velocity of PM 1 is 0.095 kg/s Therefore the water consumption for paper machine per ton of product is : 1000/0.095 (2.21+3.64) = 61.65 m3/ton

The water consumption per day for PM1 and PM2 producing carton product (8.5 tons of carton) = 61.65 x 8.5 = 524 m3/day Table B9 The Water Consumption for Wire Washing in Paper Machine 3
No Vol. (L) Duration (s) Flowrate (L/s)
1 8 3.5 2.29 2 8 3.2 2.50 3 8 3.4 2.35
Average 2.38 Table B10 The Water Consumption for Blanket Washing in Paper Machine 3
No Vol. (L) Duration (s) Flowrate (L/s)
1 8 1.9 4.21 2 8 2.1 3.81 3 8 1.8 4.44
Average 4.15 Water consumption for paper machine is total water using for wire and blanket washing. The velocity of PM 3 is 0.084 kg/s Therefore the water consumption for paper machine per ton of product is : 1000/0.084 (2.70+4.15) = 81.55 m3/ton The water consumption per day (0.7 tons of note-book cover paper) of PM3 is 81.55 x 0.7 =57 m3/day Table B11 The Water Consumption for Pulp Diluting before Coming to Beater
No Vol. (L) Duration (s) Flowrate (L/s)
1 8 2.3 3.48 2 8 2.1 3.81 3 8 2.1 3.81 4 8 2.2 3.64 5 8 2.0 4.00
Average 3.75
Time of supplying water for diluting per batch is (from 11:07 - 12:31) = 84 min
Water consumption = 18.9 m3
For 9 tons of paper (16 batchs of cooking) per day
Total water consumption for beating = 302.4 m3/day

Table B12 Water Consumption for Cleaning Beater
Date Working time (s) Water Consumption (m3)
16/3/96 129 0.285 17/3/96 183 0.404 3/4/96 96 0.212 4/4/96 101 0.223 5/4/96 89 0.197 10/4/96 115 0.254
Average 0.263 The flowrate is 2.21 L/s (measured by using 8L bucket and stop watch)
Beater is cleaned once per day.
Water consumption (for 10 beater) is 2.6 m3/day.
Table B-13 Water Consumption for Floor Washing
Date Working time (s) Flowrate (L/s) Water consumption (m3)
18/3/96 165 3.51 0.579 19/3/96 177 2.58 0.456 20/3/96 184 3.01 0.553 3/4/96 199 3.61 0.718 5/4/96 139 2.96 0.411 6/4/96 143 2.77 0.396
Average 0.519 Normally, floor cleaning at pulp mill section and paper mill once per shift (3 shifts per
day). Water consumption for floor cleaning is 3.1 m3/day.

Table B-14 The Leaking Water Water at Various Points
Location Flowrate (L/min)
Water leaking/overflow (m3/day)
Washing tank 1 Washing tank 2 Washing tank 3 Washing tank 4 Washing tank 5 Washing tank 6
1.91 0.62 1.35 1.24 1.07 0.72
2.29 0.74 1.62 1.49 1.28 0.86
Total 8.28 Beating tank1 Beating tank 2 Beating tank 3 Beating tank 4 Beating tank 5 Beating tank 6 Beating tank 7 Beating tank 8 Beating tank 9 Beating tank 1
0.60 0.81 0.90 0.72 0.38 0.53 0.37 1.01 0.55 0.98
0.72 0.97 1.08 0.86 0.46 0.64 0.44 1.21 0.66 1.18
Total 8.22 The amount of water overflow from the malfunction tap at the digestor house is 169.2 m3. This figure was obtained by measuring flowrate of the tap (2.25 L/s) and calculated for duration of water pumping is 20 hours. In addition leaking and over flow water at paper machine and other water taps in the mill was estimated with the amount 10m3/day. The total amount of leaking and overflow water is 195.7 m3/day.

Table B-15. The Flowrate of Wastewater Discharging from a Digestor
Date No Vol. of Wastewater (L)
Duration (s)
Flowrate (L/s)
18/3/96 1 8 8.1 0.99 2 8 8.0 1.00 3 8 7.6 1.05 4 8 7.8 1.03 5 8 8.2 0.98 6 8 8.0 1.00
19/3/96 1 8 7.6 1.05 2 8 7.7 1.04 3 8 8.3 0.96 4 8 8.2 0.98 5 8 7.9 1.01 6 8 8.1 0.99 Average 1.01
The average discharging time is 21 minute/digestor (or batch) Wastewater generated per digestor = 1.15 m3/batch Wastewater generated per day (16 batch of cooking) = 22.1 m3/day Table B-16 The Flowrate of Wastewater Discharge from Washing Unit Operation
Date No Vol. of Wastewater (L)
Duration (s)
Flowrate (L/s)
18/3/96 1 8 4.1 1.95 2 8 4.0 2.00 3 8 3.7 2.16 4 8 4.2 1.90 5 8 4.1 1.95 6 8 3.9 2.05
19/3/96 1 8 3.8 2.10 2 8 4.1 1.95 3 8 3.7 2.16 4 8 3.6 2.22 5 8 3.9 2.05 6 8 4.4 1.82 Average 2.03
The average discharging time is 110 minutes/batch

Wastewater generated per batch = 13.4 m3/batch Wastewater generated per day (16 batchs) = 214.4 m3/day Table B-17 The Flowrate of Wastewater Discharge from Beating Unit Operation
Date No Vol. of Wastewater (L)
Duration (s)
Flowrate (L/s)
2/4/96 1 8 3.5 2.29 2 8 4.0 2.00 3 8 3.8 2.11 4 8 5.3 1.51 5 8 4.1 1.95 6 8 4.3 1.86
3/4/96 1 8 3.7 2.16 2 8 4.0 2.00 3 8 4.2 1.90 4 8 4.2 1.90 5 8 3.9 2.05 6 8 3.6 2.22 Average 2.00
The average discharging time is 56 minutes/batch Wastewater generated from a batch of beating = 6.72 m3/batch Wastewater generated per day (57 batchs) = 383 m3/day Table B-18 The Wastewater Discharging from PM 1 The flowrate was calculated from the velocity of flow as measured with a velocity indicating instrument (propeller) and refer calibration curve Figure B-2 Appendix B -Cross section of the flow is 34x40 cm -Velocity of propeller
No Velocity 1 2 3 4 5 6
20 10 23 33 13 29
Average 21.3 -From velocity of propeller and the calibration curve (vl:1 24327 line) it was found velocity of the flow to be 7.5 cm/s. Therefore flowrate F= 7.5x34x40=10.2 L/sec -The velocity of PM1 is 0.095 Kg/sec -Therefore, the wastewater from PM1 per ton of product is

10.2x1000/0.095=107.4m3 /ton. -Wastewater discharge from PM1and PM2 (produce 8.5 tons of product per day) is 912.9 m3/day Table B-19 The Wastewater Discharging from PM 3 The flowrate was calculated from the velocity of flow as measured with a velocity indicating instrument (propeller) and refer calibration curve Figure B-2 Appendix B -Cross section of the flow is 37x30 cm -Velocity of propeller
No Velocity 1 2 3 4 5 6
39 12 25 29 10 36
Average 25.2
-From velocity of propeller and the calibration curve (vl:1 24327 line) it was found velocity of the flow to be 8 cm/s. Therefore flowrate F= 8x37x30=8.88 L/sec -The velocity of PM3 is 0.084 Kg/sec -Therefore, the wastewater from PM3 per ton of product is 8.88x1000/0.084=104.76m3 /ton. -The wastewater discharging from PM 3 (produce 0.7 tons of product per day) is 73.33m3/day .

Table B-20 Flowrate of Wastewater Discharge Point before Fiber Recovery Unit -The flowrate was calculated from the velocity of flow as measured with a velocity indicating instrument (propeller) and refer calibration curve Figure B-2 Appendix B -Average cross section of the flow is 34x25 cm -Velocity of propeller (vi) then refer calibration curve getting velocity of flow(vf) No Time (25/4/96) vi vf (cm/s) 1 9:00 14 12 2 11:00 35 30 3 13:00 28 24 4 15:00 29 25 5 17:00 17 15 6 19:00 25 22 7 21:00 26 23 8 23:00 43 36 9 1:00 28 24 10 3:00 36 32 11 5:00 20 18 12 7:00 33 28 Average 24.1 -The flowrate of the wastewater is 24.1x34x25=20485cm3/s=20.5 L/s -The flow of the wastewater per day is 1771.2 m3/day Table B-21 Flow rate of wastewater discharging at sump on 2/4/96
Time Flowrate at Line1 (L/s)
Flowrate at Line2 (L/s)
Total Flowrate at sump(L/s)
8:00 10:00 12:00 14:00 16:00 18:00 20:00 22:00 24:00 2:00 4:00 6:00
0.18 3.11 0.10 1.88 2.34 2.98 1.13 0.71 1.44 2.89 0.32 1.87
12.65 27.13 18.05 18.41 22.40 28.51 24.57 17.0 11.73 22.08 22.03 18.21
12.83 30.24 18.38 20.29 24.74 31.49 25.70 17.71 13.17 24.97 22.35 20.08
Average 1.58 20.23 21.81

Note: flowrate of the wastewater was measured by using bucket with volume of 20 L and stop watch. Table B-22 Flowrate of Wastewater Discharging at Sump on 7/4/96
Time Flowrate at Line1 (L/s)
Flowrate at Line2 (L/s)
Total at sump
8:00 10:00 12:00 14:00 16:00 18:00 20:00 22:00 24:00 2:00 4:00 6:00
2.21 3.43 1.1 0.82 0.73 2.30 3.12 2.60 1.22 0.60 0.43 0.37
12.12 34.97 27.9 22.95 20.52 23.24 25.25 19.52 17.89 27.19 21.48 15.29
14.33 38.40 29.00 23.77 21.25 25.54 28.37 22.12 19.11 27.79 21.91 15.66
Average 1.58 22.36 23.94 Note: flowrate of the wastewater was measured by using bucket with volume of 20 L and stop watch. Table B-23 Flowrate of Wastewater Discharging at Sump on 12/4/96
Time Flowrate at Line1 (L/s)
Flowrate at Line2 (L/s)
Total at sump
8:00 10:00 12:00 14:00 16:00 18:00 20:00 22:00 24:00 2:00 4:00 6:00
2.32 0.30 1.24 3.57 0.16 1.62 1.91 0.43 1.02 0.50 2.70 0.66
13.15 20.81 17.15 13.70 17.82 14.26 22.88 21.49 18.10 26.64 17.91 14.46
15.47 21.11 18.39 17.27 17.98 15.88 24.79 21.92 19.12 27.14 20.61 15.12
Average 1.37 18.15 19.52 Note: flowrate of the wastewater was measured by using bucket with volume of 20 L and stop watch. The average flowrate at sump was: (21.83+22.85+19.57)/3= 21.42L/s.
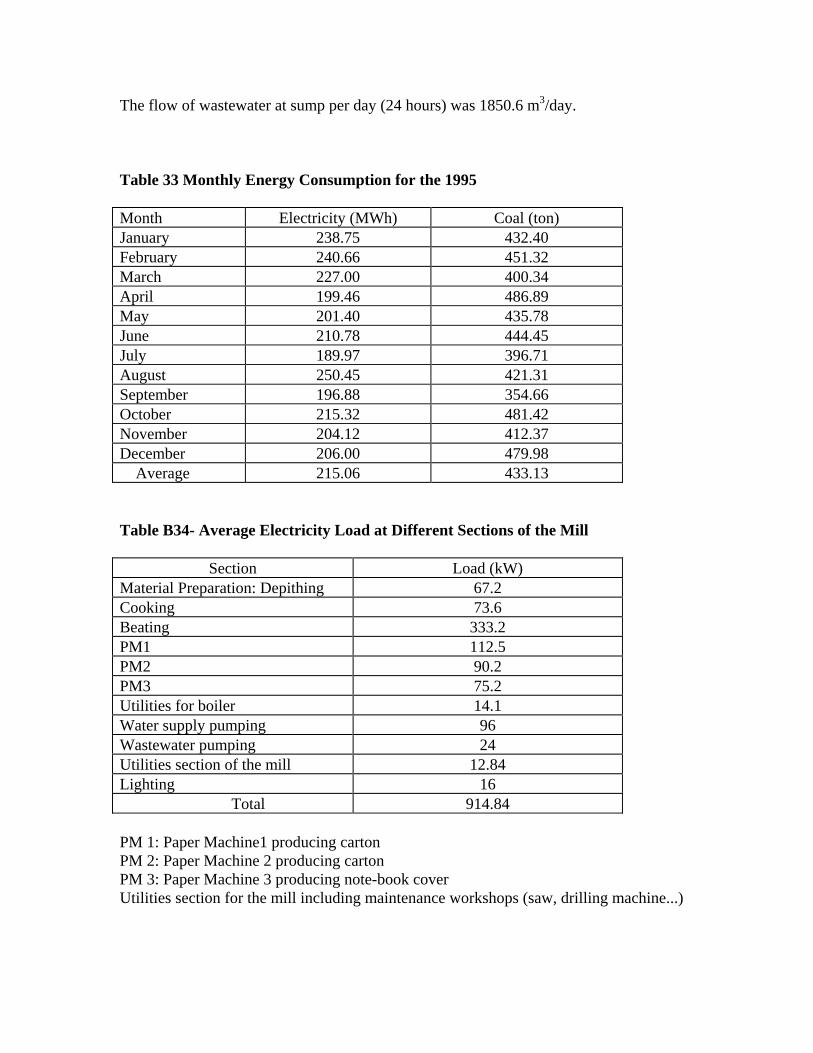
The flow of wastewater at sump per day (24 hours) was 1850.6 m3/day. Table 33 Monthly Energy Consumption for the 1995 Month Electricity (MWh) Coal (ton) January 238.75 432.40 February 240.66 451.32 March 227.00 400.34 April 199.46 486.89 May 201.40 435.78 June 210.78 444.45 July 189.97 396.71 August 250.45 421.31 September 196.88 354.66 October 215.32 481.42 November 204.12 412.37 December 206.00 479.98 Average 215.06 433.13 Table B34- Average Electricity Load at Different Sections of the Mill
Section Load (kW) Material Preparation: Depithing 67.2 Cooking 73.6 Beating 333.2 PM1 112.5 PM2 90.2 PM3 75.2 Utilities for boiler 14.1 Water supply pumping 96 Wastewater pumping 24 Utilities section of the mill 12.84 Lighting 16 Total 914.84
PM 1: Paper Machine1 producing carton PM 2: Paper Machine 2 producing carton PM 3: Paper Machine 3 producing note-book cover Utilities section for the mill including maintenance workshops (saw, drilling machine...)
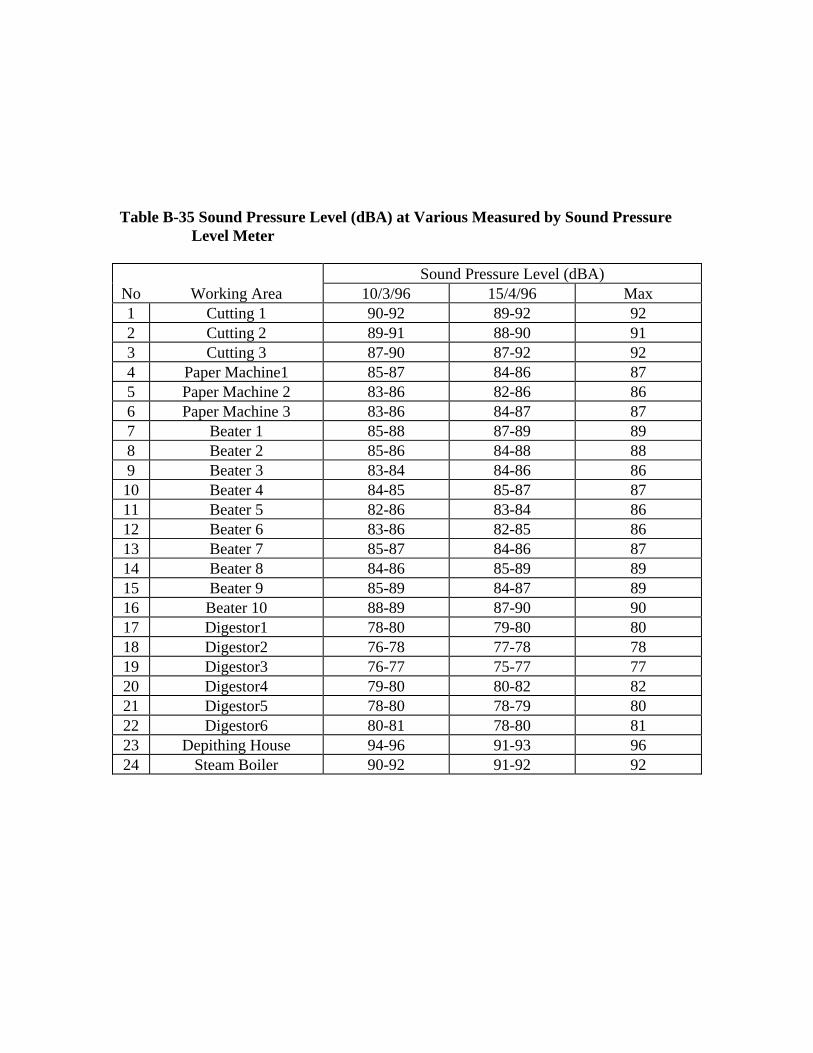
Table B-35 Sound Pressure Level (dBA) at Various Measured by Sound Pressure Level Meter Sound Pressure Level (dBA) No Working Area 10/3/96 15/4/96 Max 1 Cutting 1 90-92 89-92 92 2 Cutting 2 89-91 88-90 91 3 Cutting 3 87-90 87-92 92 4 Paper Machine1 85-87 84-86 87 5 Paper Machine 2 83-86 82-86 86 6 Paper Machine 3 83-86 84-87 87 7 Beater 1 85-88 87-89 89 8 Beater 2 85-86 84-88 88 9 Beater 3 83-84 84-86 86 10 Beater 4 84-85 85-87 87 11 Beater 5 82-86 83-84 86 12 Beater 6 83-86 82-85 86 13 Beater 7 85-87 84-86 87 14 Beater 8 84-86 85-89 89 15 Beater 9 85-89 84-87 89 16 Beater 10 88-89 87-90 90 17 Digestor1 78-80 79-80 80 18 Digestor2 76-78 77-78 78 19 Digestor3 76-77 75-77 77 20 Digestor4 79-80 80-82 82 21 Digestor5 78-80 78-79 80 22 Digestor6 80-81 78-80 81 23 Depithing House 94-96 91-93 96 24 Steam Boiler 90-92 91-92 92

Table B-24 Characteristic of Wastewater Discharging from Digestor
Date pH Temp Cond
(s/m) Turb
(mg/L) BOD
(mg/L) COD (g/L) SS (g/L) TS (g/L)
27/01/96 11.86 61.3 1.71 2252 3040.2 23.29 2.89 11.25 16/03/96 12.2 65.2 1.68 2853 4887.4 28.13 2.20 10.95 3/04/96 12.4 70.3 1.75 3252 4785.4 27.36 1.71 10.29 5/04/96 11.9 63.5 1.58 1001 3120 21.30 1.60 9.78 2/05/96 12.5 64.0 1.70 2560 3550.4 21.66 2.02 10.70 Average 12.17 64.9 1.68 2383.6 3876.6 24.35 2.08 10.59
Sampling point No1 (see Figure 4.3)
Table B-25 Characteristic of Wastewater Discharging from Washing Operation
Date pH Temp Cond (s/m)
Turb (mg/L)
BOD (mg/L)
COD (g/L)
SS (g/L) TS (g/L) SS70 (g/L)
6/03/96 9.91 24.4 0.31 1020 780.1 9.96 2.69 6.31 2.19 15/03/96 10.27 25.0 0.42 1100 845.6 11.85 3.27 7.02 2.78 3/04/96 10.15 26.5 0.39 1456 860.6 11.96 3.48 7.14 3.07 5/04/96 10.47 28.4 0.29 1255 736.0 10.12 2.95 6.43 2.14 10/05/96 10.1 29 0.28 980 702.0 10.67 3.03 6.77 2.71 Average 10.18 26.7 0.34 1162.2 784.9 10.91 3.08 6.73 2.58
Note: sampling point No1 when pulp washing is done.

Table B-26 Characteristic of Wastewater Discharging from Beating Operation
Date pH Temp Cond (s/m) Turb (mg/L) BOD (mg/L)
COD (g/L) SS (g/L) TS (g/L) SS70 (g/L)
6/03/96 8.51 21.9 0.11 1243 903.4 10.00 4.96 8.23 2.84 15/03/96 8.01 22.0 0.23 927 779.5 10.50 3.67 6.40 2.57 4/04/96 8.13 23.5 0.19 1050 820.0 11.69 3.95 6.85 2.74 19/04/96 8.04 22.7 0.15 998 810.0 11.35 3.80 6.50 1.99 22/04/96 8.43 24.0 0.16 1001 897.0 11.63 3.92 7.49 2.21 Average 8.22 22.8 0.17 1043.8 842.0 11.43 4.06 7.09 2.47
Note: Sampling point No2
Table B-27 Characteristic of Wastewater Discharging from Paper Machine 1
Date pH Temp Cond (s/m) Turb (mg/L) COD (g/L) SS (g/L) TS (g/L) SS70 (g/L)6/03/96 7.13 20.0 0.05 100.2 1.49 1.30 2.23 1.12 15/03/96 7.43 21.5 0.07 112.3 2.42 2.12 3.25 1.97 4/04/96 7.51 23.0 0.08 115.0 1.84 1.54 2.66 1.33 5/04/96 7.32 22.5 0.06 99.6 2.10 2.12 2.89 2.09 22/4/96 7.28 23.8 0.05 105.0 1.54 1.33 1.44 1.18 Average 7.33 22.16 0.06 106.42 1.88 1.68 2.49 1.54
Note: Sampling point No3

Table B-28 Characteristic of Wastewater Discharging from Paper Machine 3
Date pH Temp Cond (s/m) Turb (mg/L) COD (g/L) SS (g/L) TS (g/L) SS70 (g/L)15/03/96 7.22 20.1 0.06 98.7 1.77 1.86 4.01 1.45 4/04/96 7.40 21.5 0.05 128.3 1.70 1.45 3.21 0.97 6/04/96 7.36 22.9 0.08 129.5 2.13 2.00 3.78 1.36 18/04/96 7.31 22.6 0.07 101.0 2.07 1.87 3.92 1.52 22/4/96 7.29 24.0 0.06 100.9 1.84 1.40 3.15 1.02 Average 7.31 22.2 0.064 111.68 1.90 1.72 3.61 1.26
Note: Sampling point No4
Table B-29 Characteristic of Wastewater at Sump
Date pH Temp Cond (s/m) Turb (mg/L) BOD (mg/L) COD (g/L) SS (g/L) TS (g/L) SS70 (g/L)15/03/96 7.55 21.8 0.24 1272.1 569.0 4.12 1.53 5.21 1.54 16/04/96 7.30 22.0 0.32 1644.3 658.5 5.13 2.47 5.84 1.87 6/04/96 7.42 23.5 0.25 1512.4 612.4 4.91 2.42 5.58 1.79 8/04/96 7.41 24.0 0.20 1327.5 540.0 5.08 2.43 6.35 1.85 18/4/96 7.38 25.0 0.17 1172.8 497.3 4.94 1.97 5.67 1.65 Average 7.41 23.3 0.24 1385.8 575.4 4.84 2.10 5.73 1.74
Note: Sampling point No8

Table B-30 Characteristic of Wastewater inlet Fiber Recovery Unit
Date pH Temp Cond (s/m) Turb (mg/L) BOD (mg/L) COD (g/L) SS (g/L) TS (g/L) SS70 (g/L)16/03/96 8.72 22.1 0.42 774.1 994.0 4.44 2.35 4.87 1.40 2/04/96 8.81 22.3 0.53 798.0 1025.5 4.85 2.71 5.02 1.58 6/04/96 8.85 23.0 0.44 783.0 1000.0 4.37 2.28 4.95 1.28 8/04/96 8.56 23.8 0.39 692.3 952.8 3.95 2.14 4.64 1.42 22/4/96 8.62 25.7 0.31 688.7 935.0 3.87 2.30 4.55 1.33 Average 8.71 23.4 0.42 747.2 981.2 4.30 2.34 4.81 1.40
Note: sampling point No5
Table B-31 Characteristic of Wastewater outlet Fiber Recovery Unit
Date pH Temp Cond (s/m) Turb (mg/L) BOD (mg/L) COD (g/L) SS (g/L) TS (g/L) SS70 (g/L)16/03/96 10.12 21.9 0.13 425.7 858.6 3.83 1.77 3.98 1.05 2/04/96 10.00 22.1 0.15 399.0 712.0 3.18 2.15 4.21 1.13 6/04/96 10.21 23.4 0.13 430.6 785.5 2.97 1.65 3.78 0.84 8/04/96 9.92 24.2 0.11 373.7 758.0 3.15 1.60 3.83 0.90 22/4/96 9.98 24.9 0.09 364.6 745.4 3.08 1.52 3.47 0.93 Average 10.05 23.3 0.12 398.7 771.9 3.24 1.74 3.85 0.97
Note: Sampling point No6

Table B-32 Characteristic of Wastewater Discharging at Point before Sump (Line 1)
Date pH Temp Cond (s/m) Turb (mg/L) BOD (mg/L) COD (g/L) SS (g/L) TS (g/L) SS70 (g/L)16/03/96 10.01 21.7 0.31 305.0 1383.0 11.92 2.22 2.74 1.73 2/04/96 10.42 22.5 0.28 296.8 1202.8 10.86 2.13 2.72 1.63 6/04/96 9.89 24.0 0.36 320.0 1400.4 10.40 2.25 2.37 1.74 8/04/96 10.11 24.2 0.26 273.5 1210.5 10.75 2.07 2.31 1.62 22/4/96 10.19 25.6 0.28 284.6 1214.0 10.91 2.18 2.59 1.70 Average 10.12 23.6 0.30 295.9 1282.1 10.85 2.17 2.59 1.69
Note: Sampling point No7

Table D-3 Using Black Liquor as Construction Material Additives Alternative
Condensating 1m3 of black liquor consumes 3-5 tons of steam Production 4 tons of steam consumes 0.8 tons of coal
Investment Profit
1. Man Power: 120,000 D/m3
2. Power Cost: 7,000 D/m3 (Pump, Light, Fan...) 3. Coal 216,000 D/m3 3. Mislenous : 50,000 D/m3
Total production cost: 393,000 D/m 4. Equipment and Installation Cost - Steam boile 300,000,000 - Storage tank: 100,000,000 - Condensate system 200,000,000 - Design and installation cost: 200,000,000 - Recovery pipeline system : 100,000,000 Total of construction cost :1,180,000,000
400 m3 BL/month Condensate BL sell:700,000D/m3 Turnover : 700,000*400=280,000,000 Profit : (700,000-393,000)* 400