cleaner production considers your technologies employees raw materials processes emissions
DESCRIPTION
Cleaner production Considers your Technologies Employees Raw materials Processes Emissions Partners and Products. Elements of a CP-project. Data collection Mass flow Energy flow Costs and safety Reflection: Where and why do we generate waste? Option generation - PowerPoint PPT PresentationTRANSCRIPT
Slides 1 – CP Basics
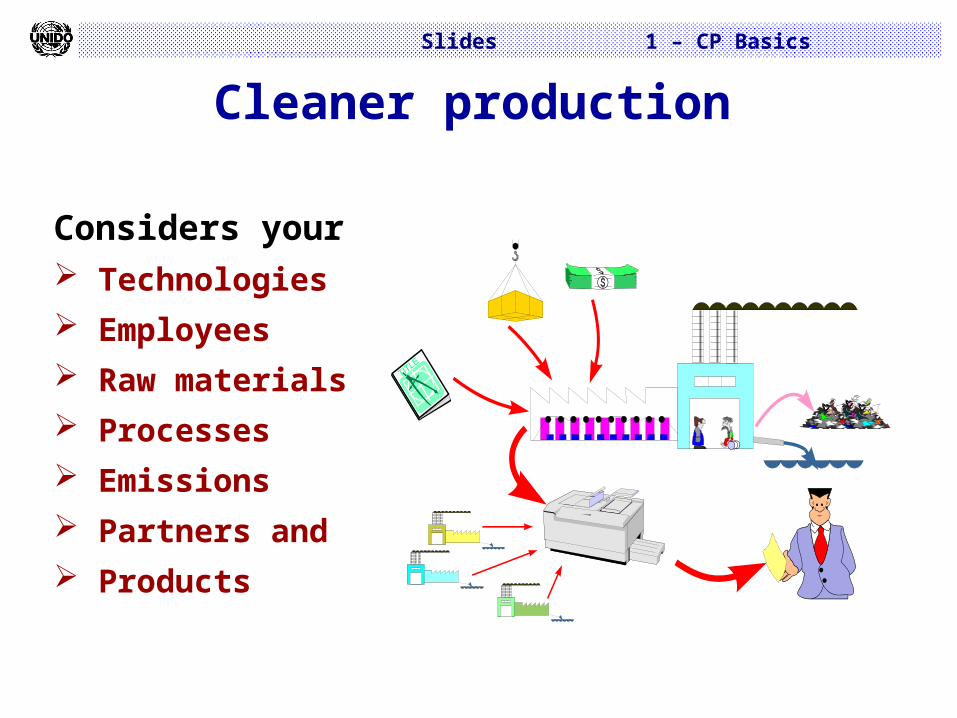
Cleaner production
Considers your Technologies Employees Raw materials Processes Emissions Partners and Products
Slides 1 – CP Basics
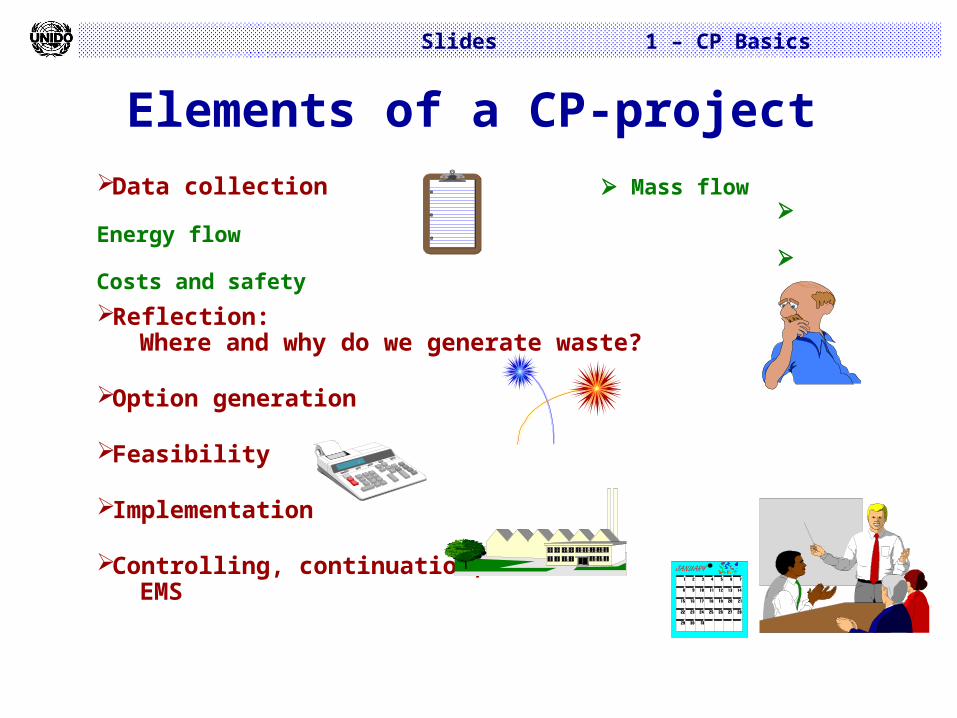
Elements of a CP-projectData collection Mass flow Energy flow Costs and safetyReflection: Where and why do we generate waste?
Option generation
Feasibility
Implementation
Controlling, continuation, EMS
Slides 1 – CP Basics
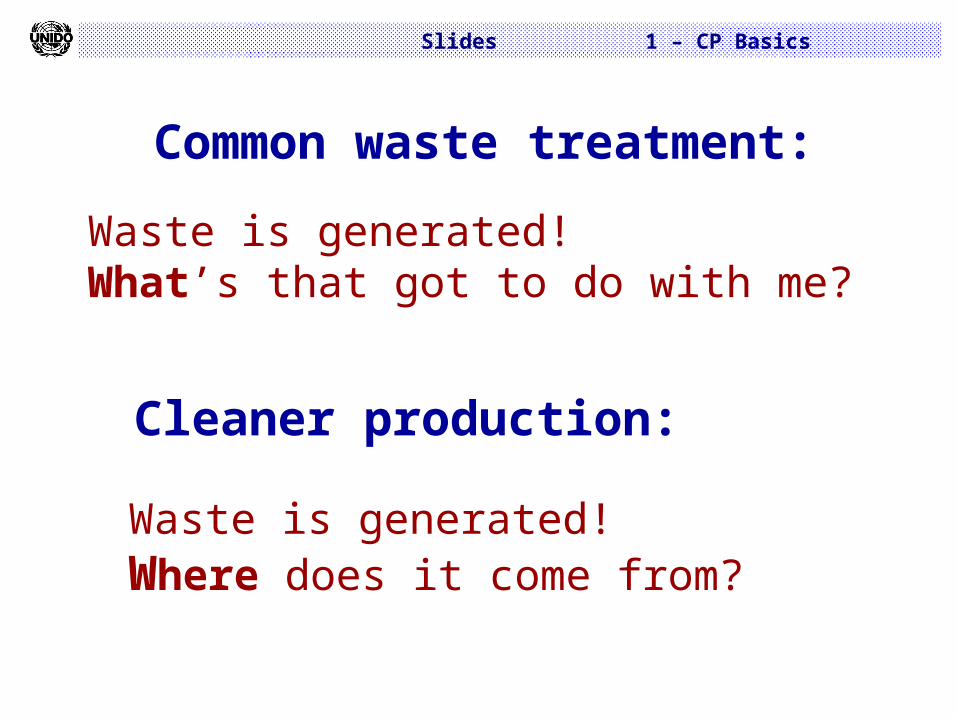
Common waste treatment:Waste is generated!What’s that got to do with me?
Cleaner production:
Waste is generated!Where does it come from?
Slides 1 – CP Basics
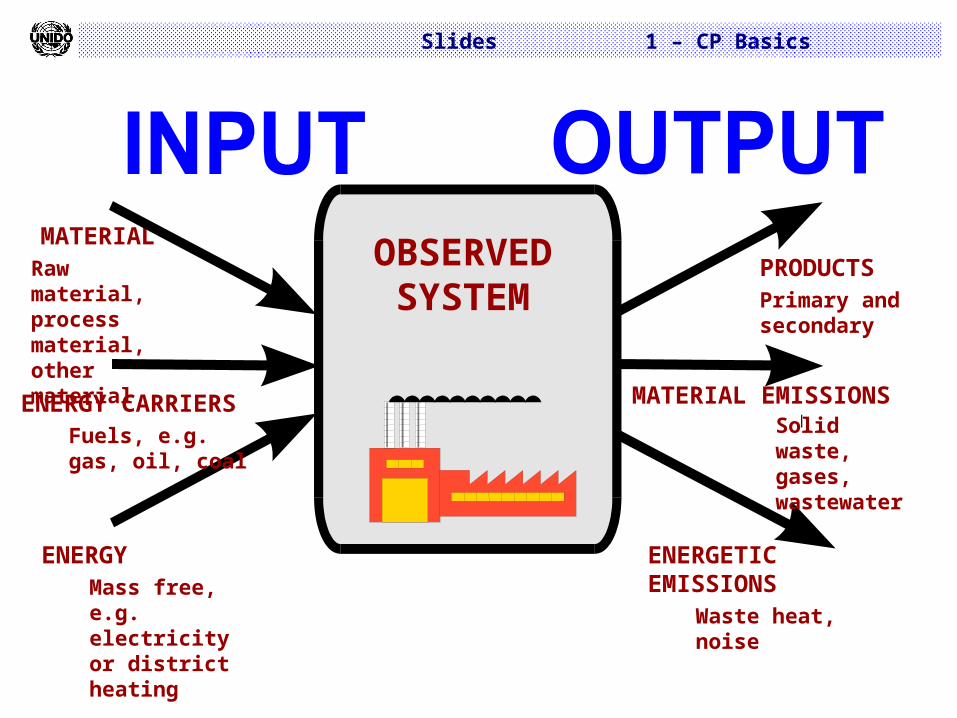
MATERIALRaw material, process material, other material
PRODUCTSPrimary and secondary
MATERIAL EMISSIONSSolid
waste, gases, wastewater
OBSERVED SYSTEM
ENERGY CARRIERS
Fuels, e.g. gas, oil, coal
ENERGYMass free, e.g. electricity or district heating
ENERGETICEMISSIONS
Waste heat, noise
Slides 1 – CP Basics
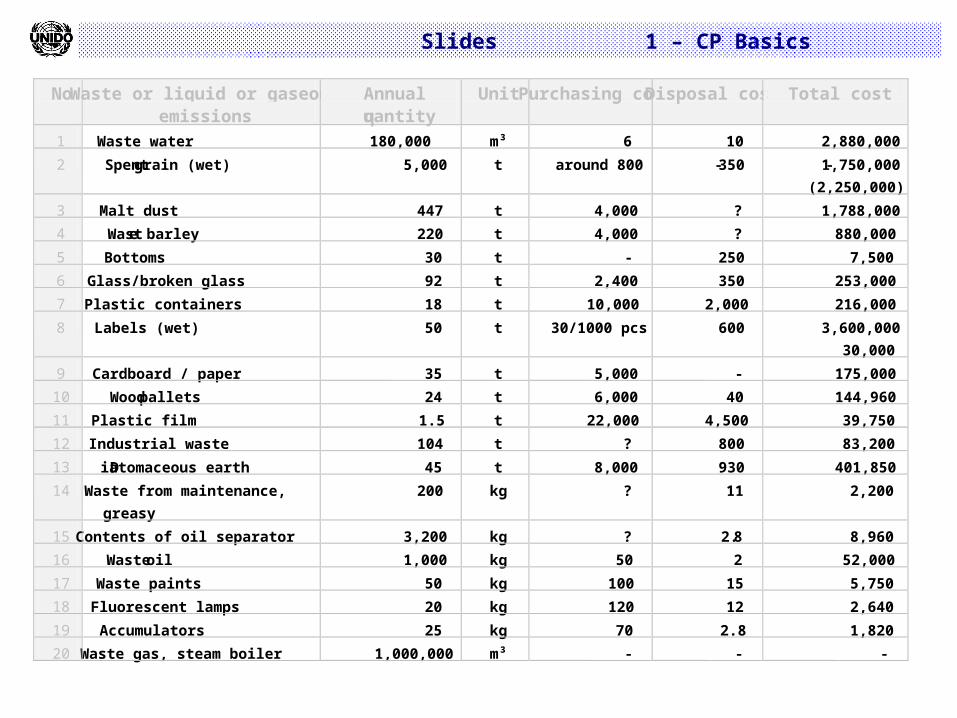
No Waste or liquid or gaseous emissions
Annual quantity
Unit Purchasing cost Disposal cost Total cost
1 Waste water 180,000 m³ 6 10 2,880,000 2 Spent grain (wet) 5,000 t around 800 -350 -1,750,000
(2,250,000) 3 Malt dust 447 t 4,000 ? 1,788,000 4 Waste barley 220 t 4,000 ? 880,000 5 Bottoms 30 t - 250 7,500 6 Glass/broken glass 92 t 2,400 350 253,000 7 Plastic containers 18 t 10,000 2,000 216,000 8 Labels (wet) 50 t 30/1000 pcs 600 3,600,000
30,000 9 Cardboard / paper 35 t 5,000 - 175,000 10 Wood pallets 24 t 6,000 40 144,960 11 Plastic film 1.5 t 22,000 4,500 39,750 12 Industrial waste 104 t ? 800 83,200 13 Diatomaceous earth 45 t 8,000 930 401,850 14 Waste from maintenance,
greasy 200 kg ? 11 2,200
15 Contents of oil separator 3,200 kg ? 2.8 8,960 16 Waste oil 1,000 kg 50 2 52,000 17 Waste paints 50 kg 100 15 5,750 18 Fluorescent lamps 20 kg 120 12 2,640 19 Accumulators 25 kg 70 2.8 1,820 20 Waste gas, steam boiler 1,000,000 m³ - - -
Slides 1 – CP Basics
Reasons for an environmental team
Because there are many different departments/machines in a company, it is difficult to get the necessary overview and the detailed technological knowledge.
Because there are motivated and competent employees in a company.
Because as a TEAM – with a common goal – it is possible to work more efficiently than a lone ranger.
Gather people from differnet departments: production, maintenance, technology, purchasing, management, quality, accounting, research and development, environment, health and safety, legal branch, etc.
Slides 1 – CP Basics
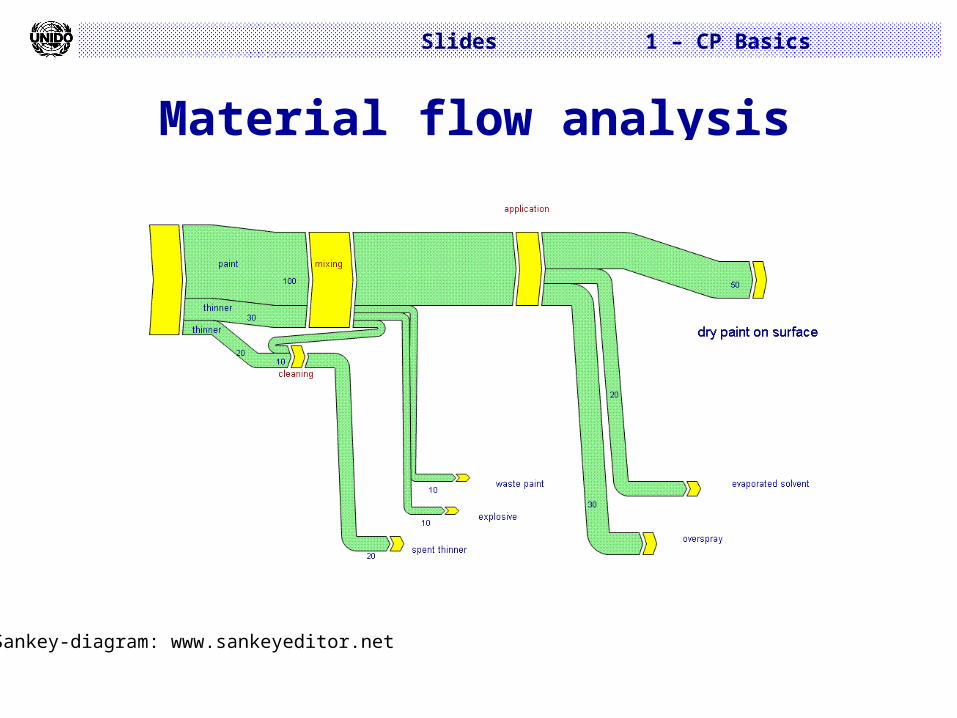
Material flow analysis
Sankey-diagram: www.sankeyeditor.net
Slides 1 – CP Basics
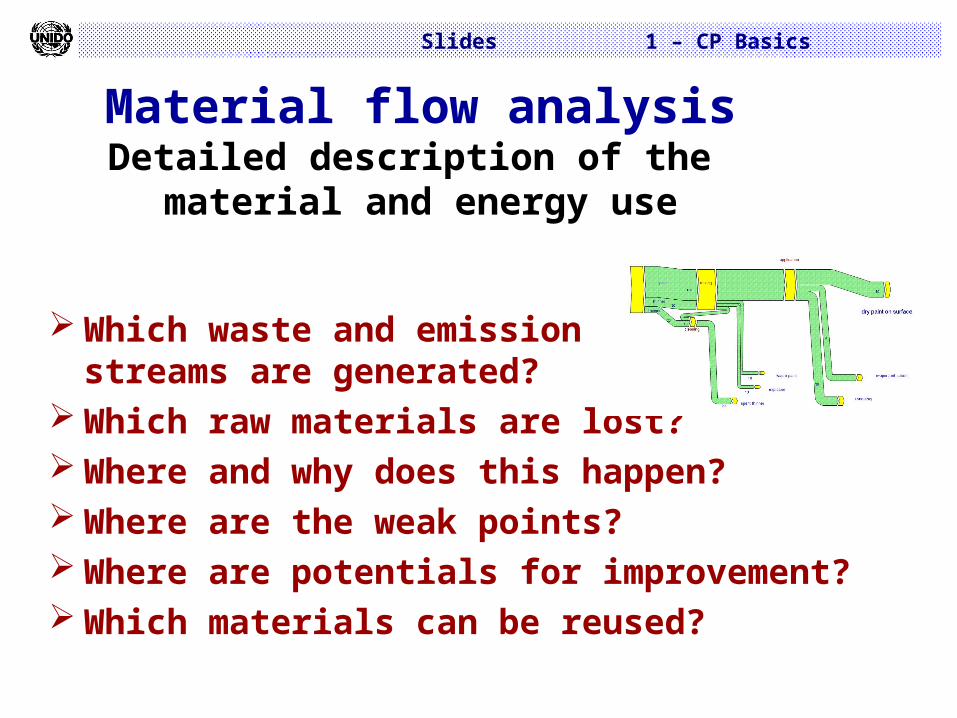
Material flow analysisDetailed description of the
material and energy use
Which waste and emission streams are generated?
Which raw materials are lost? Where and why does this happen? Where are the weak points? Where are potentials for improvement? Which materials can be reused?
Slides 1 – CP Basics
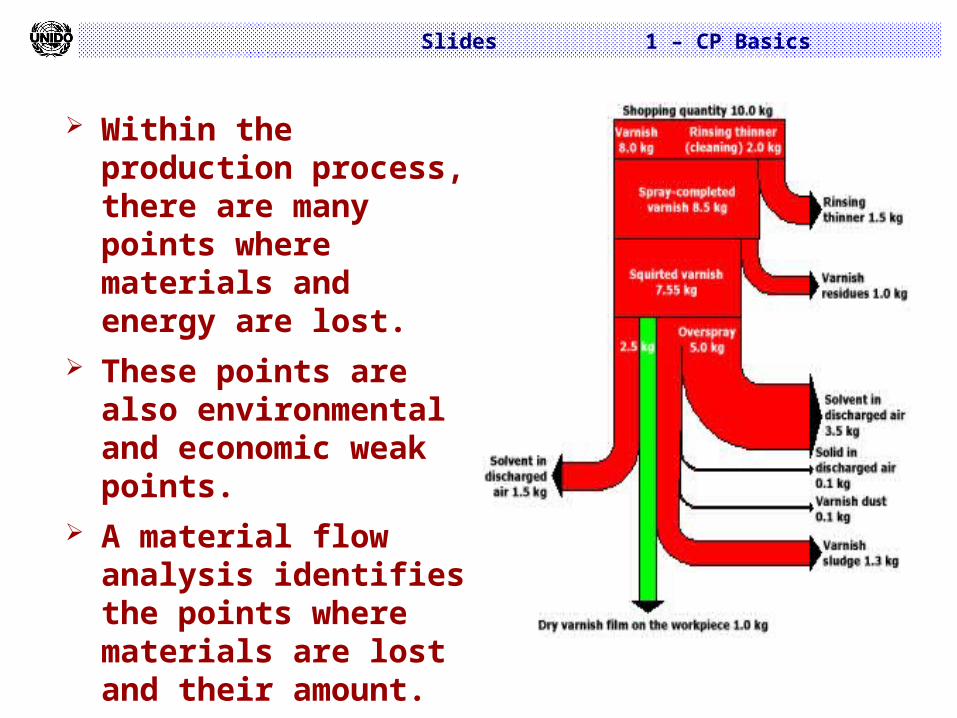
Within the production process, there are many points where materials and energy are lost.
These points are also environmental and economic weak points.
A material flowanalysis identifies the points where materials are lost and their amount.
Slides 1 – CP Basics
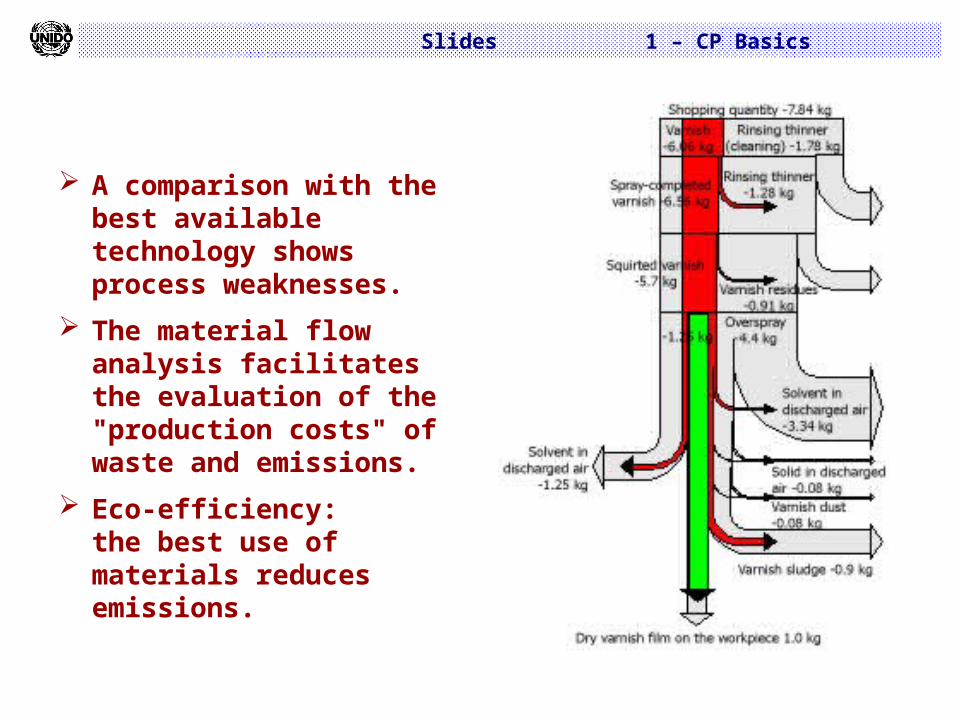
A comparison with the best available technology shows process weaknesses.
The material flow analysis facilitates the evaluation of the "production costs" of waste and emissions.
Eco-efficiency:the best use of materials reduces emissions.

Slides 1 – CP Basics
Strategies for cleaner production
Slides 1 – CP Basics
Product change
Substitute the productIncrease the product life-timeChange the materialsChange the product designUse recycled materialsAvoid critical components

Slides 1 – CP Basics
Good housekeeping Improve information Change dosage/concentration Increase the utilization of process capacities Check cleaning and maintenance period Foster standardization/automation Improve purchasing, storage and
distribution Carry out a material flow analysis

Slides 1 – CP Basics
Waste logisticsSeparation of waste and wastewater to Set up closed cycles Facilitate recovery and re-utilization Minimize quantities of hazardous waste Minimize disposal costs Minimize cleaning expenses
(wastewater, exhaust gases, etc.)
Slides 1 – CP Basics
Technological modification Substitute thermo-chemical processes by
mechanical alternatives Use countercurrent cascades instead of single-
static rinse techniques Manage separate waste and wastewater streams Improve process conditions Foster recovery and reuse of materials Increase life time of chemicals/materials Reduce the infiltration of impurities Ensure airtight sealing of equipment
Slides 1 – CP Basics
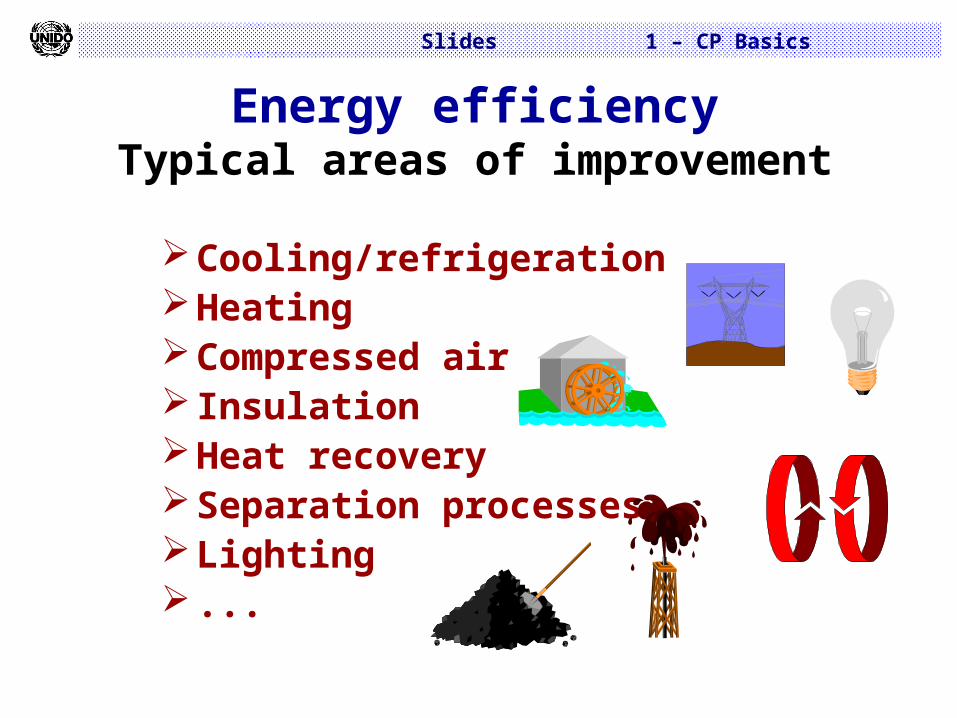
Energy efficiencyTypical areas of improvement
Cooling/refrigerationHeatingCompressed air InsulationHeat recoverySeparation processesLighting ...
Slides 1 – CP Basics
Internal recycling
Reuse materials (solvents, etc.) Reuse materials for different purposes
(paper, solvents for lower-quality use, e.g. pre-cleaning, etc.)
Close internal loops (water) Use returnable systems (packaging
materials) Reclaim materials with high value
Slides 1 – CP Basics
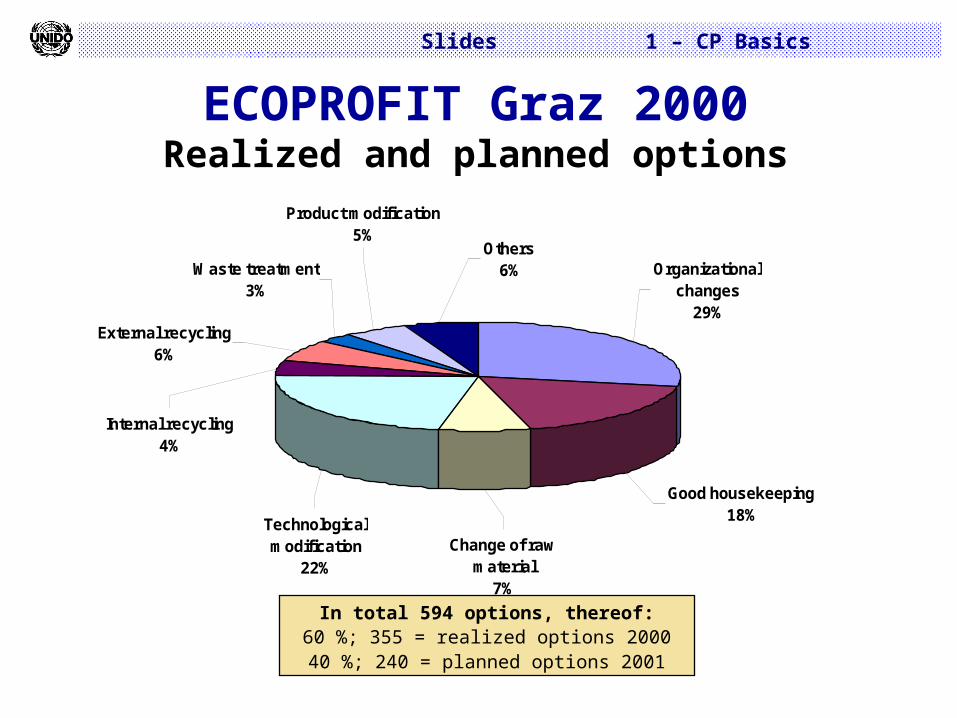
Organizational changes
29%
Good housekeeping18%
Change of raw material
7%
Technological modification
22%
Others6%
Product modification5%
Waste treatment3%
External recycling6%
Internal recycling4%
ECOPROFIT Graz 2000Realized and planned options
In total 594 options, thereof:60 %; 355 = realized options 200040 %; 240 = planned options 2001

Slides 1 – CP Basics
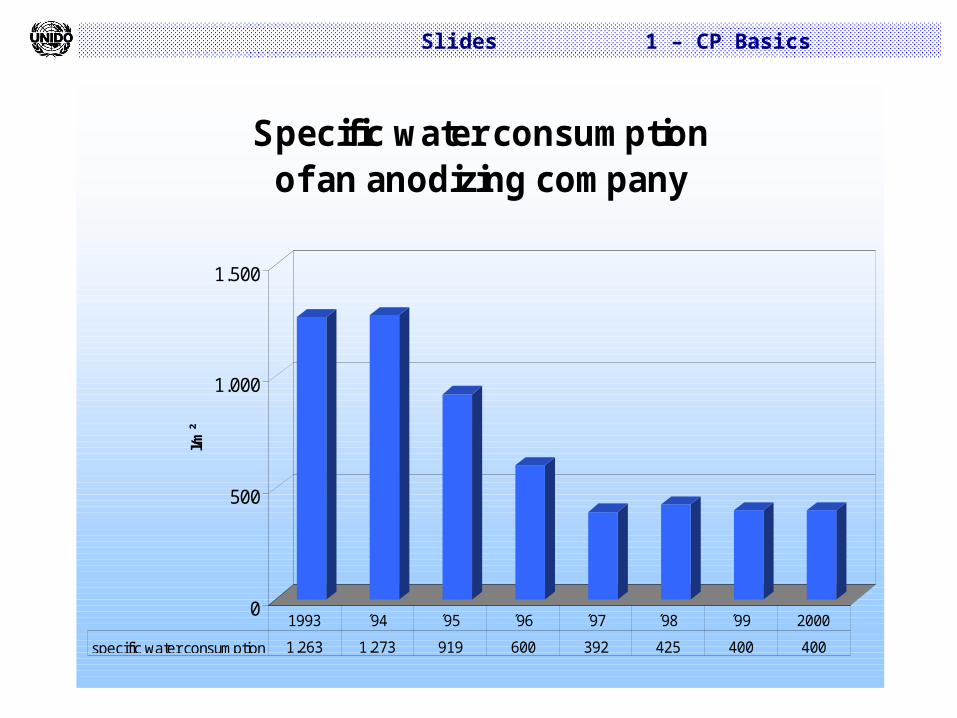
Anodizing company Use of spray rinses Reconstruction of water
pipes Longer drag-out time Daily check Reduction in water
consumption by 46% (14,000 m³)
Slides 1 – CP Basics
0
500
1.000
1.500
l/m²
Specific water consumptionof an anodizing company
specific water consumption 1.263 1.273 919 600 392 425 400 400
1993 ´94 ´95 ´96 ´97 ´98 ´99 2000
Slides 1 – CP Basics
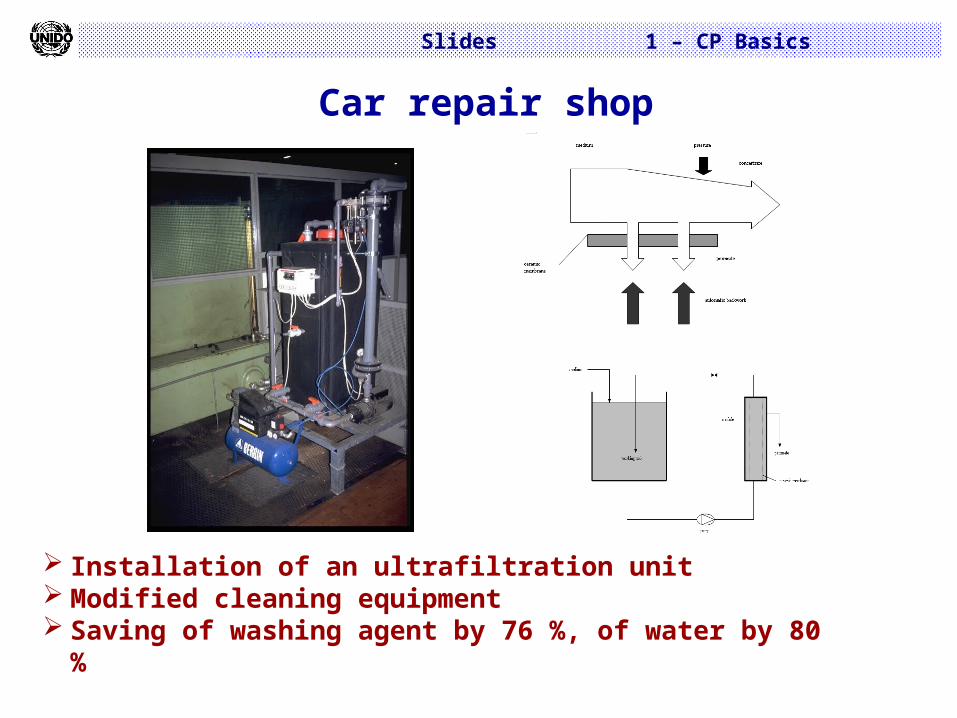
Car repair shop
Installation of an ultrafiltration unit Modified cleaning equipment Saving of washing agent by 76 %, of water by 80
%