cleveland and cuyahoga county, ohio - vacant...
TRANSCRIPT

May 2014
CLEVELAND AND CUYAHOGA COUNTY, OHIOA Resilient Region’s Responses to Reclaiming Vacant Properties

1
CLEVELAND AND CUYAHOGA COUNTY, OHIO A RESILIENT REGION’S RESPONSES TO RECLAIMING VACANT PROPERTIES
executive summaryThis case study is one of three conducted by Virginia Tech’s Vacant Property Research Network (VPRN), with support from the Ford Foundation, to document resilient approaches to reclaiming vacant properties in three cities: Philadelphia, Cleveland, and Baltimore. These studies identify policy
the strategies and initiatives across these three pioneering cities, the case studies bring to life the elements of a holistic and adaptively resilient policy system for vacant property reclamation that can assist practitioners, policymakers, and researchers in regenerating distressed communities.
Resilience
change, when resilience is discussed in the context of urban policies, its principles extend to the characteristics that have always made for healthy dynamics in cities, notably the ability to adapt to changing circumstances, and to maintain or return to equilibrium (a “new normal”) even after major demographic or economic change. Author Andrew Zolli articulated “a good working
… [t]he ability to maintain core purpose, with integrity, under the widest variety of circumstances. More broadly, it’s the ability to recover, persist or even thrive amid disruption…..Among other things, resilient systems sense and respond to their own state and the state of the world around them, compensate or dynamically reorganize themselves in the face of novel shocks, decouple themselves from other fragile systems when
1
The VPRN case study series examines contemporary approaches to regeneration through the lens of adaptive resilience, moving beyond conventional notions of a single equilibrium. As Professor Margaret Cowell points out in a February 2013 article in Cities, the characteristic of adaptive resilience in post-industrial cities such as Cleveland, Baltimore, and Philadelphia is focused not on “bouncing back” to previous economic models or levels of population, but instead on creative ways to take new leadership actions and to learn and adapt over time.2 Characteristics of adaptive resilience include the following:
• Adaptability to local circumstances, including sensitivity to neighborhoods’ unique and diverse histories, markets, conditions, opportunities, resident leadership, and needs.
• Responsiveness to acute and chronic economic changes and market dynamics at the neighborhood, city, regional, national, and global scales.
• High degree of collaboration, transparency, and in fact permeability—not only transparency of policies to the public, but an enduring collaborative network that
and can adapt to neighborhood conditions, political transitions, and institutional capacity.
• Flexible, readily accessible, and understandable knowledge base that can be frequently updated and used for a wide variety of purposes, both immediate and long-term.
•
change and challenges.

CLEVELAND AND CUYAHOGA COUNTY, OHIO A RESILIENT REGION’S RESPONSES TO RECLAIMING VACANT PROPERTIES
2
A Resilient Policy Model for Reclaiming Vacant Properties
The framework for understanding the current and best practices in vacant property policy is presented in the Resilient Vacant Property Policy Model (Figure 1). Three aspects of a cyclical, mutually reinforcing process can help cities match policy interventions to neighborhood type, and help communities develop programs and initiatives that respond to the dynamic, changing
within our policy model illustrate a dynamic and complex process. This process focuses both on policy reform and program action/implementation, which are ideally responsive to the different trajectories of neighborhoods and markets. The collective network also evolves but requires a forum or vehicle for regular action, a holistic vision, and consistent communication and leadership. Together these elements form a more resilient system for reclaiming vacant properties that can
transformation, and long-standing cross-sector collaboration.
VACANT PROPERTY STRATEGIC POLICY PROCESS
REUSE, LONG-TERM PLANNING & REDEVELOPMENT
POLICY REFORM PROGRAM ACTIONS
COLLABORATIVE NETWORK
INFORMATION SYSTEMS | DATA DRIVEN ACTIONS
PREVENTION & STABILIZATION
REHAB, CODE ENFORCEMENT, HOUSING COURT
ACQUISITION & VACANT PROPERTY MANAGEMENT
LAND BANK, TAX FORECLOSURE
NEIGHBORHOOD TYPOLOGY
REBUILDING DISTRESSED TRANSITIONAL STABLE SUSTAINING
OUTCOME & COLLECTIVE IMPACT
REASSESS AND RECALIBRATE
POLICY REFORM ADOPTED
PROPERTY & NEIGHBORHOOD STABILIZATION & REVITALIZATION
CROSS-SECTOR COLLABORATION
RESILIENT VACANT PROPERTY STRATEGIES
Metropolitan Institute at Virginia Tech
MODEL VACANT PROPERTY POLICY SYSTEM
FIGURE 1. Resilient Vacant Property Policy Model
Source: Metropolitan Institute at Virginia Tech.
increasing inventories of vacant properties (such as Cleveland or Detroit) to those with vacancy and abandonment concentrated in a few neighborhoods (such as Atlanta or Las Vegas). The mix within the model’s policy framework would vary from city to city depending on market conditions, neighborhood characteristics, institutional capacity, and political and civic leadership. Public
and assessment tool to identify comparative strengths and weaknesses of existing efforts, as well as to help them identify and adapt model practices from other communities. By using this model to adopt such a systems approach, communities can become more resilient in addressing future drivers of property abandonment and neighborhood decline. The policy model contains three interdependent components of a resilient system for reclaiming vacant properties:
3
CLEVELAND AND CUYAHOGA COUNTY, OHIO A RESILIENT REGION’S RESPONSES TO RECLAIMING VACANT PROPERTIES
1. leaders that foster coordination and problem solving among levels of government and
institutional and individual glue that supports actions on vacant property policy reforms
and political support for making vacant property reclamation a top policy priority, and then establish coordinating councils, working groups, and campaigns to implement the list of policy and programmatic prescriptions.
2. Information systems and data-driven interventions that more fully understand the complexities and spatial dynamics of vacant property problems by compiling, tracking, and disseminating a wide range of relevant data on vacant property drivers and impacts. Given that most real property data are owned and managed
step in to aggregate, coordinate, and disseminate vacant property information across
programs more strategically, based on current market and vacant property data. These information systems can also provide reports and analysis that support many of the comprehensive policy reforms (e.g., revamping code enforcement departments or chartering a land bank).
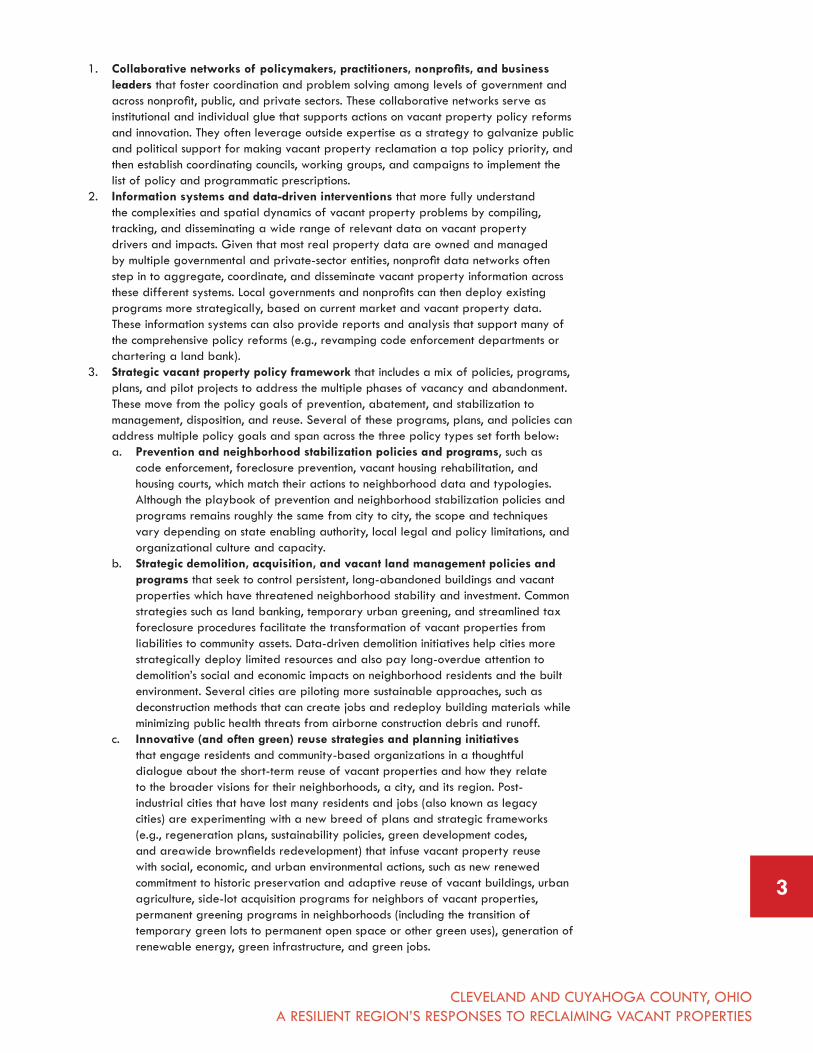
3. Strategic vacant property policy framework that includes a mix of policies, programs, plans, and pilot projects to address the multiple phases of vacancy and abandonment.
management, disposition, and reuse. Several of these programs, plans, and policies can address multiple policy goals and span across the three policy types set forth below: a. Prevention and neighborhood stabilization policies and programs, such as
code enforcement, foreclosure prevention, vacant housing rehabilitation, and housing courts, which match their actions to neighborhood data and typologies.
programs remains roughly the same from city to city, the scope and techniques vary depending on state enabling authority, local legal and policy limitations, and
b. programs that seek to control persistent, long-abandoned buildings and vacant properties which have threatened neighborhood stability and investment. Common strategies such as land banking, temporary urban greening, and streamlined tax foreclosure procedures facilitate the transformation of vacant properties from liabilities to community assets. Data-driven demolition initiatives help cities more strategically deploy limited resources and also pay long-overdue attention to demolition’s social and economic impacts on neighborhood residents and the built environment. Several cities are piloting more sustainable approaches, such as deconstruction methods that can create jobs and redeploy building materials while
c.
dialogue about the short-term reuse of vacant properties and how they relate to the broader visions for their neighborhoods, a city, and its region. Post-industrial cities that have lost many residents and jobs (also known as legacy cities) are experimenting with a new breed of plans and strategic frameworks (e.g., regeneration plans, sustainability policies, green development codes,
with social, economic, and urban environmental actions, such as new renewed commitment to historic preservation and adaptive reuse of vacant buildings, urban agriculture, side-lot acquisition programs for neighbors of vacant properties, permanent greening programs in neighborhoods (including the transition of temporary green lots to permanent open space or other green uses), generation of renewable energy, green infrastructure, and green jobs.

CLEVELAND AND CUYAHOGA COUNTY, OHIO A RESILIENT REGION’S RESPONSES TO RECLAIMING VACANT PROPERTIES
4
Cleveland:
of the nation’s most powerful waves of property abandonment. Beginning in the city’s boom era, Cuyahoga County became a region rich in suburban residential communities (Figure 2). The region’s trajectory since then illustrates the plight not only of older industrial cities but also of the suburbs around them. Since the 1960s, the loss of manufacturing jobs and major industries, compounded by longstanding racial tensions and increasingly poor services and schools, led to
declined 5 to 10 percent in population between 1970 and 2010, although one suburb—East Cleveland—experienced a stunning 34 percent loss during that time.3 Meanwhile, the region’s surrounding counties witnessed dramatic population increases.
Bay Village City
East Cleveland
Cleveland Heights
Mayfield
Bratenahl
Fairview Park
Chagrin Falls
(village)
Bentleyville
GlenwillowOakwood
Warrensville Heights
North Randall
Highland Hills
Beachwood
Woodmere
University Heights
BedfordHeights
Cuyahoga Heights
Newburg Heights
BrooklynHeights
Linndale
Chagrin Falls
(township)
Cleveland
Solon
Parma
North RoyaltonStrongsville
Brecksville
Euclid
Westlake
North Olmsted
Gates Mills
Broadview Heights
Brook Park
BereaWalton
Hills
Pepper Pike
Garfield Heights
Valley View
Hunting Valley
Shaker Heights
Moreland Hills
South Euclid
Seven Hills
Rocky River
Middleburg Heights
Bedford
Maple Heights
Independence
Parma Heights
Highland Heights
Lakewood
Orange
Brooklyn
Mayfield HeightsLyndhurst
Richmond Heights
0 5 10
Miles
Cuyahoga County2010 Census Boundaries
2010 Places and MCDs
Olmsted Falls
Olmsted (township)
Source: Northeast Ohio Data Collaborative

5
CLEVELAND AND CUYAHOGA COUNTY, OHIO A RESILIENT REGION’S RESPONSES TO RECLAIMING VACANT PROPERTIES
Year
% change
since
% change
since
% change
since
% change
since
% change
since
Total % change
Ohio 10,652,017 9.7 10,797,630 1.4 10,847,115 0.5 11,353,140 4.7 11,536,504 1.6 18.9
Cleveland-Elyria-Mentor (MSA)***
3,098,048 9.6 2,938,627 -5.1 2,859,644 -2.7 2,945,832 3.0 2,881,937 -2.2 2.0
Cuyahoga County 1,721,300 4.5 1,498,400 -12.9 1,412,140 -5.8 1,393,978 -1.3 1,280,122 -8.2 -22.3
Cleveland 750,903 -14.3 573,822 -23.6 505,615 -11.9 478,403 -5.4 396,815 -17.1 -54.7
Sources: Richard L. Forstall, “Population of Counties by Decennial Census,” U.S. Bureau of the Census.
At http://www.census.gov/population/cencounts/oh190090.txt. Accessed 31 Jan. 2014.
Dealer, Mar. 9, 2011. At . * % = percent change in population since previous decade
** % = percent change in population from 1960 and 2010 numbers
*** Region = 8-county metro area (Ashtabula, Cuyahoga, Geauga, Lake, Lorain, Medina, Portage and Summit counties)
Year % % % % %
Bedford 15,223 - 17,552 15.3 15,056 -14.2 14,823 -1.6 14,214 -4.1 13,078 -8.0 -14.1
Bedford Heights 5,275 - 13,063 147.6 13,214 1.2 12,131 -8.2 11,375 -6.2 10,752 -5.5 103.8
Berea 16,592 - 22,396 35.0 19,567 -12.6 19,047 -2.7 18,970 -0.4 17,841 -6.0 7.5
Brooklyn 10,733 - 13,142 22.4 12,342 -6.1 11,706 -5.2 11,586 -1.0 11,169 -3.6 4.1
Brook Park 12,856 - 30,774 139.4 26,195 -14.9 22,798 -13.0 21,218 -6.9 19,212 -9.5 49.4
Cleveland Heights 61,813 - 60,767 -1.7 56,438 -7.1 54,052 -4.2 49,958 -7.6 46,114 -7.7 -25.4
East Cleveland 37,991 - 39,600 4.2 36,957 -6.7 33,096 -10.5 27,217 -17.8 17,867 -34.4 -53.0
Euclid 62,998 - 71,552 13.6 59,999 -16.2 54,875 -8.5 52,717 -3.9 48,936 -7.2 -22.3
Fairview Park 14,624 - 21,681 48.3 19,311 -10.9 18,028 -6.6 17,572 -2.5 16,831 -4.2 15.1
38,455 - 41,417 7.7 34,938 -15.6 31,739 -9.2 30,734 -3.2 28,843 -6.2 -25.0
Lakewood 66,154 - 70,173 6.1 61,963 -11.7 59,718 -3.6 56,646 -5.1 52,131 -8.0 -21.2
Maple Heights 31,667 - 34,093 7.7 29,735 -12.8 27,089 -8.9 26,156 -3.4 23,142 -11.5 -26.9
Parma 82,845 - 100,216 21.0 92,548 -7.7 87,876 -5.1 85,655 -2.5 81,627 -4.7 -1.5
Parma Heights 18,100 - 27,192 50.2 23,112 -15.0 21,448 -7.2 21,659 1.0 20,703 -4.4 14.4
Rocky River*** 18,097 - 22,958 26.9 21,084 -8.2 20,410 -3.2 20,735 1.6 20,209 -2.5 11.7
Shaker Heights 36,460 - 36,306 -0.4 32,487 -10.5 30,831 -5.1 29,405 -4.6 28,417 -3.4 -22.1
South Euclid 27,569 - 29,579 7.3 25,713 -13.1 23,866 -7.2 23,537 -1.4 22,247 -5.5 -19.3
University Heights 16,641 - 17,055 2.5 15,401 -9.7 14,790 -4.0 14,146 -4.4 13,592 -3.9 -18.3
Warrenville Heights 10,609 - 18,925 78.4 16,565 -12.5 15,882 -4.1 15,109 -4.9 13,526 -10.5 27.5
Sources: 1960/1970 http://www2.census.gov/prod2/decennial/documents/1970a_oh1-01.pdf
1980 http://www2.census.gov/prod2/decennial/documents/1980/1980censusofpopu80137un_bw.pdf
http://neocando.case.edu/cando/index.jsp?tPage=nei_snapshots* % = percent change in population since previous decade
** % = percent change in population from 1960 and 2010 numbers
*** Not in First Suburbs Consortium, but population over 5,000 in 1960 and directly borders the City of Cleveland.

CLEVELAND AND CUYAHOGA COUNTY, OHIO A RESILIENT REGION’S RESPONSES TO RECLAIMING VACANT PROPERTIES
From 2005 to 2010, the Great Recession and a tsunami of mortgage foreclosures aggravated this population loss and outmigration. With the City of Cleveland as the epicenter, the housing market decline and foreclosure shockwaves have now spread to many of the adjacent suburban cities, transforming what was once just a municipal problem into a regional one. The cumulative weight of these socio-economic disasters has left the region with thousands of vacant and abandoned properties.
Cleveland’s decline mirrors the dynamics of cities confronting the challenges of rebuilding from natural disasters, such as hurricanes and tornados. Instead of an acute cause, chronic economic forces have driven Cleveland’s steady population losses. Yet the pace and concentration of vacancy and abandonment are uneven throughout the city and the region. Some of Cleveland’s neighborhoods have remained stable and a few have begun to thrive. First-tier suburban cities such as Shaker Heights and Cleveland Heights, once immune to vacant housing, have caught the contagion from the foreclosure crisis, although they remain stable overall.
Cleveland’s vacant property story offers a new context for exploring the resiliency of communities.
as they adapt to the challenges created by the vacant property and foreclosure crisis. Most
more than a decade to devise an impressive menu of policy innovations and create a systematic, shared focus on every phase of the vacant property policy cycle, from vacancy prevention
community-based visions for the sustainable reuse of vacant properties. The region is currently eight years into these comprehensive efforts. As with any long-term effort in complex regions, the work to regenerate Cleveland and reclaim vacant properties takes place within a dynamic environment that is affected by changes in real estate values, economic trends, shifts in the status
of principal author Joseph Schilling, who worked directly with many of the local policymakers, practitioners, and community leaders over the past ten years as they engaged with key questions and approaches to reclaiming vacant properties. Since co-authoring the National Vacant
meetings and strategic planning sessions, made numerous local and national presentations about Cleveland’s efforts, led a study tour of graduate students, and served as the lead investigator and interviewer for this case study.
Cleveland’s efforts highlight the value of ongoing networks of people who collaborate across sectors and jurisdictional boundaries. The essence of the Cleveland case is not so much its “back story” as an industrial city that has continued to cope with population loss, but rather its “middle”
groups—supported by key local universities and foundations—shifted the community mindset from reactive interventions to dynamic, enduring reforms of state and local vacant property policies and programs. These individuals chose to collectively bring discrete and sometimes disconnected policy, planning, and program elements into a more cohesive, interconnected, and resilient system for reclaiming vacant properties. As the region’s “policy innovators,” they chose to go beyond
Abandoned Properties Action Council (VAPAC) to carry out this collaborative work.

CLEVELAND AND CUYAHOGA COUNTY, OHIO A RESILIENT REGION’S RESPONSES TO RECLAIMING VACANT PROPERTIES
Notes
1. Richard Florida, “The Rush to Resilience: ‘We Don’t Have Decades until the Next Sandy,’” Atlantic Cities, Place Matters, 9 Nov. 2012, Accessed 3 Mar. 2013, http://www.theatlanticcities.com/jobs-and-economy/2012/11/building-
.
2. Margaret Cowell, “Bounce Back or Move On: Regional resilience and economic development planning,“ Cities, Vol. 30 (February 2013): 212-222. Elsevier. DOI at http://dx.doi.org/10.1016/j.cities.2012.04.001.
3. U.S. Bureau of the Census 1960/1970 Decennial Census, at http://www2.census.gov/prod2/decennial/documents/1970a_oh1-01.pdf http://www2.census.gov/prod2/decennial/documents/1980/1980censusofpopu80137un_bw.pdf http://NEO CANDO.case.edu/cando/index.jsp?tPage=nei_snapshots. All accessed 3 September 2013.