click to edit master title style click to edit master subtitle style o pen s ociety f oundation...
TRANSCRIPT
Click to edit Master title style
Click to edit Master subtitle style
OPEN SOCIETY FOUNDATIONROMÂNIA
by The Gallup Organization Romania
GENDER GENDER
BAROMETERBAROMETER
ROMANIAROMANIAAugust 2000August 2000

“Emancipation and development” this is the title of a new program of Open Society Foundation to be carried out in 2000-2001, with the main purpose of designing gender centered public policies. So far such topics have sometimes been the concern of non-governmental organizations, and I have even seldom heard political men or women, journalists tackling or at least discussing such issues. Nobody questioned the Romanian society about the role that women and men should have in Romanian life, about the relationships between them, or their everyday life.
The idea of such a poll is not novel. It was advocated by “AnA Society for Feminist Analyses” and by the “Women Program” of the Foundation. But designing gender-centered public policies is a process that cannot be pursued without considering the way public opinion think about it, the priorities it envisages. Therefore, we believed that it was high time for the Gender Barometer.
Mihaela Miroiu, Manuela Stănculescu, Ionica Berevoiescu and myself have been the members of the coordinating team who was engaged in designing the present poll, from choosing the topics, finalizing the question sets, pre-testing the questions, to interpreting the collected data. It is our pleasure to thank to all who have helped us along the project, supporting us with invaluable ideas, time and their expertise: Alfred Bulai, Laura Grumberg, Valentina Marinescu, Dumitru Sandu.
Due to the limitations of the traditionally printed formula, our work represents only a selection of information and data collected for the interviews. The complete database of the poll is to be found on the web page of Open Society Foundation www.osf.ro.
Thanks are due to all of those invited by the Foundation to take part at the brainstorming organized before launching the idea of the Gender Barometer: Mircea Cărtărescu, Laura Grunberg, Anca Jugaru, Dina Loghin, Cristina Mihai, Mihaela Miroiu, Doina Ştefănescu, Marina Roman, Roxana Teşiu, Cristian Vlădescu. We express our belief that their outstanding commitment in understanding and promoting women’s rights will go on as well as their collaboration with Open Society Foundation. Our fruitful collaboration with The Gallup Organization Romania has been of paramount importance in carrying out the survey, and we are grateful to director Alina Şerbănică for her professional commitment in this project.
Renate Weber
Chair of the National Board Open Society Foundation - Romania Program Coordinator: Oana Cinca Tel. (40) -1 - 212 54 30, 312 86 36, 312 70 52; Fax: (40) - 1 - 312 70 53 E-mail: [email protected]
Gender Barometer - August 20002
3
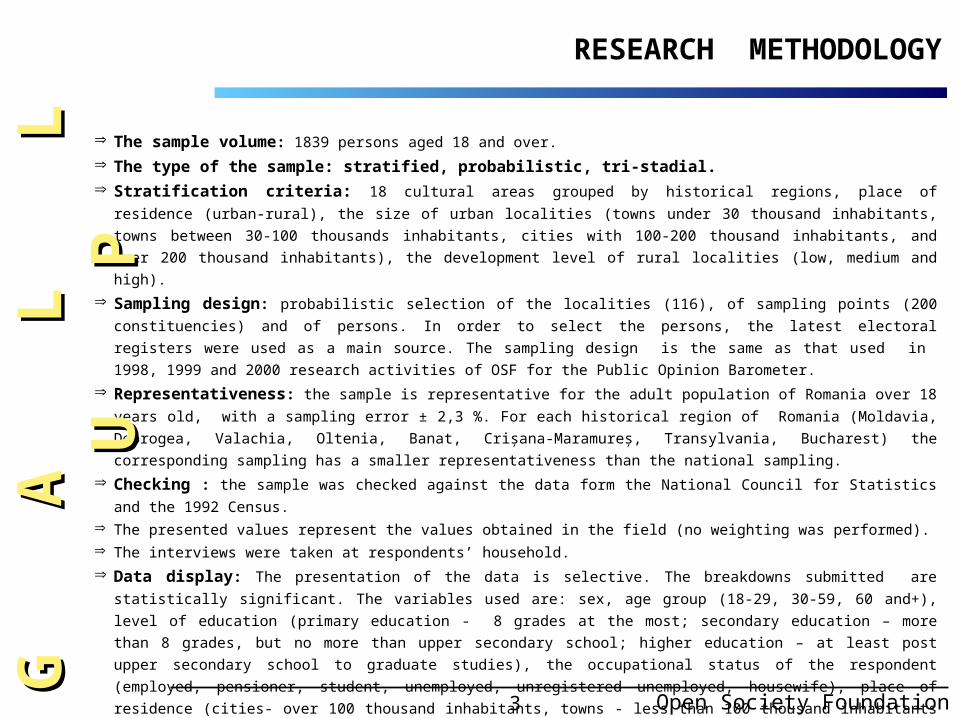
The sample volume: 1839 persons aged 18 and over.
The type of the sample: stratified, probabilistic, tri-stadial. Stratification criteria: 18 cultural areas grouped by historical regions, place of residence (urban-rural), the size of urban
localities (towns under 30 thousand inhabitants, towns between 30-100 thousands inhabitants, cities with 100-200 thousand
inhabitants, and over 200 thousand inhabitants), the development level of rural localities (low, medium and high).
Sampling design: probabilistic selection of the localities (116), of sampling points (200 constituencies) and of persons. In
order to select the persons, the latest electoral registers were used as a main source. The sampling design is the same as
that used in 1998, 1999 and 2000 research activities of OSF for the Public Opinion Barometer.
Representativeness: the sample is representative for the adult population of Romania over 18 years old, with a sampling
error ± 2,3 %. For each historical region of Romania (Moldavia, Dobrogea, Valachia, Oltenia, Banat, Crişana-Maramureş,
Transylvania, Bucharest) the corresponding sampling has a smaller representativeness than the national sampling.
Checking : the sample was checked against the data form the National Council for Statistics and the 1992 Census.
The presented values represent the values obtained in the field (no weighting was performed). The interviews were taken at respondents’ household.
Data display: The presentation of the data is selective. The breakdowns submitted are statistically significant. The variables
used are: sex, age group (18-29, 30-59, 60 and+), level of education (primary education - 8 grades at the most; secondary
education – more than 8 grades, but no more than upper secondary school; higher education – at least post upper secondary
school to graduate studies), the occupational status of the respondent (employed, pensioner, student, unemployed,
unregistered unemployed, housewife), place of residence (cities- over 100 thousand inhabitants, towns - less than 100
thousand inhabitants and commune/villages) and historical region. For the complete list of questions and for data conveying to
more elaborated analysis, please access the complete database in the web page of Open Society Foundation www.osf.ro.
Survey timetable: 17 July - 4 August 2000.
RESEARCH METHODOLOGYG
A
G
A
L
L
U
L L
U
PP
Open Society Foundation Romania

4
CUPRINS
Gender Barometer - August 2000
R O
R
O
M
Â
N
I
M Â
N
I
AA1. THE GENDER IMAGE
1.1 Values – The gender Image................................ 5 1.2 Fear................................................................................................................... 43
1.3 Women compared to men .......................................................................... 46
2. PRIVATE LIFE
2.1 Successful marriage 48
2.2 Domestic work............................................................................... 58 2.3 Duties of household’s members...... 62
2.4 Single mothers............................................................................. 73 2.5 Children / raising children 78
2.6 Leisure ................................................................................................................ 90
3. VIOLENCE 3.1 Prostitution........................................................................................... 99
3.2 Sexual harrasment.................................................................... 108
3.3 Domestic violence against spouses......................................... 110 3.4 Other forms of domestic violence / deviant behaviour..................................... 117
4. PUBLIC LIFE 4.1 Equality of rights ................................................................................................ 120
4.2 Women and leadership / executive positions 130
4.3 To whom one discusses community issues............ 156 4.4 Involvment in community life................................... 158
4.5 Power relations .......................................................................... ........................... 160
5. GENDER AND ECONOMY
5.1 Jobs and unemployment................ 167
5.2 The economics of household................................................................ 170
5
59%
69%
76%
63%
66%
56%
64%
55%
36%
24%
17%
33%
29%
28%
39%
7%
7%
16%
33%
6%
3%
5%
4%
5%
0% 20% 40% 60% 80% 100%
Moldavia
Valachia
Oltenia
Dobrogea
Transylvania
Crişana-Maramureş
Banat
Bucharest
Yes No DK/DA
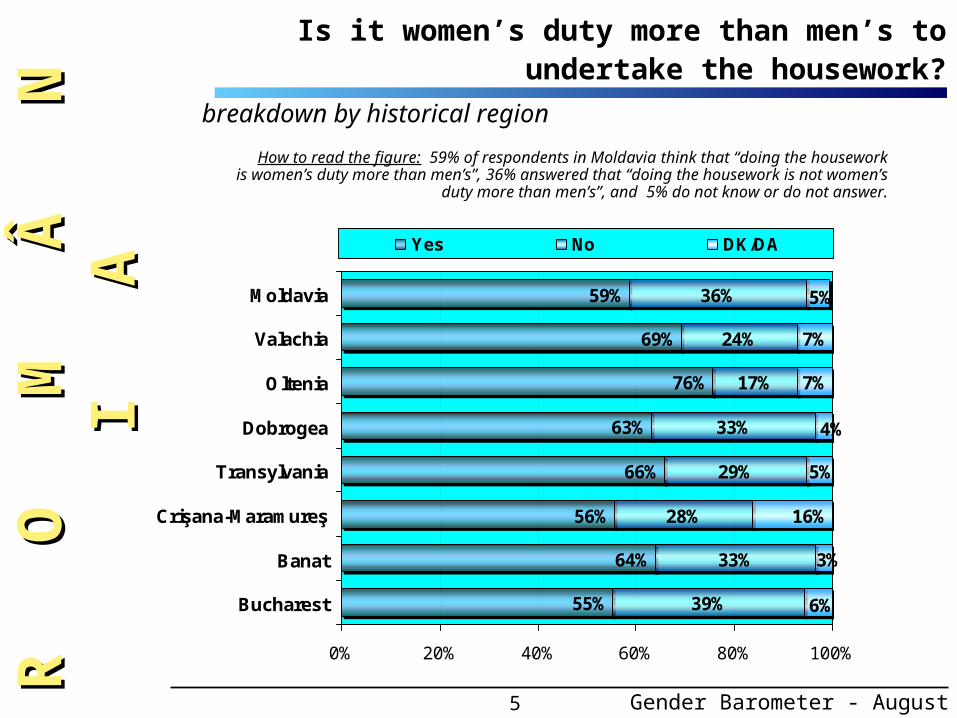
breakdown by historical region
How to read the figure: 59% of respondents in Moldavia think that “doing the houseworkis women’s duty more than men’s”, 36% answered that “doing the housework is not women’s
duty more than men’s”, and 5% do not know or do not answer.
Is it women’s duty more than men’s to undertake the housework?
R O
R
O
M
Â
N
I
M Â
N
I
AA
Gender Barometer - August 2000

6
Is it women’s duty more than men’s to undertake the housework?
No30%
DK/DA7%
Yes63%
Open Society Foundation
G A
G
A
L
L
U
L L
U
PP
7
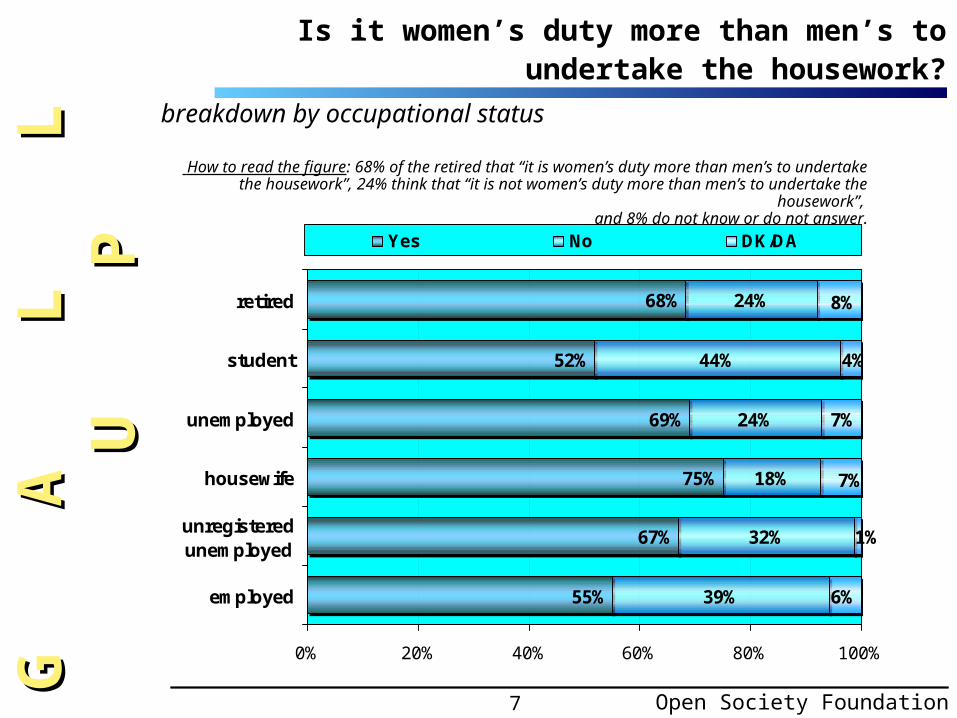
Is it women’s duty more than men’s to undertake the housework?
breakdown by occupational status
68%
52%
69%
75%
67%
55%
24%
44%
24%
18%
32%
39%
7%
6%
4%
1%
7%
8%
0% 20% 40% 60% 80% 100%
retired
student
unemployed
housewife
unregisteredunemployed
employed
Yes No DK/DA
How to read the figure: 68% of the retired that “it is women’s duty more than men’s to undertake the housework”, 24% think that “it is not women’s duty more than men’s to undertake the housework”,
and 8% do not know or do not answer.
Open Society Foundation
G A
G
A
L
L
U
L L
U
PP
8
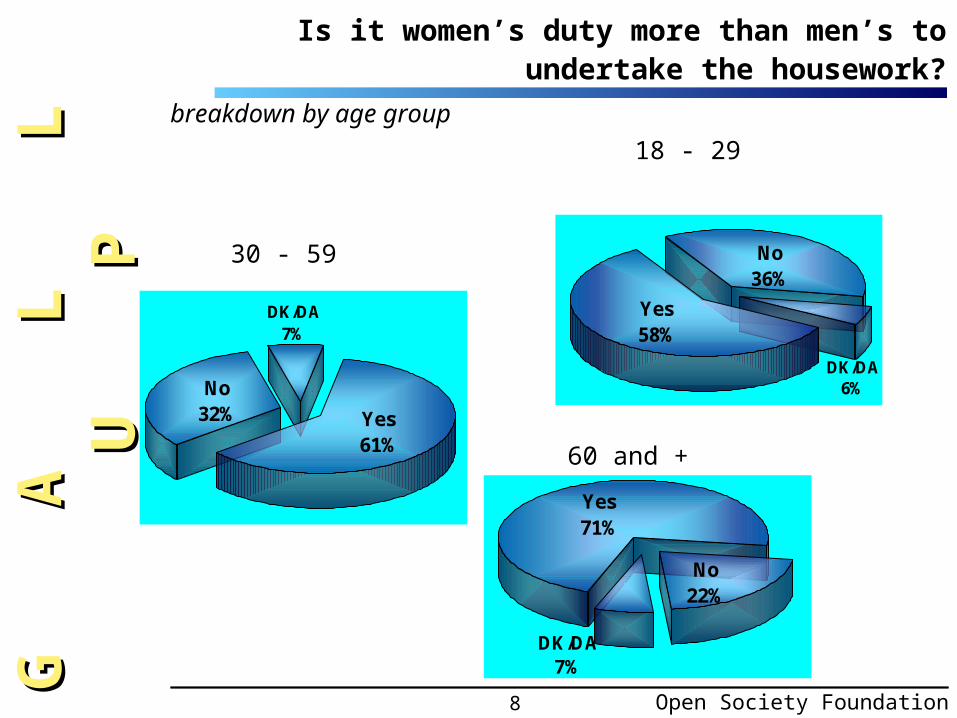
breakdown by age group
18 - 29
30 - 59
60 and +
Is it women’s duty more than men’s to undertake the housework?
No22%
DK/DA7%
Yes71%
No36%
DK/DA6%
Yes58%
No32%
DK/DA7%
Yes61%
Open Society Foundation
G A
G
A
L
L
U
L L
U
PP
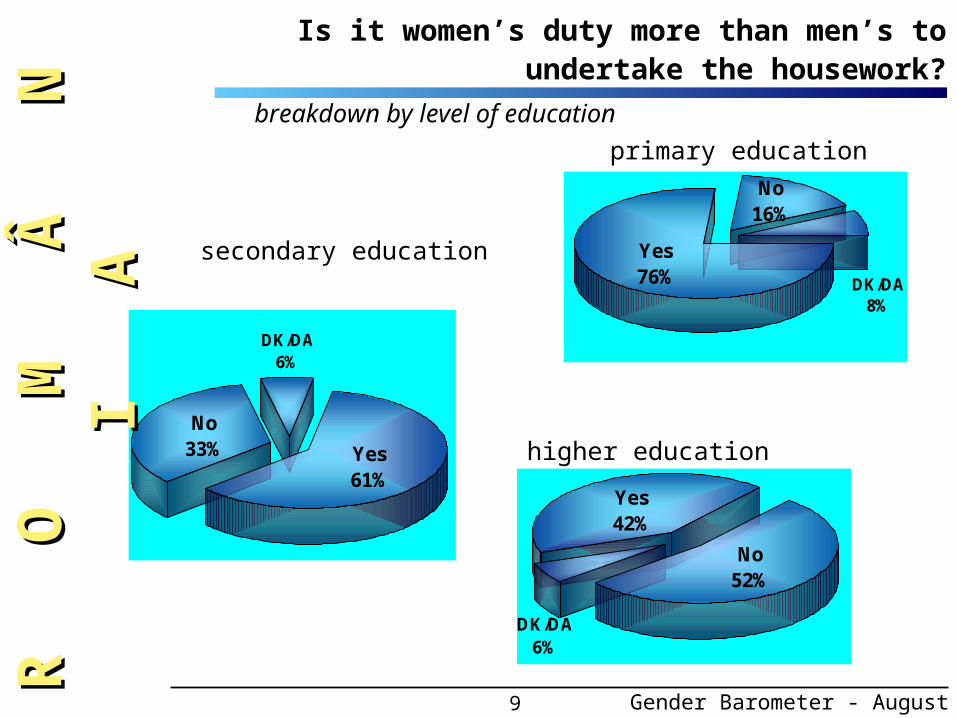
9
Yes42%
DK/DA6%
No52%
No33%
DK/DA6%
Yes61%
primary education
secondary education
higher education
No16%
DK/DA8%
Yes76%
Is it women’s duty more than men’s to undertake the housework?
breakdown by level of education
R O
R
O
M
Â
N
I
M Â
N
I
AA
Gender Barometer - August 2000

10
Yes72%
DK/DA7%
No21%
No33%
DK/DA7%
Yes60%
city
town
commune / village
No40%
DK/DA6%
Yes54%
breakdown by place of residence
R O
R
O
M
Â
N
I
M Â
N
I
AA
Is it women’s duty more than men’s to undertake the housework?
Gender Barometer - August 2000

11
Is it men’s duty more than women’s to be the main breadwinners in the household?
No23%DK/DA
7%
Yes70%
Open Society Foundation
G A
G
A
L
L
U
L L
U
PP
12
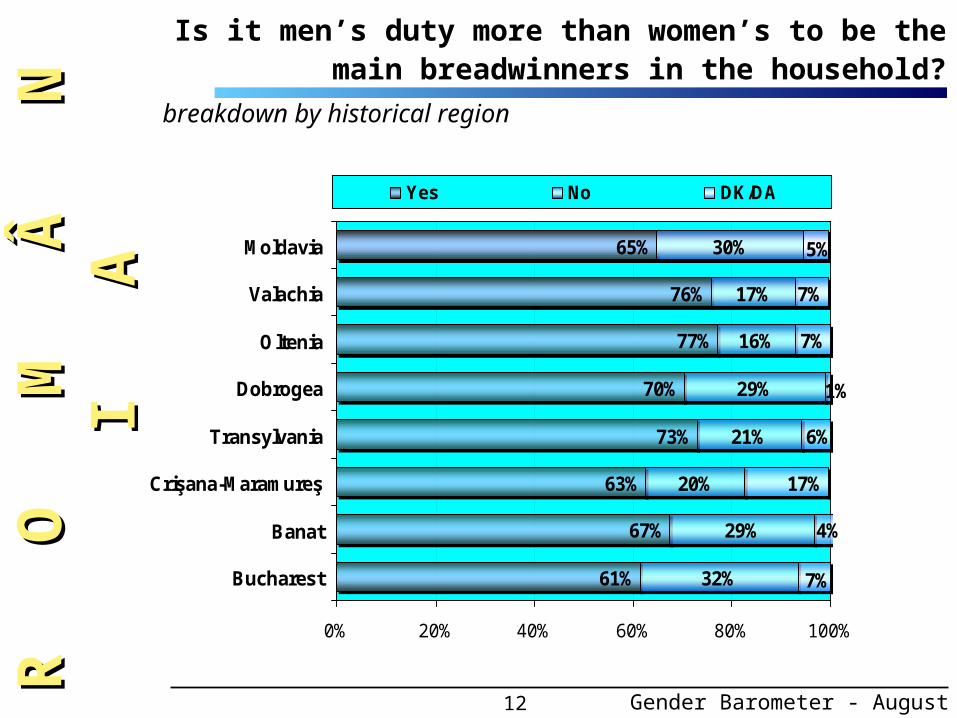
65%
76%
77%
70%
73%
63%
67%
61%
30%
17%
16%
29%
21%
20%
32%
7%
7%
17%
29%
7%
4%
6%
1%
5%
0% 20% 40% 60% 80% 100%
Moldavia
Valachia
Oltenia
Dobrogea
Transylvania
Crişana-Maramureş
Banat
Bucharest
Yes No DK/DA
breakdown by historical region
R O
R
O
M
Â
N
I
M Â
N
I
AA
Is it men’s duty more than women’s to be the main breadwinners in the household?
Gender Barometer - August 2000
13
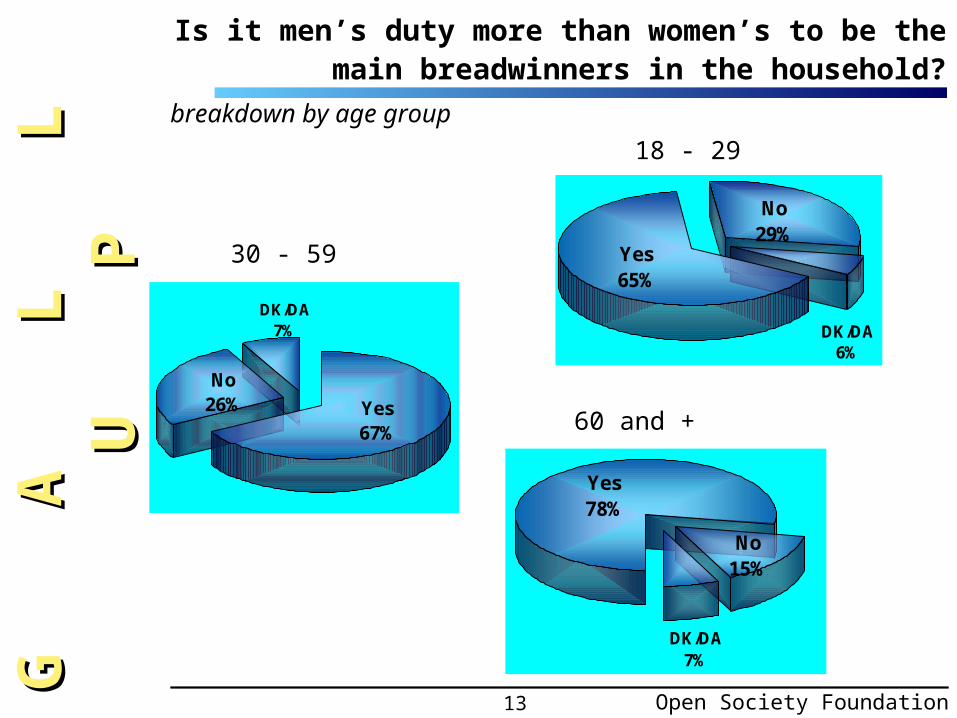
breakdown by age group
Is it men’s duty more than women’s to be the main breadwinners in the household?
No15%
DK/DA7%
Yes78%
18 - 29
30 - 59
60 and +
Yes65%
DK/DA6%
No29%
No26%
DK/DA7%
Yes67%
Open Society Foundation
G A
G
A
L
L
U
L L
U
PP
14
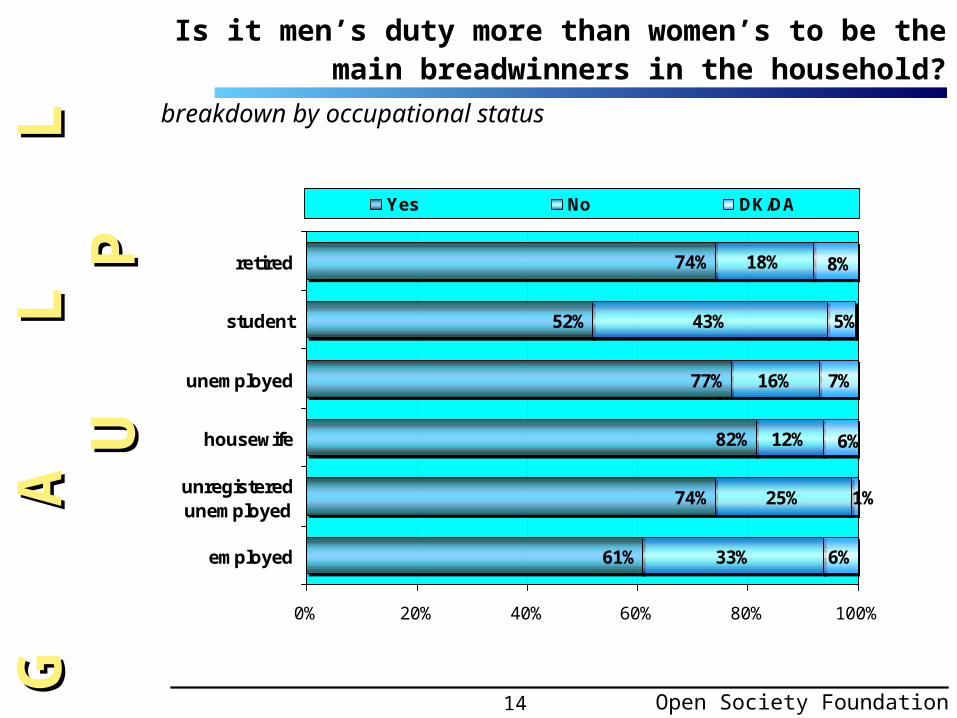
breakdown by occupational status
Is it men’s duty more than women’s to be the main breadwinners in the household?
74%
52%
77%
82%
74%
61%
18%
43%
16%
12%
25%
33%
7%
6%
5%
1%
6%
8%
0% 20% 40% 60% 80% 100%
retired
student
unemployed
housewife
unregisteredunemployed
employed
Yes No DK/DA
Open Society Foundation
G A
G
A
L
L
U
L L
U
PP
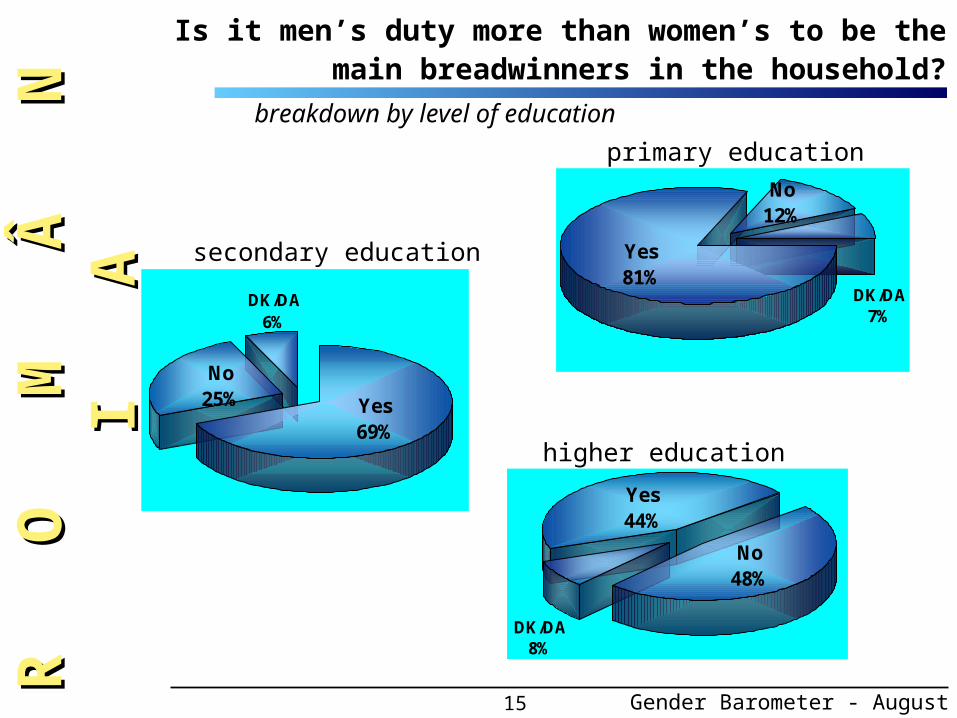
15
No48%
DK/DA8%
Yes44%
Yes69%
DK/DA6%
No25%
primary education
secondary education
higher education
No12%
DK/DA7%
Yes81%
breakdown by level of education
R O
R
O
M
Â
N
I
M Â
N
I
AA
Is it men’s duty more than women’s to be the main breadwinners in the household?
Gender Barometer - August 2000
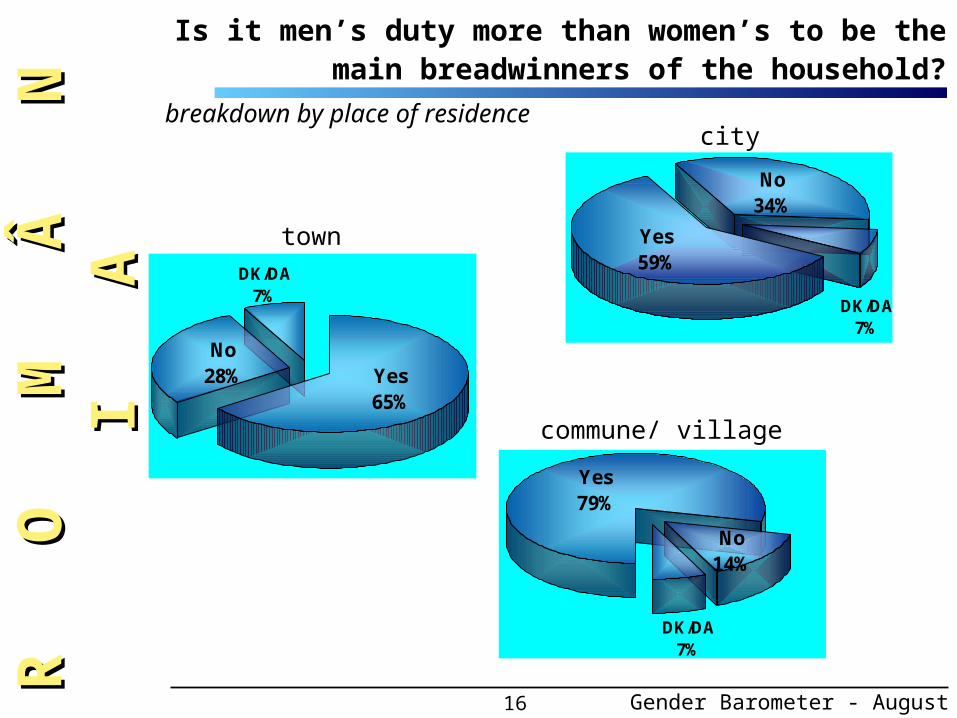
16
Yes79%
DK/DA7%
No14%
Yes65%
DK/DA7%
No28%
city
town
commune/ village
No34%
DK/DA7%
Yes59%
breakdown by place of residence
R O
R
O
M
Â
N
I
M Â
N
I
AA
Is it men’s duty more than women’s to be the main breadwinners of the household?
Gender Barometer - August 2000
17
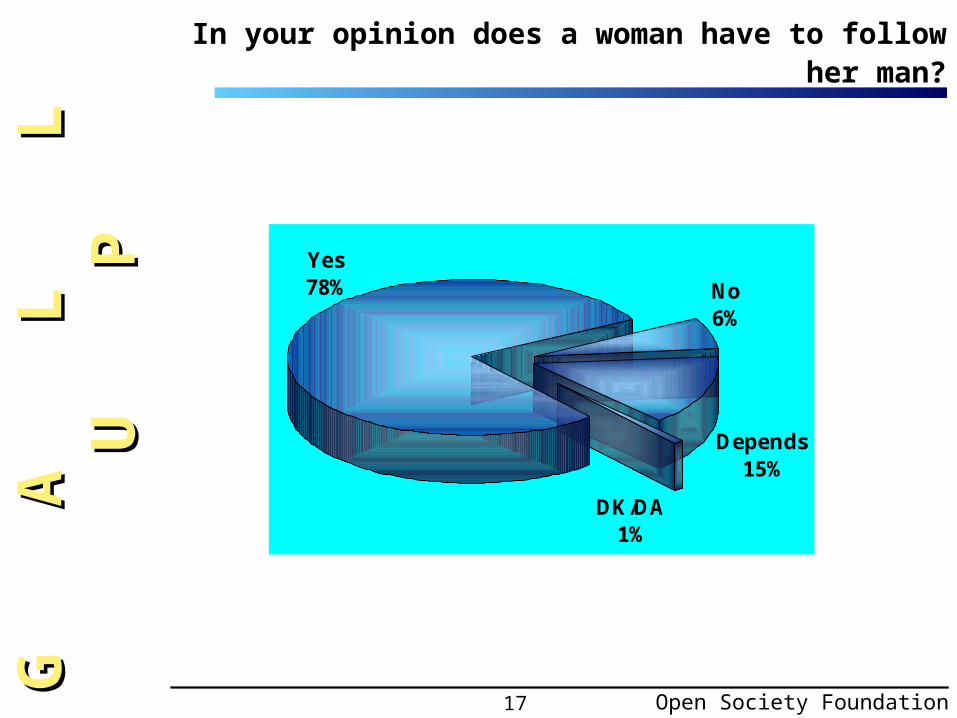
In your opinion does a woman have to follow her man?
DK/DA1%
No6%
Depends15%
Yes78%
Open Society Foundation
G A
G
A
L
L
U
L L
U
PP
18
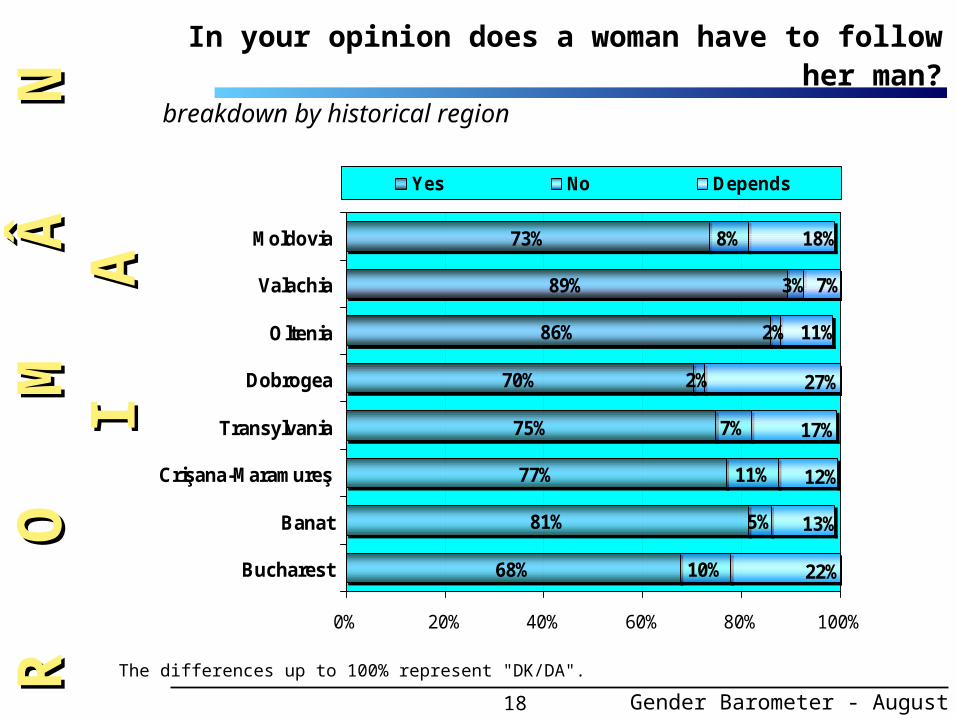
73%
89%
86%
70%
75%
77%
81%
68%
8%
3%
2%
2%
7%
11%
10%
5%
12%
11%
7%
22%
13%
17%
27%
18%
0% 20% 40% 60% 80% 100%
Moldovia
Valachia
Oltenia
Dobrogea
Transylvania
Crişana-Maramureş
Banat
Bucharest
Yes No Depends
breakdown by historical region
R O
R
O
M
Â
N
I
M Â
N
I
AA
The differences up to 100% represent "DK/DA".
In your opinion does a woman have to follow her man?
Gender Barometer - August 2000

19
breakdown by age group
The differences up to 100% represent "DK/DA".
70%77%
85%
10%
19% 16%
7%4%
10%
0%
20%
40%
60%
80%
100%
18-29 30-59 60 and +
Depends
No
Yes
How to read the figure: within the age group 18 – 29 , 70% of respondents think that “the woman has to follow her man”, 10% that “the woman does not have to follow him” and 19% answered “It depends”.
Open Society Foundation
G A
G
A
L
L
U
L L
U
PPIn your opinion does a woman have to follow her man?
20
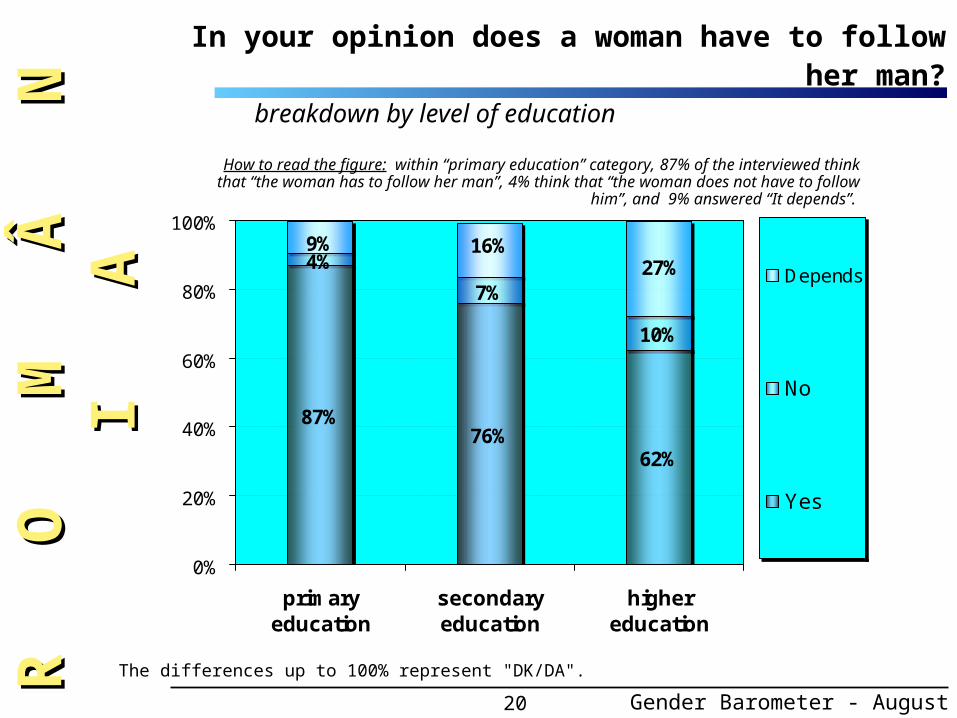
87%76%
62%
4%
7%
10%
9% 16%27%
0%
20%
40%
60%
80%
100%
primaryeducation
secondaryeducation
highereducation
Depends
No
Yes
breakdown by level of education
How to read the figure: within “primary education” category, 87% of the interviewed think that “the woman has to follow her man”, 4% think that “the woman does not have to follow
him”, and 9% answered “It depends”.
R O
R
O
M
Â
N
I
M Â
N
I
AA
The differences up to 100% represent "DK/DA".
In your opinion does a woman have to follow her man?
Gender Barometer - August 2000
21
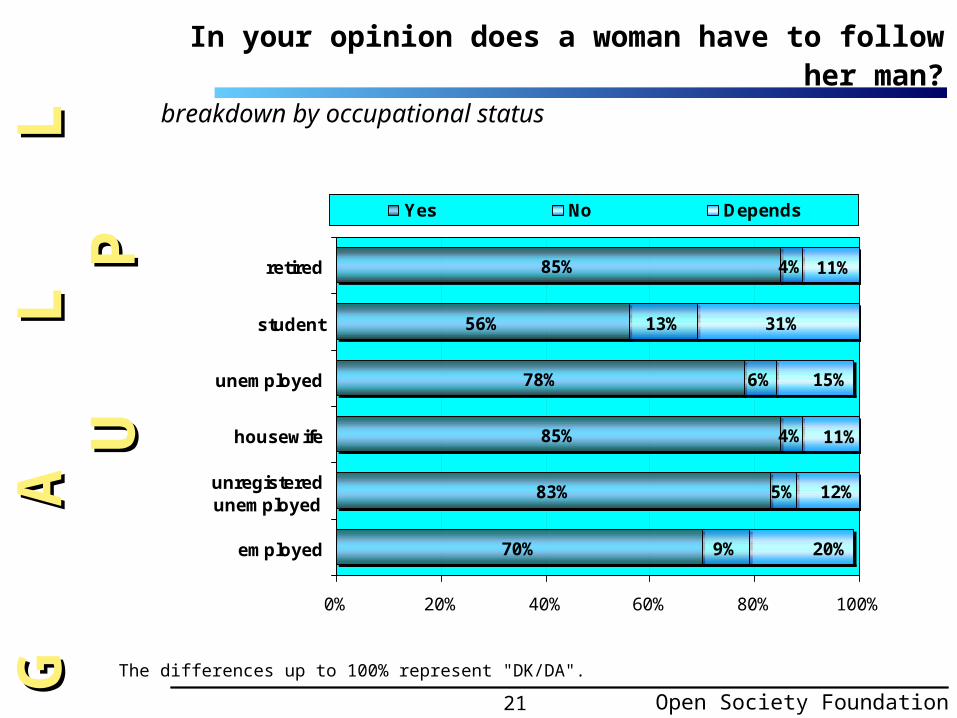
The differences up to 100% represent "DK/DA".
breakdown by occupational status
85%
56%
78%
85%
83%
70%
4%
13%
6%
4%
5%
9%
15%
20%
31%
12%
11%
11%
0% 20% 40% 60% 80% 100%
retired
student
unemployed
housewife
unregisteredunemployed
employed
Yes No Depends
Open Society Foundation
G A
G
A
L
L
U
L L
U
PPIn your opinion does a woman have to follow her man?
22
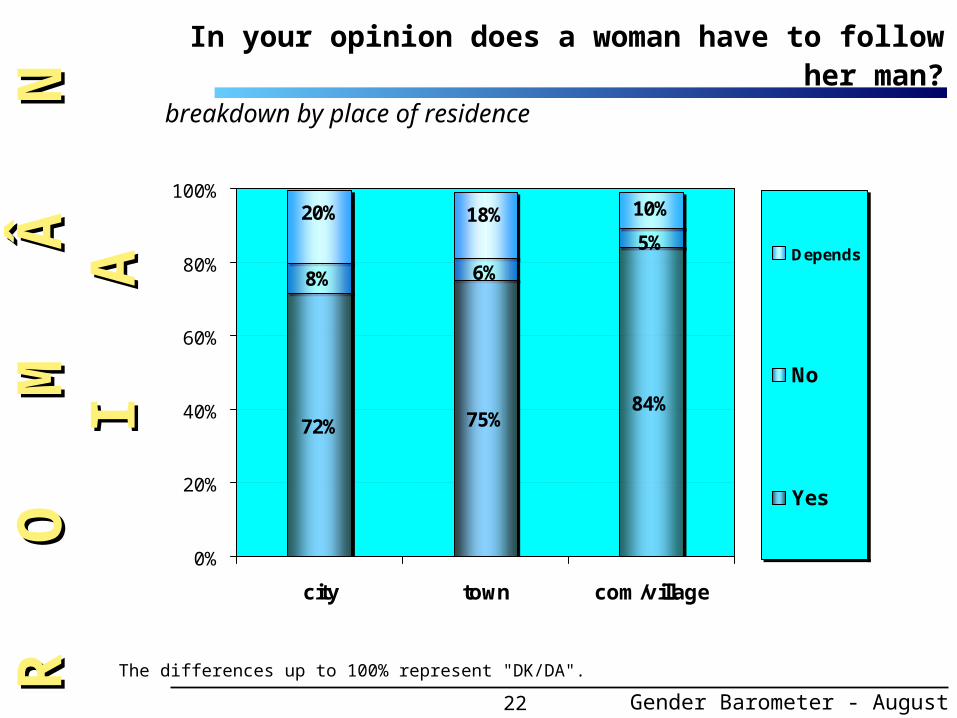
breakdown by place of residence
72% 75%84%
20% 18%
6%
5%
8%
10%
0%
20%
40%
60%
80%
100%
city town com/village
Depends
No
Yes
R O
R
O
M
Â
N
I
M Â
N
I
AA
The differences up to 100% represent "DK/DA".
In your opinion does a woman have to follow her man?
Gender Barometer - August 2000
23
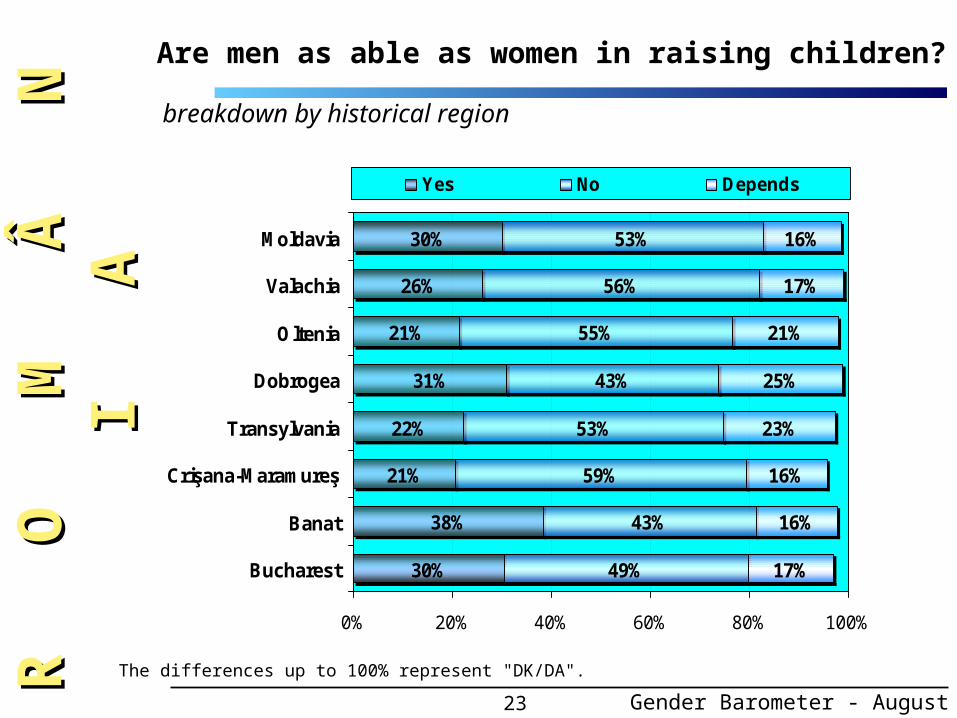
breakdown by historical region
30%
26%
21%
31%
22%
21%
38%
30%
53%
56%
55%
43%
53%
59%
49%
43%
16%
21%
17%
17%
16%
23%
25%
16%
0% 20% 40% 60% 80% 100%
Moldavia
Valachia
Oltenia
Dobrogea
Transylvania
Crişana-Maramureş
Banat
Bucharest
Yes No Depends
R O
R
O
M
Â
N
I
M Â
N
I
AAAre men as able as women in raising children?
The differences up to 100% represent "DK/DA".
Gender Barometer - August 2000

24
Are men as able as women in raising children?
DK/DA2%
No53%
Depends19%
YES26%
Open Society Foundation
G A
G
A
L
L
U
L L
U
PP
25
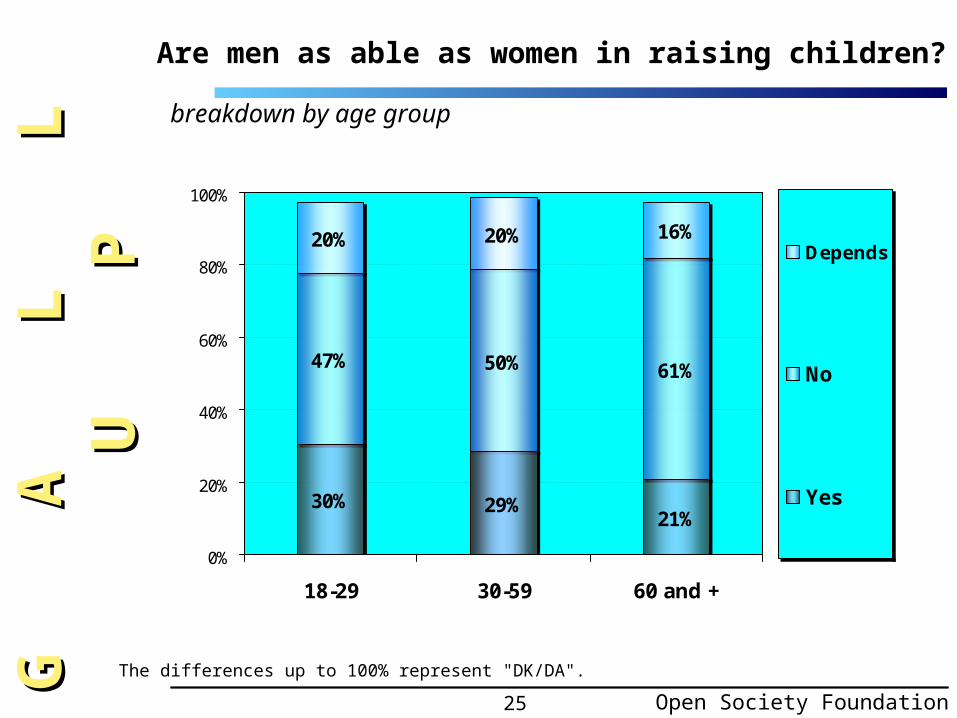
breakdown by age group
The differences up to 100% represent "DK/DA".
Are men as able as women in raising children?
30% 29%21%
47% 50% 61%
20% 20% 16%
0%
20%
40%
60%
80%
100%
18-29 30-59 60 and +
Depends
No
Yes
Open Society Foundation
G A
G
A
L
L
U
L L
U
PP

26
breakdown by level of education
18%30%
37%
63%48%
41%
17% 20% 20%
0%
20%
40%
60%
80%
100%
primaryeducation
secondaryeducation
highereducation
Depends
No
Yes
R O
R
O
M
Â
N
I
M Â
N
I
AAAre men as able as women in raising children?
The differences up to 100% represent "DK/DA".
Gender Barometer - August 2000
27
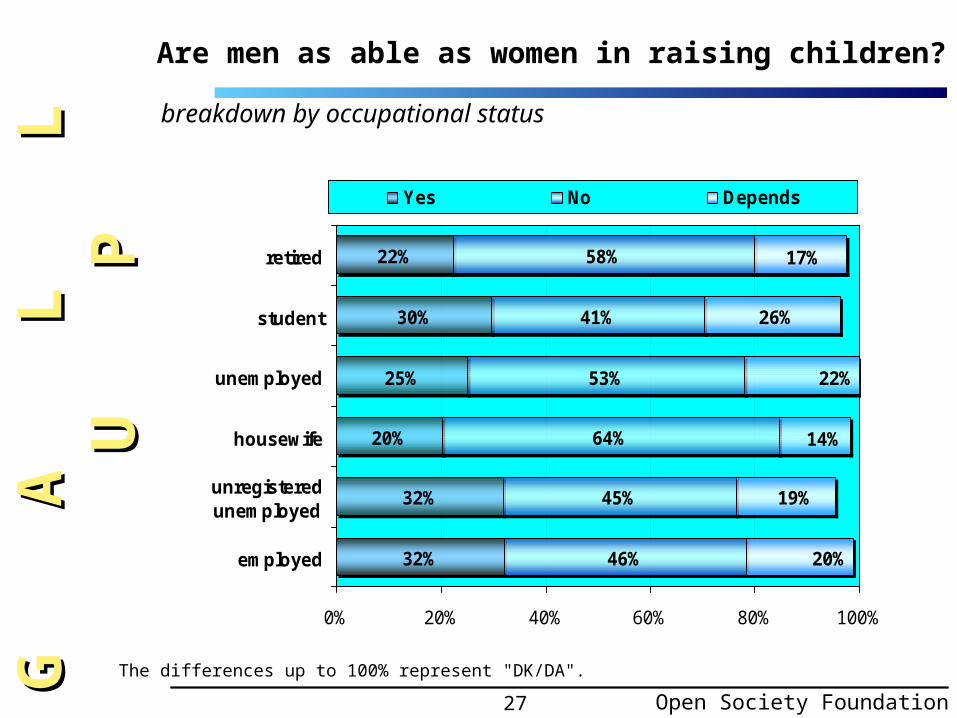
The differences up to 100% represent "DK/DA".
breakdown by occupational status
Are men as able as women in raising children?
22%
30%
25%
20%
32%
32%
58%
41%
53%
64%
45%
46%
22%
20%
26%
19%
14%
17%
0% 20% 40% 60% 80% 100%
retired
student
unemployed
housewife
unregisteredunemployed
employed
Yes No Depends
Open Society Foundation
G A
G
A
L
L
U
L L
U
PP
28
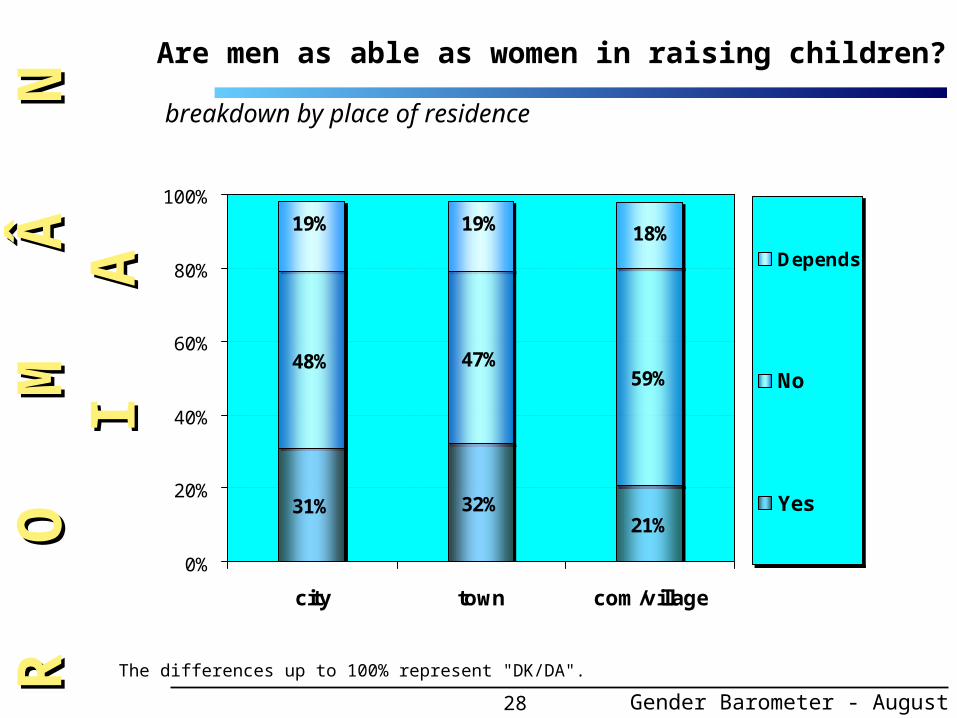
breakdown by place of residence
31% 32%21%
48% 47%59%
19% 19% 18%
0%
20%
40%
60%
80%
100%
city town com/village
Depends
No
Yes
R O
R
O
M
Â
N
I
M Â
N
I
AAAre men as able as women in raising children?
The differences up to 100% represent "DK/DA".
Gender Barometer - August 2000

29
Is man the head of the family?
DK/DA1%
No8%
Depends8%
Yes83%
Open Society Foundation
G A
G
A
L
L
U
L L
U
PP

30
DK/DA1%
No7%
Depends6%
Yes86%
DK/DA1%
No8%
Depends
9%
Yes82%
males
females
breakdown by sex
R O
R
O
M
Â
N
I
M Â
N
I
AAIs man the head of the family?
Gender Barometer - August 2000

31
The differences up to 100% represent "DK/DA".
breakdown by level of education
Is man the head of the family?
92%80%
69%
13%
10%9%
4%2%
16%
0%
20%
40%
60%
80%
100%
primaryeducation
secondaryeducation
highereducation
Depends
No
Yes
Open Society Foundation
G A
G
A
L
L
U
L L
U
PP

32
breakdown by historical region
The differences up to 100% represent "DK/DA".
Is man the head of the family?
79%
87%
91%
82%
78%
89%
87%
79%
13%
5%
5%
8%
5%
9%
3%
6%
3%
6%
7%
9%
6%
13%
11%
7%
0% 20% 40% 60% 80% 100%
Moldavia
Valachia
Oltenia
Dobrogea
Transylvania
Crişana-Maramureş
Banat
Bucharest
Yes No Depends
Open Society Foundation
G A
G
A
L
L
U
L L
U
PP
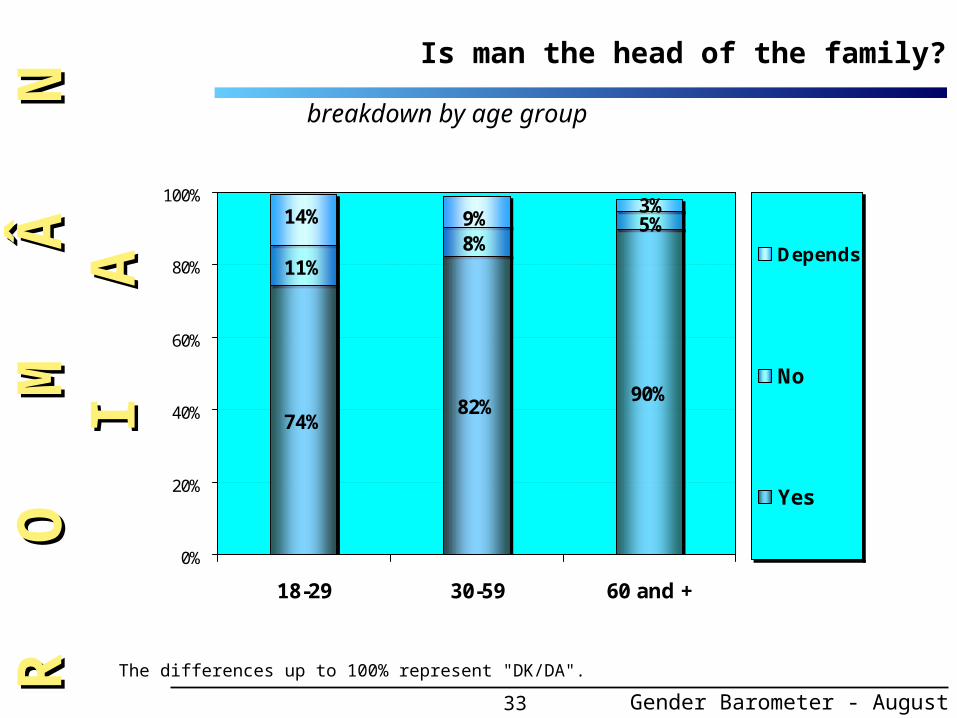
33
74%82%
90%
11%8%
14% 9% 5%3%
0%
20%
40%
60%
80%
100%
18-29 30-59 60 and +
Depends
No
Yes
breakdown by age group
R O
R
O
M
Â
N
I
M Â
N
I
AAIs man the head of the family?
The differences up to 100% represent "DK/DA".
Gender Barometer - August 2000

34
88%
55%
77%
90%
88%
79%
5%
15%
12%
7%
8%
8%
10%
12%
30%
4%
3%
5%
0% 20% 40% 60% 80% 100%
retired
student
unemployed
housewife
unregisteredunemployed
employed
Yes No Depends
breakdown by occupational status
R O
R
O
M
Â
N
I
M Â
N
I
AAIs man the head of the family?
The differences up to 100% represent "DK/DA".
Gender Barometer - August 2000

35
The differences up to 100% represent "DK/DA".
breakdown by place of residence
Is man the head of the family?
80% 76%89%
9%9%
10% 14% 6%4%
0%
20%
40%
60%
80%
100%
city town commune /village
Depends
No
Yes
Open Society Foundation
G A
G
A
L
L
U
L L
U
PP
36
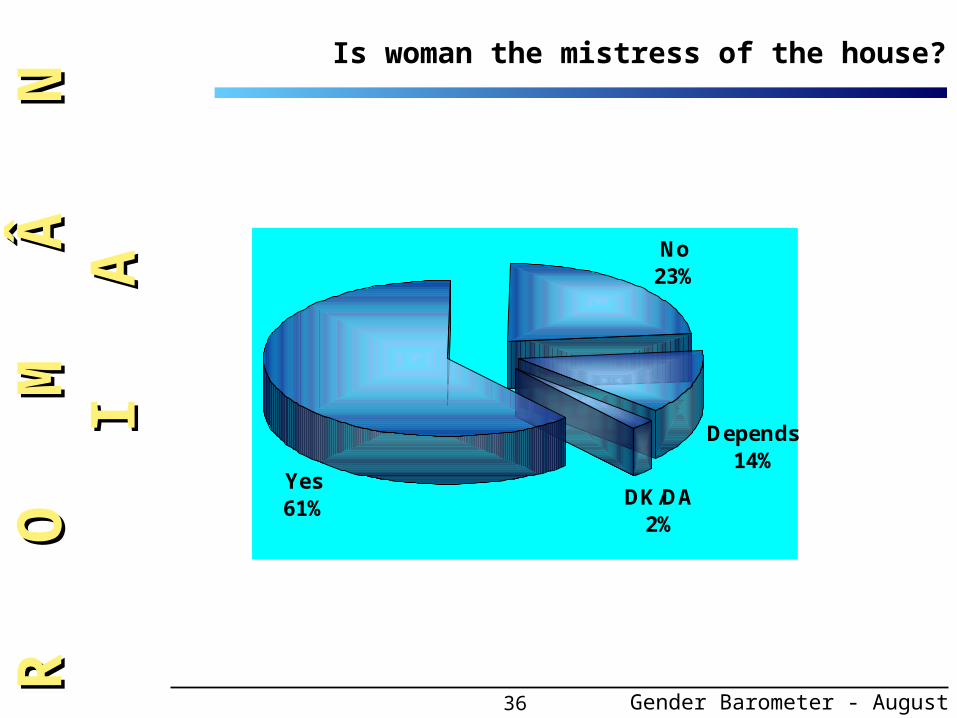
DK/DA2%
No23%
Depends14%
Yes61%
R O
R
O
M
Â
N
I
M Â
N
I
AAIs woman the mistress of the house?
Gender Barometer - August 2000

37
breakdown by sex
Is woman the mistress of the house?
DK/DA2%
No27%
Depends
13%
Yes58%
DK/DA2%
No19%
Depends
14%
Yes65%
males
females
Open Society Foundation
G A
G
A
L
L
U
L L
U
PP

38
59%
68%
69%
54%
59%
59%
60%
56%
29%
18%
17%
25%
21%
26%
27%
26%
10%
13%
14%
12%
12%
18%
20%
10%
0% 20% 40% 60% 80% 100%
Moldavia
Valachia
Oltenia
Dobrogea
Transylvania
Crişana-Maramureş
Banat
Bucharest
Yes No Depends
breakdown by historical region
R O
R
O
M
Â
N
I
M Â
N
I
AAIs woman the mistress of the house?
Differences up to 100% represent "DK/DA"
Gender Barometer - August 2000
39
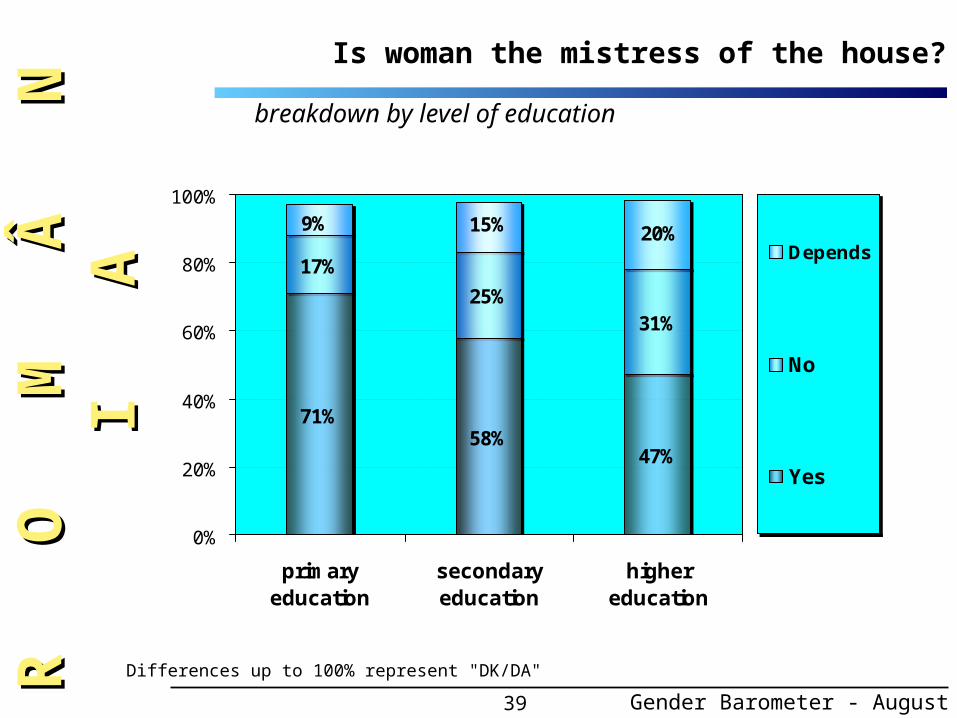
71%58%
47%
17%
25%31%
15%9% 20%
0%
20%
40%
60%
80%
100%
primaryeducation
secondaryeducation
highereducation
Depends
No
Yes
breakdown by level of education
R O
R
O
M
Â
N
I
M Â
N
I
AAIs woman the mistress of the house?
Differences up to 100% represent "DK/DA"
Gender Barometer - August 2000

40
breakdown by age group
Differences up to 100% represent "DK/DA"
Is woman the mistress of the house?
51%58%
73%
32% 24%
15% 16%
16%
8%
0%
20%
40%
60%
80%
100%
18-29 30-59 60 and+
Depends
No
Yes
Open Society Foundation
G A
G
A
L
L
U
L L
U
PP

41
Differences up to 100% represent "DK/DA"
breakdown by occupational status
Is woman the mistress of the house?
70%
44%
51%
73%
49%
53%
17%
20%
34%
17%
36%
29%
15%
17%
31%
12%
10%
10%
0% 20% 40% 60% 80% 100%
retired
student
unemployed
housewife
unregisteredunemployed
employed
Yes No Depends
Open Society Foundation
G A
G
A
L
L
U
L L
U
PP

42
58% 56%66%
27%22%
21%
14% 20% 10%
0%
20%
40%
60%
80%
100%
city town com/village
Depends
No
Yes
breakdown by place of residence
R O
R
O
M
Â
N
I
M Â
N
I
AAIs woman the mistress of the house?
Differences up to 100% represent "DK/DA"
Gender Barometer - August 2000

43
80% 20%
46%54%
0% 20% 40% 60% 80% 100%
males
females
Yes No
breakdown by sex
Do you usually go out alone in the late evening?
Open Society Foundation
G A
G
A
L
L
U
L L
U
PP
44
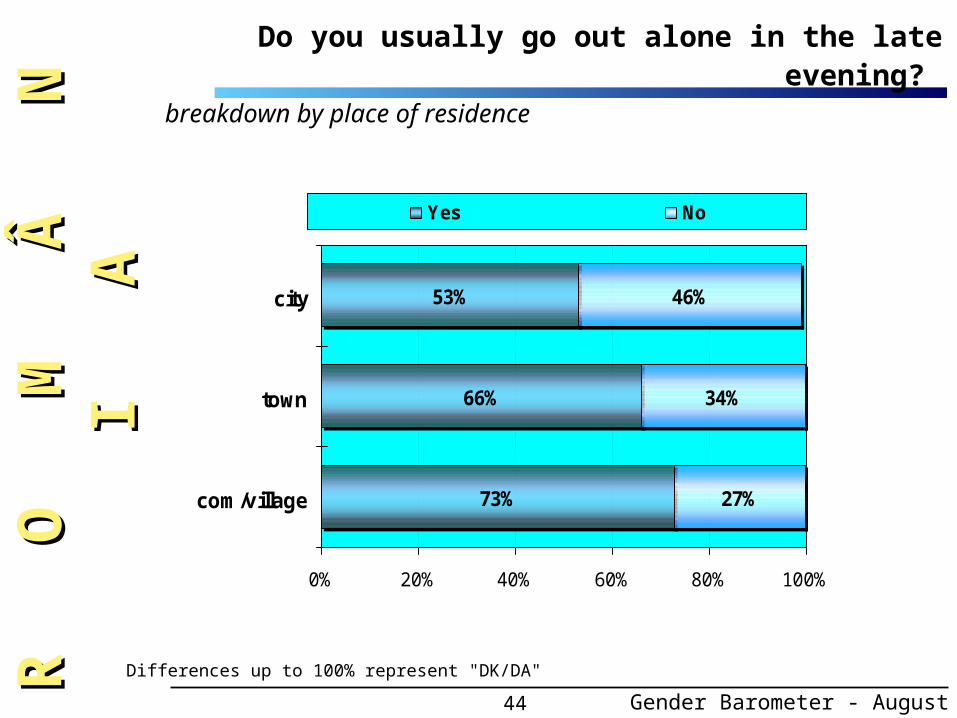
53%
66%
73%
46%
34%
27%
0% 20% 40% 60% 80% 100%
city
town
com/village
Yes No
breakdown by place of residence
R O
R
O
M
Â
N
I
M Â
N
I
AA
Differences up to 100% represent "DK/DA"
Gender Barometer - August 2000
Do you usually go out alone in the late evening?
45
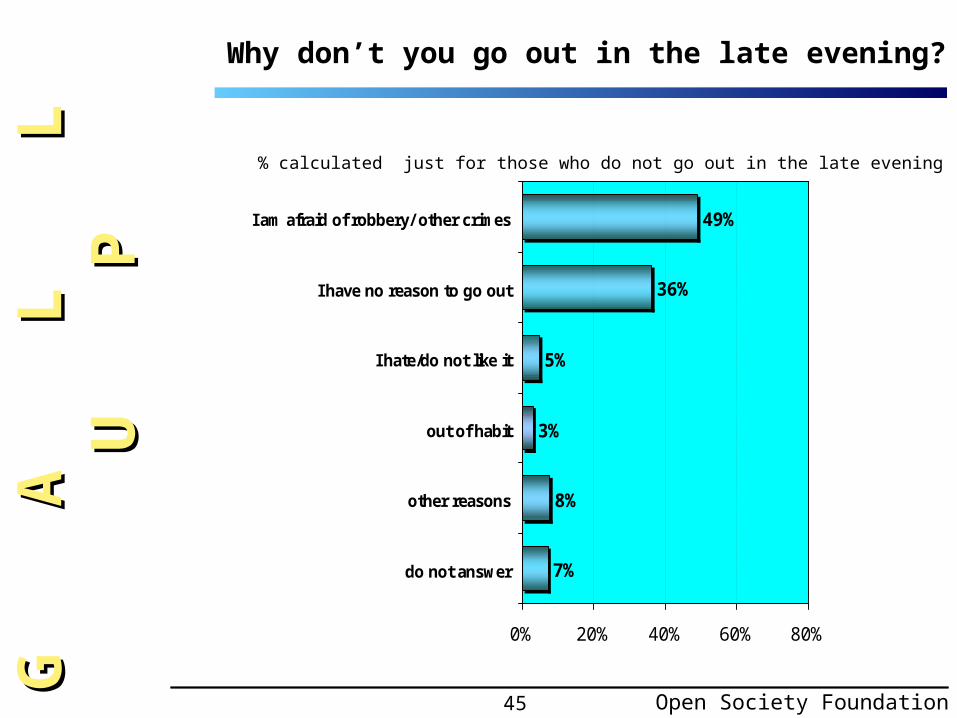
49%
36%
5%
3%
8%
7%
0% 20% 40% 60% 80%
I am afraid of robbery/ other crimes
I have no reason to go out
I hate/do not like it
out of habit
other reasons
do not answer
Why don’t you go out in the late evening?
% calculated just for those who do not go out in the late evening
Open Society Foundation
G A
G
A
L
L
U
L L
U
PP
46
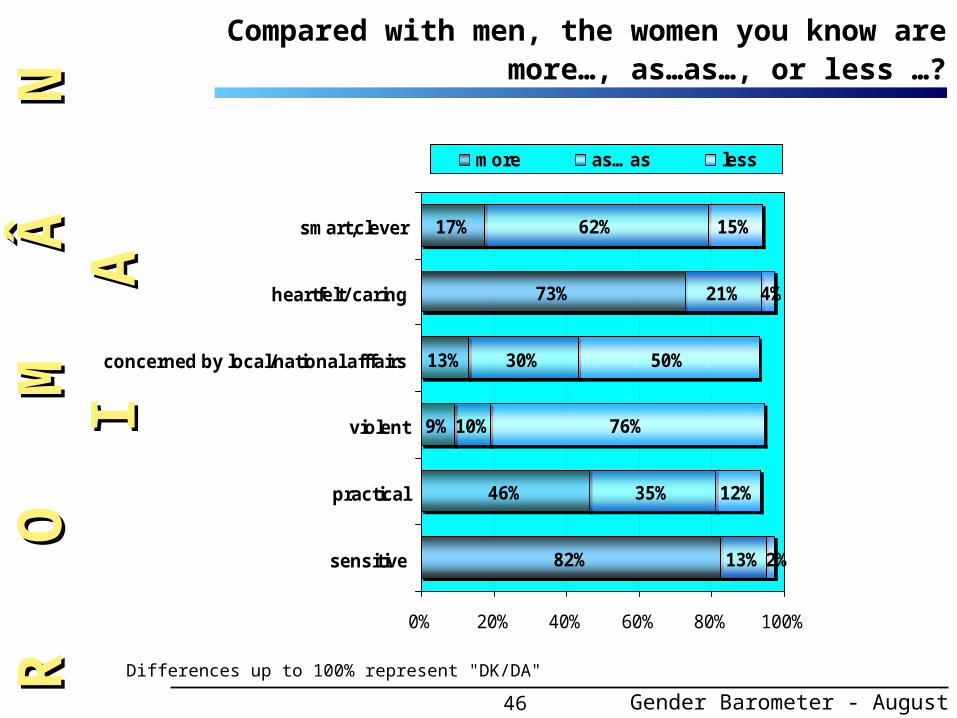
17%
73%
13%
9%
46%
82%
62%
21%
30%
10%
35%
13%
15%
50%
76%
12%
4%
2%
0% 20% 40% 60% 80% 100%
smart,clever
heartfelt/ caring
concerned by local/national afffairs
violent
practical
sensitive
more as…as less
R O
R
O
M
Â
N
I
M Â
N
I
AA
Compared with men, the women you know are more…, as…as…, or less …?
Differences up to 100% represent "DK/DA"
Gender Barometer - August 2000
47
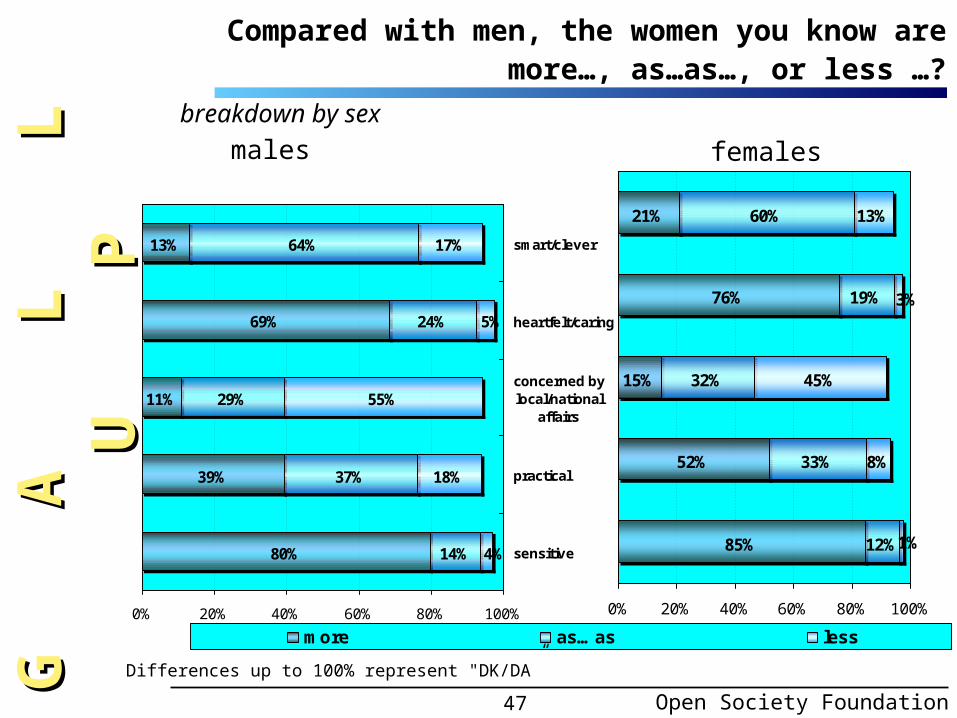
13%
69%
11%
39%
80%
64%
24%
29%
37%
14%
17%
55%
18%
5%
4%
0% 20% 40% 60% 80% 100%
smart/clever
heartfelt/caring
concerned bylocal/national
affairs
practical
sensitive
more as…as less
21%
76%
15%
52%
85%
60%
19%
32%
33%
12%
13%
45%
8%
3%
1%
0% 20% 40% 60% 80% 100%
males females
Compared with men, the women you know are more…, as…as…, or less …?
Open Society Foundation
breakdown by sex
G A
G
A
L
L
U
L L
U
PP
Differences up to 100% represent "DK/DA”
48
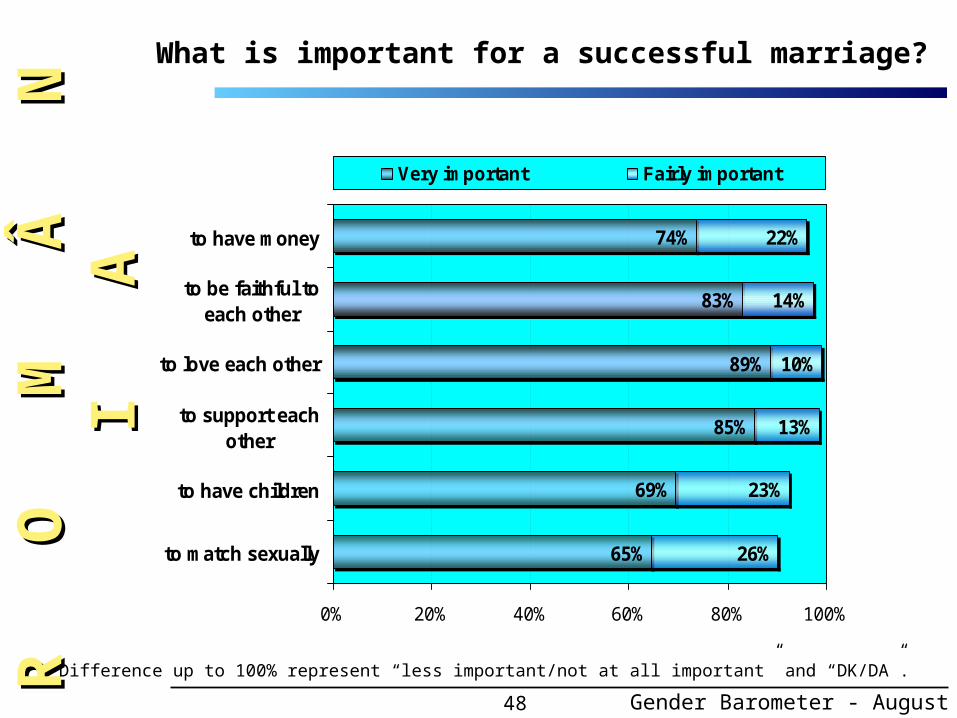
What is important for a successful marriage?
74%
83%
89%
85%
69%
65%
22%
14%
10%
13%
23%
26%
0% 20% 40% 60% 80% 100%
to have money
to be faithful toeach other
to love each other
to support eachother
to have children
to match sexually
Very important Fairly important
R O
R
O
M
Â
N
I
M Â
N
I
AA
Difference up to 100% represent “less important/not at all important” and “DK/DA”.
Gender Barometer - August 2000

49
Is it important for the spouses to match sexually?
Difference up to 100% represent “less important/not at all important” and “DK/DA”.
breakdown by age group
68%
70%
54%
24%
23%
30%
0% 20% 40% 60% 80% 100%
18-29
30-59
60 and+
Very important Fairly important
Open Society Foundation
G A
G
A
L
L
U
L L
U
PP

50
breakdown by level of education
54%
71%
71%
31%
22%
24%
0% 20% 40% 60% 80% 100%
primary education
secondaryeducation
higher education
Very important Fairly important
R O
R
O
M
Â
N
I
M Â
N
I
AAIs it important for the spouses to match sexually?
Difference up to 100% represent “less important/not at all important” and “DK/DA”.
Gender Barometer - August 2000

51
Is it important for the spouses to match sexually?
Difference up to 100% represent de “less important/not at all important” and “DK/DA”.
breakdown by historical region
61%
62%
58%
74%
65%
60%
91%
70%
31%
30%
32%
19%
23%
18%
22%
6%
0% 20% 40% 60% 80% 100%
Moldavia
Valachia
Oltenia
Dobrogea
Transylvania
Crişana-Maramureş
Banat
Bucharest
Very important Fairly important
Open Society Foundation
G A
G
A
L
L
U
L L
U
PP
52
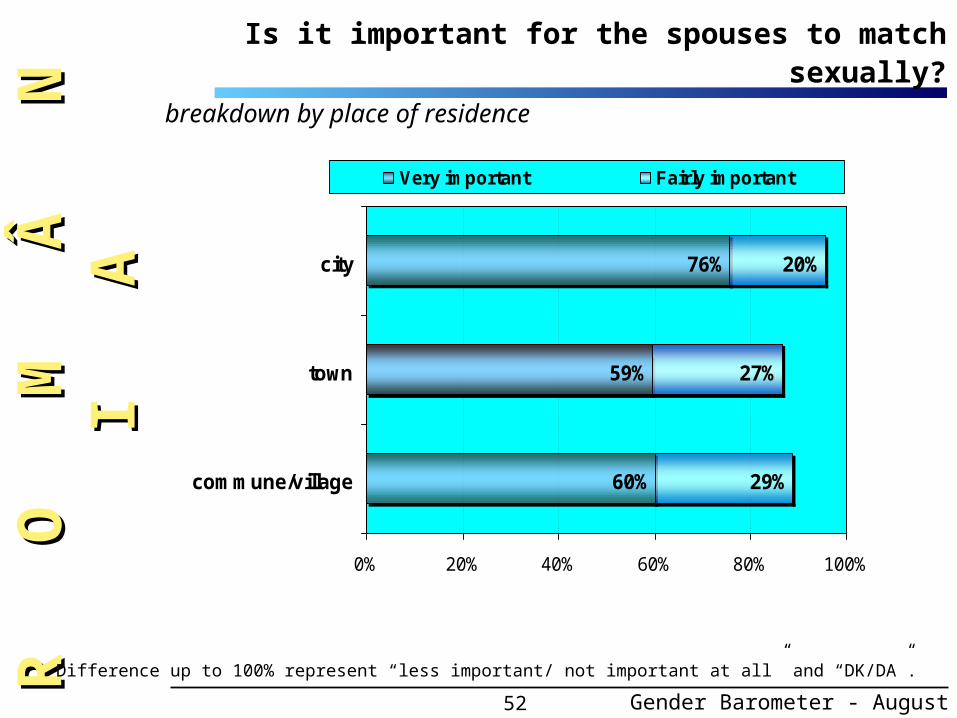
breakdown by place of residence
76%
59%
60%
20%
27%
29%
0% 20% 40% 60% 80% 100%
city
town
commune/village
Very important Fairly important
R O
R
O
M
Â
N
I
M Â
N
I
AAIs it important for the spouses to match sexually?
Difference up to 100% represent “less important/ not important at all” and “DK/DA”.
Gender Barometer - August 2000

53
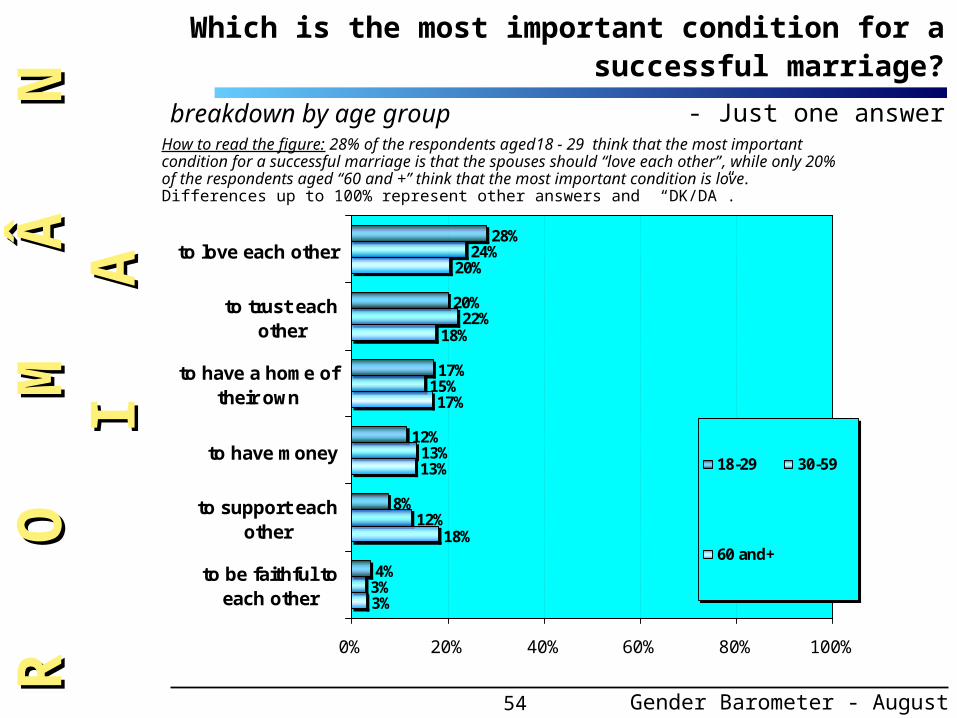
Which is the most important condition for a successful marriage?
- just one answer -
24%
20%
16%
13%
13%
3%
0% 20% 40% 60% 80% 100%
to love each other
to trust eachother
to have a home oftheir own
to support eachother
to have money
to be faithful toeach other
Open Society Foundation
G A
G
A
L
L
U
L L
U
PP
Difference up to 100% represent”other answers” and “DK/DA”.
54
- Just one answer -breakdown by age group
28%
20%
17%
12%
8%
4%
24%
22%
15%
13%
12%
3%
20%
18%
17%
13%
18%
3%
0% 20% 40% 60% 80% 100%
to love each other
to trust eachother
to have a home oftheir own
to have money
to support eachother
to be faithful toeach other
18-29 30-59
60 and+
How to read the figure: 28% of the respondents aged18 - 29 think that the most important condition for a successful marriage is that the spouses should “love each other”, while only 20% of the respondents aged “60 and +” think that the most important condition is love. Differences up to 100% represent other answers and “DK/DA”.
R O
R
O
M
Â
N
I
M Â
N
I
AA
Which is the most important condition for a successful marriage?
Gender Barometer - August 2000

55
Which is the most important condition for a successful marriage?
- just one answer -breakdown by level of education
20%
18%
17%
17%
16%
3%
26%
20%
16%
11%
12%
3%
25%
25%
14%
9%
10%
3%
0% 20% 40% 60% 80% 100%
to love each other
to trust each other
to have a home oftheir own
to have money
to support eachother
to be faithful toeach other
primary education
secondaryeducation
higher education
Open Society Foundation
G A
G
A
L
L
U
L L
U
PP
Difference up to 100% represent other answers and “DK/DA”.
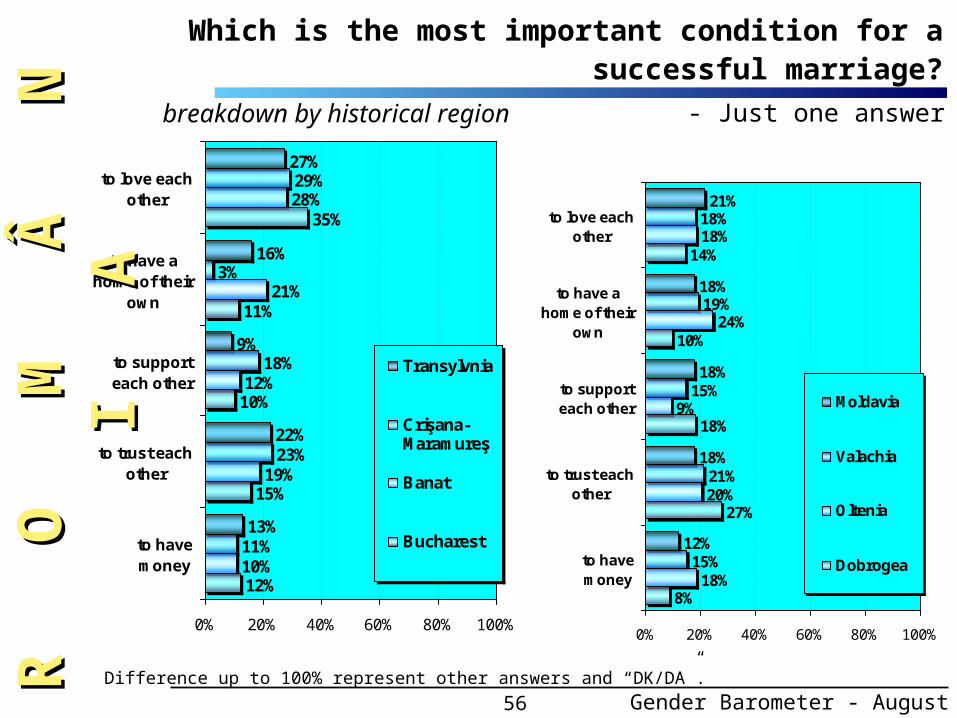
56
- Just one answer -breakdown by historical region
21%
18%
18%
18%
12%
18%
19%
15%
21%
15%
18%
24%
9%
20%
18%
14%
10%
18%
27%
8%
0% 20% 40% 60% 80% 100%
to love eachother
to have ahome of their
own
to supporteach other
to trust eachother
to havemoney
Moldavia
Valachia
Oltenia
Dobrogea
27%
16%
9%
22%
13%
29%
3%
18%
23%
11%
28%
21%
12%
19%
10%
35%
11%
10%
15%
12%
0% 20% 40% 60% 80% 100%
to love eachother
to have ahome of their
own
to supporteach other
to trust eachother
to havemoney
Transylvnia
Crişana-Maramureş
Banat
Bucharest
R O
R
O
M
Â
N
I
M Â
N
I
AA
Which is the most important condition for a successful marriage?
Gender Barometer - August 2000Difference up to 100% represent other answers and “DK/DA”.
57
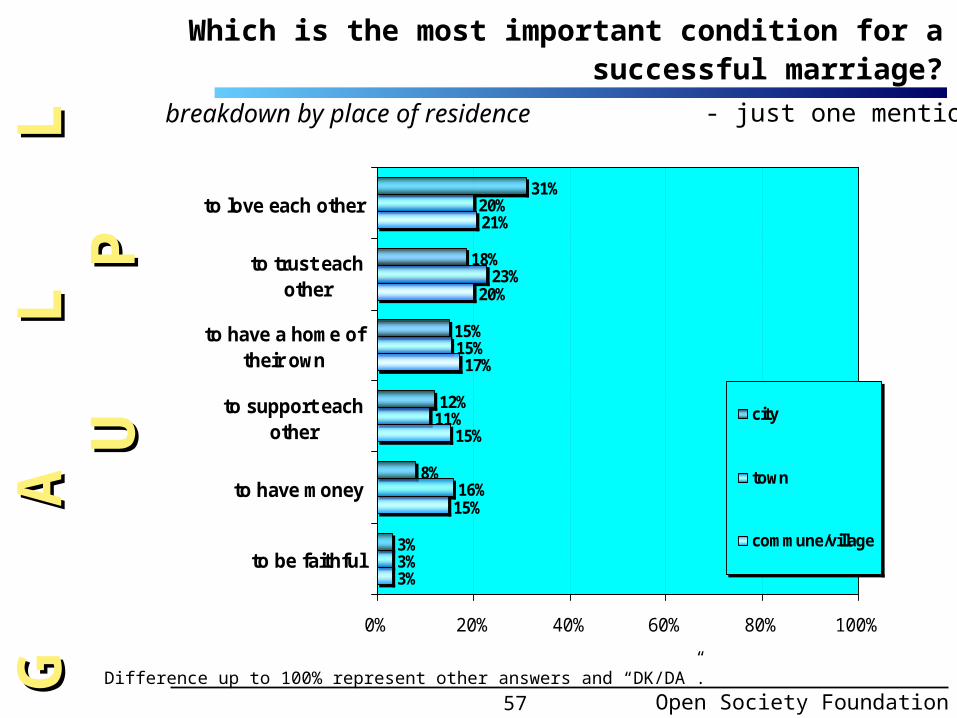
Which is the most important condition for a successful marriage?
- just one mention -breakdown by place of residence
31%
18%
15%
12%
8%
3%
20%
23%
15%
11%
16%
3%
21%
20%
17%
15%
15%
3%
0% 20% 40% 60% 80% 100%
to love each other
to trust eachother
to have a home oftheir own
to support eachother
to have money
to be faithful
city
town
commune/village
Open Society Foundation
G A
G
A
L
L
U
L L
U
PP
Difference up to 100% represent other answers and “DK/DA”.

58
DK/DA6%
No29%
I did not think14%
Yes51%
R O
R
O
M
Â
N
I
M Â
N
I
AA
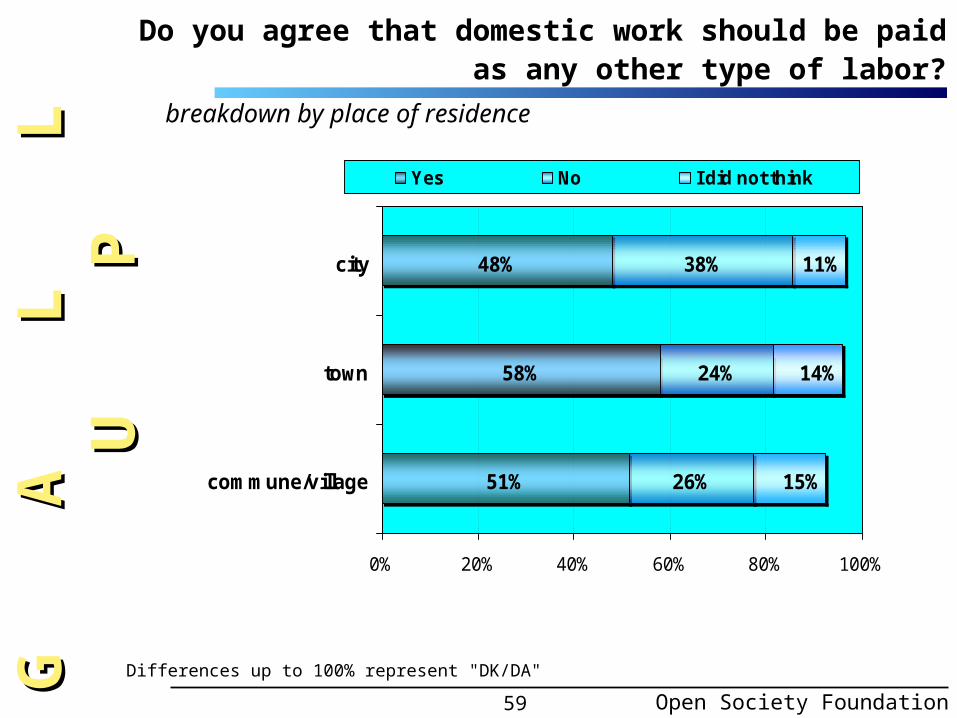
Do you agree that domestic work should be paid as any other type of labor?
Gender Barometer - August 2000
59
Differences up to 100% represent "DK/DA"
breakdown by place of residence
48%
58%
51%
38%
24%
26%
11%
14%
15%
0% 20% 40% 60% 80% 100%
city
town
commune/village
Yes No I did not think
Do you agree that domestic work should be paid as any other type of labor?
Open Society Foundation
G A
G
A
L
L
U
L L
U
PP

60
53%
48%
50%
42%
58%
68%
45%
43%
25%
29%
26%
37%
25%
21%
44%
14%
18%
15%
17%
12%
9%
7%
12%
40%
0% 20% 40% 60% 80% 100%
Moldavia
Valachia
Oltenia
Dobrogea
Transylvania
Crişana-Maramureş
Banat
Bucharest
Yes No I did not think
breakdown by historical region
R O
R
O
M
Â
N
I
M Â
N
I
AA
Do you agree that domestic work should be paid as any other type of labor?
Differences up to 100% represent "DK/DA"
Gender Barometer - August 2000
61
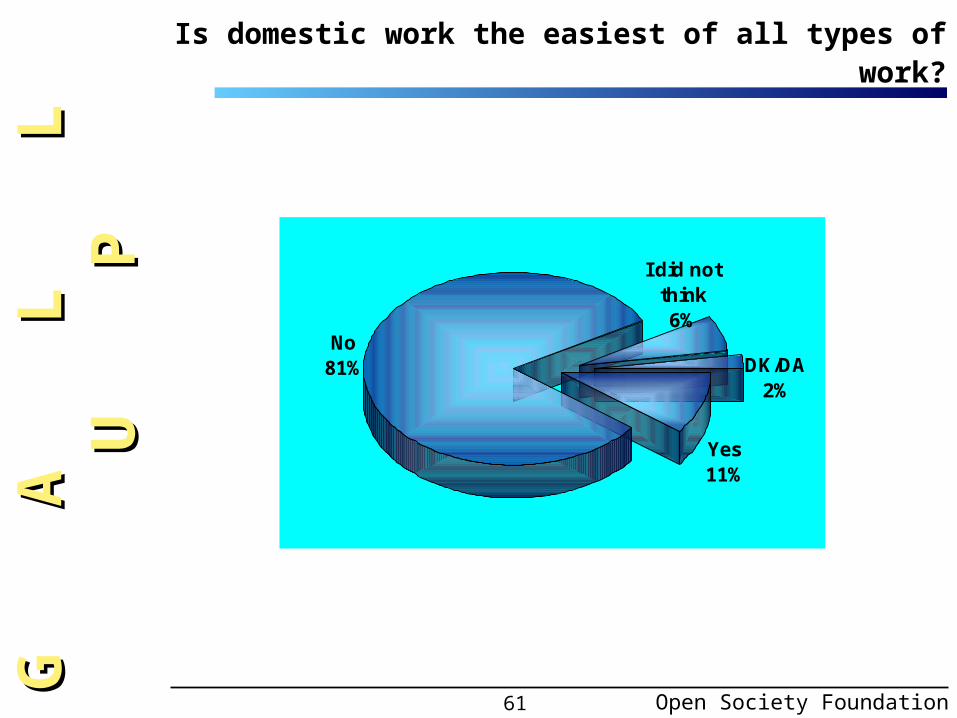
DK/DA2%
No81%
I did not think6%
Yes11%
Is domestic work the easiest of all types of work?
Open Society Foundation
G A
G
A
L
L
U
L L
U
PP
62
R O
R
O
M
Â
N
I
M Â
N
I
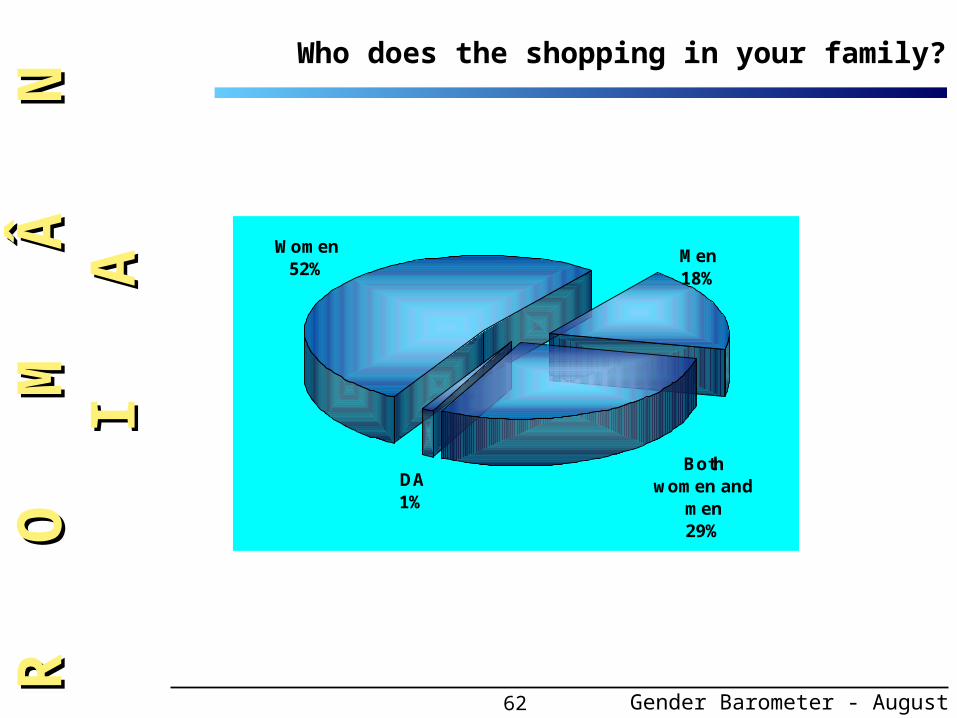
AAWho does the shopping in your family?
Gender Barometer - August 2000
DA1%
Men18%
Both women and
men29%
Women52%
63
41%
61%
12%
34%26%
24%
0%
20%
40%
60%
80%
100%
Males Females
Both womenand men
Men
Women
breakdown by sex
Open Society Foundation
G A
G
A
L
L
U
L L
U
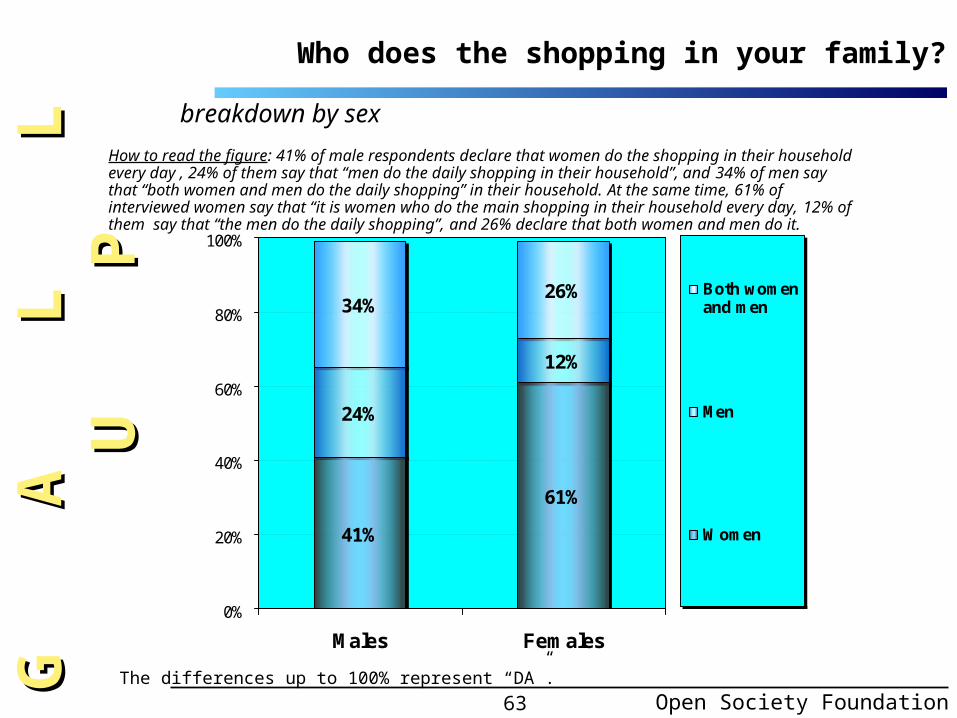
PPWho does the shopping in your family?
How to read the figure: 41% of male respondents declare that women do the shopping in their household every day , 24% of them say that “men do the daily shopping in their household”, and 34% of men say that “both women and men do the daily shopping” in their household. At the same time, 61% of interviewed women say that “it is women who do the main shopping in their household every day, 12% of them say that “the men do the daily shopping”, and 26% declare that both women and men do it.
The differences up to 100% represent “DA”.

64
R O
R
O
M
Â
N
I
M Â
N
I
AA
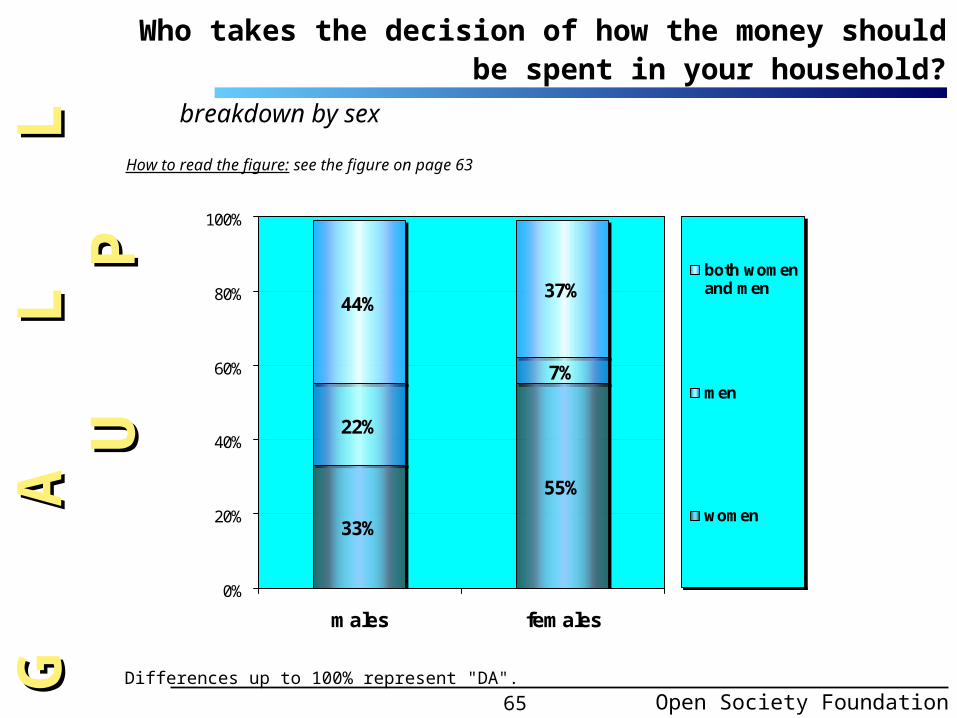
Who takes the decision of how the money should be spent in your household?
Gender Barometer - August 2000
DA1%
men14%
both women and
men40%
women45%
65
breakdown by sex
Open Society Foundation
How to read the figure: see the figure on page 63
G A
G
A
L
L
U
L L
U
PP
Who takes the decision of how the money should be spent in your household?
33%
55%
7%
44%37%
22%
0%
20%
40%
60%
80%
100%
males females
both womenand men
men
women
Differences up to 100% represent "DA".
66
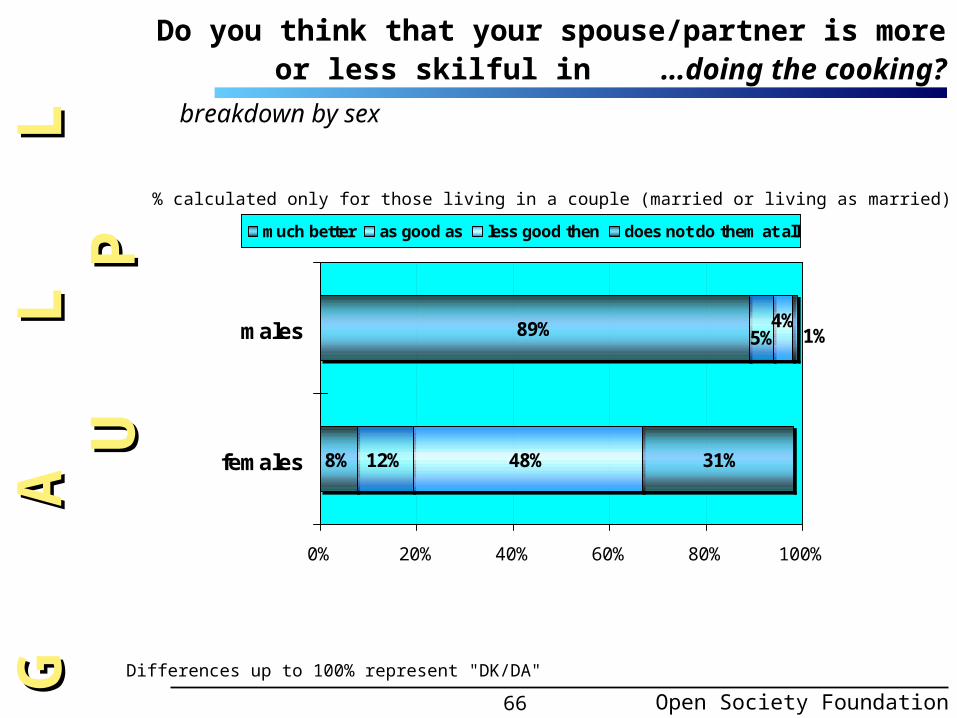
89%
8% 12% 48%
5%4%
31%
1%
0% 20% 40% 60% 80% 100%
males
females
much better as good as less good then does not do them at all
Differences up to 100% represent "DK/DA"
breakdown by sex
Do you think that your spouse/partner is more or less skilful in …doing the cooking?
% calculated only for those living in a couple (married or living as married)
Open Society Foundation
G A
G
A
L
L
U
L L
U
PP
67
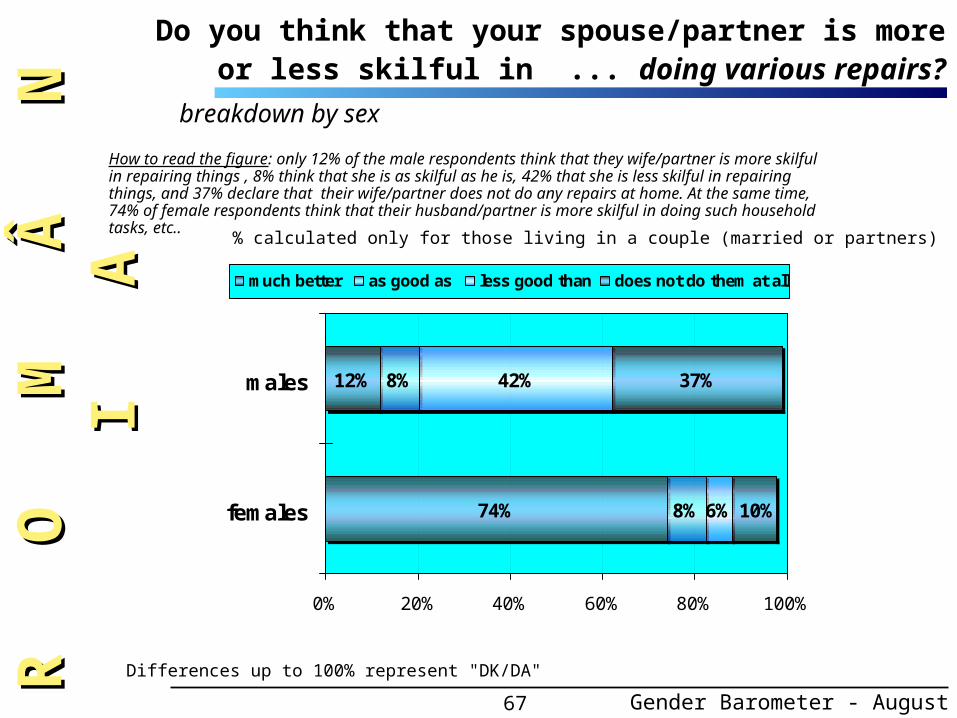
12%
74%
8%
8%
42%
6%
37%
10%
0% 20% 40% 60% 80% 100%
males
females
much better as good as less good than does not do them at all
breakdown by sex
Do you think that your spouse/partner is more or less skilful in ... doing various repairs?
% calculated only for those living in a couple (married or partners)
How to read the figure: only 12% of the male respondents think that they wife/partner is more skilful in repairing things , 8% think that she is as skilful as he is, 42% that she is less skilful in repairing things, and 37% declare that their wife/partner does not do any repairs at home. At the same time, 74% of female respondents think that their husband/partner is more skilful in doing such household tasks, etc..
R O
M
Â
N
I
R O
M
Â
N
I
AA
Differences up to 100% represent "DK/DA"
Gender Barometer - August 2000
68
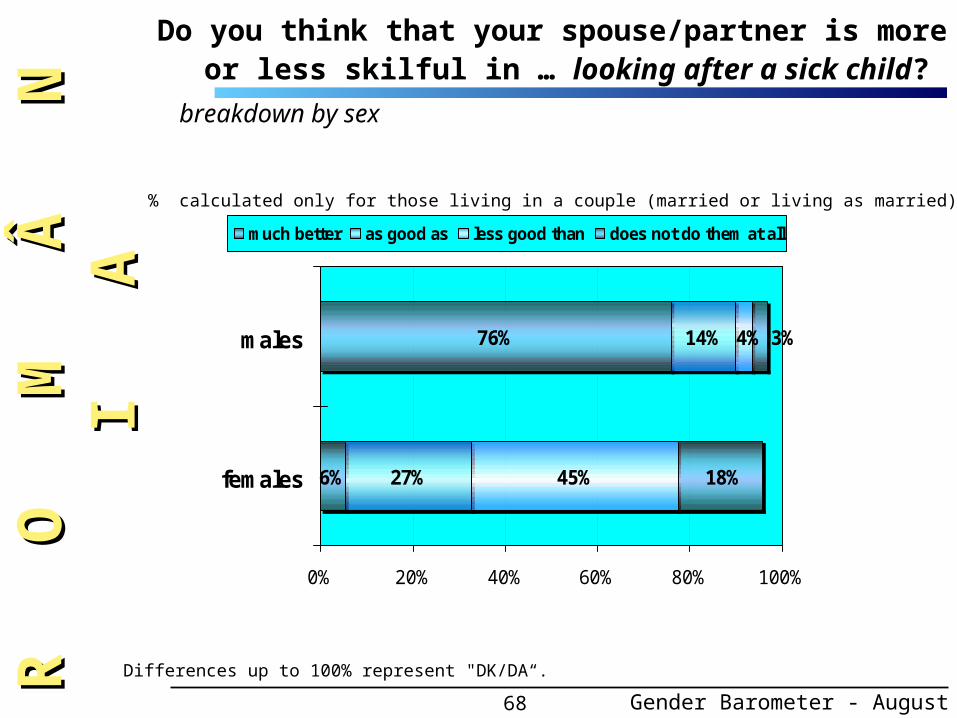
76%
6%
14%
27% 45%
4% 3%
18%
0% 20% 40% 60% 80% 100%
males
females
much better as good as less good than does not do them at all
Do you think that your spouse/partner is more or less skilful in … looking after a sick child?
% calculated only for those living in a couple (married or living as married)
breakdown by sex
R O
R
O
M
Â
N
I
M Â
N
I
AA
Differences up to 100% represent "DK/DA“.
Gender Barometer - August 2000
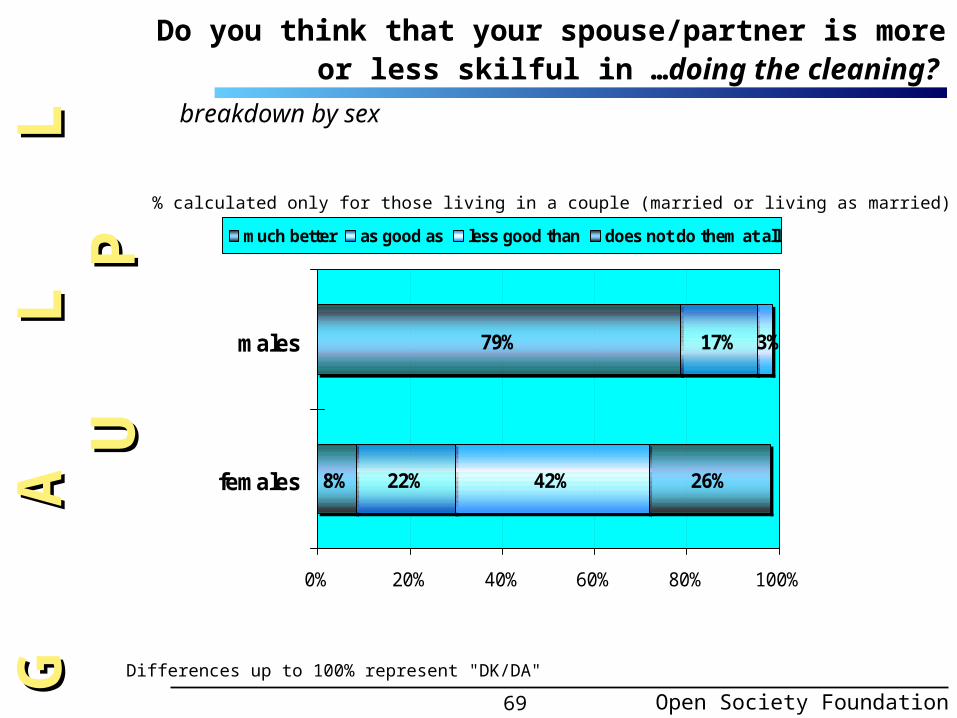
69
79%
8%
17%
22% 42% 26%
3%
0% 20% 40% 60% 80% 100%
males
females
much better as good as less good than does not do them at all
Differences up to 100% represent "DK/DA"
breakdown by sex
Do you think that your spouse/partner is more or less skilful in …doing the cleaning?
% calculated only for those living in a couple (married or living as married)
Open Society Foundation
G A
G
A
L
L
U
L L
U
PP

70
21%
35%
19%
19% 15%
35%
27%
22%
0% 20% 40% 60% 80% 100%
males
females
much better as good adless good than does not do them at alldoes not do it at all
breakdown by sex
% calculated only for those living in a couple (married or living as married)
R O
R
O
M
Â
N
I
M Â
N
I
AA
Do you think that your spouse/partner is more or less skilful in … painting the house?
Differences up to 100% represent "DK/DA"
Gender Barometer - August 2000
71
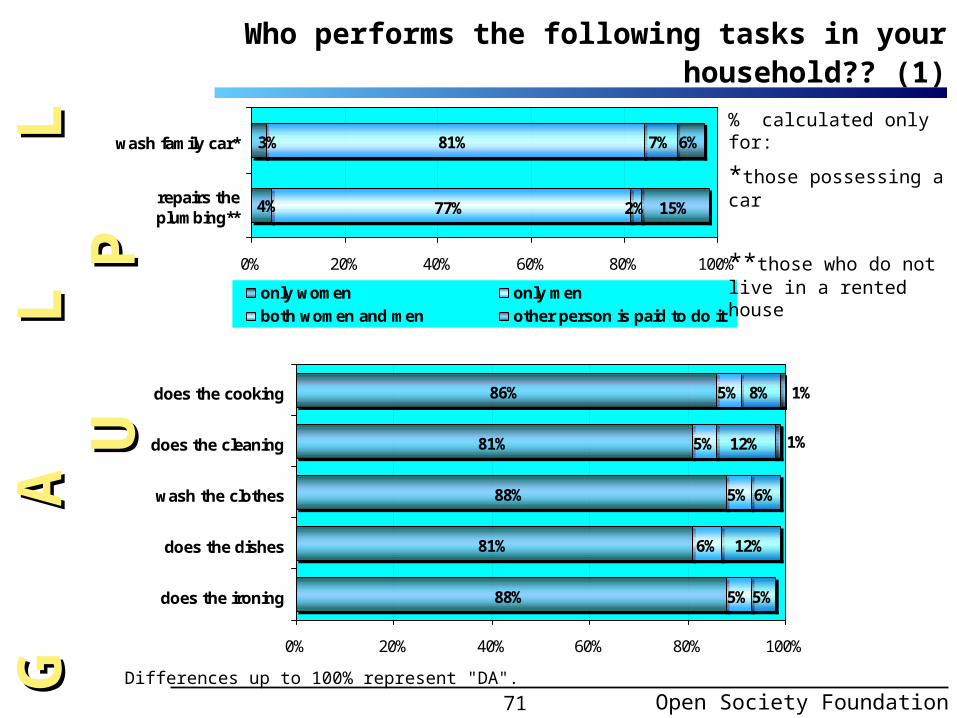
Who performs the following tasks in your household?? (1)
81%
77%
7%
2%
6%
15%4%
3%
0% 20% 40% 60% 80% 100%
wash family car*
repairs theplumbing**
only women only men
both women and men other person is paid to do it
Open Society Foundation
G A
G
A
L
L
U
L L
U
PP
86%
81%
88%
81%
88%
5%
5%
5%
6%
5%
8%
12%
6%
12%
5%
1%
1%
0% 20% 40% 60% 80% 100%
does the cooking
does the cleaning
wash the clothes
does the dishes
does the ironing
% calculated only for:
*those possessing a car
**those who do not live in a rented house
Differences up to 100% represent "DA".
72
R O
R
O
M
Â
N
I
M Â
N
I
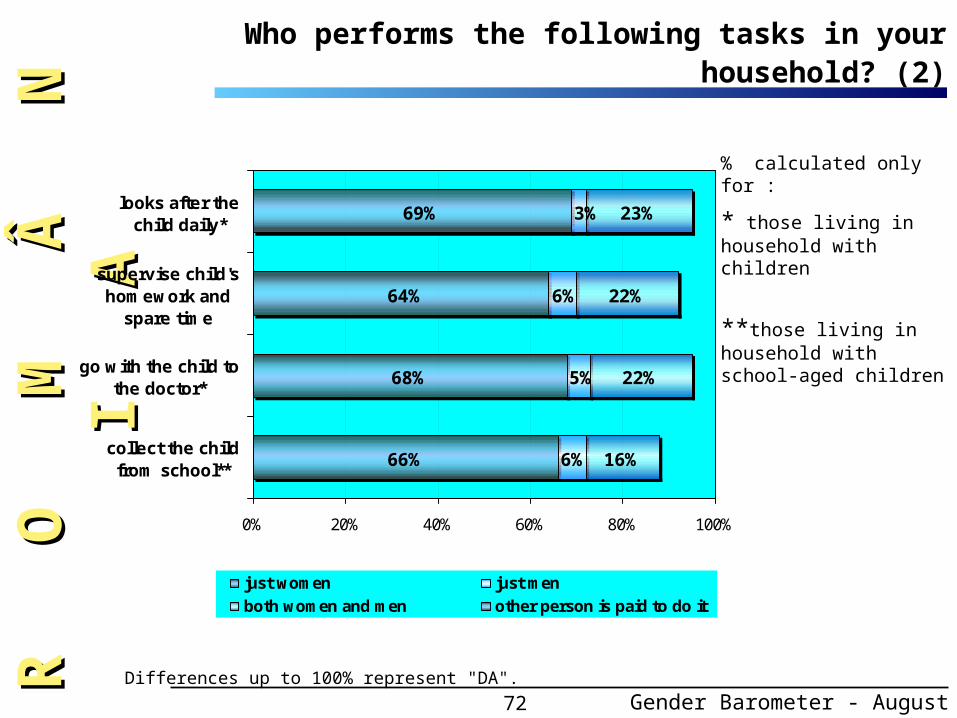
AAWho performs the following tasks in your household? (2)
Gender Barometer - August 2000
% calculated only for :
* those living in household with children
**those living in household with school-aged children
Differences up to 100% represent "DA".
68%
66%
23%
22%
22%
16%
69%
64%
6%
5%
6%
3%
0% 20% 40% 60% 80% 100%
looks after thechild daily*
supervise child'shomework and
spare time
go with the child tothe doctor*
collect the childfrom school**
just women just men
both women and men other person is paid to do it

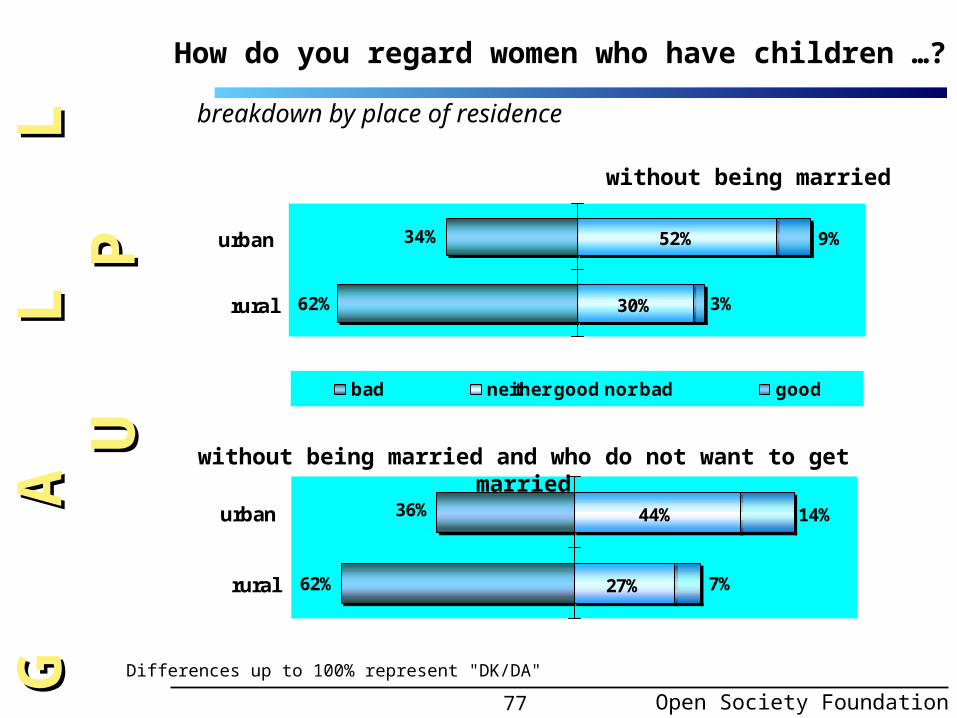
73
DN/DA5%
neither good
nor bad42%
bad47%
good6%
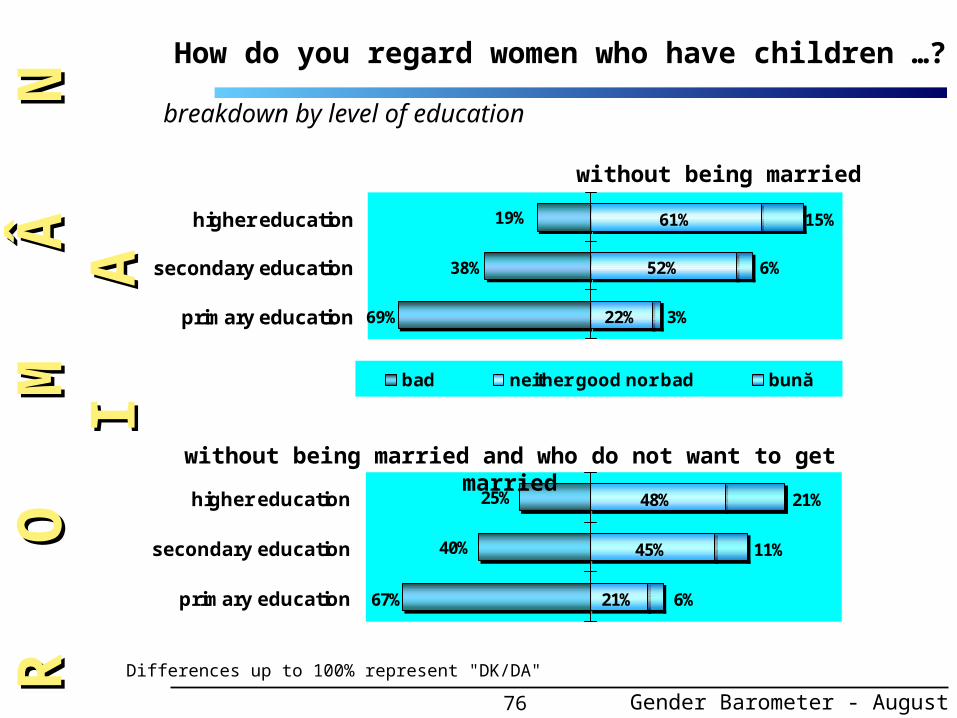
How do you regard women who have children …?
without being married
without being married and who do not want to get married
DN/DA5%
neither good
nor bad36%
bad48%
bad11%
Open Society Foundation
G A
G
A
L
L
U
L L
U
PP

74
38%
36%
38%
40%
51%
34%
36%
57%
51%
56%
54%
46%
35%
60%
44%
30%
1%
6%
5%
3%
7%
8%
14%
9%
Moldavia
Valachia
Oltenia
Dobrogea
Transylania
Crişana-Maram.
Banat
Bucharest
bad neither good, nor bad good
29%
32%
32%
48%
42%
33%
33%
48%35%
49%
59%
35%
40%
56%
55%
54%
12%
13%
2%
18%
8%
8%
8%
11%Moldova
Muntenia
Oltenia
Dobrogea
Transilvania
Crişana-Maram.
Banat
Bucureşti
without being married
without being married and who do not want to get married
breakdown by historical region
R O
R
O
M
Â
N
I
M Â
N
I
AAHow do you regard women who have children …?
Differences up to 100% represent "DK/DA"
Gender Barometer - August 2000

75
Differences up to 100% represent "DK/DA"
breakdown by age group
56%
48%
23%
34%
39%
67%
7%
8%
4%
18-29
30-45
60 and +
bad neither good, nor bad good
without being married
How do you regard women who have children …?
48%
40%
23%65%
42%
38% 11%
14%
6%
18-29
30-59
60 and+
without being married and who do not want to get married
Open Society Foundation
G A
G
A
L
L
U
L L
U
PP
76
breakdown by level of education
22%
52%
61%19%
38%
69%
15%
6%
3%primary education
secondary education
higher education
bad neither good nor bad bună
21%
45%
48%
67%
40%
25%
6%
11%
21%
primary education
secondary education
higher education
without being married
without being married and who do not want to get married
R O
R
O
M
Â
N
I
M Â
N
I
AAHow do you regard women who have children …?
Differences up to 100% represent "DK/DA"
Gender Barometer - August 2000
77
30%
52%
62%
34%
3%
9%
rural
urban
bad neither good nor bad good
Differences up to 100% represent "DK/DA"
breakdown by place of residence
How do you regard women who have children …?
27%
44%
62%
36%
7%
14%
rural
urban
without being married
without being married and who do not want to get married
Open Society Foundation
G A
G
A
L
L
U
L L
U
PP
78
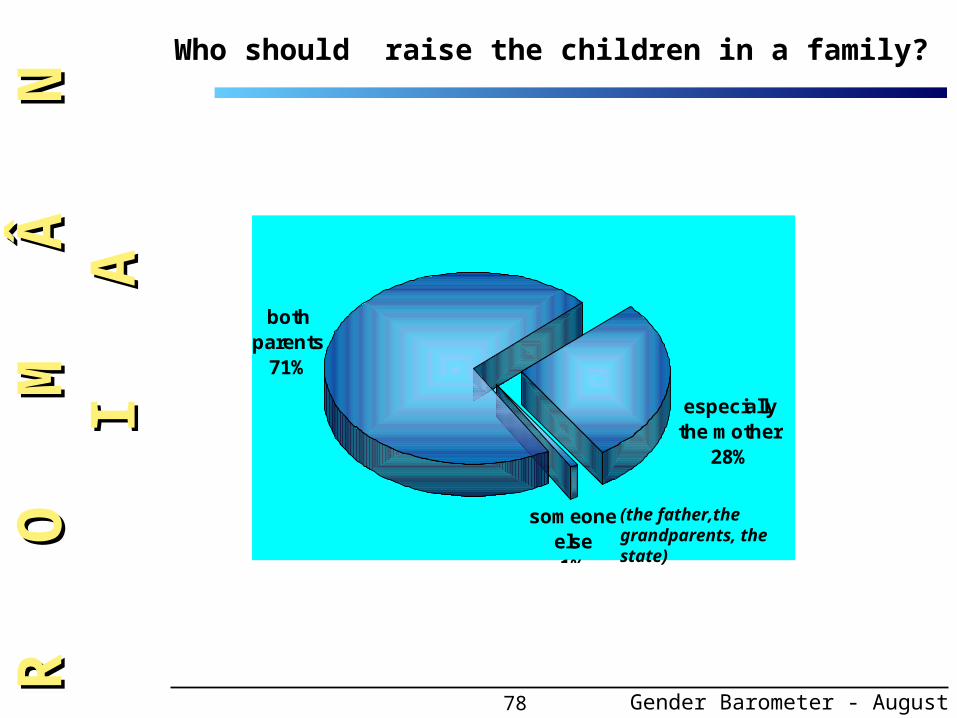
especially the mother
28%
someone else1%
both parents
71%
(the father,the grandparents, the state)
R O
R
O
M
Â
N
I
M Â
N
I
AAWho should raise the children in a family?
Gender Barometer - August 2000
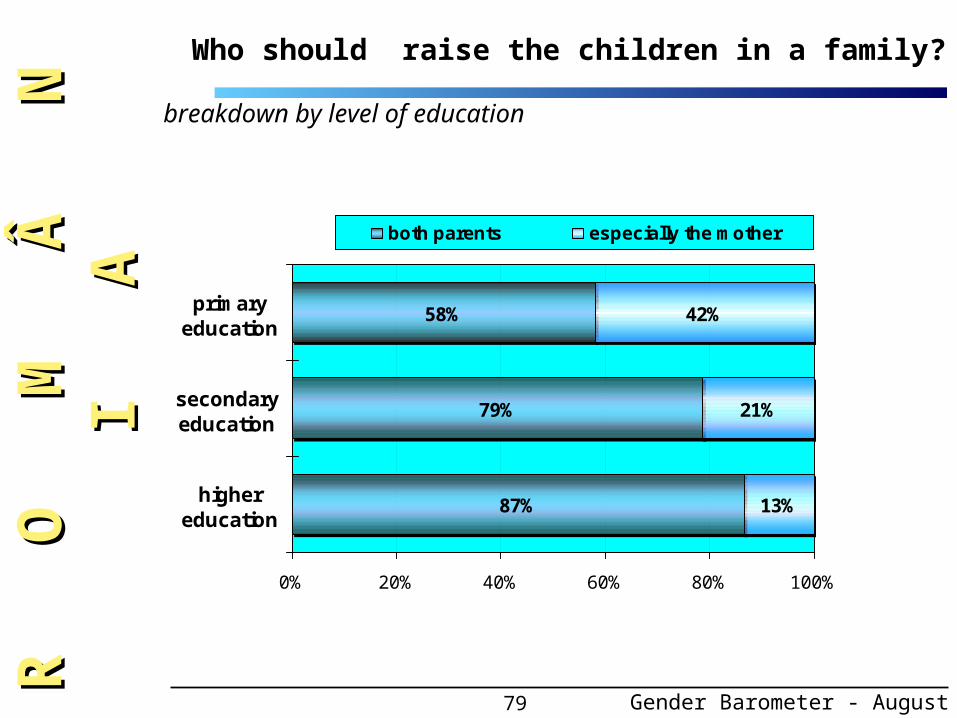
79
58%
79%
87%
42%
21%
13%
0% 20% 40% 60% 80% 100%
primaryeducation
secondaryeducation
highereducation
both parents especially the mother
breakdown by level of education
R O
R
O
M
Â
N
I
M Â
N
I
AAWho should raise the children in a family?
Gender Barometer - August 2000
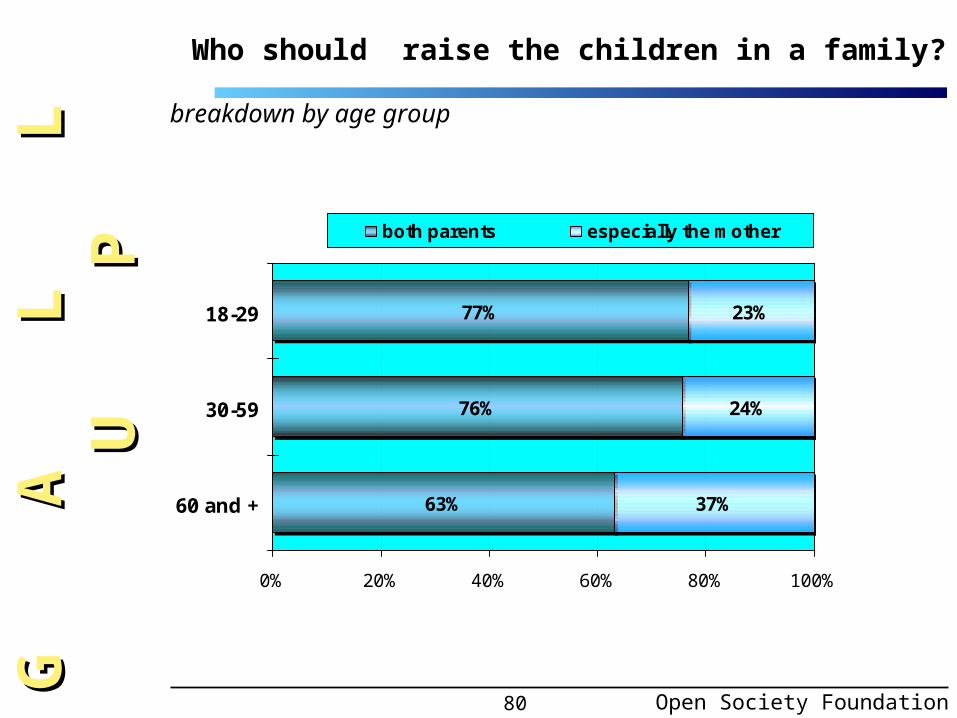
80
77%
76%
63%
23%
24%
37%
0% 20% 40% 60% 80% 100%
18-29
30-59
60 and +
both parents especially the mother
Who should raise the children in a family?
breakdown by age group
Open Society Foundation
G A
G
A
L
L
U
L L
U
PP
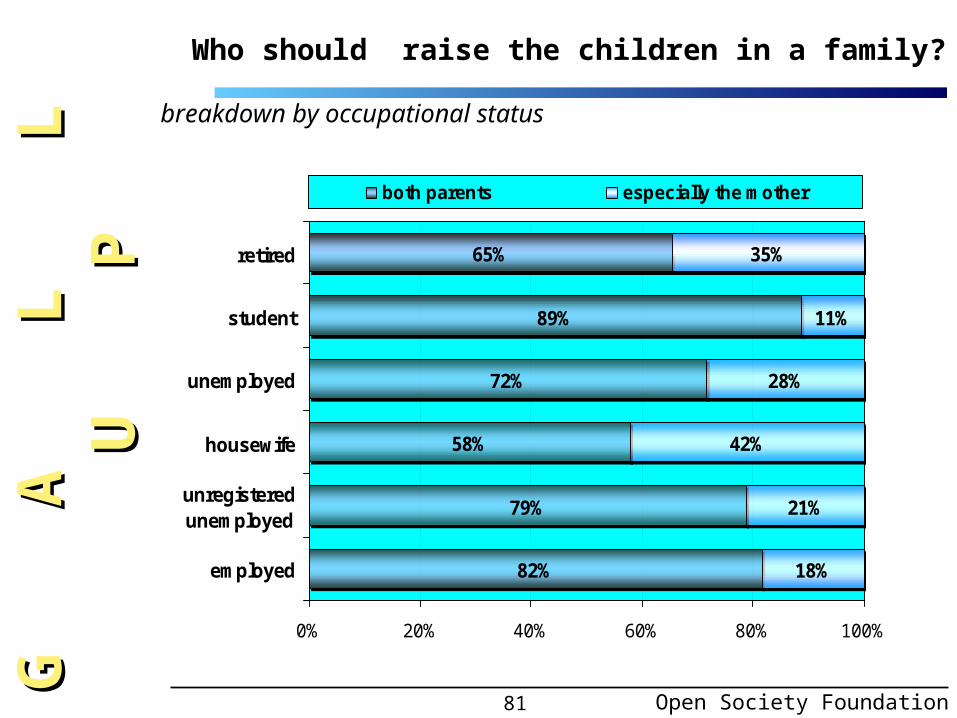
81
65%
89%
72%
58%
79%
82%
35%
11%
28%
42%
21%
18%
0% 20% 40% 60% 80% 100%
retired
student
unemployed
housewife
unregisteredunemployed
employed
both parents especially the mother
breakdown by occupational status
Who should raise the children in a family?
Open Society Foundation
G A
G
A
L
L
U
L L
U
PP
82
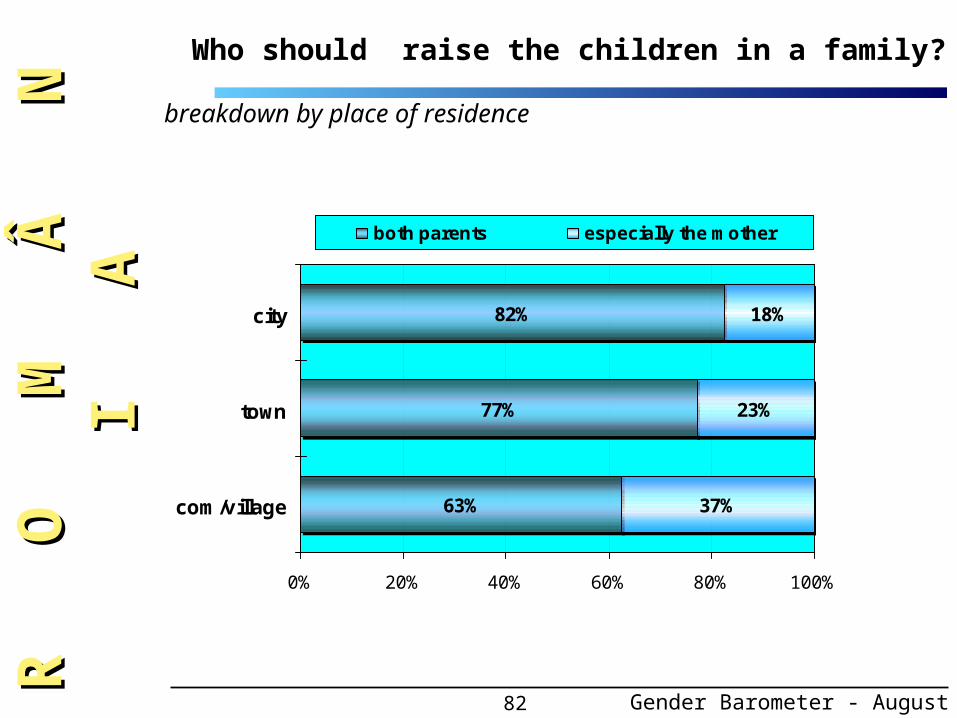
82%
77%
63%
18%
23%
37%
0% 20% 40% 60% 80% 100%
city
town
com/village
both parents especially the mother
breakdown by place of residence
R O
R
O
M
Â
N
I
M Â
N
I
AAWho should raise the children in a family?
Gender Barometer - August 2000
83
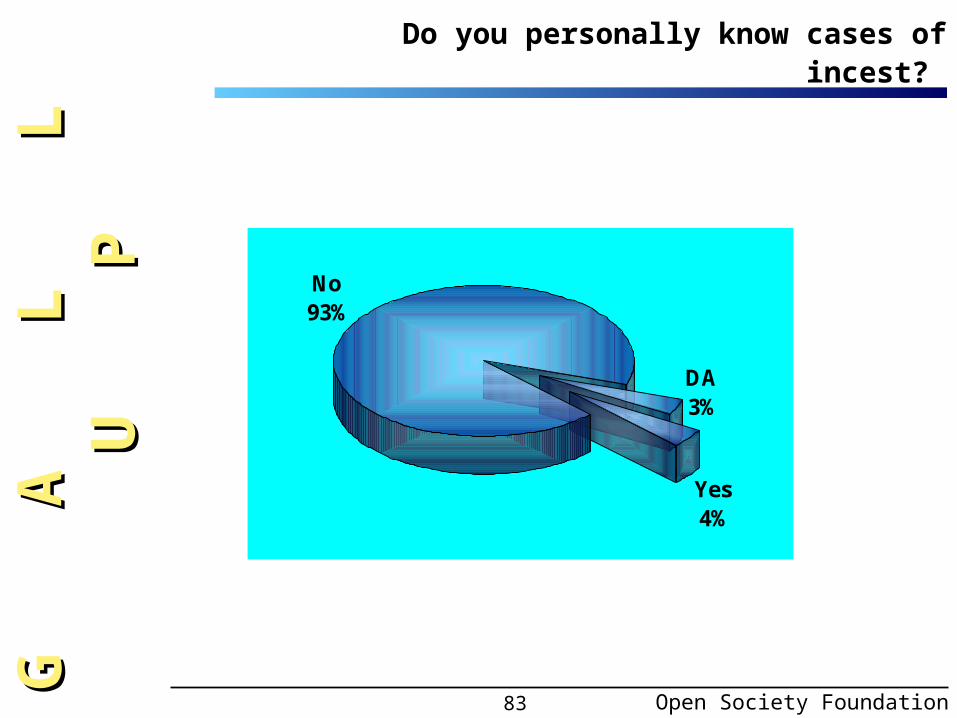
No93%
DA3%
Yes4%
Do you personally know cases of incest?
Open Society Foundation
G A
G
A
L
L
U
L L
U
PP
84
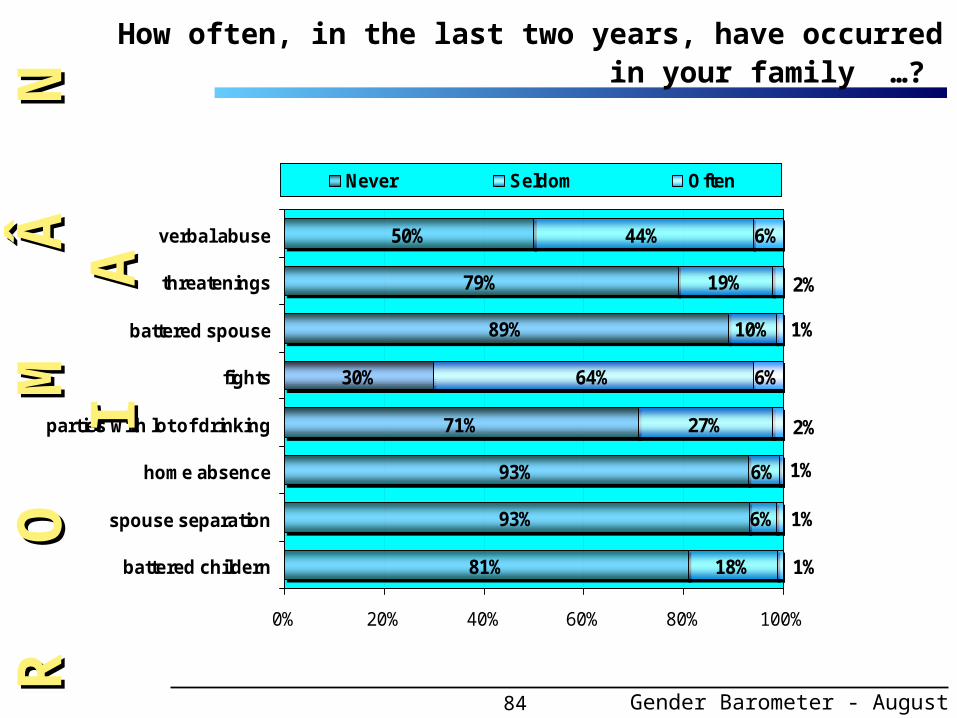
How often, in the last two years, have occurred in your family …?
50%
79%
89%
30%
71%
93%
93%
81%
44%
19%
10%
64%
27%
6%
18%
6%
6%
6%
1%
1%
1%
2%
1%
2%
0% 20% 40% 60% 80% 100%
verbal abuse
threatenings
battered spouse
fights
parties with lot of drinking
home absence
spouse separation
battered childern
Never Seldom Often
R O
R
O
M
Â
N
I
M Â
N
I
AA
Gender Barometer - August 2000
85
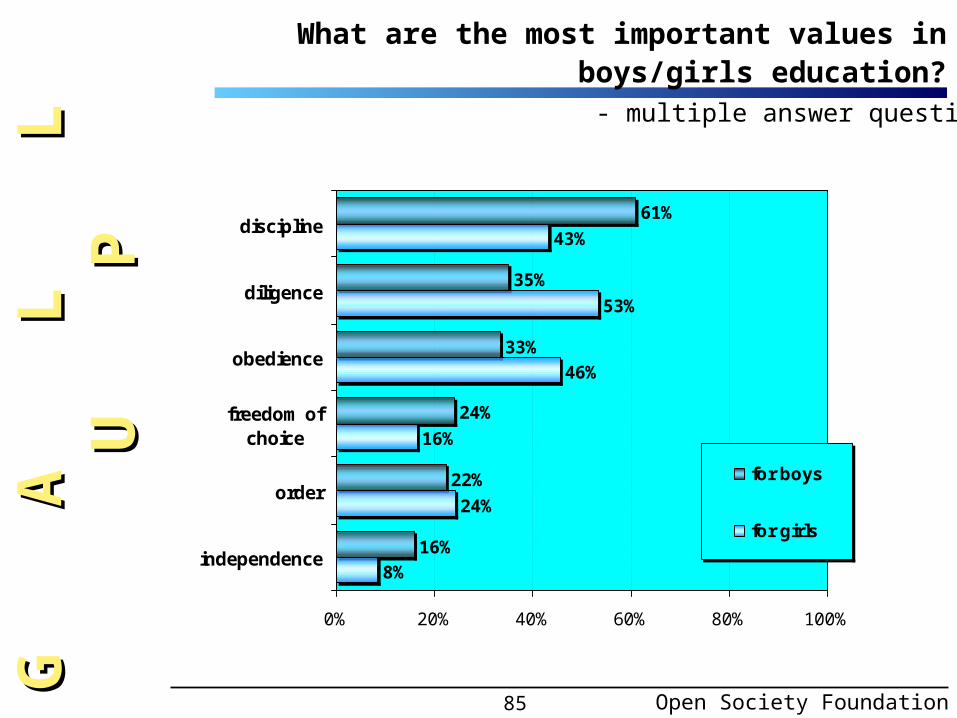
61%
35%
33%
24%
22%
16%
43%
53%
46%
16%
24%
8%
0% 20% 40% 60% 80% 100%
discipline
diligence
obedience
freedom ofchoice
order
independence
for boys
for girls
What are the most important values in boys/girls education?
- multiple answer question -
Open Society Foundation
G A
G
A
L
L
U
L L
U
PP
86
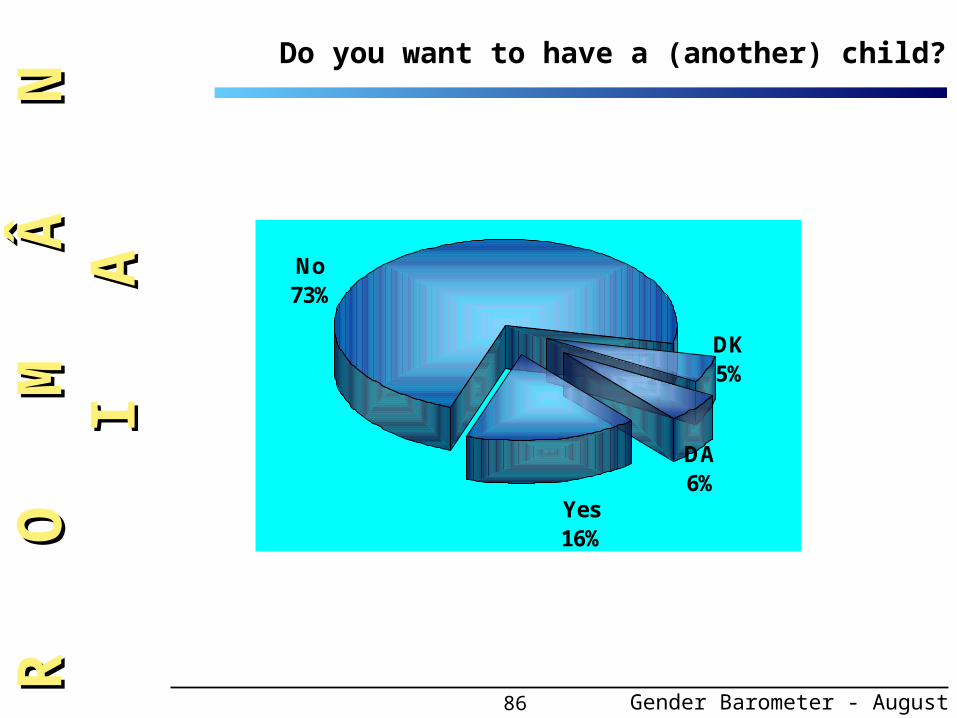
Yes16%
DK5%
No73%
DA6%
R O
R
O
M
Â
N
I
M Â
N
I
AADo you want to have a (another) child?
Gender Barometer - August 2000

87
DA7%
No68%
DK6%
Yes19%
breakdown by sex
DA5%
No77%
DK4%
Yes14%
males
females
Do you want to have a (another) child?
Open Society Foundation
G A
L
L
U
G A
L
L
U
PP

88
DA17%
No41%
I can not have
children32%
Yes10%
Do you protect yourself against unwanted pregnancies?
% calculated just for those who do not want to have a child.
R O
R
O
M
Â
N
I
M Â
N
I
AA
Gender Barometer - August 2000
89
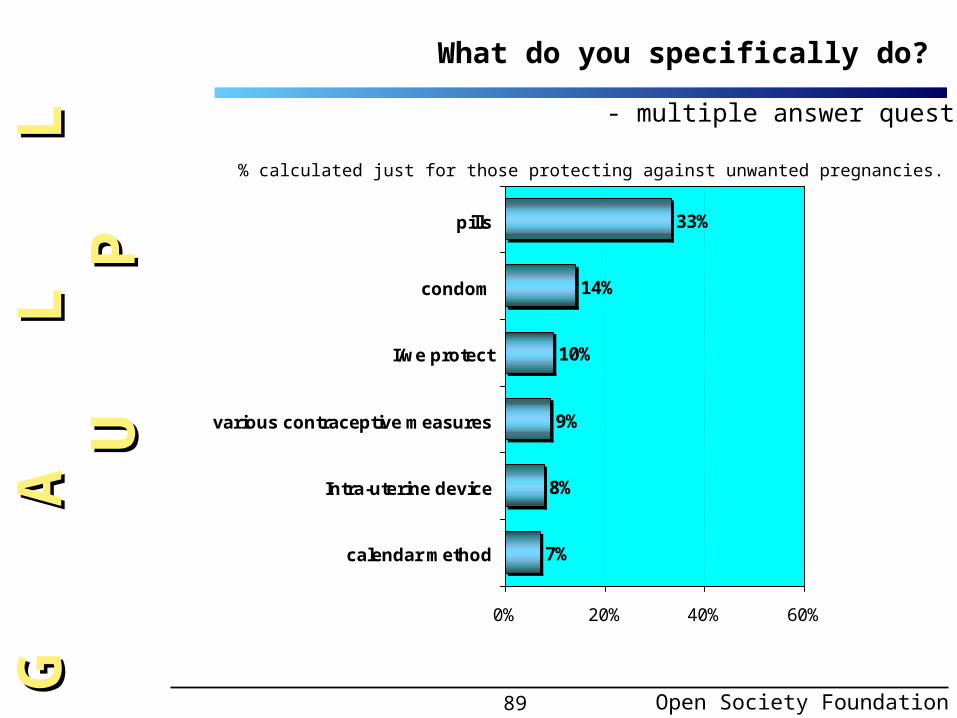
33%
14%
10%
9%
8%
7%
0% 20% 40% 60%
pills
condom
I/we protect
various contraceptive measures
Intra-uterine device
calendar method
What do you specifically do?
% calculated just for those protecting against unwanted pregnancies.
Open Society Foundation
G A
L
L
U
G A
L
L
U
PP- multiple answer question -

90
Have you had any spare time in June 2000 (i.e. you did not have to work at your job, at home or anywhere else)?
Only on religious holydays
14%
Several days a month, not
necessarily on religious holidays
5%No
12%
DN/DA2%
1-2 days a week, not necessarily
on Saturadays or Sundays
4%
Almost daily17%
Only in week-ends25%
Whenever I wanted
21%
R O
M
Â
N
I
R O
M
Â
N
I
AA
Gender Barometer - August 2000

91
Do you want to have more or less spare time?
37%
44%
39%
37%
11%
6%
10%
9%
0% 20% 40% 60% 80% 100%
males
women
more the same less I cannot estimate
breakdown by sex
Differences up to 100% represent "DK/DA"
Open Society Foundation
G A
L
L
U
G A
L
L
U
PP
92
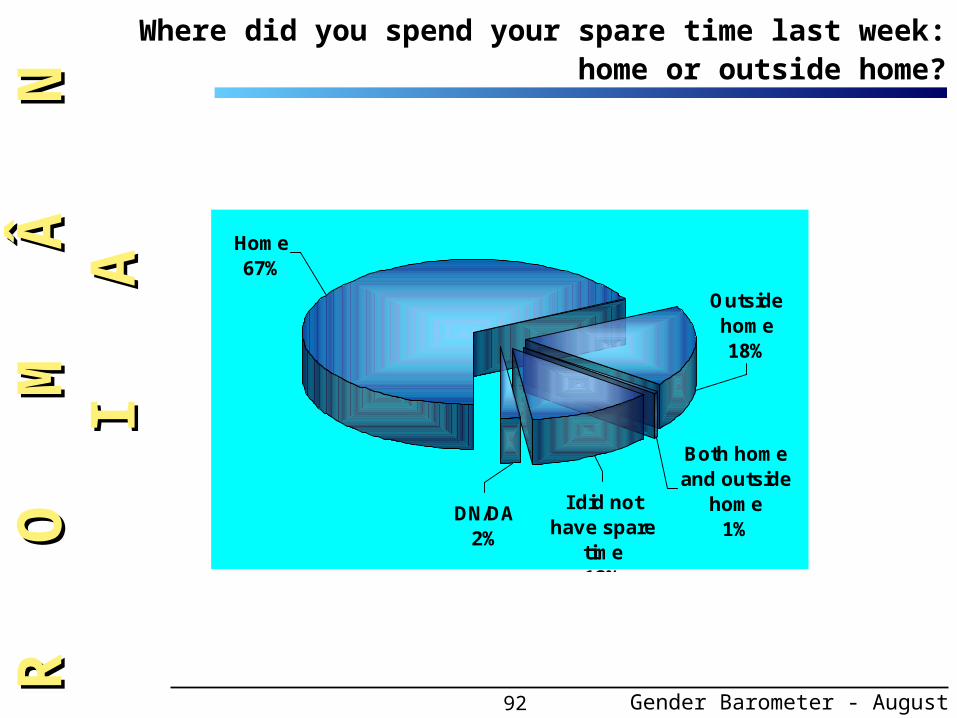
DN/DA2%
I did not have spare
time12%
Outside home18%
Both home and outside
home1%
Home67%
R O
M
Â
N
I
R O
M
Â
N
I
AA
Where did you spend your spare time last week: home or outside home?
Gender Barometer - August 2000
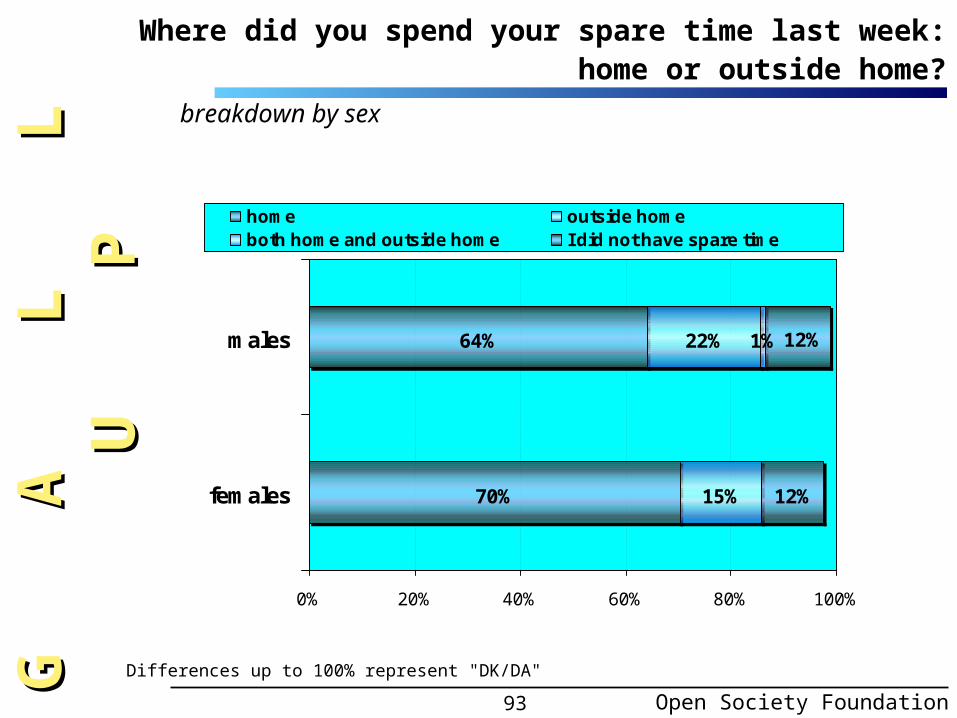
93
64%
70%
22%
15%
1%
12%
12%
0% 20% 40% 60% 80% 100%
males
females
home outside homeboth home and outside home I did not have spare time
Differences up to 100% represent "DK/DA"
Where did you spend your spare time last week: home or outside home?
breakdown by sex
Open Society Foundation
G A
L
L
U
G A
L
L
U
PP
94
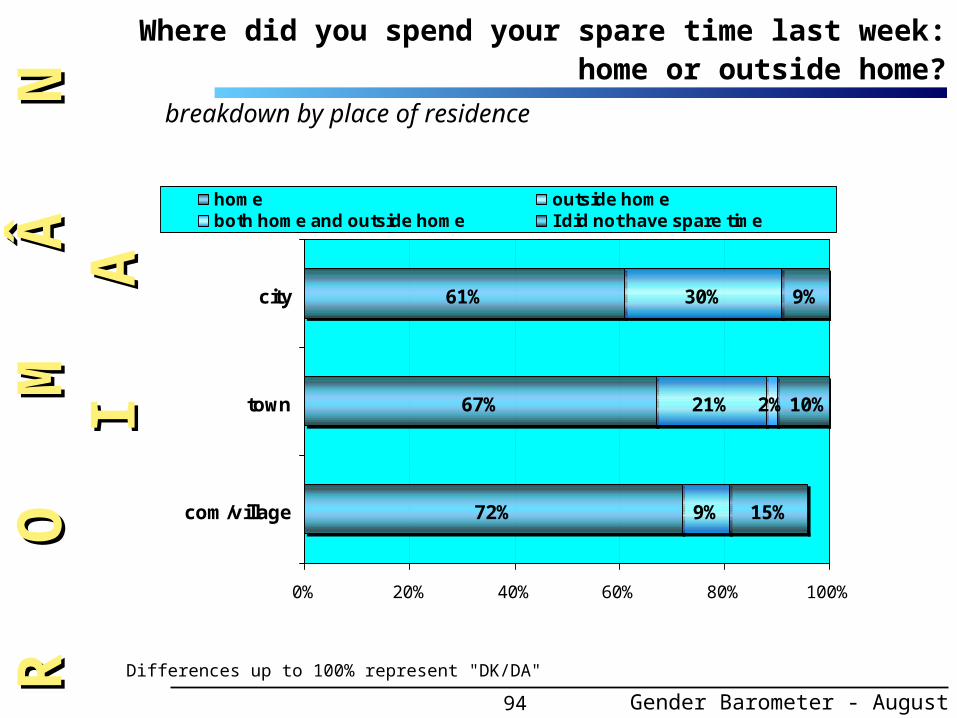
breakdown by place of residence
61%
67%
72%
30%
21%
9%
2%
9%
15%
10%
0% 20% 40% 60% 80% 100%
city
town
com/village
home outside homeboth home and outside home I did not have spare time
R O
R
O
M
Â
N
I
M Â
N
I
AA
Where did you spend your spare time last week: home or outside home?
Differences up to 100% represent "DK/DA"
Gender Barometer - August 2000
95
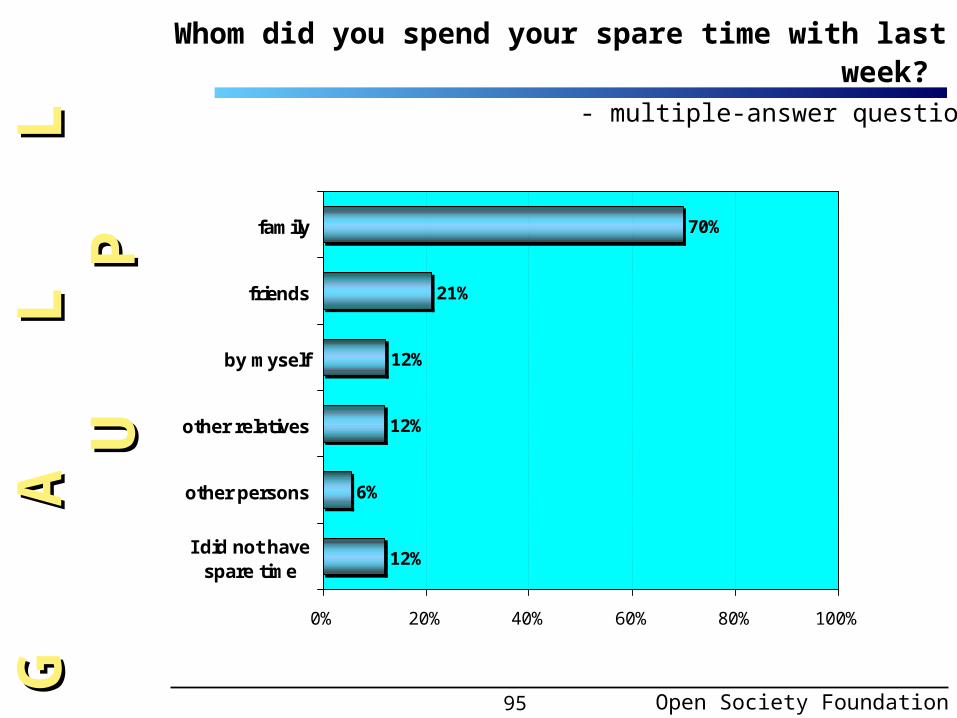
Whom did you spend your spare time with last week?
- multiple-answer question -
70%
21%
12%
12%
6%
12%
0% 20% 40% 60% 80% 100%
family
friends
by myself
other relatives
other persons
I did not havespare time
Open Society Foundation
G A
G
A
L
L
U
L L
U
PP

96
70%
26%
12%
10%
10%
6%
70%
18%
12%
13%
14%
5%
0% 20% 40% 60% 80% 100%
family
friends
I did not havespare time
other relatives
by myself
other persons
males
females
breakdown by sex
How to read the figure: 70% of male respondents spent their spare time with families, 26% with their friends, 12% did not have spare time, etc. 70% of female respondents spent their spare time with their family, 18% with friends, 12% did not have spare time, etc.
R O
M
Â
N
I
R O
M
Â
N
I
AAWhom did you spend your spare time with?
Gender Barometer - August 2000
- multiple-answer question -
97
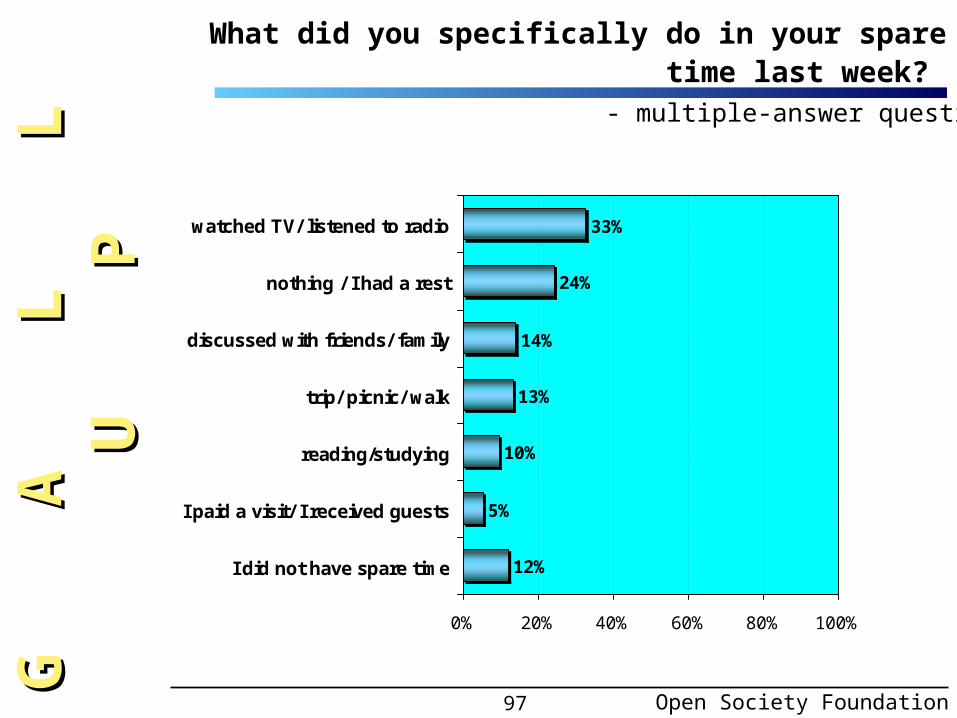
What did you specifically do in your spare time last week?
33%
24%
14%
13%
10%
5%
12%
0% 20% 40% 60% 80% 100%
watched TV/ listened to radio
nothing / I had a rest
discussed with friends/ family
trip/ picnic/ walk
reading/studying
I paid a visit/ I received guests
I did not have spare time
Open Society Foundation
G A
L
L
U
G A
L
L
U
PP- multiple-answer question -
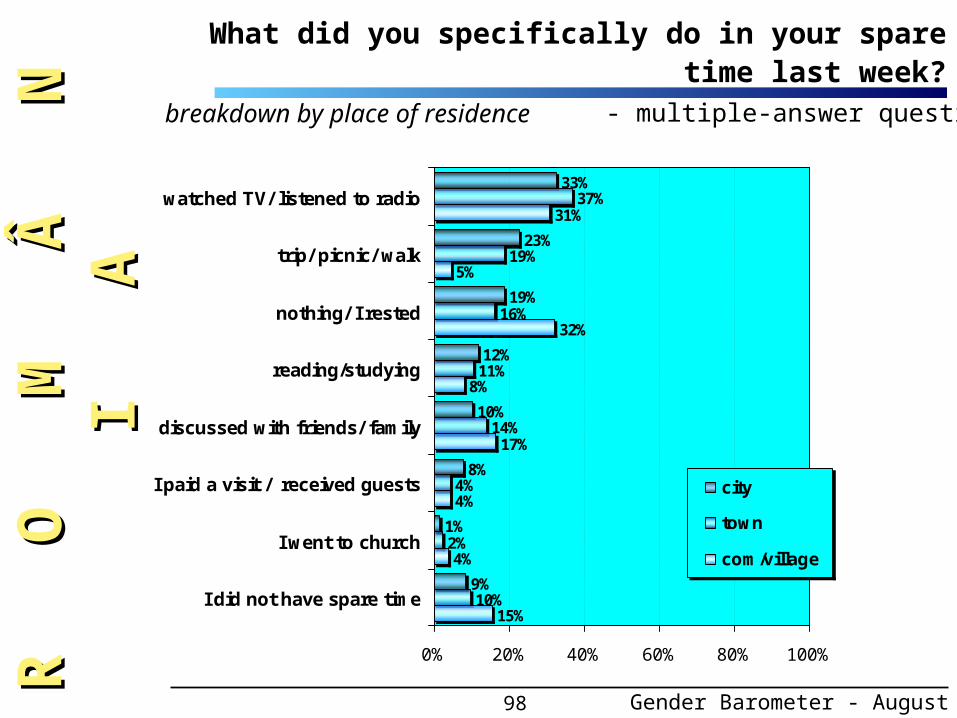
98
33%
23%
19%
12%
10%
8%
1%
9%
37%
19%
16%
11%
14%
4%
2%
10%
31%
5%
32%
8%
17%
4%
4%
15%
0% 20% 40% 60% 80% 100%
watched TV/ listened to radio
trip/ picnic/ walk
nothing/ I rested
reading/studying
discussed with friends/ family
I paid a visit / received guests
I went to church
I did not have spare time
city
town
com/village
breakdown by place of residence
R O
R
O
M
Â
N
I
M Â
N
I
AAWhat did you specifically do in your spare time last week?
Gender Barometer - August 2000
- multiple-answer question -

99
DN/DA13%
should be outlawed
51%
should be legalized
36%
In your opinion should prostitution be outlawed or legalized?
Open Society Foundation
G A
L
L
U
G A
L
L
U
PP

100
45%
56%
44%
30%
11%
14%
0% 20% 40% 60% 80% 100%
males
females
outlawed legalized DN/A
breakdown by sex
R O
R
O
M
Â
N
I
M Â
N
I
AA
In your opinion should prostitution be outlawed or legalized?
Gender Barometer - August 2000
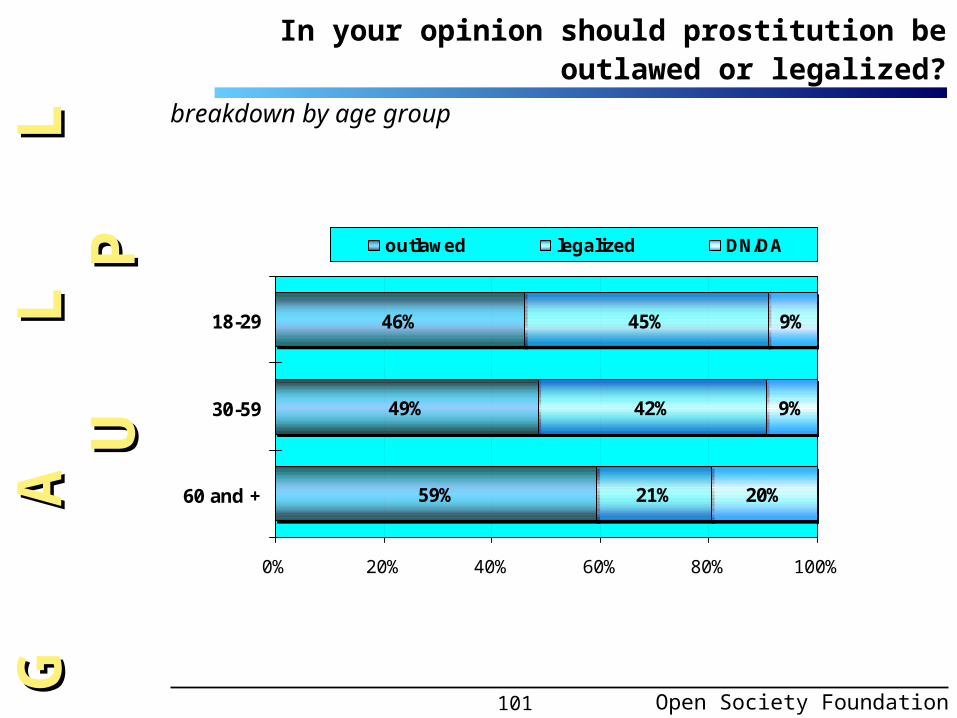
101
46%
49%
59%
45%
42%
21%
9%
9%
20%
0% 20% 40% 60% 80% 100%
18-29
30-59
60 and +
outlawed legalized DN/DA
In your opinion should prostitution be outlawed or legalized?
breakdown by age group
Open Society Foundation
G A
G
A
L
L
U
L L
U
PP
102
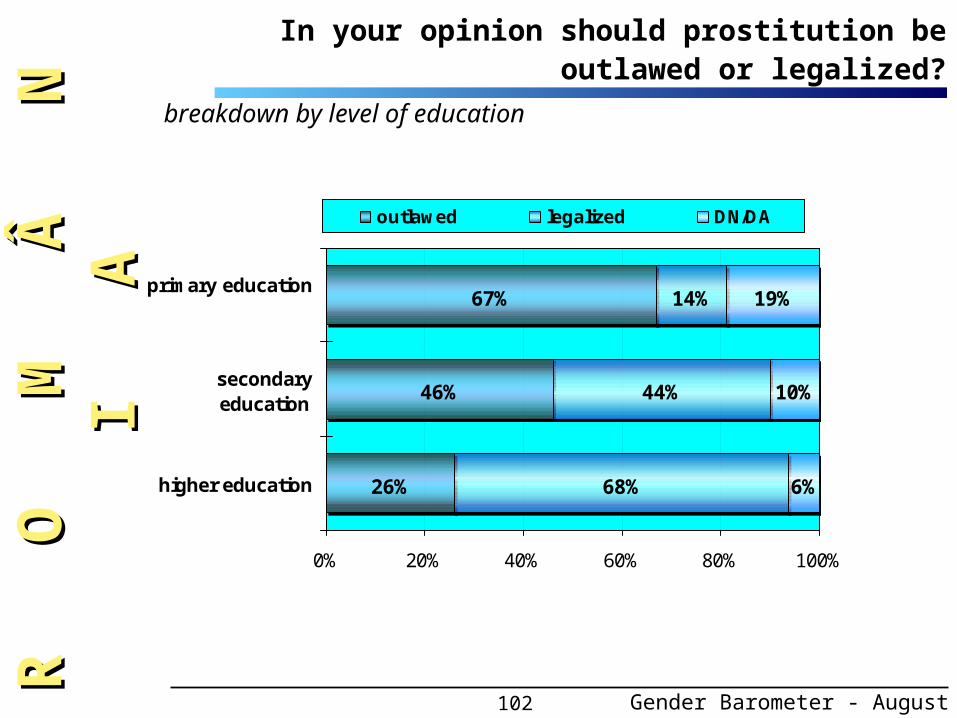
67%
46%
26%
14%
44%
68%
19%
10%
6%
0% 20% 40% 60% 80% 100%
primary education
secondaryeducation
higher education
outlawed legalized DN/DA
breakdown by level of education
R O
R
O
M
Â
N
I
M Â
N
I
AA
In your opinion should prostitution be outlawed or legalized?
Gender Barometer - August 2000

103
36%
47%
64%
55%
42%
20%
9%
11%
16%
0% 20% 40% 60% 80% 100%
city
town
com/village
outlawed legalized DN/DA
In your opinion should prostitution be outlawed or legalized?
breakdown by place of residence
Open Society Foundation
G A
G
A
L
L
U
L L
U
PP
104
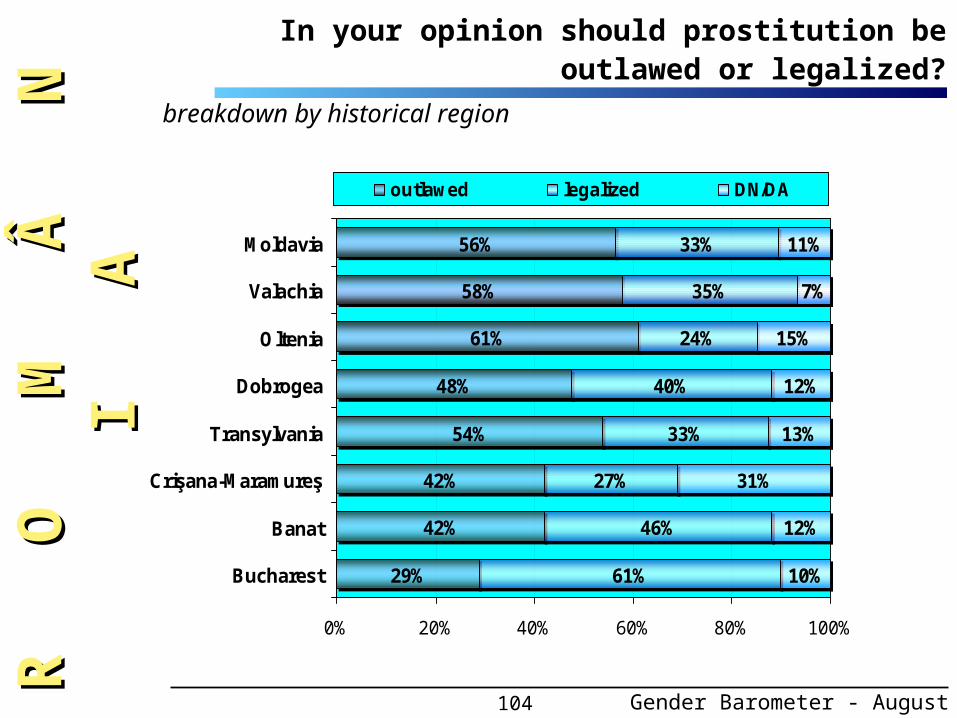
56%
58%
61%
48%
54%
42%
42%
29%
33%
35%
24%
40%
33%
27%
61%
11%
7%
15%
12%
13%
31%
12%
10%
46%
0% 20% 40% 60% 80% 100%
Moldavia
Valachia
Oltenia
Dobrogea
Transylvania
Crişana-Maramureş
Banat
Bucharest
outlawed legalized DN/DA
breakdown by historical region
R O
R
O
M
Â
N
I
M Â
N
I
AA
In your opinion should prostitution be outlawed or legalized?
Gender Barometer - August 2000
105
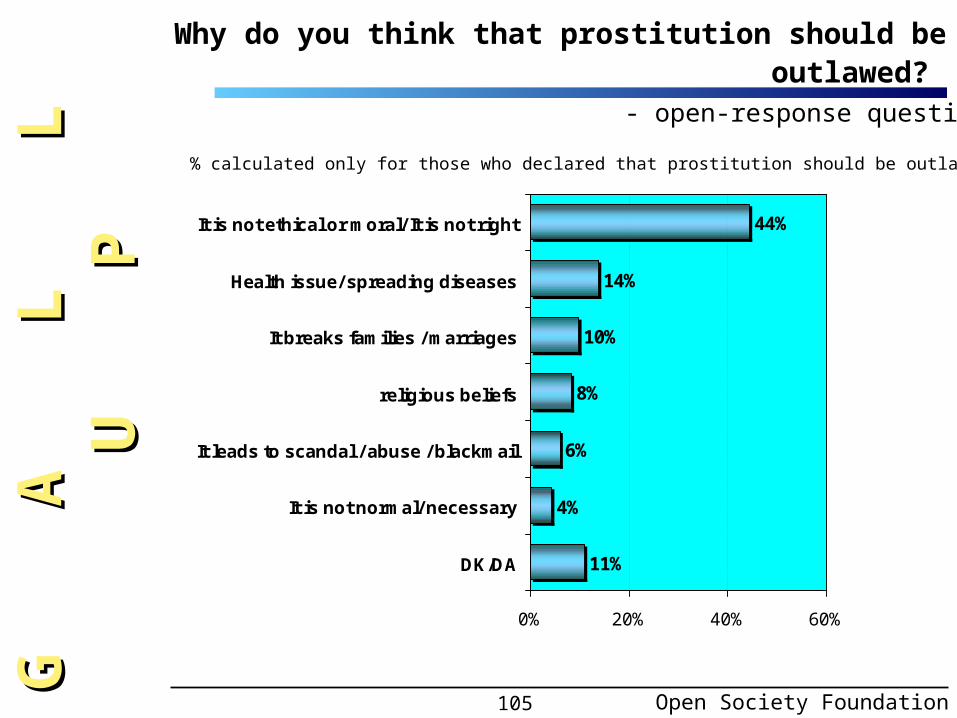
44%
14%
10%
8%
6%
4%
11%
0% 20% 40% 60%
It is not ethical or moral/ It is not right
Health issue/ spreading diseases
It breaks families / marriages
religious beliefs
It leads to scandal / abuse / blackmail
It is not normal/ necessary
DK/DA
Why do you think that prostitution should be outlawed?
% calculated only for those who declared that prostitution should be outlawed
Open Society Foundation
G A
G
A
L
L
U
L L
U
PP- open-response question -
106
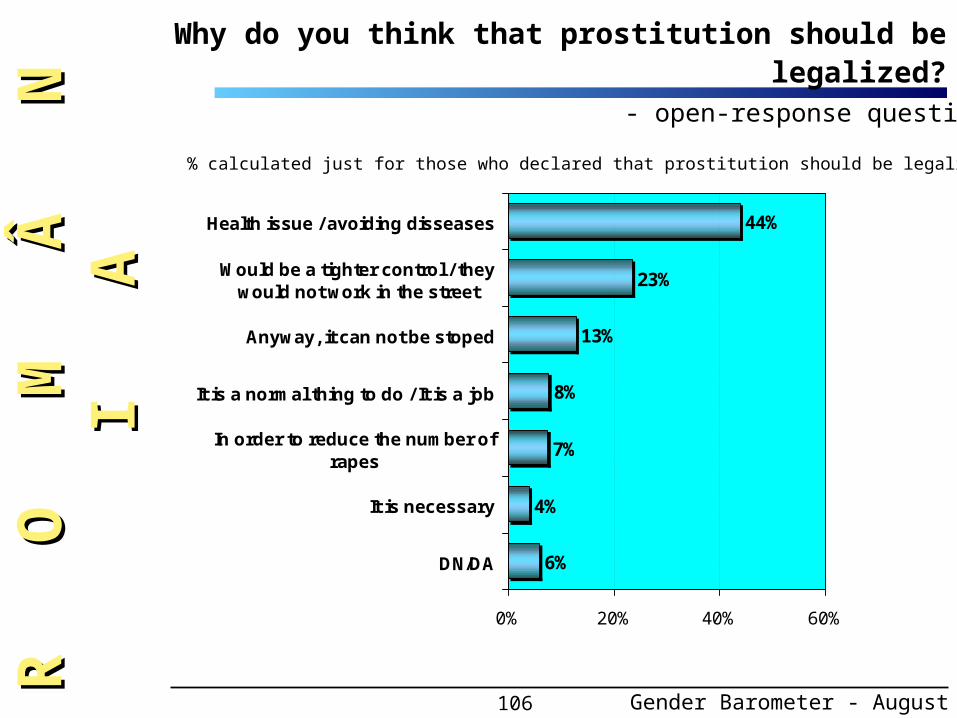
44%
23%
13%
8%
7%
4%
6%
0% 20% 40% 60%
Health issue / avoiding disseases
Would be a tighter control / theywould not work in the street
Anyway, it can not be stoped
It is a normal thing to do / It is a job
In order to reduce the number ofrapes
It is necessary
DN/DA
R O
R
O
M
Â
N
I
M Â
N
I
AAWhy do you think that prostitution should be legalized?
% calculated just for those who declared that prostitution should be legalized
Gender Barometer - August 2000
- open-response question -
107
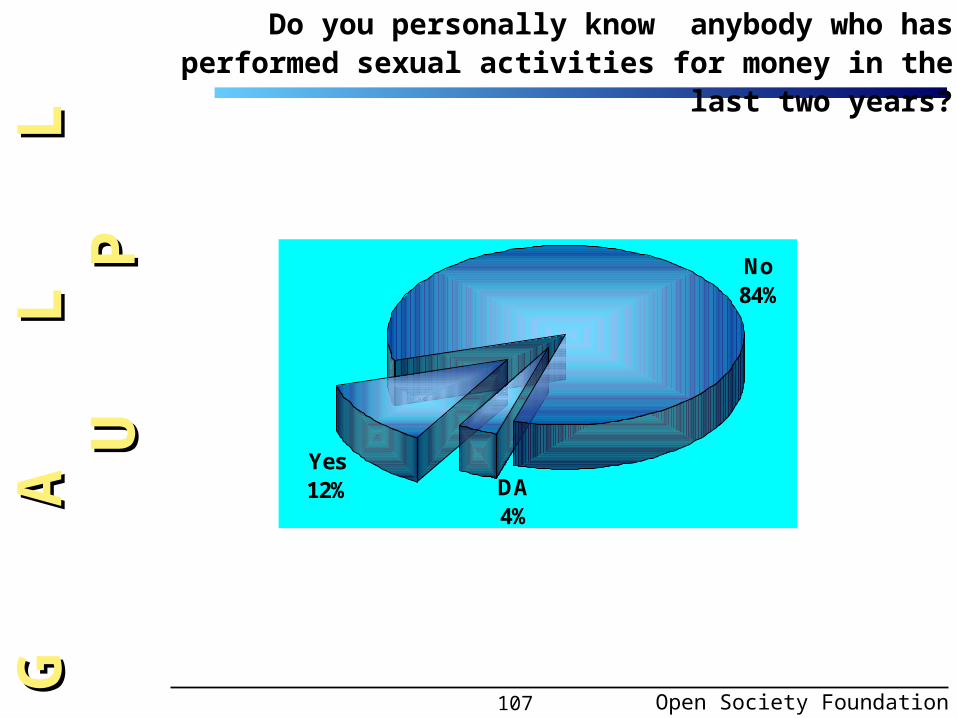
No84%
DA4%
Yes12%
Do you personally know anybody who has performed sexual activities for money in the last two years?
Open Society Foundation
G A
G
A
L
L
U
L L
U
PP
108
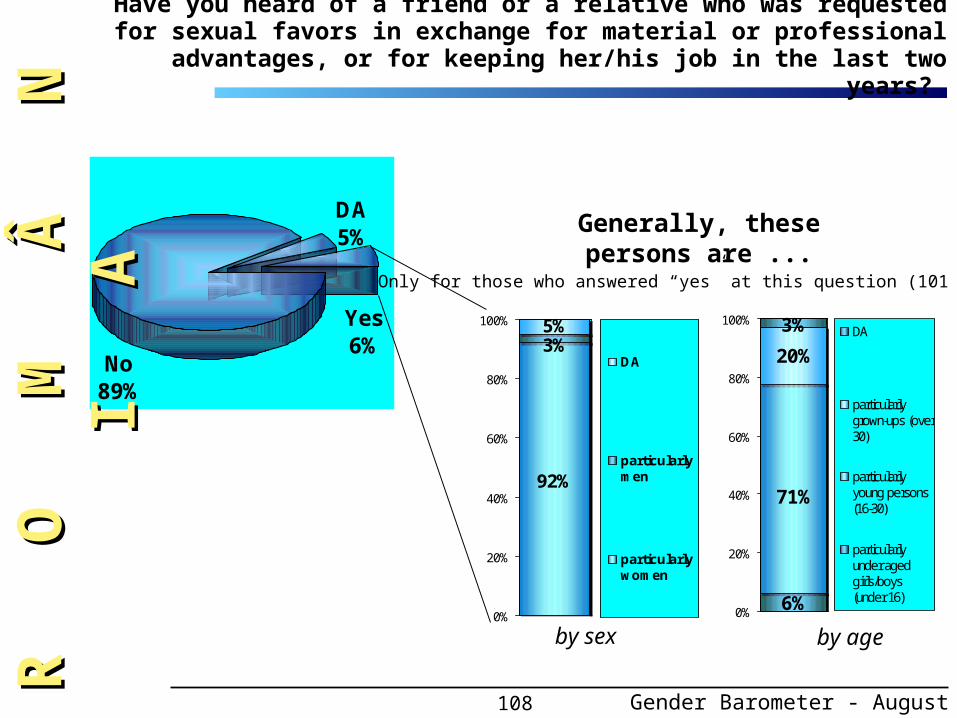
Have you heard of a friend or a relative who was requested for sexual favors in exchange for material or professional advantages, or for
keeping her/his job in the last two years?
Yes6%
DA5%
No89%
Generally, these persons are ...
92%
3%5%
0%
20%
40%
60%
80%
100%
DA
particularlymen
particularlywomen
6%
3%
71%
20%
0%
20%
40%
60%
80%
100%DA
particularlygrown-ups (over30)
particularlyyoung persons(16-30)
particularlyunder agedgirls/boys(under 16)
by sex by age
Only for those who answered “yes” at this question (101 respondents)
R O
M
Â
N
I
R O
M
Â
N
I
AA
Gender Barometer - August 2000
109
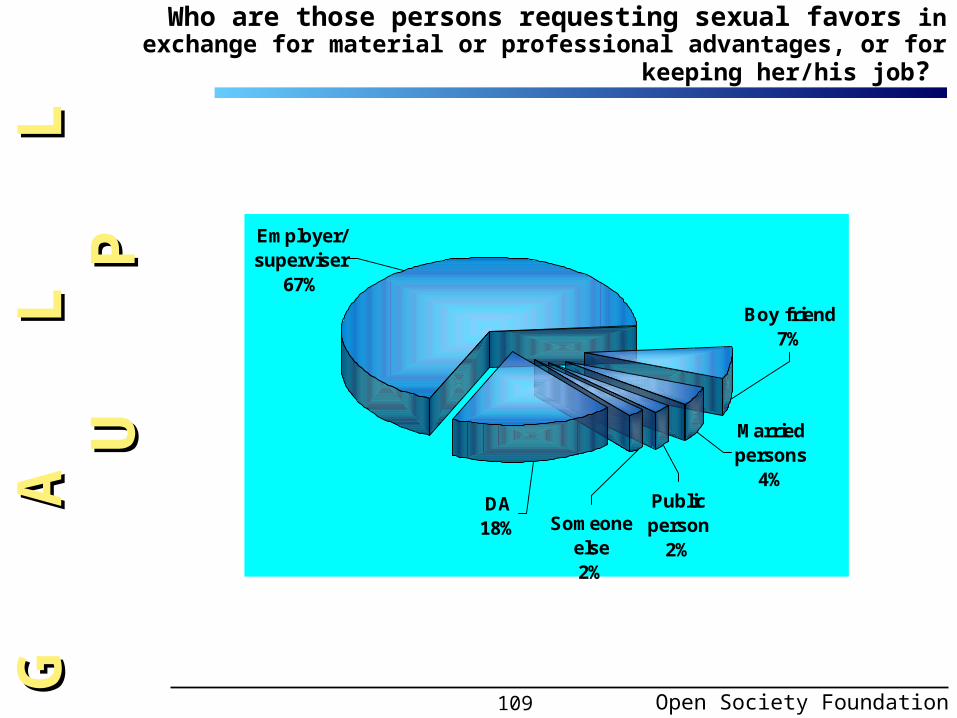
Public person
2%
Someone else2%
Married persons
4%
Employer/ superviser
67%
Boy friend7%
DA18%
Open Society Foundation
Who are those persons requesting sexual favors in exchange for material or professional advantages, or for keeping her/his job?
G A
L
L
U
G A
L
L
U
PP
110
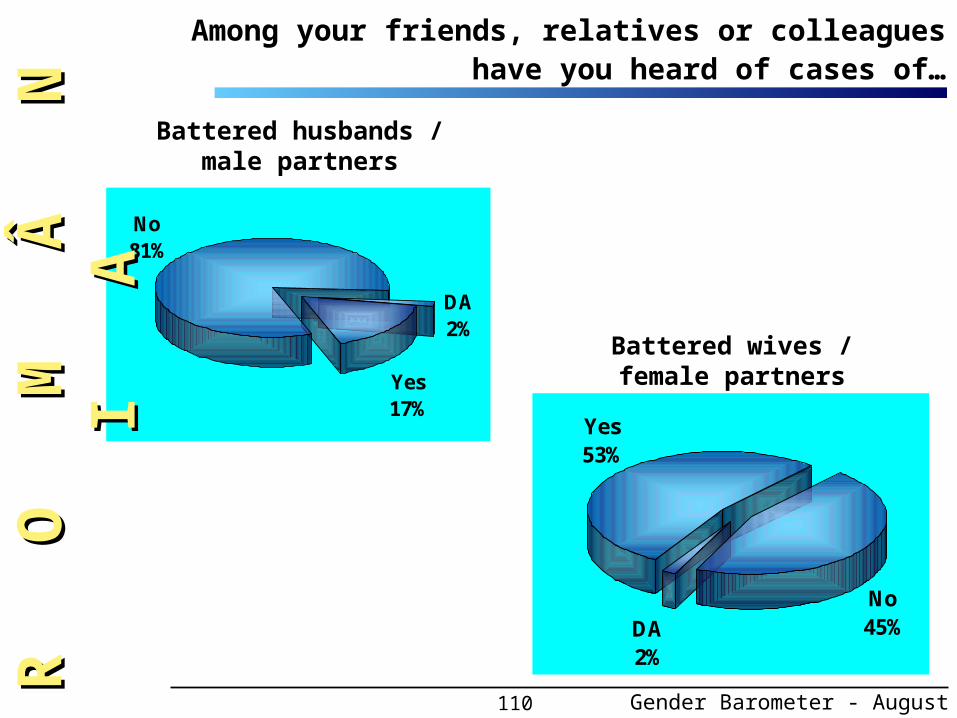
No81%
DA2%
Yes17%
No45%DA
2%
Yes53%
Battered husbands / male partners
Battered wives / female partners
Among your friends, relatives or colleagues have you heard of cases of…
R O
R
O
M
Â
N
I
M Â
N
I
AA
Gender Barometer - August 2000

111
64%
52%
47%
36%
46%
50%
0% 20% 40% 60% 80% 100%
18-29
30-59
60 and +
Yes No
breakdown by age group
Have you heard of cases of battered husbands/partners among your friends, relatives or colleagues?
Differences up to 100% represent "DK/DA"
Open Society Foundation
G A
G
A
L
L
U
L L
U
PP

112
57%
53%
42%
41%
45%
57%
0% 20% 40% 60% 80% 100%
primaryeducation
secondaryeducation
higher education
Yes No
breakdown by level of education
R O
M
Â
N
I
R O
M
Â
N
I
AA
Have you heard of cases of battered husbands/partners among your friends, relatives or colleagues?
Differences up to 100% represent "DK/DA"
Gender Barometer - August 2000
113
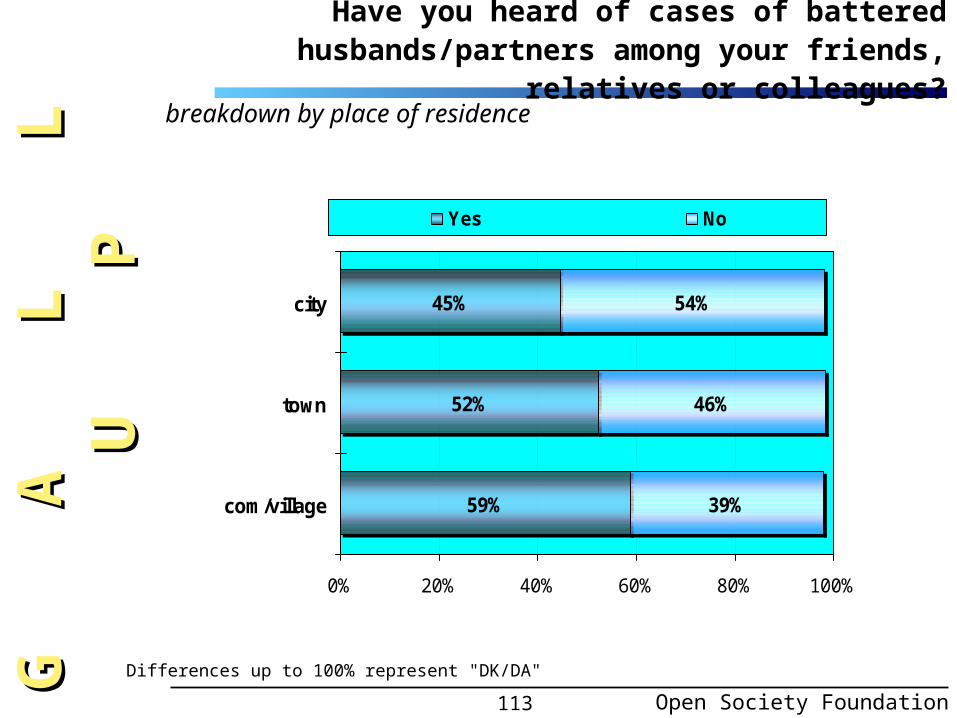
45%
52%
59%
54%
46%
39%
0% 20% 40% 60% 80% 100%
city
town
com/village
Yes No
breakdown by place of residence
Have you heard of cases of battered husbands/partners among your friends, relatives or colleagues?
Differences up to 100% represent "DK/DA"
Open Society Foundation
G A
G
A
L
L
U
L L
U
PP

114
52%
61%
65%
52%
49%
51%
37%
44%
47%
37%
34%
43%
49%
48%
53%
59%
0% 20% 40% 60% 80% 100%
Moldavia
Valachia
Oltenia
Dobrogea
Transylvania
Crişana-Maramureş
Banat
Bucharest
Yes No
breakdown by historical region
R O
R
O
M
Â
N
I
M Â
N
I
AA
Have you heard of cases of battered husbands/partners among your friends, relatives or colleagues?
Differences up to 100% represent "DK/DA"
Gender Barometer - August 2000
115
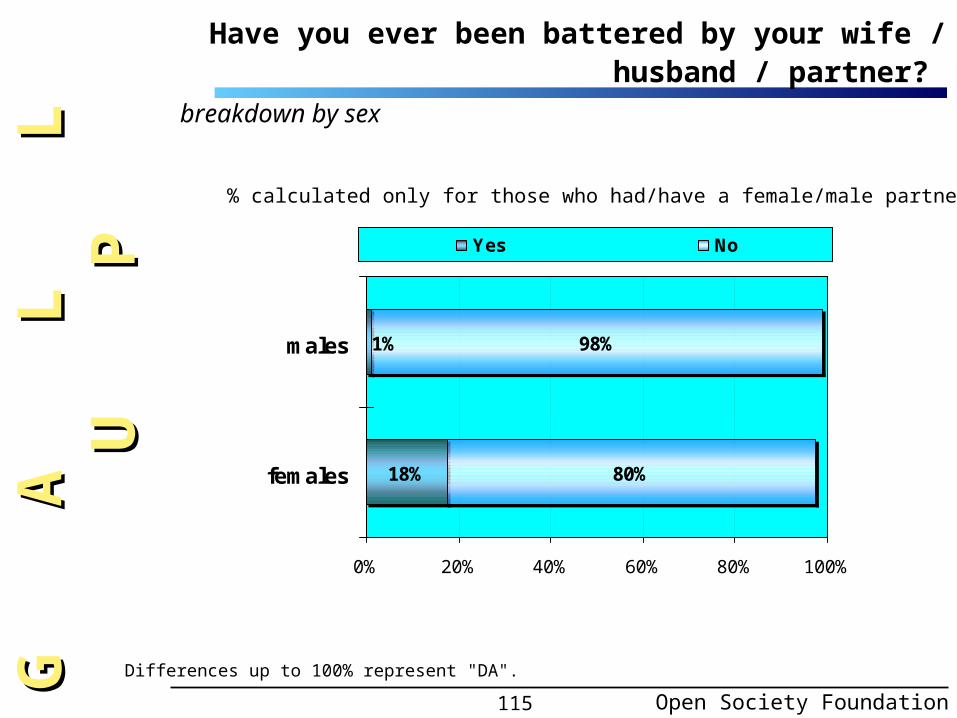
1% 98%
80%18%
0% 20% 40% 60% 80% 100%
males
females
Yes No
breakdown by sex
Have you ever been battered by your wife / husband / partner?
Differences up to 100% represent "DA".
% calculated only for those who had/have a female/male partner
Open Society Foundation
G A
G
A
L
L
U
L L
U
PP

116
35%
28%
28%
13%
7%
6%
0% 20% 40% 60%
they have to deal with their problemsby themselves
relatives
police
neighbours
friends
DA
Who should intervene when a spouse/partner is battered?R
O
R
O
M
Â
N
I
M Â
N
I
AA
Gender Barometer - August 2000
- multiple-answer question -

117
How often do you experience problems in your couple?
% calculated only for couples
often9%
very often2%
DA2%
seldom46%
very seldom, never41%
Open Society Foundation
G A
G
A
L
L
U
L L
U
PP type of residence
118
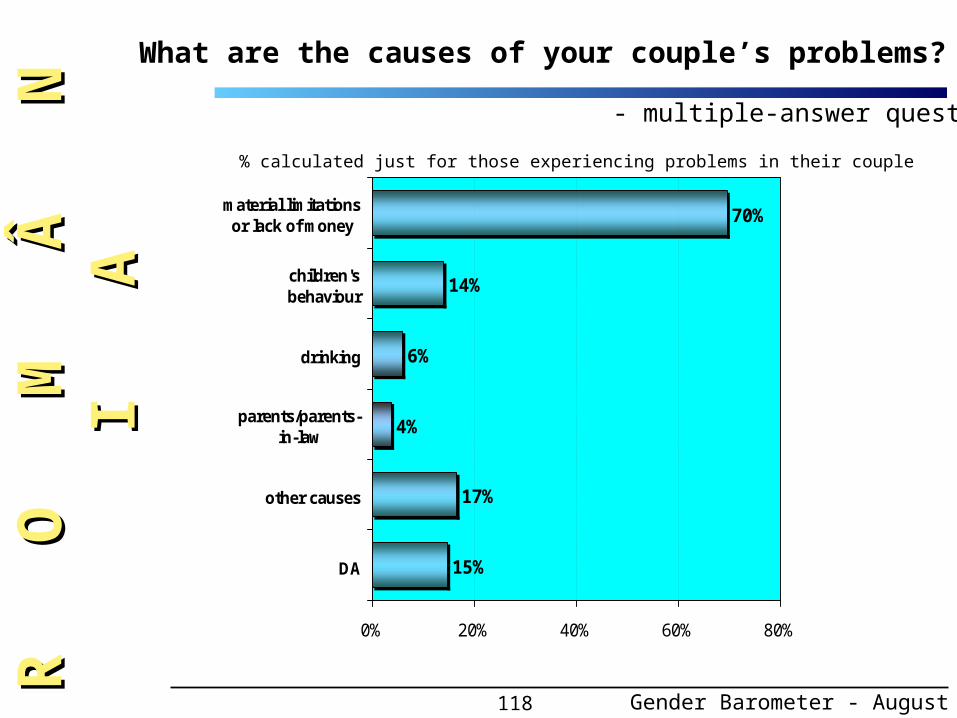
70%
14%
6%
4%
17%
15%
0% 20% 40% 60% 80%
material limitationsor lack of money
children'sbehaviour
drinking
parents/parents-in-law
other causes
DA
R O
R
O
M
Â
N
I
M Â
N
I
AAWhat are the causes of your couple’s problems?
Gender Barometer - August 2000
% calculated just for those experiencing problems in their couple
- multiple-answer question-

119
Do you have sexual relations with your partner even when you do not want it?
% calculated only for those living with spouse/partner
never71%
DA16%
very seldom
7%
yes, often1%
sometimes5%
Open Society Foundation
G A
G
A
L
L
U
L L
U
PP
120
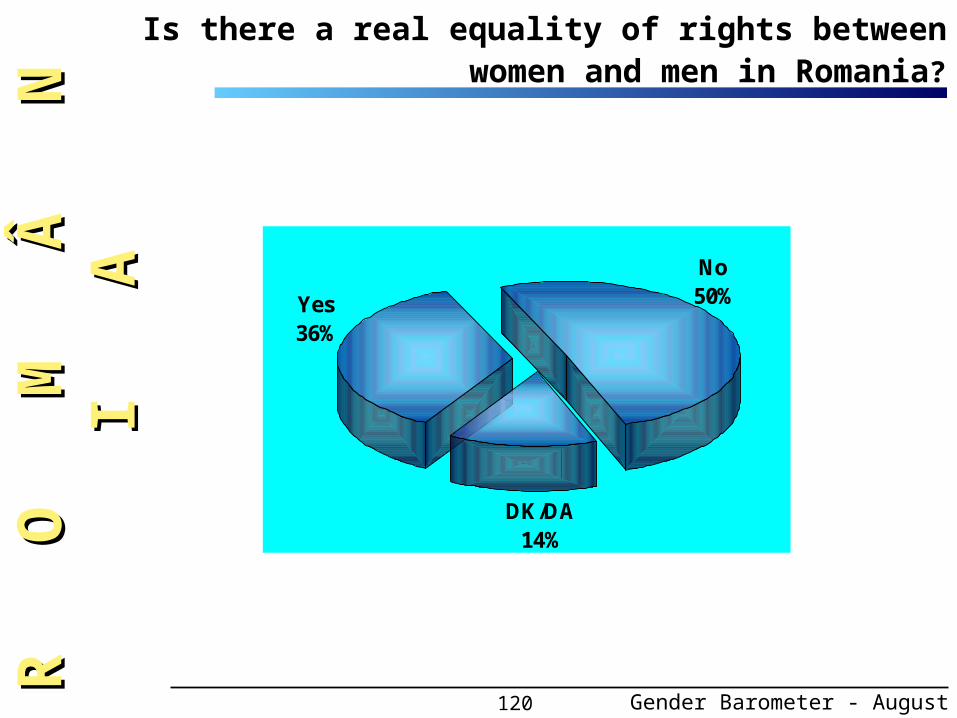
No50%
DK/DA14%
Yes36%
R O
R
O
M
Â
N
I
M Â
N
I
AA
Is there a real equality of rights between women and men in Romania?
Gender Barometer - August 2000
121
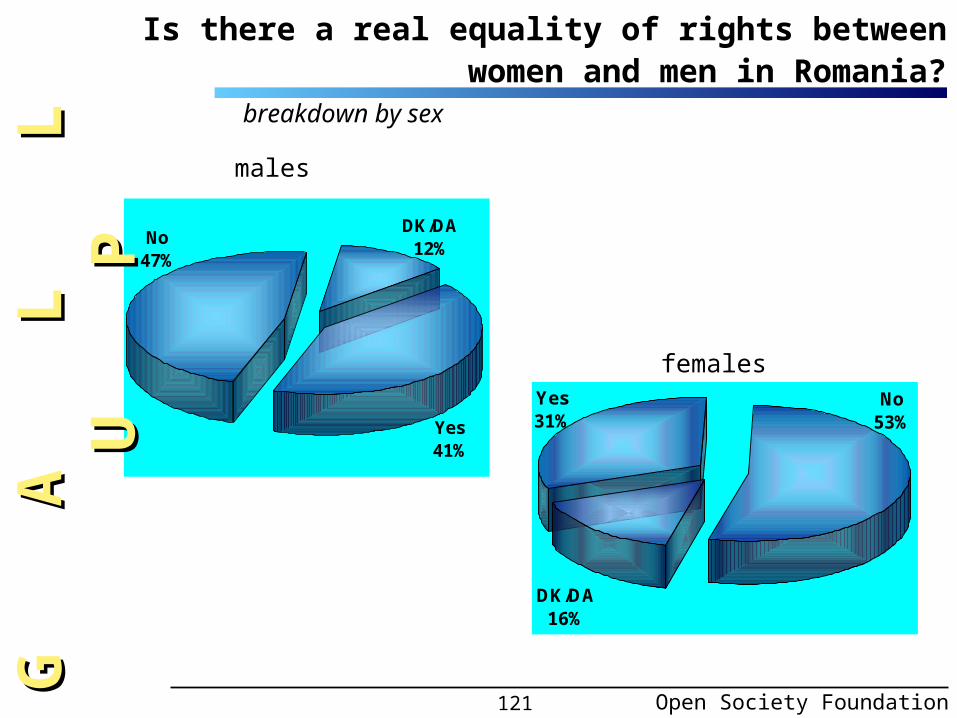
Is there a real equality of rights between women and men in Romania?
No47%
DK/DA12%
Yes41%
breakdown by sex
No53%
DK/DA16%
Yes31%
males
females
Open Society Foundation
G A
G
A
L
L
U
L L
U
PP
122
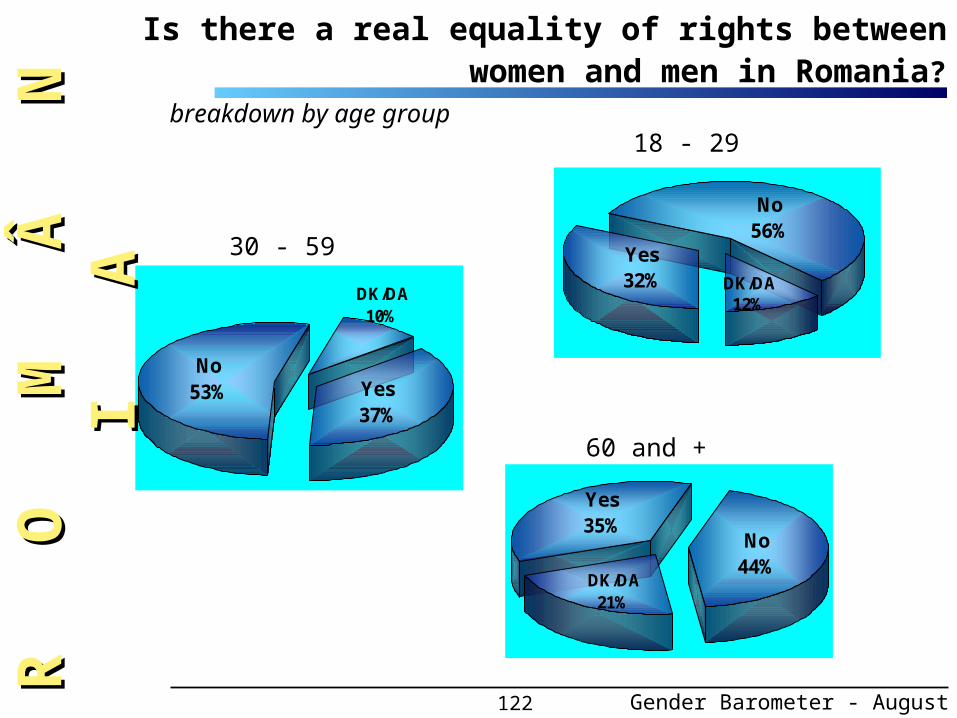
breakdown by age group
No44%
DK/DA21%
Yes35%
18 - 29
30 - 59
60 and +
Yes32% DK/DA
12%
No56%
Yes37%
DK/DA10%
No53%
R O
R
O
M
Â
N
I
M Â
N
I
AA
Is there a real equality of rights between women and men in Romania?
Gender Barometer - August 2000
123
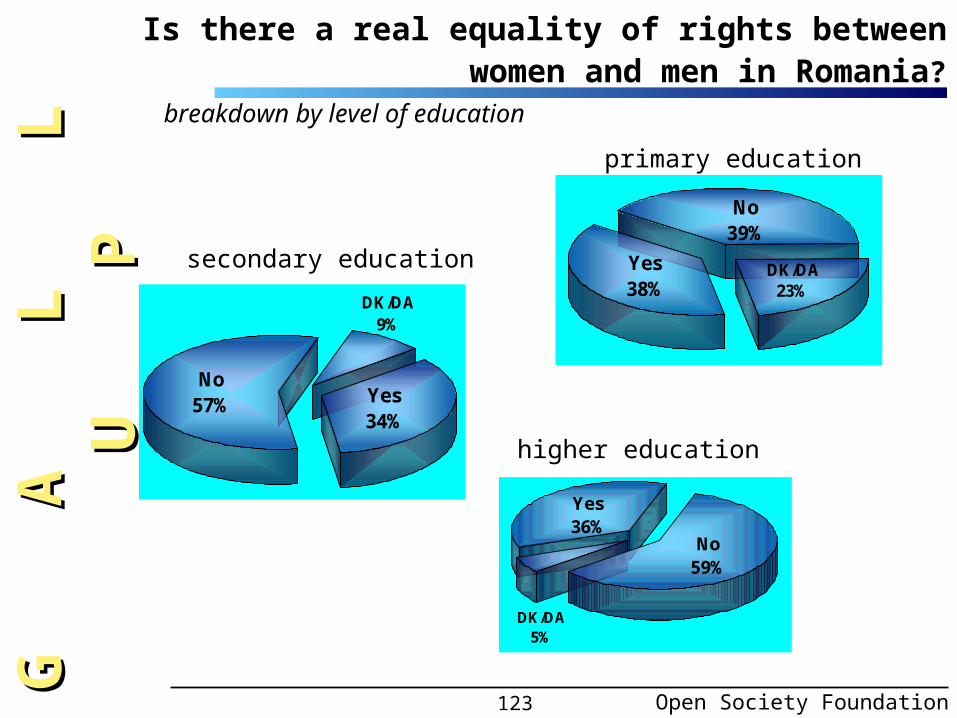
Is there a real equality of rights between women and men in Romania?
Yes36%
DK/DA5%
No59%
No57%
DK/DA9%
Yes34%
primary education
secondary education
higher education
No39%
DK/DA23%
Yes38%
breakdown by level of education
Open Society Foundation
G A
G
A
L
L
U
L L
U
PP
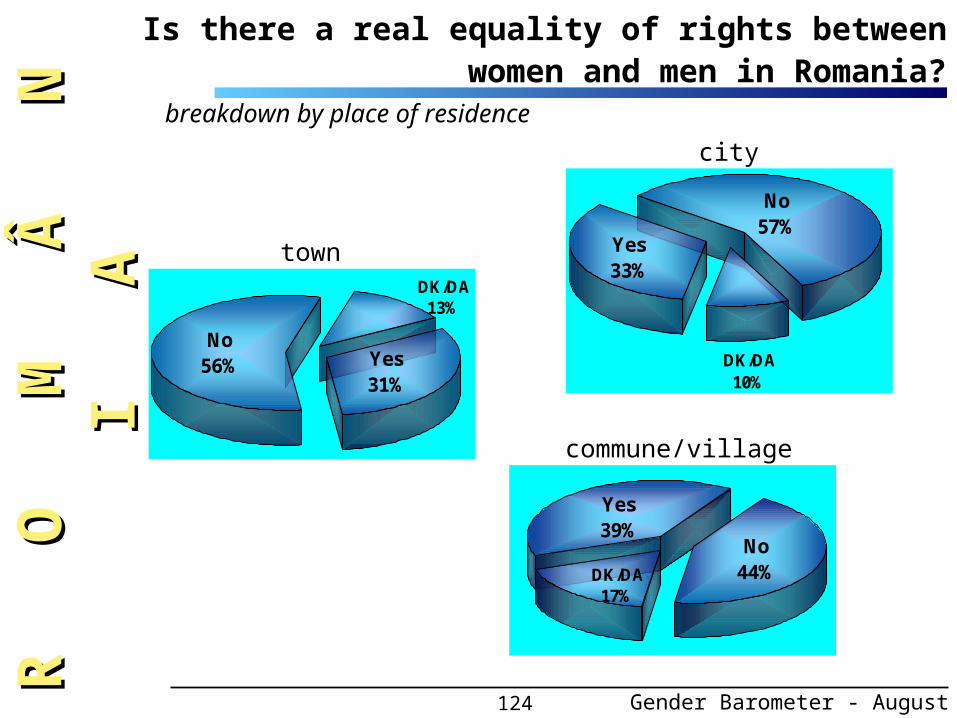
124
Yes39%
DK/DA17%
No44%
No56%
DK/DA13%
Yes31%
city
town
commune/village
No57%
DK/DA10%
Yes33%
breakdown by place of residence
R O
R
O
M
Â
N
I
M Â
N
I
AA
Is there a real equality of rights between women and men in Romania?
Gender Barometer - August 2000

125
37%
22%
35%
34%
32%
36%
46%
67%
50%
47%
49%
56%
17%
11%
15%
19%
19%
8%
0% 20% 40% 60% 80% 100%
retired
student
unemployed
housewife
unregisteredunemployed
employed
Yes No DK/DA
breakdown by occupational status
Is there a real equality of rights between women and men in Romania?
Open Society Foundation
G A
G
A
L
L
U
L L
U
PP
126
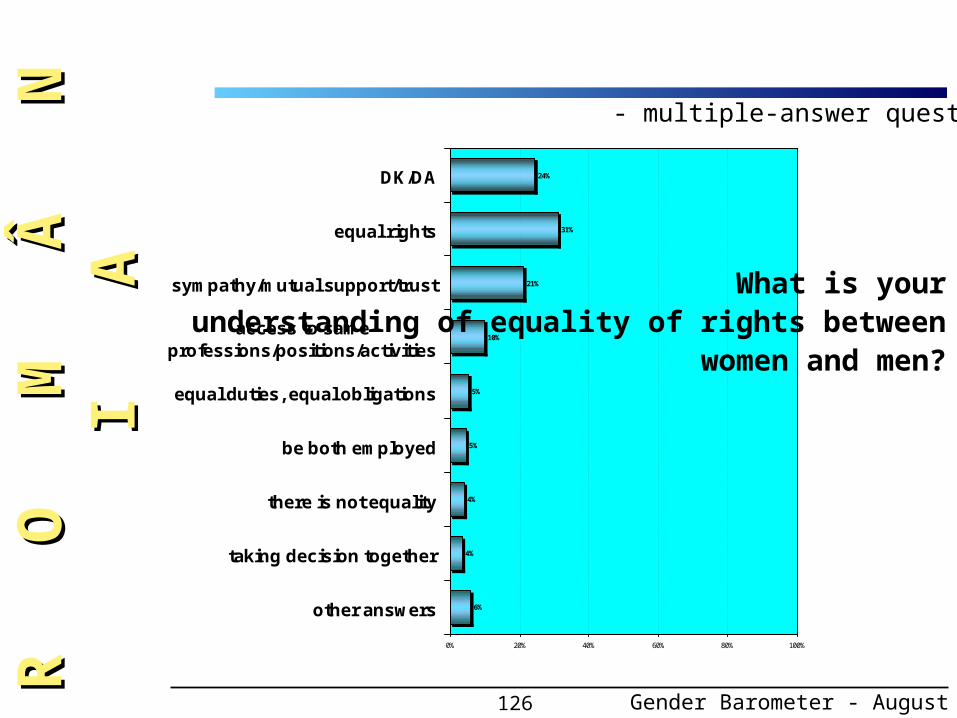
24%
31%
21%
10%
5%
5%
4%
4%
6%
0% 20% 40% 60% 80% 100%
DK/DA
equal rights
sympathy/mutual support/trust
access to sameprofessions/positions/activities
equal duties, equal obligations
be both employed
there is not equality
taking decision together
other answers
R O
R
O
M
Â
N
I
M Â
N
I
AA
Gender Barometer - August 2000
What is your understanding of equality of rights between women and men?
- multiple-answer question-
127
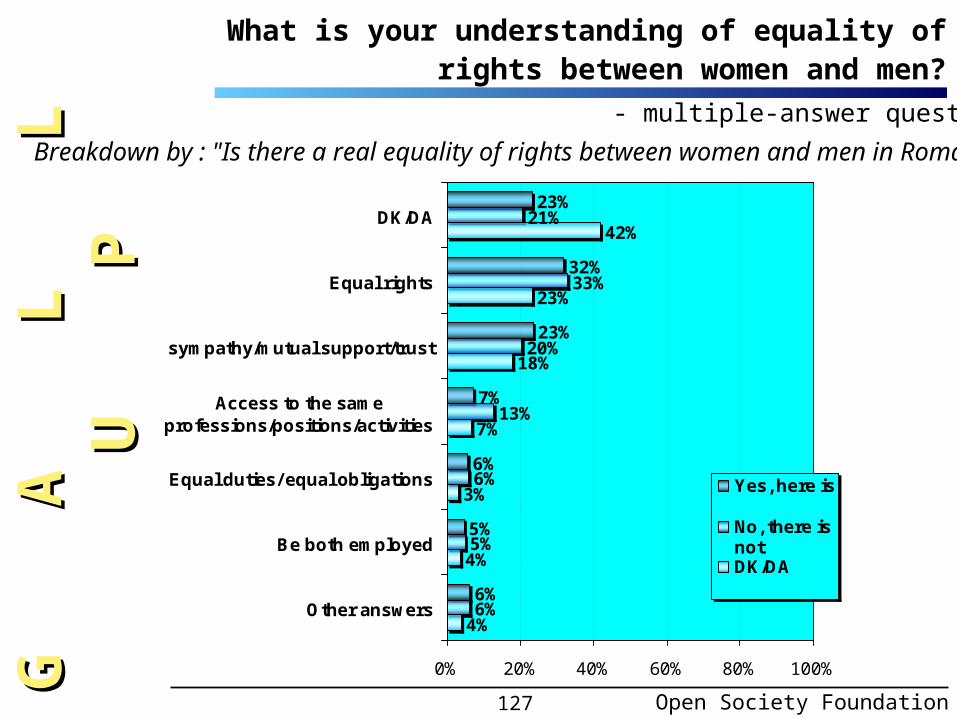
What is your understanding of equality of rights between women and men?
Breakdown by : "Is there a real equality of rights between women and men in Romania"
23%
32%
23%
7%
6%
5%
6%
21%
33%
20%
13%
6%
5%
6%
42%
23%
18%
7%
3%
4%
4%
0% 20% 40% 60% 80% 100%
DK/DA
Equal rights
sympathy/mutual support/trust
Access to the sameprofessions/positions/activities
Equal duties/ equal obligations
Be both employed
Other answers
Yes, here is
No, there isnotDK/DA
Open Society Foundation
G A
G
A
L
L
U
L L
U
PP- multiple-answer question-

128
23%
34%
23%
7%
5%
4%
0% 20% 40% 60% 80% 100%
DK/DA
Equal righrs
Sympathy/mutual support/trust
Access to the sameprofessions/positions/activities
Equal duties/ equalobligations
Be both employed
- male sample -
Yes, there is
Breakdown by : "Is there a real equality of rights between women and men in Romania"
18%
35%
19%
12%
8%
5%
0% 20% 40% 60% 80% 100%
DK/DA
Equal rights
Sympathy/mutualsupport/trust
Access to the sameprofessions/positions/activities
Equal duties/ equal oligations
Be both employed
No, there is not
R O
R
O
M
Â
N
I
M Â
N
I
AA
Gender Barometer - August 2000
What is your understanding of equality of rights between women and men?
- multiple-answer question-
129
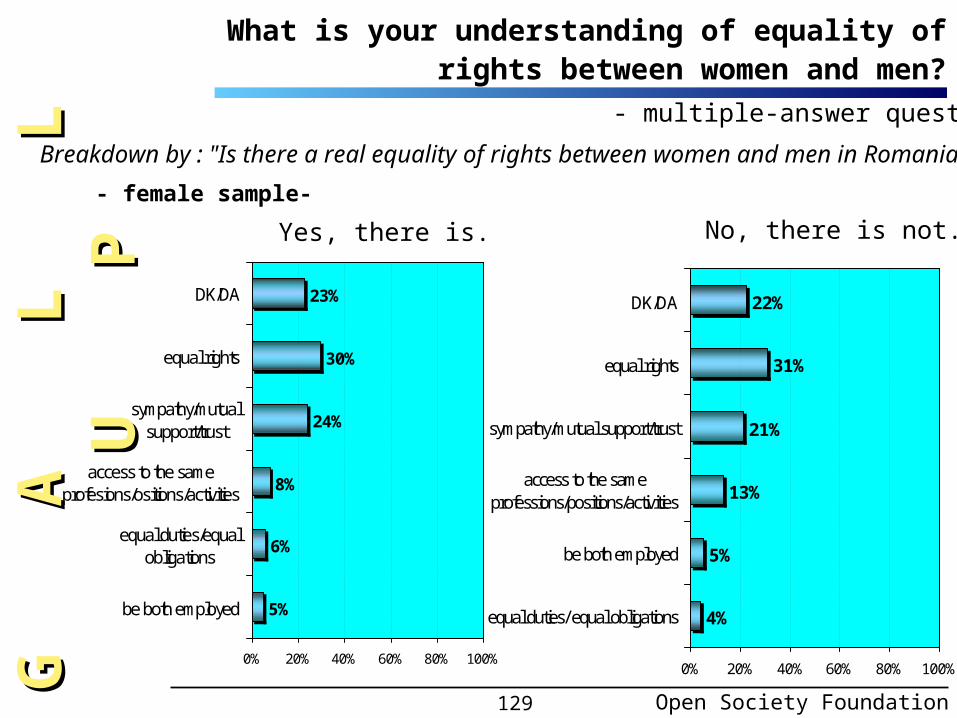
What is your understanding of equality of rights between women and men?
23%
30%
24%
8%
6%
5%
0% 20% 40% 60% 80% 100%
DK/DA
equal rights
sympathy/mutualsupport/trust
access to the sameprofesions/ositions/activities
equal duties/equalobligations
be both employed
- female sample-
Breakdown by : "Is there a real equality of rights between women and men in Romania"
Open Society Foundation
22%
31%
21%
13%
5%
4%
0% 20% 40% 60% 80% 100%
DK/DA
equal rights
sympathy/mutual support/trust
access to the sameprofessions/positions/activities
be both employed
equal duties/ equal obligations
G A
G
A
L
L
U
L L
U
PP
Yes, there is. No, there is not.
- multiple-answer question-

130
DK/DA3%
women4%
sex is not important
61%
men32%
R O
R
O
M
Â
N
I
M Â
N
I
AA
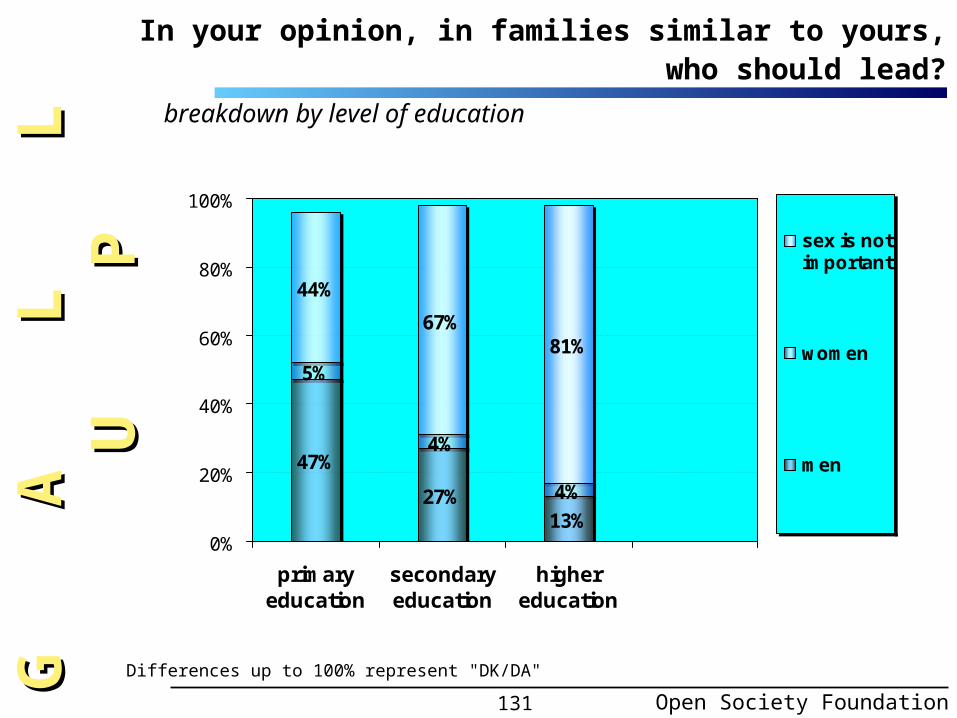
In your opinion, in families similar to yours, who should lead?
Gender Barometer - August 2000
131
47%
27%13%
5%
4%
4%
67%
44%
81%
0%
20%
40%
60%
80%
100%
primaryeducation
secondaryeducation
highereducation
sex is notimportant
women
men
Differences up to 100% represent "DK/DA"
breakdown by level of education
In your opinion, in families similar to yours, who should lead?
Open Society Foundation
G A
G
A
L
L
U
L L
U
PP
132
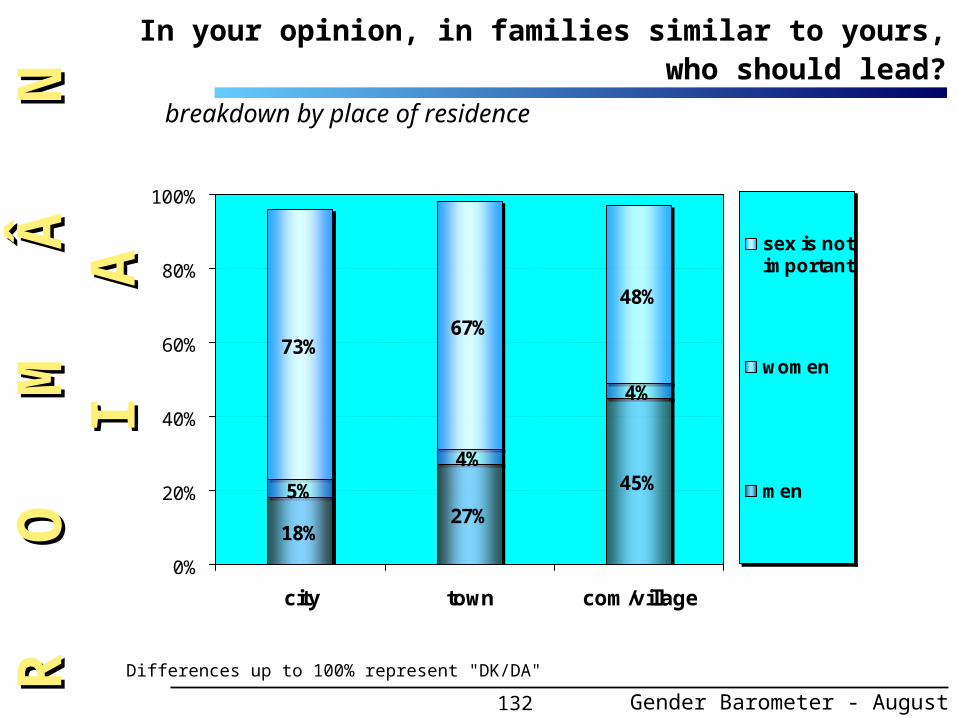
18%27%
45%5%
4%
4%
73%67%
48%
0%
20%
40%
60%
80%
100%
city town com/village
sex is notimportant
women
men
breakdown by place of residence
R O
R
O
M
Â
N
I
M Â
N
I
AA
In your opinion, in families similar to yours, who should lead?
Differences up to 100% represent "DK/DA"
Gender Barometer - August 2000
133
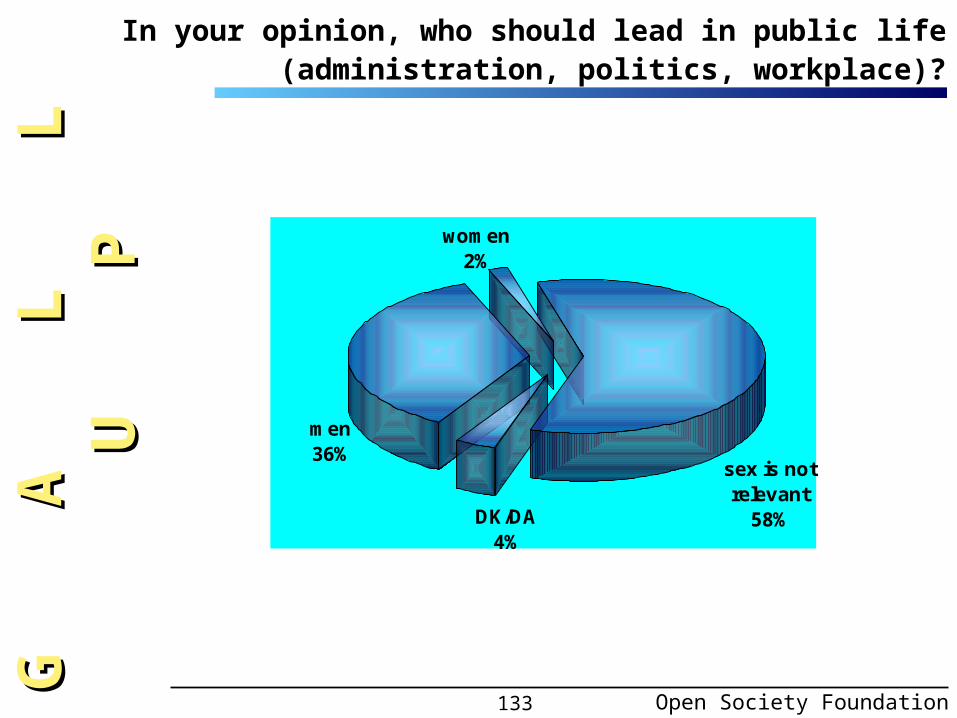
DK/DA4%
women2%
sex is not relevant
58%
men36%
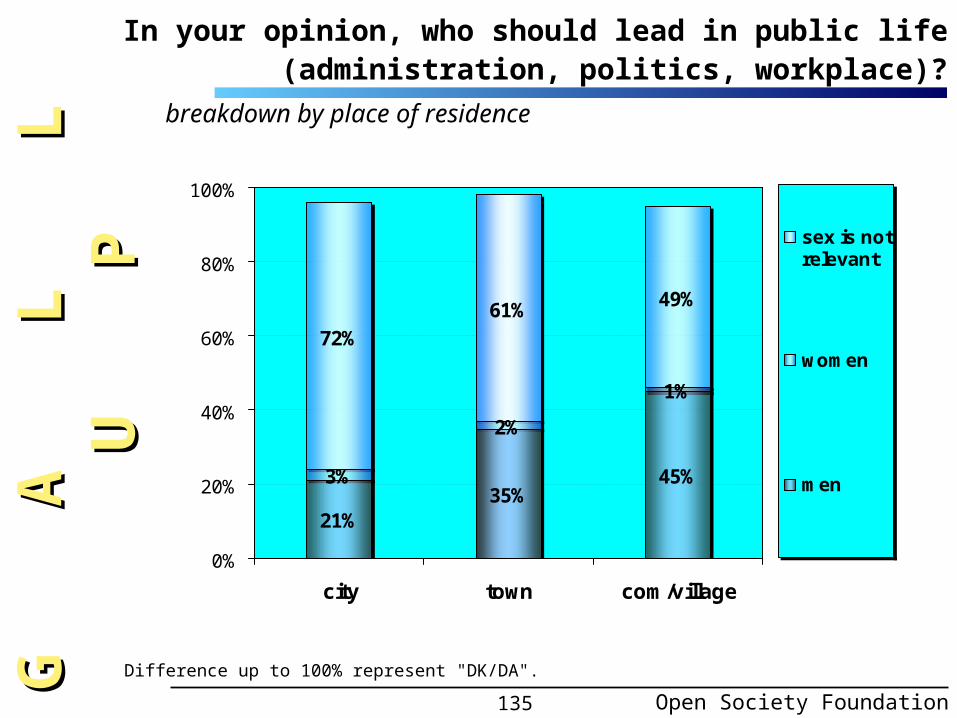
In your opinion, who should lead in public life (administration, politics, workplace)?
Open Society Foundation
G A
G
A
L
L
U
L L
U
PP

134
48%
30%20%
1%
2%
2%
65%45%
76%
0%
20%
40%
60%
80%
100%
primaryeducation
secondaryeducation
highereducation
sex isnotrelevant
women
men
breakdown by level of education
R O
R
O
M
Â
N
I
M Â
N
I
AA
In your opinion, who should lead in public life (administration, politics, workplace)?
Difference up to 100% represent "DK/DA".
Gender Barometer- August 2000
135
21%35%
45%3%
2%
1%
72%
61% 49%
0%
20%
40%
60%
80%
100%
city town com/village
sex is notrelevant
women
men
Difference up to 100% represent "DK/DA".
breakdown by place of residence
In your opinion, who should lead in public life (administration, politics, workplace)?
Open Society Foundation
G A
G
A
L
L
U
L L
U
PP

136
DK/DA12%
neither good,
nor bad31%
bad7%
good50%
…political life
good54%
bad6%
neither good,
nor bad29%
DK/DA11%
...business
R O
R
O
M
Â
N
I
M Â
N
I
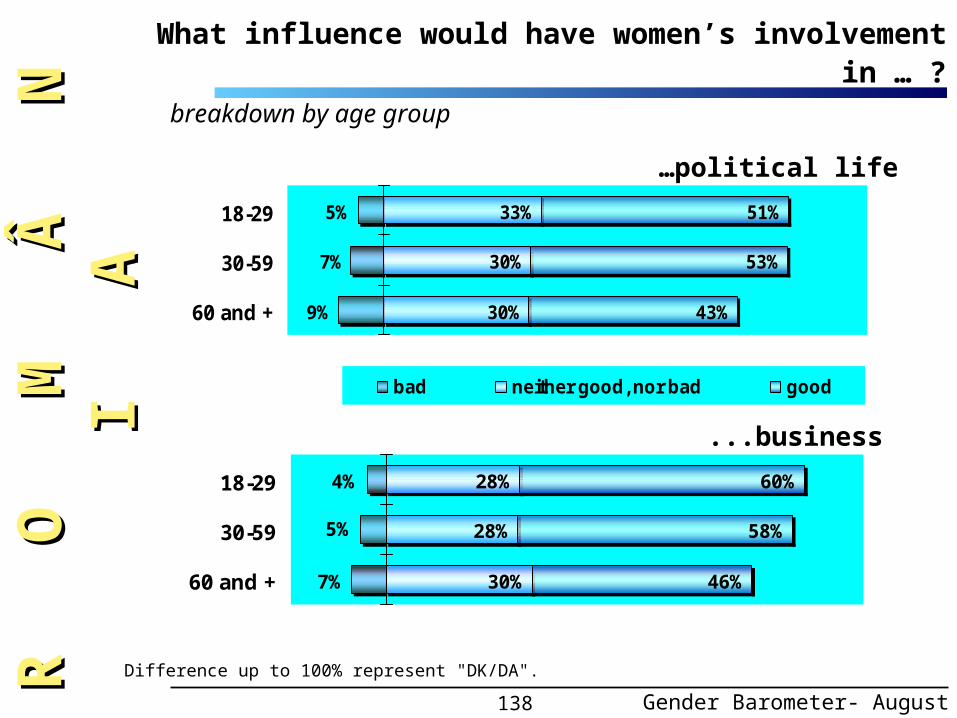
AAWhat influence would have women’s involvement in … ?
Gender Barometer- August 2000

137
37%
26%
46%
53%
9%
6%
males
females
bad neither good nor bad good
Difference up to 100% represent "DK/DA".
breakdown by sex
What influence would have women’s involvement in … ?
…political life
35%
23%
50%
58%
7%
5%
males
females
...business
Open Society Foundation
G A
G
A
L
L
U
L L
U
PP
138
breakdown by age group
33%
30%
30%
51%
53%
43%
5%
7%
9%
18-29
30-59
60 and +
bad neither good, nor bad good
…political life
28%
28%
30%
60%
58%
46%
4%
5%
7%
18-29
30-59
60 and +
...business
R O
R
O
M
Â
N
I
M Â
N
I
AAWhat influence would have women’s involvement in … ?
Difference up to 100% represent "DK/DA".
Gender Barometer- August 2000

139
Difference up to 100% represent "DK/DA".
breakdown by level of education
30%
32%
28%
41%
54%
58%5%
5%
11%primary education
secondary education
higher education
bad neither good, nor bad good
31%
27%
27%
43%
61%
63%
9%
3%
4%
primary education
secondary education
higher education
What influence would have women’s involvement in … ?
Open Society Foundation
…political life
...business
G A
G
A
L
L
U
L L
U
PP
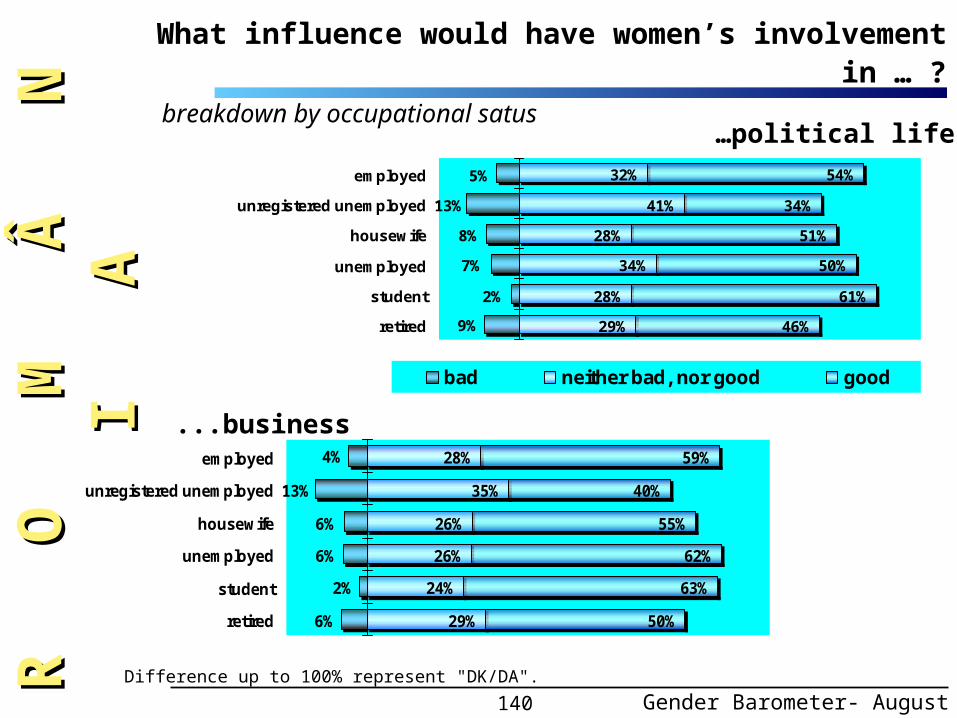
140
breakdown by occupational satus
32%
41%
28%
34%
28%
29%
54%
34%
51%
50%
61%
46%
5%
13%
8%
7%
2%
9%
employed
unregistered unemployed
housewife
unemployed
student
retired
bad neither bad, nor good good
28%
35%
26%
26%
24%
29%
59%
40%
55%
62%
63%
50%6%
2%
6%
6%
13%
4%employed
unregistered unemployed
housewife
unemployed
student
retired
…political life
...business
R O
R
O
M
Â
N
I
M Â
N
I
AAWhat influence would have women’s involvement in … ?
Difference up to 100% represent "DK/DA".
Gender Barometer- August 2000
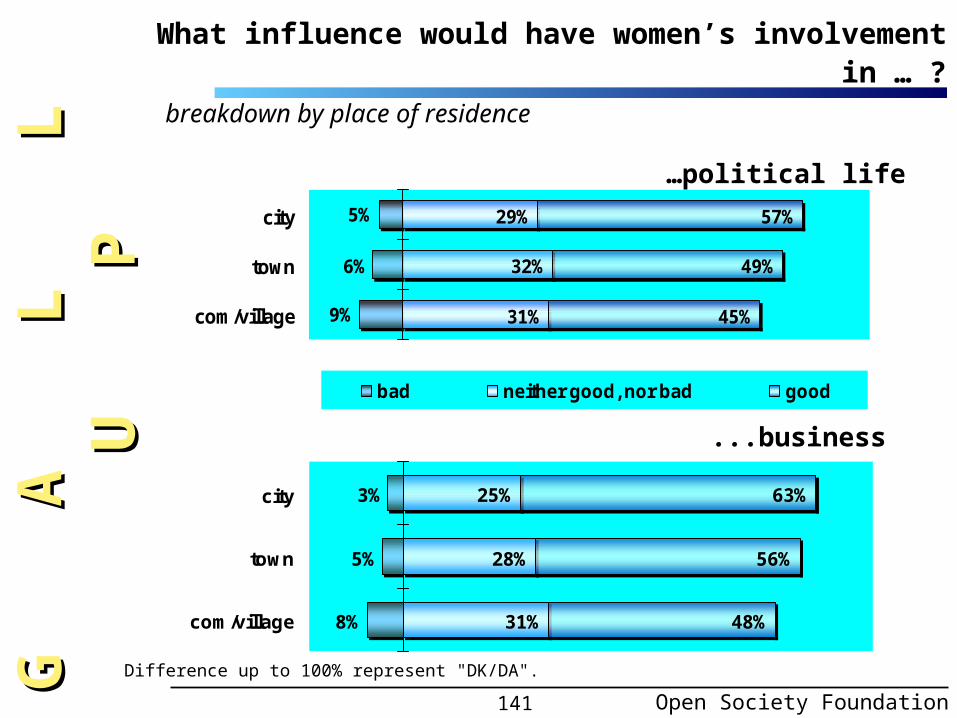
141
Difference up to 100% represent "DK/DA".
breakdown by place of residence
What influence would have women’s involvement in … ?
29%
32%
31%
57%
49%
45%
5%
6%
9%
city
town
com/village
bad neither good, nor bad good
25%
28%
31%
63%
56%
48%
3%
5%
8%
city
town
com/village
Open Society Foundation
…political life
...business
G A
G
A
L
L
U
L L
U
PP
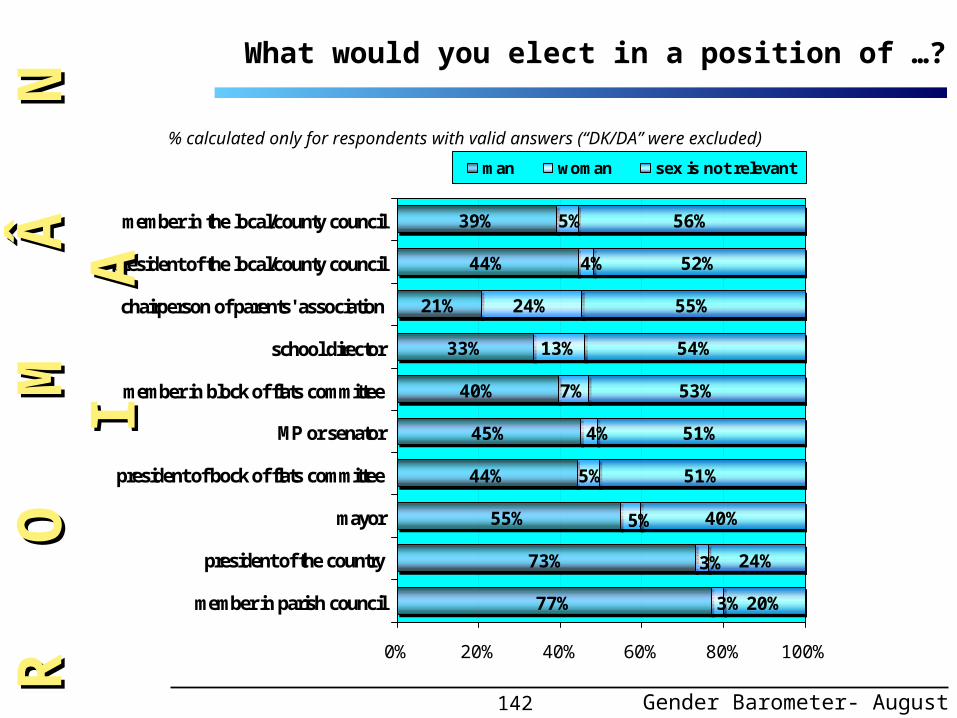
142
39%
44%
21%
33%
40%
45%
44%
55%
73%
77%
24%
13%
7%
55%
51%
24%
20%3%
3%
5%
4%
4%
5%
5%
52%
40%
51%
53%
54%
56%
0% 20% 40% 60% 80% 100%
member in the local/county council
president of the local/county council
chairperson of parents' association
school director
member in block of flats committee
MP or senator
president of bock of flats committee
mayor
president of the country
member in parish council
man woman sex is not relevant
% calculated only for respondents with valid answers (“DK/DA” were excluded)
R O
R
O
M
Â
N
I
M Â
N
I
AAWhat would you elect in a position of …?
Gender Barometer- August 2000
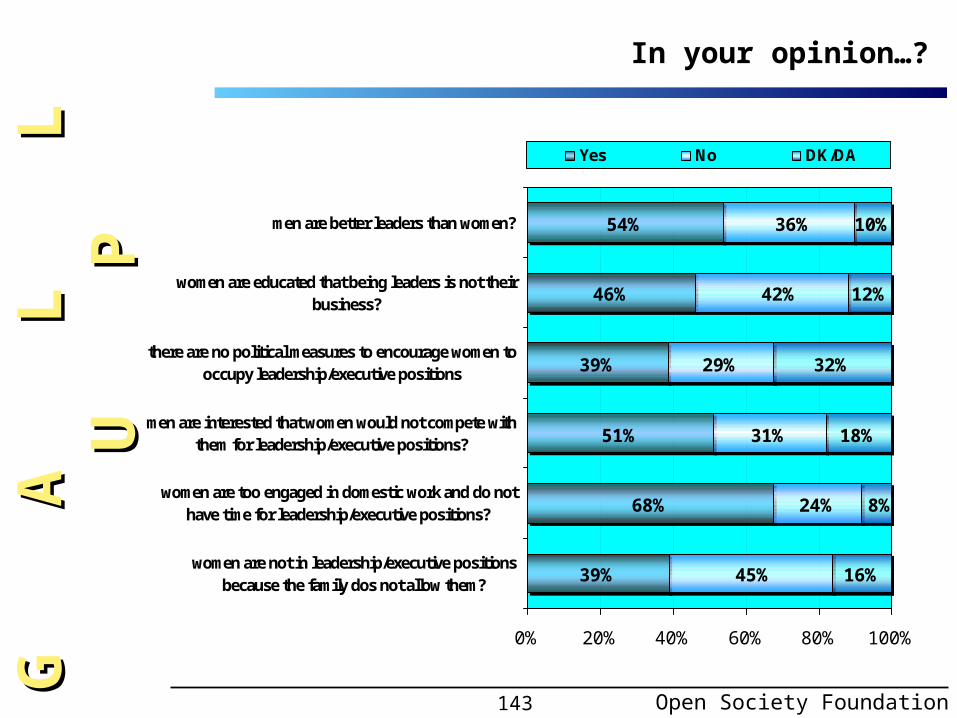
143
In your opinion…?
54%
46%
39%
51%
68%
39%
29%
31%
24%
32%
16%45%
42%
36%
12%
8%
18%
10%
0% 20% 40% 60% 80% 100%
men are better leaders than women?
women are educated that being leaders is not theirbusiness?
there are no political measures to encourage women tooccupy leadership/executive positions
men are interested that women would not compete withthem for leadership/executive positions?
women are too engaged in domestic work and do nothave time for leadership/executive positions?
women are not in leadership/executive positionsbecause the family dos not allow them?
Yes No DK/DA
Open Society Foundation
G A
G
A
L
L
U
L L
U
PP
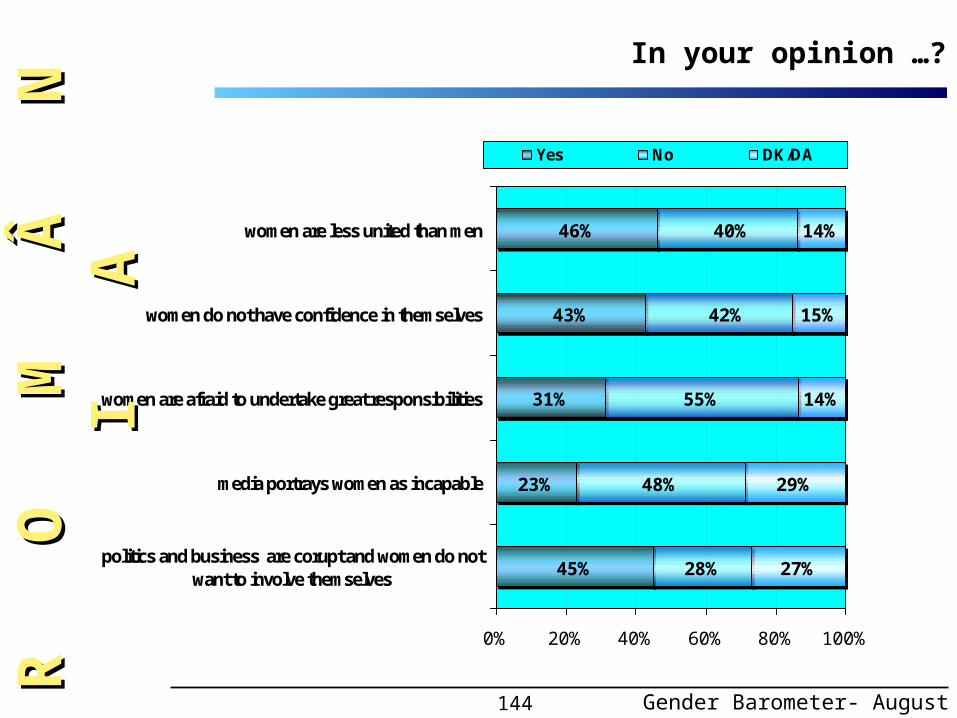
144
46%
43%
31%
23%
45%
55%
48%
28%
14%
42%
40%
15%
27%
29%
14%
0% 20% 40% 60% 80% 100%
women are less united than men
women do not have confidence in themselves
women are afraid to undertake great responsibilities
media portrays women as incapable
politics and business are corupt and women do notwant to involve themselves
Yes No DK/DA
R O
R
O
M
Â
N
I
M Â
N
I
AAIn your opinion …?
Gender Barometer- August 2000
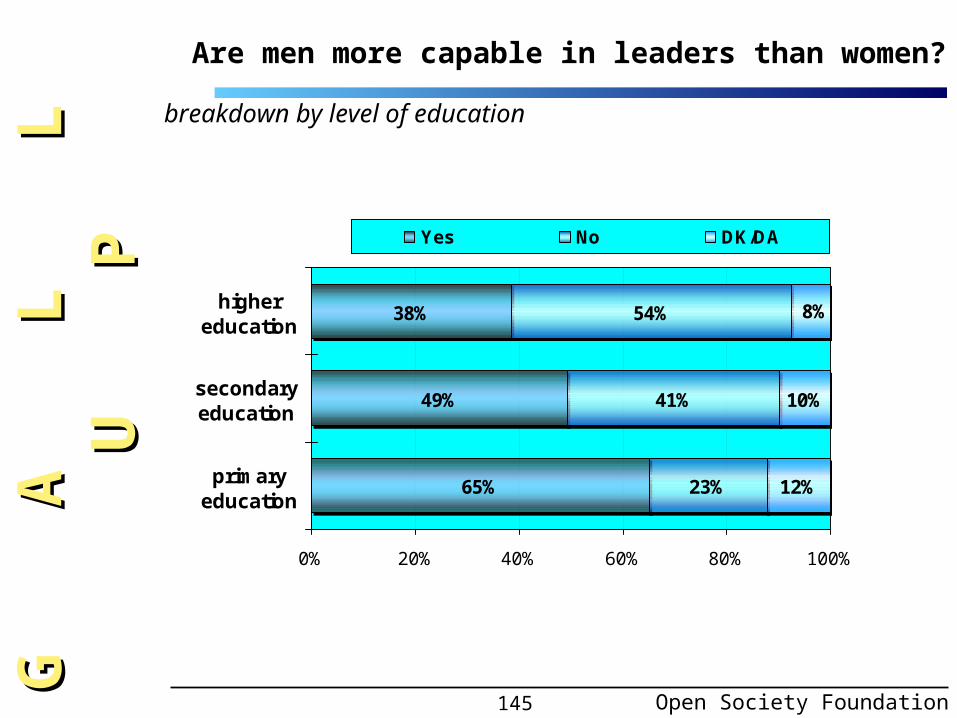
145
65%
49%
38%
23%
41%
54%
12%
10%
8%
0% 20% 40% 60% 80% 100%
primaryeducation
secondaryeducation
highereducation
Yes No DK/DA
breakdown by level of education
Are men more capable in leaders than women?
Open Society Foundation
G A
G
A
L
L
U
L L
U
PP

146
41%
50%
64%
47%
41%
26%
12%
9%
10%
0% 20% 40% 60% 80% 100%
city
town
com/village
Yes No DK/DA
breakdown by place of residence
R O
R
O
M
Â
N
I
M Â
N
I
AAAre men more capable leaders than women?
Gender Barometer- August 2000
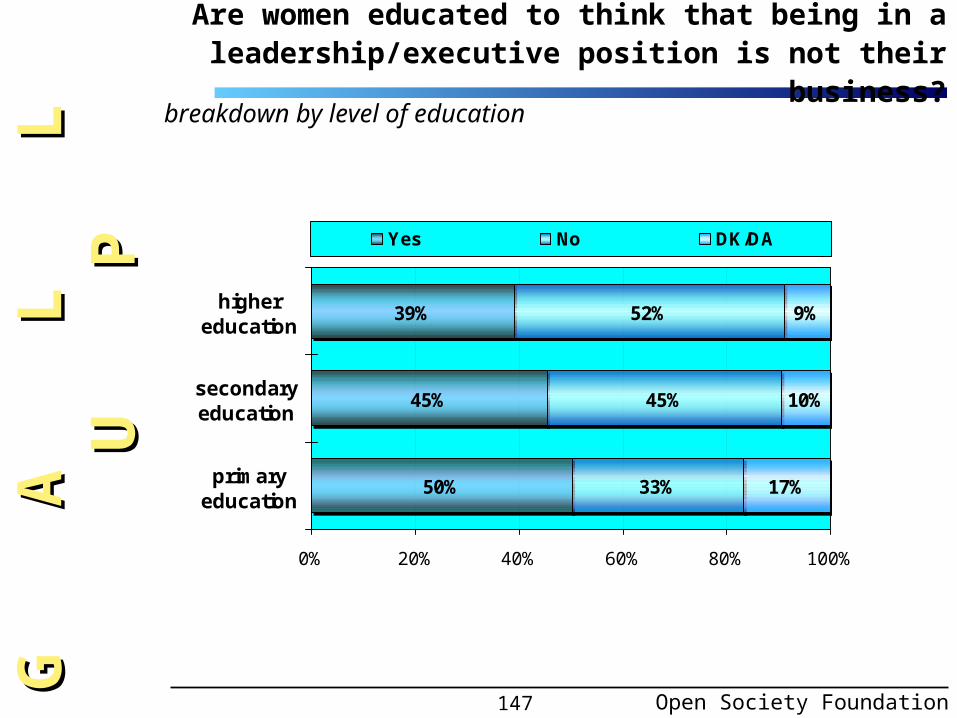
147
50%
45%
39%
33%
45%
52%
17%
10%
9%
0% 20% 40% 60% 80% 100%
primaryeducation
secondaryeducation
highereducation
Yes No DK/DA
breakdown by level of education
Are women educated to think that being in a leadership/executive position is not their business?
Open Society Foundation
G A
G
A
L
L
U
L L
U
PP
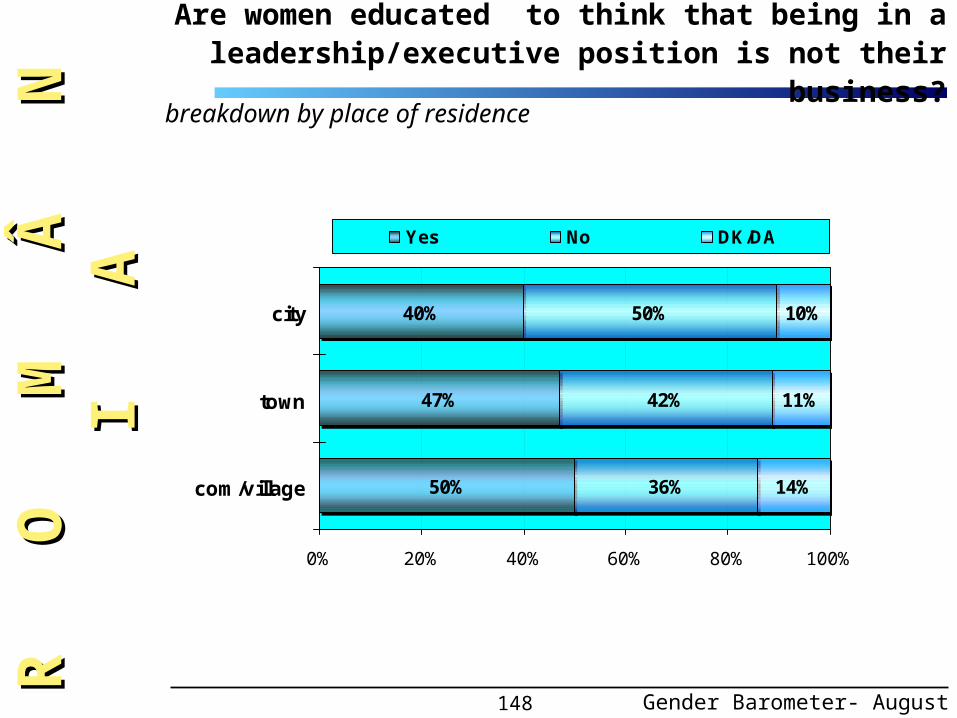
148
40%
47%
50%
50%
42%
36%
10%
11%
14%
0% 20% 40% 60% 80% 100%
city
town
com/village
Yes No DK/DA
breakdown by place of residence
R O
R
O
M
Â
N
I
M Â
N
I
AA
Are women educated to think that being in a leadership/executive position is not their business?
Gender Barometer- August 2000

149
65%
49%
23%
41%
12%
10%
0% 20% 40% 60% 80% 100%
males
females
yes no DK/DA
breakdown by sex
Are men interested that women would not compete with them for leadership/executive positions?
Open Society Foundation
G A
G
A
L
L
U
L L
U
PP

150
breakdown by level of education
76%
67%
51%
14%
27%
40%
10%
9%
6%
0% 20% 40% 60% 80% 100%
primaryeducation
secondaryeducation
highereducation
Yes No DK/DA
R O
R
O
M
Â
N
I
M Â
N
I
AA
Are women too engaged in domestic work and do not have time for leadership/executive positions?
Gender Barometer- August 2000

151
56%
68%
75%
35%
26%
16%
9%
9%
6%
0% 20% 40% 60% 80% 100%
city
town
com/village
Yes No DK/DA
breakdown by place of residence
Are women too engaged in domestic work and do not have time for leadership/executive positions?
Open Society Foundation
G A
G
A
L
L
U
L L
U
PP
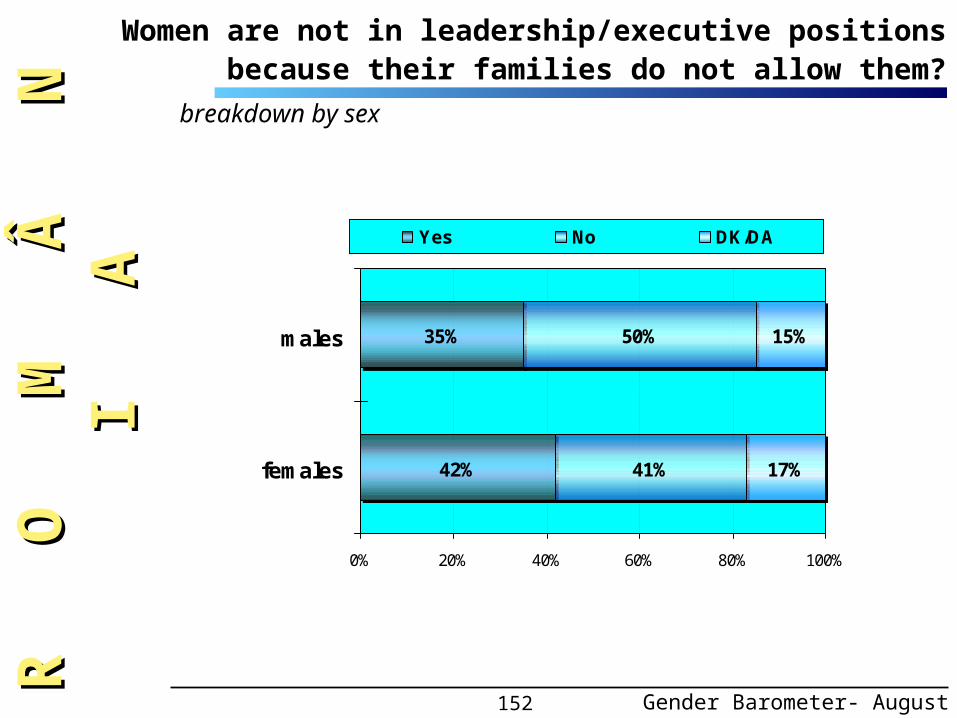
152
35%
42%
50%
41%
15%
17%
0% 20% 40% 60% 80% 100%
males
females
Yes No DK/DA
breakdown by sex
R O
R
O
M
Â
N
I
M Â
N
I
AA
Women are not in leadership/executive positions because their families do not allow them?
Gender Barometer- August 2000

153
48%
36%
23%
32%
50%
63%
20%
14%
14%
0% 20% 40% 60% 80% 100%
primaryeducation
secondaryeducation
highereducation
Yes No DK/DA
breakdown by level of education
Women are not in leadership/executive positions because their families do not allow them?
Open Society Foundation
G A
G
A
L
L
U
L L
U
PP
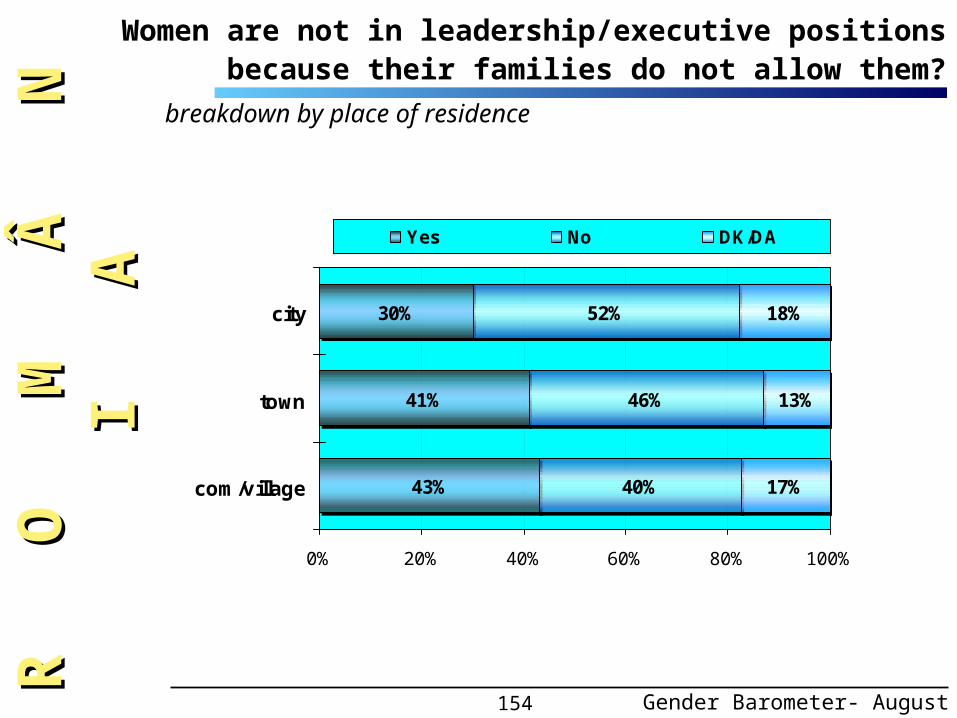
154
30%
41%
43%
52%
46%
40%
18%
13%
17%
0% 20% 40% 60% 80% 100%
city
town
com/village
Yes No DK/DA
breakdown by place of residence
R O
R
O
M
Â
N
I
M Â
N
I
AA
Women are not in leadership/executive positions because their families do not allow them?
Gender Barometer- August 2000
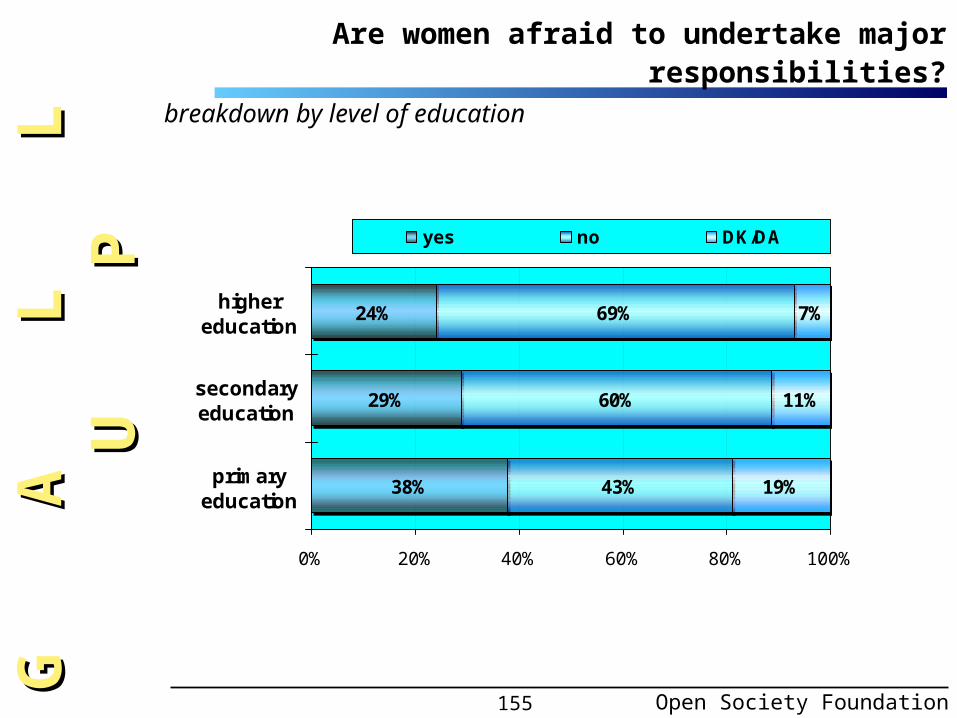
155
38%
29%
24%
43%
60%
69%
19%
11%
7%
0% 20% 40% 60% 80% 100%
primaryeducation
secondaryeducation
highereducation
yes no DK/DA
breakdown by level of education
Are women afraid to undertake major responsibilities?
Open Society Foundation
G A
G
A
L
L
U
L L
U
PP

156
49%
34%
22%
31%
16%
39%
46%
45%
41%
28%
19%
31%
22%
49%
79%
93%
93%
93%
3% 15%
2%
3%
3%
10%
0% 20% 40% 60% 80% 100%
family
friends
neighbours
work colleagues
work supervisor
local counselors or mayor
MPs in your constituency
at a party public meeting
messages to mass-media
often sometimes never
Whom do you discuss your opinions about the current national or local affairs?
R O
R
O
M
Â
N
I
M Â
N
I
AA
Differences up to 100% represent "DA".
Gender Barometer- August 2000

157
53%
45%
25%
37%
18%
37%
43%
46%
41%
31%
12%
28%
18%
46%
74%4% 20%
8%
0% 20% 40% 60% 80% 100%
family
friends
neighbours
workcollagues
worksupervisor
localcounsellors
often sometimes never
Whom do you discuss your opinions about the current national or local affairs?
Differences up to 100% represent "DA".
46%
25%
20%
25%
14%
41%
48%
44%
41%
25%
12%
25%
34%
26%
53%
83%2%11%
0% 20% 40% 60% 80% 100%
males females
Open Society Foundation
G A
G
A
L
L
U
L L
U
PP
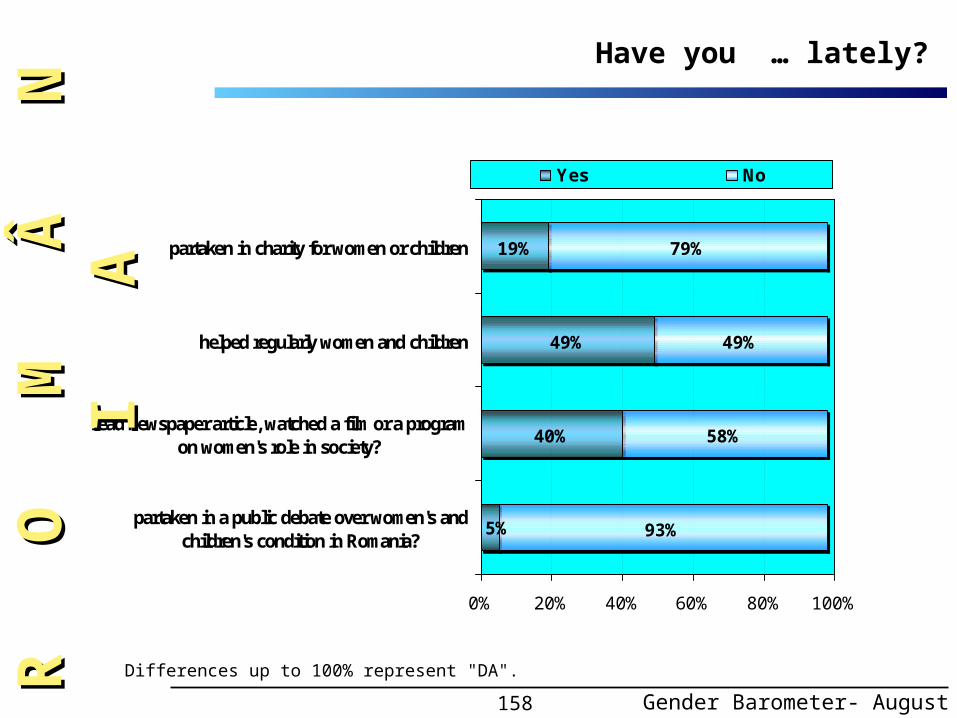
158
19%
49%
40%
79%
49%
58%
93%5%
0% 20% 40% 60% 80% 100%
partaken in charity for women or children
helped regularly women and children
read newspaper article, watched a film or a programon women's role in society?
partaken in a public debate over women's andchildren's condition in Romania?
Yes No
R O
R
O
M
Â
N
I
M Â
N
I
AAHave you … lately?
Differences up to 100% represent "DA".
Gender Barometer- August 2000
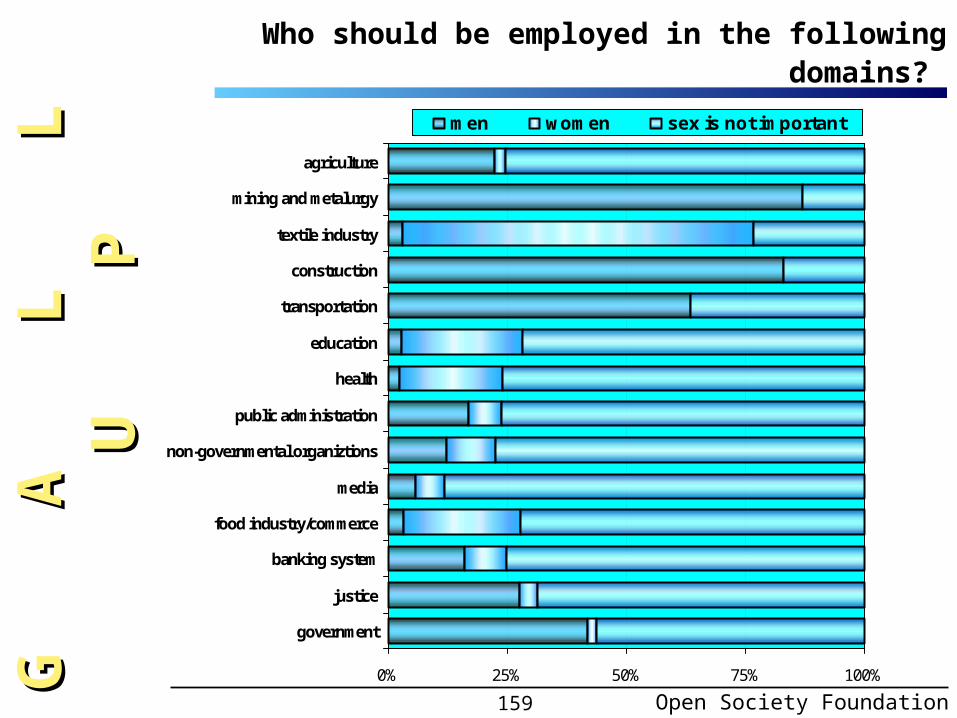
159
Who should be employed in the following domains?
0% 25% 50% 75% 100%
agriculture
mining and metalurgy
textile industry
construction
transportation
education
health
public administration
non-governmental organiztions
media
food industry/commerce
banking system
justice
government
men women sex is not important
Open Society Foundation
G A
G
A
L
L
U
L L
U
PP

160
47%
48%
9%
17%
41%
30%2%
2%
0% 20% 40% 60% 80% 100%
males
females
partener/spouse parents someone else I decided by myself
breakdown by sex
How to read the figure: For 47% of the male respondents their partener/ wife influenced their decision when they decided to get married, for 9% of them parents influnenced their decision, for 2% it was somebody else who had an influence, while 41% of male respondents declared that it was their own decision.
R O
R
O
M
Â
N
I
M Â
N
I
AA
Who influenced your decision when you decided …to get married (first time)?
Differences up to 100% represent "DA".
Gender Barometer- August 2000

161
74%
69%
20%
23%
1%
1%
2%
2%
0% 20% 40% 60% 80% 100%
males
females
partner/spouse parents somebody else I decided by myself
Differences up to 100% represent "DA"
Who influenced your decision when you decided … to have children?
breakdown by sex
Open Society Foundation
G A
G
A
L
L
U
L L
U
PP

162
18%
13%
77%
77%
1%
4%
1%
1%
0% 20% 40% 60% 80% 100%
males
females
partner/spouse parents somebody else I decided by myself
breakdown by sex
R O
R
O
M
Â
N
I
M Â
N
I
AA
Who influenced your decision when you choose... your friends?
Differences up to 100% represent "DA"
Gender Barometer - August 2000
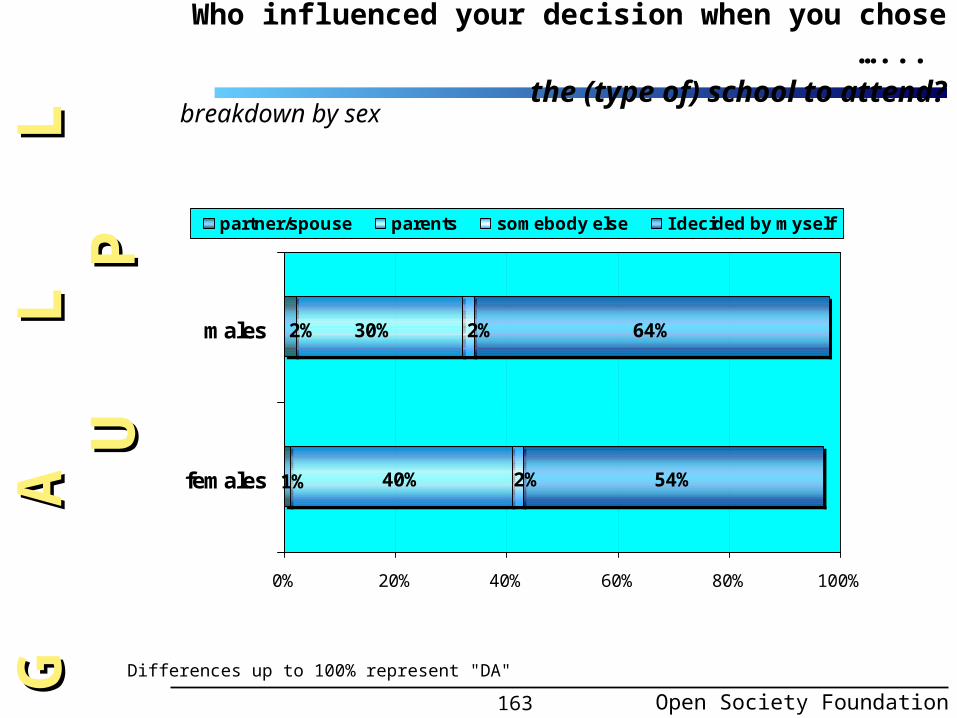
163
64%
54%1%
2% 30%
40%
2%
2%
0% 20% 40% 60% 80% 100%
males
females
partner/spouse parents somebody else I decided by myself
Differences up to 100% represent "DA"
Who influenced your decision when you chose …... the (type of) school to attend?
breakdown by sex
Open Society Foundation
G A
G
A
L
L
U
L L
U
PP
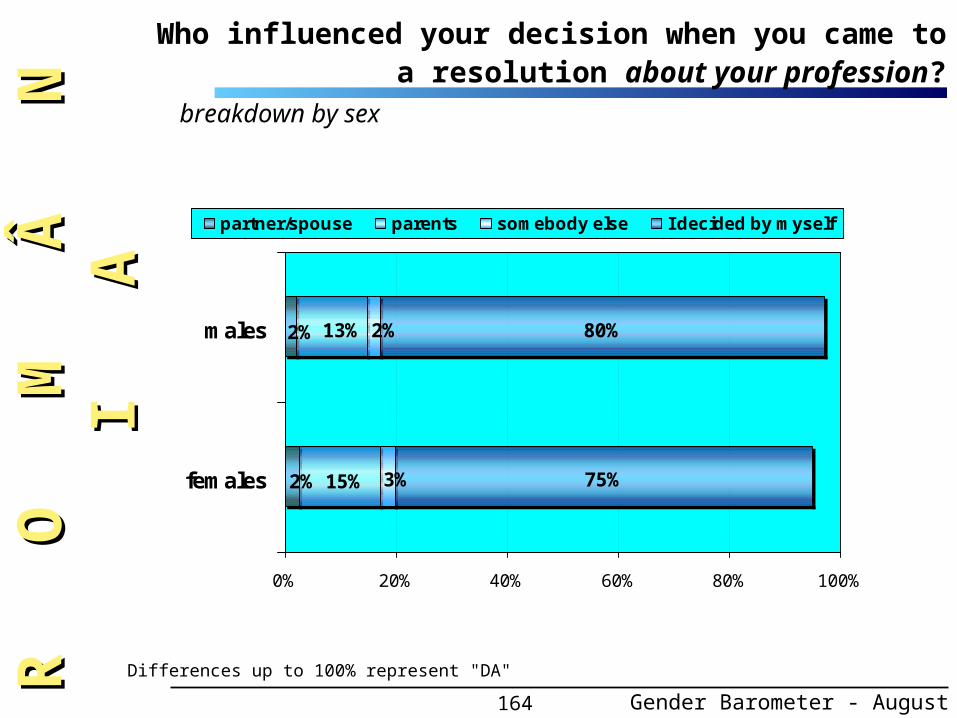
164
breakdown by sex
80%
75%2%
2% 13%
15%
2%
3%
0% 20% 40% 60% 80% 100%
males
females
partner/spouse parents somebody else I decided by myself
R O
R
O
M
Â
N
I
M Â
N
I
AA
Who influenced your decision when you came to a resolution about your profession?
Differences up to 100% represent "DA"
Gender Barometer - August 2000
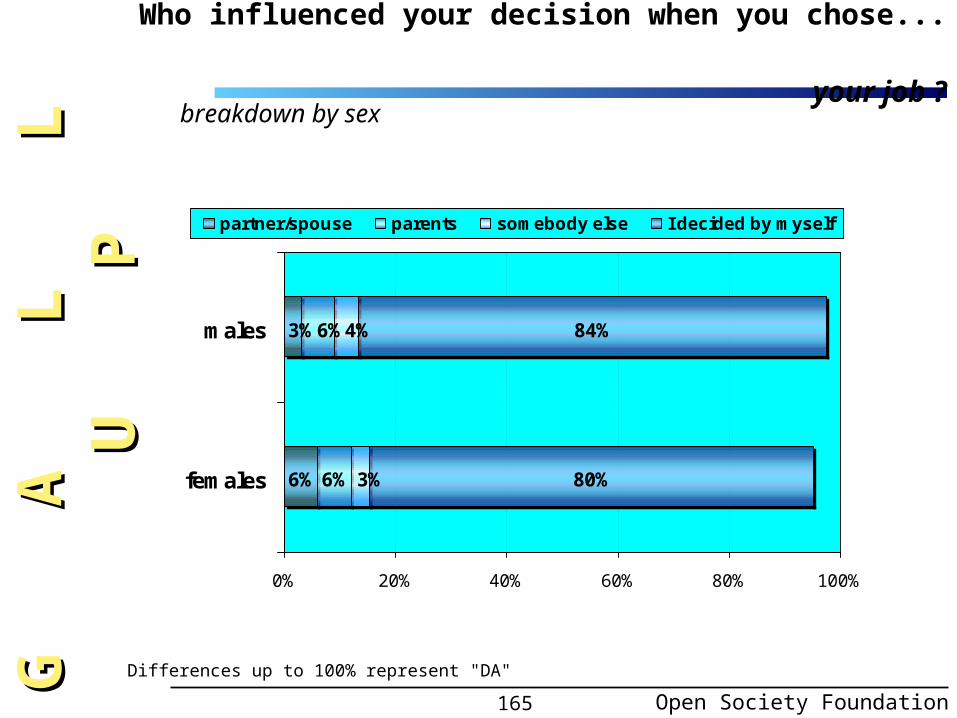
165
6%
84%
80%
3%6%
6%
4%
3%
0% 20% 40% 60% 80% 100%
males
females
partner/spouse parents somebody else I decided by myself
Differences up to 100% represent "DA"
Who influenced your decision when you chose... your job ?
breakdown by sex
Open Society Foundation
G A
G
A
L
L
U
L L
U
PP
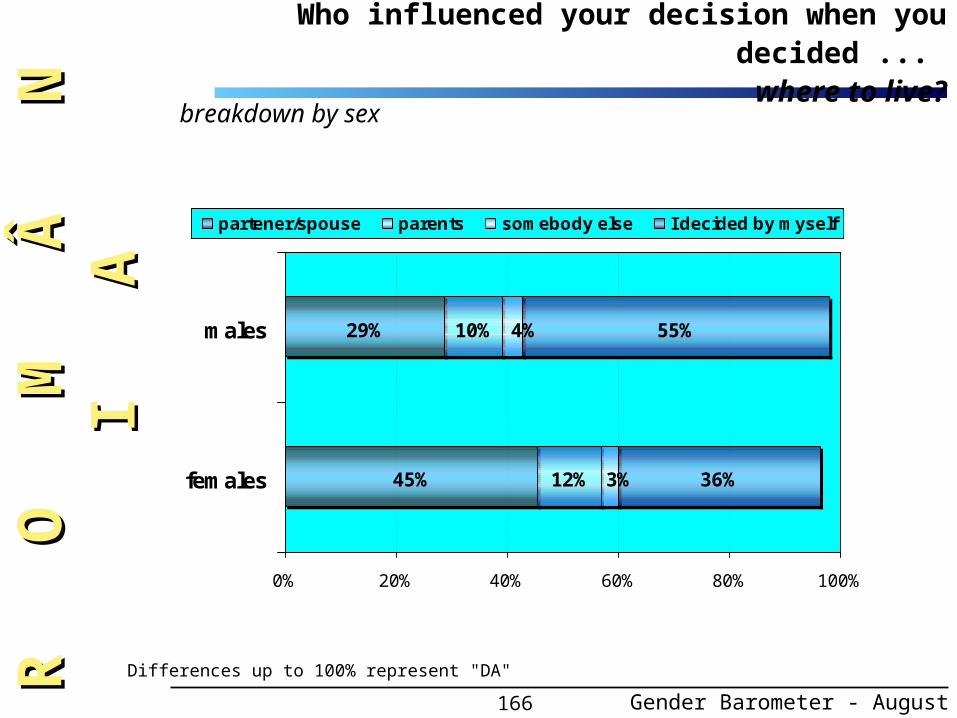
166
29%
45%
55%
36%
10%
12%
4%
3%
0% 20% 40% 60% 80% 100%
males
females
partener/spouse parents somebody else I decided by myself
breakdown by sex
R O
R
O
M
Â
N
I
M Â
N
I
AA
Who influenced your decision when you decided ... where to live?
Differences up to 100% represent "DA"
Gender Barometer - August 2000
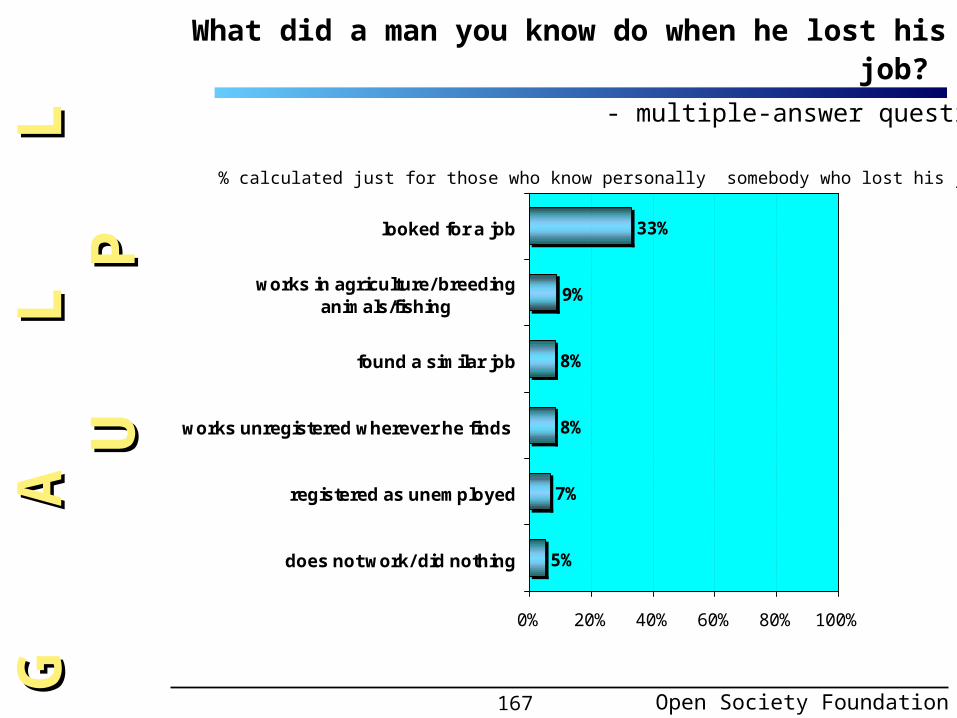
167
What did a man you know do when he lost his job?
- multiple-answer question -
33%
9%
8%
8%
7%
5%
0% 20% 40% 60% 80% 100%
looked for a job
works in agriculture/ breedinganimals/fishing
found a similar job
works unregistered wherever he finds
registered as unemployed
does not work/ did nothing
Open Society Foundation
% calculated just for those who know personally somebody who lost his job
G A
G
A
L
L
U
L L
U
PP

168
26%
11%
8%
7%
6%
6%
5%
5%
0% 20% 40% 60% 80% 100%
looked for a job
remained at home to look after the family
found a similar job
worked in her own household
worked in agriculture/breeding animals/fishing
registered as unemployed
works unregistered wherever she finds
does not work/ did not do anything
% calculated just for those who know personally somebody who lost her job
R O
R
O
M
Â
N
I
M Â
N
I
AAWhat did a woman you know do when she lost her job?
Gender Barometer - August 2000
- multiple-answer question -

169
19%
5%
4%
72%
89%
92%
90%1%1%
1%5%
4%
3%
4%
4%
3%
3%
0% 20% 40% 60% 80% 100%
has taken updrinking
steals
prostitutes
begs
Yes, a man Yes, a womanYes, both a man and a woman I know nobodyDK/DA
Do you know somebody that when s/he lost her/his job….?
How to read the figure: from the respondents who know personally a person who lost her/his job,72% do not know somebody „who took up drinking”, 19% do know a man „who took up drinking”, only 1% know a women who did that, , while 5% of them know both a man and a woman in this situation, and 3% „do not know/de not answer”.
Open Society Foundation
% calculated just for those who know personally somebody who lost her job
G A
G
A
L
L
U
L L
U
PP

170
20%
16%
13%
7%
4%
3%
3%
2%
2%
20%
6%
0% 20% 40% 60% 80% 100%
house/flat
household appliances
car
electronic appliances
personal computer
household tools
agricultural tools and implements
telephone (incl.cellular phone)
land
nothing, I would give the money other use
nothing, as I could not afford it
R O
R
O
M
Â
N
I
M Â
N
I
AA
If you had more money, what would you buy first from the following list?
-first option -
Gender Barometer - August 2000
Differences up to 100% represent"DK/DA".

171
If you had more money, what would you buy first from the following list?
-first option -
19%
17%
13%
7%
4%
4%
3%
2%
20%
5%
21%
10%
19%
6%
5%
2%
2%
2%
19%
6%
0% 20% 40% 60% 80% 100%
house/flat
car
household appliances
electronic appliances
personal computer
agricultural tools and implements
telephne (incl. Cellular)
land
nothing, I would give the money other use
nothng, as I could not afford it
males
females
breakdown by sex
Open Society Foundation
G A
G
A
L
L
U
L L
U
PP
Differences up to 100% represent"DK/DA".

172
35%
26%
21%
12%
8%
7%
7%
6%
6%
20%
6%
0% 20% 40% 60% 80% 100%
household appliances
house/flat
car
electronic appliances
personal computer
agricultural tools and implements
land
household tools
telephone (incl. Cellular)
nothing, I would give the money other use
nothing, because I could not afford it
R O
R
O
M
Â
N
I
M Â
N
I
AA
If you had more money, what would you buy first from the following list ?
- two options -
Gender Barometer - August 2000

173
28%
26%
25%
12%
10%
9%
8%
6%
6%
21%
6%
41%
17%
26%
12%
4%
8%
6%
6%
5%
20%
6%
0% 20% 40% 60% 80% 100%
household appliances
car
house/ flat
electronic appliances
agricultural tools and implements
personal computer
land
household tools
telephone (incl cellular)
nothing, I would give the money other use
nothing, as I could not afford it
males
females
breakdown by sex
If you had more money, what would you buy first from the following list?
- two options -
Open Society Foundation
G A
G
A
L
L
U
L L
U
PP

174
The profile of samples
used in surveying polls
made by:
Data at the level of
total population
BOP FSD
May 2000,
MMT
Gender Barometer, July
2000 –
Volume of the sample 1796 1839
Number of localities where the data were
collected
111 116
The weight of women 51,5 1 54 55.2
The weight of women- rural areas 50,7 1 52 54.7
Mean age- women 46,0 1 48 48
Mean age- men 44,0 1 46 48
% of university graduates 5 - 8 2 7 7
% post upper secondary schools graduates 2 - 5 2 7 7
% upper secondary schools graduates 21 - 23 2 22 21
% upper secondary schools graduates – rural
areas
9 - 12 2 15 11.5
% households with cars 18,1 3 31 29
% households with cars – urban 25,5 3 39 38
% households with cars – rural 11,3 3 21 19
% households with TV 88,0 3 90 90
% households with TV – rural 77,0 3 85 83.5
The average distance from village to the
nearest town (km)
21 22
The weight of persons selected from electoral
registers
88 91
1 The calculation was made with reference to adult population, 1995. Data from: Anuarul Statistic al României 1996 (The Statistical Yearbook of Romania –1996) ; Recensământul populaţiei şi locuinţelor din 7 ianuarie 1992 (The Census of Population and Household – January 7, 1992), CNS, 1994 2 The first figure represents the minimal estimation considering the results of then 1992 Census; the second figure represent a maximal estimation on the basis of the data from Ancheta asupra forţei de muncă în gospodării (AMIGO) Trimestrul II 1997. (Survey on Domestic Work AMIGO, second semester, 1997) CNS, September 1997. Within the maximal estimation, the basic data refer to the employed population. As there has been registered a trend to declare a higher level of education than the real one, the figures in the survey should be treated cautiously. The post upper-secondary school graduates must be treated separately but also cumulatively. 3 Data from: Aspecte privind calitatea vieţii populaţiei în perioada iulie 1996 – iunie 1997. CNS 1997 - (Some Characteristics of the Quality of Population’s Life - July 1996- June 1997).
As in research literature (Dumitru Sandu - Sociologia Tranziţiei, Ed. Staff, Bucureşti, 1996), the following groups of counties (judeţe) are considered cultural areas:
MM SMAR BH 1
AG DB PHBZ BL 4GR TR IL CL
AB HDBV SBCJ MS 7CV HGBN SJ
TM CS 2BUCUREŞTI 5
OT DJ MHGJ VL 3
TL CT 6
BC NT VR SV GL ISBT VS 8
Cultural areas were grouped into the following historical provinces: : Crişana-Maramureş (1), Banat (2), Oltenia (3), Valachia (4), Bucharest (5), Dobrogea (6), Transylvania (7), Moldavia (8).
Technical chart: The sample profile of Gender BarometerR
O
R
O
M
Â
N
I
M Â
N
I
AA
Gender Barometer - August 2000

175
The interviews were taken from 17 July – 4 August 2000. The period after was employed for electronic data
processing, editing and printing the poll. Also, standard procedures for checking the interviews and the sampling
were run.
The Institute for Science and Social Reform (ISSR) ran the control procedures for interviews and respondents’ selection. 172
addresses from 18 localities were checked by the operators of GALLUP Organization, Romania.
Validation of the research carried out by Gender Barometer took into consideration both the control run by ISSR and
also the thorough checking of data consistency.
92 operators collected the data in 1839 “face to face” interviews.
The sample contains 116 localities, out of which 67 are communes, and 49 towns and cities, spread all over the
historical regions of the country. The most remote village (88 km from a town) is Ceamurlia de Jos, the main village
of Topalu commune in Tulcea county.
The sample contains 1839 persons, with 1016 women. The oldest woman is a 94-year widow, living on a 300000 lei
agricultural pension, in the main village of a commune in Botoşani county. The oldest man is 90; he is living with his
76-year wife on a 600 000 lei agricultural pension (plus his wife’s 120 000 lei state pension) in a village in Prahova
county.
The book was printed in 1000 copies to be distributed free of charge to all persons interested in the subject.
Behind the scene of the Gender BarometerG
A
G
A
L
L
U
L L
U
PP
Open Society Foundation
The interviews were taken from 17 July – 4 August 2000. The period after was employed for electronic data
processing, editing and printing the poll. Also, standard procedures for checking the interviews and the sampling
were run.
The Institute for Science and Social Reform (ISSR) ran the control procedures for interviews and respondents’ selection. 172
addresses from 18 localities were checked by the operators of GALLUP Organization, Romania.
Validation of the research carried out by Gender Barometer took into consideration both the control run by ISSR and
also the thorough checking of data consistency.
92 operators collected the data in 1839 “face to face” interviews.
The sample contains 116 localities, out of which 67 are communes, and 49 towns and cities, spread all over the
historical regions of the country. The most remote village (88 km from a town) is Ceamurlia de Jos, the main village
of Topalu commune in Tulcea county.
The sample contains 1839 persons, with 1016 women. The oldest woman is a 94-year widow, living on a 300000 lei
agricultural pension, in the main village of a commune in Botoşani county. The oldest man is 90; he is living with his
76-year wife on a 600 000 lei agricultural pension (plus his wife’s 120 000 lei state pension) in a village in Prahova
county.
English translation: Otilia Dragomir.