clickprints on web- k@wharton
TRANSCRIPT
8/15/2019 Clickprints on Web- K@Wharton
http://slidepdf.com/reader/full/clickprints-on-web-kwharton 1/34
Clickprints on the Web: Are there signatures in Web browsing data?
http://opim.wharton.upenn.edu/~balaji
http://faculty.gsm.ucdavis.edu/~yiyang
Balaji Padmanabhan
The Wharton School
University of Pennsylvania
Yinghui Yang
Graduate School of Management
University of California, Davis

8/15/2019 Clickprints on Web- K@Wharton
http://slidepdf.com/reader/full/clickprints-on-web-kwharton 2/34
1
Clickprints on the Web: Are there signatures in Web browsing data?
Abstract
We address the question of whether humans have unique signatures - or clickprints - when they browse
the Web. The importance of being able to answer this can be significant given applications to electronic
commerce in general and in particular online fraud detection, a major problem in electronic commerce
costing the economy billions of dollars annually. In this paper we present a data mining approach to
answer this “unique clickprint determination problem”. The solution technique is based on a simple yet
powerful idea of casting this problem as an aggregation problem. We develop formal methods to solve
this problem and thereby determine the optimal amount of user data that must be aggregated before
unique clickprints can be deemed to exist. Using some basic behavioral variables derived from real Web
browsing data, our results suggest that the answer to the main question is “most likely”, given that we
observe reasonably accurate user predictions using limited data.
1. Background and motivation
Humans are believed to have many unique characteristics such as fingerprints or even handwriting styles.
We use the term “signatures” here to refer to distinguishing characteristics that are behavioral, as opposed
to characteristics that are physiological. The applications of methods for unique identification are
significant, ranging from forensics and law enforcement to novel biometrics-based access to personal
information that protects user privacy and mitigates fraud. The development and perfection of such
unique distinguishing characteristics continues to be an important area of research.
Given the vast impact technology has had in everyday life, there has naturally been interest in recent
years on whether there might be unique signatures in technology mediated applications. For instance:
There is evidence that shows that individuals have unique typing patterns, or “keystroke dynamics”
(Miller 1994) when they use computer keyboards. In an experiment involving 42 user profiles, Monrose
and Rubin (1997) shows that depending on the classifier used, between 80 to 90 percent of users can be

8/15/2019 Clickprints on Web- K@Wharton
http://slidepdf.com/reader/full/clickprints-on-web-kwharton 3/34
2
automatically recognized using features such as the latency between keystrokes and the length of time
different keys are pressed. A natural extension was to incorporate both keystroke dynamics and mouse
movements to identify users, and an experiment using both was reported in Everitt and McOwan (2003).
Building on some classic ideas in information science that authors often have unique content
authoring styles, recent research that studied online message board postings showed that users may have
online “writeprints” (Li et al. 2006) - unique ways in which they write messages on online bulletin
boards. A post on a message board is converted to a large number of features (such as number of
sentences and frequency of specific characters), and Li et al. (2006) applied a novel genetic algorithm
based feature selection method to extract a powerful set of sub-features that are then used to identify
users. Experiments involving 10 users in two different message boards suggest that “writeprints” could
well exist since the accuracies obtained were between 92 and 99 percent.
A large number of users now use portable devices, many of which contain personal data. A group of
researchers in Finland have recently shown (Mäntyjärvi et al. 2005) that individuals may have unique
“gait” or walking patterns when they move with these devices. Building on this observation, the
(different) walking patterns are used to trigger an acceleration sensor in the mobile device. The device
then requests additional information from a user if it detects what it deems as unusual behavior.
In the same spirit, consider behavior when consuming online content. Do humans have unique
“clickprints” based on how they browse, or consume content online? This is a fascinating question, and
will need extensive research before it can be conclusively answered since there are several hard
challenges as noted later in this paper. This paper provides a new formulation of, and some preliminary
answers to this question. There are several different research streams, reviewed in Section 3, that address
related questions but not this specifically1
.
1 It is important to note that the research presented in this paper discuss the possibility of identifying users based ontheir online behavior. However this “identification” is still anonymous, and even perfect methods will only be ableto indicate that some current session belongs to the “same user” as some previous session. These methods cannot identify users by “name”.

8/15/2019 Clickprints on Web- K@Wharton
http://slidepdf.com/reader/full/clickprints-on-web-kwharton 4/34
3
Before introducing our ideas, it is useful to review some broader implications of research into this
question. Assume that research provides us a conclusive answer to this question. Further assume that this
translates into a method for either “detection” or “verification”. Detection is the ability to determine who
an online user is when the user has not yet identified himself or herself in any way to a merchant (such as
by signing on, or entering credit card information). When a user has identified himself or herself,
verification is the ability to check that the revealed identity is correct. Naturally detection is the harder
problem to solve, but both are important abilities to have. Having a method for detection could help
online merchants customize content and recommendations much earlier in a user session than they might
otherwise be able to do (since they will not have to require a sign on before implementing strategies to
better serve this customer). Implemented appropriately, such customized online storefronts have been
shown to increase customer satisfaction. While detection is clearly valuable, for most online merchants
having a method for better verification alone – or having an additional verification filter over an existing
one - can directly help mitigate fraud.
Some numbers provide valuable perspective. The U.S. Department of Commerce reported that in
2004 U.S. retail ecommerce sales was $71 Billion, accounting for 2 percent of total retail sales in the
economy. Another source, Cyberquest2
, estimated that in the same year (2004) online fraud cost
merchants $2.4 Billion, and that about 1.3% of all online orders that year were fraudulent. The most
recent data published by the U.S. Department of Commerce shows that in the first quarter of 2006, retail
ecommerce sales climbed to $25 Billion, accounting now for 2.6% of total retail in the quarter. While
online fraud statistics for 2006 are not yet available, a rough approximation using 2004 rates would
suggest a direct cost to the economy of $3-$4 billion in 2006. Also, as mentioned earlier, the detection
capability can provide other advantages to online retailers, helping them compete more effectively for the
approximately $100 Billion at stake here in retail ecommerce in the U.S. alone.
2 See http://www.cybersource.com/fraudreport/

8/15/2019 Clickprints on Web- K@Wharton
http://slidepdf.com/reader/full/clickprints-on-web-kwharton 5/34
4
2. Framing the unique clickprint determination problem
In this paper we address the problem of determining whether users have unique online clickprints. While
not the focus of this paper, methods for answering this often suggest a solution for the related verification
and/or detection problems.
2.1 Some problem characteristics and solution approaches
First, to appropriately reflect how these methods may be used, we will consider this question specifically
in the context of a given Web browsing data set. That is, for a specific site, say Yahoo!, are there unique
clickprints in the Web browsing data that Yahoo! observes? Note that the answer may clearly be different
for different sites. As an (extreme) example consider a site that just has one main home page with some
text but no more links or content to consume. It is unlikely that the Web browsing data observed here will
have unique clickprints given that most users here may well exhibit the exact same behavior – i.e. they
come in, see the only page and leave.
So, for a given site, are there unique online clickprints? There are two natural ways in which the
question can be addressed using Web browsing data observed at that site:
1. Build features and classify. Specifically, the Web browsing data is usually transformed into a data set
of user sessions, where each row corresponds to a single session that a user conducts online. The variables
are behavioral features that are constructed, such as the time spent in the session or the nature of the
content seen, and the dependent variable is the user ID for the session. Now if a classifier can be built that
provides very high accuracies (ideally close to 100%), it can be claimed that unique clickprints exist since
the classifier is able to exactly identify users from their behavior alone. Here note that the actual
clickprints are implicit in the learned classifier. These may be “extracted” by analyzing the classifier
using standard methods.
If the answer to the main question is “yes” because the learned classifier has very high accuracy,
then verification and detection may be done based on using the learned classifier to make predictions for a

8/15/2019 Clickprints on Web- K@Wharton
http://slidepdf.com/reader/full/clickprints-on-web-kwharton 6/34
5
given session. Hence in this approach, answering the existential question and providing methods for
verification/detection are related.
2. A patterns-based approach - pick a pattern representation, and search for distinguishing patterns. A
second approach is to make explicit the representation for clickprints. For example, assume a specific
representation for clickprints, say conjunctions of feature-value pairs (itemsets), and then look for patterns
in that representation that distinguish different user sessions. For this chosen representation, the output of
such a learning algorithm may be an itemset for each user (e.g. for user k , “total_time < 5 minutes and
number of pages > 50” may be a unique clickprint since there is no other user for whom this is true.)
In this approach if the answer to the existential question is “yes” – because for all users we have
learned patterns that hold for them and no others – then verification and detection techniques may be
implemented based on this. Verification is the process of selecting the unique clickprint learned for that
user, and checking if it holds in some data purported to be from this user. Detection is possible, but needs
exhaustive checking – given some data run all the unique clickprints through this and check which one
matches.
2.2 An undecidability conjecture and weaker versions of the problem
Conjecture 2.2.1. The general problem of determining whether there are unique clickprints given any
Web browsing data is undecidable.
First note that when approaches 1 and 2 determine that the answer is “yes” then we can
conclusively say that unique clickprints exist in the data, and this is certainly an important result.
However when they do not provide a positive confirmation there is no guarantee that unique clickprints
do not exist, it may just be the case that these approaches could not find them. Specifically, approach (1)
depends on a specific set of features and a chosen classifier. It may always be possible that one can
construct some new set of features, or pick a new classifier, that may find unique clickprints.
Unfortunately the set of all feature construction methods and classifiers is not enumerable and it is not
possible to simply go through an exhaustive list. Similarly approach (2) depends on a representation for

8/15/2019 Clickprints on Web- K@Wharton
http://slidepdf.com/reader/full/clickprints-on-web-kwharton 7/34
6
clickprints. Perhaps a chosen representation did not result in learning unique patterns, but there may
always be a different representation for which unique clickprints exist.
If we admit that the two types of solution procedures (i.e. “build features and classify” and the
“patterns-based approach”) outlined in Section 2.1 are the “only” approaches to answering the unique
clickprint determination problem, then this can be stated as a theorem since the proofs follow directly
from the arguments offered above. However we leave open the possibility that there may be (unknown)
alternate approaches and hence just stated this as a conjecture.
Given the above, we state weaker versions of the problems:
A. Given a feature construction mechanism, F , a classifier, C , and a Web browsing data set D, are there
unique clickprints, implicit in F and C , that exist in D?
B. Given a pattern representation, R, and a Web browsing data set D, are there unique clickprints defined
on R that exist in D?
In the rest of this paper we focus on problem (A) and note that addressing (B) for different representations
will be a promising direction for future research as well.
Solving problem (A) may appear trivial, since all that is needed is to construct features, build a
classifier and check its accuracy. However this seems trivial, as we argue shortly, only because it ignores
perhaps the most interesting aspect of the problem – the unit of analysis at which the search is done.
2.3. Casting the problem as an aggregation problem.
Specifically, it is common in the literature to treat a single session at a Web site as the unit of analysis and
build models that predict purchase in the session, or as is the case here, models that predict the user ID
corresponding to the session. This approach implicitly assumes that an online signature is something that
manifests itself in the chosen unit of analysis, here a single Web session. In practice this may often not be
the case. For instance, a news event may prompt an individual to visit a Web site and read an article and
perhaps watch a related video. If the news event is of wide interest there may be several, even millions, of
sessions that “look similar”. Our experiments reported later too show that the accuracies of predicting a
user based on treating a single session as the unit of analysis is often significantly low.

8/15/2019 Clickprints on Web- K@Wharton
http://slidepdf.com/reader/full/clickprints-on-web-kwharton 8/34
7
However over time – across many sessions - an individual often reveals more information that
may then enable unique identification. In other words, we do not assume that every Web session has
information to uniquely identify individuals – in fact the examples offered above suggest otherwise. What
specifically motivates us here is the observation that there may be some level of aggregation, agg, such
that every agg sessions may have enough information to uniquely distinguish individuals. Determining
this level of aggregation agg is critical, which leads to the following problem statement:
A2 Given a feature construction mechanism, F , a classifier, C , and a Web browsing data set D, find the
smallest level of aggregation agg at which unique clickprints, implicit in F and C , exist in D.
Hence we have casted the unique clickprint determination problem as an aggregation problem, where the
main problem now is to develop efficient methods for determining what the smallest level of aggregation
is at which unique clickprints exist.
There is a statistical interpretation as well for this manner of casting the problem. This has to do
with how we might construct features (the procedure F ) for groups of sessions, as opposed to single
sessions. A natural approach is to determine a set of variables that can be constructed for a single session,
and to then use groups of sessions to learn the full distributions of these variables. For example, if a
variable is the total time spent in the session, for a single session by a user we may determine this to be,
say, 4 minutes. Even if this variable is relevant to uniquely distinguishing users, it is unrealistic to assume
that this person will always have sessions of length exactly 4 minutes, and equivalently it is possible that
someone else may have a session of length 4 minutes too in some other session. However as sessions are
aggregated we obtain better estimates of the entire distribution of this variable for this user. After, say, ten
sessions, we may determine that the distribution is N(4, 1.2), and this is sufficiently far from all other
distributions (for other users). Note that in the actual solution procedure we do not compare distributions
as such, it is the classifier C that will determine which, if any, of different statistical measures are
significant for classifying individuals. Interestingly, there is also evidence in the psychology literature for
deriving such measures from aggregations. Mischel and Shoda (1995) note that substantial empirical
evidence exists to show that individuals can be characterized not just by stable individual differences in

8/15/2019 Clickprints on Web- K@Wharton
http://slidepdf.com/reader/full/clickprints-on-web-kwharton 9/34
8
overall behavior, but also by distinctive patterns of behavior variability – which some of the measures
computed from aggregations capture.
Readers may note that in the above example, aggregating more than ten sessions may give us an
even better estimate of the distribution. However we may not need a better estimate if we already have
enough information for the classifier to uniquely distinguish individuals. So while higher levels of
aggregation may also provide unique clickprints, we seek the smallest level of aggregation at which we
can do so, as reflected in the problem statement A2. Seeking the smallest level of aggregation is also
useful from a practical perspective as we discuss further below.
Finally note that it is certainly possible that given some set of variables, the individual and joint
distributions of these, estimated at any level of aggregation, may still be inadequate to uniquely
distinguish individuals – perhaps because there are a very large number of individuals or perhaps because
unique clickprints just do not exist. In such cases we will require that our solution procedure indicate that
no level of aggregation is adequate to uniquely distinguish the users.
Assuming that we have a solution procedure to determine the level of aggregation agg, if agg > 1
we will need more than one session’s worth of data to uniquely determine who this user is. This brings
out one downside of our approach, related to the other goals of verification and detection. Assume we
need five sessions to uniquely distinguish users. An online retailer observes a current session and seeks to
identify the user. For the purpose of verification the retailer can easily – in real time - retrieve the
previous four sessions of this user from past data, combine these with the current session to create
variables so that the classifier can be applied. Detection though, is now computationally more difficult to
do in real time since the system will need to retrieve the previous four sessions for all users in order to
determine who the current user is. One option is to perhaps precompute various measures for all users and
develop efficient update mechanisms where all the past sessions may not have to be retrieved. We will
focus our attention in this paper on methods for determining the smallest level of aggregation for uniquely
identifying users, and will leave specific implementations of the verification and detection problems for
future work.

8/15/2019 Clickprints on Web- K@Wharton
http://slidepdf.com/reader/full/clickprints-on-web-kwharton 10/34
9
3. Related Work
The unique clickprint determination problem in general and its casting as an aggregation problem are
novel and there is no prior work that has addressed these specifically. However our work here is built on
several important ideas that have been well developed in the literature, particularly prior work in the areas
of learning user profiles and signatures, methods for biometric identification, data preprocessing
techniques for Web data, and online intrusion detection.
An early technique developed in Aggarwal et al. (1998) showed how association rules could be
generated from online data to build profiles. Adomavicius and Tuzhilin (2001) describe a system for
learning profiles that capture both facts about users as well as behavioral rules learned from transaction
data. Instead of just individual user profiles, there has also been work on learning aggregate profiles, such
as the work of Mobasher et al. (2002), that builds profiles that can apply across groups of users who may
have similar interests. Rather than learning profiles from clickstream data, Goecks and Shavlik (2000)
describe an approach that unobtrusively monitors user activities on pages, such as how much they scroll,
to build profiles that capture user interest in specific pages or content. Reviews of work in this area are
presented in Srivastava et al. (2000) and Kosala and Blockeel (2000).
The main reason for learning profiles has been to use these for personalization and product
recommendations. However these applications do not require that users have truly unique profiles. On the
contrary it is recognized that these may be similar since it is possible that many users share the same
interests or buy similar products. Hence most of this work did not focus on learning profiles that uniquely
distinguish all users, which is the focus in our paper. However this literature does make the key point that
users have behavioral signatures (not assumed to be unique) that manifest themselves in clickstream data.
Motivated specifically by the signature learning problem, in our recent work (Yang and Padmanabhan
2005) we showed how a pattern-based clustering approach can be used to group Web transactions such
that individual users may be identified. This approach was based on choosing a representation for user
signatures and to then cast the problem as clustering user transactions to separate users. While this

8/15/2019 Clickprints on Web- K@Wharton
http://slidepdf.com/reader/full/clickprints-on-web-kwharton 11/34
10
worked well for small sets of users, the accuracies obtained for larger sets of users were not high and this
still used only single sessions as the unit of analysis to learn patterns.
Also related is work on learning user profiles specifically for fraud detection (Fawcett and
Provost 1996). From a database of transactions in which fraudulent and normal transactions are marked,
user profiles may be built from machine learning techniques that can then be used to predict if any given
transaction is fraudulent. While effective for fraud detection, such approaches cannot be used for the more
general task of uniquely distinguishing individuals. Specifically for fraud detection we offer a
complementary approach. Here we do not require any data on fraud, but instead build models to identify
users. This naturally helps in fraud detection when a user reveals a different identity as the one predicted.
Cortes and Pregibon (2001) show how user call records can be used to learn caller signatures. These
signatures can then be tested against a current call to determine if any fraud occurred. While this is a
different application, building statistical measures across telephone calls and generating feature
distributions across multiple Web sessions are similar in spirit, however users are not uniquely identified.
Converting physiological characteristics of humans into techniques for biometric identification has
been an active area of research for several years and Miller (1994) presents a review of many such
approaches. With the widespread use of technology, recently there has been substantial interest in
identifying unique behavioral characteristics, such as clickprints, that can possibly serve as identifiers.
Monrose and Rubin (1997) show that users have distinct ways in which they use computer keyboards and
that users have unique keystroke dynamics. Everitt and McOwan (2003) extend this work to the use of
mouse movements in addition to keystroke dynamics and note that the combination can often be used to
uniquely identify humans. Madigan et al. (2005) recently showed that authors have unique writing styles
that enable identifying them from text. In a similar vein Li et al. (2006) showed that users have unique
writing patterns when they author content for online message boards. Research has also shown that
humans may have distinct patterns even in everyday activities like walking and driving. Igarashi et al.
(2004) show how driving behavior, such as the extent of braking, often can be used to identify the driver
of a vehicle. Mäntyjärvi et al. (2005) show that users may also have unique gait patterns relating to how

8/15/2019 Clickprints on Web- K@Wharton
http://slidepdf.com/reader/full/clickprints-on-web-kwharton 12/34
11
they walk when they talk on mobile phones. Such gait patterns are then used to provide an extra layer of
security for personal information in mobile devices.
Our research also builds on the notion that clickstream data lends itself to several methods for
preprocessing and combining units of analyses such as individual clicks or sessions (Cooley et al. 1999,
Zheng et al. 2003). Specifically the use of sliding window techniques for considering multiple Web
sessions and the clustering of Web sessions for various objectives are common. However the use of
aggregation of Web sessions specifically to build models to uniquely identify users has not been
considered before.
The problem of detecting security risks in computer networks is another one where “signatures” play
an important role. Lee et al. (1999) discuss how specific data mining techniques can be used to address
online intrusion detection. The general approach is similar to fraud detection where data on intrusions
exist, and models are built to predict these occurrences. There are broadly two types of approaches here
(Ellis et al. 2004). The first looks for specific signatures, such as patterns that certain computer viruses
always contain. The second approach casts the problem as anomaly detection, where the goal is to detect
any behavior different from normal. In contrast to our approach traditional intrusion detection systems do
not uniquely identify all users as we do unless these users are linked to the security compromises. On the
flip side our approach may be used to intrusion detection when an online user perhaps logs in as another
person; however it is not clear if our approach can solve some other central intrusion detection issues such
as the spreading of computer works or viruses.
Finally, recent research in marketing (Hui, Fader and Bradlow 2006) discusses a framework for
understanding very general types of “path data” in marketing. While Web clickstream data is one such
example, Hui, Fader and Bradlow (2006) point to other types of such data, such as in-store grocery
shopping paths. While this paper specifically addresses signatures in Web clickstream data, future
research may study the existence of these in other forms of path data as well.

8/15/2019 Clickprints on Web- K@Wharton
http://slidepdf.com/reader/full/clickprints-on-web-kwharton 13/34
12
4. Solving the Problem: The Naïve Approach
The naïve approach to determining the smallest level of aggregation is to exhaustively search for different
levels of aggregation starting from a single session and to stop at a level of aggregation corresponding to a
highly accurate classifier. We present this formally here so that we can discuss all related terminology.
Let D = { S1 , S2 , …, S N } be a Web browsing data set representing a total of N Web sessions
conducted at this site. Assume that in this data set the number of unique users is M and users are
identified by a userid ∈ {1,2,…, M }.
Rather than defining each session as a set of variable-value pairs that can be used directly by our
method, we define it more generally here to capture the wide range of (different and often proprietary)
information commercial online retailers extract from each click or page that a user views. Using
terminology we previously proposed in (Padmanabhan et al. 2001) we define each session Si to be a tuple
of the form <ui , clicksi> where ui is the userid corresponding to the user in session Si and clicksi is a set of
tuples of the form <object , accessdetails>, where each tuple represents data that a site captures on each
user click (see Figure 4.1 below for an example). Corresponding to a click, object is the Web object
(usually a Web page) accessed, and accessdetails is a set of attribute-value pairs that represents any other
information that a site can capture from each user click. This includes standard information from http
headers such as time of access, IP address, referrer field, and a wide range of other information that online
retailers capture from each page view, such as the content in this page or whether the user made a
purchase in this page.
Since time stamps are always stored in Web log data we assume that the time at which each page
is accessed is necessarily part of accessdetails. We make this assumption since we need to sort user
sessions in chronological order before considering various aggregations of these sessions.
Figure 4.1 presents an example of a user session based on the above representation.

8/15/2019 Clickprints on Web- K@Wharton
http://slidepdf.com/reader/full/clickprints-on-web-kwharton 14/34
13
S1 = < ID=4, {< home.html, {(time = 02/01/2001 23:43:15),(IP = 128.122.195.3),(Ads Shown = {cars, travel packages})
}>,< flights.html,{
(time = 02/01/2001 23:43:15),
(IP = 128.122.195.3),(Ads Shown = {finance, travel packages}),(Flights shown = 14)
}>
}>
Figure 4.1. An example of a session at an online travel site.
Next define F to be a feature construction procedure that takes a set of sessions belonging to the same
user and returns a vector of attribute values <v1, v2,…, vq, userid >. For instance, given a set sessions, the
procedure F may be defined to return: <avg. session time = 5.3 minutes, variance of session time = 1.3,
avg. number of pages = 4, variance of number of pages = 1.1, avg. number of ads shown = 7, variance of
number of adds shown = 2.2, userid = 4>. For any given level of aggregation (of sessions), agg, when F
is repeatedly applied to sets of agg consecutive sessions, and in such a manner for all users, we derive a
data set Dv, on which a classifier, C , is built. When we need to make explicit the specific level of
aggregation, agg, used in the process of creating Dv we will denote the data set as Dv
agg.
Here C is a learning algorithm such as CART or any algorithm for obtaining maximum likelihood
estimates for general parameterized models. This can be applied to data to learn the actual classification
function g: V → U that maps any feature vector v ∈ V to a user ID ∈ U , where U ∈ {1, 2,…, M }. Hence
we will write g = C ( D) to refer to the trained classifier built on the data set D by applying algorithm C .
In order to be explicit about how F creates data sets for different levels of aggregation, we present
an example in Figure 4.2. We will also refer to this example later in the paper to clarify important aspects.
Assume six user sessions such that:
User 1:
Visits 10 pages over 30 mins in session 1Visits 6 pages over 20 mins in session 2Visits 12 pages over 15 mins in session 3
User 2:
Visits 5 pages over 40 mins in session 1Visits 3 pages over 10 mins in session 2Visits 7 pages over 15 mins in session 3

8/15/2019 Clickprints on Web- K@Wharton
http://slidepdf.com/reader/full/clickprints-on-web-kwharton 15/34
14
At agg = 1, F constructs D v1 as:
Avg. num pagesper sess.
Avg. time spentper sess.
User
10 30 1
6 20 1
12 15 1
5 40 2
3 10 2
7 15 2 At agg = 2, F constructs D v
2as:
Avg. num pagesper sess.
Avg. time spentper sess.
User Comment
8 25 1 From sessions 1 and 2 of user 1
9 17.5 1 From sessions 2 and 3 of user 1
4 25 2 From sessions 1 and 2 of user 2
5 12.5 2 From sessions 2 and 3 of user 2 At agg = 3, F constructs D v
3 as:
Avg. num pagesper sess.
Avg. time spentper sess.
User Comment
9.33 21.67 1 From sessions 1, 2 and 3 of user 1
5 21.67 2 From sessions 1, 2 and 3 of user 2
Figure 4.2. An example of constructing data sets at different levels of aggregation
Figure 4.3 formally presents the naïve procedure for determining the smallest level of aggregation at
which unique clickprints can be deemed to exist. Here we start with a set of sessions and first group all
sessions belonging to the same user. For each user, we then sort all of his or her sessions chronologically,
and then apply a sliding window of size agg to pick out all groups of consecutive sessions of size agg.
The feature construction procedure is then applied to every such sliding window to create feature vectors.
Finally on all the feature vectors constructed in this manner a classifier is built. If the goodness of this
classifier is better than some threshold goodness we deem that unique clickprints exist at this (agg) level
of aggregation. If not the case, we repeat the entire process after incrementing agg by one.
Note that the goodness of the classifier is also considered an input since it can be based on
different criteria such as MSE, cross-validated errors or R-squared. Without loss of generality we assume
that goodness is defined such that a larger value corresponds to a better model.
However it may be possible that incrementing agg in this manner never finds a model as accurate
as needed. Hence we use as input a procedure that will test if some other stopping criterion is true. Two
stopping criteria that we suggest are: (i) If the size of Dv falls below a minimum number – as the example
in Figure 4.2 shows, at higher levels of aggregation the data set size is naturally smaller. At some point
the data size may fall below a threshold considered too small. (ii) a maximum agg that we are willing to

8/15/2019 Clickprints on Web- K@Wharton
http://slidepdf.com/reader/full/clickprints-on-web-kwharton 16/34
15
consider. In such cases when a stopping criterion triggers termination, the procedure returns a negative
number indicating that no such agg exists.
Inputs:Data set D = { S1, S2, …, SN } of N sessions.Feature construction function F (S) returning a vector of features <v1, v2,…, vq,userid >, where S is a set of sessions.Classification algorithm C and related model goodness criterion, goodness
(e.g. of goodness are 1-MSE, 1-cross-validated errors, R-squared etc)Threshold goodness, A, at which the learned classifier is deemed to adequatelyclassify users.(A is ideally 1 but can be other if some misclassification can be tolerated).A procedure, TEST _STOP, to test if some other stopping condition is met
Output: The minimum level of aggregation, agg
model_acc = 0agg = 0other_stopping_condition = FALSEwhile ( (model_acc < A) and not(other_stopping_condition) ) {
agg = agg + 1Dv = {}Compute M as the number of unique userIDs in D For u = 1 to M {
Select as X 1, X 2,…,X k all sessions belonging to user u in D Sort X 1, X 2,…,X k chronologically such that time that
session X i starts < time that session X j starts whenever i < j Let Sagg = {X agg | X agg is a set of agg consecutive sessions in X 1, X 2,…,X k }// i.e. all sliding windows of size agg are created and stored in Sagg
Forall s ∈ Sagg
Dv = Dv ∪ F (s)}g =
C (Dv) // i.e. g is the trained classifiermodel_acc = goodness (g )
other_stopping_condition = TEST_STOP().}If (model_acc < A) // the “other stopping condition” terminated the iterations
agg = -1return agg
Figure 4.3. Exhaustive search for determining the smallest level of aggregation
5. A Monotonicity Asumption for C given D and F.
Ex ante we do not know how large agg is and hence the complexity of the above procedure is O(|D|)
where | D| is the size of the data corresponding to no aggregation. Moreover, the ideas in this paper can be
applied to a different unit of analysis, say each page click, instead of treating a session as the main unit of

8/15/2019 Clickprints on Web- K@Wharton
http://slidepdf.com/reader/full/clickprints-on-web-kwharton 17/34
16
analysis that we desire to aggregate over. In such a case the smallest agg is likely to be much higher since
we may need to aggregate over many more clicks to learn unique clickprints.
Hence both for complexity reasons as well as for pragmatic reasons the exhaustive search
procedure discussed in Section 4 may not be adequate. In this section we make a monotonicity
assumption that will significantly reduce the complexity of the process, bringing it to O(log2| D|).
5.1. The Monotonicity Assumption
Let g′ = C ( Dvi), denoting the classification function learned from applying the feature construction
procedure F on the original data set D at a level of aggregation i. Similarly let g″ = C ( Dv j). Also assume a
given goodness measure goodness.
The monotonicity assumption we make here is the following.
Given C , D, F and goodness, then goodness(g′) ≥ goodness(g″) whenever i > j, where as noted earlier:
g′ = C ( Dvi), g″ = C ( Dv
j) and
Dvi refers to the aggregated data set created by applying F to D at level of aggregation i.
In words, this states that the goodness of the model when applied to “more aggregated” data is never
worse than the goodness of the model applied to “less aggregated” data.
Unfortunately we cannot prove this for any C , D, F and goodness and hence state this as an
assumption. However we can:
test this empirically, as we do in our experiments. Specifically for each data set we build classifiers
for a large number of different aggregation levels and compute the goodness of the models at these
various levels. Empirically such a test should enable us to determine a fraction of cases where a more
aggregated data set actually results in a worse model. If this fraction is below a threshold we can
deem this to be an acceptable assumption.
provide intuitive arguments why this is a reasonable assumption. We present this next.

8/15/2019 Clickprints on Web- K@Wharton
http://slidepdf.com/reader/full/clickprints-on-web-kwharton 18/34
17
5.2. Justifying Monotonicity
The example in Figure 4.2 should give the reader some intuition about why this may happen. The
intuition is the following:
Without any aggregation the set of features constructed for each session, <v1, v2,…, vq>, is used to
classify the user. If these features are assumed to be informative for classification, then estimating these
over consecutive sessions for each user can only provide better estimates, and perhaps even the full
distribution, of these features. This is clearly more information, and classifiers built using more
information should do at least as well as those using less information.
Note that this is not “more information” in the sense of adding extra variables for the same data
set – which is known to result in better models. As the example in Figure 4.2 shows, (i) at different levels
of aggregation no two records are even the same, and hence the data sets are definitely not the same (ii)
the number of variables at different levels of aggregation remains the same. Hence in contrast this is
“more information” in the sense of getting better estimates for informative features by averaging or
estimating feature distributions over a larger time horizon.
Finally, the reader may note that in the example in Figure 4.2 the number of records for users 1
and 2 were created equally – i.e. the priors for the different class labels were equal (50%). If the priors are
not the same, it is possible that aggregation may result in a trivial reason for improving the goodness of
models built at higher levels of aggregation. For instance, assume that there are M instances of user 1 and
N instances of user 2 in the data set at some level of aggregation i, and let M > N . At a higher level of
aggregation, i+k , there will be M -k instances of user 1 and N -k instances of user 2.
Since we assumed M > N , a trivial model that always predicts the user with the greater prior will
have an accuracy of M / ( M + N ) in the less aggregated data set and an accuracy of M -k / ( M -k + N -k ) at the
higher level of aggregation.
Lemma 5.2.1. For integers M , N and k that are positive ( M -k ) / ( M + N -2k ) > M / ( M + N ) if M > N .
The proof is straightforward (the inequality simplifies to M > N , given as true). This however shows that
even a trivial model will do better at higher levels of aggregation just because of unequal priors in the

8/15/2019 Clickprints on Web- K@Wharton
http://slidepdf.com/reader/full/clickprints-on-web-kwharton 19/34
18
original data set. This occurs essentially because the unequal class priors gradually become even more
skewed in the same directions at increasing levels of aggregation (as Lemma 5.2.1 states). An important
consequence of this is that any method for testing goodness at different levels of aggregation must control
for this. In our experiments we do so by maintaining the original priors across all levels of aggregation
similar to the idea of stratified sampling. Hence improvements at higher levels of aggregation will be
observed mainly due to the fundamental intuitions behind the monotonicity assumption stated here.
6. Determining the Optimal Aggregation
The monotonicity assumption implies that the model goodness at increasing levels of aggregation are
sorted in ascending order. If the smallest number of sessions for any user is N , the highest level of
aggregation we consider is N . In practice it may be smaller, either because it is adequate or because of a
user specified stopping criterion. Hence if gagg represents the model goodness at level of aggregation agg,
then the monotonicity assumption suggests that the sequence g1, g2,…, g N is in ascending order.
Finding the smallest agg corresponding to a goodness greater than some threshold can now be
done using the classic binary search technique where the sequence is recursively broken into halves based
on whether the mid-point is greater or less than the threshold. That is, we first consider g N/2, and if this is
greater than the threshold, then the smallest level of aggregation has to be even lower, and hence we
repeat this procedure in the first half of the sequence. Instead if g N/2 does not satisfy our threshold then we
need to aggregate more, and hence repeat the procedure for the second half of the sequence. The
complexity of this procedure is O(log2 N ).
Using the same notation as Section 4, Figure 6.1 presents the new algorithm. There are three
changes here compared to the exhaustive search procedure presented in Section 4:
1. The procedure is modified as a binary search algorithm (we explain the steps in detail subsequently).
Since binary search usually searches for a value in a list it terminates when the value is found.
However the goal here is to search for the smallest value satisfying an accuracy threshold, so we will
modify the standard algorithm as explained below. Also since binary search is tail recursive -

8/15/2019 Clickprints on Web- K@Wharton
http://slidepdf.com/reader/full/clickprints-on-web-kwharton 20/34
19
recursion occurs at the end of the procedure – we can write the algorithm with iterations (as we have
chosen to do here) instead of using an explicit recursive call.
2. We note that our focus in Section 4 was expositional clarity, and hence we grouped all actions on a
specific user’s sessions together (within the loop). However selecting sessions belonging to the same
user can clearly be done just once before the iterations begin. The revised search procedure shown in
Figure 6.1 incorporates this.
3. Since the search is now O(log2 N ) as opposed to O( N ), the algorithm terminates rapidly for even large
N . Hence we will not explicitly assume a user stopping criterion as an input and will allow the binary
search procedure to determine the smallest agg value, however high it is.
Given the intuition, we make one important comment regarding how strict the monotonicity assumption
needs to be. Our search is for the smallest level of aggregation at which unique clickprints exist. Assume
that this is twenty. If the sequence is not strictly monotonic, this only suggests that perhaps a lower
aggregation would suffice since we have already established twenty as a number for which highly
accurate classifiers can be built. In this case the exhaustive search procedure outlined in Section 4 can
now be used with this number (twenty) as the upper bound. Hence even when the assumption does not
always hold, the procedure can substantially reduce the alternatives to consider.
Figure 6.1 formally presents the algorithm. As before, D is the original data set consisting of
sessions from various users. Assume that k u represents the total number of sessions conducted by user u
and assume X i(u) refers to the i-th session of user u. Before the binary search loop, the preprocessing steps
extract the specific user sessions X i(u) from D since this can be done once outside the loop.
The sequence (different levels of aggregation) over which the search is done is (start , start +1,…,
end ). At the beginning of the procedure this sequence is initialized as follows. The start is initialized to
one since there may well exist signatures with no aggregation at all (i.e. at an agg = 1). If there are M
users, the maximum aggregation we consider is the lowest total number of sessions of some user. At this
(maximum) aggregation this user will have (only) one aggregated session and hence end is set to this
number initially.

8/15/2019 Clickprints on Web- K@Wharton
http://slidepdf.com/reader/full/clickprints-on-web-kwharton 21/34
20
Inputs:Data set D = { S1, S2, …, SN } of N sessions.Feature construction function F (S) returning a vector of features <v1, v2,…, vq,userid > where S is a set of sessions.Classification algorithm C and related model goodness criterion, goodness
Threshold goodness, A, at which the learned classifier is deemed to adequatelyclassify users.
Output: The minimum level of aggregation, agg
model_acc = 0Compute M as the number of unique userIDs in DFor u = 1 to M {
Select as X1(u), X2(u),…,Xku(u) all sessions belonging to user u in D
// note here that Xj(i) represents the j-th session of user i// since users have different numbers of sessions, ki represents// the total number of sessions conducted by user i
Sort X1(u), X2(u),…,Xku(u)chronologically such that the time that
session Xi(u) starts < time that session Xj(u) starts whenever i < j}
start = 1, end = min(k1, k2, …, kM)
while ( end ≥ start) {agg = int (start + end) / 2Dv = {}For u = 1 to M {
Let Sagg = {Xagg | Xagg is a set of agg consecutive sessions inX1(u), X2(u),…,Xku(u)}
Forall s ∈ Sagg
Dv = Dv ∪ F(s)}g = C(Dv) // g is the trained classifiermodel_acc = goodness (g)
if model_acc ≥ A then// so current model is very good, so search again in the first halfend = min (agg , end -1)
else // the current agg is inadequate, so search in the second halfstart = agg+1
endif}
if model_acc ≥ A thenreturn agg
elsereturn -1
endif
Figure 6.1. The algorithm for determining the smallest level of aggregation
Within the loop the current agg to consider is set repeatedly as the mid-point of the (start , end ) interval.
For a given agg if the model is sufficiently accurate it suggests that perhaps a lower agg may exist at
which we can still find accurate models. Hence end is now set at this current agg. Likewise, if for a given
agg the model is not good enough it suggests that a higher agg should be considered, and hence start is
set at agg + 1 before iterating.

8/15/2019 Clickprints on Web- K@Wharton
http://slidepdf.com/reader/full/clickprints-on-web-kwharton 22/34
21
Eventually this process will lead to start and end converging to the same value. In the next
iteration after this happens start will exceed end and the loop terminates. The loop can clearly terminate
in two cases. If an agg at which the model goodness is sufficiently high is found then this value is
returned. However if no such agg was found (in this case start and end both converge to the right extreme
value before termination) the procedure returns a negative number.
7. Results
In this section we report results from empirically estimating the minimum level of agg for several leading
online sites based on Web browsing data of 50,000 users over a period of one year.
7.1 Experimental setup: Selecting the inputs
Our approach uses five inputs: the data, the feature construction function, the classification algorithm,
model goodness, threshold goodness. Here we describe the choice of and rationale for the inputs.
The data: Ideally this analysis should be done on data directly gathered by the leading online retailers (i.e.
“site-centric” data, as we refer to these in Padmanabhan et al. (2001). However these are difficult to
obtain for practical reasons, and it has therefore been standard practice in empirical academic research on
Web usage to use panel data (i.e. “user-centric data”) for analysis. The data set that we used was provided
by a commercial data vendor comScore Networks3. The firm captures in detail the Web browsing history
of a panel of more than a million users worldwide. The data provided to us was the browsing behavior of
a sample of 50,000 users over one full year (2004). From this user-centric data set we construct site-
centric data sets by taking snapshots of each specific site using methods described in (Padmanabhan et al.
2006). For this paper we restricted our analysis to five popular online sites with the largest number of user
sessions in this data4
. Since our goal is not to make any comparisons of values across specific online
retailers we will refer to these sites in this paper anonymously as firm1, firm2,…, firm5.
3 It is important to note that all user IDs were anonymized. As noted in footnote 1, our predictive models onlyattempt to identify a user anonymously and the models here do not show that there is any revealing informationother than an anonymous user ID.4 These include Web portals and online retailers.

8/15/2019 Clickprints on Web- K@Wharton
http://slidepdf.com/reader/full/clickprints-on-web-kwharton 23/34
22
Rather than running the method on the entire data set for each firm, we create multiple data sets
by combining data from a specific number of users. This will enable us to (a) explicitly study the impact
of the number of users (b) use standard classifiers that may not scale with the size of the dependent
variable (a challenge we discuss in Section 7.3) and (c) deal with data sparsity in the panel data by
selecting those users for whom enough data is available
Specifically, for the five sites we create several sub-datasets by combining sessions belonging to
2, 5, 10, 15, 20, 25, 50 and 100 different users who visit these five sites often5. That is, for each such sub-
dataset the dependent variable, userID, may take eight (2, 5, 10, 15, 20, 25, 50 and 100) different values
respectively. Hence the choice of five sites and eight different values for number of users combined
results in 40 different sub-datasets. However since each such sub-dataset represents only one sample of a
chosen set of users we repeat the random selection process twenty times to essentially create 800 data
sets, each of which we apply our method to. The goal is to find the level of aggregation, agg, at which we
can build classifiers at a high level of accuracy for all these data sets. To better organize the results, the
agg values reported are grouped by firm and number of users, and hence the reported optimal agg values
in this section represent the values averaged over twenty different runs.
Finally, as noted at the end of Section 5, lemma 5.2.1 shows that aggregation may trivially
improve errors due to the class priors changing with aggregation. Hence we ensure that all aggregated
data sets have the same class priors as the original priors. For example, if user 1 has 200 sessions and user
2 has 300 sessions before aggregation, the ratio of priors is 2/3=0.67. If we aggregate 50 sessions
together, there will be 200 – 50 + 1=151 records for user 1 and 300-50+1=251 records for user 2. The
ratio is now 151/251=0.60. In order to maintain the original ratio of 0.67 we only select the first
151/0.67=225 records for user 2. The extension of this to multiple users is straightforward.
Feature construction: Rather than constructing a large set of complex variables, our focus was on
simplicity to test if unique clickprints exist even from some basic features. Hence we identified five
5 While creating these sub-datasets we only consider users who had a minimum of 100 sessions at each of these sitesin order to ensure there is enough data across which we can consider aggregations.

8/15/2019 Clickprints on Web- K@Wharton
http://slidepdf.com/reader/full/clickprints-on-web-kwharton 24/34
23
simple measures that can be estimated for any user session: (i) the duration (ii) number of pages viewed
(iii) avg. time spent per page (iv) the starting time (in seconds after 12.00am) and (v) the day of the week
the sessions begins. The first four measures are continuous while the fifth is categorical.
These five measures are for each session - but we require features to be constructed from groups
of sessions. The natural approach is to use these aggregations to estimate the distributions of these
measures. Hence rather than just taking averages, for any aggregation we compute the mean, median,
variance, maximum and minimum values for the four continuous measures giving us 5*4=20 specific
variables. Similarly for the categorical variable we compute its distribution by computing a histogram of
frequencies. Hence on any aggregation we derive seven variables corresponding to the fifth (day of the
week) measure, resulting in a total of 27 variables plus the categorical dependent variable (userid .)
The classifier, goodness and threshold: We chose weka’s J4.8 as the classifier since classification trees
in general have been shown to be highly accurate classifiers. The specific choice of J4.8 was for
convenience since weka is an open source data mining platform that also lends itself easily to automation
within scripts. We use stratified cross validation as the model goodness measure. Cross validation is in
general a robust approach to estimating model errors and it is particularly appropriate when data sets are
relatively small. In our case some of the data sets may be small due to aggregations that reduce the size of
the data and also due to selecting a specific number of users in these data sets. Empirically, Kohavi (1995)
showed in a large scale study using real data sets that ten fold stratified cross validation is a particularly
good approach to estimate model error. Finally the threshold goodness measure was chosen to be 90%
accuracy. To put this threshold value in perspective, at one extreme the two user datasets will have class
priors of approximately 50%, while at the other extreme the 100 user datasets will have class priors of
approximately 1% for each label.
7.2 Empirical estimation
Figure 7.1 presents one example of using our approach on a data set containing sessions mixed from ten
different users. The smallest number of sessions for any user was 102, so binary search first considers the
accuracy at agg=51 sessions. The accuracy at this level is greater than the 90% threshold, so the search

8/15/2019 Clickprints on Web- K@Wharton
http://slidepdf.com/reader/full/clickprints-on-web-kwharton 25/34
24
continues in the bottom half and moves to agg=26. This continues until agg=7 is considered. Since the
accuracy now falls below the threshold, the search continues in the upper half and moves higher now to
agg=10. Continuing the procedure in Figure 7.1 results in determining agg = 10 (specifically the
procedure ends when start = 10, end =9 and agg=10). Hence in this case while all ten users have hundreds
of sessions, aggregating just ten sessions results in building an accurate model.
Aggregation Accuracy
51 99.4253
26 98.2099
13 94.53
7 86.7488
10 91.8919
8 87.6389
9 89.5833
1 39.8925
Figure 7.1. An example of a single run
For reference the last entry in Figure 7.1 shows the accuracy when no aggregation is applied (agg=1).
Hence in this case a classifier built on the raw session data has an accuracy of 39.9% - which is still good
considering the class priors are all approximately 10%. This suggests that individual sessions do indeed
have some information to distinguish users, but aggregating these increases this ability substantially to a
point where we might consider unique clickprints to exist in the data.
As a final comment on this example, from figure 7.1 note that the accuracies are a strictly non-
decreasing function of the level of aggregation – i.e. the monotonicity assumption holds for these levels of
aggregations considered. Across a total of 5329 total aggregations considered in all our runs, there were
129 cases where model accuracies did not exhibit this behavior.
# of users Agg:firm1 Agg:firm2 Agg:firm3 Agg:firm4 Agg:firm5
2 3.45 3.25 4.65 3.6 3.55
5 6.9 7.05 6.55 6.35 7.3
10 9.75 10.2 9.45 10.2 9.9
15 11.3 11.3 10.75 11.2 11.15
20 13.4 12.4 12.15 12.75 13.5
25 13.55 14.15 13.2 13.4 14.15
50 15.4 15.9 14.8 16 16.25
100 19.9 20.45 17.8 19.6 20.65
Note: The avg. accuracy without any aggregation across all runs was 35.4%
Figure 7.2. The optimal levels of aggregation averaged over 20 runs

8/15/2019 Clickprints on Web- K@Wharton
http://slidepdf.com/reader/full/clickprints-on-web-kwharton 26/34
25
Figure 7.2 presents the summary of results for all five firms. Each row represents data sets generated by
combining user sessions for a fixed number of users. The agg value in each cell is the minimum number
of sessions to aggregate before highly accurate classifiers are generated. The reported value here is a
decimal since it is the average value across 20 runs (where in each run a different set of users is randomly
selected to create the data set).
The optimal number of sessions to aggregate ranges from 3 to 20 user sessions for the range of
users considered. Given the low priors for the class labels in the larger user data sets this is an important
result that suggests that unique clickprints may indeed exist in Web clickstream data, given that classifiers
are able to uniquely distinguish users at these levels of aggregation. In contrast, the average accuracy
without aggregation was only 35.4%. As previously noted, we use a very basic set of features in this
study. Online retailers capture orders of magnitude more information on each user session. Having such
additional information may help in building accurate models at possibly lower levels of aggregation.
In general the greater the number of users we wish to distinguish, the more the aggregation
required. One explanation for this is the following. We start with some basic informative features and
aggregation is used to estimate the distributions of these features. The classifier then uses these estimated
distributions to compute its own function to identify users. The larger the number of users, the more
precise these distributions need to be in order to distinguish all the users and hence greater data (# of
sessions) is required.
0
5
10
15
20
25
0 20 40 60 80 100 120
# of users
O p t i m a l a g g
Figure 7.3. The optimal levels of aggregation for different # of users

8/15/2019 Clickprints on Web- K@Wharton
http://slidepdf.com/reader/full/clickprints-on-web-kwharton 27/34
26
As Figure 7.3 shows (here the Y axis value is averaged across all firms), the optimal aggregation
necessary does not increase linearly with the number of users (the data show a good logarithmic fit),
which is an important scalability result. One explanation for this is that after a certain amount of data the
distributions are calibrated well enough that additional data may not necessarily change the feature values
significantly.
Figure 7.2 also shows that for each row the optimal aggregation required is remarkably similar for
all the five firms, suggesting that the clickprints could be fundamental browsing behavior that may well
be independent of the actual contents seen. However this is a hypothesis that needs to be examined in
detail in future research.
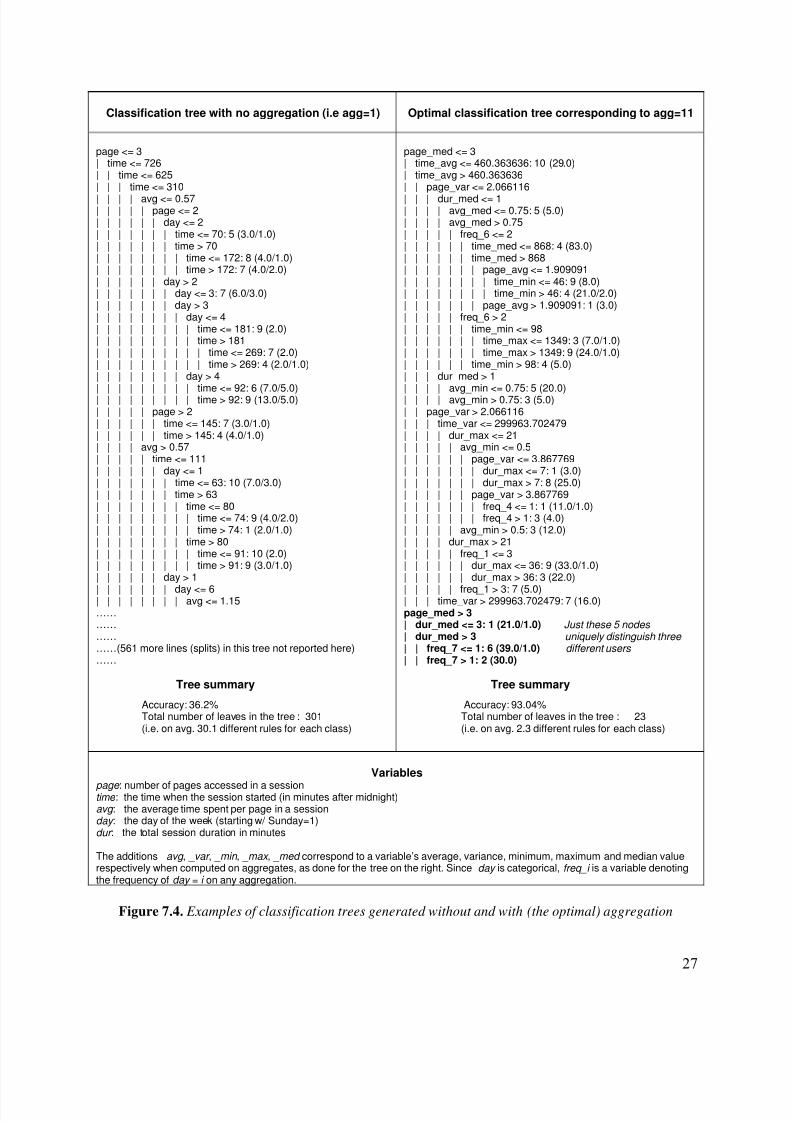
In Figure 7.4 we present the actual classification trees corresponding to no aggregation and the
optimal aggregation for a run with ten different users mixed in. First, as the tree summaries at the bottom
of the figure show, the accuracy with the optimal aggregation is significantly higher (93% vs. 36%). The
class priors are approximately 10%, so as noted previously even the model with no aggregation is able to
extract valuable structure from the basic five variables in each single session alone. However aggregation
substantially helps.
Second, the tree with the optimal aggregation is remarkably compact (23 leaves, compared to 301
leaves for the other case) and this makes it easier to manually examine in the search for valuable
qualitative insights into what the clickprints really are. For instance, consider the last five nodes of the
optimal tree (in bold in the figure). Before interpreting the clickprints revealed here, we explain the terms
that occur in that segment: (a) since here eleven sessions are aggregated, the variable page_med is
interpreted as the median number of pages in eleven consecutive sessions of any user. Similarly dur_med
is the median session duration (total time) and freq_7 is the number of Saturdays (day=7) in any group of
eleven sessions. (b) The text associated with the leaf, say “1 (21.0/1.0)” is read as follows. The prediction
made in this leaf is “user # 1”, there are 21.0 total records that fall into this leaf, 1.0 of which are
incorrectly classified as user 1. Hence in this leaf, the accuracy of a user 1 prediction is 20/21.
8/15/2019 Clickprints on Web- K@Wharton
http://slidepdf.com/reader/full/clickprints-on-web-kwharton 28/34
27
Classification tree with no aggregation (i.e agg=1) Optimal classification tree corresponding to agg=11
page <= 3| time <= 726| | time <= 625| | | time <= 310
| | | | avg <= 0.57| | | | | page <= 2| | | | | | day <= 2| | | | | | | time <= 70: 5 (3.0/1.0)| | | | | | | time > 70| | | | | | | | time <= 172: 8 (4.0/1.0)| | | | | | | | time > 172: 7 (4.0/2.0)| | | | | | day > 2| | | | | | | day <= 3: 7 (6.0/3.0)| | | | | | | day > 3| | | | | | | | day <= 4| | | | | | | | | time <= 181: 9 (2.0)| | | | | | | | | time > 181| | | | | | | | | | time <= 269: 7 (2.0)| | | | | | | | | | time > 269: 4 (2.0/1.0)| | | | | | | | day > 4
| | | | | | | | | time <= 92: 6 (7.0/5.0)| | | | | | | | | time > 92: 9 (13.0/5.0)| | | | | page > 2| | | | | | time <= 145: 7 (3.0/1.0)| | | | | | time > 145: 4 (4.0/1.0)| | | | avg > 0.57| | | | | time <= 111| | | | | | day <= 1| | | | | | | time <= 63: 10 (7.0/3.0)| | | | | | | time > 63| | | | | | | | time <= 80| | | | | | | | | time <= 74: 9 (4.0/2.0)| | | | | | | | | time > 74: 1 (2.0/1.0)| | | | | | | | time > 80| | | | | | | | | time <= 91: 10 (2.0)| | | | | | | | | time > 91: 9 (3.0/1.0)| | | | | | day > 1
| | | | | | | day <= 6| | | | | | | | avg <= 1.15……………………(561 more lines (splits) in this tree not reported here)……
Tree summary
Accuracy: 36.2%Total number of leaves in the tree : 301(i.e. on avg. 30.1 different rules for each class)
page_med <= 3| time_avg <= 460.363636: 10 (29.0)| time_avg > 460.363636| | page_var <= 2.066116
| | | dur_med <= 1| | | | avg_med <= 0.75: 5 (5.0)| | | | avg_med > 0.75| | | | | freq_6 <= 2| | | | | | time_med <= 868: 4 (83.0)| | | | | | time_med > 868| | | | | | | page_avg <= 1.909091| | | | | | | | time_min <= 46: 9 (8.0)| | | | | | | | time_min > 46: 4 (21.0/2.0)| | | | | | | page_avg > 1.909091: 1 (3.0)| | | | | freq_6 > 2| | | | | | time_min <= 98| | | | | | | time_max <= 1349: 3 (7.0/1.0)| | | | | | | time_max > 1349: 9 (24.0/1.0)| | | | | | time_min > 98: 4 (5.0)| | | dur_med > 1
| | | | avg_min <= 0.75: 5 (20.0)| | | | avg_min > 0.75: 3 (5.0)| | page_var > 2.066116| | | time_var <= 299963.702479| | | | dur_max <= 21| | | | | avg_min <= 0.5| | | | | | page_var <= 3.867769| | | | | | | dur_max <= 7: 1 (3.0)| | | | | | | dur_max > 7: 8 (25.0)| | | | | | page_var > 3.867769| | | | | | | freq_4 <= 1: 1 (11.0/1.0)| | | | | | | freq_4 > 1: 3 (4.0)| | | | | avg_min > 0.5: 3 (12.0)| | | | dur_max > 21| | | | | freq_1 <= 3| | | | | | dur_max <= 36: 9 (33.0/1.0)| | | | | | dur_max > 36: 3 (22.0)
| | | | | freq_1 > 3: 7 (5.0)| | | time_var > 299963.702479: 7 (16.0)page_med > 3| dur_med <= 3: 1 (21.0/1.0) Just these 5 nodes | dur_med > 3 uniquely distinguish three | | freq_7 <= 1: 6 (39.0/1.0) different users | | freq_7 > 1: 2 (30.0)
Tree summary
Accuracy: 93.04%Total number of leaves in the tree : 23(i.e. on avg. 2.3 different rules for each class)
Variables
page : number of pages accessed in a sessiontime : the time when the session started (in minutes after midnight)avg : the average time spent per page in a sessionday : the day of the week (starting w/ Sunday=1)dur : the total session duration in minutes
The additions _ avg , _ var , _ min , _ max , _ med correspond to a variable’s average, variance, minimum, maximum and median valuerespectively when computed on aggregates, as done for the tree on the right. Since day is categorical, freq_i is a variable denotingthe frequency of day = i on any aggregation.
Figure 7.4. Examples of classification trees generated without and with (the optimal) aggregation

8/15/2019 Clickprints on Web- K@Wharton
http://slidepdf.com/reader/full/clickprints-on-web-kwharton 29/34
28
A qualitative interpretation is as follows. Users 1, 2 and 6 typically access more pages in a session
corresponding to the other 7 users who do not appear in the bottom half of the tree. Among these three
users now, user 1 appears to have shorter sessions (median duration less than 3 minutes) while the other
two typically spend longer time and this alone isolates user 1’s records cleanly. Between the other two
users it appears that user 2 rarely visits on Saturdays, a characteristic that seems adequate for separation.
As a final note, we wish to emphasize that our approach is one that can be used to compute the
optimal aggregation required given a specific data set that an online retailer collects. We do not claim
specific numbers as contributions other than using these numbers (a) to show how our method works (b)
to claim that there is evidence that unique clickprints may indeed exist in Web browsing data and (c) to
perhaps provide an approximate estimate of the amount of data needed. In addition to the development of
the problem and the solution methods, these are important empirical findings that have not been described
before in any prior research.
A motivation for our research was online fraud. While specific implementations of verification are
beyond the scope of this paper we describe how this may be done based on the results here. An online
retailer can apply this procedure either directly on their data or on selected subsets of their data to first
determine the level of aggregation at which highly accurate classifiers can be built. Assume this is six
sessions. A classifier is then built at this level of aggregation that takes as input features constructed from
six sessions. Assume a specific user now completes an online session and presents all information
including payment information. For this specific user, the previous five sessions (the optimal agg, six,
minus one) are retrieved. The current session is assumed to be the sixth session and the set of features for
the classifier are created from these six sessions. If the identity revealed matches the classifiers output
then this is likely to be a genuine transaction. If there is divergence a fraud alert may be triggered.
7.3 Limitations and challenges
Some important limitations and related challenges remain, and the approach and results presented in this
paper should therefore be viewed as only the first step in the process of seeking a conclusive answer to
the existential question. Here we discuss three specific issues that will need to be addressed in the future.

8/15/2019 Clickprints on Web- K@Wharton
http://slidepdf.com/reader/full/clickprints-on-web-kwharton 30/34
29
First, building accurate classifiers when the class label takes on millions of values (compared to
hundreds) is generally known to be hard and this is the main challenge that will need to be addressed in
future research. There is no guarantee in such cases that we will get a specific level of aggregation at
which signatures exist. The problem in such cases is that the class priors may all be infinitesimally small
and the heuristics used to build these classifiers may no longer work well. However in support of the
approach and results presented here we note that:
Previous academic research in signature detection has also restricted empirical analyses to tens or
hundreds of users, similar to what was done here.
Second, our approach may be modified a little, at a cost, to address this issue directly. Specifically,
rather than working on a data set where the label takes millions of values, the approach can be used to
build a classifier for each user. Here for each user we can construct a data set where the class label is
now binary (this user or “anyone else”) and traditional classifiers can be built. The output of our
approach then will be a level of aggregation that is required for each user to distinguish this user from
anyone else. In this case though, millions of classifiers need to be built. However this is a
significantly simpler problem given the large scale computing technology available today.
There are indeed other approaches that may be investigated for this too, such as reducing the size of the
problem by clustering the original set of users into a more manageable number of segments before
applying this procedure to distinguish between segments instead of users. In such cases we might even
iteratively break segments down in this manner to ultimately predict individual users. This is similar in
spirit to the idea of multi-stage classification in machine learning.
A second challenge is determining the C and F to use. Our approach was presented as one that
works given any specific choice of these. However in practice online retailers will need guidance on how
to optimally select these. The classifier is relatively a simpler issue since there are a finite number of
classifiers that exist and more than one can well be tried. Determining the optimal set of features to
generate is harder. In this paper we presented some guidelines on how to do this. Specifically suggesting
that session-level features can first be identified, and then aggregations can be used to estimate various

8/15/2019 Clickprints on Web- K@Wharton
http://slidepdf.com/reader/full/clickprints-on-web-kwharton 31/34
30
statistical measures of these features. However identifying good session-level features is important. Here
we took an approach of making this as simplistic a set as possible, to test if unique clickprints exist even
for these very basic features. In practice online retailers may need to go with a much larger feature set
based on the extensive information that they track and to then use feature selection techniques to reduce
this set before building classifiers.
Third, our approach cannot easily be used to qualitatively describe what a user signature is. To an
extent, if the main objective is to identify users then this does not matter since the classifiers achieve this
purpose. But if there is a requirement that individual signatures are understandable then other methods
may need to be used. In our approach the signatures are implicit in the classifiers built and standard
methods for “opening up” these classifiers may need to be used, and these vary based on the classifier.
8. Conclusions
In this paper we addressed a fundamental and new problem – the identification of unique clickprints in
Web browsing data. We showed how this problem can be cast as an aggregation problem, and then
presented two methods that can be used to determine the optimal level of aggregation at which highly
accurate user predictions can be made. If such an optimal aggregation can be found then it follows that
the classifier making the predictions can uniquely identify individuals when given such data, and unique
clickprints therefore do exist. We then applied our method on real Web browsing data generated for five
leading online firms and showed that in all cases considered unique clickprints did exist given the optimal
level of aggregation was computed by our method. We discussed how our approach can be used in online
fraud detection, a critical problem for the Internet economy.
The approach presented in this paper is only a first step, although an important one, in answering the
existential question in a conclusive manner. Important challenges remain, that need to be studied in future
work. However this paper has developed the salient idea and methods that can be built on.
The specific contributions of this paper are:

8/15/2019 Clickprints on Web- K@Wharton
http://slidepdf.com/reader/full/clickprints-on-web-kwharton 32/34
31
Presented a novel and important problem regarding determining unique clickprints online and
discussed specific formulations.
Showed how this problem can be cast as an aggregation problem.
Presented formal methods to address the problem.
Presented empirical results from Web browsing data showing that unique clickprints may exist.
Reference
Adomavicius, G., A.Tuzhilin. 2001. Using Data Mining Methods to Build Customer Profiles. IEEE
Computer, vol. 34, no. 2.
Aggarwal, C., Z. Sun, P.S. Yu. 1998. Online generation of profile association rules. In Proc. of the Fourth
Int'l Conference on Knowledge Discovery and Data Mining, August 1998.
Cooley, R., B. Mobasher, J. Srivastava. 1999. Data Preparation for Mining World Wide Web Browsing
Patterns. Knowl. Inf. Syst. 1(1): 5-32.
Cortes, C., Pregibon, D. 2001. Signature-Based Methods for Data Streams. Data Min. Knowl. Discov. 5,
3, 167-182.
Ellis, D.R., J.Aiken, K.S.Attwood, S.D.Tenaglia. 2004. A behavioral approach to worm detection. In
Proceedings of the ACM WORM '04. ACM Press, New York, NY, 43-53.
Everitt, R. A., P.W.McOwan. 2003. Java-Based Internet Biometric Authentication System. IEEE Trans.
Pattern Anal. Mach. Intell. 25, 9 (Sep. 2003), 1166-1172.
Fawcett, T., F. Provost. 1996. Combining Data Mining and Machine Learning for Effective User
Profiling. KDD 1996 : 8-13
Goecks, J., J. Shavlik. 2000. Learning users' interests by unobtrusively observing their normal behavior.
In Proceedings of IUI 2000. ACM Press, New York, NY, 129-132.

8/15/2019 Clickprints on Web- K@Wharton
http://slidepdf.com/reader/full/clickprints-on-web-kwharton 33/34
32
Hui, Sam K, Fader, Peter and Bradlow, Eric. 2006. Path Data in Marketing: An Integrative Framework
and Prospectus for Model-Building (September 2006). Available at SSRN:
http://ssrn.com/abstract=930141
Igarashi, K, C. Miyajima, C, K.Itou, K.Takeda, F.Itakura, H.Abut. 2004. Biometric identification using
driving behavioral signals. In Procs. of. ICME '04. pp. 65- 68, June 2004
Kohavi, R. 1995. A Study of Cross-Validation and Bootstrap for Accuracy Estimation and Model
Selection. In Proceedings of IJCAI-95.
Kosala, R., H. Blockeel. 2000. Web mining research: a survey. SIGKDD Explorations, 2, 1, pp/ 1-15.
Lee, W., S.J.Stolfo, K.W.Mok. 1999. A data mining framework for building intrusion detection models.
In Procs. IEEE Symposium on Security and Privacy, pp.120-132.
Li, J., Zheng, R., Chen, H. 2006. From fingerprint to writeprint. Commun. ACM 49, 4 (Apr. 2006), 76-82
Madigan, D., A. Genkin, D. D. Lewis, S. Argamon, D. Fradkin, and Li Ye. 2005. Author Identification on
the Large Scale. In Procs. CSNA 2005
Mäntyjärvi, J., M.Lindholm, E.Vildjiounaite, S.Mäkelä, H.Ailisto. 2005. Identifying Users of Portable
Devices from Gait Pattern with Accelerometers. In IEEE International Conference on Acoustics,
Speech, and Signal Processing, 2005.
Miller, B. 1994. Vital signs of identity. IEEE Spectr. 31, 2 (Feb. 1994), 22-30.
Mischel,W., Y.Shoda. 1995. A cognitive-affective system theory of personality: Reconceptualizing
situations, dispositions, dynamics, and invariance in personality structure. Psych. Rev., 102, 246-268.
Mobasher, B., Dai, H., Luo, T., Nakagawa, M. 2002. Discovery and Evaluation of Aggregate Usage
Profiles for Web Personalization. Data Min. Knowl. Discov. 6, 1 (Jan. 2002), 61-82.
Monrose, F., A.Rubin. 1997. Authentication via keystroke dynamics, Proceedings of the 4th ACM
conference on Computer and communications security, p.48-56, April 01-04, 1997, Zurich,
Switzerland
8/15/2019 Clickprints on Web- K@Wharton
http://slidepdf.com/reader/full/clickprints-on-web-kwharton 34/34
Padmanabhan, B., Z. Zheng, S. Kimbrough. 2001. Personalization from Incomplete Data: What You
Don’t Know Can Hurt. Procs. KDD 2001, pp. 154-164.
Padmanabhan, B., Z. Zheng, S. Kimbrough. 2006. An Empirical Analysis of the Value of Complete
Information for eCRM Models. MIS Quarterly, 30(2), pp. 247-267.
Srivastava, J., R. Cooley, M. Deshpande, P-T. Tan. 2000. Web Usage Mining: Discovery and
Applications of Usage Patterns from Web Data. In SIGKDD Explorations, (1) 2, 2000.
Yang, Y., B.Padmanabhan. 2005. GHIC: A Hierarchical Pattern Based Clustering Algorithm for
Grouping Web Transactions. In IEEE TKDE 17(9), pp.1300-1304, 2005.
Zheng, Z., B. Padmanabhan, S. Kimbrough. 2003. On the Existence and Significance of Data
Preprocessing Biases in Web Usage Mining. INFORMS J. on Computing, 15(2), pp.148-170, 2003.