climate action plan advisory group (capag) final report...the climate action plan advisory group...
TRANSCRIPT
Recommended Mitigation Options forControlling Greenhouse Gas Emissions
Climate Action Plan Advisory Group(CAPAG)
North Carolina
Final Report October 2008

[This page is intentionally left blank]
Table of Contents Preface ..................................................................................................................................................................................................................... ii Acknowledgments ........................................................................................................................................................................................ iii Members of the Climate Action Plan Advisory Group .................................................................................................... iv Acronyms ............................................................................................................................................................................................................. vi Executive Summary .................................................................................................................. EX-1 Chapter 1 – Background and Overview .................................................................................................................................... 1-1 Chapter 2 – Inventory and Projections of GHG Emissions ...................................................................................... 2-1 Chapter 3 – Residential, Commercial, and Industrial Sectors ................................................................................ 3-1 Chapter 4 – Energy Supply ................................................................................................................................................................. 4-1 Chapter 5 – Transportation and Land Use............................................................................................................................... 5-1 Chapter 6 – Agriculture, Forestry, and Waste Management .................................................................................... 6-1 Chapter 7 – Cross-Cutting Issues ................................................................................................................................................... 7-1 Appendixes A. Description of CAPAG Process ............................................................................................................................................ A-1 B. Members of Technical Work Groups ................................................................................................................................ B-1 C. GHG Emissions Inventory and Reference Case Projections .......................................................................... C-1 D. Methods for Quantification ....................................................................................................................................................... D-1 E. Residential, Commercial, and Industrial Sectors – Mitigation Option Recommendations .... E-1 F. Energy Supply – Mitigation Option Recommendations ..................................................................................... F-1 G. Transportation and Land Use – Mitigation Option Recommendations .................................................. G-1 H. Agriculture, Forestry, and Waste Management – Mitigation Option Recommendations ........ H-1 I. Cross-Cutting Issues – Mitigation Option Recommendations ........................................................................ I-1 J. Catalogs of State Climate Mitigation Options ........................................................................ J-1 K. References ............................................................................................................................. K-1
Preface
This report contains recommendations from a voluntary stakeholder advisory group on potential measures to reduce greenhouse gas (GHG) emissions that are worthy of consideration by policy makers in North Carolina. This advisory group represents a broad range of interests in North Carolina. The Climate Action Plan Advisory Group (CAPAG) consists of more than 40 volunteers from business, industry, environmental groups, academia, government and the general public. A consultant, the Center for Climate Strategies (CCS), provided facilitation and technical analysis expertise. From over 300 potential GHG mitigation options, more than 50 were analyzed considering likely GHG reductions, costs and benefits.
The North Carolina General Assembly created a Legislative Commission on Global Climate Change (LCGCC) in the fall of 2005 to address climate related issues. These issues included whether North Carolina should set a goal for reduction of GHGs in this state, and if so, what that goal should be. CAPAG coordinated closely with the LCGCC and shared several members with that Commission.
This report is not intended to be a climate action implementation plan for North Carolina. Such a plan will come only after State policy makers assess these and other recommendations further. However the data, results and recommendations contained in this report provide valuable guidance for the creation of an action plan(s) for legislative, administrative, regulatory or voluntary action.
The Appalachian State University (ASU) Energy Center and CCS and their team of analysts worked together to conduct a secondary economic impact analysis of the potential economic and jobs impacts of various options developed by the CAPAG. The ASU Energy Center examined thirty of the fifty-six mitigation options bundled into twenty- three mitigation option scenarios with similar policies grouped together for analysis. Combined, these options account for more than 90% of the GHG emissions reductions and offsets identified by the CAPAG.
For the study, the ASU Energy Center utilized the NC Energy Scenario Economic Impact Model (NC ESEIM). Originally developed in 2005 for the North Carolina Energy Policy Council, the peer-reviewed model assesses the impacts of various energy policies on the North Carolina economy, measured in terms of employment, employee and proprietor compensation (income), and the incomes earned by labor and capital (gross state product). The results and discussion of the secondary economic impact analysis are summarized in Chapter 1 of the CAPAG report. The results and the report methodology are discussed in detail in a separate report entitled, “Secondary Economic Impact Analysis of Greenhouse Gas Mitigation Options for North Carolina” available at “http://www.ncclimatechange.us” or “http://daq.state.nc.us/monitor/eminv/gcc."
ii
iii
Acknowledgments
The North Carolina Climate Action Plan Advisory Group (CAPAG) gratefully acknowledges the following individuals and organizations who contributed significantly to the successful completion of the CAPAG process and the publication of this Final Report:
Thomas D. Peterson and the Center for Climate Strategies (CCS), with its dedicated team of professionals who contributed extraordinary amounts of time, energy, and expertise in providing facilitation services and technical analysis for the CAPAG process. Special thanks to June Taylor, Laurie Cullen, and Randy Strait who coordinated and edited the Final Report, and to other CCS team members:
Alison Bailie Kenneth Colburn Bill Dougherty Karl Hausker Sivan Kartha
Lewison Lem Stephen Roe Will Schroeer David Von Hippel Dan Wei
Special thanks also go to Brock Nicholson and James Southerland of the North Carolina (NC) Department of Environment and Natural Resources’ (DENR) Division of Air Quality (DAQ) who coordinated and supervised all activities associated with the CAPAG process on behalf of DENR/DAQ. Many thanks also to DENR staff Charles Davis, Kimberly Garnett, Heather Hawkins, and Phyllis Jones who also contributed their time, energy, and expertise as DENR/DAQ’s liaisons to the Technical Work Groups.
The CAPAG also recognizes the many individuals who participated in the sector-based Technical Work Groups, all of whom are listed in Appendix B. Even though this report is intended to represent the results of the CAPAG’s work, the group would be remiss if it did not recognize and express appreciation for the time and efforts spent in discussion, study, and deliberation of each fellow member of the group.
Finally, the CAPAG would like to thank the donor organizations that provided the financial support to CCS that allowed it to serve the CAPAG: NC DENR, Energy Foundation, Rockefeller Brothers Fund, Surdna Foundation, and Z. Smith Reynolds Foundation.

iv
Members of the North Carolina Climate Action Plan Advisory Group1
Stan Adams, NC DENR, Division of Forestry Resources (now retired, but active) Dan Besse, Winston-Salem City Council Ryan Boyles, State Climatologist, NC Climate Office (original member was Sethu Raman, now
retired) Thomas F. Cecich, Environmental Management Commission Caroline Choi, Progress Energy (Vicky Will, original Progress Energy member) Jerry Coker, Weyerhaeuser Marion Deerhake, Environmental Management Commission Dolores M. Eggers, Professor, UNC Asheville Roy Ericson, NC Utilities Commission George Everett, Duke Energy George Givens, Principal Legislative Analyst, Attorney at Law, General Assembly of North
Carolina, Council to the Environmental Review Commission of the General Assembly of North Carolina and the Legislative Commission on Global Climate Change
Dennis Grady, Appalachian State University Steve Halstead, NC Council of Churches Bob Hazel, Senior Citizens’ Interest Dennis Hazel, NCSU, Forestry Extension Alex Hobbs, NCSU Solar Center Bill Holman, Clean Water Management Trust Fund, then Duke University, Nicholas Institute for
Environmental Policy Solutions Preston Howard, Manufacturer Chemical Industry Council Gary Hunt, NC DENR Division of Pollution Prevention and Sustainability Robert Jackson, Duke University, Nicholas School of the Environment and Earth Sciences Robert Koger, Advanced Energy Carolyn McCormick, Outer Banks Visitors Bureau Steven McNulty, USDA Forest Service, Southern Global Change Program Maximilian Merrill, NC Department of Agriculture and Consumer Services Marily Nixon, Southern Environmental Law Center Chuck Pickering, Biltmore Estate Simon Rich, Energy Industry & Duke University Lisa Riegel, NC Natural Heritage Trust Fund Roger Sheats, Global Warming Initiatives Paul Sherman, NC Farm Bureau (replaced Mitch Peele)
1 Note: A limited number of members of the CAPAG were members in the beginning, but due to job changes, etc., were later replaced by others representing the same company. Their participation and contributions are acknowledged and appreciated even though they were not on the Group for its full existence.
v
Larry Shirley, State Energy Office, NC Department of Administration Michael Shore, Environmental Defense Bob Slocum, North Carolina Forestry Association Libby Smith, NC Department of Commerce Stephen Smith, Southern Alliance for Clean Energy Jim Stephenson, NC Coastal Federation Nina S. Szlosberg, NC Board of Transportation Tim Toben, Carolina Green Energy Ivan Urlaub, NC Sustainable Energy Association Kraig Westerbeek, Murphy-Brown Farms Stephen Whitfield, NC Woodlands Jim Witkowski, International Paper (replaced Edward Kruel) Skip Yeakel, Volvo Trucks North America
Acronyms
AC alternating current ACEEE American Council for an Energy-Efficient Economy AEO Annual Energy Outlook AFW Agriculture, Forestry, and Waste Management [TWG] AG Attorney General AIA American Institute of Architects AQ air quality ASAP Appliance Standards Awareness Project ASHRAE American Society of Heating, Refrigerating and Air-Conditioning Engineers ASU Appalachian State University ASUEC Appalachian State University Energy Center AVL automatic vehicle location B20 blend of 20% biodiesel and 80% petroleum diesel BACT Best Available Control Technology BAU business as usual [assuming no major changes to reduce greenhouse gases] BCAP Building Code Assistance Project BenMAP Environmental Benefits Mapping and Analysis Program Btu British thermal unit C&D construction and demolition c/kWh cents per kilowatt hour CALS College of Agriculture and Life Sciences [NCSU] CAPAG [North Carolina] Climate Action Plan Advisory Group CARB California Air Resources Board CBECS Commercial Buildings Energy Consumption Survey CC Cross-Cutting Issues [TWG] CCS Center for Climate Strategies CCSR carbon capture and storage/sequestration or reuse CCV closed crankcase ventilation [on buses and trucks] CDG customer-operated distributed generation CEFS Center for Environmental Farming Systems [North Carolina Department of
Agriculture and Consumer Services] CERT Community Emergency Response Team CH4 methane CHP combined heat and power CNG compressed natural gas CNR College of Natural Resources [NCSU]
vi

CO carbon monoxide CO2 carbon dioxide CO2e carbon dioxide equivalent COBRA Co-benefits Risk Assessment [Model] COG Council of Governments CPCN Certificate of Public Convenience and Necessity CREP Conservation Reserve Enhancement Program [USDA] CRP Conservation Reserve Program [USDA] CS Cambridge Systematics, Inc. CSA Clean Smokestacks Act [of 2002] CTIC Conservation Technology Information Center DAQ [North Carolina] Division of Air Quality DC direct current DCM [North Carolina] Division of Coastal Management DENR [North Carolina] Department of Environment and Natural Resources DG distributed generation DMV [NCDOT] Division of Motor Vehicles DOA [North Carolina] Department of Administration DOC diesel oxidation catalyst DOR [North Carolina] Department of Revenue DPF diesel particulate filter [for buses and trucks] DPI Department of Public Instruction DPPEA [North Carolina] Division of Pollution Prevention and Environmental
Assistance DSM demand-side management DVD digital versatile disc [formerly digital video disc] E10 blend of 10% ethanol and 90% gasoline E85 blend of 85% ethanol and 15% gasoline EE energy efficiency EEM Energy Efficient Mortgage [Initiative] EF emission factor EIA Energy Information Administration [US DOE] EMC Environmental Management Commission EPRI Electric Power Research Institute EPS environmental portfolio standard EQIP Environmental Quality Incentives Program [USDA] ERC Environmental Review Commission ES Energy Supply [TWG]
vii
ESEIM Energy Scenario Economic Impact Model ESI Environmental Stewardship Initiative EV electric vehicle FDP [North Carolina] Forest Development Program FERC Federal Energy Regulatory Commission FFV flexible-fuel vehicle FIA Forest Inventory Analysis FPP Farm Preservation Program FSA Farm Service Agency [USDA] FTA Federal Transportation Administration FY fiscal year GHG greenhouse gas GIS geographic information system GMAC General Motors Acceptance Corporation GPS global positioning systems GREET Greenhouse Gases, Regulated Emissions, and Energy Use in Transportation
[Model] GWh gigawatt-hours GWP global warming potential HB House Bill HBH HealthyBuilt Homes [Program] HC hydrocarbon HDV heavy-duty vehicle HFC hydrofluorocarbon HVAC heating, ventilation, and air conditioning HWP harvested wood products I&F Inventory and Forecast IAQ indoor air quality IEBC International Existing Building Code IECC International Energy Conservation Code IES Industrial Extension Service IGA investment grade audit IGCC integrated gasification combined cycle IPCC Intergovernmental Panel on Climate Change IR/E idle reduction/elimination IRS Internal Revenue Service IT information technology kWh kilowatts per hour
viii
LCGCC [North Carolina] Legislative Commission on Global Climate Change LCID land clearing and inert debris [landfills] LDV light-duty vehicle LEED Leadership in Energy and Environmental Design LEED-H Leadership in Energy and Environmental Design for Homes LFG landfill gas LFGTE landfill gas to energy [sometimes LFGE] LIREP Low-Income Residential Energy Program LMOP Landfill Methane Outreach Program LPG liquefied petroleum gas MH manufactured home MMBtu million British thermal units MMt million metric tons MMtC million metric tons of carbon MMtCO2e million metric tons of carbon dioxide equivalent MST municipal sewage treatment MSW municipal solid waste MW megawatt N2O nitrous oxide NASA National Aeronautics and Space Administration NC North Carolina NCA&T North Carolina Agricultural & Technical State University NCCES North Carolina Cooperative Extension Service NCDA&CS North Carolina Department of Agriculture and Consumer Services NCDFR North Carolina [DENR] Division of Forest Resources NCDOT North Carolina Department of Transportation NCGP North Carolina GreenPower NCHFA North Carolina Housing Finance Agency NCSC North Carolina Solar Center NCSTEP North Carolina Small Town Economic Development NCSU North Carolina State University NCUC North Carolina Utilities Commission NEED National Energy Education Development [Project] NEMA National Electrical Manufacturers Association NEMS National Energy Modeling System NESCAUM Northeast States for Coordinated Air Use Management NG natural gas NOx nitrogen oxides
ix
NPV net present value NRCS Natural Resource Conservation Service [USDA] NREL National Renewable Energy Laboratory [US DOE] O&M operations and maintenance PAYD Pay-As-You-Drive PBF Public Benefits Fund PC performance-based contracting PEM polymer electrolytic membrane [fuel cells] PFC perfluorocarbon PHA Public Housing Authority PIRG Public Research Interest Group PM particulate matter PSCNC Public Service Company North Carolina PTD Public Transportation Division [NCDOT] PV photovoltaic R&D research and development RCI Residential, Commercial, and Industrial [TWG] RDU Raleigh-Durham [Airport] REC renewable energy credits RESNET Residential Energy Services Network RFF Resources for the Future RFP request for proposals RFS renewable fuel standard ROI return on investment RPS renewable portfolio standard RTD Regional Transportation District [bus rapid transit] RTI Research Triangle Institute SB Senate Bill SEO State Energy Office SEP State Energy Plan SEQL Sustainable Environment for Quality of Life SERC Southeastern Electric Reliability Council SF6 sulfur hexafluoride SIT State Greenhouse Gas Inventory Tool [US EPA] SM service mark (similar to a trademark) SMEs small and medium enterprises SO2 sulfur dioxide SOV single-occupancy vehicle
x
xi
SUV sport utility vehicle SWCD [North Carolina] Soil and Water Conservation District SWH solar water heating t metric ton (1,000 kg or 2,205 lb.) T&D transmission and distribution TCR The Climate Registry TDM Transportation Demand Management [Program] TLU Transportation and Land Use [TWG] TMO Transportation Management Organization TRC total resource cost TSE truck stop electrification TWG Technical Work Group UNC University of North Carolina UNCA University of North Carolina-Asheville UNCG University of North Carolina-Greensboro UPS uninterruptible power supply US DOE U.S. Department of Energy US EPA U.S. Environmental Protection Agency USDA U.S. Department of Agriculture USFS U.S. Forest Service USI Utility Savings Initiative VAC volts alternating current VMT vehicle miles traveled WARM WAste Reduction Model [US EPA] WHIP Wildlife Habitat Incentives Program [USDA] WRP Waste Reduction Partners ZEH Zero Energy Home
Executive Summary
Introduction
In 2002, the North Carolina General Assembly passed, and the Governor signed, the Clean Smokestack Act (CSA). The CSA tasked the North Carolina Department of Environment and Natural Resources’ (DENR) Division of Air Quality (DAQ) with studying options for reducing carbon dioxide (CO2) emissions from coal-burning power plants and other sources. The Act required DAQ to complete a series of studies and make recommendations for reducing North Carolina’s carbon emissions.1, 2, 3 As a result of these studies, DAQ and DENR embarked on efforts to further address the potential reductions of North Carolina’s greenhouse gas (GHG) emissions. The DAQ recognized that many potential options that would mitigate GHG emissions also likely have the long term potential to stimulate economic growth and create much needed jobs in the state, regardless of, and in addition to impacts upon climate change.
The final CSA report, submitted to the North Carolina General Assembly in September of 2005, contained a recommendation, that the state continue GHG mitigation planning to consider a public stakeholder process. Thus, the North Carolina Climate Action Plan Advisory Group (CAPAG) was initiated within an open and publicized process to develop recommendations to DENR/DAQ. The purpose was to assemble a diverse group of stakeholders to further identify and assess mitigation options that might be appropriate, carry out analysis and make recommendations that state policy makers should consider for a state-level Climate Action and Implementation Plan. This report provides the results of that process, focusing in addition to GHG reductions on economic opportunities impacts and co-benefits as associated with proposed potential mitigation options.
The CAPAG process was organized by first assembling 43 stakeholders to represent a diverse range of interests and expertise. The CAPAG met seven times from February, 2006 through October, 2007. During this same period, five technical work groups (TWGs) of the CAPAG developed initial recommendations in the areas of: Energy Supply (ES); Residential, Commercial, Industrial (RCI); Transportation and Land Use (TLU); Agriculture, Forestry, and Waste Management (AFW); and Cross-Cutting Issues (CC). These TWGs consisted of both a consultant facilitator and expertise for analysis as well as several experts and interested parties from within each of the sector communities. The membership of the CAPAG and the five TWGs are documented elsewhere in the appendices of this report. The CAPAG followed a consensus-building process designed and facilitated by the non-profit Center for Climate Strategies (CCS). Applying a proven design similar to those used elsewhere, CCS provided both facilitation services and technical analysis to the CAPAG in formulating its recommendations.
1 CO2 Emission Reduction Options For Coal-fired Electrical Utility Boilers and Other Stationary Sources, First Interim Report, NC DENR/DAQ, Raleigh, NC, September 1, 2003. 2 CO2 Emission Reduction Options For Coal-fired Electrical Utility Boilers and Other Stationary Sources, Second Interim Report Pursuant to Clean Smokestacks Act, NC DENR/DAQ, Raleigh, NC, September 1, 2004. 3 Recommended Carbon Dioxide (CO2) Emission Reduction Strategies for North Carolina (Pursuant to North Carolina’s Clean Smokestacks Act of 2002), NC DENR/DAQ, Raleigh, NC, September 1, 2005.
EX-1
The North Carolina General Assembly in 2005 also formed the Legislative Commission on Global Climate Change (LCGCC) with a charge to among other things, determine if a cap on emissions was warranted, and if so, at what level should it be set. The LCGCC appointed by leaders of both the House and Senate and facilitated by Legislative Counsel and staff, held its first meeting on February 3, 2006. Though the Commission has focused mainly on broader issues, the CAPAG has coordinated closely with them and has become integrated in many of their deliberations.
CAPAG Mitigation Option Recommendations and Impacts The CAPAG offers 564 recommended options for further study and potential adoption that are believed to be most important for mitigating North Carolina’s GHG emissions. The level of support among CAPAG members for these options, although not always unanimous, has been very high. As a starting point it was discovered that
• GHG emissions as estimated subsequent to a 1990 baseline have grown at a rate much higher than most areas due to the growth in population and high level of prosperity in this state, as further detailed later in the report. This growth has resulted in large increases in use of electricity, more cars driving more miles, and other consumer trends that have developed.
• Projected emissions can be reduced significantly if each and every one of the CAPAG’s recommendations is completely, strictly and properly implemented and the estimated reductions are fully achieved.
• Full adoption by the state and complete, strict and proper implementation of each and every one of the CAPAG’s recommendations is estimated to reduce gross GHG emissions by approximately 47%, from 256 million metric tons of carbon dioxide equivalent (MMtCO2e) in the reference case forecast to 137 MMtCO2e by 2020, or within 1% of 1990 levels.
• Cumulative GHG reductions from 2007-2020 from complete adoption and implementation are estimated to be as high as 828 MMtCO2e.
• The associated economic analysis (considering both plus and minus costs) indicates significant cost savings for the State’s economy over the period 2007–2020.
The associated cost savings are defined fully in the following chapters of this report.
Details of the 56 mitigation options and their analysis, over the five sectors, as supported by the CAPAG process and recommendations are presented in Chapters 3 through 7 of this report, and in the Appendices.
As further discussed in Chapter 1, the CAPAG’s recommendations complement efforts underway in North Carolina, especially the LCGCC and policies and programs developed by the
4 This number is based on the total number of options approved by the CAPAG (see table below). Some options were renumbered (i.e., AFW-7 to AFW-4b; TLU 2 to TLU-1b) or combined (e.g., AFW 9&10), and others were divided into sections a, b, c to yield a total of 56 options supported by CAPAG.
EX-2

North Carolina Energy Office.5 This report also points to numerous co-benefits that would result from implementation of CAPAG-recommended options.
As this is currently a very active area, we also note that the State Energy Office is currently updating the State Energy Plan. In addition, during the 2007 session of the General Assembly, State Legislators adopted, and Governor Easley signed, several bills related to mitigation options also considered by the CAPAG, particularly relating to a requirement for North Carolina utilities to use renewable energy and energy efficiency programs and to require the state to increase energy efficiency in existing and new state-owned and leased buildings. Time and resources have not allowed a full integration of these actions into the recommendations included in this report. A summary of the CAPAG’s 56 Mitigation Options by sector is provided below:
Mitigation Option Name
Cumulative GHG Reductions 2007–2020 MMtCO2e
Residential, Commercial, and Industrial (RCI)
RCI–1 Demand Side Management Programs for the RCI Sectors - Recommended Case: "Top-Ten States" EE Investment 77.1
RCI–2 Expand Energy Efficiency Funds 54.8
RCI–3 Energy Efficiency Requirements for Government Buildings 6.4
RCI–4 Market Transformation and Technology Development Programs 10.5
RCI–5 Improved Appliance and Equipment Efficiency Standards 5.3
RCI–6 Building Energy Codes 23.1
RCI–7 “Beyond Code” Building Design Incentives and Targets, Incorporating Local Building Materials and Advanced Construction 34.2
RCI–8 Education (Consumer, Primary/Secondary, Post-Secondary/ Specialist, College and University Programs) Not Applicable (NA)
RCI–9 Green Power Purchasing (required for state facilities) and Bulk Purchasing Programs for Energy Efficiency or Other Equipment 3.5
RCI–10 Distributed Renewable and Clean Fossil Fuel Power Generation 33.5
RCI–11 Residential, Commercial, and Industrial Energy and Emissions Technical Assistance and Recommended Measure Implementation 14.9
SECTOR TOTAL AFTER ADJUSTING FOR OVERLAPS 218.7
RCI REDUCTIONS FROM RECENT ACTIONS* 10.1
RCI–1 Demand Side Management Programs for the Residential, Commercial and Industrial Sectors 6.2
RCI–2 Expand Energy Efficiency Funds 3.6
RCI–6 Building Energy Codes 0.0
RCI–9 Green Power Purchasing (required for state facilities) and Bulk Purchasing Programs for Energy Efficiency or Other Equipment 0.3
SECTOR TOTAL PLUS RECENT ACTIONS 228.8
5 See Annex A to Appendix E (Residential, Commercial and Industrial Sectors) for summaries of the North Carolina State Energy Office (SEO) and State Energy Plan (SEP) policies and programs related to RCI mitigation options.
EX-3
Mitigation Option Name
Cumulative GHG Reductions 2007–2020 MMtCO2e
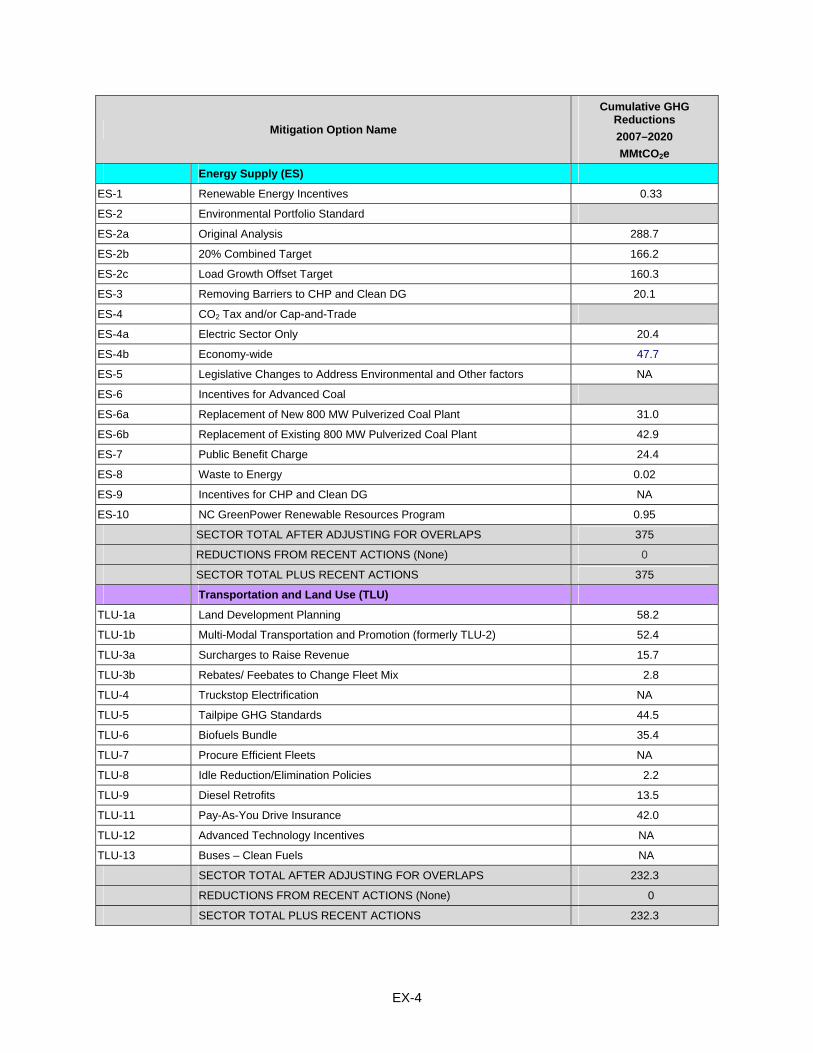
Energy Supply (ES)
ES-1 Renewable Energy Incentives 0.33
ES-2 Environmental Portfolio Standard
ES-2a Original Analysis 288.7
ES-2b 20% Combined Target 166.2
ES-2c Load Growth Offset Target 160.3
ES-3 Removing Barriers to CHP and Clean DG 20.1
ES-4 CO2 Tax and/or Cap-and-Trade
ES-4a Electric Sector Only 20.4
ES-4b Economy-wide 47.7
ES-5 Legislative Changes to Address Environmental and Other factors NA
ES-6 Incentives for Advanced Coal
ES-6a Replacement of New 800 MW Pulverized Coal Plant 31.0
ES-6b Replacement of Existing 800 MW Pulverized Coal Plant 42.9
ES-7 Public Benefit Charge 24.4
ES-8 Waste to Energy 0.02
ES-9 Incentives for CHP and Clean DG NA
ES-10 NC GreenPower Renewable Resources Program 0.95
SECTOR TOTAL AFTER ADJUSTING FOR OVERLAPS 375
REDUCTIONS FROM RECENT ACTIONS (None) 0
SECTOR TOTAL PLUS RECENT ACTIONS 375
Transportation and Land Use (TLU)
TLU-1a Land Development Planning 58.2
TLU-1b Multi-Modal Transportation and Promotion (formerly TLU-2) 52.4
TLU-3a Surcharges to Raise Revenue 15.7
TLU-3b Rebates/ Feebates to Change Fleet Mix 2.8
TLU-4 Truckstop Electrification NA
TLU-5 Tailpipe GHG Standards 44.5
TLU-6 Biofuels Bundle 35.4
TLU-7 Procure Efficient Fleets NA
TLU-8 Idle Reduction/Elimination Policies 2.2
TLU-9 Diesel Retrofits 13.5
TLU-11 Pay-As-You Drive Insurance 42.0
TLU-12 Advanced Technology Incentives NA
TLU-13 Buses – Clean Fuels NA
SECTOR TOTAL AFTER ADJUSTING FOR OVERLAPS 232.3
REDUCTIONS FROM RECENT ACTIONS (None) 0
SECTOR TOTAL PLUS RECENT ACTIONS 232.3
EX-4

Mitigation Option Name
Cumulative GHG Reductions 2007–2020 MMtCO2e
Agriculture, Forestry, and Waste (AFW)
AFW-1 Manure Digesters & Energy Utilization 6.4
AFW-2 Biodiesel Production (incentives for feedstocks and production plants) 5.1
AFW-3 Soil Carbon Management (including organic prod. methods incentives) 3.0
AFW-4a Preservation of Working Land–Agricultural Land 2.6
AFW-4b Preservation of Working Land–Forest Land (formerly AFW-7) 36
AFW-5 Agricultural Biomass Feedstocks for Electricity or Steam Production 0.2
AFW-6 Policies to Promote Ethanol Production 38
AFW-8 Afforestation and/or Restoration of Nonforested Lands 15
AFW-9&10 Expanded Use of Forest Biomass and Better Forest Management 48
AFW-11 Landfill Methane and Biogas Energy Programs 20
AFW-12 Increased Recycling Infrastructure and Collection 4.1
AFW-13 Urban Forestry Measures 34
SECTOR TOTAL AFTER ADJUSTING FOR OVERLAPS 213
REDUCTIONS FROM RECENT ACTIONS (None) 0
SECTOR TOTAL PLUS RECENT ACTIONS 213
Cross-Cutting Issues (CC)
CC-1 GHG Inventories and Forecasts NA
CC-2 GHG Reporting NA
CC-3 GHG Registry NA
CC-4 Public Education and Outreach NA
CC-5 Adaptation NA
CC-6 Options for Goals or Targets (for CAPAG in support of LCGCC) NA
Some options were renumbered (i.e., AFW-7 to AFW-4b; TLU 2 to TLU-1b) or combined (e.g., AFW 9&10), and others were divided into sections a, b, c to yield a total of 56 options supported by CAPAG.
* “Recent actions" represent initiatives undertaken in North Carolina that reduce GHG emissions that were implemented shortly before or during the CAPAG process. The emission reductions associated with recent actions are not accounted for in the GHG emissions inventory and reference case projections. Emissions reductions associated with these recent actions were therefore estimated separately, and are counted toward overall statewide reductions along with reductions from the mitigation options recommended by the CAPAG.
Perspectives on Mitigation Option Recommendations There can be a large variation in the GHG reductions associated with various options. These are discussed in substantially more detail in the following chapters and appendices, as well as details of the costs, cost per ton, figures showing the net reductions, and other details of how the information was developed.
EX-5

EX-6
Secondary Economic Impact Analysis of Mitigation Options The Appalachian State University (ASU) Energy Center and CCS and their team of analysts worked together to conduct a secondary economic impact analysis of the potential economic and jobs impacts of various options developed by the CAPAG. The ASU Energy Center examined thirty of the fifty-six mitigation options bundled into twenty-three mitigation option scenarios with similar policies grouped together for analysis. Combined these options account for more than 90% of the GHG emissions reductions and offsets identified by the CAPAG.
For the study, the ASU Energy Center utilized the NC Energy Scenario Economic Impact Model (NC ESEIM). Originally developed in 2005 for the North Carolina Energy Policy Council, the peer-reviewed model assesses the impacts of various energy policies on the North Carolina economy, measured in terms of employment, employee and proprietor compensation (income), and the incomes earned by labor and capital (gross state product).
On the whole, implementation of the modeled mitigation option bundles would result in a mildly positive economic impact on North Carolina’s economy. By 2020, the mitigation options analyzed would result in the creation of more than 15,000 jobs, $565 million in employee and proprietor income, and $302 million in gross state product. For the study period, 2007–2020, the mitigation options analyzed would generate more than $2.2 billion net present value (NPV) in net additional employee and proprietor income and more than $1.2 million (NPV) in net gross state product. These results and the report methodology are discussed in substantially more detail in the following chapters and the ASU Energy Center’s stand-alone report available at “http://www.ncclimatechange.us” or “http://daq.state.nc.us/monitor/eminv/gcc.”
Chapter 1 Background and Overview
The Climate Action Planning Initiative North Carolina leaders, including the General Assembly, have acted upon concerns that North Carolina would be prudent to examine steps that could and should be taken to address climate change and any man made components of the problem. The concerns include potential that the state’s vast coastal areas and other resources may suffer damage from climate changes. In 2002 the North Carolina General Assembly passed, and the Governor signed, a major bill, commonly known as the Clean Smokestack Act (CSA), that is resulting in major reductions in sulfur dioxide (SO2) and oxides of nitrogen (NOx) emissions from coal-fired power plants.
The CSA also charged the North Carolina Division of Air Quality (DAQ) with studying and reporting on potential controls for carbon dioxide (CO2) emissions from coal-fired electric power plants. This resulted in a series of reports with recommendations for reducing North Carolina’s carbon emissions. One of those recommendations was to develop a climate action plan. Under the CSA’s Section 13 requirements, the Division released a draft inventory and forecast of the state’s GHG emissions as well as the third report (September 2005) with a list of recommendations assembled by the Division.
The Center for Climate Strategies (CCS), a non-profit organization with expertise and a history of similar efforts regarding greenhouse gas (GHG) emissions, prepared the draft inventory and forecast under contract and through donated funds. The Center also made recommendations on a process which would result in a prioritized list of GHG mitigation options. Following the publication of the September 2005 report, the North Carolina Department of Environment and Natural Resources (DENR) with management supplied by the DAQ, initiated a follow up to that report and began the first steps toward a comprehensive climate action plan by commencing a facilitated stakeholder process to consider potential mitigation options.
During this period, the state General Assembly also established the Legislative Commission on Global Climate Change (LCGCC, or “the Commission”) to assess GHG concerns and, among other things, provide a recommendation to the General Assembly regarding whether the state should establish a cap on emissions, and if so, what that cap should be. The Commission held its first meeting in February 2006 and initiated a climate-related fact-finding effort regarding the science and potential recommendations. The DAQ (assisted with support from CCS) was asked to provide technical background and implementation support to the work of the LCGCC. This cooperative effort was initiated and is expected to continue through the Commission’s life, currently proposed to be extended until October 2009.
DAQ recognized that it was possible, and even likely, that many potential GHG mitigation options would stimulate economic growth and new jobs in the state, in addition to reducing the effects of climate change. Thus, a stakeholder process was initiated which called on over 40 volunteer stakeholders representing a broad range of interests and expertise to be formed into a body to be called the Climate Action Plan Advisory Group (CAPAG). This diverse group of North Carolina citizens, representing business, industry, environmental and educational
1-1

organizations and government, took on the responsibility of analyzing and making recommendations for priority options to reduce GHG emissions in the state. Many of the CAPAG members were also members of the LCGCC. Their work included:
• Development, prioritization, analysis and approval of a final collection of existing and proposed actions that could contribute to GHG emissions reductions.
• Review and approval of an inventory of historical and forecasted GHG emissions in North Carolina as a basis against which to gauge priorities and progress.
• Consideration of costs and emission reductions of recommended options.
This report is the outcome of that effort, one that involved a distinguished and broad group of stakeholders including other state agencies, with technical support and facilitation from the CCS.
Recent Developments North Carolina has undertaken several efforts to conserve energy while addressing GHG emissions. The North Carolina State Energy Office has developed and is currently updating the State Energy Plan.1 Examples of efforts undertaken by other entities include the following:
• Major utilities in North Carolina have expanded existing demand-side management programs (DSM) for the RCI sectors.
• Under the authority of the North Carolina Utilities Commission, a Public Benefits Charge is collected on electricity sales, a portion of which is managed by the Advanced Energy Corporation and used to fund energy efficiency and economic development programs.
• NC GreenPower coordinates a voluntary program of green power purchasing for consumers in the governmental, residential, commercial and industrial sectors.
• The state fleet of vehicles has been required (and this requirement continues to expand) to meet several standards goals related to make the fleet Flex-fueled and to increase the purchase of hybrid and other high mileage/low emitting vehicles.
In addition, during 2007 the North Carolina General Assembly considered several bills related to mitigation options that were also considered by the CAPAG. The following includes legislation passed by the General Assembly and signed by the Governor. Note that the CAPAG had completed analysis of its mitigation options before the final requirements of these bills were determined. As a result, the GHG reductions and costs (or cost savings) reflected in this report have not been aligned specifically with these new statutes.
• Senate Bill (SB) 3 (Promote Renewable Energy/Energy Efficiency) includes the following:
○ Requires a percentage of energy sales in North Carolina to come from new renewable sources and efficiency measures on the following schedule: 3% by 2012 (up to 0.75%
1 See Annex A to Appendix E (Residential, Commercial and Industrial Sectors) for summaries of the North Carolina State Energy Office (SEO) and State Energy Plan (SEP) policies and programs related to RCI mitigation options. Also note that that plan is now being updated.
1-2

from efficiency); 6% by 2015 (up to 1.5% from efficiency); 10% by 2018 (up to 2.5% from efficiency); and 12.5% by 2021 (up to 5% from efficiency).
○ Requires specific amounts of electricity sales from: (1) solar (0.02% in 2010 up to 0.2% in 2018); (2) swine waste (0.07% in 2012 up to 0.2% in 2018); and (3) poultry waste (170,000 megawatt hours in 2012 up to 900,000 megawatt hrs in 2014.
○ Requires any new biomass energy facility to meet Best Available Control Technology (BACT). Other language was included to ensure that renewable energy technologies do not have secondary, undesirable consequences. Impacts on residential consumers must not exceed $10 per year 2008-2011; $12 per year 2012-2014; and $34 per year 2015 and beyond.
○ Allows for ongoing review of construction costs for new power plants and recovery of costs in a general rate case.
• SB 567 (Allow Distribution of E-Blend Fuels) - Allows E85 to be dispensed from dispensers approved for E10 provided the manufacturer has initiated the process for approval by an independent testing lab.
• SB 1272 (Definition of Biodiesel) - An individual that produces biodiesel for use in a private (non-commercial) vehicle is exempt from the motor fuels tax.
• SB 1277 (State Diesel Vehicles’ Warranties/B20 Fuel) - Every new diesel vehicle purchased by the State shall be covered by an express manufacturer’s warranty that allows the use of B20 fuel.
• SB 1452 (Diesel School Buses to Use Minimum B20 Fuel) - Requires that 2% of the annual diesel used by North Carolina school buses be B20 by June 2008 (2% = ~ 500,000 gallons).
• SB 668 (Energy Conservation in State Buildings) - Energy Conservation in State Buildings – Specific performance criteria and goals for sustainable, energy efficient public buildings must be established.
• SB 670 (Energy Devices That Use Renewable Resources) - Use of Solar Collectors on detached single-family residences – As long as they aren’t facing public access or common areas, an ordinance, deed restriction, covenant and other similar agreements cannot prohibit or have the effect of prohibiting their installation.
The CAPAG Process The CAPAG first met in February of 2006 and was charged with making recommendations to DAQ that would then be a resource list and as input to further state consideration and proposals for action. The CAPAG met seven times with the final decisional meeting held in July 2007. In addition a meeting to review this report’s capture of the intent of the members of CAPAG was held in October 2007. This report addresses comments provided at that meeting and shortly thereafter. In all, about 75 meetings and significant conference calls of the CAPAG and their supporting technical work groups (TWGs) were held between February 2006 and July, 2007 to identify and analyze various potential mitigation actions.
The CAPAG was assisted and supported by, five TWGs representing local and outside expertise in key sectors selected for analysis: Energy Supply (ES); Residential, Commercial, Industrial
1-3
(RCI); Transportation and Land Use (TLU); Agriculture, Forestry, and Waste Management (AFW); and Cross-Cutting Issues (CC). The TWGs consisted of CAPAG members as well as individuals not on the CAPAG with interest and expertise in the issues being addressed by each TWG. CAPAG members as well as individuals not on the CAPAG with interest and expertise in the issues being addressed formed each TWG. Where members of the TWG did not fully agree upon recommendations to the CAPAG, the summary of their efforts was reported to the CAPAG for their further consideration and actions. (See Appendix B for a listing of the members of each group.)
The CAPAG process involved a model of informed self-determination through a facilitated stepwise consensus building approach. Under the oversight of DENR, the process was conducted by the CCS, an independent, expert facilitation and technical analysis team. It was based on procedures that CCS consultants have used in a number of other state climate change planning initiatives since 2000, but adapted specifically for North Carolina. The CAPAG process sought, but did not mandate consensus, and it explicitly documented the level of CAPAG support for individual mitigation options and key findings established through a voting process, outlined and agreed to in advance.
The 56 top priority (out of over 300 total) recommendations adopted by the CAPAG and presented in this report underwent two levels of screening by the CAPAG. First, a potential mitigation option being considered by a TWG was not accepted as a “priority for analysis” and developed for full analysis unless it had a supermajority of support from CAPAG members present at the decisional meetings (with a “supermajority” defined as 80% or more of the CAPAG members attending a meeting agree). Second, after the analyses were conducted, only options that received at least majority support from CAPAG members present at the decisional meetings were adopted by the CAPAG and included in this report. In total, of the 56 recommended mitigation options adopted by the CAPAG, more than 85% (48) received unanimous consent, and just over 14% (8) received a majority of support, of those present at the CAPAG decisional meetings. The TWGs recommendations to the CAPAG were documented and presented to the CAPAG at each CAPAG meeting. All meetings were open to the public, were widely advertised, and all materials for and summaries of the CAPAG and TWG meetings were posted on the project website.
Analysis of Options With CCS providing facilitation and technical analysis, the TWGs prepared mitigation options for CAPAG consideration using a “mitigation option template” conveying key information:
• Mitigation option description
• Mitigation option design (goals, timing, parties involved)
• Implementation mechanisms
• Related policies / programs in place
• Type(s) of GHG reductions
• Estimated GHG reductions and costs (or cost savings)
1-4

• Key uncertainties
• Additional benefits and costs
• Feasibility issues
• Status of group approval
• Level of group support
• Barriers to consensus
In its deliberations, the CAPAG modified and embraced various mitigation options. The final versions for each sector, conforming to the mitigation option templates, appear in Appendices E through I and constitute the most detailed record of decision of the CAPAG. Appendix D presents a description of the methods used for quantification of mitigation options. CCS and the TWGs produced estimates of the GHG emission reductions and costs (or cost savings) of various mitigation options, both in terms of a net present value from 2007-2020 and a dollars-per-ton cost (i.e., cost-effectiveness).2 The key methods are summarized here:
• Estimates of GHG reductions. Using the projection of future GHG emissions (see below) as a starting point, analysis of the impact of mitigation options produced estimates of the GHG reductions attributable to each option in the years 2010 and 2020, and cumulative over the time period 2007-2020. Many options were estimated to affect the quantity or type of fossil fuel combusted; others affected methane (CH4) or CO2 sequestered, etc. Among the many assumptions involved in this task was selection of the appropriate GHG accounting framework, namely, the choice between taking a “production-based” approach versus a “consumption-based” approach to various sectors of the economy.3 The CAPAG took a “production-based” approach in all sectors except the electricity sector, in both forecasting emissions and in estimating the GHG impacts of mitigation options. This issue, along with other GHG estimation issues (e.g., analysis of overlapping or interacting mitigation option impacts), are discussed in detail in Chapter 2 (GHG Inventory and Reference Case Projections), Appendix D (Methods for Quantification), and Chapters 3 through 6 and Appendices E through H for each sector.
• Estimates of costs or cost savings.
○ Discounted and Annualized Costs. Standard approaches were taken here. The “present value” of costs was calculated by applying a real discount rate of 5%. Dollars-per-ton estimates were derived as an annualized cost per ton, dividing the “present value cost” by the cumulative GHG reduction measured in tons. As was the case with GHG reductions, the period 2007-2020 was analyzed.
2 The analysis addressed emission reductions and associated cost or cost savings and did not attempt to estimate specific price changes or utility rate changes that might result from implementation of a mitigation option. 3 In brief, a production-based approach estimates GHG emissions associated with goods and services produced within the state, and a consumption-based approach estimates GHG emissions associated with goods and services consumed within the state. In some sectors of the economy, these two approaches may not result in significantly different numbers, however, the power sector is notable in that it is responsible for large quantities of GHG emissions, and states often produce far more or far less electricity than they consume (with the remainder attributable to power exports or imports). North Carolina imports electric power and must account for the emissions this consumption creates, even though they are not produced in-state.
1-5

○ Cost savings. Many options created easily monetized cost savings (e.g., fuel savings and electricity savings). In these cases, monetized cost savings were subtracted from monetized costs, resulting in net costs. These net costs could be positive or negative; negative costs indicated that the option saved money or produced “cost savings.”
○ Direct vs. Indirect Effects. Estimates costs and cost savings were based on “direct effects” (i.e., those borne by the entities implementing the option).4 Implementing entities could be: individuals, companies, and/or government agencies, etc. In contrast, conventional cost-benefit analysis takes the “societal perspective” and tallies every conceivable impact on every entity in society (and quantifies these wherever possible).
○ North Carolina vs. National/Global perspective. Estimates costs and cost savings were based on implementing entities in North Carolina, not on a broader societal perspective (national or global). One implication of this is that national taxes or subsidies that affect actions in North Carolina were not part of the analysis.
• Contributing issues. The CAPAG recommendations were guided in part by the GHG reductions and monetized costs and cost savings of various options, but members also felt that other considerations should also have weight. The CAPAG developed a checklist for TWGs to use to keep in mind important human, social, economic, environmental, and other factors that may warrant consideration when evaluating GHG emission reduction strategies. The TWGs were asked to examine these qualitative terms where deemed important, and quantify them on a case-by-case as needed depending on need and where data were readily available.
North Carolina GHG Emissions Inventory and Reference Case Projections In support of requirements to the CSA and in cooperation with DENR, CCS prepared a draft document, entitled Revised Draft North Carolina Greenhouse Gas Inventory and Reference Case Projections 1990–2020 (hereafter Inventory and Projections).5 The projection of future emissions aimed to capture as accurately as possible the trajectory of emissions given policies and programs in place as of 2004. The draft was presented to the CAPAG at its first meeting, and then approved by unanimous consent at the CAPAG’s fifth meeting following technical review and revision.6 The Inventory and Projections included detailed coverage of all economic sectors and GHGs in North Carolina, including future emissions trends and assessment issues related to energy, economic, and population growth. The assessment included estimates of total statewide
4 “Additional benefits and costs” were defined as those borne by entities other than those implementing the option. These indirect effects were quantified on a case-by-case basis depending on magnitude, importance, need and availability of data. 5 Revised Draft North Carolina Greenhouse Gas Inventory and Reference Case Projections 1990-2020, prepared by the Center for Climate Strategies for the North Carolina DENR/DAQ, February 2006, http://www.ncclimatechange.us or http://daq.state.nc.us/monitor/eminv/gcc. 6 Final North Carolina Greenhouse Gas Inventory and Reference Case Projections 1990-2020, prepared by the Center for Climate Strategies for the North Carolina DENR/DAQ, September 2007, http://www.ncclimatechange.us or http://daq.state.nc.us/monitor/eminv/gcc.
1-6
“gross emissions” (leaving aside carbon sequestration7) and “net emissions” (in which reductions due to sequestration are subtracted from gross emissions) on a production basis for all sources and a consumption basis for the electricity sector (see prior discussion under “Analysis of Options” in this chapter for an explanation of the production versus consumption approach). Further discussion of the issues involved in developing the inventory and reference case projections is summarized in Chapter 2 (Inventory and Projections of GHG Emissions) and discussed in detailed in the final report for the Inventory and Projections.
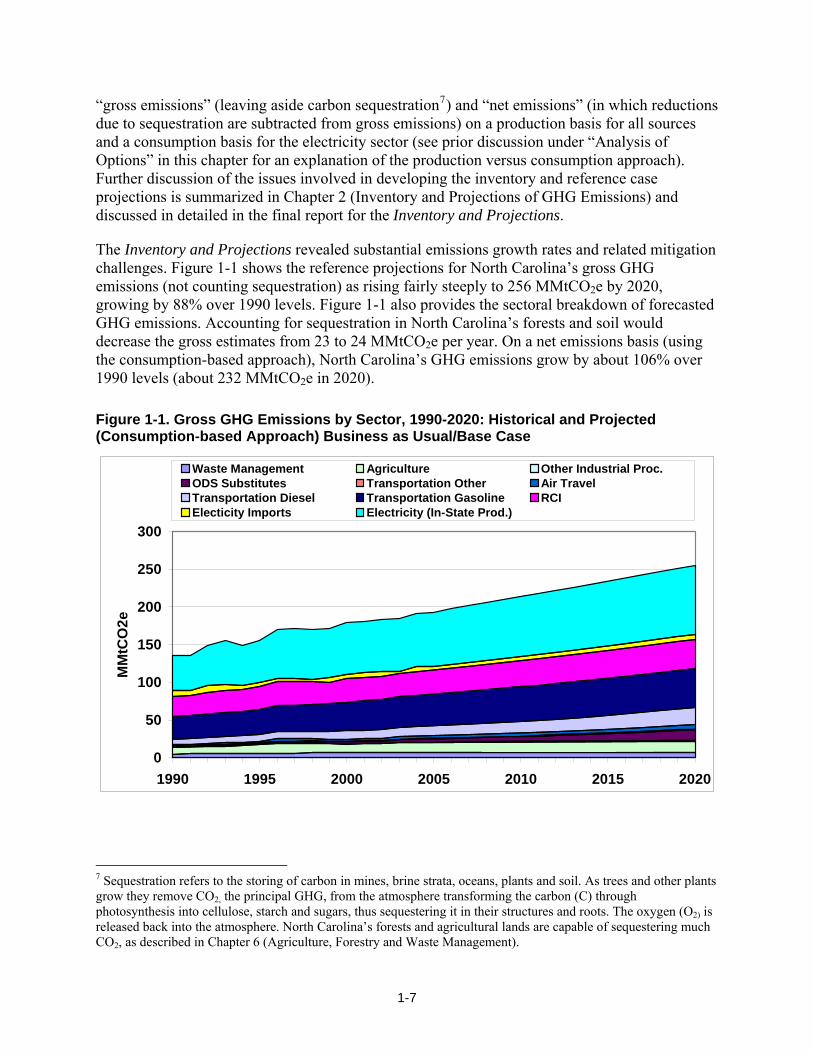
The Inventory and Projections revealed substantial emissions growth rates and related mitigation challenges. Figure 1-1 shows the reference projections for North Carolina’s gross GHG emissions (not counting sequestration) as rising fairly steeply to 256 MMtCO2e by 2020, growing by 88% over 1990 levels. Figure 1-1 also provides the sectoral breakdown of forecasted GHG emissions. Accounting for sequestration in North Carolina’s forests and soil would decrease the gross estimates from 23 to 24 MMtCO2e per year. On a net emissions basis (using the consumption-based approach), North Carolina’s GHG emissions grow by about 106% over 1990 levels (about 232 MMtCO2e in 2020).
Figure 1-1. Gross GHG Emissions by Sector, 1990-2020: Historical and Projected (Consumption-based Approach) Business as Usual/Base Case
0
50
100
150
200
250
300
1990 1995 2000 2005 2010 2015 2020
MM
tCO
2e
Waste Management Agriculture Other Industrial Proc.ODS Substitutes Transportation Other Air TravelTransportation Diesel Transportation Gasoline RCIElecticity Imports Electricity (In-State Prod.)
7 Sequestration refers to the storing of carbon in mines, brine strata, oceans, plants and soil. As trees and other plants grow they remove CO2, the principal GHG, from the atmosphere transforming the carbon (C) through photosynthesis into cellulose, starch and sugars, thus sequestering it in their structures and roots. The oxygen (O2) is released back into the atmosphere. North Carolina’s forests and agricultural lands are capable of sequestering much CO2, as described in Chapter 6 (Agriculture, Forestry and Waste Management).
1-7

The inventory and projection of North Carolina’s GHG emissions provided several critical findings, including:
• As is common in many states, the electricity and transportation sectors are the two sectors with the largest emissions, and are expected to continue to grow faster than other sectors.
• Consumption of electricity is growing faster in North Carolina than population. In addition, there appears to be a trend toward an increasing reliance on natural gas and imported electricity. Vehicle-miles traveled (VMT) are also projected to grow faster than the state’s population. Freight traffic (resulting in increased diesel consumption) and increasing use of hydrofluorocarbons (HFCs) and perfluorocarbons (PFCs) as substitutes for ozone-depleting substances (ODS) in refrigeration, air conditioning, and other applications is also increasing more rapidly than population.
While North Carolina’s emissions estimated growth rate (88% from 1990 to 2020 on a gross emissions, consumption basis) presents challenges, it also provides major opportunities. Key choices on technologies and infrastructure can have a significant impact on the emissions of a fast-growing state. The CAPAG’s recommendations document the opportunities for the state to reduce its GHG emissions while continuing its strong economic growth by being more energy efficient, using more renewable energy sources, and increasing the use of cleaner transportation modes, technologies, and fuels. The inventory and reference case projections are discussed in more detail in Chapter 2 of this report and the entire study appears in the final report for the Inventory and Projections.8
Overview of CAPAG Mitigation Option Recommendations The CAPAG offers 569 recommended options to DENR for mitigating North Carolina’s GHG emissions. Among the CAPAG members that attended each decisional meeting, the level of support for these options is very high; 86% (48 options) received unanimous consent, and 14% (8 options) received a super majority. Figure 1-2 below presents:
• Projected growth in North Carolina’s gross GHG emissions on a consumption basis (blue line). The consumption based approach accounts for emissions associated with the generation of electricity in-state and imported from out-of-state to meet North Carolina’s demand for electricity.
• Projected emissions if each and every one of the CAPAG’s recommendations is completely, strictly and properly implemented and the estimated reductions are fully achieved (green line).
8 Detailed documentation of the inventory and reference case projections is provided in Final North Carolina Greenhouse Gas Inventory and Reference Case Projections, 1990-2020, prepared by the Center for Climate Strategies for the North Carolina DENR/DAQ, September 2007, http://www.ncclimatechange.us or http://daq.state.nc.us/monitor/eminv/gcc. 9 This number is based on the total number of options approved by the CAPAG (see Table 1-3). Some options were renumbered (i.e., AFW-7 to AFW-4b; TLU 2 to TLU-1b) or combined (e.g., AFW 9&10), and others were divided into sections a, b, c to yield a total of 56 options supported by CAPAG.
1-8
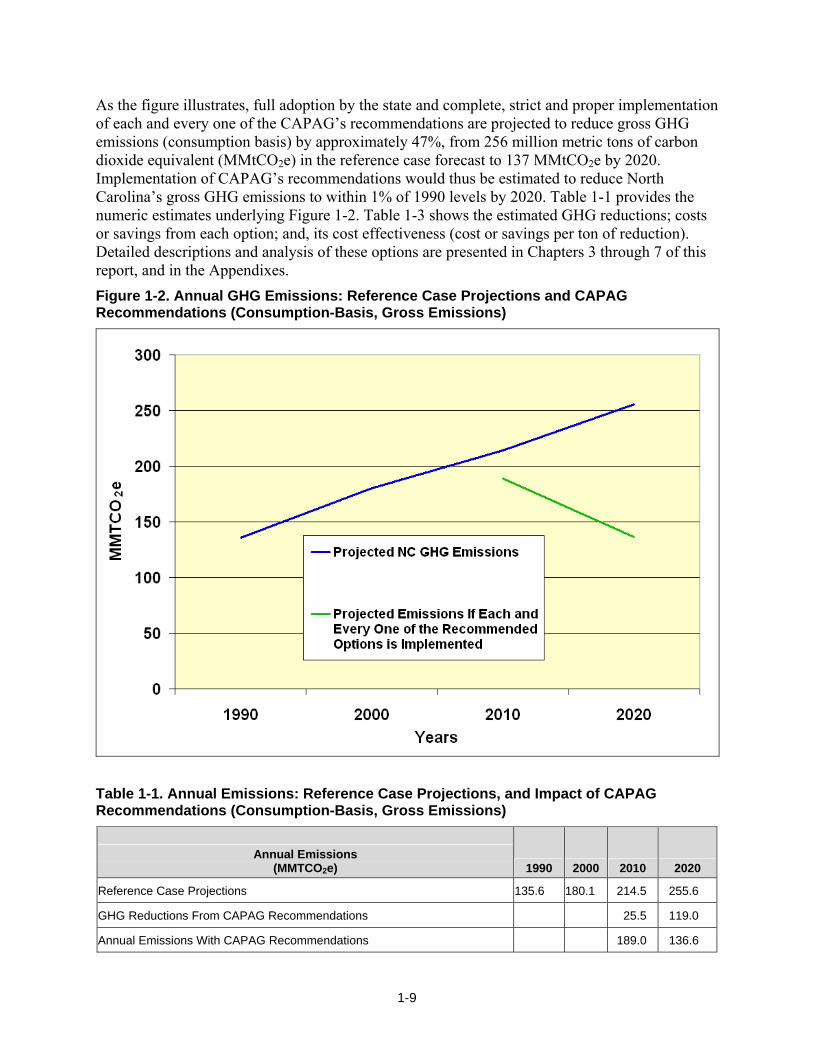
As the figure illustrates, full adoption by the state and complete, strict and proper implementation of each and every one of the CAPAG’s recommendations are projected to reduce gross GHG emissions (consumption basis) by approximately 47%, from 256 million metric tons of carbon dioxide equivalent (MMtCO2e) in the reference case forecast to 137 MMtCO2e by 2020. Implementation of CAPAG’s recommendations would thus be estimated to reduce North Carolina’s gross GHG emissions to within 1% of 1990 levels by 2020. Table 1-1 provides the numeric estimates underlying Figure 1-2. Table 1-3 shows the estimated GHG reductions; costs or savings from each option; and, its cost effectiveness (cost or savings per ton of reduction). Detailed descriptions and analysis of these options are presented in Chapters 3 through 7 of this report, and in the Appendixes. Figure 1-2. Annual GHG Emissions: Reference Case Projections and CAPAG Recommendations (Consumption-Basis, Gross Emissions)
Table 1-1. Annual Emissions: Reference Case Projections, and Impact of CAPAG Recommendations (Consumption-Basis, Gross Emissions)
Annual Emissions (MMTCO2e) 1990 2000 2010 2020
Reference Case Projections 135.6 180.1 214.5 255.6
GHG Reductions From CAPAG Recommendations 25.5 119.0
Annual Emissions With CAPAG Recommendations 189.0 136.6
1-9

The CAPAG’s recommendations tabulated in the Executive Summary, along with a listing of the estimated reductions for each. Chapters 3 through 7 and the Appendices provide detailed descriptions and analysis of GHG reductions, costs, additional impacts, feasibility, etc. for individual options developed by the five TWGs/sectors:
• Residential, Commercial, Industrial (RCI)
• Energy Supply (ES)
• Transportation and Land Use (TLU)
• Agriculture and Forestry (AF)
• Cross-Cutting Issues (CC)
Table 1-2. Summary by Sector of Estimated Impacts of Implementing All of the CAPAG Recommendations
GHG Reductions (MMtCO2e)
Net Direct Cost
(Million $) Sector
2010 2020Total 2007- 2020
2007– 2020 (NPV)
Cost- Effective-
ness ($/tCO2e)
Residential, Commercial and Industrial (RCI, non-electricity options only) 0.1 1.5 7.9 –987 N/A
Energy Supply (ES, including RCI options with impacts on electricity consumption, and adjusted for RCI and ES electricity options that overlap)
6.5 62.7 375 –5.9 –0.016
Transportation and Land Use 11.1 25.5 232 –4,350 –19
Agriculture, Forestry and Waste Management 7.8 29.3 213 270 1.27
Cross-Cutting Issues Non-quantified, enabling options
TOTAL (includes all adjustments for overlaps and recent actions)* 25.5 119 828 –5,073 N/A
*Notes: NPV=Net Present Value. Negative values in the Net Direct Cost and the Cost-Effectiveness columns represent, as discussed above, net cost savings associated with the options. Within each sector, values have been adjusted to eliminate double counting for options or elements of options that overlap. In addition, values associated with options or elements of options within a sector that overlap with options or elements of options in another sector have been adjusted to eliminate double counting.
N/A = Not available; for RCI non-electricity options, an overall cost-effectiveness value is not provided because dividing the net non-electric cost savings (mostly due to natural gas energy efficiency) by the net non-electric emission reductions (which factors in both additional fuel for combined heat and power (CHP) and gas savings from energy efficiency) yields results that can be misleading.
For the ES sector, emission reductions and costs associated with ES-2b, ES-4a, and ES 6a (see Table 1-3) were used to estimate the cumulative impacts shown in Table 1-2. Note that the row in Table 1-2 for the RCI sectors includes only that portion of RCI emissions reductions and net costs (in this case, cost savings) that are from RCI options (or elements of options) that affect fuels that are combusted for purposes other than to generate electricity. RCI emissions reductions and net costs that affect electricity use or generation are included in the ES row in Table 1-2, because the emissions reductions and costs of electricity-sector options are dependent on the electrical load served, which is affected by RCI electricity savings. As a result, the net cost savings reported in the ES row in Table 1-2, -$5.9 million, is actually the sum of a large estimated net savings from RCI options and a large estimated net cost from ES options.
1-10

Table 1-3. Summary of CAPAG’s 56 Mitigation Option Recommendations by Sector
GHG Reductions (MMtCO2e)
Net Direct Cost
(Million $) Mitigation Option Name
2010 2020 Total 2007–2020
2007– 2020 (NPV)
Cost- Effective-
ness ($/tCO2e)
Level of Support
Residential, Commercial, and Industrial (RCI)
RCI–1 Demand Side Management Programs for the RCI Sectors - Recommended Case: “Top-Ten States” EE Investment
1.9 11.6 77.1 –1,895 –25 UC
RCI–2 Expand Energy Efficiency Funds 1.5 8.0 54.8 –1,346 –25 UC
RCI–3 Energy Efficiency Requirements for Government Buildings 0.0 1.1 6.4 –88 –14 UC
RCI–4 Market Transformation and Technology Development Programs 0.0 2.0 10.5 –339 –32 UC
RCI–5 Improved Appliance and Equipment Efficiency Standards 0.0 1.0 5.3 –336 –63 UC
RCI–6 Building Energy Codes 0.5 3.5 23.1 –400 –17 UC
RCI–7 “Beyond Code” Building Design Incentives and Targets, Incorporating Local Building Materials and Advanced Construction
0.7 5.2 34.2 –494 –14 UC
RCI–8 Education (Consumer, Primary/Secondary, Post-Secondary/ Specialist, College and University Programs)
Not quantified UC
RCI–9
Green Power Purchasing (required for state facilities) and Bulk Purchasing Programs for Energy Efficiency or Other Equipment
0.1 0.5 3.5 11 3 UC
RCI–10 Distributed Renewable and Clean Fossil Fuel Power Generation 1.2 4.6 33.5 392 12 UC
RCI–11
Residential, Commercial, and Industrial Energy and Emissions Technical Assistance and Recommended Measure Implementation
0.5 2.1 14.9 –494 –33 UC
Sector Total After Adjusting for Overlaps 5.3 33.0 218.7 –3,994 –18
Reductions From Recent Actions** 0.5 1.2 10.1
RCI–1 Demand Side Management Programs for the Residential, Commercial and Industrial Sectors
0.3 0.7 6.2
RCI–2 Expand Energy Efficiency Funds 0.2 0.4 3.6 RCI–6 Building Energy Codes 0.0 0.0 0.0
RCI–9
Green Power Purchasing (required for state facilities) and Bulk Purchasing Programs for Energy Efficiency or Other Equipment
0.0 0.0 0.3
Sector Total Plus Recent Actions 5.8 34.2 228.8
1-11

GHG Reductions (MMtCO2e)
Net Direct Cost
(Million $) Mitigation Option Name
2010 2020 Total 2007–2020
2007– 2020 (NPV)
Cost- Effective-
ness ($/tCO2e)
Level of Support
Energy Supply (ES) ES-1 Renewable Energy Incentives 0.01 0.04 0.33 15 45.1 UC ES-2 Environmental Portfolio Standard ES-2a Original Analysis 6.94 44.3 288.7 1,634 5.7 UC ES-2b 20% Combined Target 5.90 23.4 166.2 409.80 2.5 UC ES-2c Load Growth Offset Target 5.53 22.3 160.3 393.95 2.5 UC ES-3 Removing Barriers to CHP and Clean DG 0.69 2.8 20.1 127.98 6.4 UC ES-4 CO2 Tax and/or Cap-and-Trade ES-4a Electric Sector Only 0.84 3.3 20.4 119 5.8 SMJ ES-4b Economy-wide 1.84 7.1 47.7 284 6.0 SMJ
ES-5 Legislative Changes to Address Environmental and Other factors Not quantified UC
ES-6 Incentives for Advanced Coal
ES-6a Replacement of New 800 MW Pulverized Coal Plant 0.00 3.9 31.0 949 30.6 UC
ES-6b Replacement of Existing 800 MW Pulverized Coal Plant 0.00 5.4 42.9 2,061 48.1 UC
ES-7 Public Benefit Charge 0.8 3.4 24.4 329 13.5 SMJ ES-8 Waste to Energy 0.0 0.0 0.02 –0.7 –36.8 UC ES-9 Incentives for CHP and Clean DG Combined with ES-3 UC
ES-10 NC GreenPower Renewable Resources Program 0.01 0.2 0.95 35 37.0 UC
Sector Total After Adjusting for Overlaps* 6.5 62.7 375 –5.9 –0.016
Reductions From Recent Actions (None) 0 0 0 0 0 Sector Total Plus Recent Actions* 6.5 62.7 375 –5.9 –0.016
1-12
GHG Reductions
(MMtCO2e)
Net Direct Cost
(Million $) Mitigation Option Name
2010 2020 Total 2007–2020
2007– 2020 (NPV)
Cost- Effective-
ness ($/tCO2e)
Level of Support
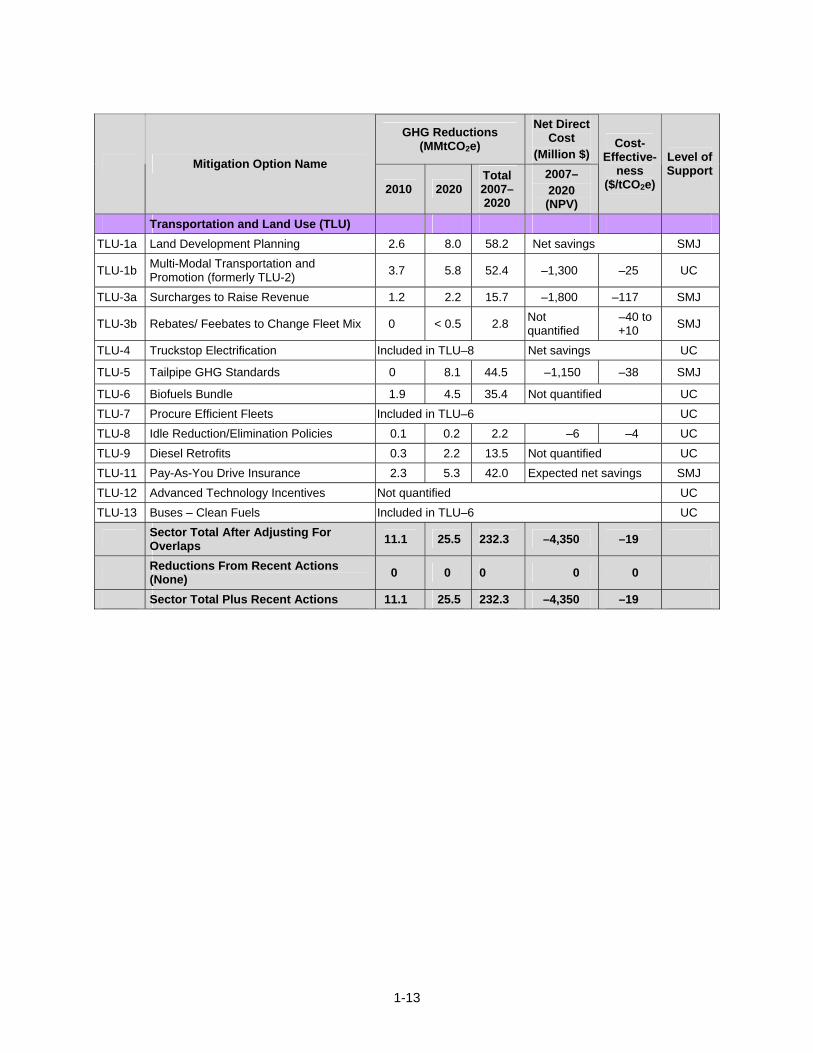
Transportation and Land Use (TLU) TLU-1a Land Development Planning 2.6 8.0 58.2 Net savings SMJ
TLU-1b Multi-Modal Transportation and Promotion (formerly TLU-2) 3.7 5.8 52.4 –1,300 –25 UC
TLU-3a Surcharges to Raise Revenue 1.2 2.2 15.7 –1,800 –117 SMJ
TLU-3b Rebates/ Feebates to Change Fleet Mix 0 < 0.5 2.8 Not quantified
–40 to +10 SMJ
TLU-4 Truckstop Electrification Included in TLU–8 Net savings UC
TLU-5 Tailpipe GHG Standards 0 8.1 44.5 –1,150 –38 SMJ
TLU-6 Biofuels Bundle 1.9 4.5 35.4 Not quantified UC TLU-7 Procure Efficient Fleets Included in TLU–6 UC TLU-8 Idle Reduction/Elimination Policies 0.1 0.2 2.2 –6 –4 UC TLU-9 Diesel Retrofits 0.3 2.2 13.5 Not quantified UC TLU-11 Pay-As-You Drive Insurance 2.3 5.3 42.0 Expected net savings SMJ TLU-12 Advanced Technology Incentives Not quantified UC TLU-13 Buses – Clean Fuels Included in TLU–6 UC
Sector Total After Adjusting For Overlaps 11.1 25.5 232.3 –4,350 –19
Reductions From Recent Actions (None) 0 0 0 0 0
Sector Total Plus Recent Actions 11.1 25.5 232.3 –4,350 –19
1-13

GHG Reductions (MMtCO2e)
Net Direct Cost
(Million $) Mitigation Option Name
2010 2020 Total 2007–2020
2007– 2020 (NPV)
Cost- Effective-
ness ($/tCO2e)
Level of Support
Agriculture, Forestry, and Waste (AFW) AFW-1 Manure Digesters & Energy Utilization 0.2 0.9 6.4 199 32 UC
AFW-2 Biodiesel Production (incentives for feedstocks and production plants) 0.2 0.8 5.1 286 56 UC
AFW-3 Soil Carbon Management (including organic prod. methods incentives) 0.2 0.2 3.0 –16 –5 UC
AFW-4a Preservation of Working Land–Agricultural Land 0.2 0.3 2.6 290 114 UC
AFW-4b Preservation of Working Land–Forest Land (formerly AFW-7) 1.7 4.3 36 112 3 UC
AFW-5 Agricultural Biomass Feedstocks for Electricity or Steam Production 0.009 0.02 0.2 10 54 UC
AFW-6 Policies to Promote Ethanol Production 0.9 6.9 38 200 5 UC
AFW-8 Afforestation and/or Restoration of Nonforested Lands 0.2 2.4 15 128 9 UC
AFW-9&10
Expanded Use of Forest Biomass and Better Forest Management 1.5 5.9 48 –639 –13 UC
AFW-11 Landfill Methane and Biogas Energy Programs 1.1 2.9 20 23 1 UC
AFW-12 Increased Recycling Infrastructure and Collection 0.2 0.5 4.1 52 13 UC
AFW-13 Urban Forestry Measures 1.4 4.3 34 –376 –11 UC Sector Total After Adjusting For Overlaps 7.9 29 213 270 1
REDUCTIONS FROM RECENT ACTIONS (None) 0 0 0 0 0
Sector Total Plus Recent Actions 7.9 29 213 270 1
GHG Reductions (MMtCO2e)
Net Direct Cost
(Million $) Mitigation Option Name
2010 2020 Total 2007–2020
2007– 2020 (NPV)
Cost- Effective-
ness ($/tCO2e)
Level of Support
Cross-Cutting Issues (CC) CC-1 GHG Inventories and Forecasts Not quantified UC CC-2 GHG Reporting Not quantified UC CC-3 GHG Registry Not quantified UC CC-4 Public Education and Outreach Not quantified UC CC-5 Adaptation Not quantified UC
CC-6 Options for Goals or Targets (for CAPAG in support of LCGCC) Not quantified UC
1-14
For “Level of Support” column: UC = unanimous consent (all CAPAG members attending meeting agree), SMJ = supermajority (80% or more of the CAPAG members attending meeting agree).
NPV=Net Present Value. Negative values in the Net Direct Cost and the Cost-Effectiveness columns represent, as discussed above, net cost savings associated with the options.
Some options were renumbered (i.e., AFW-7 to AFW-4b; TLU-2 to TLU-1b) or combined (e.g., AFW-9&-10), and others were divided into sections a, b, c to yield a total of 56 options supported by CAPAG.
* For ES-2, ES-4, and ES-6, emission reductions and costs associated with ES-2b, ES-4a, and ES-6a were used to estimate the cumulative impacts shown in Tables 1-2 and 1-3.
** “Recent actions” represent initiatives undertaken in North Carolina that reduce GHG emissions that were implemented shortly before or during the CAPAG process. The emission reductions associated with recent actions are not accounted for in the GHG emissions inventory and reference case projections. Emissions reductions associated with these recent actions were therefore estimated separately, and are counted toward overall statewide reductions along with reductions from the mitigation options recommended by the CAPAG.
Perspectives on Mitigation Option Recommendations There can be a large imprecision in the GHG reductions associated with various options. Figure 1-3 presents the estimated tons of reductions for each mitigation option recommendation for which estimates were available, expressed as a cumulative figure for the period 2007–2020.
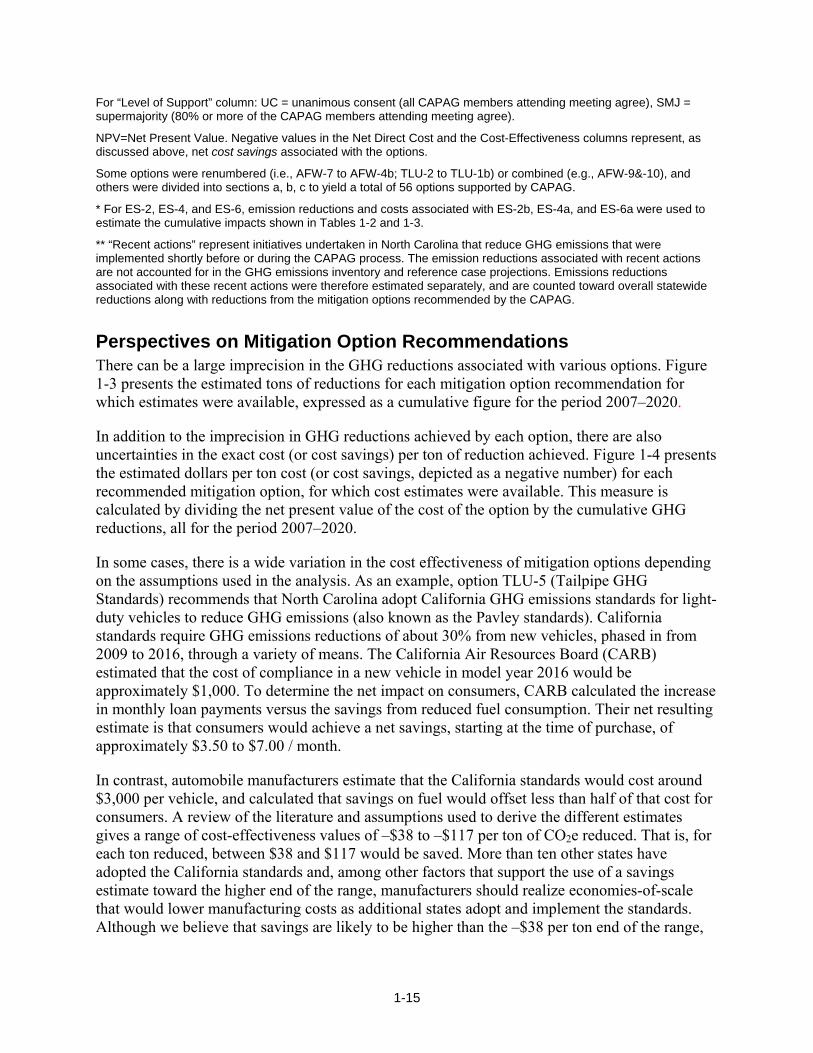
In addition to the imprecision in GHG reductions achieved by each option, there are also uncertainties in the exact cost (or cost savings) per ton of reduction achieved. Figure 1-4 presents the estimated dollars per ton cost (or cost savings, depicted as a negative number) for each recommended mitigation option, for which cost estimates were available. This measure is calculated by dividing the net present value of the cost of the option by the cumulative GHG reductions, all for the period 2007–2020.
In some cases, there is a wide variation in the cost effectiveness of mitigation options depending on the assumptions used in the analysis. As an example, option TLU-5 (Tailpipe GHG Standards) recommends that North Carolina adopt California GHG emissions standards for light-duty vehicles to reduce GHG emissions (also known as the Pavley standards). California standards require GHG emissions reductions of about 30% from new vehicles, phased in from 2009 to 2016, through a variety of means. The California Air Resources Board (CARB) estimated that the cost of compliance in a new vehicle in model year 2016 would be approximately $1,000. To determine the net impact on consumers, CARB calculated the increase in monthly loan payments versus the savings from reduced fuel consumption. Their net resulting estimate is that consumers would achieve a net savings, starting at the time of purchase, of approximately $3.50 to $7.00 / month.
In contrast, automobile manufacturers estimate that the California standards would cost around $3,000 per vehicle, and calculated that savings on fuel would offset less than half of that cost for consumers. A review of the literature and assumptions used to derive the different estimates gives a range of cost-effectiveness values of –$38 to –$117 per ton of CO2e reduced. That is, for each ton reduced, between $38 and $117 would be saved. More than ten other states have adopted the California standards and, among other factors that support the use of a savings estimate toward the higher end of the range, manufacturers should realize economies-of-scale that would lower manufacturing costs as additional states adopt and implement the standards. Although we believe that savings are likely to be higher than the –$38 per ton end of the range,
1-15

we use a cost-effectiveness of –$38 per ton of CO2e reduced in our calculations in an effort to be conservative.
Note that this option cannot be implemented until any pending law suits are settled and the US Environmental Protection Agency issues a waiver under the Clean Air Act authorizing California to implement the standards. This may take some months.
Figure 1-3. CAPAG Mitigation Option Recommendations Ranked by Cumulative GHG Reductions, 2007–2020
1-16
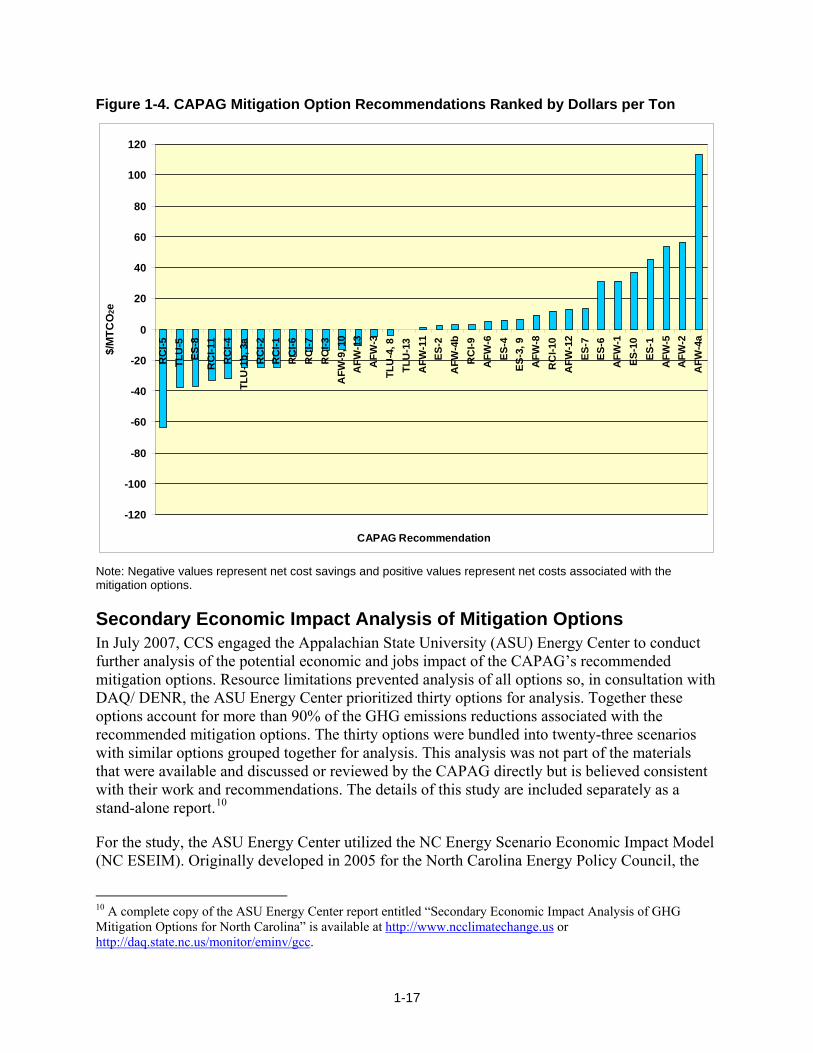
Figure 1-4. CAPAG Mitigation Option Recommendations Ranked by Dollars per Ton
CAPAG Recommendation
-120
-100
-80
-60
-40
-20
0
20
40
60
80
100
120R
CI-5
TLU
-5ES
-8R
CI-1
1R
CI-4
TLU
-1b,
3a
RC
I-2R
CI-1
RC
I-6R
CI-7
RC
I-3A
FW-9
, 10
AFW
-13
AFW
-3TL
U-4
, 8TL
U-1
3A
FW-1
1ES
-2A
FW-4
bR
CI-9
AFW
-6ES
-4ES
-3, 9
AFW
-8R
CI-1
0A
FW-1
2ES
-7ES
-6A
FW-1
ES-1
0ES
-1A
FW-5
AFW
-2A
FW-4
a
$/M
TCO
2e
Note: Negative values represent net cost savings and positive values represent net costs associated with the mitigation options.
Secondary Economic Impact Analysis of Mitigation Options In July 2007, CCS engaged the Appalachian State University (ASU) Energy Center to conduct further analysis of the potential economic and jobs impact of the CAPAG’s recommended mitigation options. Resource limitations prevented analysis of all options so, in consultation with DAQ/ DENR, the ASU Energy Center prioritized thirty options for analysis. Together these options account for more than 90% of the GHG emissions reductions associated with the recommended mitigation options. The thirty options were bundled into twenty-three scenarios with similar options grouped together for analysis. This analysis was not part of the materials that were available and discussed or reviewed by the CAPAG directly but is believed consistent with their work and recommendations. The details of this study are included separately as a stand-alone report.10
For the study, the ASU Energy Center utilized the NC Energy Scenario Economic Impact Model (NC ESEIM). Originally developed in 2005 for the North Carolina Energy Policy Council, the
10 A complete copy of the ASU Energy Center report entitled “Secondary Economic Impact Analysis of GHG Mitigation Options for North Carolina” is available at http://www.ncclimatechange.us or http://daq.state.nc.us/monitor/eminv/gcc.
1-17
peer-reviewed model assesses the impacts of various energy policies on the North Carolina economy, measured in terms of employment, employee and proprietor compensation (income), and the incomes earned by labor and capital (gross state product).
At the core of the NC ESEIM is an input-output economic impact model that estimates how a given change in public policy might result in positive or negative impacts to the economy. Input-output analysis conceives of the economy as a set of interrelated sectors where the consumption of finished goods and services, or final demand, catalyzes a chain reaction of production. As final demand for goods and services change, the upstream sectors in the economy respond accordingly, creating a ripple or multiplier effect. The economic multipliers in the NC ESEIM are derived from data published by the Minnesota IMPLAN Group.11
This approach is distinguishable from the approach undertaken by the CAPAG. The CAPAG sought to quantify the direct costs and cost savings borne by those entities implementing an option to mitigate GHG emissions. The quantified costs were subtracted from the quantified cost savings to produce a “net direct cost.” Building on the work of the CAPAG, the ASU Energy Center sought to measure the full multiplier effect of both positive and negative changes in final demand resulting from a given option. Moreover, the secondary analysis considers the relative effect of an option on all of the affected sectors of the state's economy.12 Therefore, the ASU Energy Center report should be considered a complement to the CAPAG report that seeks to identify the likely ancillary effects of implementing a given option.
While more sophisticated econometric models exist, input-output analysis is typically a reasonable approximation of the economic impacts associated with the type of modest policy changes considered by the CAPAG. Moreover, numerous national, regional, and state-level studies, including reports for Florida, Maryland, and Texas, utilize a similar approach in estimating the potential economic impacts of changes in energy policy.13
The NC ESEIM, as well as its application in the Secondary Economic Impact Analysis, has undergone extensive peer-review. An initial review of the model was performed by Adam Rose, Ph.D., Economist and Research Professor at the University of Southern California (Rose and Wei 2005). Dr. Rose also coordinated an anonymous peer review of the Secondary Economic Impact Analysis during the summer of 2008. Based on these comments the Energy Center has made a number of refinements to the underlying methodology so as to fully and properly account for the potential implications of the options analyzed.14
11 Minnesota IMPLAN Group, Inc. (2005). North Carolina State Data Package, 2004.Stillwater, MN, Minnesota IMPLAN Group, Inc. The Minnesota IMPLAN Group (www.implan.com) is the developer of IMPLAN Professional, a computer software application for conducting input-output economic analysis in use by more than 1,000 public and private institutions. 12 For a more detailed overview of the analytical approach used by the NC ESEIM please refer to Chapter 1 of the ASU Energy Center Report. 13 See Laitner, J.A. 2008. "Positive Returns: State Energy Efficiency Analyses Can Inform U.S. Energy Policy Assessments." American Council for and Energy Efficient Economy, at http://www.aceee.org/. 14 For a complete discussion of the methodological refinements made as a result the peer review process please refer to Appendix C of the ASU Energy Center Report.
1-18
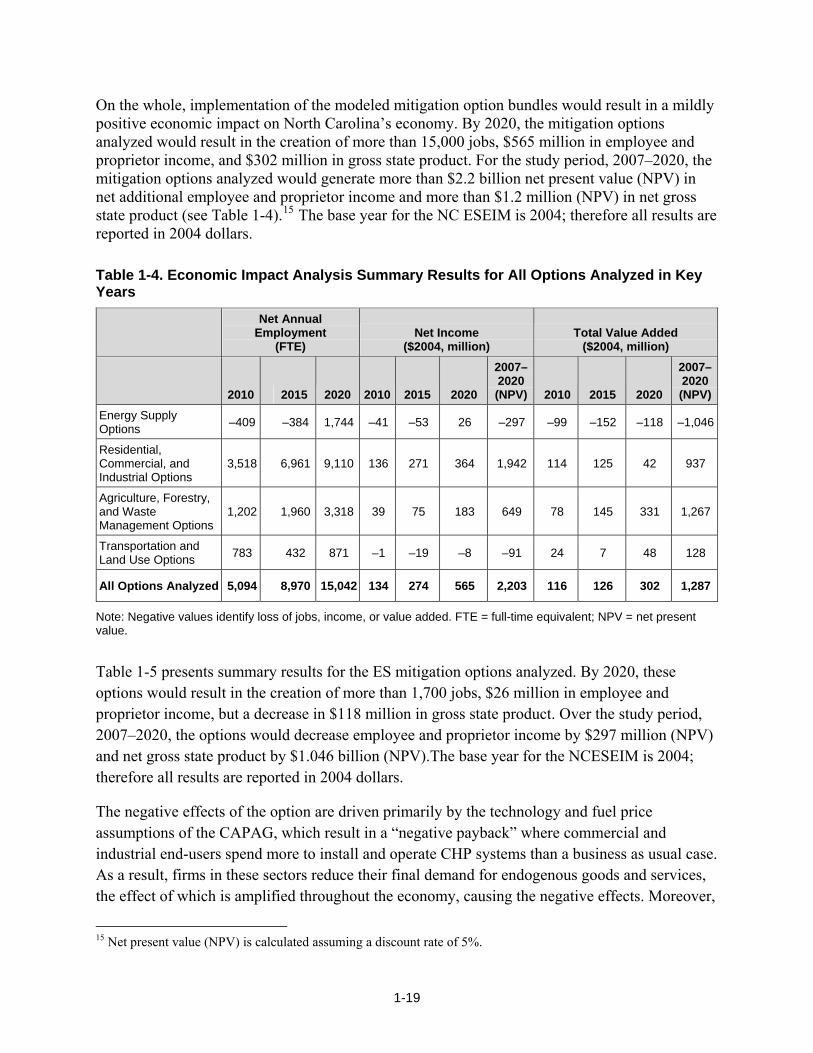
On the whole, implementation of the modeled mitigation option bundles would result in a mildly positive economic impact on North Carolina’s economy. By 2020, the mitigation options analyzed would result in the creation of more than 15,000 jobs, $565 million in employee and proprietor income, and $302 million in gross state product. For the study period, 2007–2020, the mitigation options analyzed would generate more than $2.2 billion net present value (NPV) in net additional employee and proprietor income and more than $1.2 million (NPV) in net gross state product (see Table 1-4).15 The base year for the NC ESEIM is 2004; therefore all results are reported in 2004 dollars.
Table 1-4. Economic Impact Analysis Summary Results for All Options Analyzed in Key Years
Net Annual Employment
(FTE) Net Income
($2004, million) Total Value Added
($2004, million)
2010 2015 2020 2010 2015 2020
2007–2020(NPV) 2010 2015 2020
2007–2020(NPV)
Energy Supply Options –409 –384 1,744 –41 –53 26 –297 –99 –152 –118 –1,046
Residential, Commercial, and Industrial Options
3,518 6,961 9,110 136 271 364 1,942 114 125 42 937
Agriculture, Forestry, and Waste Management Options
1,202 1,960 3,318 39 75 183 649 78 145 331 1,267
Transportation and Land Use Options 783 432 871 –1 –19 –8 –91 24 7 48 128
All Options Analyzed 5,094 8,970 15,042 134 274 565 2,203 116 126 302 1,287
Note: Negative values identify loss of jobs, income, or value added. FTE = full-time equivalent; NPV = net present value.
Table 1-5 presents summary results for the ES mitigation options analyzed. By 2020, these options would result in the creation of more than 1,700 jobs, $26 million in employee and proprietor income, but a decrease in $118 million in gross state product. Over the study period, 2007–2020, the options would decrease employee and proprietor income by $297 million (NPV) and net gross state product by $1.046 billion (NPV).The base year for the NCESEIM is 2004; therefore all results are reported in 2004 dollars.
The negative effects of the option are driven primarily by the technology and fuel price assumptions of the CAPAG, which result in a “negative payback” where commercial and industrial end-users spend more to install and operate CHP systems than a business as usual case. As a result, firms in these sectors reduce their final demand for endogenous goods and services, the effect of which is amplified throughout the economy, causing the negative effects. Moreover,
15 Net present value (NPV) is calculated assuming a discount rate of 5%.
1-19
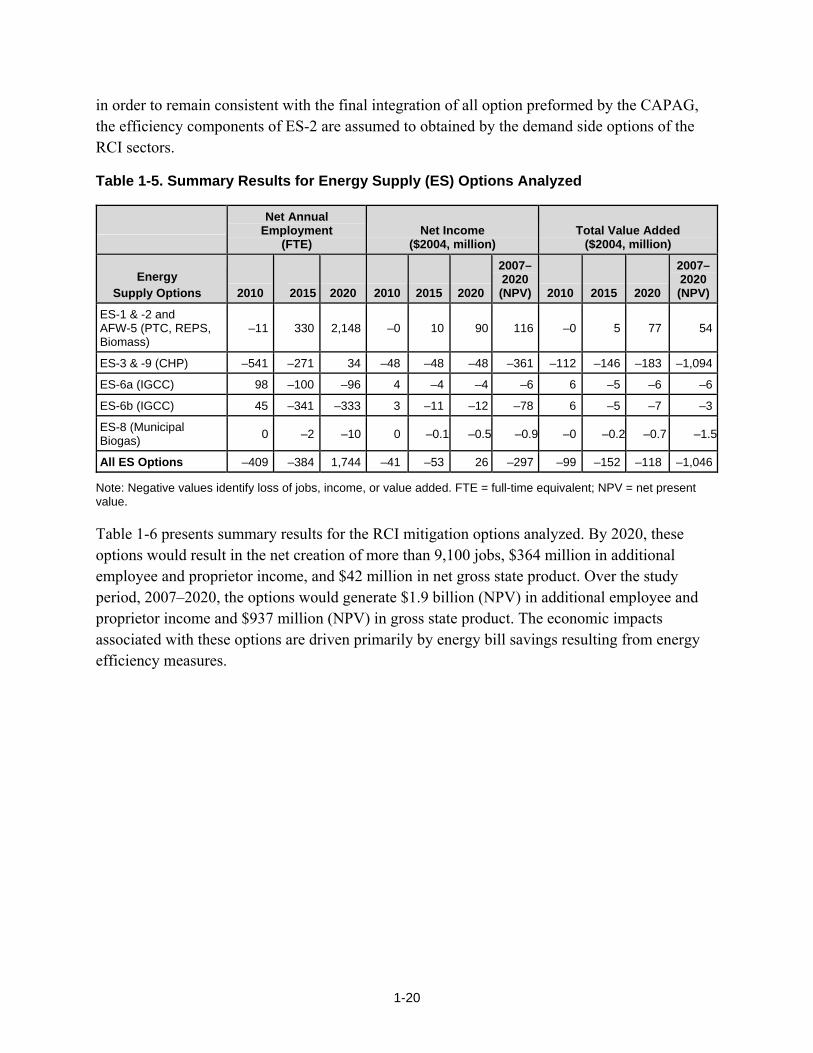
in order to remain consistent with the final integration of all option preformed by the CAPAG, the efficiency components of ES-2 are assumed to obtained by the demand side options of the RCI sectors.
Table 1-5. Summary Results for Energy Supply (ES) Options Analyzed
Net Annual Employment
(FTE) Net Income
($2004, million) Total Value Added
($2004, million)
Energy Supply Options 2010 2015 2020 2010 2015 2020
2007–2020(NPV) 2010 2015 2020
2007–2020(NPV)
ES-1 & -2 and AFW-5 (PTC, REPS, Biomass)
–11 330 2,148 –0 10 90 116 –0 5 77 54
ES-3 & -9 (CHP) –541 –271 34 –48 –48 –48 –361 –112 –146 –183 –1,094
ES-6a (IGCC) 98 –100 –96 4 –4 –4 –6 6 –5 –6 –6
ES-6b (IGCC) 45 –341 –333 3 –11 –12 –78 6 –5 –7 –3
ES-8 (Municipal Biogas) 0 –2 –10 0 –0.1 –0.5 –0.9 –0 –0.2 –0.7 –1.5
All ES Options –409 –384 1,744 –41 –53 26 –297 –99 –152 –118 –1,046
Note: Negative values identify loss of jobs, income, or value added. FTE = full-time equivalent; NPV = net present value.
Table 1-6 presents summary results for the RCI mitigation options analyzed. By 2020, these options would result in the net creation of more than 9,100 jobs, $364 million in additional employee and proprietor income, and $42 million in net gross state product. Over the study period, 2007–2020, the options would generate $1.9 billion (NPV) in additional employee and proprietor income and $937 million (NPV) in gross state product. The economic impacts associated with these options are driven primarily by energy bill savings resulting from energy efficiency measures.
1-20
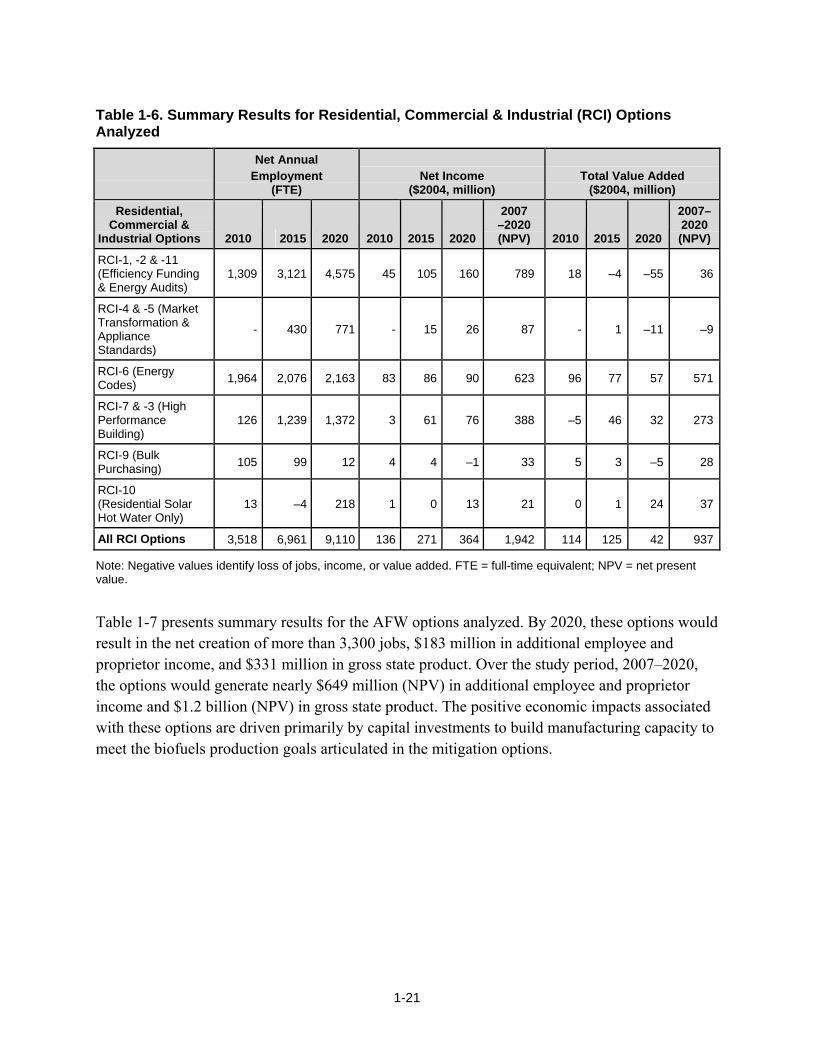
Table 1-6. Summary Results for Residential, Commercial & Industrial (RCI) Options Analyzed
Net Annual Employment
(FTE) Net Income
($2004, million) Total Value Added
($2004, million)
Residential, Commercial &
Industrial Options 2010 2015 2020 2010 2015 2020
2007 –2020 (NPV) 2010 2015 2020
2007–2020(NPV)
RCI-1, -2 & -11 (Efficiency Funding & Energy Audits)
1,309 3,121 4,575 45 105 160 789 18 –4 –55 36
RCI-4 & -5 (Market Transformation & Appliance Standards)
- 430 771 - 15 26 87 - 1 –11 –9
RCI-6 (Energy Codes) 1,964 2,076 2,163 83 86 90 623 96 77 57 571
RCI-7 & -3 (High Performance Building)
126 1,239 1,372 3 61 76 388 –5 46 32 273
RCI-9 (Bulk Purchasing) 105 99 12 4 4 –1 33 5 3 –5 28
RCI-10 (Residential Solar Hot Water Only)
13 –4 218 1 0 13 21 0 1 24 37
All RCI Options 3,518 6,961 9,110 136 271 364 1,942 114 125 42 937
Note: Negative values identify loss of jobs, income, or value added. FTE = full-time equivalent; NPV = net present value.
Table 1-7 presents summary results for the AFW options analyzed. By 2020, these options would result in the net creation of more than 3,300 jobs, $183 million in additional employee and proprietor income, and $331 million in gross state product. Over the study period, 2007–2020, the options would generate nearly $649 million (NPV) in additional employee and proprietor income and $1.2 billion (NPV) in gross state product. The positive economic impacts associated with these options are driven primarily by capital investments to build manufacturing capacity to meet the biofuels production goals articulated in the mitigation options.
1-21

Table 1-7. Summary Results for Agriculture, Forestry, and Waste Management (AFW) Options
Net Annual Employment
(FTE) Net Income
($2004, million) Total Value Added
($2004, million)
Agriculture, Forestry, and Waste Management Options 2010 2015 2020 2010 2015 2020
2007–2020(NPV) 2010 2015 2020
2007–2020 (NPV)
AFW-1 (Manure Digesters) 51 48 53 2 2 2 19 3 2 2 24
AFW-2 (Biodiesel) 51 48 53 –6 –12 10 –72 –7 –15 17 –85
AFW-4a & -4b (Easements) 2 –4 3 –.2 –1 –1 –4 1 2 4 18
AFW-6 (Cellulosic Ethanol) 547 1,399 2,781 23 74 163 547 43 135 298 1,016
AFW-8 (Afforestation) –13 –45 66 –1 –2 4 –9 –1 –3 8 –8
AFW-9 & -10 (Forest Management) –9 –33 –48 –2 –6 –9 –41 –.1 –.3 –.4 –2
AFW-11 (Landfill Gas) –6 –24 –5 –.1 –1 0.4 –2 1 –.3 2 4
AFW-12 (Recycling) 1 2 6 .1 .1 .3 2 .3 .3 1 3
AFW-13 (Urban Forestry) 566 524 475 22 19 17 106 37 22 8 115
All AFW Options 1,202 1,960 3,318 39 75 183 649 78 145 331 1,267
Note: Negative values identify loss of jobs, income, or value added. FTE = full-time equivalent; NPV = net present value.
Table 1-8 presents summary results for the TLU mitigation options analyzed. By 2020, these options would result in the creation of more than 870 net jobs and $48 million in net gross state product but the loss of $8 million in employee and proprietor income. Over the study period, 2007–2020, the options would generate $128 million (NPV) in gross state product but the loss of $91 million (NPV) in employee and proprietor income. The bulk of the positive economic impacts associated with these options are driven by consumer re-spending of reduced vehicle operating costs.
The negative impacts associated with TLU-5 are largely the result of the relative effect of reduced vehicle operating costs versus the displacement of retail gasoline sales. While TLU-5 results in a net savings to vehicle owners, the positive multiplier effect of these savings do not outweigh the constrictive multiplier effect of displaced retail gasoline sales. However, it should be noted that the modeling assumptions of this option are intentionally conservative. For example, it assumes as the U.S. Energy Information Administration’s 2007 regional retail fuel price forecast for gasoline, which averages $2.21 per gallon over the study period and is considerably lower than the current market prices. Variability in the baseline fuel price
1-22

assumption is considered and discussed in a set of sensitivity analyses in Chapter 6 of the ASU Report. These sensitivities suggest that if energy prices remain at, or near, their recent highs then vehicle greenhouse emissions standards would result in substantial positive economic impacts.
Table 1-8. Summary Results for Transportation and Land Use (TLU) Options Analyzed
Net Annual Employment
(FTE) Net Income
($2004, million) Total Value Added
($2004, million)
Transportation and Land Use Options 2010 2015 2020 2010 2015 2020
2007–2020(NPV) 2010 2015 2020
2007–2020 (NPV)
TLU-1b (Shift to Transit Spending) 98 127 252 –29 –31 –27 –213 –23 –26 –19 –173
TLU-3a (Registration Surcharge for Transit Spending)
718 646 632 30 28 28 205 49 45 46 332
TLU-5 (CO2 Tailpipe Standard) –32 –341 –14 –1 –17 –9 –83 –2 –12 21 –31
All TLU Options 783 432 871 –1 –19 –8 –91 24 7 48 128
Note: Negative values identify loss of jobs, income, or value added. FTE = full-time equivalent; NPV = net present value.
Potential Investment Costs Associated with Mitigation Options At its October 16, 2007 meeting, the CAPAG requested a summary of the potential annual upfront public and private investments associated with the mitigation options. These results are summarized in Table 1-9. The potential annual investment costs associated with the options are based on the methods used to estimate the costs or cost savings of each option analyzed during the CAPAG process, and supplemental research conducted by the Appalachian State University (ASU) Energy Center. 16
While implementation of some of the mitigation options may require significant upfront investments of public and/or private resources, these investments, in many cases, also result in significant savings over time. Moreover, many of the mitigation options result in ongoing savings beyond the period included in the CAPAG and ASU Energy Center analyses. Finally, almost all of these initial investment costs will be financed over time reducing the actual annual costs borne by the public and private sectors.
Consider for example TLU-5 (Tailpipe GHG Standards). As noted above, this mitigation option would require automakers to install additional pollution control technologies increasing the purchase price of a new vehicle and monthly car payments. However, these same pollution control technologies will increase fuel economy and reduce the vehicle operating expenses, which tend to offset the increased purchase price.
16 Documentation of the methods used to develop estimates of the upfront investment costs is provided in the ASU Energy Center’s report “Secondary Economic Impact Analysis of GHG Mitigation Options for North Carolina,” at http://www.ncclimatechange.us or http://daq.state.nc.us/monitor/eminv/gcc.
1-23
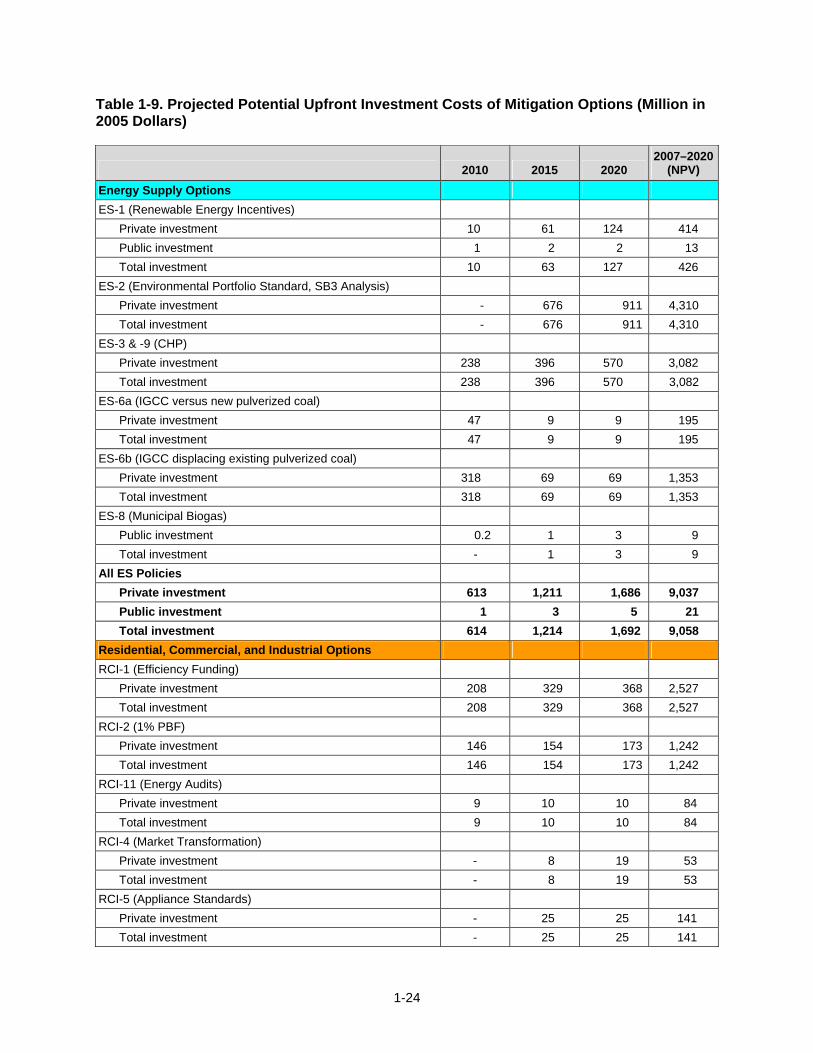
Table 1-9. Projected Potential Upfront Investment Costs of Mitigation Options (Million in 2005 Dollars)
2010 2015 2020 2007–2020
(NPV) Energy Supply Options ES-1 (Renewable Energy Incentives)
Private investment 10 61 124 414 Public investment 1 2 2 13 Total investment 10 63 127 426
ES-2 (Environmental Portfolio Standard, SB3 Analysis) Private investment - 676 911 4,310 Total investment - 676 911 4,310
ES-3 & -9 (CHP) Private investment 238 396 570 3,082 Total investment 238 396 570 3,082
ES-6a (IGCC versus new pulverized coal) Private investment 47 9 9 195 Total investment 47 9 9 195
ES-6b (IGCC displacing existing pulverized coal) Private investment 318 69 69 1,353 Total investment 318 69 69 1,353
ES-8 (Municipal Biogas) Public investment 0.2 1 3 9 Total investment - 1 3 9
All ES Policies Private investment 613 1,211 1,686 9,037 Public investment 1 3 5 21 Total investment 614 1,214 1,692 9,058
Residential, Commercial, and Industrial Options RCI-1 (Efficiency Funding)
Private investment 208 329 368 2,527 Total investment 208 329 368 2,527
RCI-2 (1% PBF) Private investment 146 154 173 1,242 Total investment 146 154 173 1,242
RCI-11 (Energy Audits) Private investment 9 10 10 84 Total investment 9 10 10 84
RCI-4 (Market Transformation) Private investment - 8 19 53 Total investment - 8 19 53
RCI-5 (Appliance Standards) Private investment - 25 25 141 Total investment - 25 25 141
1-24
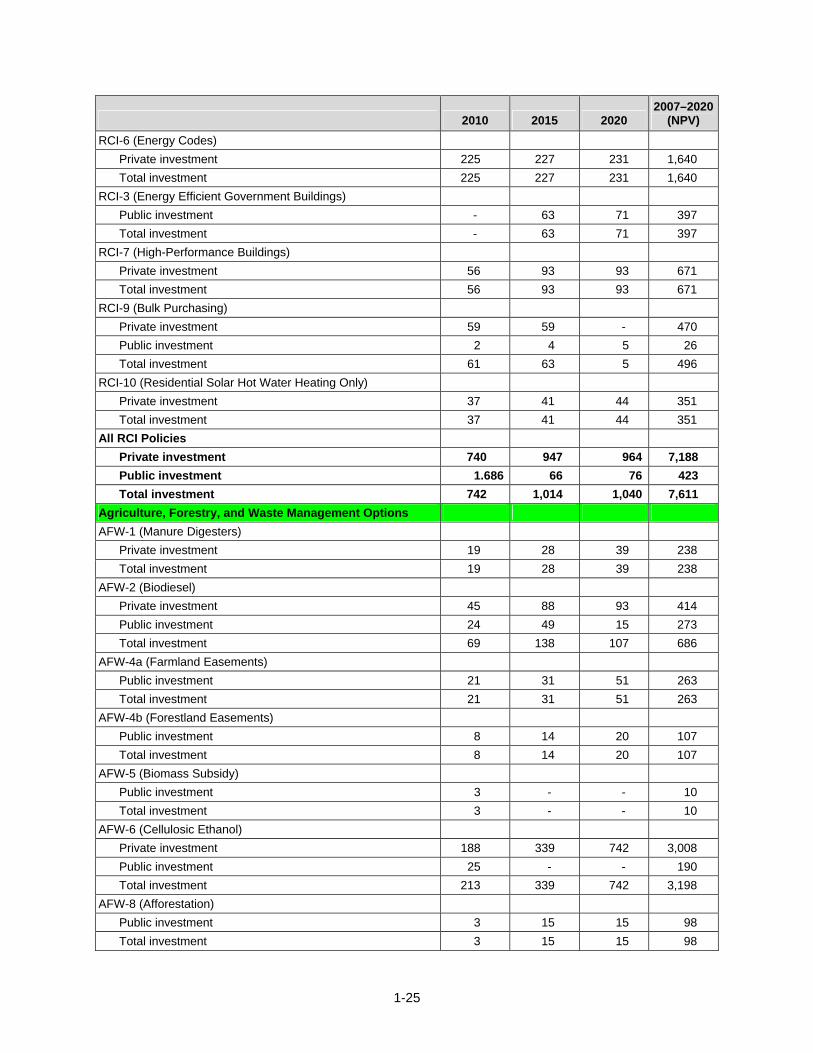
2007–2020 2010 2015 2020 (NPV)
RCI-6 (Energy Codes) Private investment 225 227 231 1,640 Total investment 225 227 231 1,640
RCI-3 (Energy Efficient Government Buildings) Public investment - 63 71 397 Total investment - 63 71 397
RCI-7 (High-Performance Buildings) Private investment 56 93 93 671 Total investment 56 93 93 671
RCI-9 (Bulk Purchasing) Private investment 59 59 - 470 Public investment 2 4 5 26 Total investment 61 63 5 496
RCI-10 (Residential Solar Hot Water Heating Only) Private investment 37 41 44 351 Total investment 37 41 44 351
All RCI Policies Private investment 740 947 964 7,188 Public investment 1.686 66 76 423 Total investment 742 1,014 1,040 7,611
Agriculture, Forestry, and Waste Management Options AFW-1 (Manure Digesters)
Private investment 19 28 39 238 Total investment 19 28 39 238
AFW-2 (Biodiesel) Private investment 45 88 93 414 Public investment 24 49 15 273 Total investment 69 138 107 686
AFW-4a (Farmland Easements) Public investment 21 31 51 263 Total investment 21 31 51 263
AFW-4b (Forestland Easements) Public investment 8 14 20 107 Total investment 8 14 20 107
AFW-5 (Biomass Subsidy) Public investment 3 - - 10 Total investment 3 - - 10
AFW-6 (Cellulosic Ethanol) Private investment 188 339 742 3,008 Public investment 25 - - 190 Total investment 213 339 742 3,198
AFW-8 (Afforestation) Public investment 3 15 15 98 Total investment 3 15 15 98
1-25

1-26
2010 2015 2020 2007–2020
(NPV) AFW-9 & -10 (Forest Management)
Public investment 16 54 78 358 Total investment 16 54 78 358
AFW-11 (Landfill Gas) Private investment 12 12 15 112 Total investment 12 12 15 112
AFW-12 (Recycling) Private investment 6 10 15 79 Total investment 6 10 15 79
AFW-13 (Urban Forestry) Private investment 96 84 76 896 Total investment 96 84 76 896
All AFW Policies Private investment 382 616 1,057 5,105 Public investment 81 167 255 1,353 Total investment 463 784 1,312 6,459
Transportation and Land Use Options TLU-1b (Shift to Transit Spending)
Public investment 347 347 347 2,487 Total investment 347 347 347 2,487
TLU-3a (Registration Surcharge for Transit $) Public investment 33 33 33 239 Total investment 33 33 33 239
TLU-5 (CO2 Tailpipe Standard) Private investment 26 401 553 2,341 Total investment 26 401 553 2,341
All TLU Options Private investment 26 401 553 2,702 Public investment 380 380 380 3,156 Total investment 406 781 933 5,858
NPV = net present value (calculated assuming a discount rate of 5%); SB = Senate Bill; CHP = combined heat and power; IGCC = integrated gasification combined cycle; PBF = Public Benefits Fund; CO2 = carbon dioxide.
2-1
Chapter 2 Inventory and Projections of GHG Emissions
Introduction This chapter presents a summary of North Carolina’s anthropogenic greenhouse gas (GHG) emissions and sinks (carbon storage) from 1990 to 2020. The Center for Climate Strategies (CCS) prepared a preliminary draft of North Carolina’s GHG emissions and reference case projections under contract to the North Carolina Department of Environment and Natural Resources’ (DENR) Division of Air Quality (DAQ).1 The preliminary draft inventory and reference case projections, completed in February 2006, provided DENR/DAQ with an initial, comprehensive understanding of current and possible future GHG emissions. The preliminary draft report was provided to the North Carolina Climate Action Plan Advisory Group (CAPAG) (and its Technical Work Groups [TWGs]) to assist the CAPAG in understanding past, current, and possible future GHG emissions in North Carolina and thereby inform the mitigation option development process. The CAPAG and the TWGs also provided comments for improving the reference case projections. Subsequently, the inventory and reference case projection estimates were revised to incorporate revisions approved by the CAPAG. The information presented in this chapter reflects the information presented in the final inventory and reference case projections report (hereafter referred to as the Inventory and Projections).2
Historical GHG emissions estimates (1990 through 2005)3 were developed using a set of generally accepted principles and guidelines for state GHG emissions, relying to the extent possible on North Carolina–specific data and inputs. The initial reference case projections (2006–2020) are based on a compilation of various existing North Carolina projections of electricity generation, fuel use, and other GHG-emitting activities, along with a set of simple, transparent assumptions described in the appendixes of the Inventory and Projections report.
The Inventory and Projections covers the six types of gases included in the U.S. Greenhouse Gas Inventory: carbon dioxide (CO2), methane (CH4), nitrous oxide (N2O), hydrofluorocarbons (HFCs), perfluorocarbons (PFCs), and sulfur hexafluoride (SF6). Emissions of these GHGs are presented using a common metric, CO2 equivalence (CO2e), which indicates the relative contribution of each gas, per unit mass, to global average radiative forcing on a global warming potential– (GWP–) weighted basis.
It is important to note that the emissions estimates reflect the GHG emissions associated with the electricity sources used to meet North Carolina’s demands, corresponding to a consumption-based approach to emissions accounting. Another way to look at electricity emissions is to consider the GHG emissions produced by electricity generation facilities in the state. This report
1 Revised Draft North Carolina Greenhouse Gas Inventory and Reference Case Projections, 1990–2020, prepared by the Center for Climate Strategies for the North Carolina DENR/DAQ, February 2006. 2 Final North Carolina Greenhouse Gas Inventory and Reference Case Projections, 1990–2020, prepared by the Center for Climate Strategies for the North Carolina DENR/DAQ, September 2007. 3 The last year of available historical data varies by sector, ranging from 2000 to 2004.
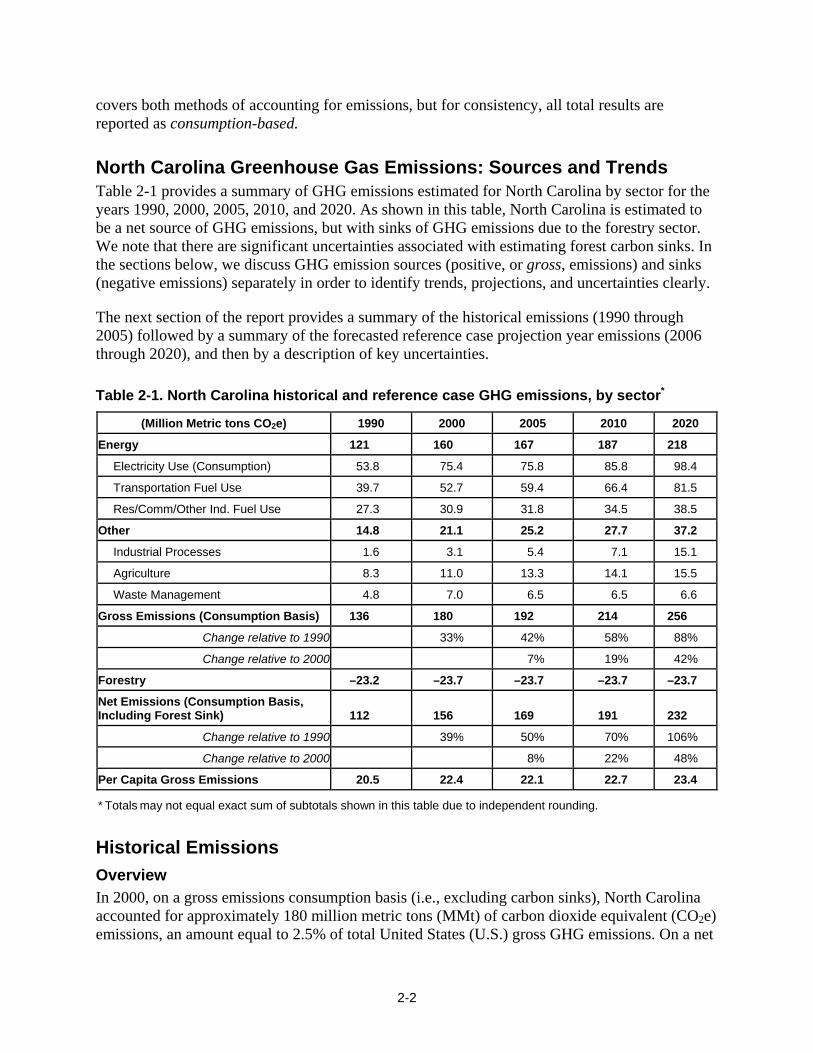
2-2
covers both methods of accounting for emissions, but for consistency, all total results are reported as consumption-based.
North Carolina Greenhouse Gas Emissions: Sources and Trends Table 2-1 provides a summary of GHG emissions estimated for North Carolina by sector for the years 1990, 2000, 2005, 2010, and 2020. As shown in this table, North Carolina is estimated to be a net source of GHG emissions, but with sinks of GHG emissions due to the forestry sector. We note that there are significant uncertainties associated with estimating forest carbon sinks. In the sections below, we discuss GHG emission sources (positive, or gross, emissions) and sinks (negative emissions) separately in order to identify trends, projections, and uncertainties clearly.
The next section of the report provides a summary of the historical emissions (1990 through 2005) followed by a summary of the forecasted reference case projection year emissions (2006 through 2020), and then by a description of key uncertainties.
Table 2-1. North Carolina historical and reference case GHG emissions, by sector*
(Million Metric tons CO2e) 1990 2000 2005 2010 2020
Energy 121 160 167 187 218
Electricity Use (Consumption) 53.8 75.4 75.8 85.8 98.4
Transportation Fuel Use 39.7 52.7 59.4 66.4 81.5
Res/Comm/Other Ind. Fuel Use 27.3 30.9 31.8 34.5 38.5
Other 14.8 21.1 25.2 27.7 37.2
Industrial Processes 1.6 3.1 5.4 7.1 15.1
Agriculture 8.3 11.0 13.3 14.1 15.5
Waste Management 4.8 7.0 6.5 6.5 6.6
Gross Emissions (Consumption Basis) 136 180 192 214 256
Change relative to 1990 33% 42% 58% 88%
Change relative to 2000 7% 19% 42%
Forestry –23.2 –23.7 –23.7 –23.7 –23.7
Net Emissions (Consumption Basis, Including Forest Sink) 112 156 169 191 232
Change relative to 1990 39% 50% 70% 106%
Change relative to 2000 8% 22% 48%
Per Capita Gross Emissions 20.5 22.4 22.1 22.7 23.4 * Totals may not equal exact sum of subtotals shown in this table due to independent rounding.
Historical Emissions Overview In 2000, on a gross emissions consumption basis (i.e., excluding carbon sinks), North Carolina accounted for approximately 180 million metric tons (MMt) of carbon dioxide equivalent (CO2e) emissions, an amount equal to 2.5% of total United States (U.S.) gross GHG emissions. On a net
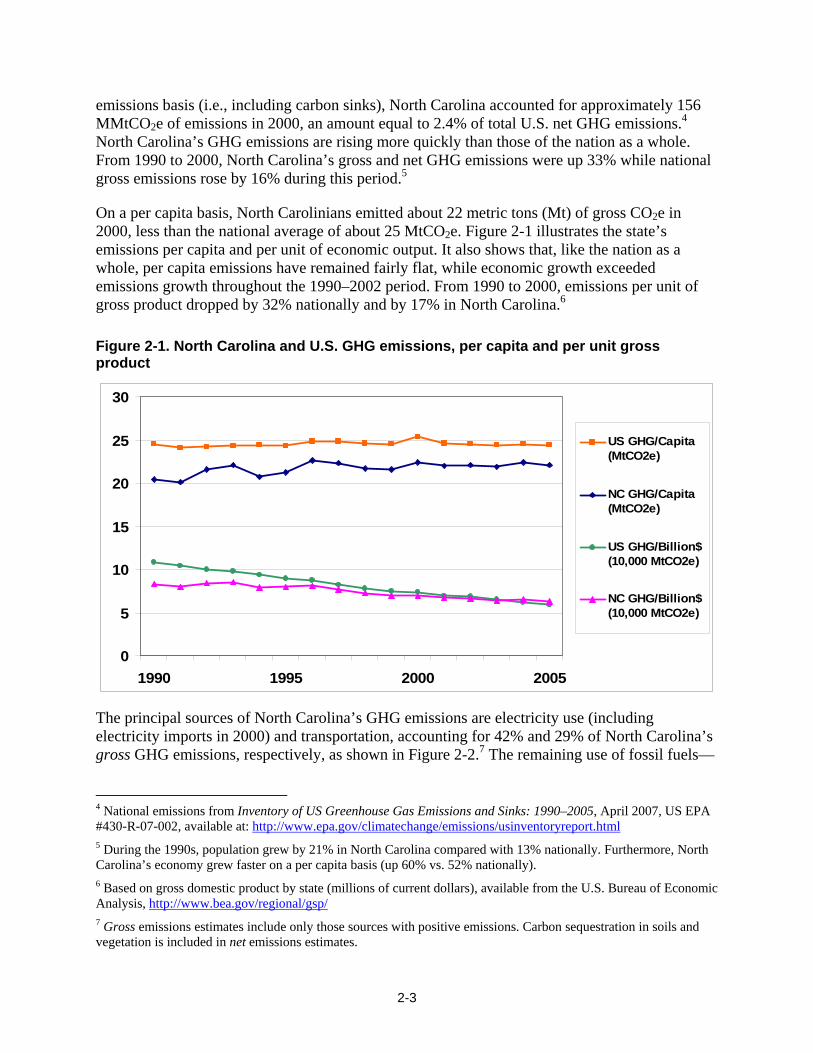
2-3
emissions basis (i.e., including carbon sinks), North Carolina accounted for approximately 156 MMtCO2e of emissions in 2000, an amount equal to 2.4% of total U.S. net GHG emissions.4 North Carolina’s GHG emissions are rising more quickly than those of the nation as a whole. From 1990 to 2000, North Carolina’s gross and net GHG emissions were up 33% while national gross emissions rose by 16% during this period.5
On a per capita basis, North Carolinians emitted about 22 metric tons (Mt) of gross CO2e in 2000, less than the national average of about 25 MtCO2e. Figure 2-1 illustrates the state’s emissions per capita and per unit of economic output. It also shows that, like the nation as a whole, per capita emissions have remained fairly flat, while economic growth exceeded emissions growth throughout the 1990–2002 period. From 1990 to 2000, emissions per unit of gross product dropped by 32% nationally and by 17% in North Carolina.6
Figure 2-1. North Carolina and U.S. GHG emissions, per capita and per unit gross product
0
5
10
15
20
25
30
1990 1995 2000 2005
US GHG/Capita(MtCO2e)
NC GHG/Capita(MtCO2e)
US GHG/Billion$ (10,000 MtCO2e)
NC GHG/Billion$ (10,000 MtCO2e)
The principal sources of North Carolina’s GHG emissions are electricity use (including electricity imports in 2000) and transportation, accounting for 42% and 29% of North Carolina’s gross GHG emissions, respectively, as shown in Figure 2-2.7 The remaining use of fossil fuels—
4 National emissions from Inventory of US Greenhouse Gas Emissions and Sinks: 1990–2005, April 2007, US EPA #430-R-07-002, available at: http://www.epa.gov/climatechange/emissions/usinventoryreport.html 5 During the 1990s, population grew by 21% in North Carolina compared with 13% nationally. Furthermore, North Carolina’s economy grew faster on a per capita basis (up 60% vs. 52% nationally). 6 Based on gross domestic product by state (millions of current dollars), available from the U.S. Bureau of Economic Analysis, http://www.bea.gov/regional/gsp/ 7 Gross emissions estimates include only those sources with positive emissions. Carbon sequestration in soils and vegetation is included in net emissions estimates.
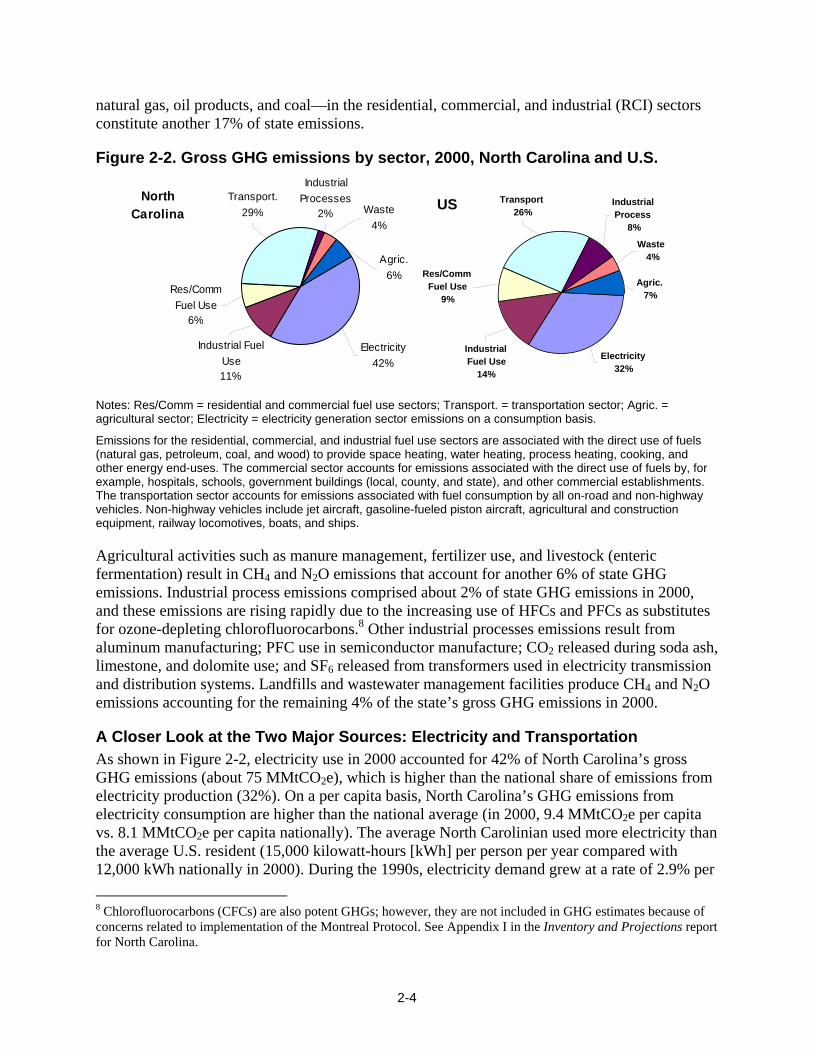
2-4
natural gas, oil products, and coal—in the residential, commercial, and industrial (RCI) sectors constitute another 17% of state emissions.
Figure 2-2. Gross GHG emissions by sector, 2000, North Carolina and U.S.
North Carolina Waste
4%
Agric.6%
Industrial Processes
2%
Electricity42%
Transport.29%
Res/Comm Fuel Use
6%
Industrial Fuel Use11%
Notes: Res/Comm = residential and commercial fuel use sectors; Transport. = transportation sector; Agric. = agricultural sector; Electricity = electricity generation sector emissions on a consumption basis.
Emissions for the residential, commercial, and industrial fuel use sectors are associated with the direct use of fuels (natural gas, petroleum, coal, and wood) to provide space heating, water heating, process heating, cooking, and other energy end-uses. The commercial sector accounts for emissions associated with the direct use of fuels by, for example, hospitals, schools, government buildings (local, county, and state), and other commercial establishments. The transportation sector accounts for emissions associated with fuel consumption by all on-road and non-highway vehicles. Non-highway vehicles include jet aircraft, gasoline-fueled piston aircraft, agricultural and construction equipment, railway locomotives, boats, and ships. Agricultural activities such as manure management, fertilizer use, and livestock (enteric fermentation) result in CH4 and N2O emissions that account for another 6% of state GHG emissions. Industrial process emissions comprised about 2% of state GHG emissions in 2000, and these emissions are rising rapidly due to the increasing use of HFCs and PFCs as substitutes for ozone-depleting chlorofluorocarbons.8 Other industrial processes emissions result from aluminum manufacturing; PFC use in semiconductor manufacture; CO2 released during soda ash, limestone, and dolomite use; and SF6 released from transformers used in electricity transmission and distribution systems. Landfills and wastewater management facilities produce CH4 and N2O emissions accounting for the remaining 4% of the state’s gross GHG emissions in 2000.
A Closer Look at the Two Major Sources: Electricity and Transportation As shown in Figure 2-2, electricity use in 2000 accounted for 42% of North Carolina’s gross GHG emissions (about 75 MMtCO2e), which is higher than the national share of emissions from electricity production (32%). On a per capita basis, North Carolina’s GHG emissions from electricity consumption are higher than the national average (in 2000, 9.4 MMtCO2e per capita vs. 8.1 MMtCO2e per capita nationally). The average North Carolinian used more electricity than the average U.S. resident (15,000 kilowatt-hours [kWh] per person per year compared with 12,000 kWh nationally in 2000). During the 1990s, electricity demand grew at a rate of 2.9% per 8 Chlorofluorocarbons (CFCs) are also potent GHGs; however, they are not included in GHG estimates because of concerns related to implementation of the Montreal Protocol. See Appendix I in the Inventory and Projections report for North Carolina.
Electricity 32%
Agric.7%
Res/Comm Fuel Use
9%
Industrial Fuel Use
14%
Transport26%
Waste4%
Industrial Process
8% US

2-5
year, while electricity emissions grew 3.4% annually, reflecting an increase in emissions per kWh.
As noted above, these electricity emissions estimates reflect the GHG emissions associated with the electricity sources used to meet North Carolina demands, corresponding to a consumption-based approach to emissions accounting. For many years, North Carolina power plants have tended to produce less electricity than is consumed in the state; in the year 2000, for example, North Carolina imported 8% of the electricity consumed in the state. As a result, in 2000, emissions associated with electricity consumption (75 MMtCO2e) were higher than those associated with electricity production (70 MMtCO2e).9
While we estimate the emissions from both electricity production and consumption, unless otherwise indicated, tables, figures, and totals in this report reflect electricity consumption emissions. The consumption-based approach can better reflect the emissions (and emissions reductions) associated with activities occurring in the state, particularly with respect to electricity use (and efficiency improvements) and is particularly useful for decision making. Under this approach, emissions associated with electricity exported to other States would need to be covered in those States’ accounts in order to avoid double counting or exclusions.
Like electricity emissions, GHG emissions from transportation fuel use have risen steadily from 1990 to 2005 at an average rate of 2.7% annually. Gasoline-powered vehicles accounted for about 72% of transportation GHG emissions in 2000. Diesel vehicles accounted for another 21% in 2000, air travel for roughly 6%, and the remainder of transportation emissions came from natural gas and liquefied petroleum gas (LPG) vehicles. As a result of North Carolina’s rapid expansion and an increase in miles traveled during the 1990s, gasoline use has grown at a rate of 2.5% annually. Meanwhile, diesel use has risen 4.8% annually, suggesting an even more rapid growth in freight movement within the State.
Reference Case Projections Relying on North Carolina agency projections of electricity and fuel use and other assumptions noted in the Inventory and Projections report, a simple reference case projection of GHG emissions through 2020 was developed. As illustrated in Figure 2-3 and shown numerically in Table 2-1, under the reference case projections, North Carolina’s gross GHG emissions continue to grow steeply, climbing to 256 MMtCO2e by 2020, 88% above 1990 levels. Electricity is projected to be the largest contributor to future emission growth by far, followed by HFCs and PFCs used in place of ozone-depleting substances (ODS), as shown in Figure 2-4. Other major sources of emissions growth include transport (diesel), gasoline, and fuel use in buildings and industry (RCI). For the electricity supply sector, the increase in emissions after 2010 appears largely as the result of emissions associated with natural gas used to generate electricity by facilities in-state and emissions associated with electricity imported into North Carolina to meet North Carolina’s demand for electricity (see Figure 2-5). After 2010, the use of coal and oil to generate electricity in-state is projected to remain at 2010 levels.
9 Estimating the emissions associated with electricity use requires an understanding of the electricity sources (both in-state and out-of-state) used by utilities to meet consumer demand. The current estimate reflects some very simple assumptions described in Appendix A of Inventory and Projections.

2-6
Figure 2-3. North Carolina gross GHG emissions by sector, 1990–2020: historical and projected (consumption-based approach) business as usual/base case
0
50
100
150
200
250
300
1990 1995 2000 2005 2010 2015 2020
MM
tCO
2e
Waste Management Agriculture Other Industrial Proc.ODS Substitutes Transportation Other Air TravelTransportation Diesel Transportation Gasoline RCIElecticity Imports Electricity (In-State Prod.)
Overall, the average annual projected rate of emissions growth in North Carolina is 1.8% per year from the year 2000 to 2020. The increase in emissions after 2010 appears largely as the result of four factors: (1) electricity consumption (including imports) growth at a rate faster than population growth, (2) increasing use of vehicles with vehicle miles traveled (VMT) growing faster than population, (3) freight traffic growing faster than population, and (4) increasing use of HFCs and PFCs as substitutes for ODSs in refrigeration, air conditioning, and other applications. Other sources that are projected to grow faster than population are residential natural gas use, industrial fuel use, gasoline, air travel, and agriculture. Figure 2-6 illustrates how growth in net GHG emissions compares with growth in population and gross state product (GSP) for North Carolina.

2-7
Figure 2-4. Sector contributions to emissions growth in North Carolina, 1990–2020: reference case projections
-5 0 5 10 15 20 25
Agriculture
Waste
Industrial Processes
ODS Substitutes
Air Travel
Transportation Gasoline
Transportation Diesel
Direct Fuel Use (RCI)
Electricity (Consumption Based)
MMtCO2e
1990-2005
2005-2020
Figure 2-5. Emissions from electricity consumption in North Carolina, by fuel source
0
20
40
60
80
100
120
1990 1995 2000 2005 2010 2015 2020
MM
tCO
2
Coal PetroleumNatural gas Imports
Note: Emissions associated with electricity generated from biomass are not shown in this graph because of scale effects. Emissions associated with biomass combustion are estimated to be about 0.03 MMtCO2e from 2003 through 2020.
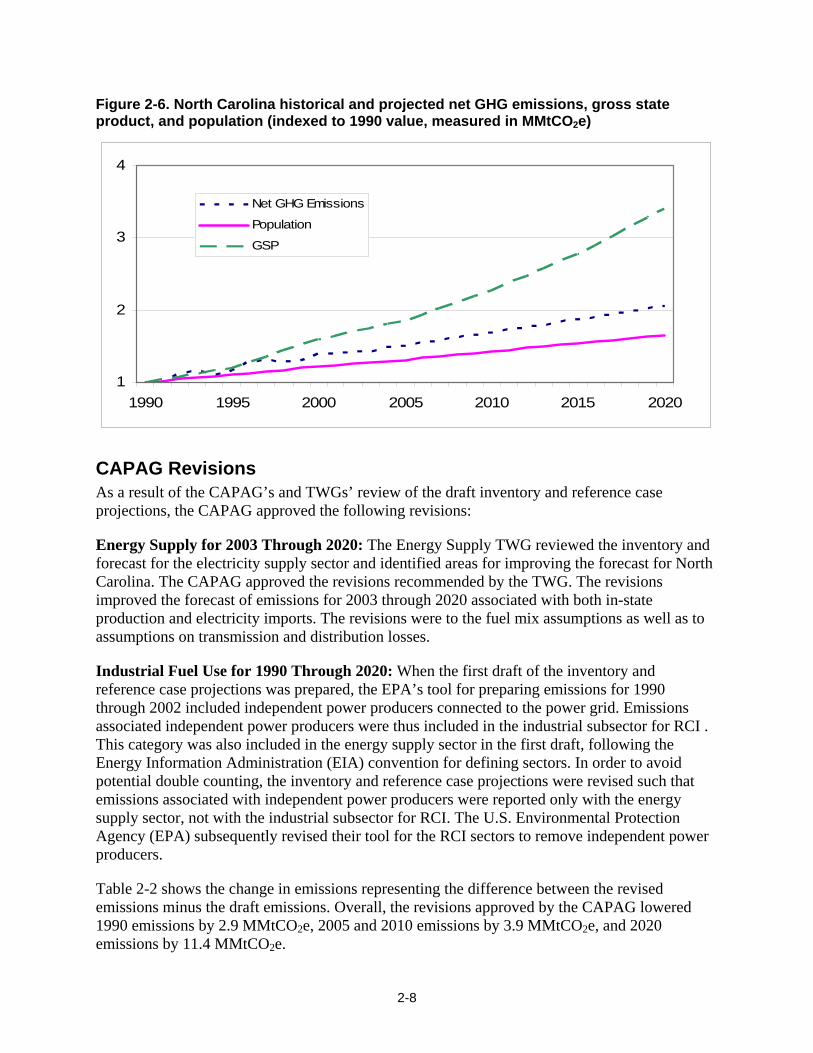
2-8
Figure 2-6. North Carolina historical and projected net GHG emissions, gross state product, and population (indexed to 1990 value, measured in MMtCO2e)
1
2
3
4
1990 1995 2000 2005 2010 2015 2020
Net GHG Emissions
Population
GSP
CAPAG Revisions As a result of the CAPAG’s and TWGs’ review of the draft inventory and reference case projections, the CAPAG approved the following revisions:
Energy Supply for 2003 Through 2020: The Energy Supply TWG reviewed the inventory and forecast for the electricity supply sector and identified areas for improving the forecast for North Carolina. The CAPAG approved the revisions recommended by the TWG. The revisions improved the forecast of emissions for 2003 through 2020 associated with both in-state production and electricity imports. The revisions were to the fuel mix assumptions as well as to assumptions on transmission and distribution losses.
Industrial Fuel Use for 1990 Through 2020: When the first draft of the inventory and reference case projections was prepared, the EPA’s tool for preparing emissions for 1990 through 2002 included independent power producers connected to the power grid. Emissions associated independent power producers were thus included in the industrial subsector for RCI . This category was also included in the energy supply sector in the first draft, following the Energy Information Administration (EIA) convention for defining sectors. In order to avoid potential double counting, the inventory and reference case projections were revised such that emissions associated with independent power producers were reported only with the energy supply sector, not with the industrial subsector for RCI. The U.S. Environmental Protection Agency (EPA) subsequently revised their tool for the RCI sectors to remove independent power producers.
Table 2-2 shows the change in emissions representing the difference between the revised emissions minus the draft emissions. Overall, the revisions approved by the CAPAG lowered 1990 emissions by 2.9 MMtCO2e, 2005 and 2010 emissions by 3.9 MMtCO2e, and 2020 emissions by 11.4 MMtCO2e.

2-9
Table 2-2. Revisions to inventory and reference case projections (MMtCO2e)
Sector 1990 2000 2005 2010 2020 Electricity Supply—In-State Production 0.0 0.0 –0.2 0.6 –5.3 Electricity Supply—Imports 0.0 0.0 0.3 0.3 –0.1 Industrial Fuel Use –2.9 –3.4 –4.0 –4.8 –5.9 Total Change from Draft Inventory and Reference Case Projections –2.9 –3.4 –3.9 –3.9 –11.4
Industrial Processes Non-Fuel Use: The CAPAG and RCI TWG added text to the discussion for this category in the final inventory and reference case projections report noting that, following international and national protocols, the GHG emissions associated with the use of ODSs are excluded from GHG inventories.
Key Uncertainties Some data gaps exist in this inventory, including 1990–1999 activity data for natural gas distribution and transmission. Key tasks, among others, include developing a better understanding of the electricity generation sources currently used to meet North Carolina loads (in collaboration with state utilities) and reviewing and revising key drivers, such as the electricity and transportation fuel use growth rates that will be major determinants of North Carolina’s future GHG emissions. Table 2-3 shows the key historical and projected growth rates affecting the North Carolina GHG emissions.
Perhaps the variables with the most important implications for GHG emissions are the type, size, and number of power plants built in North Carolina between now and 2020. There are also significant impacts associated with projecting electricity consumption in the state, as well as in the estimation of consumption-based electricity emissions (i.e., which electricity sources serve North Carolina loads). If a consumption-based emissions approach is adopted by the state, further analysis should be directed toward resources that utilities use to meet North Carolina loads and methods that can be reliably used to track them.
Emissions of aerosols, particularly black carbon from fossil fuel combustion, could have significant impacts in terms of radiative forcing (i.e., climate impacts). Methodologies for conversion of black carbon mass estimates and projections to global warming potential involve significant uncertainty at present, but CCS has developed and used a recommended approach for estimating black carbon emissions based on methods used in other States. At this time, no estimates have been developed for North Carolina. By including black carbon emission estimates in the inventory, additional opportunities for reducing climate impacts are realized.
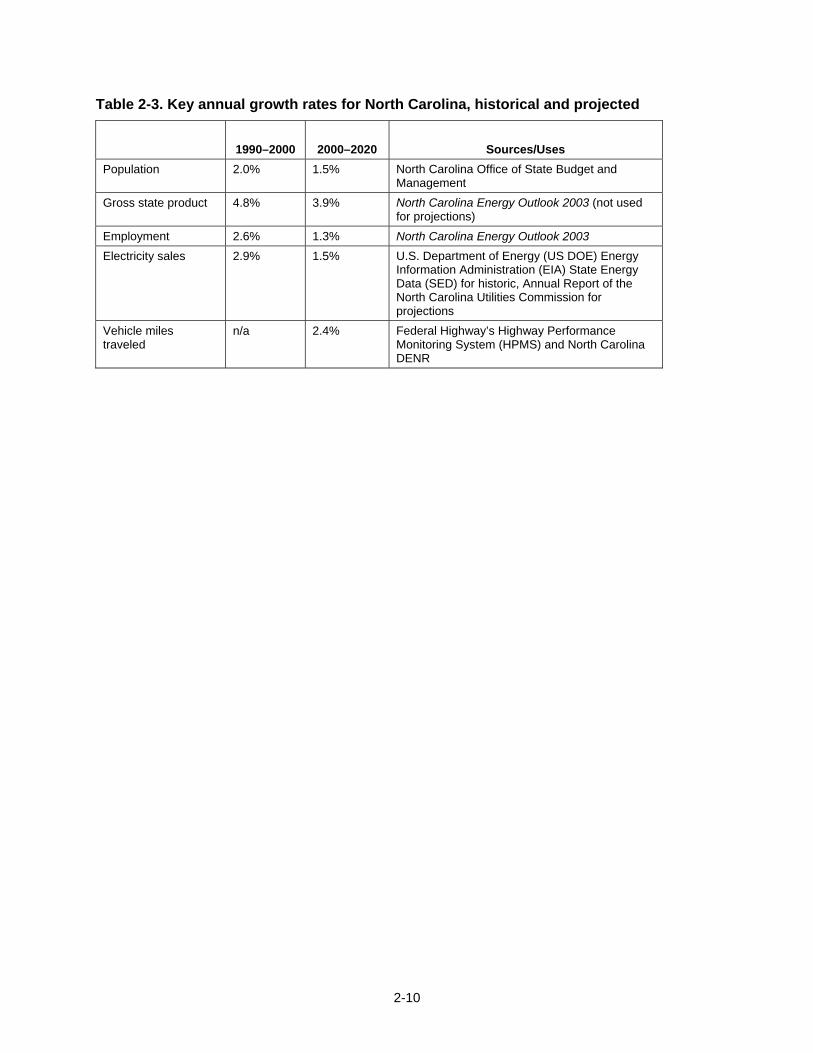
2-10
Table 2-3. Key annual growth rates for North Carolina, historical and projected
1990–2000 2000–2020 Sources/Uses Population 2.0% 1.5% North Carolina Office of State Budget and
Management Gross state product 4.8% 3.9% North Carolina Energy Outlook 2003 (not used
for projections) Employment 2.6% 1.3% North Carolina Energy Outlook 2003 Electricity sales 2.9% 1.5% U.S. Department of Energy (US DOE) Energy
Information Administration (EIA) State Energy Data (SED) for historic, Annual Report of the North Carolina Utilities Commission for projections
Vehicle miles traveled
n/a 2.4% Federal Highway’s Highway Performance Monitoring System (HPMS) and North Carolina DENR

3-1
Chapter 3 Residential, Commercial, and Industrial Sectors
Overview of Greenhouse Gas Emissions The residential, commercial, and industrial (RCI) sectors are directly responsible for almost one-fifth of North Carolina’s current gross greenhouse gas (GHG) emissions (37 million metric tons (MMt) of carbon dioxide equivalent (CO2e) in 2005). Direct emissions of GHGs from the RCI sectors result principally from the on-site combustion of natural gas, oil, and coal plus non-energy sources of GHG emissions – primarily leaks of methane from natural gas transmission and distribution pipelines, the release of CO2 and fluorinated gases (PFCs) during industrial processing (largely from the aluminum production, soda ash consumption, and semi-conductor industries), the use of sulfur hexafluoride (SF6) in the utility industry, and the leakage of hydrofluorocarbons (HFCs) from refrigeration and related equipment.1
Considering only the direct emissions that occur within buildings and industries, however, ignores the fact that virtually all electricity sold in North Carolina is consumed as the result of activities in the residential, commercial, and industrial sectors. If the emissions associated with producing the electricity consumed in North Carolina are considered, RCI activities are associated with well over half (about 60% of the state’s gross GHG emissions.2 The State’s future GHG emissions therefore will depend heavily on future trends in the consumption of electricity and other fuels in the RCI sectors.
Figure 3-1 shows historical and projected RCI GHG emissions by fuel and source, and illustrates the large fraction of RCI emissions associated with electricity use. RCI emissions associated with electricity and natural gas use are expected to rise by nearly 30% between 2005 and 2020, and are projected to account for over 40% of the State’s growth in gross GHG emissions during this period.
1 RCI direct fuel use accounted for 31.8 MMtCO2e in GHG emissions in 2005, while industrial process emissions accounted for emissions totaling 5.4 MMtCO2e. 2 Gross emissions here denote greenhouse gas emissions from activities in North Carolina, adjusted for exports of electricity, but not including consideration of estimated “sinks” of greenhouse gases in the forestry and land-use sectors.

3-2
Figure 3-1. Historical and projected RCI GHG emissions by fuel and process in North Carolina, 1990 to 2020
020406080
100120140160180
1990 1995 2000 2005 2010 2015 2020
MM
TCO
2eElectricityNatural GasPetroleumCoalHFCs and PFCsOther Non-energy emissions
PFCs = perfluorocarbons; HFCs = hydrofluorocarbons. Since 1990, overall GHG emissions associated with energy consumption in the residential and commercial sectors have grown steadily. This growth is projected to continue, driven by both population growth and increasing commercial activity (as indicated in Figure 3-2). The total emissions from electricity and fuels consumption in the industrial sector have varied, showing increases or and decreases year-to-year, in the years since 1990, but show only a very slight overall reduction from 1990 to 2005.3 The GHG emissions from industrial sector electricity and fuels use are expected to grow modestly through 2010, and decline slightly thereafter, so that 2020 emissions are projected to be about 2.5% higher than emissions in 2005. Non-energy emissions grew by a factor of more than 3 between 1990 and 2005, largely as a result of increased emissions from HFC use. This trend in non-energy emissions is expected to accelerate in the future. Non-energy emissions are projected to increase by over 8% per year from 2005 to 2020 – increasing from 2% of total gross GHG emissions in 2000 to almost 6% in 2020. Increased use of HFCs for refrigeration, air conditioning and other uses, as substitutes for ozone depleting substances, are the main source of the projected emissions increases. Even low amounts of HFCs, from leaks and other releases under normal use of the products, can lead to high GHG emissions in CO2-equivalent terms, due to the high global warming potential of these
3 This reduction was largely the result of changes in North Carolina industrial activity and processes, rather than direct emissions reduction efforts. GHGs have not historically been considered pollutants or regulated in the same way that “criteria pollutants” (local and regional air pollutants such as oxides of sulfur and nitrogen) or hazardous air pollutants, and no post-combustion control/removal devices are commonly in use for CO2, the major GHG species.

3-3
substances.4 Figure 3-2 shows the estimated contribution of the individual sectors to RCI emissions over time.
Figure 3-2. 1990–2020 GHG emissions by sector and source
020406080
100120140160180
1990 1995 2000 2005 2010 2015 2020
MM
TCO
2e
Industrial CommercialResidential Non-energy
Key Challenges and Opportunities The principal means to reduce RCI emissions in North Carolina include improving energy efficiency, substituting for electricity and natural gas with lower-emission energy resources (such as wind, solar water heating, photovoltaics, and biomass), reducing industrial-sector process (non-energy) emissions, increasing distributed (consumer-sited) electricity generation based on renewable fuels and on combined heat and power, and various strategies to decrease the emissions associated with electricity production (see Chapter 5, Energy Supply, for the latter). The state’s limited implementation of energy efficiency programs and related initiatives in past years, relative to some other states that have aggressively pursued efficiency programs, provides a challenge—in rapidly assembling capacity to harvest energy efficiency resources—but also strong opportunities to reduce emissions through programs and initiatives to improve the efficiency of buildings, appliances, and industrial practices. An excellent start to building such programs and initiatives has been provided by the efforts of the State Energy Office (see, for example, the listing of Energy Office and other ongoing programs in NC provided in Annex A to the RCI Options Descriptions provided as Appendix E, by the recent Duke Energy and Progress
4 Projections of energy consumption in the RCI sectors are based on NC Energy Outlook 2003. Prepared by Global Insight for the State Energy Office, North Carolina Department of Administration, May 2003. Projections for emissions from HFC use are Growth rates are based on growth in projected national emissions from U.S. Department of State, U.S. Climate Action Report 2002, Washington, DC, May 2002. See http://yosemite.epa.gov/oar/globalwarming.nsf/UniqueKeyLookup/SHSU5BNQ76/$File/ch5.pdf
3-4
Energy announcements that they will significantly expand their energy efficiency programs, by the recent passage of Senate Bill 3,5 and by programs outlined in the State Energy Plan (see below). At the same time, North Carolina’s robust population and economic growth, and the North Carolina’s leaders’ growing commitment to carry out significant emissions reductions, places pressure on communities and businesses in North Carolina to make swift decisions to put in motion changes that will reduce emissions. A key challenge lies in the design and implementation of strategies that address State goals and thus ensure that new buildings and industries take full advantage of opportunities to reduce energy use and emissions.
Though overall investment in energy efficiency to date has been limited relative to that in a number of other states, there are a number of existing programs in North Carolina that can readily be built upon to reduce greenhouse gas emissions. These include a number of programs and initiatives through the North Carolina State Energy Office (to be expanded by recent legislation), including programs related to energy efficiency, training and certification of energy sector professionals, and others. Local organizations have provided building and industrial energy technical assistance (energy audits) for many years, and the North Carolina Greenpower program, offering consumers electricity generated from renewable sources, is ongoing. A systems benefit charge-funded program for energy efficiency and other services has likewise been operating in the State for many years, and several utilities have programs addressing energy efficiency through provision of low-interest loans and direct incentives. The State Energy Plan, first updated and published in 2003 and revised in 2005 (further updates are currently underway), identifies a strong list of initiatives to increase energy efficiency in the RCI sectors and in other areas of the North Carolina economy.6 While an indication of the growing efforts for improving efficiency and reducing emissions in North Carolina, these programs need to be further supported and extended to realize the overall potential of the state to slow its growth of energy use and emissions of GHG pollutants.
Overview of Mitigation Recommendations and Estimated Impacts The CAPAG recommends a set of 11 mitigation options for the residential, commercial, and industrial sectors (including industrial process emissions from sources other than energy use) that offer the potential for major economic benefits and emissions savings. As summarized in Figure 3-3, these mitigation options, if fully implemented, could lead to emissions savings from reference case projections of 33 MMtCO2e per year by 2020, and cumulative savings of 219 MMtCO2e from 2007 through 2020.7 The mitigation options recommended could result in net 5 See, for example, http://www.ncleg.net/Sessions/2007/Bills/Senate/HTML/S3v6.html. Senate Bill 3, among other provisions, includes “Renewable Energy and Energy Efficiency Standards (REPS) for Electric Public Utilities.” This bill passed in August 2007 and has been signed into law. 6 See North Carolina State Energy Plan, prepared for the North Carolina Energy Policy Council by the State Energy Office, North Carolina Department of Administration and Appalachian State University Energy Center (Revised edition January 2005), available at http://www.energync.net/epc/docs/Energy%20Plan%202005.pdf 7 Note that these figures do not include additional emission savings from recent actions that were not already accounted for in the reference case projections. See the Appendix E for more detailed information on these options, including details of how costs and savings of the options were calculated. Of the total 219 MMtCO2e in cumulative emissions savings from the RCI policies, 211 MMtCO2e are from reduced electricity consumption, 8 MMtCO2e are from the reduction in on-site use of fossil fuels, though the latter total does not include avoided heating fuel savings from implementation of combined heat and power systems.
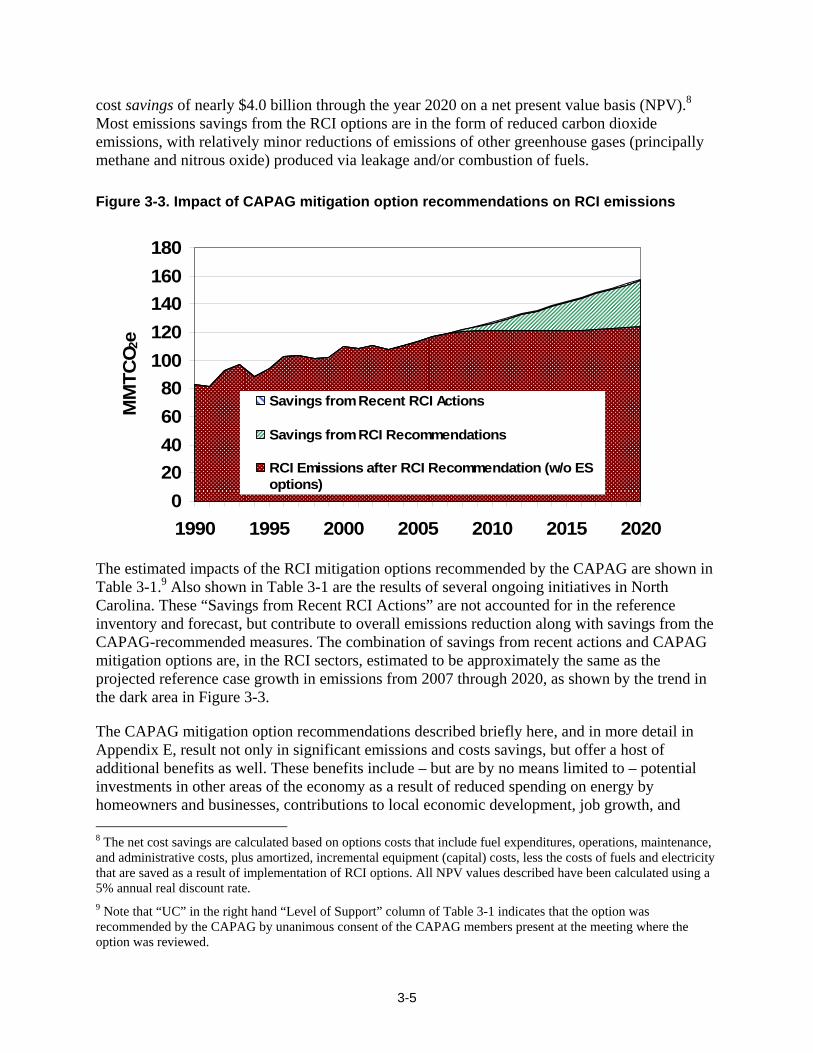
3-5
cost savings of nearly $4.0 billion through the year 2020 on a net present value basis (NPV).8 Most emissions savings from the RCI options are in the form of reduced carbon dioxide emissions, with relatively minor reductions of emissions of other greenhouse gases (principally methane and nitrous oxide) produced via leakage and/or combustion of fuels.
Figure 3-3. Impact of CAPAG mitigation option recommendations on RCI emissions
020406080
100120140160180
1990 1995 2000 2005 2010 2015 2020
MM
TCO 2
e
Savings from Recent RCI Actions
Savings from RCI Recommendations
RCI Emissions after RCI Recommendation (w/o ESoptions)
The estimated impacts of the RCI mitigation options recommended by the CAPAG are shown in Table 3-1.9 Also shown in Table 3-1 are the results of several ongoing initiatives in North Carolina. These “Savings from Recent RCI Actions” are not accounted for in the reference inventory and forecast, but contribute to overall emissions reduction along with savings from the CAPAG-recommended measures. The combination of savings from recent actions and CAPAG mitigation options are, in the RCI sectors, estimated to be approximately the same as the projected reference case growth in emissions from 2007 through 2020, as shown by the trend in the dark area in Figure 3-3.
The CAPAG mitigation option recommendations described briefly here, and in more detail in Appendix E, result not only in significant emissions and costs savings, but offer a host of additional benefits as well. These benefits include – but are by no means limited to – potential investments in other areas of the economy as a result of reduced spending on energy by homeowners and businesses, contributions to local economic development, job growth, and 8 The net cost savings are calculated based on options costs that include fuel expenditures, operations, maintenance, and administrative costs, plus amortized, incremental equipment (capital) costs, less the costs of fuels and electricity that are saved as a result of implementation of RCI options. All NPV values described have been calculated using a 5% annual real discount rate. 9 Note that “UC” in the right hand “Level of Support” column of Table 3-1 indicates that the option was recommended by the CAPAG by unanimous consent of the CAPAG members present at the meeting where the option was reviewed.

3-6
enhancement of productivity, reduced local air pollution and related reduced impacts of air pollution on human health, reduction in the needs for and costs of electricity transmission and distribution system additions, and improvements in comfort, convenience, and indoor air quality as a result of building improvement measures.
In order for the RCI mitigation options recommended by the CAPAG to yield the levels of savings described here, the options must be implemented in a timely, aggressive, and thorough manner. This means, for example, not only putting the options themselves in place, but attending at the same time to the development of “supporting options” that are needed to help make the recommended options effective. Many of these supporting mitigation options are a part of the package of RCI options, while others are included among the mitigation options recommended as “cross-cutting” options (see Chapter 7), and/or in options recommended in other chapters of this report (most notably, in the case of RCI, in the Energy Supply Chapter). Improved building energy codes (RCI-6) will not be optimally effective, for example, without further support and intensified training of contractors, builders, architects, financial institutions, and building inspectors, among others, in the methods and benefits of efficient building design, and of building code enforcement (as recommended, in part, in RCI-8). Given that the way that energy-efficiency improvements made as buildings are constructed will save energy over the entire, often long, lifetime of those buildings, modest investments now in building codes, training for building sector professionals, and code enforcement will yield significant cost, energy, and GHG emissions savings for decades. Regulatory changes that provide incentives and lower disincentives for the adoption of consumer-sited combined heat and power and renewable electricity generation are also among the supporting initiatives crucial to the success of the RCI options recommended by the CAPAG; some of these options are already in the formative stages in North Carolina. The CAPAG’s work indicates that there are considerable benefits to both the environment and to consumers from adoption of the mitigation options recommended, but careful, comprehensive, and detailed planning and implementation, as well as consistent support (building on existing North Carolina programs and capacity whenever possible), of these options, and the initiatives and activities that they include, will be required if these benefits are to be achieved.
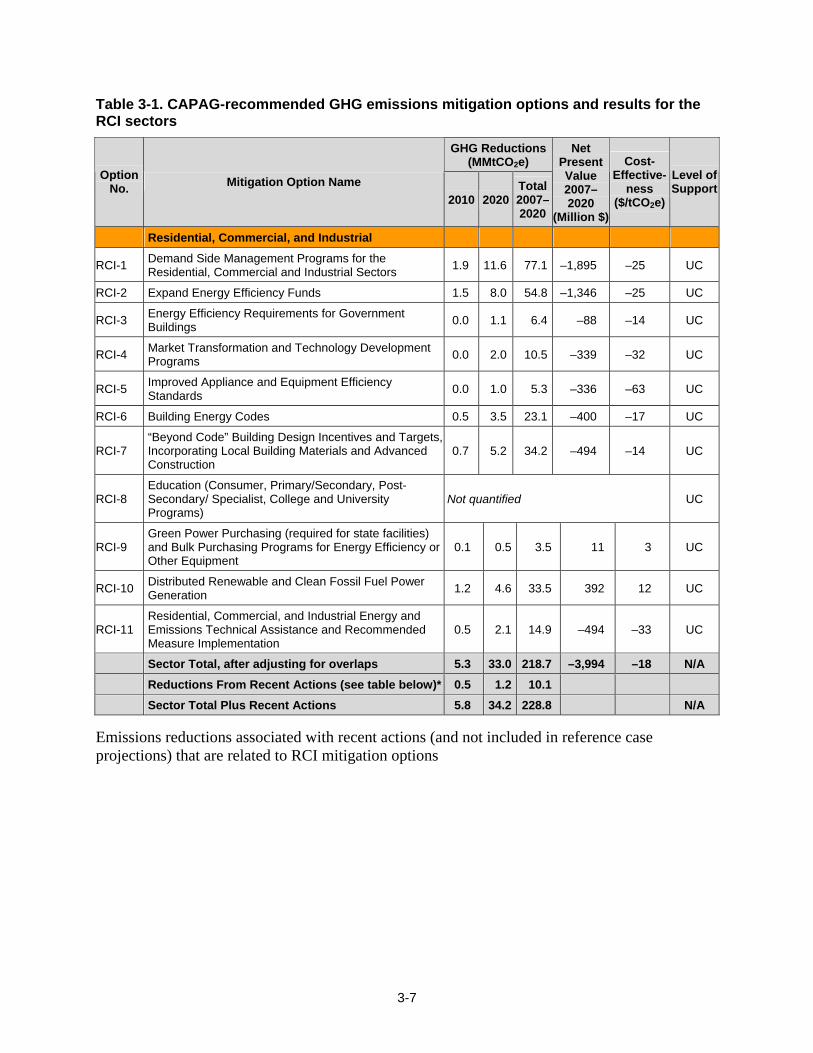
3-7
Table 3-1. CAPAG-recommended GHG emissions mitigation options and results for the RCI sectors
GHG Reductions(MMtCO2e)
Option No. Mitigation Option Name
2010 2020Total2007–2020
Net Present Value 2007–2020
(Million $)
Cost- Effective-
ness ($/tCO2e)
Level of Support
Residential, Commercial, and Industrial
RCI-1 Demand Side Management Programs for the Residential, Commercial and Industrial Sectors 1.9 11.6 77.1 –1,895 –25 UC
RCI-2 Expand Energy Efficiency Funds 1.5 8.0 54.8 –1,346 –25 UC
RCI-3 Energy Efficiency Requirements for Government Buildings 0.0 1.1 6.4 –88 –14 UC
RCI-4 Market Transformation and Technology Development Programs 0.0 2.0 10.5 –339 –32 UC
RCI-5 Improved Appliance and Equipment Efficiency Standards 0.0 1.0 5.3 –336 –63 UC
RCI-6 Building Energy Codes 0.5 3.5 23.1 –400 –17 UC
RCI-7 “Beyond Code” Building Design Incentives and Targets, Incorporating Local Building Materials and Advanced Construction
0.7 5.2 34.2 –494 –14 UC
RCI-8 Education (Consumer, Primary/Secondary, Post-Secondary/ Specialist, College and University Programs)
Not quantified UC
RCI-9 Green Power Purchasing (required for state facilities) and Bulk Purchasing Programs for Energy Efficiency or Other Equipment
0.1 0.5 3.5 11 3 UC
RCI-10 Distributed Renewable and Clean Fossil Fuel Power Generation 1.2 4.6 33.5 392 12 UC
RCI-11 Residential, Commercial, and Industrial Energy and Emissions Technical Assistance and Recommended Measure Implementation
0.5 2.1 14.9 –494 –33 UC
Sector Total, after adjusting for overlaps 5.3 33.0 218.7 –3,994 –18 N/A
Reductions From Recent Actions (see table below)* 0.5 1.2 10.1
Sector Total Plus Recent Actions 5.8 34.2 228.8 N/A Emissions reductions associated with recent actions (and not included in reference case projections) that are related to RCI mitigation options

3-8
Option No. Mitigation Option
Estimated 2010 GHG Reduction (MMtCO2e)
Estimated 2020 GHG Reduction (MMtCO2e)
Cumulative 2007–2020
GHG Reduction (MMtCO2e)
RCI-1 Demand Side Management Programs for the Residential, Commercial and Industrial Sectors 0.3 0.7 6.2
RCI-2 Expand Energy Efficiency Funds 0.2 0.4 3.6 RCI-6 Building Energy Codes 0.0 0.0 0.0
RCI-9 Green Power Purchasing (required for state facilities) and Bulk Purchasing Programs for Energy Efficiency or Other Equipment
0.0 0.0 0.3
UC = unanimous consent; N/A = not applicable.
Negative values in the Net Present Value and the Cost-Effectiveness columns represent net cost savings associated with the options.
* “Recent actions” represent initiatives undertaken in North Carolina that reduce GHG emissions that were implemented shortly before or during the CAPAG process. The emission reductions associated with recent actions are not accounted for in the GHG emissions inventory and reference case projections. Emissions reductions associated with these recent actions were therefore estimated separately, and are counted toward overall statewide reductions along with reductions from the mitigation options recommended by the CAPAG.

3-9
Residential, Commercial, Industrial (RCI) Mitigation Option Descriptions
The Residential, Commercial, Industrial Sectors include emissions reduction opportunities related to improving energy (and sometimes water) use efficiency, using lower-GHG energy sources, and increasing consumer-sited renewable electricity generation and use of combined heat (and/or cooling) and power (CHP) systems. Additional detail on each of the options summarized below can be found in Appendix E.
RCI-1 Demand-Side Management Programs for the Residential, Commercial, and Industrial Sectors
The CAPAG recommends that Demand-side Management (DSM) programs funded by gas and electric utilities in North Carolina be expanded to yield higher levels of energy savings, demand response, and greenhouse gas emissions savings. Utility-funded DSM programs reduce either the consumption of or the demand for conventional sources of electricity and fossil fuels. Examples of DSM programs include technical assistance for and implementation of energy efficiency and renewable energy measures, electrical (and in some cases fuel) demand responses, alternative rate schedules, and research activities. The goal for this option is to reach a level of DSM investment in North Carolina equal to 1.5% of utility revenues by 2012. This option is designed to work in tandem with other strategies recommended by the CAPAG, including options described in other Chapters in this Report, which can also encourage efficiency gains.
Specific recommendations from the RCI TWG include proposing that the North Carolina General Assembly and the North Carolina Utilities Commission take an active role in encouraging the investor-owned, cooperative and municipal utilities to pursue active DSM programs.
Examples of utility-funded programs that this option supports include:
• Residential building programs—including programs to promote higher efficiency new and existing homes, and the expanded use of renewable energy in residences, with specific programs focused on the often under-served low-income and rental properties segments;10
• Commercial and industrial building programs, including efficiency programs for new and existing buildings, and renewable energy programs for commercial and industrial buildings; and
• Multi-sector strategies, including demand response and demand reduction programs, technical assistance, education, training, consumer outreach, and promotional activities to support the DSM programs, and grants, loans, performance contracting arrangements, and
10 See the RCI Options Descriptions in Appendix E, and the discussion of existing programs in these areas developed by the State Energy Office, Appalachian State University, and others provided in Annex A to Appendix E.
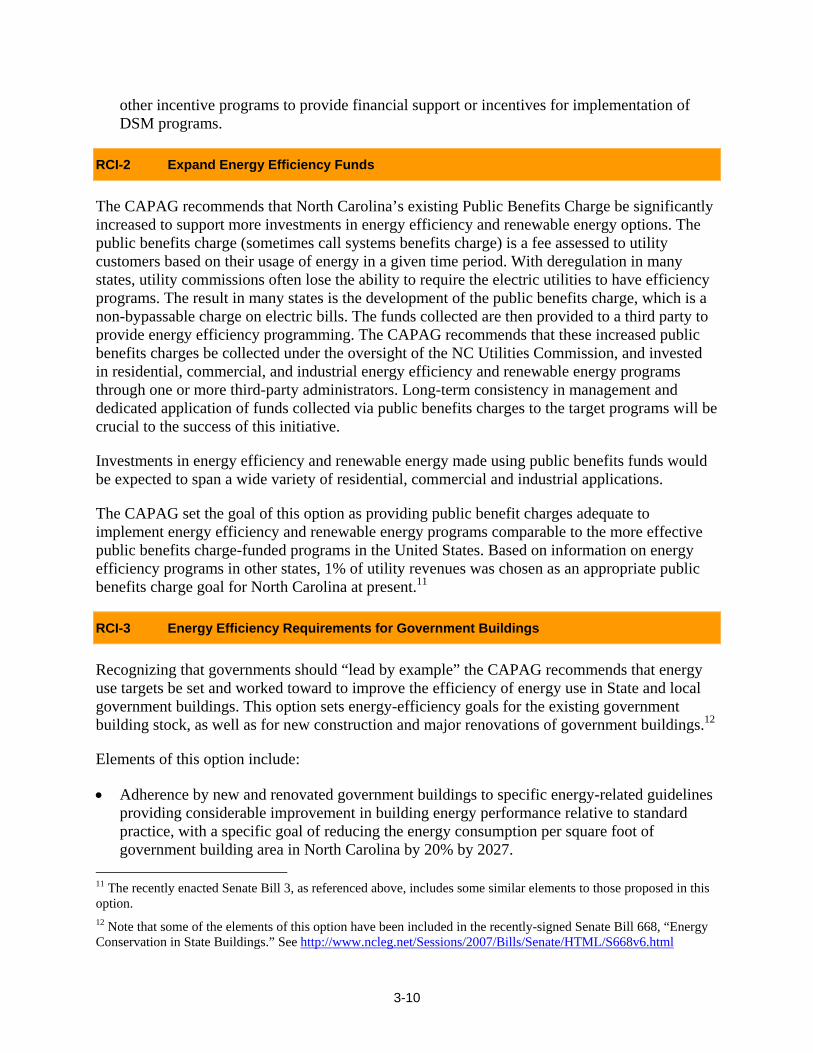
3-10
other incentive programs to provide financial support or incentives for implementation of DSM programs.
RCI-2 Expand Energy Efficiency Funds
The CAPAG recommends that North Carolina’s existing Public Benefits Charge be significantly increased to support more investments in energy efficiency and renewable energy options. The public benefits charge (sometimes call systems benefits charge) is a fee assessed to utility customers based on their usage of energy in a given time period. With deregulation in many states, utility commissions often lose the ability to require the electric utilities to have efficiency programs. The result in many states is the development of the public benefits charge, which is a non-bypassable charge on electric bills. The funds collected are then provided to a third party to provide energy efficiency programming. The CAPAG recommends that these increased public benefits charges be collected under the oversight of the NC Utilities Commission, and invested in residential, commercial, and industrial energy efficiency and renewable energy programs through one or more third-party administrators. Long-term consistency in management and dedicated application of funds collected via public benefits charges to the target programs will be crucial to the success of this initiative.
Investments in energy efficiency and renewable energy made using public benefits funds would be expected to span a wide variety of residential, commercial and industrial applications.
The CAPAG set the goal of this option as providing public benefit charges adequate to implement energy efficiency and renewable energy programs comparable to the more effective public benefits charge-funded programs in the United States. Based on information on energy efficiency programs in other states, 1% of utility revenues was chosen as an appropriate public benefits charge goal for North Carolina at present.11
RCI-3 Energy Efficiency Requirements for Government Buildings
Recognizing that governments should “lead by example” the CAPAG recommends that energy use targets be set and worked toward to improve the efficiency of energy use in State and local government buildings. This option sets energy-efficiency goals for the existing government building stock, as well as for new construction and major renovations of government buildings.12
Elements of this option include:
• Adherence by new and renovated government buildings to specific energy-related guidelines providing considerable improvement in building energy performance relative to standard practice, with a specific goal of reducing the energy consumption per square foot of government building area in North Carolina by 20% by 2027.
11 The recently enacted Senate Bill 3, as referenced above, includes some similar elements to those proposed in this option. 12 Note that some of the elements of this option have been included in the recently-signed Senate Bill 668, “Energy Conservation in State Buildings.” See http://www.ncleg.net/Sessions/2007/Bills/Senate/HTML/S668v6.html

3-11
• Revising administrative policies as needed to provide incentives for government organizations to invest in increased energy-efficient construction or building alterations.
• Extending green campus initiatives to all public academic and government campuses.
• Energy benchmarking, measurement, and tracking programs for municipal and state buildings.
• Energy efficiency and renewable energy requirements for new, renovated, and existing government buildings.
RCI-4 Market Transformation and Technology Development Programs
The CAPAG recommends that North Carolina develop long-term and robust market transformation and technology development programs. Such programs must provide 1) consistent and enduring support for technology improvement and incorporation, 2) continued investment in technology development and integration, and 3) independent evaluation of the efficacy of the technologies.
This recommendation is broadly defined and does not address a particular technology or market. Rather, it addresses a method for bringing appropriate technologies and processes to the marketplace. Defined as such, the CAPAG recommends that the following components be included in market transformation strategies for North Carolina, though others can and should be included as well:
• Expand existing programs to promote the appropriate use of premium motors and drives in industrial applications.
• Provide renewed and intensified support for implementation of renewable energy applications such as solar water heaters.
• Target the early retirement of older appliances using a “bounty” program.
• Provide support for processes that recover waste heat from industrial applications, and promote the use of ground-source heat pumps by helping to identify and qualify appropriate applications in the residential, commercial and industrial sectors.
• Encourage national legislators to provide increased federal funding for the U.S. Environmental Protection Agency’s ENERGY STAR program in order to identify and qualify a greater number of products under ENERGY STAR labeling.
• Encourage and enable smaller purchasers to act in aggregate groups to reduce costs and quantify emission reduction benefits from technology and process improvements. This could include, for example, setting up programs to organize consumers and to work with them to provide information resources to evaluate and take advantage of savings emissions reduction opportunities.
• Provide a continuous funding level for near-term research and deployment of energy efficient technologies and processes, including providing stable or expanded state funding for existing programs and new initiatives.

3-12
Implementation of market transformation programs requires the participation and buy-in of industry partners, regulatory bodies and consumer groups.
RCI-5 Improved Appliance and Equipment Efficiency Standards
The CAPAG recommends that North Carolina should replicate the appliance and equipment efficiency standards adopted in other states for appliances not covered by federal standards.13 As part of this action, the CAPAG recommends that the State, working together with other states in, should advocate for stronger federal appliance efficiency standards where doing so is technically feasible and economically justified.14. Implementation of stronger-than-federal standards together with other states is much preferred by the CAPAG, as it provides a broader market for manufacturers and thus lowers net costs of higher-efficiency devices to North Carolina consumers. The CAPAG recommends that development of new standards start in 2010, with implementation starting in 2012.
Elements of this mitigation option include:
• Development of committee or other working group to develop recommendations on appliance standards (similar to, for example, the existing North Carolina group that considers building code changes).
• Adoption of State-level Appliance Efficiency Standards, defined sufficiently broadly to include, for example, commercial sector and information technology (IT) equipment.
• The CAPAG voices support for adoption of more stringent federal-level appliance efficiency standards, and recommends that North Carolina’s congressional delegation and state government officials voice support for such standards.
• Design standards for recycling of materials in appliances, and include water use reduction as a criterion for appliance efficiency improvement.
• Assistance programs to help low-income consumers with purchase of appliances meeting more stringent standards, so as to reduce the higher-first-cost burden of higher-efficiency appliances on those consumers.
• Introduce elevated energy standards for appliances and equipment purchased by public agencies.
• Encourage state agencies, utilities, and other organizations involved in appliance and equipment efficiency programs to work with manufacturers to identify devices where significant savings are possible, and to consider cost and technical impacts on manufacturers—and how to address those impacts—when setting new standards.
13 A few examples here of devices not currently covered by Federal standards are commercial boilers, distribution transformers, and AC to DC power supplies. See www.standardsasap.org and Appendix E. 14 For example, where changes in efficiency can be implemented by manufacturers in such a manner that the value of energy savings, and perhaps eventually the value of GHG emissions savings, is greater than equal to the increased cost of production of the appliance or equipment.

3-13
RCI-6 Building Energy Codes
The CAPAG recommends that North Carolina upgrade the energy-efficiency provisions of its building codes, and hasten implementation of standards already adopted or awaiting adoption. Building energy codes specify minimum energy efficiency requirements for new buildings or for existing buildings undergoing a major renovation. As energy use (largely electricity and gas) in buildings in North Carolina accounts for about one-third of current emissions, amending the Building Codes to make the requirements for minimum energy efficiency levels in buildings more stringent will have a considerable immediate and ongoing impact in reducing building-sector greenhouse gas emissions.
An ongoing process of code amendments for new and renovated residential and commercial buildings is proposed as follows.15
• North Carolina should adopt more stringent building codes to improve the efficiency of energy use in buildings.
• North Carolina should move toward adopting innovative features of advanced codes being implemented in other states, such as lighting efficiency requirements in new homes that go beyond the codes in force, as appropriate to conditions in the State.
• Statewide enforcement of both existing and new building codes should be improved at all levels, and enforcement should be fully implemented within 6 months of statewide code adoption (if applicable).
• North Carolina should regularly update its energy codes to assure that they remain consistent with stringent codes in use nationally and internationally. A three-year cycle of code review and improvement could be timed to coincide with the release of national model codes.
• As appropriate, codes should be modified to remove obstacles to renewable energy use, daylighting and non-conventional energy-efficient building materials in buildings where applicable.
• Include programs of expanded, more accessible and intensified education for building inspectors and other building industry professionals to assure that the new codes are implemented and enforced.
The CAPAG recommends 95% enforcement of existing building energy codes by 2008, and establishment and similar enforcement of a new energy code by 2010 that requires new North Carolina residences and commercial/industrial buildings to be 20% more efficient than buildings meeting current national building energy codes.
15 As with other RCI options, please see Appendix E for additional details on the suggested building code improvements.

3-14
RCI-7 “Beyond Code” Building Design Incentives and Targets, Incorporating Local Building Materials and Advanced Construction
Energy use in existing buildings and in non-government-funded new buildings must be substantially improved. The CAPAG recommends that incentives and targets be provided and developed to induce the owners and developers of new and existing non-government buildings to markedly improve the efficiency with which energy and other resources are used in those buildings, along with provisions for raising targets periodically and resources to help achieve the desired building performance. This option includes elements to encourage the improvement and review of energy use goals over time, and to encourage flexibility in contracting arrangements to encourage integrated energy and resource efficient design and construction.
Elements of this option include:
• Promotion and Incentives for “beyond code” construction, using programs of various types to focus on specific sectors (new home construction, apartments, low income housing, commercial new construction, commercial renovation construction, and others), with improved design and construction standards and guidelines addressing multiple aspects of resource conservation.
• Promotion of energy technologies include solar water heating and solar heating/cooling building technologies, solar photovoltaic power on commercial buildings and many new homes, solar hot water heaters on homes and other buildings, new and existing lighting building energy technologies, and other applicable new technologies.
• Promotion of energy education under this option in coordination with the programs noted in RCI-8.
• The goals of this option are to induce 5% of new residential buildings and 2% of new commercial buildings annually to go to “beyond code” energy use levels that improve energy performance over the average new building by 30%, to induce significant examples throughout the state of various building types that use 50% or less energy than is supported by the existing building code, and to provide incentives such that energy efficiency in 20% of existing buildings is increase by 15% by 2015, and energy efficiency in 20% of existing commercial building energy performance is increased by 20%. These goals are intended to be in addition to privately and publicly-sponsored efforts at “beyond code” construction now ongoing in North Carolina.
RCI-8 Education (Consumer, Primary/Secondary, Post-Secondary/Specialist, College and University Programs)
The CAPAG notes that the effectiveness of emissions reduction activities in many cases depends on providing information and education to consumers, as well as to future consumers (primary and secondary school students), regarding the energy and greenhouse gas emissions implications of consumer choices. As a consequence, the CAPAG recommends that consumer and primary/secondary schools education programs focused on these issues be created in North Carolina, or augmented and expanded where they exist already. In addition, in order to
3-15
effectively implement many of the other RCI options above, specific and targeted education (at the community college, university, and post-graduate levels), outreach, and licensing requirements will be required for professionals in a variety of building-related trades in order to ensure that those professionals have the expertise to support aggressive GHG mitigation options in North Carolina. State support for such programs will help to build a pool of trained professionals that will benefit the state for years to come.
Training and education activities under this option should be implemented so as to fully support other RCI options, and options in other areas as applicable, and should be timed and provided at levels appropriate so as to build understanding and awareness of energy and environmental issues, and human capacity in the field (skilled worker and professionals) so that capacity will be ready when needed by the people and businesses of North Carolina.
Elements of this option include training, education, and certification for builders and contractors, training and certification of building code and other officials in energy code enforcement, energy management training and training of building operators, continuing education for building design professionals, including architects, engineers, developers, contractors, urban planners, and realtors, energy efficiency and related education introduced at community colleges and trade schools, consumer education and consumer information programs (building on efforts to date by the State Energy Office, the NC Energy Research Center at Appalachian State University, and others), and introduction/augmenting of energy and environmental curricula in schools.
RCI-9 Green Power Purchasing (required for State facilities) and Bulk Purchasing Programs for Energy Efficiency or Other Equipment
The CAPAG recommends that the use of “green power” in North Carolina be significantly expanded, and that public- and private-sector programs for the bulk purchase of high-efficiency appliances and equipment be developed. “Green power” supplements the state’s existing power supply with electricity generated from renewable resources like the sun, wind and organic matter. This option expands an existing voluntary North Carolina program by making green power purchases mandatory for State facilities. As part of this strategy, the CAPAG also recommends establishing a program for the bulk purchase of appliances and equipment with higher-than-standard energy efficiency by public agencies, and for the organization of similar bulk-purchase programs in the private sector.
The CAPAG recommends that State facilities purchase energy through NC GreenPower or a similar green power provider to cover 20% of their power needs by 2018, over and above the requirements of renewable generation within an Environmental Portfolio Standard or similar requirement applying to electricity suppliers. This target would be phased in starting in 2008. Additionally, for bulk purchases, the CAPAG recommends a program to address purchases of 10% of electricity-consuming equipment purchased annually by state agencies, and 1% of electricity-consuming equipment purchased annually by all commercial/institutional sector consumers. Devices purchased under the energy efficiency bulk purchase program would have a target consumption of 20% less electricity, on average, than devices that would otherwise have been purchased.
3-16
RCI-10 Distributed Renewable and Clean Fossil Fuel Power Generation
The CAPAG recommends that implementation of distributed renewable and clean fossil fuel power generation systems of less than 10 MW be encouraged through a combination of regulatory changes and incentive programs. Distributed generation with clean power systems reduces fossil fuel use and greenhouse gas emissions as well as providing electricity system benefits.16 Elements of this program include:
• Review existing net-metering policies (or check that the most recent North Carolina reviews of these policies are complete), including policies that affect electricity consumers who install on-site combined heat and power or distributed generation fueled with renewable or fossil fuels.
• Review as needed, and in consultation with the NC Utilities Commission, rate issues in NC, including the potential for decoupling of utility revenues from sales and rate design, with a specific focus on the impacts of rate design on greenhouse gas emissions.
• Provide incentives, including, as needed, increasing existing tax and utility incentives, for renewable energy applications such as photovoltaics and other renewable power sources, sufficient to reach the renewable energy development goals below.
• Promote clean combined heat and power in all sectors through, for example, a combination of utility incentives, information provision, streamlining of connection requirements, providing low-interest loans, and/or tax credits for potential hosts/owners/developers of these systems.
• Funding of research and development for distributed renewable and clean fossil fuel power generation, and provide direct or indirect support for in-state commercialization and production of new or advanced technologies for distributed renewable and clean fossil fuel power generation.
• Encourage the development of building-integrated distributed renewable and clean fossil-fuel power generation.
The goal of the program would be to implement 25%–33% of North Carolina’s combined heat and power potential by 2020. An additional 2% to 4% of all NC homes will have solar hot water installations by 2020. This option also includes the goal of implementing 35 additional MW of distributed renewable generation over and above renewable portfolio standard-related new generation by 2020.
RCI-11 Residential, Commercial, and Industrial Energy and Emissions Technical Assistance and Recommended Measure Implementation
The CAPAG recommends that technical assistance be provided to help identify options for energy consumers to reduce fossil energy use and to reduce non-energy emissions of GHGs, and that consumers be provided with information and incentives allowing them to follow-up on that 16 Electric system benefits can include, for example, reducing the need for transmission and distribution capacity by providing generation at the local level, and providing voltage and frequency support.

3-17
assistance to implement recommended measures. This initiative may include the following elements:
• Residential energy technical assistance for existing homes that identifies the most cost-effective energy efficiency measures for the individual homes visited. The technical assistance program can include diagnostic testing and analysis specific to the features of the home being investigated. The results reported to the homeowner can provide estimates of energy use, energy cost savings, and reductions in emissions due to implementation of the recommended measures.
• Commercial energy technical assistance for existing commercial buildings similar to the residential services, but most likely not including diagnostic testing. The analysis associated with technical assistance can also consider the benefit to the individual businesses visited of being served under alternative utility rate structures and of taking advantage of load control opportunities.
• Industrial energy technical assistance that identifies key efficiency measures, such as process heat changes, motor efficiency improvements, boiler efficiency provisions, compressed air system measures, as well as lighting and building envelope efficiency improvements. The industrial technical assistance program can identify opportunities for capture and use of process heat, as well as for implementation of combined heat and power. Opportunities for reducing the use of non-energy greenhouse gases can also be considered. Evaluation of the benefit to the individual plants visited of being served under alternative utility rate structures and assessments of load control opportunities can be included as well.
• The technical assistance programs can include follow-up mechanisms by which those who receive services are contacted at least twice after receiving the results to answer questions and give suggestions for installing the recommended measures, and to provide access to incentives (such as grants to cover a portion of the incremental cost of efficiency improvements) and financial assistance (such as low-interest loans) to encourage implementation of recommendations.
Initial goals for this option are to provide over 10,000 residential technical assistance visits, 1,500 commercial building technical assistance visits, and 300 industrial technical assistance visits annually once the technical assistance programs are fully implemented, and to have over 50% of consumers provided with assistance visits implement measures providing at least 50% of the GHG emission reduction potential of the recommendations. The CAPAG recommends that these goals be increased if needed, over time, to help to fully implement other RCI options.

4-1
Chapter 4 Energy Supply
Overview of GHG Emissions Greenhouse gas (GHG) emissions from the energy supply (ES) sector in North Carolina include emissions from electricity generation and represent a substantial portion of the State’s overall GHG emissions (approximately 46% of gross emissions in 2000). A significant portion of North Carolina’s gross GHG emissions are associated with electricity imports - roughly 8% of the State’s electricity-related fossil fuel emissions were associated with imports in 2000, though this is expected to decline to about 6% by 2020 based on the reference case forecast.
As shown on Figure 4-1, ES emissions are expected to increase from 1990 levels of 54 million metric tons (MMt) of carbon dioxide equivalent (CO2e) to about 98 MMtCO2e by 2020, or by approximately 83% on a consumption basis. This projection assume that the gross electric generation trends shown in Figure 4-2 are not perturbed by GHG-reducing actions, such as implementation of some or all of the recommendations identified in this chapter.
Figure 4-1. Historical and projected GHG emissions from the Electric Sector, North Carolina, 1990 to 2020 (consumption basis)
0
20
40
60
80
100
120
1990 1993 1996 1999 2002 2005 2008 2011 2014 2017 2020
MM
tCO
2e
Coal Natural Gas
biomass and waste Petroleum
Imports

4-2
Figure 4-2. Historical and projected In-State Electric Gross Generation By Source,, 1990–2020
0
20,000
40,000
60,000
80,000
100,000
120,000
140,000
160,000
180,000
1990 1993 1996 1999 2002 2005 2008 2011 2014 2017 2020
Gro
ss g
ener
atio
n (G
Wh)
Coal Natural GasNuclear RenewablesPetroleum
Note: only capacity additions assumed at the time of the analysis are included in the above generation projections..
Key Challenges and Opportunities The key challenge in addressing GHG emissions from North Carolina’s ES sector is the continued growth of electricity demand within the State. Electricity sales are projected to grow annually at the rate of about 1.6% between 2003 and 2020. This challenge is compounded by the fact that there is expected to be continued significant reliance on electricity produced by coal-fired power stations. These units produced 59% of all electrical energy generated in the state in 1990. While the share of coal-fired electricity is projected to decrease slowly, it is still projected to be a relatively high 54% by 2020.
Fortunately, there are significant opportunities in North Carolina to reduce the GHG emissions growth attributable to energy production and supply, including diminishing the carbon intensity of electrical generation through greater use of renewable energy options, and recapture of waste energy through combined heat and power and other technologies. Significant opportunities to reduce GHG emissions through mitigation options addressing electricity consumption also exist, and can often provide net cost savings to consumers and to the State. The CAPAG has identified several demand-side management, energy efficiency, and conservation measures in the Residential, Commercial, and Industrial Sector; these are detailed in Chapter 3.

4-3
North Carolina has significant renewable resources in the form of biomass, wind and hydro energy. North Carolina also has untapped onshore and offshore wind resources, albeit not necessarily well located to meet domestic demand. The intermittent nature of winds inhibits its value for providing baseload capacity, but its value to the electricity grid can be enhanced by carefully planning of wind facilities at multiple sites so they can support power demand in parts of the grid where it is most needed.
Overview of Mitigation Option Recommendations and Estimated Impacts The CAPAG recommends a set of 9 mitigation options for the ES sector that offer the potential for significant GHG emission reductions. These recommendations include efforts to increase the supply of electricity from renewable energy sources (ES-1, ES-2, ES-8, and ES-10), encourage lower-emitting fossil fuel generation (ES-6), increase distributed generation and distributed combined heat and power (ES-3 and ES-9), implement cap in-state carbon emissions (ES-4), align environmental objectives within the planning process (ES-5), and reduce electricity demand (ES-7). It is important to note that all the options identified above were approved by unanimous consent of the CAPAG with the exception of the cap-and-trade option (ES-4) and the public benefits option (ES-7), both of which were nonetheless approved by a supermajority of the CAPAG.
A glance at the numbers in Table 4-1 would seem to suggest that if simply added together, the cumulative emission reductions of these mitigation options could exceed 800 MMtCO2e in 2020, and NPV costs could approach $4 billion, assuming all options are implemented in isolation from each other. These options are not, however, independently additive. In fact, they tend to overlap heavily, so simply summing them would introduce significant double-counting. These options essentially target – through different means – the avoidance of the same or similar emissions sources (e.g., the emissions from existing fossil-fuel power plants and those yet to be built). When taken together in a combined scenario that assumes all of the CAPAG’s recommendations are fully implemented, these electricity supply recommendations are estimated to lead to cumulative GHG emissions reductions of about 78 MMtCO2e through 2020, at a NPV (net present value) cost of about $1.4 billion. (See Appendix F for discussion of the methodology used for the integrated analysis.)
In fact, the CAPAG’s recommendations concerning GHG emissions from electricity generation are also highly interactive with its RCI mitigation option recommendations concerning electricity use, because reducing electricity demand can offset the need for new generation, often at a lower cost or even with a savings. The scenario above (full implementation of all CAPAG recommendations) takes into account the many overlaps among ES and RCI mitigation options that reduce the demand for power.
The approach used for estimating emission reductions and costs associated with the combined set of ES and RCI mitigation options involved four major steps. First, electricity saving overlaps among RCI options was accounted for to eliminate the possibility of double-counting. Second, aggregate costs associated with the achieving total demand-side electricity savings were estimated. Third, revised electric generation requirements were estimated that accounted for
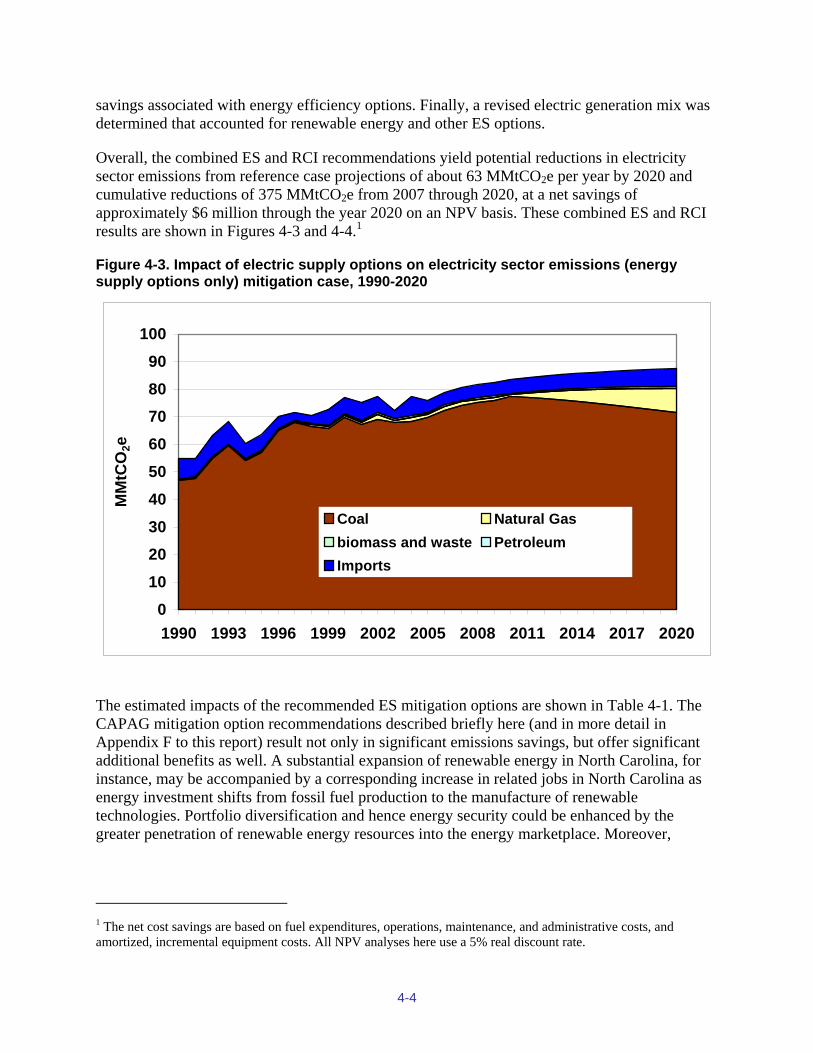
4-4
savings associated with energy efficiency options. Finally, a revised electric generation mix was determined that accounted for renewable energy and other ES options.
Overall, the combined ES and RCI recommendations yield potential reductions in electricity sector emissions from reference case projections of about 63 MMtCO2e per year by 2020 and cumulative reductions of 375 MMtCO2e from 2007 through 2020, at a net savings of approximately $6 million through the year 2020 on an NPV basis. These combined ES and RCI results are shown in Figures 4-3 and 4-4.1
Figure 4-3. Impact of electric supply options on electricity sector emissions (energy supply options only) mitigation case, 1990-2020
0102030405060708090
100
1990 1993 1996 1999 2002 2005 2008 2011 2014 2017 2020
MM
tCO
2e
Coal Natural Gasbiomass and waste PetroleumImports
The estimated impacts of the recommended ES mitigation options are shown in Table 4-1. The CAPAG mitigation option recommendations described briefly here (and in more detail in Appendix F to this report) result not only in significant emissions savings, but offer significant additional benefits as well. A substantial expansion of renewable energy in North Carolina, for instance, may be accompanied by a corresponding increase in related jobs in North Carolina as energy investment shifts from fossil fuel production to the manufacture of renewable technologies. Portfolio diversification and hence energy security could be enhanced by the greater penetration of renewable energy resources into the energy marketplace. Moreover,
1 The net cost savings are based on fuel expenditures, operations, maintenance, and administrative costs, and amortized, incremental equipment costs. All NPV analyses here use a 5% real discount rate.

4-5
energy reliability could be enhanced through the penetration of distributed generation.2 Finally, air pollution-related public health and visibility impacts would decline with reduced fossil fuel-fired emissions from electricity generation. Nevertheless, some renewable sources (i.e., biomass) do emit small levels of GHGs.
Figure 4-4. Impact of supply- and demand-side mitigation option recommendations on electricity generation sector emissions (including demand reductions) mitigation case, 1990-2020
0
10
20
30
40
50
60
70
80
90
100
1990 1993 1996 1999 2002 2005 2008 2011 2014 2017 2020
MM
tCO
2e
Demand reductionImportsPetroleumbiomass and wasteNatural GasCoal
2 See, for example, the study entitled, “The Role of Distributed Generation in Power Quality and Reliability” by Energy and Environmental Analysis, Inc prepared for NYSERDA in 2004 (available from http://www.eea-inc.com/natgas_reports/DGPowerQualityReport-NYSERDA.pdf).

4-6
Table 4-1. CAPAG-recommended mitigation options and results for the Energy Supply sector
GHG Reductions (MMtCO2e)
Mitigation Option Name 2010 2020
Total 2007–2020
Net Present Value
(Million $)
Cost-Effective-
ness ($/tCO2e)
Level of Support*
ES-1 Renewable Energy Incentives 0.01 0.04 0.33 15 45.1 UC
ES-2 Environmental Portfolio Standard ***
ES-2a Original analysis 6.94 44.3 288.7 1,634 5.7 UC
ES-2b 20% combined target 5.90 23.4 166.2 409.80 2.5 UC ES-2c Load growth offset target 5.53 22.3 160.3 393.95 2.5 UC ES-3 Removing Barriers to CHP and Clean DG 0.69 2.8 20.1 127.98 6.4 UC
ES-4 CO2 tax and/or Cap-and-Trade
ES-4a Electric sector only 0.84 3.3 20.4 119 5.8 SMJ
ES-4b Economy-wide 1.84 7.1 47.7 284 6.0 SMJ
ES-5 Legislative Changes to Address Environmental and Other factors Not quantified UC
ES-6 Incentives for advanced coal
ES-6a Replacement of new 800 MW pulverized coal plant 0.00 3.9 31.0 949 30.6 UC
ES-6b Replacement of Existing 800 MW Pulverized Coal plant 0.00 5.4 42.9 2,061 48.1 UC
ES-7 Public Benefit Charge 0.8 3.4 24.4 329 13.5 SMJ
ES-8 Waste to Energy 0.0 0.0 0.02 –0.7 –36.8 UC
ES-9 Incentives for CHP and Clean DG Combined with ES–3 UC
ES-10 NC GreenPower Renewable Resources Program 0.01 0.2 0.95 35 37.0 UC
SECTOR TOTAL AFTER ADJUSTING FOR OVERLAPS** 6.5 62.7 375 –5.9 –0.016
REDUCTIONS FROM RECENT ACTIONS (none) 0 0 0 0 0
SECTOR TOTAL PLUS RECENT ACTIONS** 6.5 62.7 375 –5.9 –0.016
* UC = unanimous consent (all agree), SMJ = super majority (at least 80 percent or more agree).
** For ES-2, ES-4, and ES-6, emission reductions and costs associated with ES-2b, ES-4a, and ES 6a were used in the cumulative analysis.
*** On August 20, 2007, toward the end of the CAPAG process, Governor Mike Easley signed into law S.L. 2007-397, which establishes a Renewable Energy and Energy Efficiency Portfolio Standard for the state.
4-7
Energy Supply Sector Mitigation Option Descriptions
The ES sector includes emissions mitigation opportunities related to electricity generation. These options include mitigation activities associated with the generation, transmission, and distribution of electricity, whether generated through the combustion of fossil fuels or by renewable energy sources; in a centralized power station supplying the grid or by distributed generation facilities; or imported into the state.
ES-1. Renewable Energy Incentives (Biomass, Wind, Solar, Geothermal, Hydro)
This option focuses on financial incentives that promote the greater use of renewable energy. The incentives are focused primarily for residences, businesses, and other electricity end-users rather than for research and development, outreach, or inter-governmental programs. The effect of these incentives is to encourage investment in renewable power sources by providing direct financial support for adoption of these technologies.
ES-2. Environmental Portfolio Standard (Renewables and Energy Efficiency) with Renewable Energy Credit Trading
A renewable portfolio standard (RPS) is a mitigation option requiring investor-owned electric utilities to supply a certain percentage of retail electricity from renewable energy sources by a stipulated date. A type of RPS that includes measurable, verifiable and lasting efficiency options is an Environmental Portfolio Standard (EPS). Utilities can satisfy the renewable energy component of the EPS requirement by generating renewable energy themselves or by purchasing renewable energy credits (REC) from a renewable energy generator. A REC is equal to 1 kWh of eligible and verified renewable electricity produced
Three different targets were analyzed for the EPS, as briefly outlined in the bullets below:
• Aggressive target: this corresponds to a 31% combined energy efficiency and renewable energy target by 2020.
• 20% target: this corresponds to a 20% combined energy efficiency and renewable energy target by 2020.
• Load growth offset target: this corresponds to a combined energy efficiency and renewable energy target by 2020 that offsets load growth over that period.
ES-3 and ES-9. Removing Barriers and Providing Incentives to Combined Heat and Power (CHP) and Clean DG
Combined Heating Cooling and Power (CHP), also know as cogeneration, is a method of utilizing the thermal energy (heat) produced when generating electricity (power) in a single, coordinated process. CHP is more energy-efficient than separate generation of electricity at a
4-8
central electric plant and production of localized thermal energy for the end user. This distributed generation resource allows for recycling the heat, which is normally wasted to cooling towers or lakes at centralized electric generating stations, to meet onsite thermally-driven demand such as process and space heating, cooling, and dehumidification.
ES-4. CO2 Tax and/or Cap-and-Trade (Covering Sources Including Fossil, Renewable, and Nuclear on Life Cycle Basis)
A cap and trade system is a market mechanism in which CO2 and other GHG emissions are limited or capped at a specified level, and those participating in the system can trade permits (a permit is an allowance to emit one ton of CO2 or its equivalent in other GHGs) in order to lower costs of compliance. For every ton of CO2 (or other GHGs) released, an emitter must hold a permit. Therefore, the number of permits issued or allocated is, in effect, the cap on emissions. The government can give permits away for free (with permits distributed based on any one of many different criteria, to those participating in the cap and trade system or even to those who are not), auction them, or a combination of the two methods. Participants can range from a small group within a single sector to the entire economy, and can be implemented upstream (at the level of fuel extraction or import) or downstream at the points where fuel is consumed. The CAPAG considered two options for a cap-and-trade system in North Carolina: economywide and only on the power sector. Also, substantial discussion at the TWG and CAPAG levels focused on the geographic coverage of the system, with a number of members indicating that a national system is preferable to state or regional systems.
ES-5. Aligning Environmental and Profit Incentives Through Electric Sector Regulatory/Rate Reform
Several regulatory and rate reforms in North Carolina would encourage electric utilities to invest in clean, non-carbon-producing energy resources such as renewables and energy efficiency. Under the current rate structure, utilities have an incentive to invest in new large capital projects, which also may inhibit investments in energy efficiency. North Carolina could align the regulated electric utilities’ profit motive with increased energy efficiency by removing perverse disincentives to energy efficiency. For example, a carbon adder on new supply sources would have the effect of favoring low carbon-emitting sources such as renewables and/or demand side energy efficiency over higher carbon-emitting sources such as IGCC, natural gas, and coal stations, in ascending order of the impact of a carbon adder.
ES-6. Incentives for Advanced Coal
Integrated gasification combined cycle (IGCC) is an emerging technology for coal-fired electricity generation, offering the potential for higher efficiency and reduced cost of pollutant emissions control. IGCC involves partially combusting coal under high pressure to produce a synthetic gas, which is then used in a combined-cycle combustion plant to generate electricity. IGCC can be combined with carbon capture and sequestration or reuse (CCSR) in North Carolina to lead to significant CO2 emission reductions relative to those of conventional coal technology. Options for carbon storage are available though limited in the NC region. Based on

4-9
initial studies, potential sites are located offshore and just west of the state.3 Support for RD&D for a range of other new technologies to further reduce GHG emissions from coal generation is also envisaged in this option.
ES-7. Public Benefits Charge on Electric Bills to Support Energy Efficiency Programs
A public benefits charge (sometimes called a systems benefits charge) is a non-bypassable fee attributed to electric customers based on their electricity use in a given time period. The funds collected are then provided to a third party to provide energy efficiency programming. The purpose behind public benefits charges is most often to reduce energy consumption. While efficiency improvements carry significant air quality and GHG benefits, this impact is rarely a consideration for creation of a program. In a GHG-constrained mitigation option context, these benefits boost the attractiveness of a public benefits charge option.
ES-8. Waste to Energy
The combustion of waste materials, or their conversion by biological or thermo-chemical means to an easily-used fuel, can be used to produce heating, cooling or electric generation with lower GHG emissions than many conventionally-fueled alternatives. This waste-to-energy mitigation option focuses exclusively on the use of methane derived from Municipal Sewage Treatment (MST) to produce electricity. This is due to the fact that the use of other waste resources to substitute for fossil fuels—including landfill gas (LFG), animal waste, agriculture waste, and forestry waste—are all covered under the Agriculture, Forestry, and Waste Management (AFW) TWG, and direct combustion of MSW is opposed by environmental interests.
ES-10. NC GreenPower Renewable Resources Program
NC GreenPower is an independent, nonprofit organization established to improve North Carolina’s environment through voluntary consumer contributions toward the production of renewable energy. The goal of NC GreenPower is to supplement the state’s existing power supply with more green energy—electricity generated from renewable resources like the sun, wind and organic matter. The program accepts financial contributions from North Carolina citizens and businesses to help offset the cost to produce green energy. NC GreenPower differs from a Renewable Portfolio Standard (RPS) in that the RPS requires that electric utilities provide a certain level of renewable energy capacity in their generation mix. NC GreenPower is entirely voluntary, with the revenue going toward paying incremental costs of renewable energy generation. Also, because all power purchased through NC GreenPower is produced inside the state, the program provides local and statewide economic development benefits.
3 See “Potential Sinks for Geologic Storage of Carbon Dioxide Generated in the Carolinas”, by Smith R., et al, prepared for the Southern States Energy Board, March 2007; available at http://www.beg.utexas.edu/environqlty/co2seq/pubs_presentations/CarolinasSummary_16April07.pdf.
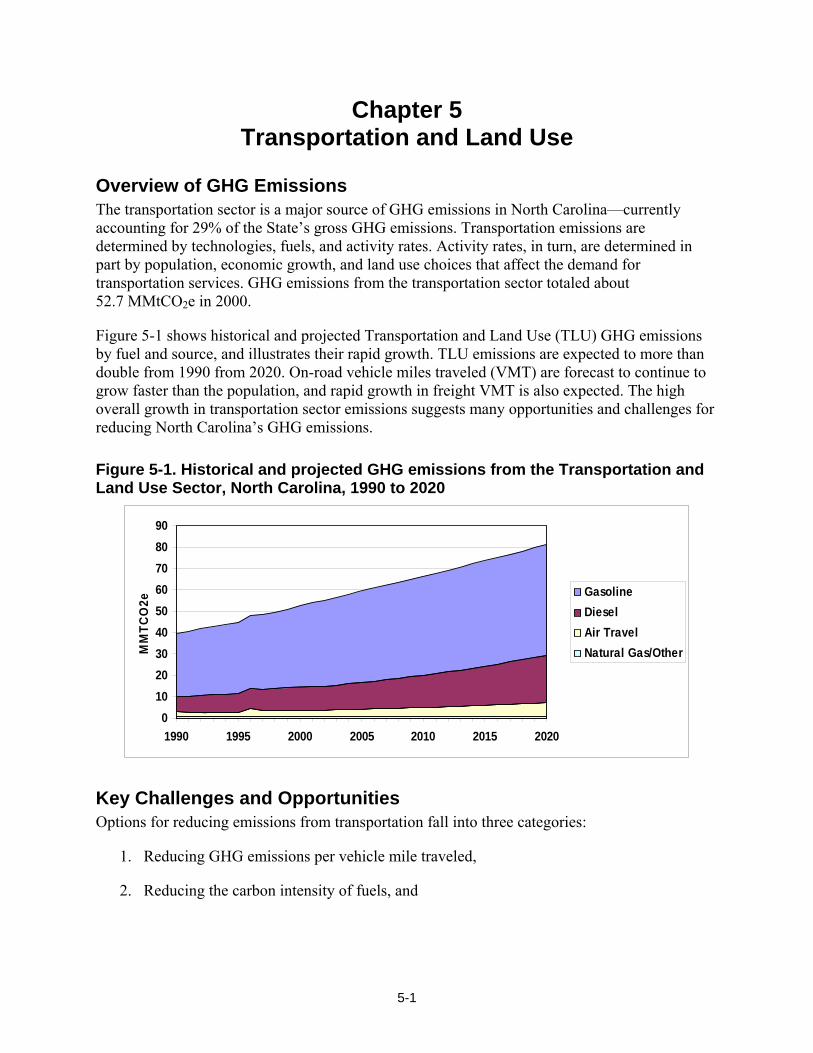
5-1
Chapter 5 Transportation and Land Use
Overview of GHG Emissions The transportation sector is a major source of GHG emissions in North Carolina—currently accounting for 29% of the State’s gross GHG emissions. Transportation emissions are determined by technologies, fuels, and activity rates. Activity rates, in turn, are determined in part by population, economic growth, and land use choices that affect the demand for transportation services. GHG emissions from the transportation sector totaled about 52.7 MMtCO2e in 2000.
Figure 5-1 shows historical and projected Transportation and Land Use (TLU) GHG emissions by fuel and source, and illustrates their rapid growth. TLU emissions are expected to more than double from 1990 from 2020. On-road vehicle miles traveled (VMT) are forecast to continue to grow faster than the population, and rapid growth in freight VMT is also expected. The high overall growth in transportation sector emissions suggests many opportunities and challenges for reducing North Carolina’s GHG emissions.
Figure 5-1. Historical and projected GHG emissions from the Transportation and Land Use Sector, North Carolina, 1990 to 2020
0102030405060708090
1990 1995 2000 2005 2010 2015 2020
MM
TCO
2e
GasolineDieselAir TravelNatural Gas/Other
Key Challenges and Opportunities Options for reducing emissions from transportation fall into three categories:
1. Reducing GHG emissions per vehicle mile traveled,
2. Reducing the carbon intensity of fuels, and
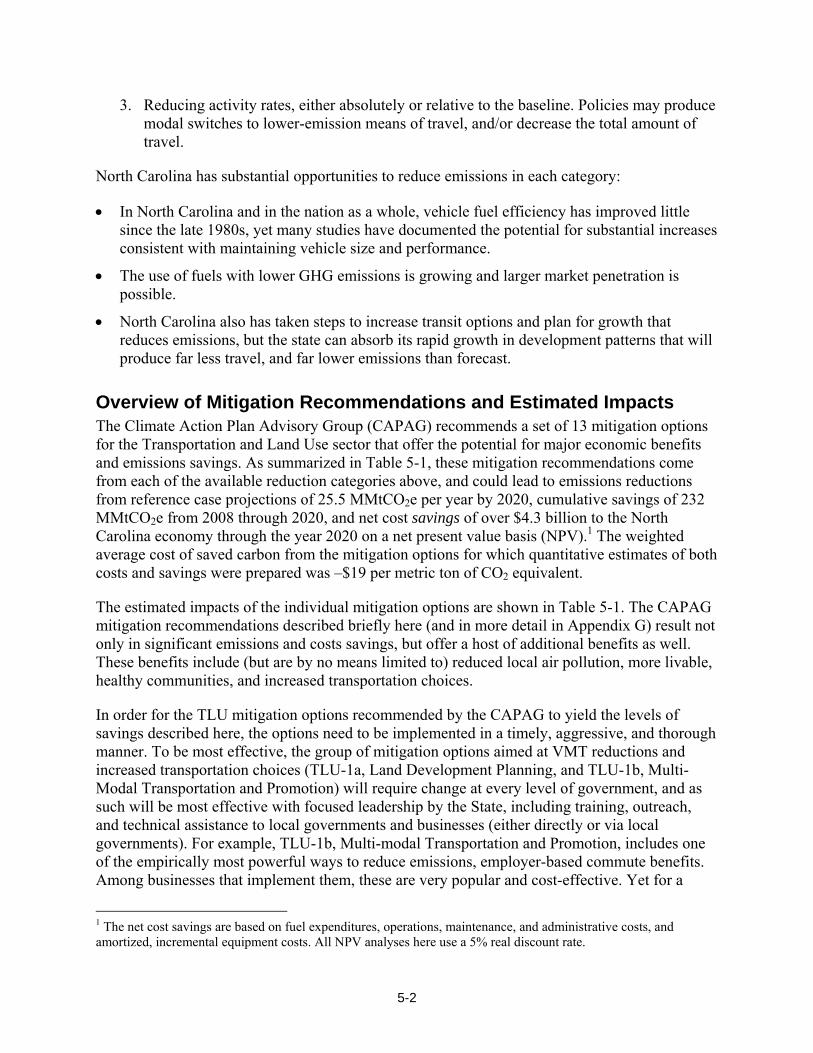
5-2
3. Reducing activity rates, either absolutely or relative to the baseline. Policies may produce modal switches to lower-emission means of travel, and/or decrease the total amount of travel.
North Carolina has substantial opportunities to reduce emissions in each category:
• In North Carolina and in the nation as a whole, vehicle fuel efficiency has improved little since the late 1980s, yet many studies have documented the potential for substantial increases consistent with maintaining vehicle size and performance.
• The use of fuels with lower GHG emissions is growing and larger market penetration is possible.
• North Carolina also has taken steps to increase transit options and plan for growth that reduces emissions, but the state can absorb its rapid growth in development patterns that will produce far less travel, and far lower emissions than forecast.
Overview of Mitigation Recommendations and Estimated Impacts The Climate Action Plan Advisory Group (CAPAG) recommends a set of 13 mitigation options for the Transportation and Land Use sector that offer the potential for major economic benefits and emissions savings. As summarized in Table 5-1, these mitigation recommendations come from each of the available reduction categories above, and could lead to emissions reductions from reference case projections of 25.5 MMtCO2e per year by 2020, cumulative savings of 232 MMtCO2e from 2008 through 2020, and net cost savings of over $4.3 billion to the North Carolina economy through the year 2020 on a net present value basis (NPV).1 The weighted average cost of saved carbon from the mitigation options for which quantitative estimates of both costs and savings were prepared was –$19 per metric ton of CO2 equivalent.
The estimated impacts of the individual mitigation options are shown in Table 5-1. The CAPAG mitigation recommendations described briefly here (and in more detail in Appendix G) result not only in significant emissions and costs savings, but offer a host of additional benefits as well. These benefits include (but are by no means limited to) reduced local air pollution, more livable, healthy communities, and increased transportation choices.
In order for the TLU mitigation options recommended by the CAPAG to yield the levels of savings described here, the options need to be implemented in a timely, aggressive, and thorough manner. To be most effective, the group of mitigation options aimed at VMT reductions and increased transportation choices (TLU-1a, Land Development Planning, and TLU-1b, Multi-Modal Transportation and Promotion) will require change at every level of government, and as such will be most effective with focused leadership by the State, including training, outreach, and technical assistance to local governments and businesses (either directly or via local governments). For example, TLU-1b, Multi-modal Transportation and Promotion, includes one of the empirically most powerful ways to reduce emissions, employer-based commute benefits. Among businesses that implement them, these are very popular and cost-effective. Yet for a
1 The net cost savings are based on fuel expenditures, operations, maintenance, and administrative costs, and amortized, incremental equipment costs. All NPV analyses here use a 5% real discount rate.

5-3
variety of reasons, businesses implement these benefits at a much higher rate with government technical assistance.
Next, the State Clean Car program must clear several hurdles before North Carolina or any other state can adopt it, including EPA approval of the original California Clean Car Program (that other states can then opt into) and a court challenge to the underlying notion of regulation of GHG emissions from vehicles. If for any reason North Carolina is not able to implement the Clean Car Program, other options would need to play a larger role if the State is to meet its emissions reduction goals. For example, the mitigation options under the Rebates/Feebates Options Bundle (TLU-3b) could substantially improve fuel efficiency through market mechanisms and consumer labeling. Feebate proposals usually have two parts: (1) a fee on relatively high emissions vehicles; and (2) a rebate or tax credit on low emissions vehicles.
As a final example, Pay-As-You-Drive Insurance would require the State to not only allow insurance companies to offer customers a way to save each time a customer chooses to drive less, but also to promote that option, if the State is to see the levels of adoption analyzed here.
Most of the recommended mitigation options would produce substantial economic benefits for North Carolina. The sources, and calculations, of these benefits are detailed in Appendix G. Because the form of several of the recommendations leaves the State and its constituents substantial latitude in how to act to achieve the recommended goals, it was not possible to estimate financial costs and benefits for all options.
For example, TLU-1a recommends that the State’s local jurisdictions develop growth plans. Given the substantial portion of forecast emissions growth driven by increasing driving, growing in more compact, mixed-use patterns is simply essential to meeting the State’s emissions reduction targets. For the same reason, changing development patterns also offers the single largest potential emissions reduction from transportation. Each jurisdiction can develop its own approach to planning for growth, and because we cannot know which approach each will choose, we cannot estimate the cost for each, or, as a result, the likely total cost. In the case of TLU-1a, CCS reviewed experience in, and estimates for, growth planning in other states. With few exceptions, experience and forecasts across a wide variety of planning choices show substantial net cost savings from planned growth relative to the kind of growth now prevalent in North Carolina. North Carolina and its communities would likely save billions of dollars from shorter sewer lines, fewer needed new roads, and fewer new schools. But given the wide range of choices available to North Carolina communities under recommended TLU-1a, it is not possible to put a point estimate on the benefits that will likely be produced by those choices
The benefits from other recommended options were more straightforward to forecast. The technology required in TLU-5, tailpipe GHG standards for example, would more than pay for itself in reduced fuel consumption, while substantially reducing North Carolina’s GHG emissions.
Cost Savings Several of the TLU options (below) show higher estimated net savings than most other options both in and out of TLU. This subsection summarizes briefly the source of those estimates.

5-4
TLU-1b. Multi-Modal Transportation and Promotion A wide variety of empirical experience suggests that the policies and investments listed in the Option Design and Implementation Mechanisms sections are likely to produce substantial net savings, as in the following four examples.
1. Transit investments generally Nationally, transit produces net economic returns on investment: “For every $10 million invested, over $15 million is saved in transportation costs to both highway and transit users. These costs include operating costs, fuel costs, and congestion costs.”2
At a high level, then, the benefits of the proposed investment in transit can be estimated as follows:
NC DOT budget: $2.5 billion/year 13% $325,000,000/year × 1.5 savings multiplier $487,500,000/year in savings –cost of investment $325,000,000/year Total benefits $162,500,000/year
This substantial return on investment is the basis for the cost savings number reported in the summary table. Without knowing more about how North Carolina will make its transit investments, it is not possible to do a finer-grained analysis. However, the following examples suggest that the 1.5x savings multiplier may be conservative. [Portions of the following sections dealing with a possible savings multiplier are italicized.]
2. Transit fare initiatives Unlimited Access transit at the University of California-Los Angeles costs $810,000 a year, and has total benefits of $3,250,000 a year,3 a return on investment of more than 4x. Similar programs at other universities show similar results.4 The many educational institutions in North Carolina could see similar savings.
Universities are in some senses unique institutions, but the general types of challenges (especially demand for, and costs of providing, parking), and the types of benefits enjoyed in response to commute benefits programs, are equally available to businesses. A report on this topic notes:
“Eco Passes also offer significant advantages for employers who offer free parking to all commuters, because those who shift from driving to transit will reduce the demand for employer-paid parking spaces. A survey of Silicon Valley commuters whose employers offer Eco Passes found that the solo-driver share fell from 76 percent before the passes were offered to 60 percent afterward. The transit mode share for commuting increased from 11 percent to 27 percent. These mode shifts reduced commuter parking demand by approximately 19 percent.
2 Cambridge Systematics, Inc., Public Transportation and the Nation’s Economy: A Quantitative Analysis of Public Transportation’s Economic Impact, 1999. 3 Jeffrey Brown, Daniel Hess, and Donald Shoup, “Fare-Free Public Transit at Universities: An Evaluation,” Journal of Planning Education and Research 23:69–82, 2003. 4 Jeffrey Brown, Daniel Hess, and Donald Shoup, “Unlimited Access,” Transportation 28:233–267, Kluwer, 2001.

5-5
“Given the high cost of constructing parking spaces in the Silicon Valley, each $1 per year spent to buy Eco Passes can save between $23 and $333 on the capital cost of required parking spaces.”5
3. Transit and non-SOV options information and promotion: Per public dollar, a Transportation Management Organization (TMO) can accommodate seven times as many commuters as new highway investment.6
4. TDM investments on the basis of avoided driving: This policy is estimated to reduce VMT by 3,317,688,733 in 2012, and 3,970,779,011 in 2020. The current IRS-estimated cost of driving a mile in a personal vehicle is $0.485. At that rate, total savings will be
2010 2020 (constant $) VMT reduced $3,317,688,733 $3,970,779,011
@ $0.485 / VMT, Avoided costs =
$1.6 billion $1.9 billion
–Cost of investment $325,000,000 $325,000,000 Net savings $1.2 billion $1.6 billion
Thus, the estimated $162,500,000/year in total savings for this Option used for the summary table is very conservative.
TLU-3a. Surcharges to Raise Revenue If, as in the above example, revenue is used to fund multi-modal options promotion that reduces VMT, then we can estimate net benefits as shown below:
2010 2020 (constant $)
VMT reduced $1,850,000,000 $1,850,000,000 @ $0.485 / VMT, Avoided costs =
$897,250,000 $897,250,000
–Cost of investment $37,000,000 $37,000,000 Net savings $860,250,000 $860,250,000
If, in an effort to be conservative, we limit the savings to the 7× savings multiplier found in a study for Minnesota DOT, 7 then the net benefits fall as follows:
2010 2020 (constant $) Cost of investment $37,000,000 $37,000,000
Avoided cost @ 7x investment $259,000,000 $259,000,000 Net savings $222,000,000 $222,000,000
We use this lower number in Table 5-1.
5 Ibid., p. 260. 6 Minnesota Department of Transportation, Modal Options Identify Project, “Measurement and Evaluation,” 2006. 7 Ibid.
5-6
TLU-5. Tailpipe GHG Standards A review of $/ton estimates prepared for the California Clean car-type regulation for California Air Resources Board (CARB), Northeast States for Coordinated Air Use Management (NESCAUM), and CCS produces an estimate of between $117 saved for each metric ton of CO2e reduced at the high end, and roughly a third of that (~$38 saved for each ton) at the low end. We used the low end in an effort to be conservative. This figure takes into account not only the higher initial cost of the California Clean Car, but also the costs of financing that car. Both the higher costs and the savings from reduced fuel consumption would start immediately upon purchase, and CARB estimates that the net savings would begin immediately as well.
Table 5-1. CAPAG-recommended mitigation options and results for the Transportation and Land Use Sector
GHG Reductions (MMtCO2e)
Option No. Mitigation Option
2010 2020 Total2008–2020
Net Present Value
2008–2020 (Million $)
Cost- Effective-
ness ($/tCO2e)
Level of Support*
TLU-1a Land Development Planning 2.6 8.0 58.2 Net savings SMJ
TLU-1b Multi-Modal Transportation and Promotion (formerly TLU-2) 3.7 5.8 52.4 –1,300 –25 UC
TLU-3a Surcharges to Raise Revenue 1.2 2.2 15.7 –1,800 –117 SMJ
TLU-3b Rebates/ “Feebates” to Change Fleet Mix 0 <0.5 2.8 Not quantified
–40 to +10 SMJ
TLU-4 Truckstop Electrification Included in TLU-8 Net savings UC
TLU-5 Tailpipe GHG Standards 0 8.1 44.5 –1,690 –38 SMJ
TLU-6 Biofuels Bundle 1.9 4.5 35.4 Not quantified UC
TLU-7 Procure Efficient Fleets Included in TLU-6 UC
TLU-8 Idle Reduction/Elimination Policies 0.1 0.2 2.2 –6 –4 UC
TLU-9 Diesel Retrofits 0.3 2.2 13.5 Not quantified UC
TLU-11 Pay-As-You Drive Insurance 2.3 5.3 42.0 Expected net savings SMJ
TLU-12 Advanced Technology Incentives Not quantified UC
TLU-13 Buses – Clean Fuels Included in TLU-6 UC
SECTOR TOTAL AFTER ADJUSTING FOR OVERLAPS 11.1 25.5 232.3 –4,350 –19
REDUCTIONS FROM RECENT ACTIONS 0 0 0 0 0
SECTOR TOTAL PLUS RECENT POLICY ACTIONS 11.1 25.5 232.3 –4,350 –19
* UC = unanimous consent (all agree); SMJ = super majority (at least 80% or more agree). TLU-2 was renamed TLU-1b because of its linkage to TLU-1a. There is no mitigation option TLU-10, because this catalog option was not advanced by the CAPAG.
Note that for TLU-5, the estimated emission reduction for each year from 2008 through 2020 was multiplied by the cost-effectiveness value of -$38/ton to estimate cost savings for each year, and then the cost savings for each year was discounted and summed to estimate the NPV. Thus, the cost-effectiveness value of –$38/ton cannot be replicated by dividing the cumulative cost savings by the cumulative emission reduction shown in this table.

5-7
Transportation and Land Use (TLU) Mitigation Option Descriptions
The Transportation and Land Use Sectors include emissions reduction opportunities related to reducing GHG emissions per miles of travel, reducing the carbon content of transportation fuels, and using transportation and land use policy to reduce the need to travel by high-emitting modes. Additional detail on each of the options summarized below can be found in Appendix G.
TLU-1a. Land Development Planning
The CAPAG recommends that North Carolina promote land planning and development that supports conservation of high quality natural and cultural resources and supports more compact development, and as a result reduces growth in driving and emissions. Do so by supporting and promoting private and public planning and development practices, including infrastructure provision, that reduce the number, length, or travel mode of trips made in North Carolina.
The suggested statewide goal is to reduce projected increase in VMT by 10% statewide by 2020. (Value was developed after review of targets in several other states, and an assessment by the group of the ability to meet the target.)
Meeting the goal will require diverse implementation tools. Providing many options, statutory changes, and program assistance for smaller communities will be essential.
Land Use and Development Legislation to Require Adoption of a Growth Plan • Each municipality and county shall develop a land use and development plan.
The plan should designate planned growth areas and natural resource areas within that jurisdiction and any extraterritorial jurisdiction for a planning horizon of at least 25 years. The land use and development plan should include standards and criteria for conservation area and/or urban service area designations to accommodate a minimum 20-year growth forecast agreed upon by the each county and municipality; establish development and conservation goals; recognize important natural and human resources; and, express appropriate policies, practices and strategies to implement these goals. Local planning programs should include appropriate public involvement processes to achieve consensus on the development and conservation vision for the community.
• Require and support integration of transportation with land use plans.
Maryland, Minnesota, and Denver, CO, as well as the non-profit Triangle Land Conservancy have developed “greenprints” of areas that have old-growth forests, productive agricultural lands, water supply watersheds, historic sites or other critical and irreplaceable resources. Adding this as a required element of all transportation plans would be a simple and meaningful step that would greatly enhance the effect and benefits of NC GS 136-66.2 without requiring new zoning or regulatory powers. The November 2004 passage of tax increment financing legislation demonstrates that North Carolina can and does make room for new ideas that help achieve economic development goals in concert with infill

5-8
development objectives. The NC Small Town Economic Development (NCSTEP) initiative created grant funds that are being used in 33 communities to plan for growth and development in a way that will help those communities benefit from growth and minimize negative impacts.
Regulatory incentives such as withholding transportation funds for noncompliance have worked in Tennessee and should be considered in North Carolina as well.
TLU-1b. Multi-Modal Transportation and Promotion
The CAPAG recommends that the State work with its constituents to shift passenger transportation mode choice to lower emitting choices. Ensure that transportation is integrated with and appropriately serves land-use development plans (developed under TLU-1a). Implement the North Carolina transportation plan allocation of 13% of state transportation spending to transit.
Implement policies that increase use of public transportation, producing a shift to lower emitting mode choices, by the following policies:
• Improve Transit Service (frequency, convenience, quality).
• Expand Transit Infrastructure (rail, bus, Bus Rapid Transit).
• Focus new development on transit-served corridors (Transit-Oriented Development).
• Expand Transit Marketing and Promotion (including tax-free and employer-paid Commuter Benefits, and Parking Cash Out).
• Expand Transportation System Management and Design, which speeds both transit and other traffic.
• Improve bike and pedestrian infrastructure both as feeders and as stand-alone modes.
• Many programs are in place and are therefore immediately expandable/implementable. Enhancement and continuation can begin short-term. These implementation mechanisms include
○ Aggressively support and aid the creation of Regional Transportation Districts (RTDs). RTDs can sell bonds for capital projects, and member governments can levy taxes for operation and maintenance subject to voter approval.
○ Make planning and funding rules more flexible to allow transit operators to provide service to places outside of their municipal jurisdictions.
○ Abolish or reduce minimum parking requirements in zoning codes, and allow localities to establish parking maximums.
○ Create a best practice guide and recognize developers who adhere to best practice when designing and locating new private and public development.
○ Require planning to extend beyond 5 years (20 years recommended) for all systems. ○ Create incentives or require the purchase of biodiesel fuel (minimum: B20) as a part of
all public bus replacement programs. Conover has already done so with great results.
5-9
○ Location of State Facilities—Locate state facilities near transit facilities. Where and when appropriate/possible all state government offices should be located downtown. Similarly, provide transit to serve concentrations of state employees.8
○ State Targeting of Infrastructure Investments—Legislatively appropriated capital outlay funds, state public revolving loan fund, and other state-funded infrastructure initiatives should be used for projects that encourage walkable and traditional communities, and are supportive of transit.
○ Make maintenance of infrastructure a priority—Fix it First. Revise any state infrastructure programs; transportation, water, sewer, that fund new systems but not maintenance or upgrades for existing systems.
○ Replace “average cost pricing” for utilities services with rate structures that charge full marginal costs for both new infrastructure and for water, sewer, electricity, and telephone service delivery.
○ Fund the transportation-related programs in this mitigation option with monies generated by other mitigation options such as feebates and/or gas tax.
TLU-3a. Surcharges to Raise Revenue
The CAPAG recommends that the State vary motor vehicle registration fees by vehicle emissions to provide a surcharge on higher emitting vehicles.
This surcharge would raise funds for State of North Carolina to support transportation-related projects that reduce GHG. It would raise these funds through a mechanism that is directly tied to a significant source of GHG emissions from cars and trucks. It is not envisioned that the scale of the surcharge would affect the fleet mix; the goal of this policy is revenue-raising that is tied to emissions.
• 5.1 million North Carolina LDV registrations per year at an average of $7.25 per vehicle would produce $37 million per year for programs to reduce emissions from travel.
• The most efficient regionally funded regional commuter programs can reduce VMT for a cost of 2 cents/mile. Most regional commuter programs cost more per mile. On the other hand, few are as well funded as this proposal, and there are almost certainly economies of scale and scope.
• $37 million per year times $0.02 per mile equals 1,850,000,000 VMT = 2% of total statewide VMT; 3% of total urban LDV VMT.
TLU–3b. Rebates/Feebates to Change Fleet Mix
The CAPAG recommends that the State charge a sliding scale of fees and rebates for new light-duty vehicles based on their emissions of greenhouse gases and/or other measures of a vehicle’s
8 This is an Executive Order from North Carolina Governor James Holshouser.
5-10
environmental impacts. This will provide an incentive for manufacturers to sell cost-effective efficiency technologies, and for consumers to buy lower-emitting vehicles by
• Having price signals reflect emissions levels and thus have emissions levels more directly enter buying decisions, and
• Sending a signal to manufacturers to produce increasingly low-emitting vehicles for the market.
The revenue should be used to create a dedicated revenue stream for promotion of low emitting or no emitting GHG transportation alternatives (e.g., hybrid tax credits, transit infrastructure). In addition,
• Emissions could be considered relative to other vehicles within each class or across classes based on their design variations.
• The rebate/feebate could be set as a multiplier for an excise tax so that the fee or rebate is determined not only by the emissions rate of the vehicle but by its price as well.
• Generally the rebate/feebate design needs to be simple, minimize the number of pivot points, be well-documented, and be designed to maximize consumer attention.
A wide variety of economics literature finds that vehicle buyers do not buy all the efficiency technology that is cost-effective, taking into account the net present value of both the fuel savings and the additional technology cost. Feebate analyses find that the fuel savings that result from a feebate program would pay for additional costs, producing net cost savings:
“The reduction in consumer surplus is more than compensated for by unvalued fuel savings that are realized. The benefits are positive for all rates up to $1000 but marginal costs begin to outweigh benefits between $500 and $1000. Adopting two or more classes reduces the benefits significantly while creating a relative subsidy for larger vehicles.”
As a result: Net benefits range from $40 per ton for a low feebate, to $10 per ton for a high feebate.
TLU-4. Truck Stop (and Places Where Trucks Stop) Electrification
The CAPAG recommends that North Carolina reduce idling-induced emissions from heavy-duty diesel trucks by providing—or helping the market to provide—electrical hook-ups to power heating, cooling, and other needs while stopped.
North Carolina should analyze existing pilot projects at major truck stops on interstate highways (principally, I-40 and I-85) and initiate other efforts at other places where truck traffic is high; then, progress to include all major truck stops statewide with at least one multi-unit electrified stop in each of the 17 urban areas in North Carolina.
North Carolina has several TSE pilots in place. While programs are in discussion there are no policies or laws to enforce participation.
5-11
TLU-5. Tailpipe GHG Standards
The CAPAG recommends that North Carolina join with the 13 other states that have adopted the State Clean Car Program to reduce emissions of GHGs from vehicle operation.9
TLU-5 would use California Clean Car standards for cars and light trucks to reduce GHG emissions. California standards require GHG emissions reductions of about 30 % from new vehicles, phased in from 2009 to 2016, through a variety of means.10 Other Clean Car Program elements include standards requiring reductions in smog- and soot-forming pollutants, and promoting introduction of very low-emitting technologies into new vehicles.
The General Assembly could enact legislation in 2009, at the earliest, unless tied to a 2007 bill carried over to 2008 so that North Carolina can implement the California standards.11
TLU-6. Biofuels Bundle
The CAPAG recommends that the State work to increase market penetration of biofuels in North Carolina by a mixture of policies (voluntary and/or mandatory) to achieve feasible goals—offsetting fossil fuel use (gasoline) with production and use of starch-based and cellulosic ethanol.
Replacing gasoline with ethanol can reduce GHG’s to the extent that the ethanol is produced with lower GHG content. Biodiesel has a lower GHG content than fossil diesel, so using biodiesel instead of fossil diesel reduces GHG emissions.
This option is linked with policy options AFW-2, Biodiesel Production, and AFW-6, Policies to Promote Ethanol Production. This option seeks to develop the demand for biofuels, whether produced locally or out-of-state. (Options AFW-2 and AFW-6 pursue the GHG benefits achievable beyond TLU options by promoting in-state production of ethanol and biodiesel using feedstocks and production methods with greater GHG benefits than the likely business-as-usual national market production methods, e.g., conventional starch-based ethanol.)
The goals for this policy should be phased in utilizing biofuels to replace the specified percentages of gasoline and diesel consumed for transportation throughout North Carolina by the specified years, as shown Table 5-2, below. The goals of this policy can be achieved through a combination of a renewable fuels standards, financial incentives, outreach, and market-based mechanisms.
9 Also known as the “Pavley” standards (after Assemblywoman Fran Pavley who introduced the legislation) or “California GHG emission standards.” 10 For detailed information, see: http://www.arb.ca.gov/cc/ccms/ccms.htm 11 The California standards currently are being litigated, and timing may be affected as a result. Recent court decisions have found that CO2 can be a pollutant under the Clean Air Act (CAA). Many observers see this as clearing the way for the required EPA waiver under the CAA.

5-12
Table 5-2. Goal levels and timing for biofuels implementation
Phase Year Percentage of Gasoline
to be Replaced by Biofuels Percentage of Diesel
to be Replaced by Biofuels 1 2010 10% (E10 equivalent) 5% (B5 equivalent) 2 2015 15% (E15 equivalent) 10% (B10 equivalent) 3 2020 20% (E20 equivalent) 15% (B15 equivalent) 4 2025 25% (E25 equivalent) 20% (B20 equivalent)
The CAPAG recommends pursuing these goals through the following mechanisms:
• Pursue DOE and State funding for more alternative fuel pumps throughout the State and for introducing appropriate infrastructure throughout the State. Some federal tax incentives currently exist for the purchase of alternative fuel vehicles. When the federal incentives expire, examine the feasibility/need to continue such incentives for alternative fuel vehicles.
• Reduce or eliminate the motor fuels tax on biodiesel and ethanol (E85). Develop a system to provide for monthly credit for biodiesel and E85 blended fuel that would be equivalent to the state motor fuels tax owed on the biofuels portion of the fuel blend. (This could follow in the wake of elimination of tax on “home brew” biodiesel by 2007 legislature.)
Monthly tax credits would be claimed on the same form (Biodiesel and Fuel Alcohol Providers Form) marketers currently file with the North Carolina Department of Revenue (DOR) Motor Fuel Tax Division to pay fuel tax. This would reduce pump price of Biofuels as marketers would pass most of the credit on to consumers to be competitive. Credits could be paid out of General State Revenues, DOT highway funds. Credit would be revenue neutral as it would be equal to the tax that would have been paid by marketers for biofuel portion of blend.
• Develop a $0.25/gallon credit for biodiesel and ethanol use in North Carolina vehicles.
As above, the tax credit would be claimed on the DOR Biodiesel and Fuel Alcohol Providers Form. Similarly, this would reduce price of Biofuels as marketers pass the credit on to consumers in order to be competitive. General State Revenues, or DOT highway funds could pay for the credit. Unlike above, this credit would not be revenue neutral as the state would be providing incentive for fuel sold to non-taxable entities (local and state government) as well as sales to taxable entities. However, only the biofuel portion of blended fuel would be eligible for 25-cent credit. For example a B20 blend would get a 5-cent credit.
• Create a tax credit for biodiesel producers.
• Develop a mandated Renewable Fuel Standard (RFS), corresponding to the penetration rates listed above.
The RFS should include a cost trigger, so that if the cost of alternative fuels exceeds conventional fuels by more than a specified amount, the RFS would be temporarily removed. The cost trigger should be based on costs over a period of time, and not spot prices. Additionally, production issues should be included in the trigger, such as water use in growing corn (or other crops) for the biofuels, such that the production of the biofuels does not increase GHG emissions or cause other resource problems.

5-13
TLU-7. Procure Efficient Fleets
The CAPAG recommends that the State reduce GHGs by increasing the efficiency of vehicle fleets generally, beginning with government lead by example. Also increase fleet use of alternative fuels.
• Increase government fleet use of low-GHG fuels and more efficient vehicles to reduce greenhouse gas emissions from fleets. In addition to CO2 reductions, this would reduce emissions affecting ozone, sulfur, and carbon monoxide loadings.
• Set statewide GHG reduction targets for fleets phased in over period of probably 8-10 years to allow fleet turnover to absorb most of the costs of replacing existing fleets. Other measures regarding more frequent maintenance and part specifications could be phased in much faster.
TLU-8. Idle Reduction/Elimination Policies
The CAPAG recommends that the State implement state policies, and support the development of local policies, to reduce hours of operation and thus emissions from idling trucks and buses (principally), perhaps off-road engines as well.
These would reduce greenhouse gas emissions from heavy vehicles and reinforce Truck Stop Electrification (TSE).
This would require working with trucking groups, truck stops, and places where trucks stop as well as with government to formulate an agreeable policy approach, phasing schedule, and legislative content.
About 15 states and a number of local governments have adopted anti- idling legislation.12 More are sure to follow or are already being discussed at some level. Toronto has had a law in place since 1996. Many North Carolina counties and the State Board of Education (Policy No. EEO-M-003) have adopted school bus idling policies already.13 The Clean School Bus USA program (USEPA) should also be consulted.14
TLU-9. Diesel Retrofits/Retirement
The CAPAG recommends that the State reduce diesel emissions from older diesel engine/emission systems through a broad retrofit and/or retirement program. Create incentives and encourage retrofits through a combination of funding and education/promotion.
12 See http://atri-online.org/research/idling/Cab%20Card%20July%202006.pdf 13 See http://www.ncbussafety.org/idling.html 14 See http://www.epa.gov/cleanschoolbus/

5-14
This policy would reduce children’s exposure to diesel emissions by retrofitting school buses in North Carolina with diesel oxidation catalyst (DOC) control devices, and/or diesel particulate filters, which have the auxiliary benefit of reducing some GHGs and carbon black.
Beyond school buses, the CAPAG recommends that the state speed retirement and/or retrofit of all older diesels through information and incentives.
• Utilize various funding mechanisms to purchase DOC pollution control devices and/or particulate traps for school buses that are not equipped with pollution control devices.
• Provide information and education: An information and education component is needed to provide truck and bus owners, school districts, and municipal organizations with information regarding the significant emissions reductions that could be achieved by retrofitting or retiring certain truck or bus engines with high annual emissions and replacing them with vehicles meeting the new emissions standards. Provide information on potential funding partners, grants, or loans available from a number of organizations for this purpose.
• Develop funding mechanisms or incentives: Develop a loan or grant program allowing truck owners to accelerate new vehicle purchases or to apply retrofit technologies to their fleets.
Currently in North Carolina, there is an ongoing effort to retrofit school buses across the State with diesel pollution control devices. An estimated 15% of the school buses in the State are already equipped with some type of pollution control device. Sources of funding include Federal and State grants, local funding and gifts from private industry. The primary purpose of these diesel pollution control devices is to reduce particulate matter.
Legislation currently under consideration, HB 1912: School Bus Retrofits in Nonattainment Areas, addresses school bus retrofits.
TLU-11. Pay-As-You-Drive Insurance
The CAPAG recommends that the State use Pay-As-You-Drive (PAYD) insurance pricing to convert a portion of insurance to a variable cost with respect to vehicle travel, so premiums are directly related to mileage. PAYD makes insurance more actuarially accurate and allows motorists to save money when they reduce their mileage. The less you drive the more you save.
Proposal would require insurance companies to offer PAYD as part of their menu of insurance choices in North Carolina. A pilot project could be implemented first on a small scale as soon as possible. Option design is to have full North Carolina light-duty fleet PAYD coverage by 2020.
TLU-12. Advanced Technology Incentives
Technology will play a vital role in dramatically reducing carbon emissions from the cars of the future. Fuel cells, plug-in hybrid, low weight carbon-fiber bodies, and other technologies will require research, development, and commercialization. The CAPAG recommends that because of its strong research university and both its high-tech and auto parts manufacturing, that North
5-15
Carolina (especially through the Department of Commerce) encourage advanced automobile technology research and recruit the new generation of manufacturers.
Studies can evaluate if there is an economic opportunity around the development and commercialization of advanced technology vehicles and suggest possible models for the Department of Commerce to take advantage of such opportunities.
The following are goals of this policy:
• Enable North Carolina’s economy to establish itself in the research, development, and commercialization of advanced automotive technologies.
• Grow North Carolina’s capacity to recruit sustainable industry.
TLU-13. Buses – Clean Fuels
The CAPAG recommends that TLU-7 (Procure Efficient Fleets) also include transit bus fleets.

6-1
Chapter 6 Agriculture, Forestry, and Waste Management
Overview of GHG Emissions The agriculture, forestry, and waste management (AFW) sectors are directly responsible for a small amount of North Carolina’s current greenhouse gas (GHG) emissions. For agriculture, net emissions were 11.0 million metric tons (MMt) of carbon dioxide equivalent (CO2e) in 2000. Agricultural emissions include methane (CH4) and nitrous oxide (N2O) emissions from the digestive systems of livestock (enteric fermentation), manure management, agriculture soils, and agriculture residue burning. As shown in Figure 6-1, emissions from agricultural soils and manure management in cattle account for the largest portions of agricultural emissions. The agricultural soils category includes N2O emissions resulting from activities that increase nitrogen in the soil, including fertilizer (synthetic, organic, and livestock) application and production of nitrogen-fixing crops. Agricultural residue burning emissions are too small to show up in Figure 6-1.
Note that, in keeping with United States Environmental Protection Agency (US EPA) methods and international reporting conventions, the inventory and forecast covers human-caused (anthropogenic) sources of GHGs. There could be some natural sources of GHGs that are not represented in the inventory and forecast; however, these are not addressed in the Climate Action Plan Advisory Group (CAPAG) process. In the forestry sector, all emissions are treated as anthropogenic, since all of the State’s forests are managed in some way (GHG reporting conventions are to treat all managed forests as anthropogenic sources). Sources such as carbon dioxide from forest fires and decomposing biomass are captured within the inventory and forecast (as part of the carbon stock modeling performed by the U.S. Forest Service [USFS]). However, methane emissions from anaerobic decomposition of biomass in forests are not currently captured due to a lack of data.
The contributions from agricultural soils and manure management have grown significantly since 1990, and they are projected to contribute 90% of agricultural emissions by 2020. Emissions from enteric fermentation have stayed the same since 1990 and are projected to stay relatively constant until 2020. GHG emissions from agricultural burning are estimated to continue to contribute a very small amount to the agricultural sector emissions.
Forestland emissions refer to the net carbon dioxide flux1 from forested lands in North Carolina, which account for about 56% of the state’s land area. As shown in Table 6-1, USFS data suggest that North Carolina forests captured and stored (sequestered) an average of 23.7 MMtCO2e per year from 1987 to 1997. The CO2 is sequestered in forest carbon pools such as live trees, debris on the forest floor, and forest soils, as well as in harvested wood products (e.g., furniture and lumber) and the landfilling of forest products. The data show an accumulation of carbon in each
1 “Flux” refers to both emissions of CO2 to the atmosphere and removal (sinks) of CO2 from the atmosphere.

6-2
of the forest carbon pools during this period.2 These rates of sequestration are assumed to remain constant through 2020.
Figure 6-1. Historical and projected GHG emissions from the agriculture sector, North Carolina, 1990–2020
0
2
4
6
8
10
12
14
16
18
1990 1995 2000 2005 2010 2015 2020
MM
TCO
2e
Ag Residue BurningAg SoilsManure ManagementEnteric Fermentation
Enteric Fermentation = production of methane and from the digestive systems of livestock.
Table 6-1. GHG emissions (sinks) from the forestry Sector
Forest Carbon Pool 1990–2020*
MMtCO2e Live and dead-standing trees and understory –6.9 Forest floor and coarse woody debris –0.8 Soils –3.1 Harvested wood products and landfills –13 Total –23.7
* Based on USFS data from 1983 to 1997. Figure 6-2 shows estimated historical and projected emissions from the management and treatment of solid wastes and wastewater. Emissions from waste management consist largely of CH4 emitted from landfills, while emissions from wastewater treatment include both CH4 and N2O. Landfill emissions are broken down into three subsectors: uncontrolled landfills (no CH4 collection or control), flared landfills (CH4 collected and flared), and landfill-gas-to-energy 2 This is not to say that the dead carbon pools (e.g., standing dead, forest floor) are sequestering carbon directly from the atmosphere. These pools accumulate carbon from trees/biomass that transition from a live carbon pool to a dead carbon pool.

6-3
(LFGTE) landfills (CH4 collected and used as an energy source). Overall, the waste management sector accounts for less than 4% of North Carolina’s total gross emissions per year from 1990 through 2020.
Opportunities for GHG mitigation in the AFW sector involve measures that can reduce emissions within the sector or reduce emissions in other sectors. For example, production of liquid biomass fuels can offset emissions in the transportation sector, while biomass energy can reduce emissions in the energy supply (ES) or residential, commercial, and industrial (RCI) sectors. Similarly, actions that promote solid waste recycling can reduce emissions within the sector (future landfill CH4) as well as emissions associated with the production of recycled products (recycled products often require less energy to produce than similar products from raw materials).
Figure 6-2. Estimated historical and projected emissions from waste and wastewater management in North Carolina
0
1
2
3
4
5
6
7
8
1990 1995 2000 2005 2010 2015 2020
MM
TCO
2E
Wastewater
Landfills, LFGTE
Landfills, Flared
Landfills, No Control
The following are primary opportunities for GHG mitigation.
• Control and utilization of CH4 —Methane emissions from manure management can be reduced through the use of anaerobic digesters or other technology. Methane can also be collected from landfills. The CH4 captured can then be used to create electricity, steam, or heat to offset fossil fuel use.
• Protection of forest and agricultural land from conversion to developed use—By protecting these areas from development, the carbon in aboveground biomass and belowground soil organic carbon can be maintained, and additional emissions of CO2e to the atmosphere can be avoided. Indirectly, these measures also support the objectives of “smart” development by helping to direct more efficient development patterns (see TLU-1a).
• Beneficial use of forest and agricultural biomass—Expanded use of biomass energy from residue removed from forested areas during treatments to reduce fire risk, crop residues, or
6-4
purpose-grown crops can achieve GHG benefits by offsetting fossil fuel consumption (to produce either electricity or heat/steam).
• Production of renewable fuels—Production of renewable fuels, such as ethanol from crops, crop residue, forestry residue, or municipal solid waste, and biodiesel from crop seed oils can produce significant reductions when they are used to offset consumption of fossil fuels (e.g., gasoline and diesel in the transportation and land use (TLU) and RCI sectors). This is particularly true when these fuels are produced using processes and/or feedstocks that emit much lower GHG emissions than those from conventional sources.
• Enhancement of forest carbon sinks—Through programs that restore forests on lands that are currently not forested or under-stocked, additional CO2 can be sequestered and stored in forest biomass. Similarly, in urban settings, expansion and maintenance of urban forests can increase sequestration and reduce energy consumption in buildings through shading and wind protection.
• Retention of agricultural soil carbon— Implement programs that incentivize growers to utilize cultivation practices that build soil carbon. By building soil carbon, CO2 is sequestered from the atmosphere. Some cultivation practices also require the use of lower amounts of fossil fuels which further lowers GHG emissions.
• Expansion of recycling infrastructure—Increase the quantity of materials recovered for recycling with specific attention given to materials with the greatest ability to reduce energy consumption during the manufacturing process and to materials that may be used as a fuel source.
Key Challenges and Opportunities In the agricultural sector, options to promote biodiesel and ethanol production were found to offer substantial GHG reduction potential with an estimated reduction of 7.7 MMtCO2e by 2020 (combined benefit of Options AFW-2 and AFW-6). This is the benefit from in-state production using North Carolina–grown feedstocks and/or lower GHG production methods. The benefit is incremental to the benefit achieved via the renewable fuels standards incorporated in TLU-6. The benefits for both biodiesel and ethanol are based on production methods and feedstocks that have lower GHG emissions than conventional processes. For ethanol, this means processes that achieve much better GHG reductions than the production from conventional starch-based ethanol (the benefits of using ethanol from starch-based production are already accounted for under TLU-6). These processes could include cellulosic hydrolysis, biomass gasification combined with biofuels production, or alternative starch-based production methods (fermentation processes fueled by renewable fuels). Feedstocks for the fiber needed by this mitigation option could come from crop residue, forestry biomass, animal waste, and municipal solid waste. A major challenge for the success of AFW-6 is the production of a viable commercial-scale cellulosic ethanol industry by 2015.
For biodiesel, crop production should be promoted that results in significantly better vegetable oil yields than soybean oil, which is currently the most prominent feedstock in the United States. Candidates include vegetable oil crops like canola, sunflower, or jatropha that have much higher yields or emerging technologies like algal oil production.
6-5
The challenges for biofuels in North Carolina will be to identify and promote appropriate feedstocks for the production of these fuels. Limited analysis by the CAPAG suggests that sufficient feedstock for cellulosic ethanol is available to meet the mitigation option’s objectives. There is limited capacity within the state for crop production to support all of the biodiesel production envisioned by the CAPAG’s recommendation without the use of cropland that is currently used for other purposes. Hence, careful study is needed to identify available croplands and appropriate crops for seed oil production. Funding and/or incentives will be needed to support the development of alternative biofuels production capacity, including research and development on emerging feedstocks and scale-up of production facilities. The biofuels recommendations assume commercial-scale viability of new technologies (e.g., cellulosic ethanol, algal biodiesel) within the policy period; however, these assumptions are consistent with the timing horizons provided by industry and government experts.
As shown in the mitigation option descriptions in Appendix H, the implementation mechanisms developed for the agricultural sector should focus on methods that avoid conflict with potential future market-based GHG reduction programs. These include GHG credits that could be generated in the agricultural sector through renewable fuels projects, soil carbon projects, and possibly other project types. New regulations that mandate emission reductions or specific agricultural practices could limit North Carolina agriculture from taking part in emerging carbon markets. Implementation mechanisms that are incentive and education based can avoid these conflicts.
Combining the agricultural and forestry land preservation options (AFW-4a and AFW-4b), 4.6 MMtCO2e/year in GHG emissions is estimated to be saved in 2020. To achieve these reductions, the state will need to work closely with local planning agencies, landowners, and nongovernmental organizations to identify lands suitable for acquisition/conservation easements and funding mechanisms. Another benefit to these options, which was not quantified, is the reduction in vehicle miles traveled due to more efficient development patterns (see TLU-1a).
Agricultural Biomass Feedstocks for Electricity or Steam Production (AFW-5) recognizes the need for incentives to build a biomass feedstocks collection and distribution infrastructure within the state. While the estimated emission reductions shown in Table 6-2 appear very small, these reductions account for the GHG reductions associated only with collection and transportation of locally derived biomass fuel compared with sourcing fossil fuel from out-of-state sources (assumed to be Pennsylvania coal). The GHG reductions that occur as a result of combusting biomass versus fossil fuels are captured in the energy supply and RCI sector policy recommendations for renewable energy.
Within the forestry sector, tree planting (afforestation and creating new forests) on non-forested lands (AFW-8) has the potential to deliver an additional 2.4 MMtCO2e/year in 2020. The mitigation option aims at afforestation of lands that are primarily agricultural today. Hence, a key uncertainty in the implementation of this option is whether or not landowners will be willing to accept a new form of land management that has an investment structure different from that of agriculture (e.g., different from the Conservation Reserve Program under the U.S. Farm Bill).
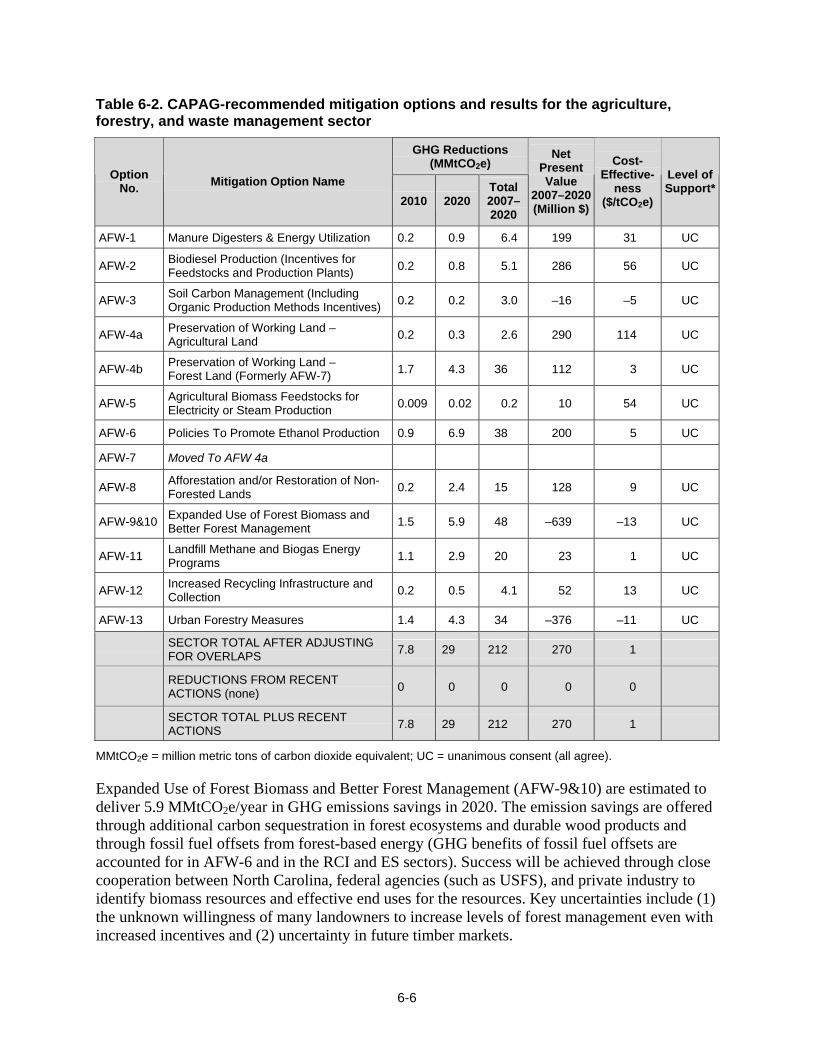
6-6
Table 6-2. CAPAG-recommended mitigation options and results for the agriculture, forestry, and waste management sector
GHG Reductions (MMtCO2e)
Option No. Mitigation Option Name
2010 2020 Total2007–2020
Net Present Value
2007–2020 (Million $)
Cost- Effective-
ness ($/tCO2e)
Level of Support*
AFW-1 Manure Digesters & Energy Utilization 0.2 0.9 6.4 199 31 UC
AFW-2 Biodiesel Production (Incentives for Feedstocks and Production Plants) 0.2 0.8 5.1 286 56 UC
AFW-3 Soil Carbon Management (Including Organic Production Methods Incentives) 0.2 0.2 3.0 –16 –5 UC
AFW-4a Preservation of Working Land –Agricultural Land 0.2 0.3 2.6 290 114 UC
AFW-4b Preservation of Working Land – Forest Land (Formerly AFW-7) 1.7 4.3 36 112 3 UC
AFW-5 Agricultural Biomass Feedstocks for Electricity or Steam Production 0.009 0.02 0.2 10 54 UC
AFW-6 Policies To Promote Ethanol Production 0.9 6.9 38 200 5 UC
AFW-7 Moved To AFW 4a
AFW-8 Afforestation and/or Restoration of Non-Forested Lands 0.2 2.4 15 128 9 UC
AFW-9&10 Expanded Use of Forest Biomass and Better Forest Management 1.5 5.9 48 –639 –13 UC
AFW-11 Landfill Methane and Biogas Energy Programs 1.1 2.9 20 23 1 UC
AFW-12 Increased Recycling Infrastructure and Collection 0.2 0.5 4.1 52 13 UC
AFW-13 Urban Forestry Measures 1.4 4.3 34 –376 –11 UC
SECTOR TOTAL AFTER ADJUSTING FOR OVERLAPS 7.8 29 212 270 1
REDUCTIONS FROM RECENT ACTIONS (none) 0 0 0 0 0
SECTOR TOTAL PLUS RECENT ACTIONS 7.8 29 212 270 1
MMtCO2e = million metric tons of carbon dioxide equivalent; UC = unanimous consent (all agree). Expanded Use of Forest Biomass and Better Forest Management (AFW-9&10) are estimated to deliver 5.9 MMtCO2e/year in GHG emissions savings in 2020. The emission savings are offered through additional carbon sequestration in forest ecosystems and durable wood products and through fossil fuel offsets from forest-based energy (GHG benefits of fossil fuel offsets are accounted for in AFW-6 and in the RCI and ES sectors). Success will be achieved through close cooperation between North Carolina, federal agencies (such as USFS), and private industry to identify biomass resources and effective end uses for the resources. Key uncertainties include (1) the unknown willingness of many landowners to increase levels of forest management even with increased incentives and (2) uncertainty in future timber markets.

6-7
Also in the forestry sector, AFW-13 (Urban Forestry Measures) has significant potential for GHG benefits (4.3 MMtCO2e/year by 2020). This is a combination of direct benefits (CO2 sequestration in urban trees) and indirect benefits (lower energy consumption in buildings through shading and wind protection) with the indirect benefits yielding most of the benefit. The biggest challenge confronting the success of this mitigation option is in containing the costs associated with tree planting and maintenance programs. For example, the costs of tree planting programs can vary substantially, depending on whether the labor is paid or unpaid. Hence, strong relationships between all of the related parties are needed (State Department of Forestry, utilities, communities, nongovernment organizations). Also, the ability to implement these programs in smaller and newer communities on previously cleared land may be limited by the administrative capacity of these communities.
Landfill Methane and Biogas Energy Programs (AFW-11) offers the potential for emission savings directly by controlling landfill CH4 emissions and indirectly through offsetting fossil fuel use (2.9 MMtCO2e/year by 2020). An additional benefit of this option includes reducing landfill gas emissions of volatile organic compounds, including some that are hazardous air pollutants. Challenges of this mitigation option include the location of landfills in very rural areas resulting in a lack of viable local end users for the gas; the possible treatment as a regulated utility can also prevent landfill-gas-to-energy projects from being developed.
Through implementation of AFW-12, additional GHG reductions can be achieved by increasing waste recycling programs in the state (0.5 MMtCO2e/year). Through recycling, emissions are reduced by avoiding future landfill CH4 and by lower energy consumption in the production of recycled products versus products made from raw materials. Emission reductions were estimated to cost $13/tCO2e through developing additional recycling infrastructure.
Overview of Mitigation Option Recommendations and Estimated Impacts The CAPAG recommends a set of 12 mitigation options for the AFW sector that offer the potential for major emissions savings. As summarized in Table 6-2, the AFW mitigation option recommendations could lead to emissions reductions from reference case projections of 29 MMtCO2e/year by 2020, cumulative reductions of around 213 MMtCO2e from 2007 through 2020, and a net cost of approximately $270 million through the year 2020 on a net present value (NPV) basis.3 The weighted average cost of saved carbon is estimated at $1/tCO2e. The CAPAG believes that this represents an extremely low cost to the North Carolina economy in implementing this package of options.
The CAPAG mitigation option recommendations described briefly here (and in more detail in Appendix H) result not only in significant emissions savings but also offer a host of additional benefits. These benefits include but are not limited to (1) support of North Carolina agricultural producers in the production of biofuels crops, development of new markets for agricultural by-products, and training/outreach covering energy production, organic farming, and other areas; (2) creation of jobs in the biomass energy and liquid biofuels feedstock and production 3 The net cost savings are based on fuel expenditures, operations, maintenance, and administrative costs, and amortized, incremental equipment costs. All NPV analyses here use a 5% real discount rate.
6-8
industries; (3) healthier forests with lower fire risk by developing markets for forestry residue; and (4) research and development work to be conducted by North Carolina universities and other in-state organizations to support many of the options for this sector.
Among the important assumptions that have been made to support the development of the estimated benefits and costs are the commercial-scale viability of advanced biofuels feedstock sources and production methods. Additional uncertainties exist in these estimates that could benefit from additional detailed study, including the costs associated with biomass collection and transport and electricity transmission infrastructure needs (costs for grid connection to utilize electricity from renewable sources).
6-9
Agriculture, Forestry, and Waste Management Sector Mitigation Option Descriptions
The agriculture, forestry, and waste management sectors include emissions and mitigation opportunities related to the use of biomass energy, protection and enhancement of forest and agricultural carbon sinks, control of agricultural CH4 emissions, production of renewable fuels, use of methods to increase soil carbon, achievement of afforestation on non-forested lands, and an increase in recycling.
AFW-1. Manure Digesters and Energy Utilization
The CH4 emissions inherent from the anaerobic (without oxygen) decomposition process of manure and other wastes may be captured and used as an energy source. By doing this, it is possible to both reduce CH4 emissions and offset fossil-based energy. However, the cost of emission captures and energy production can be higher than the value of the energy collected, making this option cost prohibitive for producers operating in a tight-margin business. This option covers programs to increase the number of CH4 capture and energy recovery projects using manure or other wastes (including food processor wastes). This is increasingly done in “anaerobic digesters”—containers in which organic wastes break down releasing CH4. The goal is to capture 20% of available CH4 from confined animal operations by 2020 for use in energy projects. The mitigation option is designed to apply to hog farms and dairies in the state.
AFW-2. Biodiesel Production (Incentives for Feedstocks and Production Plants)
Use of biodiesel offsets the consumption of diesel fuel produced from oil (fossil diesel). Since biodiesel has a lower GHG content than fossil diesel, overall GHG emissions are reduced. By producing biodiesel in the state for consumption within the state, the highest benefits can be achieved, since the fuel is transported over shorter distances to the end user. This option covers incentives needed to increase biodiesel production to offset 12.5% of North Carolina’s fossil diesel consumption by 2020.
Note: This option is linked with Transportation and Land Use Option 6 (TLU-6) on Biofuels. AFW-2 seeks to achieve incremental GHG benefits beyond the TLU option by promoting in-state production of biodiesel using feedstocks with greater GHG benefits than the likely business-as-usual national production methods. In addition, North Carolina consumption of biodiesel produced in-state will produce better GHG benefits than biodiesel obtained from a national market because of the lower embedded CO2 associated with transportation of biodiesel or its feedstocks from distant sources.
AFW-3. Soil Carbon Management (Including Organic Production Methods Incentives
Use of conservation tillage, no-till methods, cover cropping, and other soil management practices can increase the level of organic carbon in the soil, which stores/sequesters CO2. In addition,

6-10
some practices lower fossil fuel consumption through less intensive equipment use. Other practices, such as the application of bio-char (charcoal or bio-mass–derived black carbon), can also increase the level of soil carbon and improve the soil.
Another element of this option is the promotion of certified organic production techniques. A number of studies have found that organic production of row crops results in GHG benefits, including levels of soil organic carbon higher than those from conventional production methods. This option is designed to increase the acreage using soil management and production practices that lead to higher soil carbon content and other GHG benefits. Specific goals include applying soil management practices on 20% of acres that currently do not use these practices by 2010 and increasing that amount to 50% by 2020.
AFW-4a. Preservation of Working Lands – Agricultural Land
This mitigation option seeks to reduce the rate at which existing crop and pasture lands are converted to developed uses. The carbon sequestered in soils and aboveground biomass is much higher in croplands than in developed lands. Policies are needed to preserve working farms and forests (see AFW-4b) from unwise and unplanned development. This option should be seen as a companion measure to TLU-1a (Land Development Planning).
State and national programs have been established to protect farm communities from conversion to development. Funding state farmland preservation programs will help meet goals and act as a needed match to national programs. Programs that help farmers transition lands to new/ beginning farmers are being investigated. The goal is to reduce the rate at which agricultural lands are converted to developed use by 50% by 2020 from current levels.
AFW-4b. Preservation of Working Lands – Forest Land
North Carolina has lost, on average, 61,390 acres of productive forest each year over the last 30 years to development and to a lack of post-harvest regeneration. This amounts to a loss of about 10% of the state’s forestland since 1974, or an annually compounded loss of about 0.36%. The goal of this option is to reduce the rate of conversion of forestlands to non-forest lands by 10% by 2010 and 25% by 2020. When converted to developed areas, these areas contain lower amounts of biomass and its associated carbon. These areas also sequester less CO2 than forested areas. When landowners don’t have the incentive to retain their ownership, they often sell not only for development but they also sell for a forested tract as smaller parcels which may then be too small to allow forest management to be practical. On tracts too small and fragmented to be managed, the goals of AFW 9&10 cannot be achieved.
AFW-5. Agricultural Biomass Feedstocks for Electricity or Steam Production
This mitigation option seeks to offset fossil fuel use with agricultural biomass as feedstocks for electricity, steam, or heat generation. Agricultural biomass includes, but is not limited to, poultry litter, livestock manure, and crop residues, as well as energy crops (e.g., switchgrass and hybrid poplar). Offsetting fossil fuel use reduces the GHG emissions associated with these fuels. The
6-11
goals are to increase agricultural biomass usage to utilize 10% of available biomass by 2010, 25% of available biomass by 2020, and 50% of available biomass by 2030. Voluntary, incentive-based programs should be used to foster development of the industry and associated economic markets.
Note: This option links with AFW-1, which promotes the use of anaerobic digesters and energy utilization. It explores additional opportunities for agricultural biomass energy use. This option also has linkages to ES-1 (Renewable Energy Incentives), ES-2 (Environmental Portfolio Standard), ES-10 (NC GreenPower Renewable Resources Program), and RCI-10 (Distributed Renewable and Clean Fossil Fuel Power Generation).
AFW-6. Policies to Promote Ethanol Production
Offset fossil fuel use (gasoline) with production and use of starch-based (e.g., corn) and cellulosic (plant fiber) ethanol. Offsetting gasoline use with ethanol can reduce GHGs to the extent that the ethanol is produced with lower GHG content. Provide incentives for the production of ethanol from crops, forest sources, animal waste, and municipal solid waste. Several projects are being proposed that would result in the production of 150 million gallons of ethanol annually in North Carolina by 2008. Incentives could increase this amount to a volume equivalent to offsetting gasoline consumption in the state by 10% in 2015 and 25% by 2025. These goals are based on cellulosic ethanol being commercially viable by 2015.
Note: This option is linked to TLU-6, biofuels option, which focuses on mechanisms to increase biofuels consumption in North Carolina. The quantification of benefits and costs for each option takes into account the anticipated GHG reductions to be achieved by each.
AFW-8. Afforestation and/or Restoration of Non-Forested Lands
Afforestation, the planting of trees on lands that have not recently supported forests, has both carbon sequestration and other environmental benefits—storing more than one ton of carbon per acre each year (on-site, not including off-site storage and offsets in products). Afforestation delivers other important benefits such as improved wildlife habitat, reduced soil erosion and fertilizer runoff, and new recreational opportunities. Existing afforestation programs are underfunded for the task of this afforestation; typically, there is a long waiting list for landowner forestation projects. This option covers the provision of additional incentives to increase the rate of afforestation and restoration (e.g., increased stocking on poorly managed stands). The goals are to achieve afforestation projects on 40,000 acres of land by 2010 and a total of 540,000 acres by 2020.
AFW-9&10. Expanded Use of Forest Biomass and Better Forest Management
This mitigation option seeks to expand the production and use of wood products for solid wood products, fiber, and fuel. Such use offsets fossil fuel burning in the production of substitute materials (e.g., cement or steel for solid wood products and plastic for wood fiber). Wood can be substituted for fossil fuels directly in the case of biomass for energy. However, these GHG

6-12
benefits are not explicitly included in the analysis, which focuses on direct carbon sequestration in forests and in wood products. Having a market for relatively low-value biomass products enables forest management for higher value solid wood products. The increase in growth and yield of production from sustainably managed forest resources can be done through site preparation, competition control, thinning, fertilization, and improved genetics. The goal is to increase forest productivity by 100% on half of North Carolina timberlands by 2020.
AFW-11. Landfill Methane and Biogas Energy Programs
Provide incentives that will result in an increase in the recovery of landfill CH4 for use as an energy source. Increasing recovery of landfill CH4 reduces emissions of GHG and offsets the use of fossil fuels for commercial and industrial heat/steam generation or electricity production. Of approximately 130 open and closed landfills in the state, only about 15 sites are currently recovering landfill CH4 for energy use. The aim of this mitigation option is to increase the number of uncontrolled municipal solid waste landfills recovering CH4 as an energy source, such that 50% of the landfill gas being generated is controlled by 2020. This can be done through the development of additional LFGTE projects. For sites where LFGTE is not feasible, the aim is to implement flaring controls—burning the methane on-site to reduce GHG emissions.
Note: This option has linkages to ES-1 (Renewable Energy Incentives), ES-2 (Environmental Portfolio Standard), ES-10 (NC GreenPower Renewable Resources Program), and RCI-10 (Distributed Renewable and Clean Fossil Fuel Power Generation).
AFW-12. Increased Recycling Infrastructure and Collection
Increase the quantity of materials recovered for recycling with specific attention given to materials with the greatest ability to reduce energy consumption during the manufacturing process and to materials that may be used as a fuel source (e.g., clean wood waste). Reducing the quantity of materials being put in landfills reduces the potential for future landfill CH4 emissions, while recycling reduces emissions associated with the manufacturing of products from raw materials. The aim of this mitigation option is to increase per capita recovery in the state by 25% by 2020.
AFW-13. Urban Forestry Measures
Urban forest cover protection and management offers a potentially cost-effective mechanism to reduce energy use, to store/sequester carbon, and to mitigate land use change (conversion of forest and agricultural lands to residential sites). Strategic planting of trees to shade houses and air conditioning units can yield energy savings of 15% to 50% on cooling costs. Planting shade trees can reduce summer cooling costs, with only marginal increases in winter heating costs, particularly in mild climates. In addition, depending on local conditions, tree planting can reduce wind speed and further reduce energy costs. The net direct impacts of tree planting are estimated to be positive, taking these factors into account.

6-13
Specifically, this mitigation option aims to increase urban tree cover by planting three additional trees (i.e., three more than planned) on all new construction sites starting in 2008 and by planting three new trees on 25% of existing housing units in 2007 by 2020, with the aim of achieving a 25% reduction in annual heating and cooling costs.
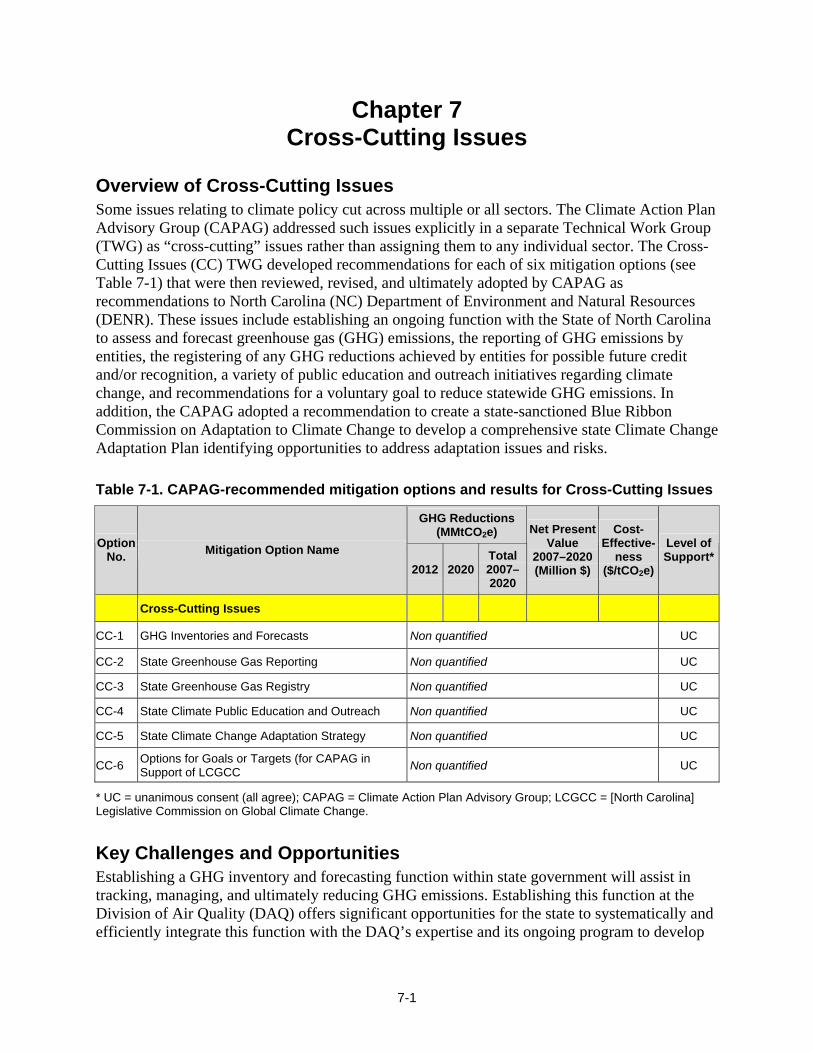
7-1
Chapter 7 Cross-Cutting Issues
Overview of Cross-Cutting Issues Some issues relating to climate policy cut across multiple or all sectors. The Climate Action Plan Advisory Group (CAPAG) addressed such issues explicitly in a separate Technical Work Group (TWG) as “cross-cutting” issues rather than assigning them to any individual sector. The Cross-Cutting Issues (CC) TWG developed recommendations for each of six mitigation options (see Table 7-1) that were then reviewed, revised, and ultimately adopted by CAPAG as recommendations to North Carolina (NC) Department of Environment and Natural Resources (DENR). These issues include establishing an ongoing function with the State of North Carolina to assess and forecast greenhouse gas (GHG) emissions, the reporting of GHG emissions by entities, the registering of any GHG reductions achieved by entities for possible future credit and/or recognition, a variety of public education and outreach initiatives regarding climate change, and recommendations for a voluntary goal to reduce statewide GHG emissions. In addition, the CAPAG adopted a recommendation to create a state-sanctioned Blue Ribbon Commission on Adaptation to Climate Change to develop a comprehensive state Climate Change Adaptation Plan identifying opportunities to address adaptation issues and risks.
Table 7-1. CAPAG-recommended mitigation options and results for Cross-Cutting Issues
GHG Reductions(MMtCO2e)
Option No. Mitigation Option Name
2012 2020Total2007–2020
Net Present Value
2007–2020 (Million $)
Cost- Effective-
ness ($/tCO2e)
Level of Support*
Cross-Cutting Issues
CC-1 GHG Inventories and Forecasts Non quantified UC
CC-2 State Greenhouse Gas Reporting Non quantified UC
CC-3 State Greenhouse Gas Registry Non quantified UC
CC-4 State Climate Public Education and Outreach Non quantified UC
CC-5 State Climate Change Adaptation Strategy Non quantified UC
CC-6 Options for Goals or Targets (for CAPAG in Support of LCGCC Non quantified UC
* UC = unanimous consent (all agree); CAPAG = Climate Action Plan Advisory Group; LCGCC = [North Carolina] Legislative Commission on Global Climate Change.
Key Challenges and Opportunities Establishing a GHG inventory and forecasting function within state government will assist in tracking, managing, and ultimately reducing GHG emissions. Establishing this function at the Division of Air Quality (DAQ) offers significant opportunities for the state to systematically and efficiently integrate this function with the DAQ’s expertise and its ongoing program to develop

7-2
inventories and forecasts for the criteria air pollutants. It will also enable multi-pollutant assessments of air emissions programs within the state since criteria air pollutant and GHG emissions will be based on the same emission source activity data.
The GHG reporting and registry programs present special challenges and opportunities. Any regional or national effort involves reconciling the interests and perspectives of different states. The states are at much different stages of the learning curve with respect to these and other climate actions. After the CAPAG completed its recommendations on these mitigation options, North Carolina joined The Climate Registry as a step toward developing a nationally uniform GHG reporting and registry capability for North Carolina sources.1 Being a charter state in this effort creates a unique opportunity for North Carolina to help ensure that North Carolina’s needs and priorities are addressed in the course of The Climate Registry’s development. To the extent that North Carolina’s needs may not be fully met by The Climate Registry, the state should consider developing supplemental or ancillary registry capacity or opportunity.
Public education and outreach programs can be difficult to develop and measure, but successful climate action will ultimately hinge on the public’s awareness of climate risks and solutions. Public education and outreach efforts should integrate with and build upon existing outreach efforts involving climate change and related issues in the state. Ultimately, public education and outreach will be the foundation for the long-term success of all the mitigation actions proposed by the CAPAG as well as those that may evolve in the future. Key challenges may be associated with coordinating existing efforts by state agencies and securing long-term funding to support these programs. However, these challenges also offer opportunities for improving the effectiveness of education and outreach efforts over the long term.
The CAPAG recommends that the state set a voluntary GHG reduction goal but that the adoption of such a goal should first be considered by the NC Legislative Commission on Global Climate Change (LCGCC). If recommended by the LCGCC, such a goal could be established by the General Assembly or by an executive order of the Governor. By setting and adhering to a GHG reduction goal, North Carolina will join many other states across the country that are demonstrating leadership in reducing their own GHG emissions. It will also provide an incentive for North Carolina citizens, businesses, and state and local governments to seek out economic opportunities to reduce GHG emissions and to position North Carolina as a supplier of carbon credits to developing carbon markets while simultaneously reducing energy costs.
Due to the existing buildup in the atmosphere of GHGs that has already occurred, North Carolina will experience some effects of climate change for years to come, even if immediate action is taken to reduce future GHG emissions. Recognizing this concern, the CAPAG agreed unanimously that it is essential for the state to initiate efforts to identify potential short-term, mid-term, and long-term impacts of climate change scenarios likely to affect the state and develop a framework for prioritizing and responding to the potential impacts identified. Thus, the 1 The Climate Registry (http://www.theclimateregistry.org/) is a collaboration between states, provinces and tribes aimed at developing and managing a common GHG emissions reporting system with high integrity that is capable of supporting various GHG emission reporting and reduction policies for its member states and tribes and reporting entities. It will provide an accurate, complete, consistent, transparent and verified set of GHG emissions data from reporting entities, supported by a robust accounting and verification infrastructure. As of July 2007, 39 U.S. states, several Tribal Authorities, two Canadian Provinces, and one Mexico state have joined The Climate Registry.

7-3
CAPAG recommends that the state empanel a Blue Ribbon Commission on Adaptation to Climate Change to develop a state Climate Change Adaptation Plan within one year of establishment of the Commission. The Commission should involve and coordinate with all appropriate state and local agencies, organizations, and institutions (e.g., universities) to ensure that all potential impacts are identified in the plan. This recommendation offers challenges in that legislative approval for funding will be required to support the Commission and development of the plan. However, developing a sound, coordinated planning effort to address North Carolina’s vulnerabilities to climate change is likely to pay for itself many times over, will help establish priorities, and will help identify opportunities for mitigating health and economic impacts associated with climate change in the state.
Overview of Mitigation Option Recommendations Cross-cutting issues include options that apply across the board to all sectors and activities. Cross-cutting recommendations typically encourage, enable, or otherwise support emissions mitigation activities and/or other climate actions. The CAPAG recommends that six such options be adopted and implemented by the State. All six are enabling options that are not quantified in terms of tons of reductions or costs/cost savings. Detailed descriptions of the individual Cross-Cutting Issues mitigation options as presented to and approved by the CAPAG can be found in Appendix I. Annex A to Appendix I offers additional reference materials that the CAPAG used in developing its recommendations for the inventories and forecast, reporting, registry, education and outreach, and adaptation mitigation options.

7-4
Cross-Cutting Issues Mitigation Option Descriptions
CC-1 GHG Inventories and Forecasts
GHG emissions inventories and forecasts are essential to understanding the magnitude of all emission sources and sinks (both natural and those resulting from human activities), the relative contribution of various types of emission sources and sinks to total emissions, and the factors that affect trends over time. The Center for Climate Strategies (CCS) is providing a baseline inventory as a part of this project. It should be a platform for further updating and improvement. The initial use for inventories and forecasts will be to inform state leaders and the public on statewide trends, opportunities for mitigating emissions or enhancing sinks, and verifying GHG reductions associated with implementation of North Carolina’s Climate Action Plan. However, it is expected that other uses of the data will be identified as the program evolves.
The CAPAG recommends that the responsibility for preparing GHG inventories and sinks should reside with the DAQ, which has the expertise needed to systematically compile information on GHG sources and sinks using established methods and data sources. Other state agencies as well as private facilities (sources) will need to provide data to DAQ on a periodic basis. This program should be integrated with existing DAQ inventory and forecast functions as seamlessly as possible as committed to by DAQ in the September 2005 Report under the Clean Smokestacks Act. This inventory and forecast function should be implemented as soon as possible to establish an ongoing effort that will be improved over time based on improvements to the accuracy and completeness of data needed to support this effort.
The CAPAG recommends that the state develop a periodic, consistent, and complete inventory of all emission sources and sinks (both natural and those resulting from human activities) on a continuing basis with forecasts to reasonable and realistic future years (5 and 10 years), to and including 2020 (and eventually beyond), as allowed by funding. The process for these and other sources should repeat as often as necessary to track significant reductions or increases, beginning with every year for major point sources and every third year for other sources to be in agreement with routine US EPA (United States Environmental Protection Agency) air emissions reporting requirements and regulations for other regulated air pollutants. The inventory should include all natural and man-made emissions generated within the boundaries of the state (i.e., production-based inventory approach) as well as emissions associated with energy imported and consumed in the state (i.e., consumption-based inventory approach). The state should provide a projection of the emissions from the same source categories and on the same basis into the future for a realistic forecast of what the emissions will be in future years reflecting expected growth and application of scheduled and expected mitigation options. The state should also provide a basis for documenting emission reductions and credits “by difference” from year to year.
7-5
CC-2 State Greenhouse Gas Reporting
GHG reporting reflects the measurement and reporting of GHG emissions at a statewide, sector, or sub-sector level to support tracking and management of emissions. GHG reporting can help sources identify emission reduction opportunities and reduce risks associated with possible future GHG mandates by moving up the learning curve. Tracking and reporting of GHG emissions would also help in the construction of periodic state GHG inventories. GHG reporting is typically a precursor for sources to participate in GHG reduction programs, provide opportunities for recognition, create a GHG emission reduction registry, and secure “baseline protection.” Further, collaboration with other states in the development of a GHG reporting program could enable North Carolina to influence the development of GHG reporting practices throughout the region and nation and build consistency and reciprocity with other state or regional GHG reporting programs.
Accordingly, the CAPAG recommends that North Carolina develop and implement a voluntary GHG reporting program as soon as possible. Reporting should occur annually on a calendar-year basis for all six traditional GHGs and, to the extent possible, for black carbon. In order to encourage GHG mitigation activities from all quarters, all entities that can verify ownership of GHG emissions should be encouraged to participate in a reporting program. Every effort should be made to maximize consistency with federal, regional, and other states’ GHG reporting programs and quantification protocols in order to maximize consistency and reciprocity with federal, regional, and other states’ GHG reporting programs. The reporting of GHGs would help position sources for participating in an emissions trading program, should one develop in the future, leading to cost savings.
For entities participating in a reporting program, reporting of direct emissions should be required, reporting of emissions associated with purchased power and heat should be phased in, and reporting of other indirect emissions should be allowed. Reporting of GHG emissions should be on an organization-wide basis within North Carolina, but with greatest possible detail by facility in order to facilitate baseline protection. Reporting of emissions from GHG reduction projects should qualify for reporting when they are identified as such, and adhere to equally rigorous quantification standards. GHG emissions reports should be verified through self-certification and NC DENR spot-checks. To qualify for future registry purposes, reports should undergo third-party verification. The reporting program should provide for appropriate public transparency of reported emissions. GHG reporting may be required by DAQ for some categories of sources through normal state rulemaking procedures.
It should be noted that many sources in North Carolina report criteria pollutant emissions to DAQ in order to comply with various federal and state regulatory programs. Most electricity generating units are also required to report carbon dioxide (CO2) emissions to the US EPA’s Acid Rain Program. Some sources may report GHG emissions on a voluntary basis to federal, state, or privately run programs. In addition, the DAQ will be collecting GHG emissions from stationary sources subject to a North Carolina state Title V air permit beginning in calendar year 2008 to fulfill a commitment under the Clean Smokestacks Act. The CAPAG acknowledges these emission reporting programs and DAQ’s efforts to systematically integrate the reporting of
7-6
GHG emissions by entities to the state in order to minimize costs to both the reporting entities and the state of North Carolina.
CC-3 State Greenhouse Gas Registry
A GHG registry enables uniform measurement and recording of GHG emissions reductions in a central repository. Typically, a registry also includes transaction ledger capability in order to support tracking, management, and ownership of emission reductions. Registries can help encourage sources to undertake GHG reduction efforts, enable potential recognition for such actions, provide baseline protection, and support the crediting of GHG mitigation actions. A registry can also provide a mechanism for regional, multistate, and cross-border cooperation. Subject to appropriately rigorous quantification standards, participation in a GHG registry should not be constrained to particular sectors, sources, or approaches in order to encourage GHG mitigation activities of all types from all quarters. In particular, a GHG registry should be able to incorporate activities associated with all of the options the CAPAG approves, whether reflective of reductions in emissions of GHGs or increases in biological or geological sequestration of carbon.
Building on the GHG reporting program recommended in CC-2, the CAPAG recommends that North Carolina actively engage with other states in developing a regional or national GHG registry that will comprehensively meet the state’s needs as soon as possible. If developing regional or national multistate registries does not initially include all of the state’s preferred criteria, North Carolina should still join and participate to the greatest extent possible and work to develop whatever additional registry capacity is necessary to meet the remaining needs of North Carolina sources (e.g., registration of carbon sequestered due to reforestation). Together, these approaches should cover all mitigation options the CAPAG recommends, provide adequate quality verification, and allow project-level reporting. Participation by North Carolina sources should be voluntary and include all entities that can verify ownership of GHG emission reductions, and costs should be borne primarily by participants. Entities should be provided the opportunity to participate in a registry as soon as possible after a GHG reporting program is operating.
The CAPAG recommends that the state ensure that any registry in which it decides to participate includes (1) voluntary participation by as broad an array of sectors, sources, facilities, and approaches as possible; (2) participation by entities at least at the statewide level and as broadly (i.e., regionally or nationally) as possible; (3) provisions for sources to start as far back chronologically as good data exists, as affirmed by third-party verification, and allowing registration of project-based reductions or “offsets” that are equally rigorously quantified; (4) incorporation of adequate safeguards to ensure that reductions are not double-counted by multiple registry participants and provide appropriate transparency; (5) maximum consistency with other state, regional, and/or national efforts and the greatest flexibility possible as GHG mitigation approaches evolve; and (6) guidance to assist participants.
In addition, the registry should allow the state and its political subdivisions to be valid participants for registering reductions associated with their programs, direct activities, or efforts, including the registration of emission reductions associated with the stationary and mobile
7-7
sources they own, lease, or operate. The state and its political subdivisions should also be allowed to participate in emission trading if and when such a program is developed and authorized. Revenues associated with the sale of any emission reduction credits generated by the state or its political subdivisions could be used to support the GHG emission inventory, forecasting, reporting, and registry functions within state government.
CC-4 State Climate Public Education and Outreach
Public education and outreach can support GHG emissions reduction efforts at a macro- or micro-scale in relation to emissions reduction programs, policies, or goals. Public education and outreach are vital to fostering a broad awareness of climate change issues and effects (including co-benefits, such as clean air and public health) among the state’s citizens. Such awareness is necessary to engage citizens in actions to reduce GHG emissions. Public education and outreach efforts should integrate with and build upon existing outreach efforts involving climate change and related issues in the state. Ultimately, public education and outreach will be the foundation for the long-term success of all the mitigation actions proposed by the CAPAG as well as those which may evolve in the future.
The CAPAG recommends that North Carolina lead by example in its own education and outreach activities by establishing a proactive public education and outreach capability and using it to target education and outreach activities to five specific audiences: (1) policymakers and managers (e.g., legislators, regulators, executive branch, agencies, and employees); (2) educators and students; (3) community leaders and community-based organizations (e.g., institutions, municipalities, service clubs, social and affinity groups, and non-governmental organizations); (4) the general public; and (5) industrial and economic sectors (such as professional training, licensing, and certification programs). A statewide public education and outreach effort should probably be overseen largely by NC DENR but would necessarily involve many other key parties. Public education and outreach efforts should commence as rapidly as possible.
CC-5 State Climate Change Adaptation Strategy
Due to the existing buildup in the atmosphere of GHGs that has already occurred, North Carolina will experience some effects of climate change for years to come, even if immediate action is taken to reduce future GHG emissions. Thus, it is essential that the state develop a plan to manage the projected impacts of ongoing climate change while worldwide mitigation efforts to lower atmospheric concentrations are under way.
While taking action to reduce GHG emissions in North Carolina, the state should develop, adopt, and implement a state Climate Change Adaptation Plan that includes identification of (a) potential short-term, mid-term, and long-term impacts of climate change scenarios likely to affect the state, and (b) implementation mechanisms for addressing these impacts. The state should empanel a state-sanctioned Blue Ribbon Commission on Adaptation to Climate Change as soon as possible to develop a state Climate Change Adaptation Plan within one year of establishment of the Commission. The Commission should involve and coordinate with all appropriate state and local agencies, organizations, and institutions (e.g., universities) to ensure that all potential impacts are identified in the plan. The Commission should also enlist the

7-8
expertise of all appropriate state and local agencies, organizations, and institutions in developing and implementing measures for mitigating these impacts.
At a minimum, the Commission should address in the plan the adaptation issues that the CAPAG has identified for this option in Appendix I. Benefit-cost analyses should be used to compare the potential costs of a “status quo” approach as opposed to implementing the recommendations proposed in the Climate Change Adaptation Plan. Recommendations in the adaptation plan should be prioritized based on the certainty and severity of adverse impacts to citizens, ecosystems, and local economies. Development of the plan should (a) involve all affected agencies and entities at all levels of government; (b) involve all affected sectors and interests; and (c) provide for periodic review and update concerning adaptation risks, responses, and opportunities in the state. Parallel public education and outreach efforts regarding adaptation should commence immediately. “Early-adoption” opportunities should be addressed as rapidly as possible (even before the Commission is established, if possible), and proactive adaptation initiatives should commence within the next 2–3 years.
The CAPAG also recommends that the State Legislature provide funding to support development and ongoing revision to the state Climate Change Adaptation Plan including, but not limited to, funds to support the cost-benefit analysis needed to guide and inform the development and implementation of the Plan and to cover expenses incurred by the Commission and Commission members.
CC-6 Options for Goals or Targets (for CAPAG in Support of LCGCC)
It is widely anticipated that eventually the federal government may cap GHG emissions associated with global warming. A number of states are ahead of the federal government in establishing GHG caps. For example, the Northeastern States (including New York) have instituted a regional cap-and-trade program to reduce power-sector GHG emissions. California has recently signed into law an economy-wide cap.
North Carolina has successfully severed the link between increasing energy consumption and emissions of soot and smog-forming pollution; even as energy consumption increases, sulfur dioxide and nitrogen oxide pollution are being significantly decreased.
North Carolina should establish voluntary goals to limit GHG emissions to prepare the state’s economy for the likely caps at the national level and begin to sever the link between increasing energy demand and GHG emissions. Even modest reductions in GHG emissions will help to align North Carolina’s environmental and economic interests and assist the state in addressing its contribution to global warming. The goal would not be mandatory but would simply set a direction in GHG emissions, just like the NC million acre conservation goal.
The CAPAG recommends that the State of North Carolina set an overall voluntary goal to bring statewide emissions back to a baseline, such as year 2000. The goal should be set over a long time horizon of 10–15 years to meet the baseline. It should be expressed as an interim goal on the longer path toward ultimate climate stabilization. There would be no mandates to any specific party. However, all sectors of the state’s economy would have the opportunity to contribute toward meeting the state’s goal. The adoption of such a goal should first be considered

7-9
by the NC LCGCC. If recommended by the LCGCC, such a goal could be established by the General Assembly or by an executive order of the Governor.
The CAPAG identified the following benefits associated with setting a goal to reduce statewide emission:
• Addressing Potential Global Warming Impacts—The direct economic toll of global warming on North Carolina may be enormous and would likely include increasing crop loss due to drought, episodic water shortages, coastal flooding and erosion, and building cooling costs. A state goal will draw attention to regional warming trends and associated effects and help business and government prepare for the future.
• Economic Development—As the state plans its economic development activities, a state carbon reduction goal can help promote expansion and recruitment of renewable energy technologies that are less GHG intensive. Additionally, these activities will seek to generate jobs in North Carolina to replace the non-native coal and gas sources that currently dominate North Carolina’s energy supply.
• State Leadership—By establishing a state goal, North Carolina will join the numerous states across the country that are already rising to the challenge of addressing GHG emissions associated with global warming.
• Business Responsibility—A state goal will be to provide the motivation and opportunity for companies to examine their options for cost-effective reductions in their GHG emissions. Many companies in North Carolina are already considering the need to reduce carbon dioxide in their long-term planning. A reduction goal will foster the broader business community to consider their ability to also reduce GHG emissions.
• Preparing for the Emerging Carbon Marketplace—North Carolina business can potentially sell tens or even hundreds of millions of dollars worth of carbon equivalence credits into the carbon marketplace that national climate legislation will eventually generate. A state goal would help companies that could potentially be suppliers of carbon credits in the coming national marketplace prepare to take advantage of these economic opportunities as soon as they arise.