climate action science vision list 2019 · the climate science list . overview arnard’s limate...
TRANSCRIPT

CLIMATE ACTION VISION 2019Draft Nov 10 2019
CLIMATE SCIENCE LIST

Climate Science List 2019
1. Overview ............................................................................................................................. 2 2. Executive Summary ............................................................................................................. 4
a. Background ..................................................................................................... 4 b. Universe Profile .............................................................................................. 4 c. Summary Findings .......................................................................................... 5
3. Methodology ....................................................................................................................... 9 a. Selection of Companies .................................................................................. 9 b. Criteria to Score Companies ......................................................................... 10 c. Data Sources Used ........................................................................................ 11 d. Scoring Process ............................................................................................. 11 e. Appendix A: Barnard College Climate Science List Criteria Scoring Guide ... 14
4. Company Scoring .............................................................................................................. 23 a. Notes and Explanation.................................................................................. 23 b. Company Scoring Detail ............................................................................... 24 c. Climate Science List Summary ...................................................................... 27
5. Scoring Appendix .............................................................................................................. 34 a. Apache Corporation ..................................................................................... 36 b. BP plc ............................................................................................................ 47 c. Cabot Oil & Gas Corporation ........................................................................ 61 d. Canadian Natural Resources ........................................................................ 72 e. Cenovus Energy ............................................................................................ 87 f. Chevron Corporation .................................................................................. 102 g. Cimarex Energy Co. ..................................................................................... 119 h. Concho Resources ...................................................................................... 130 i. ConocoPhillips ............................................................................................ 141 j. Devon Energy Corporation ......................................................................... 156 k. Encana Corporation .................................................................................... 175 l. Eni S.p.A. ..................................................................................................... 187 m. EOG Resources ........................................................................................... 207 n. Equinor ....................................................................................................... 219 o. ExxonMobil ................................................................................................. 236 p. Galp Energia, SGPS, S.A. ............................................................................. 254 q. Hess ............................................................................................................ 273 r. Imperial Oil ................................................................................................. 287 s. Inpex ........................................................................................................... 303 t. Marathon Oil .............................................................................................. 318 u. Noble Energy, Inc. ....................................................................................... 328 v. Occidental Petroleum Corporation ............................................................ 343 w. OMV ............................................................................................................ 362 x. Pioneer Natural Resources ......................................................................... 377 y. Repsol S. A. ................................................................................................. 389 z. Royal Dutch Shell ........................................................................................ 413 aa. Suncor Energy ............................................................................................. 433 bb. Total S.A. ..................................................................................................... 452 cc. Woodside Petroleum .................................................................................. 475

The Climate Science List Overview
Barnard’s Climate Action Vision outlines a 360-degree approach that prioritizes the role of women, people of color, and low-income communities in defining new paradigms of climate leadership. Our focus falls into three main areas: Barnard’s (1) academics; (2) finance and governance; and (3) campus operations and culture. Our goal around finance and governance is to incorporate climate and sustainability into our decision making, from strategic planning and capital improvements to our endowment to daily financial choices.
In terms of our endowment, In March, 2017 the Board of Trustees voted to divest Barnard’s endowment from fossil fuel companies that deny climate science or otherwise seek to thwart efforts to mitigate the impacts of climate change. The College has released a Climate Science List of 30 oil and gas companies that evaluates their commitment to climate science and sustainability. The College is using the Climate Science List as a guide to focus its endowment on companies that recognize climate science and the risks posed by climate change. The notion that human activity is causing climate change is settled science. Endowment investments in companies that question this science, in either word or deed, conflict with Barnard’s academic mission that supports evidence-based solutions to society’s problems.
A working group of Barnard faculty, students, staff and Trustees, in partnership with Fossil Free Indexes (known as FFI) and the Union of Concerned Scientists, developed six rigorous criteria to indicate the extent to which a company’s words and actions support climate science, demonstrate an urgency to act with respect to scientific knowledge about climate change, support the free flow of information, and provide transparency about their actions.
The Climate Science List is a list of 30 fossil fuel companies that were evaluated based on the criteria. The 30 companies were chosen from the Carbon Underground Oil and Gas 100 (O&G 100), a list of the of the top 100 publicly traded oil and gas reserve holders globally compiled by FFI.
The Climate Science List makes a substantive intellectual contribution to the discussion of climate science and climate change. The evaluation recognizes that fossil fuel companies’ attitudes and behaviors toward settled climate science and climate change are quite nuanced and vary by company. The list shows that companies’ words and deeds with respect to climate science operate on a continuum relative to each other. This is not a judgement on the value of the organizations named; rather it is an analysis of specific behaviors related to the scientific evidence about climate change. Because we recognize that companies can positively change such attitudes and behaviors over time, we plan to update the list periodically.
As a leading institution of higher education, Barnard believes this list provides a substantive contribution to the discussion of climate science and climate change. In addition to using this list as
2

a guiding framework for our own investments, the College is making it public to provide a framework for other institutions to consider and debate as they plan their own investment decisions.
3

Prepared in Collaboration with FFI and the Union of Concerned Scientists Climate Science List Executive Summary
I. BACKGROUND
In March 2017, Barnard announced that the college would divest its endowment from companies that dispute climate science or otherwise seek to thwart efforts to mitigate the impact of climate change. This decision led to the formulation of the Climate Science List. The Climate Science List is a list of 30 fossil fuel companies that were evaluated based on criteria developed by a working group of Barnard faculty, students, and staff in consultation with FFI and the Union of Concerned Scientists. The goal was to evaluate companies' statements, actions, and attitudes towards climate science and climate change.
II. UNIVERSE PROFILE
FFI evaluated 30 publicly traded fossil fuel companies drawn from the Carbon Underground Oil & Gas 100 list (O&G 100). The O&G100 represents the largest 100 oil & gas companies ranked by the potential emissions embedded in proven reserves. We focused on companies who (1) operate in developed markets, (2) where public information on their activities is available and (3) whose main line of business is oil and gas exploration and production. The companieschosen make up nearly 66% of the Carbon Underground 100 oil and gas market available toinvestors. For more information on how we chose this cohort of companies, see theMethodology section below.
The universe includes several categories of companies:
• 6 “Super Majors” who are the largest integrated oil & gas companies in the worldincluding BP, Chevron, ENI, ExxonMobil, Royal Dutch Shell and Total;
• 9 Additional integrated oil & gas companies whose businesses span the activities ofexploration, production, refinement and distribution including Occidental and Equinor;
• 15 independent oil and gas companies whose activities span only the exploration andproduction (E&P) such as Cimarex Energy and ConocoPhillips.
The 30 companies operate in developed markets and are based in the US, Europe, Canada and Asia:
United States: 15 UK/Europe: 8 Canada: 5 Asia & Oceana: 2
4

As of 12/31/18, all but one of the 30 companies could be categorized as large cap, having individual market capitalizations that exceeded $10 billion. The market capitalization breakdown is below:
Average: $ 61.6 billion Median: $ 23.1 billion High: $346.1 billion Low: $7.1 billion
For additional details on the process used to select the 30 companies, please see the document on page 9 titled, “Climate Science List Methodology.”
On August 8, 2019, Occidental Petroleum completed its purchase of Anadarko. Anadarko was one of the companies originally selected. Therefore, we scored and ranked only 29 companies.
III. SUMMARY FINDINGS:
• European Integrated Oil & Gas companies (a group that includes BP, Eni, Equinor, GalpEnergia, OMV, Repsol, Royal Dutch Shell, and Total) generally received the highesttotal scores and the highest scores across the 6 categories. This is in part due to EUclimate policy initiatives and subsequent pressure for implementation and compliancethat is not yet present elsewhere.
• US Integrated Oil & Gas companies, including super majors such as Chevron andExxonMobil, received overall lower scores compared to their European counterpartsacross most categories.
• Independent US companies (upstream businesses focused on E&P) tended to scorethe poorest.
• Larger companies (by market cap) generally scored better than smaller companies, inpart because they provided more disclosure and commentary on climate change.
• Super Majors (Exxon, Chevron, BP, Total, Royal Dutch Shell and ENI) on average scoredbetter than the others. However, there was a significant range between the highestand lowest in this grouping, with European majors scoring higher than their UScounterparts across categories.
Criterion 1: What is the company’s position on climate science?
Based on the scoring guidelines (see Methodology) we used a “laddered” approach -- ranging from a score of 1 (needs improvement) to 5 (demonstrates best practices) to assess a company’s position on climate science. A company’s public statements were first evaluated to see if any met the guidelines for a score of needs improvement, i.e., a misrepresentation of
5

current climate science. If a statement misrepresented current climate science, then, the company received a score of needs improvement, regardless of whether its other statements supported or affirmed current climate science and would have, if not for the statement misrepresenting current climate science, resulted in a higher score. If no misrepresentation was found, we evaluated a company’s public statements along a sliding scale. While this approach might penalize companies for a single misstatement, the misrepresentation of current climate science is a critical component of the overall analysis. Companies should be held to a high standard of consistent public disclosure given their products’ impact on the Earth’s climate.
None of the oil & gas companies evaluated directly denied the existence of climate change or directly contradicted the scientific consensus that human activity, through the burning of fossil fuels, is a primary contributor to climate change. Yet approximately two-thirds of the companies received a score of two or worse, including all fourteen US-based companies. These companies misrepresented climate science on one or more platforms, downplayed the need to reduce emissions, or did not address climate science on any of their platforms. Most of the statements characterized as misrepresentation suggested the scientific community is not in agreement or that more work needs to be done to create a consensus. European companies were most consistent in their support of climate science and the need to reduce greenhouse gas emissions, with climate change being a prominent part of their overall messaging on public platforms. Larger companies, including the Oil Super Majors, on average scored better than smaller companies. Companies issuing the strongest statements in support of climate science, including the need for swift and deep reductions to get to net-zero emissions, were Equinor and Royal Dutch Shell.
Criterion 2: What measures is the company taking to reduce its carbon footprint?
European integrated companies scored higher than their US counterparts across most sub-categories, particularly with respect to their commitments to and disclosure of in-house and/or third-party R&D into low-carbon technologies and use of an internal price of carbon in investment decisions. None of the companies in the universe established long-term company-wide science-based Greenhouse Gas (GHG) emissions reduction targets consistent with the Paris Agreement’s temperature goals. Furthermore, the majority of evaluated E&P companies had no plan for reducing GHG emissions. Most companies’ Scope 1-2 emissions increased in either 2016 or 2017. Regarding R&D into low-carbon initiatives, E&P companies scored poorly with respect to their commitments to R&D into low-carbon technologies as all but two, Devon Energy and Occidental Petroleum, did not disclose any such initiatives. Regarding carbon pricing, Canadian companies, though subject to existing provincial carbon pricing regulatory frameworks, disclosed very little about their use of a carbon price in making investment decisions. Overall, larger companies scored better than smaller companies in this sub-category. Companies scoring the highest for Criterion 2 include BP, Equinor, Galp Energia, Repsol, Suncor Energy and Total. Companies scoring lowest for Criterion 2 include Apache Corporation, Chevron, Cimarex, Concho, Encana, EOG Resources, Imperial, Marathon Oil, Noble Energy, and Woodside Petroleum.
6

Criterion 3: Is Climate Science integral to the governance and oversight of the Company?
Relative to other criteria, there was less variation in language companies used in disclosing risks and risk management procedures related to climate change, and hence the range of scores for Criterion 3 was not as wide. At a minimum, most companies tacitly acknowledged climate change-related risks and opportunities but did not always identify company-specific impacts, particularly financial impacts. Nearly all companies claimed to maintain oversight of climate change-related governance by a board committee(s), but examination of respective committee charters validated less than one-third of these claims. BP, Concho Resources and Marathon Oil supported climate change-related shareholder resolutions or made a commitment to filers that led to the withdrawal of such resolutions, though BP also recommended against a separate climate change-related shareholder resolution during the reporting period. While larger companies provided more transparency on risks and demonstrated clearer board accountability, smaller companies were less likely to face (and oppose) climate-related shareholder resolutions. Best scoring companies were Eni and Total. Lowest scoring were BP, Cenovus, Chevron, Devon Energy, EOG Resources, ExxonMobil and Imperial Oil.
Criterion 4: What are the company’s affiliations with third parties that spread disinformation on climate science?
The five trade associations identified for this assessment include American Legislative Exchange Council (ALEC), American Petroleum Institute (API), National Association of Manufacturers (NAM), Western States Petroleum Association (WSPA) and American Fuel and Petrochemical Manufacturers (AFPM). According to the research performed by the Union of Concerned Scientists, these trade associations and lobbying groups have both a history of spreading climate science disinformation and have recently misrepresented climate science. 1 While these trade associations are based in the US, they count as its members several non-US companies with significant US operations. For those companies with no significant US operations, the category was given a zero weight in the final score. With the exception of Royal Dutch Shell, the oil majors and larger companies generally scored lower in this category compared to smaller companies, as most of the Oil Super Majors have membership and leadership positions in these associations or groups. Royal Dutch Shell outperformed because it left ALEC in 2015 and AFPM in 2019, both times stating explicitly that the groups’ position on climate science was inaccurate and inconsistent with the company’s stance. Royal Dutch Shell also produced a report in 2019 (Industry Associations Climate Review) that detailed instances where the company’s position on climate change-related issues differs from positions taken by trade associations of which it is a member. Information on membership was not readily available from ALEC, so third-party sources were used to assess company affiliation with this group.
1 https://www.business-humanrights.org/sites/default/files/documents/UCS%202018%20Scorecard.pdf
7

Criterion 5: Does the company publicly support the need for climate policy and regulations?
Most companies referenced the Paris Climate Agreement in their public platforms, though often in the context of regulatory risk rather than support for policies or regulations to further the Agreement. Indeed, approximately one-third of companies were silent on the on the need for policies and/or regulations to advance the Agreement, including all but two E&P companies. This is in part due to the lack of specific pending US federal regulations or legislation around climate change. Canadian companies generally scored similarly to US E&P companies, indicative of their general lack of public support for existing Canadian provincial carbon pricing regulatory frameworks. In contrast, Eni, Equinor, Repsol, Royal Dutch Shell and Total scored well because of their explicit endorsement of the Paris Climate Agreement’s global temperature targets and active support for specific EU-based legislation that would further the goals of the Agreement.
Criterion 6: Has the company been publicly transparent about its position, actions, and affiliations with regard to climate science and climate change?
Approximately three-quarters of the companies now maintain a webpage dedicated to climate change and nearly all produced either a sustainability report or corporate responsibility report with a section dedicated to climate change. Most companies provided some disclosures regarding their affiliations with trade associations. Eleven companies did not respond to CDP’s 2018 climate change survey, seven of which (Apache Corporation, BP, Cabot Oil & Gas, Cenovus Energy, Cimarex, Concho and Marathon Oil) also did not produce a 2oC scenario analysis during the reporting period. OMV, Royal Dutch Shell, Total and Woodside Petroleum received the highest possible overall score, while Cimarex and Concho received the lowest possible overall score.
8

Prepared in Collaboration with FFI and the Union of Concerned Scientists Climate Science List
Methodology
This paper discusses the methodology we used to select the companies to evaluate, the criteria we used to score these compeanies, the sources of data we used in our evaluation, and the process by which we scored companies.
I. SELECTION OF COMPANIES
We conducted the following analysis to determine the 30 oil & gas reserve owning companies to evaluate for climate action:
Starting Universe and Options Considered
Our starting universe was the FFI Oil & Gas 100 list as of 12/31/18, which ranks companies based on the embedded emissions in proven oil and gas reserves. For each company on the O&G100, we considered different factors, including total potential emissions, market capitalization1, whether the company was domiciled in developed vs. emerging markets and whether fossil fuel exploration and production (E&P) was a primary business. Using the above factors, we created five different groupings (options) each containing 30 companies for further analysis.
Option 1 (Top 30 Emissions): This option took the Top 30 companies on the O&G100 list as ranked by potential emissions.
Option 2 (Market Capitalization): This option re-ranked the O&G100 by market capitalization.
Option 3 (Combination of Emissions & Market Cap): This list of 30 included companies that ranked in the top 50 of both potential emissions and market capitalization, sorted by Market Cap.
Option 4 (Developed Market Companies ranked by Emissions): This list included only companies whose headquarters are in developed markets. For example, this list would exclude Chinese and Russian majority state-owned oil and gas companies.
Option 5 (Developed Market Companies in the Top 80 in Emissions, Top 50 in Market Capitalization, excluding companies whose main business is not energy production or distribution). This list considers all the previously mentioned factors, but also excludes
1 The value of a company that is traded on the stock market, calculated by multiplying the total number of shares by the present share price.
9

companies whose main business is not oil and gas. These two excluded companies were BHP Billiton and BASF.
Options 1-3 captured a high percentage of both the potential emissions and market cap of the O&G100. Options 1-3 captured between 70-88% of the potential emissions and 75-86% of the free float market cap2. The main challenge with these options was that they included 7-12 emerging market companies, including Russian and Chinese Oil companies. Those markets present challenges in terms of our analysis, including the relative lack of disclosure and public information regarding company positions on climate change and climate science, and the fact that the notion of “climate denial” is far less prevalent activity among companies who are mostly state-owned and operate in China and Russia.
We decided to focus on companies who (1) operate in developed markets, (2) where public information on their activities is available and (3) whose main line of business is oil and gas exploration and production. While the developed market only options (4&5) comprise a much lower percentage of the potential emissions of the O&G100 (about 30%), they do represent a sizable percentage of the free float market cap (about 66%). The low emission percentage is due to the fact that a significant amount of the world’s fossil fuel reserves are controlled by corporations in emerging markets, particularly Russia and China. Given that the focus of our effort is to assess fossil fuel companies’ activities and stances on climate change and climate science, and that those activities are more prevalent in developed (versus emerging) markets, we decided to use Option 5 as the universe of companies to evaluate. Barnard indicated that they will review this decision in future years.
II. CRITERIA TO SCORE COMPANIES
In 2017, a working group of Barnard students, faculty, staff, and trustees convened with the goal of developing clear and rigorous criteria to evaluate companies' statements, actions, and attitudes towards climate science and climate change. The group, with input from FFI and UCS, settled on 6 criteria upon which to evaluate the universe of companies.
• What is the company’s position on climate science?• What measures is the company taking to reduce its carbon footprint?• Is climate science integral to the governance and oversight of the company?• What are the company’s affiliations with third parties that spread disinformation on
climate science?• Does the company publicly support the need for climate policies and regulations?• Has the company been transparent about its position, actions, and affiliations with
regard to climate science and climate change?
FFI and UCS subsequently worked with Barnard to create indicators and detailed scoring
2 Public float or free float represents the portion of shares of a corporation that are in the hands of public investors as opposed to locked-in stock held by promoters, company officers, controlling-interest investors, or government.
10

guidelines for each indicator to facilitate the assessment of company positions and actions versus the criteria. These indicators and scoring guidelines functioned as sub-criteria that when assessed in aggregate, provide an assessment of and a score for the criteria as a whole. In developing the scoring guidelines, FFI and UCS relied initially on the guidelines that UCS created for its 2016 Climate Accountability Scorecard and the subsequent update to the Scorecard that was published in October 2018.
The criteria, indicators and scoring guidelines are shown in Appendix A.
III. DATA SOURCES USED
Publicly available data from January 1, 2018 through June 30, 2019 was gathered to assess each company against the criteria and associated scoring guidelines. For each company, the following documents and sources were reviewed:
• Most recent company annual reports, sustainability reports, corporate responsibilityreports and CDP submissions that were available at 6/30/19;
• Most recent SEC filings including Form 10-Ks, 20-Fs, and proxy statements available at6/30/19. Because of the cutoff, most annual filings represented 2018 fiscal year-endfinancial information and disclosures;
• Company websites and press releases;• Transcripts and recordings of annual meetings;• Public statements by company executives;• Third party sources including CERES and DeSmog Blog; and• 2015-2017 Scope 1 & 2 emissions and production data (used to calculate emissions
intensity in Criterion 2B) provided by ISS-Ethix and Evaluate Energy, respectively.
IV. SCORING PROCESS
To score each company, FFI:
• Collected data for each company;• Assessed company data versus the scoring guidelines and assigned an initial score using
the scoring bands (below) for each indicator;
11

• Asked UCS to undertake a quality control and scoring adjustment:o For companies that overlapped with the companies evaluated in the UCS Climate
Accountability Scorecard3, UCS reviewed the preliminary scores according to thedata collected4;
o UCS spot checked scores of non-scorecard companies; and• Requested company feedback.
Scoring Bands
Each indicator was assessed using the guidelines and scored on a sliding scale of 1-5 based on the chart below. Each criterion had between 1 and 5 indicators and equal weight was given to each criteria. If a criterion had more than one indicator, each indicator was equally weighted to generate a total score for each criterion. For example, if there were 4 indicators, each indicator would receive a 25% weighting.
Companies had 0.5 points deducted from their total score if potential emissions from tar sands reserves were greater than 50% of a company’s total potential emissions
Definition Point Assigned
Company’s performance demonstrates best practices 5 Company’s performance neither positive nor negative 3 Company’s performance needs improvement 1
Company Feedback Request:
The companies assessed were provided an opportunity to clarify information about their climate-related policies and actions. Preliminary findings were sent in the form of a questionnaire to the companies that articulated the findings and provided an opportunity for companies to provide additional clarifying information. Ten companies responded to this outreach, and their feedback was incorporated into the assessment where relevant.
Criteria Weights:
To generate a total score for each company, the six criteria were weighted equally as follows:
3 BP, Chevron, ConocoPhillips, ExxonMobil and Royal Dutch Shell 4 UCS did not review emissions data or production data used in the calculation of emissions intensity or tar sands exposure.
12

Criteria Description Weight
1. What is the Company’s position on climate change? 16.67%
2. What action is the company taking to reduce its carbon footprint? 16.67%
3. Is climate science integral to the governance and oversight of the company?
16.67%
4. What are the company’s affiliations with third parties that spread disinformation on climate science?*
16.67%
5. Does the company publicly support the need for climate policies and regulations?
16.67%
6. Has the company been transparent about their position, actions and affiliations with regard to climate science and climate change?
16.67%
* For scoring purposes, each trade association represented one indicator for criterion 4 or 20%of the total score for criterion 4. FFI made two scoring adjustments based on regional coverageof trade association members. (1) At the broad criteria level, FFI adjusted the scoring for non-US companies with no or limited operations in the US. The rationale for this adjustment is thatcompanies with no or limited US operations would not ordinarily be expected to be affiliatedwith US trade associations, and as such shouldn’t be given “credit” for non-affiliation. For thesecompanies, Criteria 4 received a zero weight and the weights for the remaining criteria receiveda weight of 20% (adjusted from 16.67%). (2) Further, within criteria 4, WSPA is a tradeassociation whose members operate in California, Oregon, Washington, Arizona and Nevada.WSPA affiliation was evaluated only for those companies with operations in the WSPA coveredstates. For those companies that did not have operations in the WSPA states, the WSPAaffiliation received a zero weight and the remaining 4 trade association affiliations wereweighted 25% each.
Tar Sands Reserves
Barnard also believes that exploration and production activities relating to oil sands (tar sands), whose production is the most emissions intensive of oil & gas reserves, is counter to the prevention of climate change. As such, FFI has identified companies whose potential emissions from proven oil sands reserves exceeds 50% of its total potential emissions of all reserves deducted 0.5 points from their total score.
13

Appendix A: Barnard College Climate Science List Criteria Scoring GuideTable 1: Scoring Criteria
1. What is the company’s position on climate science?Understanding whether a company recognizes climate change as a significant issue is an indicator of how it views climate science. Does it explicitly recognize climate change as a significant issue? Does it support positions contrary to accepted science?
2. What measures is the company taking to reduce its carbon footprint?The extent to which a company is taking action to reduce its own carbon footprint is an indicator of how seriously it considers the risks posed by climate change. Actions could include setting GHG emissions targets, reducing GHG emissions, lowering the carbon intensity of its supply chain, and/or investing in low-carbon R&D.
3. Is climate science integral to the governance and oversight of the company?How a company is organized to manage the risks and opportunities of climate change is an indicator of its views toward climate science and climate change. For example, do company board members have explicit oversight of climate change policy? Does the company support climate-related shareholder resolutions? Has it disclosed physical, market, and regulatory risks related to climate change?
4. What are the company’s affiliations with third parties that spread disinformation on climatescience?
Trade organizations are vehicles that spread disinformation on climate science. This criterion sets out to determine a company’s affiliations with a small handful of trade associations that have been scored by a third party as having exhibited the most egregious climate change-denying behavior. Is the company associated with any of the five trade associations on our watch list, or has the company distanced itself from statements or actions by trade associations that deny climate science and foster disinformation?
5. Does the company publicly support the need for climate policies and regulations?An indicator of a company’s attitude towards climate change is the extent to which it supports a variety of public policies that seek to mitigate the causes and reduce the impacts of climate change. These could include policies that attempt to price the cost of emissions, policies that encourage a switch to alternative energy sources, and policies that support CCS.
6. Has the company been transparent about its position, actions, and affiliations with regard toclimate science and climate change?
The extent to which a company is transparent about its policies and attitudes towards climate change and climate science is an indicator of its support for the free flow of information.
Table 2: Scoring Bands Definition Point Assigned Company’s performance demonstrates best practices 5
Company’s performance neither positive nor negative 3
Company’s performance needs improvement 1
14

Table 3: Abbreviations Abbreviation Meaning Abbreviation Meaning
CCS Carbon Capture & Sequestration / Storage EPA Environmental Protection
Agency
CO2 Carbon Dioxide GHG Greenhouse Gas
CPP Clean Power Plan R&D Research & Development
Table 4: Criterion 1 1. What is the company’s position on climate science?1A. Consistently accurate public statements on climate science and consequent need for swift and deep
reductions in emissions from the burning of fossil fuels
Table 5: Indicator 1A 1A. Consistently accurate public statements on climate science and the consequent need for swift
and deep reductions in emissions from the burning of fossil fuels
(5) Company meets all of the criteria to receive a score of 4 and also highlights the urgency and importance of achieving global net-zero CO2 emissions in order to keep temperature rise well below 2°C and strive to limit below 1.5°C and limit risks to society and ecosystems.
(4) Company meets all of the criteria to receive a score of 3 and also affirms the consequent need for swift and deep reductions in emissions from the burning of fossil fuels.
(3) Company consistently acknowledges up-to-date scientific evidence of climate change in all public platforms, for example company websites and statements made by company executives.
(2) Company does not address up-to-date climate science on the company website in a prominent, easily accessible page, for example a page designated specifically to address climate change, or has downplayed the need to reduce GHG emissions in at least one platform.
(1) Company has misrepresented climate science in at least one platform, for example in the company website or in public statements. Such misrepresentation might take the form of denying the reality of the problem of climate change or disparaging the scientific evidence of climate change.
Table 6: Criterion 2 2. What measures is the company taking to reduce its carbon footprint?2A. GHG emissions targets 2B. GHG emissions reductions 2C. Measuring and reducing carbon intensity of supply chain 2D. R&D into low-carbon technologies 2E. Use of an internal price on carbon
15

Table 7: Indicator 2A 2A. GHG emissions targets
(5)
Company meets all of the criteria to receive a score of 4 and: 1. The company has near-term benchmark and long-term transition metrics to measure
progress toward the long-term goal, involving a credible plan to ultimately reduce thenet GHG emissions of its business activities to zero.
2. If it envisages a substantial role for offsetting of residual GHG emissions, thecompany provides details of that offset mechanism, including its reliability, itsavailability at sufficient scale for the global transition, and identification of who isgoing to pay for it.
3. If CO2 removal plays a substantial role in the company’s plans, the companyprovides details on how such a removal will be achieved, paid for, monitored, andmaintained—in effect, permanently.
(4)
Company has set a strong, viable, long-term science-based target for reducing GHG emissions resulting from company-wide operations and the end use of its products, and has developed a concrete action plan to achieve those reductions in the service of the Paris Climate Agreement’s global temperature goal and net-zero emissions. The plan is grounded in available technologies, or, if it depends on future technology, specifies how the company intends to contribute to the development of new technology.
(3) Company has made a company-wide commitment to reduce GHG emissions in the service of the Paris Climate Agreement’s global temperature goal, but has not set a science-based target or released a concrete plan to achieve that target.
(2) Company has a plan for reducing GHG emissions, but the plan is not company-wide and/or is not in the service of a specific temperature goal or target; or company has a GHG emissions reduction target that expires in the reporting year or earlier.
(1) Company has no plan for reducing GHG emissions.
Table 8: Indicator 2B 2B. GHG emissions reductions*
(5) Company’s GHG emissions intensity has decreased in each of the last two reporting years and has decreased by over 20% over the last two reporting years.
(4) Company’s GHG emissions intensity has decreased over the last two reporting years.
(3) Company’s GHG emissions intensity has increased in one of the last two reporting years but decreased as a whole over the last two reporting years.
(2) Company’s GHG emissions intensity has increased in one of the last two reporting years and increased as a whole over the last two reporting years.
(1) Company’s GHG emissions intensity has increased in each of the last two reporting years. * As measured by emissions intensity, measured by taking Scope 1 & 2 emissions and dividing that by total production
Table 9: Indicator 2C 2C. R&D or Venture stage investments into low-carbon technologies
(5) Company meets all of the criteria to receive a score of 4, has increased the proportion of its R&D budget dedicated to low-carbon technologies, and plans to increase the allocation to low-carbon R&D in future budgets.
16

(4) Company has publicly committed to funding in-house and/or third-party R&D into low-carbon technologies, with investments allocated by technology and the company providing monetary figures to describe its existing investments; and company has not decreased the proportion of its R&D budget dedicated to this purpose.
(3) Company has publicly committed to funding in-house and/or third-party R&D into low-carbon technologies, with some evidence of specific allocations, but R&D budget is not broken down by technology.
(2) Company has publicly committed to funding in-house and/or third-party R&D into low-carbon technologies, but listed activities, whether investments or partnerships, are vaguely defined, anecdotal, and/or lack monetary figures; and/or the low-carbon R&D budget has decreased compared to the last reporting year.
(1) Company has not publicly committed to investing in in-house and/or third-party R&D into low-carbon technologies and does not disclose its budget dedicated to R&D into low-carbon technologies.
Table 10: Indicator 2D 2D. Use of an internal price on carbon
(5) Company meets all of the criteria to receive a score of 4 and extends the use of price on carbon to parts of the supply chain that the company does not directly control.
(4) Company has set a price on carbon it uses in investment decisions reflecting CO2 emitted in all segments of the supply chain over which the company has control.
(3) Company has set an internal price on carbon it uses in investment decisions, but the price is applied only to one segment of the supply chain.
(2) Company has set a price on carbon that is used in investment decisions but does not disclose the price; or has disclosed a specific price on carbon but does not explain how it is employed.
(1) Company does not use an internal price on carbon in investment decisions.
Table 11: Criterion 3 1. Is climate science integral to the governance and oversight of the company?3A. Delineation of risks and risk management procedures related to climate change 3B. Delegation of board members and/or committees with explicit oversight of climate change policy 3C. Support of climate-related shareholder resolutions
17

Table 12: Indicator 3A 3A. Delineation of risks and risk management procedures related to climate change*
3A.i Regulatory Risks
(5)
Company meets all of the criteria to receive a score of 4 and company also includes: 1. An analysis of whether these laws and regulations will have, or are reasonably likely
to have, a material impact on liquidity, capital resources, or results of operations; as well as the basis for the company’s conclusions.
2. Any material estimating capital expenditures for environmental control facilities.3. How the company will respond.
(4) Company offers a detailed analysis of existing and proposed climate-related regulations and laws and their possible effects on the company, including potential financial impacts.
(3) Company pinpoints specific existing and proposed climate-related laws and regulations that may affect it, but does not address how the company in particular would be affected.
(2) Company notes the general existence of risk associated with current or proposed regulations and laws relating to climate change, but does not pinpoint specific laws or regulations and/or does not identify effects particular to the company.
(1) Company does not address its regulatory risks related to climate change.
3A.ii Physical Risks
(5)
Company meets all of the criteria to receive a score of 4 and also includes: 1. An analysis of whether these physical risks will have, or are reasonably likely to have,
a material impact on liquidity, capital resources, or results of operations; as well as the basis for the company’s conclusions.
2. Past physical impacts, if material.
(4)
Company discusses the physical climate-related risks it faces, with specific details, including at least one of the following:
1. The operational segments and/or specific company facilities that might be impacted.2. The magnitude and time frames of the anticipated impacts.3. How the company plans to respond to physical impacts.
(3) Company acknowledges the physical risks it faces and includes discussion of climate change as a contributor to those risks, but with few or no details about the nature of those risks, their magnitude, or how they may impact the company in particular.
(2) Company generally notes the physical risks it faces, such as weather, but does not include a discussion of climate change as a contributor to those risks.
(1) Company does not address its physical risks related to climate change.
3A.iii Market and Other Indirect Risks and Opportunities
(5)
Company meets all of the criteria to receive a score of 4 and also includes: 1. Potential impacts on suppliers and customers.2. Potential impacts on the company’s reputation.3. Magnitude of anticipated risks and opportunities.4. Basis for the company’s conclusions.
(4)
Company provides some detail and examples of how it might be affected by indirect risks and opportunities related to climate change, including:
1. An analysis of whether identified risks and opportunities will have, or are reasonablyliked to have, a material impact on liquidity, capital resources, or results of operations.
2. Key variables and other qualitative and quantitative factors that are particular to andnecessary for an understanding and evaluation of the individual company.
18
3A.iii Market and Other Indirect Risks and Opportunities
(3)
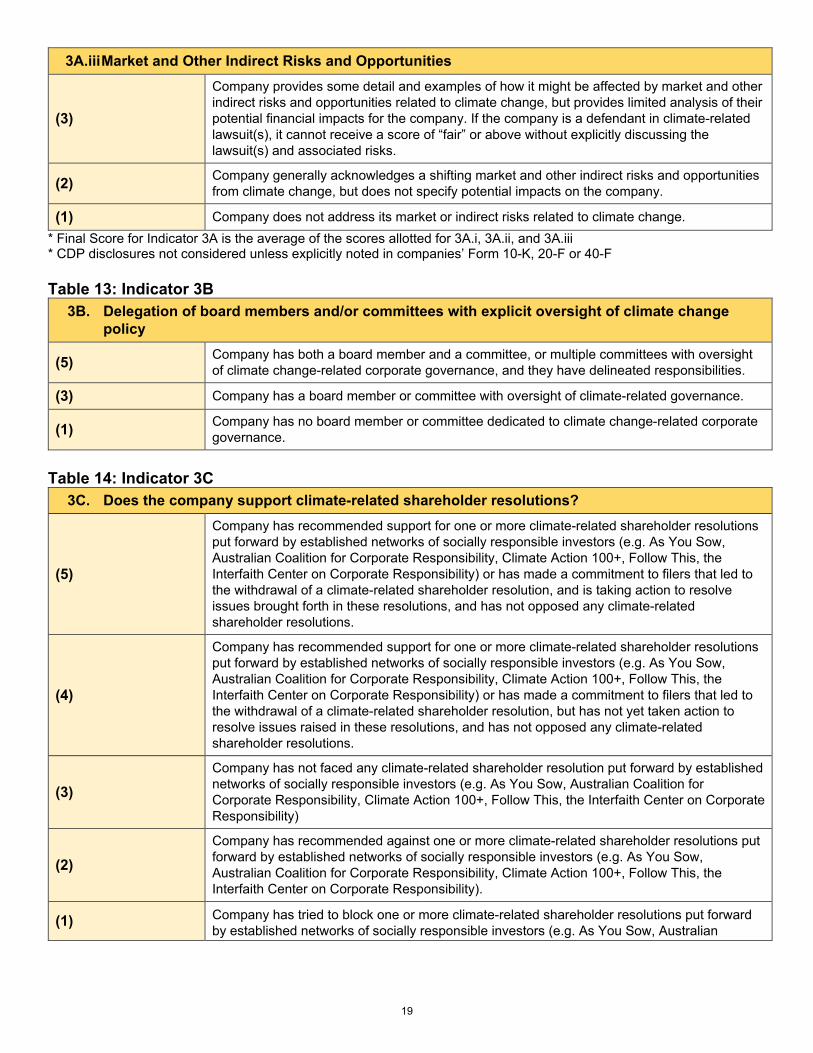
Company provides some detail and examples of how it might be affected by market and other indirect risks and opportunities related to climate change, but provides limited analysis of their potential financial impacts for the company. If the company is a defendant in climate-related lawsuit(s), it cannot receive a score of “fair” or above without explicitly discussing the lawsuit(s) and associated risks.
(2) Company generally acknowledges a shifting market and other indirect risks and opportunities from climate change, but does not specify potential impacts on the company.
(1) Company does not address its market or indirect risks related to climate change. * Final Score for Indicator 3A is the average of the scores allotted for 3A.i, 3A.ii, and 3A.iii* CDP disclosures not considered unless explicitly noted in companies’ Form 10-K, 20-F or 40-F
Table 13: Indicator 3B 3B. Delegation of board members and/or committees with explicit oversight of climate change
policy
(5) Company has both a board member and a committee, or multiple committees with oversight of climate change-related corporate governance, and they have delineated responsibilities.
(3) Company has a board member or committee with oversight of climate-related governance.
(1) Company has no board member or committee dedicated to climate change-related corporate governance.
Table 14: Indicator 3C 3C. Does the company support climate-related shareholder resolutions?
(5)
Company has recommended support for one or more climate-related shareholder resolutions put forward by established networks of socially responsible investors (e.g. As You Sow, Australian Coalition for Corporate Responsibility, Climate Action 100+, Follow This, the Interfaith Center on Corporate Responsibility) or has made a commitment to filers that led to the withdrawal of a climate-related shareholder resolution, and is taking action to resolve issues brought forth in these resolutions, and has not opposed any climate-related shareholder resolutions.
(4)
Company has recommended support for one or more climate-related shareholder resolutions put forward by established networks of socially responsible investors (e.g. As You Sow, Australian Coalition for Corporate Responsibility, Climate Action 100+, Follow This, the Interfaith Center on Corporate Responsibility) or has made a commitment to filers that led to the withdrawal of a climate-related shareholder resolution, but has not yet taken action to resolve issues raised in these resolutions, and has not opposed any climate-related shareholder resolutions.
(3) Company has not faced any climate-related shareholder resolution put forward by established networks of socially responsible investors (e.g. As You Sow, Australian Coalition for Corporate Responsibility, Climate Action 100+, Follow This, the Interfaith Center on Corporate Responsibility)
(2) Company has recommended against one or more climate-related shareholder resolutions put forward by established networks of socially responsible investors (e.g. As You Sow, Australian Coalition for Corporate Responsibility, Climate Action 100+, Follow This, the Interfaith Center on Corporate Responsibility).
(1) Company has tried to block one or more climate-related shareholder resolutions put forward by established networks of socially responsible investors (e.g. As You Sow, Australian
19

Coalition for Corporate Responsibility, Climate Action 100+, Follow This, the Interfaith Center on Corporate Responsibility).
Table 15: Criterion 4 4. What are the company’s affiliations with third parties that spread disinformation on climate
science?4A. The American Legislative Exchange Council (ALEC) 4B. The American Petroleum Institute (API) 4C. The National Association of Manufacturers (NAM) 4D. The Western States Petroleum Association (WSPA) 4E. American Fuel and Petrochemical Manufacturers (AFPM)
Table 16: Indicators 4A, 4B, 4C, 4D, 4E 4. What are the company’s affiliations with third parties that spread disinformation on climate
science?
(5) Company has left or never joined the association or group. Company stated explicitly it was because the group’s position on climate science is inaccurate and inconsistent with the company’s stance.
(4) Company has left or publicly distanced itself from the association or group, or there is clear, incontrovertible evidence that the company has never been affiliated with it.
(3) Information is unavailable to determine company’s affiliation with the association or group.
(2) Company is a recent member of the association or group and has not taken concrete steps to distance itself from the group’s climate change deception.
(1) Company meets all of the criteria for “poor” and has a leadership position in the association or group.
Table 17: Criterion 5 5. Does the company publicly support the need for climate policy and regulations?5A. Regulations, carbon tax, emissions trading, renewable energy, CCS, etc. 5B. Paris Agreement
Table 18: Indicator 5A 5A. Regulations, carbon tax, emissions trading, renewable energy, CCS, etc.
(5) Company meets all of the criteria to receive a score of 4 and advocates publicly and consistently for such climate policies and/or regulations, including through industry or multi-stakeholder groups.
(4) Company meets all of the criteria to receive a score of 3 and issues consistent public statements in support of one or more specific proposed climate policies and/or regulations in the company’s relevant jurisdictions.
(3) Company identifies a general category of climate policy that it supports (e.g., carbon tax) on the company website or in public statements.
(2) Company has not publicly expressed support for climate policies and regulations or has contradicted its stated support by actively opposing one or more specific climate policy proposals in the company’s relevant jurisdictions.
20
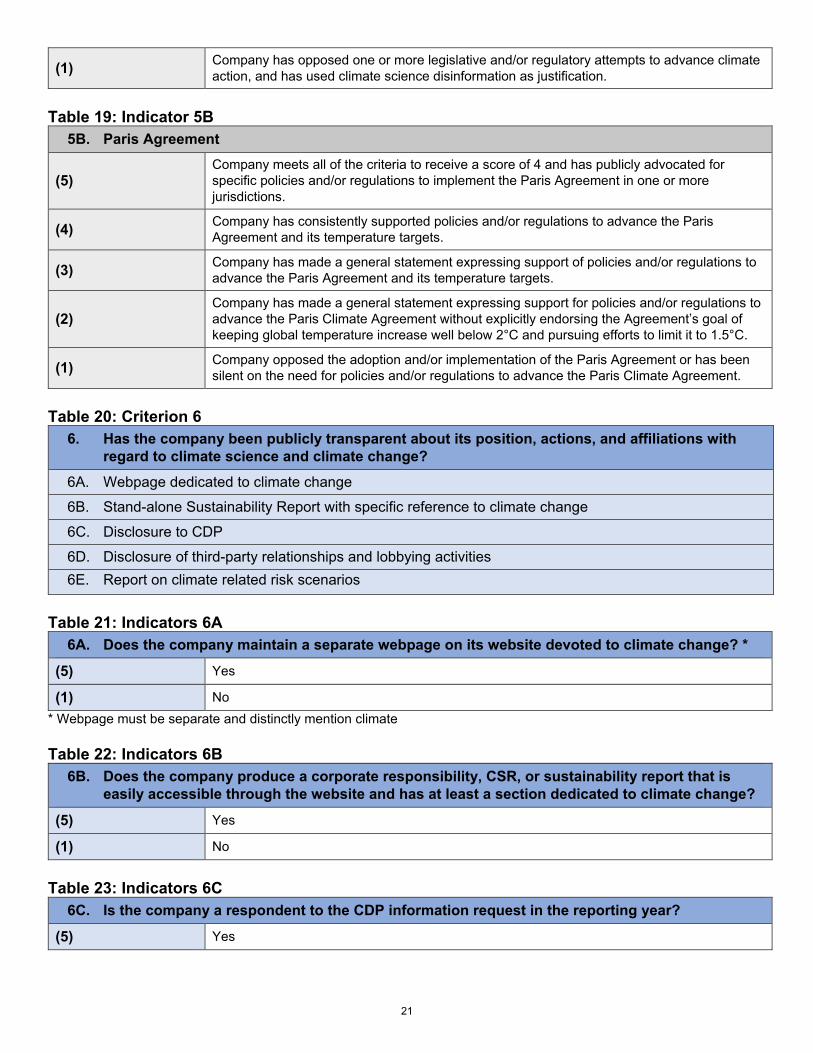
(1) Company has opposed one or more legislative and/or regulatory attempts to advance climate action, and has used climate science disinformation as justification.
Table 19: Indicator 5B 5B. Paris Agreement
(5) Company meets all of the criteria to receive a score of 4 and has publicly advocated for specific policies and/or regulations to implement the Paris Agreement in one or more jurisdictions.
(4) Company has consistently supported policies and/or regulations to advance the Paris Agreement and its temperature targets.
(3) Company has made a general statement expressing support of policies and/or regulations to advance the Paris Agreement and its temperature targets.
(2) Company has made a general statement expressing support for policies and/or regulations to advance the Paris Climate Agreement without explicitly endorsing the Agreement’s goal of keeping global temperature increase well below 2°C and pursuing efforts to limit it to 1.5°C.
(1) Company opposed the adoption and/or implementation of the Paris Agreement or has been silent on the need for policies and/or regulations to advance the Paris Climate Agreement.
Table 20: Criterion 6 6. Has the company been publicly transparent about its position, actions, and affiliations with
regard to climate science and climate change?6A. Webpage dedicated to climate change 6B. Stand-alone Sustainability Report with specific reference to climate change
6C. Disclosure to CDP 6D. Disclosure of third-party relationships and lobbying activities 6E. Report on climate related risk scenarios
Table 21: Indicators 6A 6A. Does the company maintain a separate webpage on its website devoted to climate change? *
(5) Yes
(1) No * Webpage must be separate and distinctly mention climate
Table 22: Indicators 6B 6B. Does the company produce a corporate responsibility, CSR, or sustainability report that is
easily accessible through the website and has at least a section dedicated to climate change?
(5) Yes
(1) No
Table 23: Indicators 6C 6C. Is the company a respondent to the CDP information request in the reporting year?
(5) Yes
21

(1) No
Table 24: Indicators 6D 6D. Does the company disclose affiliations with or payments to trade associations or lobbying
groups on its website or public filings?
(5) Yes
(3) Discloses some, but not all affiliations. For example, may disclose only associations or groups to whom it has contributed over a certain amount.
(1) No
Table 25: Indicators 6E 6E. Has the company produced and published an analysis on what a 2°C or lower increase in
global temperature would mean for its businesses, strategies, and financial planning?*
(5) Yes
(1) No * Per the recommendation of the Task Force on Climate-Related Financial Disclosures
22

Climate Science List
Company Universe and Summary
Spreadsheet summarizes the numerical scores for each company for each of the 6 broad evaluation criteria. A summary aggregate score is found in column N. A numerical score of 1 is the worst score and a score of 5 is the best.
Company Scoring Detail
Spreadsheet provides detail for each sub‐criteria used in the evaluation. The detailed numerical scores in this sheet roll up to the Company Universe and Summary Sheet.
23
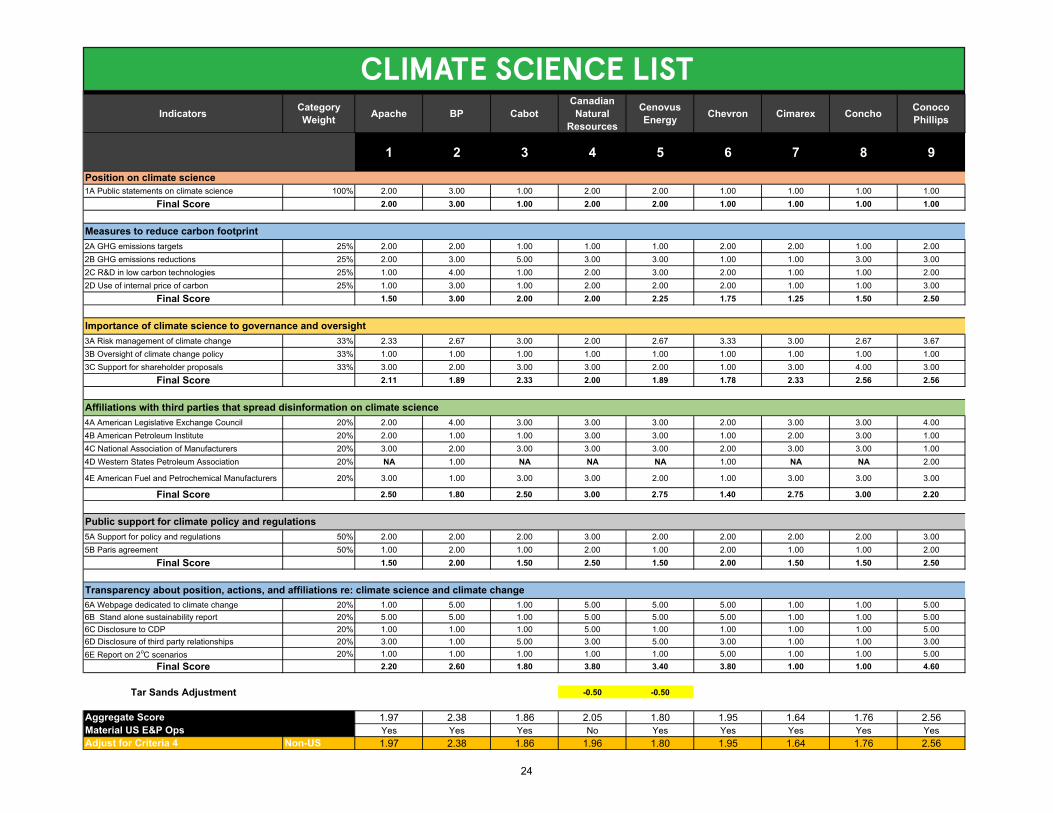
CLIMATE SCIENCE LIST
Company Scoring 2019 11‐13‐19
Indicators Category Weight Apache BP Cabot
Canadian Natural
Resources
Cenovus Energy Chevron Cimarex Concho Conoco
Phillips
1 2 3 4 5 6 7 8 9
1A Public statements on climate science 100% 2.00 3.00 1.00 2.00 2.00 1.00 1.00 1.00 1.00Final Score 2.00 3.00 1.00 2.00 2.00 1.00 1.00 1.00 1.00
2A GHG emissions targets 25% 2.00 2.00 1.00 1.00 1.00 2.00 2.00 1.00 2.002B GHG emissions reductions 25% 2.00 3.00 5.00 3.00 3.00 1.00 1.00 3.00 3.002C R&D in low carbon technologies 25% 1.00 4.00 1.00 2.00 3.00 2.00 1.00 1.00 2.002D Use of internal price of carbon 25% 1.00 3.00 1.00 2.00 2.00 2.00 1.00 1.00 3.00
Final Score 1.50 3.00 2.00 2.00 2.25 1.75 1.25 1.50 2.50
3A Risk management of climate change 33% 2.33 2.67 3.00 2.00 2.67 3.33 3.00 2.67 3.673B Oversight of climate change policy 33% 1.00 1.00 1.00 1.00 1.00 1.00 1.00 1.00 1.003C Support for shareholder proposals 33% 3.00 2.00 3.00 3.00 2.00 1.00 3.00 4.00 3.00
Final Score 2.11 1.89 2.33 2.00 1.89 1.78 2.33 2.56 2.56
4A American Legislative Exchange Council 20% 2.00 4.00 3.00 3.00 3.00 2.00 3.00 3.00 4.004B American Petroleum Institute 20% 2.00 1.00 1.00 3.00 3.00 1.00 2.00 3.00 1.004C National Association of Manufacturers 20% 3.00 2.00 3.00 3.00 3.00 2.00 3.00 3.00 1.004D Western States Petroleum Association 20% NA 1.00 NA NA NA 1.00 NA NA 2.00
4E American Fuel and Petrochemical Manufacturers 20% 3.00 1.00 3.00 3.00 2.00 1.00 3.00 3.00 3.00
Final Score 2.50 1.80 2.50 3.00 2.75 1.40 2.75 3.00 2.20
5A Support for policy and regulations 50% 2.00 2.00 2.00 3.00 2.00 2.00 2.00 2.00 3.005B Paris agreement 50% 1.00 2.00 1.00 2.00 1.00 2.00 1.00 1.00 2.00
Final Score 1.50 2.00 1.50 2.50 1.50 2.00 1.50 1.50 2.50
6A Webpage dedicated to climate change 20% 1.00 5.00 1.00 5.00 5.00 5.00 1.00 1.00 5.006B Stand alone sustainability report 20% 5.00 5.00 1.00 5.00 5.00 5.00 1.00 1.00 5.006C Disclosure to CDP 20% 1.00 1.00 1.00 5.00 1.00 1.00 1.00 1.00 5.006D Disclosure of third party relationships 20% 3.00 1.00 5.00 3.00 5.00 3.00 1.00 1.00 3.006E Report on 2oC scenarios 20% 1.00 1.00 1.00 1.00 1.00 5.00 1.00 1.00 5.00
Final Score 2.20 2.60 1.80 3.80 3.40 3.80 1.00 1.00 4.60
Tar Sands Adjustment -0.50 -0.50
Aggregate Score 1.97 2.38 1.86 2.05 1.80 1.95 1.64 1.76 2.56Material US E&P Ops Yes Yes Yes No Yes Yes Yes Yes YesAdjust for Criteria 4 Non-US 1.97 2.38 1.86 1.96 1.80 1.95 1.64 1.76 2.56
Public support for climate policy and regulations
Transparency about position, actions, and affiliations re: climate science and climate change
Position on climate science
Measures to reduce carbon footprint
Importance of climate science to governance and oversight
Affiliations with third parties that spread disinformation on climate science
Company Scoring Detail
24

CLIMATE SCIENCE LISTCompany Scoring 2019 11‐13‐19
Indicators
1A Public statements on climate scienceFinal Score
2A GHG emissions targets2B GHG emissions reductions2C R&D in low carbon technologies2D Use of internal price of carbon
Final Score
3A Risk management of climate change3B Oversight of climate change policy3C Support for shareholder proposals
Final Score
4A American Legislative Exchange Council4B American Petroleum Institute4C National Association of Manufacturers4D Western States Petroleum Association
4E American Fuel and Petrochemical Manufacturers
Final Score
5A Support for policy and regulations5B Paris agreement
Final Score
6A Webpage dedicated to climate change6B Stand alone sustainability report6C Disclosure to CDP6D Disclosure of third party relationships6E Report on 2oC scenarios
Final Score
Tar Sands Adjustment
Aggregate ScoreMaterial US E&P OpsAdjust for Criteria 4
Public support for climate policy and regu
Transparency about position, actions, and
Position on climate science
Measures to reduce carbon footprint
Importance of climate science to governan
Affiliations with third parties that spread d
Devon Encana ENI EOGEquinor (formerly Statoil)
ExxonMobil Galp Hess Imperial INPEX Marathon Oil Noble
10 11 12 13 14 15 16 17 18 19 20 21
2.00 2.00 3.00 1.00 4.00 1.00 2.00 1.00 2.00 2.00 1.00 1.002.00 2.00 3.00 1.00 4.00 1.00 2.00 1.00 2.00 2.00 1.00 1.00
2.00 1.00 2.00 1.00 2.00 2.00 2.00 3.00 2.00 2.00 1.00 1.002.00 1.00 1.00 1.00 2.00 3.00 5.00 3.00 1.00 3.00 3.00 2.002.00 1.00 3.00 1.00 4.00 2.00 3.00 1.00 2.00 2.00 1.00 1.002.00 2.00 4.00 1.00 4.00 2.00 4.00 3.00 2.00 3.00 1.00 1.002.00 1.25 2.50 1.00 3.00 2.25 3.50 2.50 1.75 2.50 1.50 1.25
2.67 2.33 3.33 2.67 3.00 2.33 3.67 2.67 2.00 2.33 1.67 2.331.00 1.00 3.00 1.00 3.00 1.00 1.00 1.00 1.00 1.00 1.00 3.001.00 3.00 3.00 1.00 2.00 1.00 3.00 1.00 2.00 3.00 4.00 2.001.56 2.11 3.11 1.56 2.67 1.44 2.56 1.56 1.67 2.11 2.22 2.44
2.00 3.00 3.00 3.00 3.00 4.00 3.00 3.00 3.00 3.00 3.00 2.001.00 1.00 3.00 1.00 2.00 1.00 3.00 1.00 3.00 3.00 1.00 1.001.00 1.00 3.00 3.00 3.00 1.00 3.00 3.00 3.00 3.00 1.00 3.00NA NA NA NA NA 2.00 NA NA NA NA NA NA
3.00 3.00 3.00 3.00 3.00 1.00 3.00 3.00 3.00 3.00 3.00 3.00
1.75 2.00 3.00 2.50 2.75 1.80 3.00 2.50 3.00 3.00 2.00 2.25
2.00 2.00 4.00 2.00 4.00 3.00 3.00 2.00 2.00 2.00 2.00 4.001.00 2.00 4.00 1.00 4.00 2.00 2.00 2.00 2.00 2.00 1.00 1.001.50 2.00 4.00 1.50 4.00 2.50 2.50 2.00 2.00 2.00 1.50 2.50
5.00 5.00 5.00 1.00 5.00 5.00 5.00 5.00 5.00 5.00 5.00 5.005.00 1.00 5.00 5.00 5.00 5.00 5.00 5.00 5.00 5.00 5.00 5.005.00 5.00 5.00 5.00 5.00 1.00 5.00 5.00 1.00 5.00 1.00 5.003.00 3.00 3.00 3.00 3.00 1.00 1.00 3.00 1.00 3.00 3.00 5.005.00 1.00 5.00 1.00 5.00 5.00 5.00 5.00 5.00 5.00 1.00 1.004.60 3.00 4.60 3.00 4.60 3.40 4.20 4.60 3.40 4.60 3.00 4.20
-0.50
2.23 2.06 3.37 1.76 3.50 2.07 2.96 2.36 1.80 2.70 1.87 2.27Yes Yes No Yes Yes Yes No Yes No No Yes Yes2.23 2.06 3.44 1.76 3.50 2.07 2.95 2.36 1.66 2.64 1.87 2.27
Climate Science List
Company Scoring Detail
25
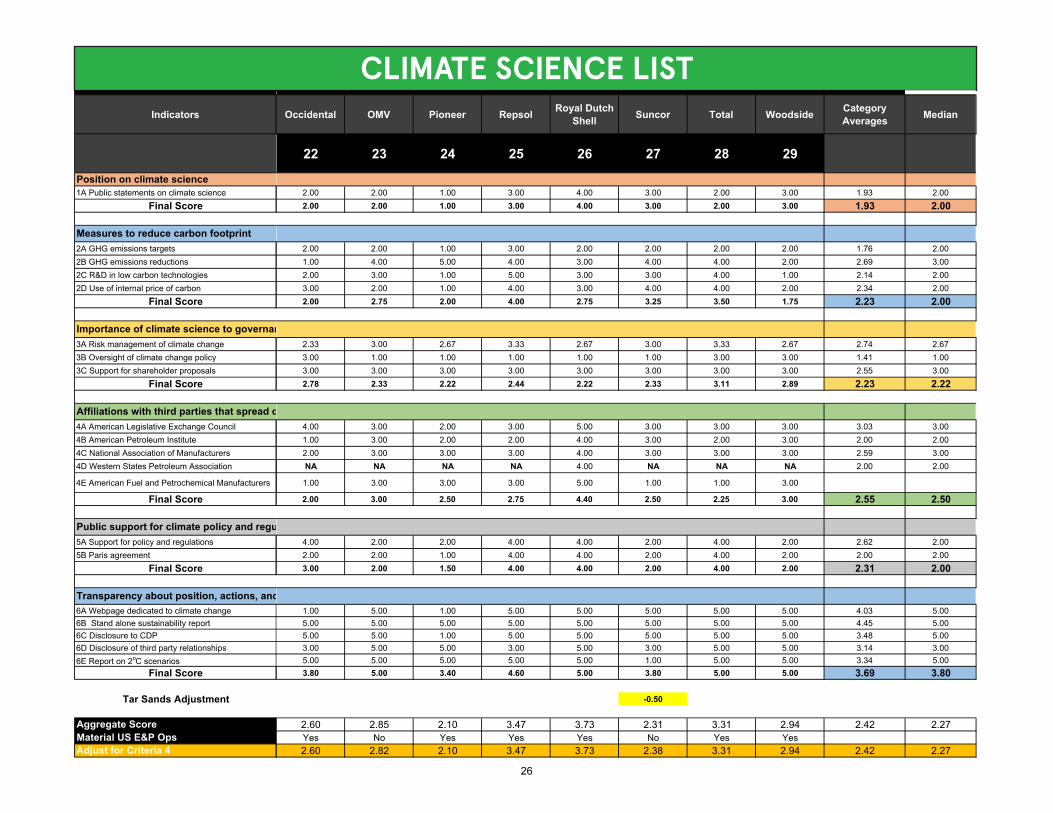
CLIMATE SCIENCE LIST
Company Scoring 2019 11‐13‐19
Indicators
1A Public statements on climate scienceFinal Score
2A GHG emissions targets2B GHG emissions reductions2C R&D in low carbon technologies2D Use of internal price of carbon
Final Score
3A Risk management of climate change3B Oversight of climate change policy3C Support for shareholder proposals
Final Score
4A American Legislative Exchange Council4B American Petroleum Institute4C National Association of Manufacturers4D Western States Petroleum Association
4E American Fuel and Petrochemical Manufacturers
Final Score
5A Support for policy and regulations5B Paris agreement
Final Score
6A Webpage dedicated to climate change6B Stand alone sustainability report6C Disclosure to CDP6D Disclosure of third party relationships6E Report on 2oC scenarios
Final Score
Tar Sands Adjustment
Aggregate ScoreMaterial US E&P OpsAdjust for Criteria 4
Public support for climate policy and regu
Transparency about position, actions, and
Position on climate science
Measures to reduce carbon footprint
Importance of climate science to governan
Affiliations with third parties that spread d
Occidental OMV Pioneer Repsol Royal Dutch Shell Suncor Total Woodside Category
Averages Median
22 23 24 25 26 27 28 29
2.00 2.00 1.00 3.00 4.00 3.00 2.00 3.00 1.93 2.002.00 2.00 1.00 3.00 4.00 3.00 2.00 3.00 1.93 2.00
2.00 2.00 1.00 3.00 2.00 2.00 2.00 2.00 1.76 2.001.00 4.00 5.00 4.00 3.00 4.00 4.00 2.00 2.69 3.002.00 3.00 1.00 5.00 3.00 3.00 4.00 1.00 2.14 2.003.00 2.00 1.00 4.00 3.00 4.00 4.00 2.00 2.34 2.002.00 2.75 2.00 4.00 2.75 3.25 3.50 1.75 2.23 2.00
2.33 3.00 2.67 3.33 2.67 3.00 3.33 2.67 2.74 2.673.00 1.00 1.00 1.00 1.00 1.00 3.00 3.00 1.41 1.003.00 3.00 3.00 3.00 3.00 3.00 3.00 3.00 2.55 3.002.78 2.33 2.22 2.44 2.22 2.33 3.11 2.89 2.23 2.22
4.00 3.00 2.00 3.00 5.00 3.00 3.00 3.00 3.03 3.001.00 3.00 2.00 2.00 4.00 3.00 2.00 3.00 2.00 2.002.00 3.00 3.00 3.00 4.00 3.00 3.00 3.00 2.59 3.00NA NA NA NA 4.00 NA NA NA 2.00 2.00
1.00 3.00 3.00 3.00 5.00 1.00 1.00 3.00
2.00 3.00 2.50 2.75 4.40 2.50 2.25 3.00 2.55 2.50
4.00 2.00 2.00 4.00 4.00 2.00 4.00 2.00 2.62 2.002.00 2.00 1.00 4.00 4.00 2.00 4.00 2.00 2.00 2.003.00 2.00 1.50 4.00 4.00 2.00 4.00 2.00 2.31 2.00
1.00 5.00 1.00 5.00 5.00 5.00 5.00 5.00 4.03 5.005.00 5.00 5.00 5.00 5.00 5.00 5.00 5.00 4.45 5.005.00 5.00 1.00 5.00 5.00 5.00 5.00 5.00 3.48 5.003.00 5.00 5.00 3.00 5.00 3.00 5.00 5.00 3.14 3.005.00 5.00 5.00 5.00 5.00 1.00 5.00 5.00 3.34 5.003.80 5.00 3.40 4.60 5.00 3.80 5.00 5.00 3.69 3.80
-0.50
2.60 2.85 2.10 3.47 3.73 2.31 3.31 2.94 2.42 2.27Yes No Yes Yes Yes No Yes Yes2.60 2.82 2.10 3.47 3.73 2.38 3.31 2.94 2.42 2.27
Company Scoring Detail
26

CLIMATE SCIENCE LIST SUMMARY
Company Scoring 2019 11‐13‐19
O&G100 Rank Companies Oil Major Type Primary Exchange Region Criterion 1 Criterion 2 Criterion 3 Criterion 4 Criterion 5 Criterion 6 Total Score Adj for Criteria 4
67 Cimarex No E&P New York Stock Exchange US 1.00 1.25 2.33 2.75 1.50 1.00 1.6436 Imperial No Integrated New York Stock Exchange CANADA 2.00 1.75 1.67 3.00 2.00 3.40 1.6649 Concho No E&P New York Stock Exchange US 1.00 1.50 2.56 3.00 1.50 1.00 1.7626 EOG No E&P New York Stock Exchange US 1.00 1.00 1.56 2.50 1.50 3.00 1.7631 Cenovus Energy No Integrated New York Stock Exchange CANADA 2.00 2.25 1.89 2.75 1.50 3.40 1.8039 Cabot No E&P New York Stock Exchange US 1.00 2.00 2.33 2.50 1.50 1.80 1.8638 Marathon Oil No E&P Toronto Stock Exchange US 1.00 1.50 2.22 2.00 1.50 3.00 1.879 Chevron Yes Integrated New York Stock Exchange US 1.00 1.75 1.78 1.40 2.00 3.80 1.95
19 Canadian Natural Resources No E&P New York Stock Exchange CANADA 2.00 2.00 2.00 3.00 2.50 3.80 1.9643 Apache No E&P Toronto Stock Exchange US 2.00 1.50 2.11 2.50 1.50 2.20 1.9752 Encana No E&P New York Stock Exchange CANADA 2.00 1.25 2.11 2.00 2.00 3.00 2.064 ExxonMobil Yes Integrated New York Stock Exchange US 1.00 2.25 1.44 1.80 2.50 3.40 2.07
47 Pioneer No E&P Wiener Börse AG US 1.00 2.00 2.22 2.50 1.50 3.40 2.1033 Devon No E&P New York Stock Exchange US 2.00 2.00 1.56 1.75 1.50 4.60 2.2332 Noble No E&P Toronto Stock Exchange US 1.00 1.25 2.44 2.25 2.50 4.20 2.2744 Hess No E&P Toronto Stock Exchange US 1.00 2.50 1.56 2.50 2.00 4.60 2.3630 Suncor No Integrated Euronext - Paris CANADA 3.00 3.25 2.33 2.50 2.00 3.80 2.385 BP Yes Integrated Toronto Stock Exchange UK/EUROPE 3.00 3.00 1.89 1.80 2.00 2.60 2.38
17 Conoco Phillips Yes Integrated Toronto Stock Exchange US 1.00 2.50 2.56 2.20 2.50 4.60 2.5625 Occidental No E&P Tokyo Stock Exchange US 2.00 2.00 2.78 2.00 3.00 3.80 2.6020 INPEX No E&P New York Stock Exchange ASIA/PAC 2.00 2.50 2.11 3.00 2.00 4.60 2.6445 OMV Yes Integrated London Stock Exchange UK/EUROPE 2.00 2.75 2.33 3.00 2.00 5.00 2.8251 Woodside No Integrated Borsa Italiana ASIA/PAC 3.00 1.75 2.89 3.00 2.00 5.00 2.9480 Galp No Integrated New York Stock Exchange UK/EUROPE 2.00 3.50 2.56 3.00 2.50 4.20 2.9512 Total Yes Integrated Oslo Stock Exchange UK/EUROPE 2.00 3.50 3.11 2.25 4.00 5.00 3.3114 ENI No Integrated New York Stock Exchange UK/EUROPE 3.00 2.50 3.11 3.00 4.00 4.60 3.4424 Repsol No Integrated Australian Securities Exchange UK/EUROPE 3.00 4.00 2.44 2.75 4.00 4.60 3.4716 Equinor (formerly Statoil) No Integrated Bolsa de Madrid UK/EUROPE 4.00 3.00 2.67 2.75 4.00 4.60 3.508 Royal Dutch Shell Yes Integrated London Stock Exchange UK/EUROPE 4.00 2.75 2.22 4.40 4.00 5.00 3.73
Company Universe & Summary
27

Scoring Appendix
I. Apache Corporation
II. BP plc
III. Cabot Oil & Gas Corporation
IV. Canadian Natural Resources
V. Cenovus Energy
VI. Chevron Corporation
VII. Cimarex Energy Co.
VIII. Concho Resources
IX. ConocoPhillips
X. Devon Energy Corporation
XI. Encana Corporation
XII. Eni S.p.A.
XIII. EOG Resources
XIV. Equinor
XV. ExxonMobil
XVI. Galp Energia, SGPS, S.A.
XVII. Hess
XVIII. Imperial Oil
XIX. Inpex
XX. Marathon Oil
XXI. Noble Energy, Inc.
XXII. Occidental Petroleum Corporation
XXIII. OMV
XXIV. Pioneer Natural Resources
XXV. Repsol S. A.
XXVI. Royal Dutch Shell
28

XXVII. Suncor Energy
XXVIII. Total S.A.
XXIX. Woodside Petroleum
29

Company UniverseThe Climate Science List focuses on 30 companies (1) that operate in developed markets, (2) where public information on their activities is available and (3) whose main line of business is oil and gas exploration and production. cience. These 30 companies represent a sizable percentage of the free float market cap of the O&G100 (about 66%).
Indicator 2B ScoringAs measured by emissions intensity, calculated by taking a company's Scope 1 & 2 emissions and dividing that by its total production. This intensity metric normalizes emissions relative to output, thus enabling comparison of two or more companies irrespective of the volumes of their GHG emissions or the amount of barrels of oil equivalent they produce. Indicator 2B scoring bands are as follows:
5 - Company’s GHG emissions intensity has decreased in each of the last two reporting years and has decreased by over 20% over the last two reporting years. 4 - Company’s GHG emissions intensity has decreased over the last two reporting years. 3 - Company’s GHG emissions intensity has increased in one of the last two reporting years but decreased as a whole over the last two reporting years. 2 - Company’s GHG emissions intensity has increased in one of the last two reporting years and increased as a whole over the last two reporting years. 1 - Company’s GHG emissions intensity has increased in each of the last two reporting years.
Tar Sands TestThe exploration and production activities relating to oil sands (tar sands), whose production is the most emissions intensive of oil & gas reserves, is counter to the prevention of climate change. As such, companies whose potential emissions from proven oil sands reserves exceeds 50% of its total potential emissions of all reserves have 0.5 points deducted from their total score.
* Cimarex Energy, Encana and EOG Resources reported incomplete FY 2015-2017 emissions and/or their emissions could not be modelled with reliability. Because of thepoor quality of their reporting, FFI scored these companies as "Eggregious" for Criteria 2B. All FY 2015-2017 emissions data provided by ISS/Ethix.
** tCO2e stands for Tonnes of Carbon Dioxide Equivalent.*** MBOED stands for Thousand Barrels Oil Equivalent per Day.
30

Scope 1 & 2 Emissions (tCO2e)**
Annual Production (MBOED)***
Emissions Intensity
Scope 1 & 2 Emissions
(tCO2e)
Annual Production (MBOED)
Emissions Intensity
Scope 1 & 2 Emissions
(tCO2e)
Annual Production (MBOED)
Emissions Intensity
Apache 7,700,000 558 13,790 6,777,460 522 12,991 7,860,000 457 17,199 BP 55,800,000 3,239 17,228 56,300,000 3,268 17,228 56,600,000 3,552 15,935
Cabot Oil & Gas 1,108,514 275 4,031 1,017,214 286 3,557 894,604 313 2,858 Canadian Natural Resources 21,507,543 790 27,232 20,565,025 753 27,312 23,489,051 894 26,274 Cenovus Energy 7,237,611 280 25,807 7,787,140 272 28,679 9,453,000 471 20,070 Chevron 61,600,000 2,622 23,494 64,000,000 2,594 24,672 68,000,000 2,728 24,927 Cimarex Energy* - - - - - - - - -Concho Resources 2,444,574 143 17,064 2,872,431 151 19,085 2,623,392 193 13,593 ConocoPhillips 25,750,000 1,589 16,205 26,798,628 1,569 17,080 20,553,191 1,377 14,926 Devon Energy 7,006,616 680 10,304 5,952,710 611 9,743 5,936,440 544 10,913 Encana* - - - - - - - - -ENI 38,785,398 1,760 22,037 40,800,000 1,759 23,195 42,520,000 1,729 24,592 EOG Resources* - - - - - - - - -Equinor 16,600,000 1,812 9,161 15,700,000 1,827 8,593 18,000,000 1,922 9,365 ExxonMobil 126,000,000 4,097 30,754 128,000,000 4,053 31,582 122,000,000 3,985 30,615
Galp Energia 4,031,820 43 93,763 3,931,880 65 60,490 3,852,741 91 42,338 Hess 5,200,000 375 13,854 4,537,250 322 14,091 4,099,851 306 13,398 Imperial Oil 11,907,841 339 35,126 13,200,000 356 37,079 13,830,000 335 41,284 Inpex 610,000 408 1,495 791,314 514 1,540 628,504 521 1,206 Marathon Oil 4,650,000 438 10,616 3,260,000 345 9,449 3,830,000 397 9,647 Noble Energy 2,245,928 355 6,327 2,543,120 420 6,055 2,477,108 381 6,502 Occidental 14,120,000 668 21,138 15,830,000 630 25,127 15,500,000 602 25,748 OMV 12,300,000 303 40,594 11,400,000 311 36,656 11,400,000 339 33,628
Pioneer Natural Resources 8,138,402 204 39,894 7,859,272 234 33,587 8,365,196 272 30,754 Repsol 21,646,884 559 38,731 25,500,000 690 36,957 23,390,988 666 35,122 Royal Dutch Shell 81,000,000 2,954 27,420 81,000,000 3,668 22,083 85,000,000 3,603 23,591 Suncor Energy 20,479,763 578 35,444 18,734,699 623 30,081 19,878,315 685 29,019 Total 45,800,000 2,347 19,514 43,400,000 2,452 17,700 40,200,000 2,457 16,361 Woodside Petroleum 13,405,000 253 53,083 13,592,000 259 52,414 13,126,000 216 60,769
Company
2015 2016 2017
31
Emissions Intensity

ApacheBP
Cabot Oil & GasCanadian Natural ResourcesCenovus EnergyChevronCimarex Energy*Concho ResourcesConocoPhillipsDevon EnergyEncana*ENIEOG Resources*EquinorExxonMobil
Galp EnergiaHessImperial OilInpexMarathon OilNoble EnergyOccidentalOMV
Pioneer Natural ResourcesRepsolRoyal Dutch ShellSuncor EnergyTotalWoodside Petroleum
Company 2017 % change in emissions
2017 % change in emissions intensity
2016 % change in emissions
2016 % change in emissions intensity
2 yr % change in emissions
2 yr % change in emissions
intensity
Not Reported / Modelled During
Study Period*
(1) (Growth in both 2017 and
2016)
(2) (Growth in either 2016 or 2017, Growth
overall)
(3) (Growth in either 2016 or
2017, reduction overall)
(4) (Reduction in both years)
(5) (Reduction in both years, overall >20%)
15.97% 32.39% -11.98% -5.79% 2.08% 24.7% X0.53% -7.51% 0.90% 0.00% 1.43% -7.5% X
-12.05% -19.64% -8.24% -11.77% -19.30% -29.1% X14.22% -3.80% -4.38% 0.29% 9.21% -3.5% X21.39% -30.02% 7.59% 11.13% 30.61% -22.2% X6.25% 1.03% 3.90% 5.02% 10.39% 6.1% X
- - - - - - * X-8.67% -28.78% 17.50% 11.84% 7.31% -20.3% X
-23.31% -12.61% 4.07% 5.40% -20.18% -7.9% X-0.27% 12.01% -15.04% -5.45% -15.27% 5.9% X
- - - - - - * X4.22% 6.02% 5.19% 5.25% 9.63% 11.6% X
- - - - - - * X14.65% 8.98% -5.42% -6.20% 8.43% 2.2% X-4.69% -3.06% 1.59% 2.69% -3.17% -0.5% X-2.01% -30.01% -2.48% -35.49% -4.44% -54.8% X-9.64% -4.92% -12.75% 1.71% -21.16% -3.3% X4.77% 11.34% 10.85% 5.56% 16.14% 17.5% X
-20.57% -21.67% 29.72% 3.04% 3.03% -19.3% X17.48% 2.10% -29.89% -10.99% -17.63% -9.1% X-2.60% 7.37% 13.23% -4.29% 10.29% 2.8% X-2.08% 2.47% 12.11% 18.87% 9.77% 21.8% X0.00% -8.26% -7.32% -9.70% -7.32% -17.2% X6.44% -8.43% -3.43% -15.81% 2.79% -22.9% X
-8.27% -4.97% 17.80% -4.58% 8.06% -9.3% X4.94% 6.83% 0.00% -19.47% 4.94% -14.0% X6.10% -3.53% -8.52% -15.13% -2.94% -18.1% X
-7.37% -7.56% -5.24% -9.30% -12.23% -16.2% X-3.43% 15.94% 1.40% -1.26% -2.08% 14.5% X
Criteria 2B Score2015-2017 Emissions Summary
32
Emissions Intensity

O&G100 Rank
Companies TickerQ4 Total
Emissions Gt CO2
Q4 Total Tar Sands
Emissions Gt CO2
Tar Sands Emissions %
4 ExxonMobil XOM 7.492 0.233 3.1%5 BP BP 6.908 0.039 0.6%8 Royal Dutch Shell RDSA 4.258 0.102 2.4%9 Chevron CVX 4.258 0.11 2.6%
12 Total FP 3.832 0.146 3.8%14 ENI ENI 2.510 0.235 9.4%16 Equinor EQNR 1.957 0.0%17 ConocoPhillips COP 1.809 0.039 2.2%19 Canadian Natural Resources CNQ 1.602 0.887 55.4%20 Inpex 1605 1.489 0.0%24 Repsol REP 1.003 0.0%25 Occidental OXY 0.984 0.0%26 EOG Resources EOG 0.945 0.0%30 Suncor Energy SU 0.709 0.647 91.2%31 Cenovus Energy CVE 0.707 0.563 79.7%32 Noble Energy NBL 0.675 0.0%33 Devon Energy DVN 0.658 0.064 9.7%36 Imperial Oil IMO 0.614 0.572 93.2%38 Marathon Oil MRO 0.539 0.0%39 Cabot Oil & Gas COG 0.535 0.0%40 Anadarko Petroleum APC 0.528 0.0%43 Apache APA 0.439 0.0%44 Hess HES 0.433 0.0%45 OMV OMV 0.422 0.0%47 Pioneer Natural Resources PXD 0.362 0.0%49 Concho Resources CXO 0.323 0.039 12.1%51 Woodside Petroleum WPL 0.318 0.0%52 Encana ECA 0.297 0.0%67 Cimarex Energy XEC 0.191 0.0%80 Galp Energia GALP 0.153 0.0%
Tar Sands Test Highlights companies that had over 50% of their potential emissions from tar sands reserves.
33
Tar Sands

Scoring Appendix
Table 1: Scoring Criteria
1. What is the company’s position on climate science?Understanding whether a company recognizes climate change as a significant issue is an indicator of how it views climate science. Does it explicitly recognize climate change as a significant issue? Does it support positions contrary to accepted science?
2. What measures is the company taking to reduce its carbon footprint?The extent to which a company is taking action to reduce its own carbon footprint is an indicator of how seriously it considers the risks posed by climate change. Actions could include setting GHG emissions targets, reducing GHG emissions, lowering the carbon intensity of its supply chain, and/or investing in low-carbon R&D.
3. Is climate science integral to the governance and oversight of the company?How a company is organized to manage the risks and opportunities of climate change is an indicator of its views toward climate science and climate change. For example, do company board members have explicit oversight of climate change policy? Does the company support climate-related shareholder resolutions? Has it disclosed physical, market, and regulatory risks related to climate change?
4. What are the company’s affiliations with third parties that spread disinformation onclimate science? Trade organizations are vehicles that spread disinformation on climate science. This criterion sets out to determine a company’s affiliations with a small handful of trade associations that have been scored by a third party as having exhibited the most egregious climate change-denying behavior. Is the company associated with any of the five trade associations on our watch list, or has the company distanced itself from statements or actions by trade associations that deny climate science and foster disinformation?
5. Does the company publicly support the need for climate policies and regulations?An indicator of a company’s attitude towards climate change is the extent to which it supports a variety of public policies that seek to mitigate the causes and reduce the impacts of climate change. These could include policies that attempt to price the cost of emissions, policies that encourage a switch to alternative energy sources, and policies that support CCS.
6. Has the company been transparent about its position, actions, and affiliations withregard to climate science and climate change? The extent to which a company is transparent about its policies and attitudes towards climate change and climate science is an indicator of its support for the free flow of information.
34

Table 2: Scoring Bands Definition Point Assigned
Company’s performance demonstrates best practices 5
Company’s performance neither positive nor negative 3
Company’s performance needs improvement 1
Table 3: Abbreviations Abbreviation Meaning Abbreviation Meaning
CCS Carbon Capture & Sequestration / Storage EPA Environmental Protection
Agency
CO2 Carbon Dioxide GHG Greenhouse Gas
CPP Clean Power Plan R&D Research & Development
Table 4: Source Code Abbreviations Abbreviation Meaning
10K Form 10-K
20F Form 20-F
40F Form 40-F
ALEC American Legislative Exchange Council
API American Petroleum Institute
AR Annual Report
CCC Company Committee Charter
CDP Carbon Disclosure Project
CO2R Carbon Report
CR Corporate Responsibility Report
CWS Company Website
FPS First-Party Source
IR Integrated Report
NAM National Association of Manufacturers
PRXY Proxy Circular
SEC U.S. Securities and Exchange Commission
SR Sustainability Report
TPS Third-Party Source
WSPA Western States Petroleum Association
35
Apache Corporation
I. Apache Corporation CRITERION 1 – WHAT IS THE COMPANY’S POSITION ON CLIMATE SCIENCE? INDICATOR 1A. CONSISTENTLY ACCURATE PUBLIC STATEMENTS ON CLIMATE SCIENCE AND THE CONSEQUENT NEED FOR SWIFT AND DEEP REDUCTIONS IN EMISSIONS FROM THE BURNING OF FOSSIL FUELS Score: (2) Rationale: Apache’s public disclosures do not meaningfully address climate science
and downplay the need to reduce GHG emissions by referencing questionable studies (e.g., the 2014 “IHS Energy Study: Deflating the Carbon Bubble”) to argue that carbon-related financial assets face limited risk in the near term.
Source(s): “In the event the predictions for rising temperatures and sea levels
suggested by reports of the United Nations Intergovernmental Panel on Climate Change do transpire, we do not believe those events by themselves are likely to impact our assets or operations.” (Apache.10K, p. 21)
“We are paying close attention and giving careful thought to the issue of climate change and the important debate over its implications for Apache and our stakeholders.” (Apache.SR, p. 18)
“While we do not set policy ourselves, we are a proponent of inclusive discussions that focus on sound science and a realistic approach to carbon mitigation.” (Apache.SR, p. 18)
“Our portfolio approach also enables us to shift capital investment away from certain assets in response to changes in regulations, energy demand or other factors, which limits our financial risks. This point is supported by IHS Energy’s Deflating the “Carbon Bubble” report, which concludes that integrated oil and gas company investments face limited near-term carbon-related financial risk because “the intrinsic value of most publicly traded oil and gas companies is based primarily on the valuation of proved reserves, 90 percent of which are expected to be monetized in the next 10–15 years.” (Apache.SR, p. 18)
36

Apache Corporation
CRITERION 2 – WHAT MEASURES IS THE COMPANY TAKING TO REDUCE ITS CARBON FOOTPRINT? INDICATOR 2A. GHG EMISSIONS TARGETS Score: (2) Rationale: Apache maintains a GHG emissions reduction plan, but that plan does not
apply to the company’s downstream operations, does not include the company’s CO2 emissions (e.g., only includes a quantitative methane emissions reduction target), is not in service of the Paris Climate Agreement and does not employ a science-based target.
Source(s): “In the past year we’ve also made continued, incremental progress on other
key environmental sustainability metrics, including a 9 percent reduction in methane emissions intensity from 2016 to 2017 as we work toward our science-based goal to reduce methane emissions intensity to 0.36 percent or less of production by 2025.” (Apache.SR, p. 5)
“Apache is a charter member of the ONE Future Coalition, an industry group working with companies across the natural gas value chain to develop and implement voluntary programs that will reduce methane losses to less than 1 percent of total methane production from the wellhead to the ultimate point of use. ONE Future has committed to an upstream sector emissions target of 0.36 percent or less of gross methane production (also called methane emissions intensity) by the year 2025. Apache has adopted this same goal, and we are on track to meet it. In 2017, our global methane emissions intensity was 0.43 percent, a reduction of 9 percent compared to 2016.” (Apache.SR, p. 16; see also Apache.SR, p. 69)
INDICATOR 2B. GHG EMISSIONS REDUCTIONS Score: (2) Rationale: Apache’s GHG emissions intensity has increased in one of the last two
reporting years and increased as a whole over the last two reporting years. Source(s): [see Supplemental Data] INDICATOR 2C. R&D INTO LOW-CARBON TECHNOLOGIES
37

Apache Corporation
Score: (1) Rationale: Apache has not publicly committed to investing in in-house and/or third-
party R&D into low-carbon technologies and does not disclose its budget dedicated to R&D into low-carbon technologies.
Source(s): INDICATOR 2D. USE OF AN INTERNAL PRICE ON CARBON Score: (1) Rationale: Apache does not use an internal price on carbon in investment decisions.
Though it references “pricing scenarios” its considers when making investments, Apache does not clarify whether such pricing refers to carbon pricing.
Source(s): “We also consider a range of pricing scenarios when forming our long-
term investment and development plans, including scenarios in a carbon-constrained world. These assessments are integrated into our overall risk management process, which includes senior managers and executives on the Corporate Risk Management Committee...Across Apache, people at all levels and in a wide range of departments...participate in carefully analyzing the potential impacts of climate change-related risks on our business. We cast a broad net to ensure rigorous scenario planning in an uncertain world.” (Apache.SR, p. 18)
CRITERION 3 – IS CLIMATE SCIENCE INTEGRAL TO THE GOVERNANCE AND OVERSIGHT OF THE COMPANY? INDICATOR 3A. DELINEATION OF RISKS AND RISK MANAGEMENT PROCEDURES RELATED TO CLIMATE CHANGE INDICATOR 3AI. REGULATORY RISKS Score: (1)
38

Apache Corporation
Rationale: Apache notes the general existence of risk associated with current or proposed regulations and laws relating to climate change, but does not pinpoint specific laws or regulations and/or does not identify effects particular to the company.
Source(s): “Certain countries where we operate, including the United Kingdom, either
tax or assess some form of greenhouse gas (GHG) related fees on our operations. Exposure has not been material to date, although a change in existing regulations could adversely affect our cash flows and results of operations. Additionally, there has been discussion in other countries where we operate, including the United States, regarding legislation or regulation of GHG. Any such legislation or regulation, if enacted, could either tax or assess some form of GHG-related fees on our operations and could lead to increased operating expenses or cause us to make significant capital investments for infrastructure modifications.” (Apache.10K, p. 21)
INDICATOR 3AII. PHYSICAL RISKS Score: (3) Rationale: Apache acknowledges physical climate-related risks facing its business, but
the company’s analysis of those physical risks lacks detail (e.g., facilities potentially impacted, mitigation efforts).
Source(s): “In the event the predictions for rising temperatures and sea levels
suggested by reports of the United Nations Intergovernmental Panel on Climate Change do transpire, we do not believe those events by themselves are likely to impact our assets or operations. However, any increase in severe weather could have a material adverse effect on our assets and operations.” (Apache.10K, p. 21)
“Apache assesses and responds to climate-related risks and opportunities including but not limited to the following...Physical risks such as from changing weather patterns.” (Apache.10K, p. 18)
“Demand for oil and gas are, to a significant degree, dependent on weather and climate, which impact the price we receive for the commodities we produce. In addition, our exploration and development activities and equipment can be adversely affected by severe weather, such as freezing temperatures, hurricanes in the Gulf of Mexico, or storms in the North
39

Apache Corporation
Sea, which may cause a loss of production from temporary cessation of activity or lost or damaged equipment. Our planning for normal climatic variation, insurance programs, and emergency recovery plans may inadequately mitigate the effects of such weather conditions, and not all such effects can be predicted, eliminated, or insured against.” (Apache.10K, p. 15)
“To address the potential physical impacts of climate change, such as reduced freshwater supplies, we are continuing our efforts to use alternatives to fresh water, especially in water-scarce areas (see p. 55).” (Apache.SR, p. 19)
INDICATOR 3AIII. MARKET AND OTHER INDIRECT RISKS AND OPPORTUNITIES Score: (2) Rationale: Apache notes various indirect risks related to climate change (i.e.,
reputation issues, shifting consumer demand) and addresses the recent high-profile climate-related litigation in which the company is named as a co-defendant, but does not detail how the company in particular might be impacted.
Source(s): “Apache assesses and responds to climate-related risks and
opportunities including but not limited to the following...Changes in consumer demand and preferences......Competition from other energy sources... Reputational and financial benefits associated with managing climate-related risks.” (Apache.SR, p.18)
“There is increasing interest in how oil and gas companies may be affected by increased carbon regulation as well as how companies are assessing and managing climate change-related risks, such as carbon asset risks or stranded assets. Shareholders are concerned about potential financial risks companies may face due to increased carbon regulations, changes in energy demand and/or competition from lower-carbon energy sources as nations reduce fossil fuel use.” (Apache.SR, p. 18)
“On July 17, 2017, in three separate actions, San Mateo County, California, Marin County, California, and the City of Imperial Beach, California, all filed suit individually and on behalf of the people of the state of California against over 30 oil, gas, and coal companies
40

Apache Corporation
alleging damages as a result of global warming. Plaintiffs seek unspecified damages and abatement under various tort theories. On December 20, 2017, in two separate actions, the City of Santa Cruz and Santa Cruz County and in a separate action on January 22, 2018, the City of Richmond, filed similar lawsuits against many of the same defendants. On November 14, 2018, the Pacific Coast Federation of Fishermen’s Associations, Inc. also filed a similar lawsuit against many of the same defendants. Apache believes that the claims made against it are baseless and intends to vigorously defend these lawsuits.” (Apache.10K, p. F-35)
INDICATOR 3B. DELEGATION OF BOARD MEMBERS AND/OR COMMITTEES WITH EXPLICIT OVERSIGHT OF CLIMATE CHANGE POLICY Score: (1) Rationale: Apache has no board member with oversight of or committee dedicated to
climate change-related governance. Though Apache's board-level Corporate Governance and Nominating Committee maintains oversight of “ESG issues,” the committee’s charter does not reference climate change. Further, Apache’s Corporate Risk Management Committee, which is responsible for the climate change-related risk analysis, is not a formal board committee.
Source(s): “Climate change-related risks and opportunities are integrated into
Apache’s overall risk management process, which is overseen by our Board of Directors.” (Apache.SR, p. 18) “The Corporate Governance and Nominating Committee oversees the nomination of Directors, the annual Board evaluation processes, ESG issues and corporate governance issues.” (Apache.SR, p. 32; see also Apache.CCC1) “These assessments [climate change-related risk analyses] are integrated into our overall risk management process, which includes senior managers and executives on the Corporate Risk Management Committee. This committee is overseen by our Board of Directors and the Board’s Audit Committee.” (Apache.SR, p. 18) “Across Apache, people at all levels and in a wide range of departments – such as Planning, Marketing, Tax, Risk Management, Treasury, Public
41

Apache Corporation
Affairs, Government Affairs and others – participate in carefully analyzing the potential impacts of climate change-related risks on our business. We cast a broad net to ensure rigorous scenario planning in an uncertain world.” (Apache.SR, p. 18)
INDICATOR 3C. DOES THE COMPANY SUPPORT CLIMATE-RELATED SHAREHOLDER RESOLUTIONS? Score: (3) Rationale: Apache has not faced any climate-related shareholder resolutions put
forward by established networks of socially responsible investors (e.g. As You Sow, Australian Coalition for Corporate Responsibility, Climate Action 100+, Follow This, the Interfaith Center on Corporate Responsibility) during the reporting period for this study.
Source(s): (see Ceres – Climate and Sustainability Shareholder Resolutions
Database; SEC – Division of Corporate Finance 2019; SEC – Division of Corporate Finance 2018)
CRITERION 4 – WHAT ARE THE COMPANY’S AFFILIATIONS WITH THIRD PARTIES THAT SPREAD DISINFORMATION ON CLIMATE SCIENCE? INDICATOR 4A. THE AMERICAN LEGISLATIVE EXCHANGE COUNCIL (ALEC) Score: (2) Rationale: Apache was a “Trustee” level sponsor of the group’s 2014 Annual
Conference, and there is no evidence to suggest that it is no longer affiliated with the group.
Source(s): (see Source Watch - ALEC; DeSmogBlog – ALEC) INDICATOR 4B. THE AMERICAN PETROLEUM INSTITUTE (API) Score: (2) Rationale: Apache is a current member of API and has not taken concrete steps to
distance itself from its climate change deception. Further, company has
42

Apache Corporation
contributed over $1,000,000 to API during the report period, the majority of which was used for API’s lobby activities.
Source(s): (see API – Members; DeSmogBlog – API) INDICATOR 4C. THE NATIONAL ASSOCIATION OF MANUFACTURERS (NAM) Score: (3) Rationale: Apache is not listed on NAM’s website as a current member of association’s
executive committee, and company is not mentioned by DeSmogBlog as having ever been affiliated with association.
Source(s): (see NAM – Board of Directors; DeSmogBlog – NAM) INDICATOR 4D. THE WESTERN STATES PETROLEUM ASSOCIATION (WSPA) Score: N/A Rationale: Apache is not listed as a corporate member on WSPA's website, and the
company has no operations in the association’s jurisdiction. Source(s): (see WSPA – Member Companies; DeSmogBlog – WSPA) INDICATOR 4E. AMERICAN FUEL AND PETROCHEMICAL MANUFACTURERS (AFPM) Score: (3) Rationale: Apache is not listed as a current member on AFPM’s website, and company
is not mentioned by DeSmogBlog as having ever been affiliated with association.
Source(s): (see AFPM – Membership Directory; DeSmogBlog – AFPM) CRITERION 5 – DOES THE COMPANY PUBLICLY SUPPORT THE NEED FOR CLIMATE POLICY AND REGULATIONS?
43

Apache Corporation
INDICATOR 5A. REGULATIONS, CARBON TAX, EMISSIONS TRADING, RENEWABLE ENERGY, CCS, ETC. Score: (2) Rationale: Apache has not publicly expressed support for climate policies and
regulations or has contradicted its stated support by actively opposing one or more specific climate policy proposals in relevant jurisdictions.
Source(s): “Apache participates in the political and public policy process in a
responsible and ethical way that serves the best interests of our shareholders and the safety and wellbeing of our workforce and other stakeholders. We operate in the highly regulated oil and natural gas industry, and our operations are affected by actions at many levels of government. Our public policy activities include education and advocacy efforts at the federal, state and local government levels.” (Apache.SR, p. 34)
INDICATOR 5B. PARIS AGREEMENT Score: (1) Rationale: Apache has been silent on the need for policies and/or regulations to
advance the Paris Climate Agreement. Company makes no references to the Paris Climate Agreement on its website, Form 10-K, or in its annual and sustainability reports.
Source(s): CRITERION 6 – HAS THE COMPANY BEEN PUBLICLY TRANSPARENT ABOUT ITS POSITION, ACTIONS, AND AFFILIATIONS WITH REGARD TO CLIMATE SCIENCE AND CLIMATE CHANGE? INDICATOR 6A. WEBPAGE DEDICATED TO CLIMATE CHANGE Score: (1) Rationale: Apache maintains a webpage entitled “Sustainability,” but it does not
reference climate change.
44

Apache Corporation
Source(s): (see Apache.CWS1) INDICATOR 6B. STAND-ALONE SUSTAINABILITY REPORT WITH SPECIFIC REFERENCE TO CLIMATE CHANGE Score: (5) Rationale: Apache produces a sustainability responsibility report that is easily
accessible through its and contains a two-page section dedicated to climate change in the “Ask Apache” section of the report.
Source(s): (see Apache.SR, pp. 18-19) INDICATOR 6C. DISCLOSURE TO CDP Score: (1) Rationale: CDP website indicates “Declined to participate” from Apache for Climate
Change 2018. Source(s): (see Apache.CDP1) INDICATOR 6D. DISCLOSURE OF THIRD-PARTY RELATIONSHIPS AND LOBBYING ACTIVITIES Score: (3) Rationale: Apache discloses some, but not all affiliations. Apache discloses payments
made to trade associations that are in excess of $50,000. Source(s): “Apache participates in trade and industry associations and engages
directly in advocacy and grassroots communications efforts. The company joins trade associations to share technical and standards expertise and to be part of important public education efforts regarding major issues of common concern to our industry. Our participation in trade and industry associations is subject to management oversight by our Governmental Affairs function, which approves our memberships and serves as the principal representative in such associations. Apache pays regular membership dues to several trade associations. Some utilize a portion
45

Apache Corporation
of those dues for nondeductible state and federal lobbying and political expenditures...We disclose these contributions on our website.” (Apache.SR, p. 35; see also Apache.FPS1, p.1)
INDICATOR 6E. REPORT ON CLIMATE RELATED RISK SCENARIOS Score: (1) Rationale: Apache considers “carbon-constrained” scenarios when developing
company strategy, but does not indicate whether a 2°C scenario is part of that process.
Source(s): “We also consider a range of pricing scenarios when forming our long-
term investment and development plans, including scenarios in a carbon-constrained world. These assessments are integrated into our overall risk management process, which includes senior managers and executives on the Corporate Risk Management Committee...Across Apache, people at all levels and in a wide range of departments...participate in carefully analyzing the potential impacts of climate change-related risks on our business. We cast a broad net to ensure rigorous scenario planning in an uncertain world.” (Apache.SR, p. 18)
“Recent studies by the International Energy Agency (IEA) suggest that, even in a carbon-constrained future scenario, where carbon dioxide (CO2) in the atmosphere is kept to 450 parts per million, demand for oil and gas will continue to grow for the next 20 years, and fossil fuels will continue to make up a significant portion of the overall energy mix. This suggests that oil and natural gas will continue to play an important role, even in a lower-carbon energy future...We continuously manage our asset mix to further limit our exposure to carbon risk. It is far easier to conduct scenario analyses over five-year timeframes than over ones that are decades long. While we do our best to look ahead, we also believe that being conservative, thoughtful, open and nimble are the best ways to run a responsible exploration and production company in light of today’s important environmental policy issues.” (Apache.SR, p. 19)
46

BP plc
II. BP plc
CRITERION 1 – WHAT IS THE COMPANY’S POSITION ON CLIMATE SCIENCE?
INDICATOR 1A. CONSISTENTLY ACCURATE PUBLIC STATEMENTS ON CLIMATE SCIENCE AND THE CONSEQUENT NEED FOR SWIFT AND DEEP REDUCTIONS IN EMISSIONS FROM THE BURNING OF FOSSIL FUELS
Score: (3)
Rationale: BP notes the dual challenge of climate change (i.e., providing affordable energy while protecting the environment), but does not present the two priorities as mutually exclusive. Further, following engagement with Barnard College over its evaluation and with the Union of Concerned Scientists over its 2018 scorecard findings, BP removed a statement that misrepresented climate science from its website. Nevertheless, BP does not stress the urgent need for deep reductions in emissions from the burning of fossil fuels, rather it advocates for a “progressive and pragmatic approach.”
Source(s): “There are two defining priorities for our industry. One is to produce more energy to meet growing global demand as emerging economies develop and provide people with a better quality of life. The other is to play our part in reducing greenhouse gas emissions. I am of the view that more energy with fewer emissions – the dual challenge – can be met if a progressive and pragmatic approach is taken to the energy transition. In BP we recognize that energy in many forms will be required, produced in ways that are cleaner and better. That is why we see ourselves not just as an oil and gas business but as a global energy business.” (BP.IR, p. 7)
“In a report looking at what would be required to keep the temperature rise to 1.5 degrees on preindustrial times it (UN’s Intergovernmental Panel on Climate Change) said emissions need to come down by 45% by 2030. So, on the one hand we’ve got to provide much more energy than ever before. And on the other we have to lower emissions drastically. People often think the solution is simple: more renewables. They’re right, up to a point, because renewables are growing faster than any fuel in history. And energy companies are all investing in wind, solar, biofuels and other forms of low carbon energy. But even optimistic projections only see renewables making up around a third of the energy mix by 2040.
47

BP plc
Renewables are going to make a big contribution, no doubt, but they can’t do it alone. We have to find additional ways of bringing emissions down. Remember, Paris is about a race to lower emissions, not just a race to renewables.” (BP.FPS1, pp. 2-3)
“We acknowledge that the current trend of greenhouse gas emissions is in excess of what the Intergovernmental Panel on Climate Change (IPCC) says is needed to limit the temperature rise to no more than 2 degrees above pre-industrial levels. The challenge is how to meet greater energy demand with less CO2. We stand ready to play our part.” (BP.FPS2, p. 1)
CRITERION 2 – WHAT MEASURES IS THE COMPANY TAKING TO REDUCE ITS CARBON FOOTPRINT? INDICATOR 2A. GHG EMISSIONS TARGETS Score: (2) Rationale: BP’s emissions reduction plan includes a company-wide 2025 target of zero
net emissions growth, but its plan is neither science-based nor in service of the Paris Climate Agreement’s global temperature goals.
Source(s): “Embedded within our strategy is BP’s approach to lower carbon and
reducing emissions. We call it our ‘reduce, improve, create’ framework. We have set targets and aims to reduce emissions in our operations, improve our products to help our customers reduce their emissions, and create low carbon businesses. We are already in action and have made progress in 2018 towards these ambitions.” (BP.SR, p. 10)
“We are targeting zero net growth in our operational emissions out to 2025. We aim to deliver this through sustainable greenhouse gas (GHG) emissions reductions totalling 3.5Mte by 2025, by targeting a methane intensity of 0.2% and, as necessary, with offsets to keep net emissions growth to zero.” (BP.IR, p. 46)
INDICATOR 2B. GHG EMISSIONS REDUCTIONS Score: (3)
48

BP plc
Rationale: BP’s GHG emissions intensity has increased in one of the last two reporting
years but decreased as a whole over the last two reporting years. Source(s): [see Supplemental Data] INDICATOR 2C. R&D INTO LOW-CARBON TECHNOLOGIES Score: (4) Rationale: BP discloses its low carbon R&D budget, the portion of that budget allocated
to developing new lower carbon businesses (i.e., BP Ventures), the current portfolio focus areas of BP Ventures (Advanced mobility, Power and storage, Carbon management, Bio and low carbon products and Digital transformation) as well as its financial investment in various specific low-carbon startups.
Source(s): “We are investing at least $500 million a year to support low carbon
activities, including our renewables businesses and acquisitions. Around $200 million of this is used to develop options for new lower carbon businesses in five areas [Advanced mobility, Power and storage, Carbon management, Bio and low carbon products and Digital transformation] that are core to our strategy for advancing the energy transition. These are areas we believe have the potential to make a real contribution to our future and build resilience in existing operations.” (BP.SR, p. 24)
“We also invest in high-tech companies to help accelerate and commercialize new technologies, products and business models....Group highlights: (1) $429 million invested in research and development (2) $200 million used to develop options for new lower carbon businesses, (3) Collaborations with innovative academic programmes and (4) >4,000 granted and pending patent applications held by BP and its subsidiaries throughout the world.” (BP.IR, p. 40; see also BP.CWS1)
“To allow us to respond rapidly to demand for charging facilities at our forecourts, we invested $5 million in FreeWire. The US-based company manufactures mobile rapid charging systems, which we successfully piloted at a BP retail site in the UK, and are now exploring options to offer FreeWire’s innovative charging services across the retail networks. We also
49

BP plc
invested $20 million in StoreDot, a company that develops ultra-fast charging battery technology for mobile and industrial markets. We anticipate the technology will be used in mobile devices by 2020 and BP will be working with them to help transfer this technology to electric vehicles. StoreDot aims to bring recharging times down to five minutes, making the time it takes to charge an electric vehicle similar to that of filling a tank.” (BP.IR, p. 42)
“Solar could generate 12% of total global power by 2040, in a scenario based on recent trends. That could grow to 21% in a scenario consistent with the Paris climate goals. We have a 43% share in Lightsource BP and plan to invest $200 million over a three-year period. Lightsource BP aims to play a vital role in shaping the future of global energy delivery by developing substantial solar capacity around the world, and we are working with Lightsource BP to expand its global presence.” (BP.IR, p. 38; see also BP.IR, p.159)
INDICATOR 2D. USE OF AN INTERNAL PRICE ON CARBON Score: (3) Rationale: BP has set an internal price on carbon but notes that it is applied only to
“certain large new projects” and those where emissions costs would be “material.”
Source(s): “We use a carbon price when evaluating our plans for certain large
new projects and also those for which emissions costs would be a material part of the project. This is currently $40 per tonne of CO2 equivalent, with a stress test at a carbon price of $80 per tonne. Until late January 2019 we used these specific prices in industrialized countries, but have now expanded this to apply globally.” (BP.SR, p. 9)
CRITERION 3 – IS CLIMATE SCIENCE INTEGRAL TO THE GOVERNANCE AND OVERSIGHT OF THE COMPANY? INDICATOR 3A. DELINEATION OF RISKS AND RISK MANAGEMENT PROCEDURES RELATED TO CLIMATE CHANGE INDICATOR 3AI. REGULATORY RISKS
50

BP plc
Score: (4) Rationale: BP details the potential impacts on the company, including financial, of a
number of specific climate-related laws and regulations, both proposed and already in-force.
Source(s): “More stringent national and regional measures relating to the
transition to a lower carbon economy can be expected in the future. These measures could increase BP’s production costs for certain products, increase compliance and litigation costs, increase demand for competing energy alternatives or products with lower-carbon intensity, and affect the sales and specifications of many of BP’s products. Further, such measures could lead to constraints on production and supply and access to new reserves, particularly due to the long term nature of many of BP’s projects.” (BP.IR, p. 292)
“In the US, the Obama administration adopted its Climate Action Plan in 2013 and used its existing statutory authority to implement that plan, including the Clean Air Act (CAA) and the Mineral Leasing Act (MLA). BP's operations are affected by regulation in a number of ways under the CAA, for example... Stricter GHG regulations, stricter limits on sulphur in fuels, emissions regulations in the refinery sector and a revised lower ambient air quality standard for ozone, finalized by the EPA in October 2015, are affecting our US operations....As noted below, some of these regulations may be suspended, revised or rescinded resulting in regulatory uncertainty and complex compliance challenges for our affected businesses.” (BP.IR, p. 292)
“On 21 August 2018, the EPA introduced the Affordable Clean Energy (ACE) Rule, which is intended to address GHG emissions from certain stationary sources, and which is intended to replace the CPP. The CPP regulations are currently stayed pending resolution of existing legal challenges; the EPA may decline to defend certain of these legal challenges. When the ACE Rule is finalized, it is likely to face legal challenges as well. The outcome with respect to these rules may affect electricity generation practices and prices, reliability of electricity supply, and regulatory requirements affecting other GHG emission sources in other sectors and have potential impacts on combined heat and power installations.” (BP.IR, p. 292)
51

BP plc
“A number of states, municipalities and regional organizations have responded to current and proposed federal changes in environmental regulation and a number of additional state and regional initiatives in the US will affect our operations. The California cap and trade programme started in January 2012 and expanded to cover emissions from transportation fuels in 2015. The State of Washington adopted a carbon cap rule that was to become effective 2017, but the rule has been suspended pending review before the state’s supreme court.” (BP.IR, p. 293)
INDICATOR 3AII. PHYSICAL RISKS Score: (2) Rationale: Though BP has identified climate change as a “principal” risk to its business,
the company does so in the context of the transition to a lower carbon economy, not as a contributor to the climate change-related physical risks to its business. BP’s mentions “physical climate-related risks,” but uses that phrase as a proxy for extreme weather, not climate change specifically.
Source(s): “As part of our annual planning process we review the group’s principal risks
and uncertainties. Climate change and the transition to a lower carbon economy has been identified as a principal risk...physical climate-related risks such as extreme weather are covered in our principal risks related to safety and operations.” (BP.IR, p. 45)
“Technical integrity failure, natural disasters, extreme weather or a change in its frequency or severity, human error and other adverse events or conditions could lead to loss of containment of hydrocarbons or other hazardous materials or constrained availability of resources used in our operating activities, as well as fires, explosions or other personal and process safety incidents, including when drilling wells, operating facilities and those associated with transportation by road, sea or pipeline…Our activities are sometimes conducted in hazardous, remote or environmentally sensitive locations, where the consequences of such events or conditions could be greater than in other locations.” (BP.IR, pp. 55-56)
52

BP plc
“Our activities require high levels of investment and are sometimes conducted in challenging environments such as those prone to natural disasters and extreme weather, which heightens the risks of technical integrity failure. The physical characteristics of an oil or natural gas field, and cost of drilling, completing or operating wells is often uncertain. We may be required to curtail, delay or cancel drilling operations or stop production because of a variety of factors, including unexpected drilling conditions, pressure or irregularities in geological formations, equipment failures or accidents, adverse weather conditions and compliance with governmental requirements.” (BP.IR, p. 56)
INDICATOR 3AIII. MARKET AND OTHER INDIRECT RISKS AND OPPORTUNITIES Score: (2) Rationale: Despite highlighting the “flexibility” of its portfolio, BP has not detailed the
indirect risks the company (presumably) sees as necessitating such adaptability. Further, BP fails to address the high-profile climate-related litigation in which the company is a defendant.
Source(s): “Our industry is changing rapidly, and the energy mix is shifting towards
lower carbon sources, driven by technological advances and growing environmental concerns.” (BP.IR, p. 40)
“...we’re increasing our activity in renewables, building on our existing solar, wind and biofuels businesses, and creating new business models. For example Lightsource BP has doubled the number of countries where it has a presence since December 2017. Embedded within our strategy is our commitment to advance a low carbon future. We plan to deliver this across our entire business by reducing emissions in our operations, improving our products and services, and creating low carbon businesses. We are actively managing the portfolio to remain resilient in a changing world and believe we have enough flexibility in our portfolio to reshape our business and balance sheet in around 10 years should we need to.” (BP.IR, p. 12)
“Technological improvements or innovations that support the transition to a lower carbon economy, and customer preferences or regulatory incentives related to such changes that alter fuel or power choices, such as towards low emission energy sources, could impact
53

BP plc
demand for oil and gas. Depending on the nature and speed of any such changes and our response, this could adversely affect the demand for our products, investor sentiment, our financial performance and our competitiveness.” (BP.IR, p. 55)
INDICATOR 3B. DELEGATION OF BOARD MEMBERS AND/OR COMMITTEES WITH EXPLICIT OVERSIGHT OF CLIMATE CHANGE POLICY Score: (1) Rationale: BP’s ‘New Energy Frontiers Steering Committee’ and ‘Carbon Steering
Group’, though tasked with some strategy development an oversight of climate-related issues, are not board-level committees.
Source(s): “BP’s governance framework applies equally to the management of the
various aspects of climate change and the transition to a lower carbon economy. In addition to the oversight provided by the executive team, the board and relevant committees, various groups and committees in BP bring together cross-segment and cross-functional expertise of relevance to this [climate governance] area...” (BP.IR, p. 45)
INDICATOR 3C. DOES THE COMPANY SUPPORT CLIMATE-RELATED SHAREHOLDER RESOLUTIONS? Score: (2) Rationale: Despite supporting a shareholder resolution submitted by Climate Action
100+ calling for clarification of the company’s strategy with respect to the Paris goals, BP recommended against another resolution submitted by Follow This during the reporting period, which called for the company to commit to reducing all emissions, including those generated by BP’s customers.
Source(s): “This year, the board is pleased to support a resolution that has been
proposed by a group of investors at our annual general meeting in May. The resolution, if passed, will pave the way for additional reporting to help investors better understand how BP’s strategy is consistent with the Paris climate goals. We see this as an important opportunity for investors to appraise our progress in responding to the dual challenge. Further details
54

BP plc
can be found in the Notice of Meeting, to be published in April.” (BP.IR, p. 7)
“BP also confirmed today that it has received a shareholder resolution for its AGM, submitted by shareholders organised by the group Follow This. After consideration, the BP Board has decided not to support this resolution. The Board will provide its response in the notice of meeting.” (BP.CWS2, pp. 2-3 ) (see also Ceres – Climate and Sustainability Shareholder Resolutions Database; SEC – Division of Corporate Finance 2019; SEC – Division of Corporate Finance 2018)
CRITERION 4 – WHAT ARE THE COMPANY’S AFFILIATIONS WITH THIRD PARTIES THAT SPREAD DISINFORMATION ON CLIMATE SCIENCE? INDICATOR 4A. THE AMERICAN LEGISLATIVE EXCHANGE COUNCIL (ALEC) Score: (4) Rationale: BP left ALEC in 2015, but did not state explicitly it was due to the
association’s position on climate science being inconsistent with the company’s.
Source(s): “...BP spokesperson Brett Clanton did not mention the group’s
position on climate change in a statement announcing the decision: “We continually assess our engagements with policy and advocacy organizations and based on our most recent assessment, we have determined that we can effectively pursue policy matters of current interest to BP without renewing our membership in Alec.” (BP.TPS1; see also Source Watch - ALEC; DeSmogBlog – ALEC)
INDICATOR 4B. THE AMERICAN PETROLEUM INSTITUTE (API) Score: (1) Rationale: BP is a current member of API and has not concretely distanced itself from
API’s climate change deception. Further, Susan Dio, Chairman and
55
BP plc
president of BP America, is a member of the American Petroleum Institute Board and Executive Committee.
Source(s): (see BP.FPS3; BP.FPS4; API – Members; DeSmogBlog – API) INDICATOR 4C. THE NATIONAL ASSOCIATION OF MANUFACTURERS (NAM) Score: (2) Rationale: BP is a current member of NAM and has not concretely distanced itself from
NAM’s climate change deception. Though Susan Dio, Chairman and president of BP America, was a panelist at NAM’s Executive Insights Series, she has not taken former Chairman and president of BP America John Mingé’s seat on the NAM board of directors.
Source(s): (see BP.TPS2, p. 68; BP.FPS4; NAM – Board of Directors; DeSmogBlog –
NAM) INDICATOR 4D. THE WESTERN STATES PETROLEUM ASSOCIATION (WSPA) Score: (1) Rationale: BP is a current member of WSPA and has not concretely distanced itself
from WSPA’s climate change deception. Further, BP Refinery Manager Bob Allendorfer was on WSPA’s Board of Directors as of 2016.
Source(s): (see BP.TPS3; BP.FPS4; WSPA – Member Companies; DeSmogBlog –
WSPA) INDICATOR 4E. AMERICAN FUEL AND PETROCHEMICAL MANUFACTURERS (AFPM) Score: (1) Rationale: BP is a current member of AFPM and has not concretely distanced itself
from AFPM’s climate change deception. Further, Doug Sparkman, Chief Operating Officer of BP Fuels North America, sits on AFPM’s board of directors and executive committee.
56

BP plc
Source(s): (see BP.TPS4; BP.TPS5; BP.FPS4; AFPM – Membership Directory; DeSmogBlog – AFPM)
CRITERION 5 – DOES THE COMPANY PUBLICLY SUPPORT THE NEED FOR CLIMATE POLICY AND REGULATIONS? INDICATOR 5A. REGULATIONS, CARBON TAX, EMISSIONS TRADING, RENEWABLE ENERGY, CCS, ETC. Score: (2) Rationale: Though BP has consistently supported the adoption of governmental
carbon-pricing policies, the company nevertheless publicly opposed Washington State’s Initiative 1631 and contributed approximately $250,000 to “NO on 1631,” a campaign sponsored by the Western States Petroleum Association to stop the ballot initiative.
Source(s): “While we support well-designed carbon pricing, we are prepared to oppose
poorly-designed proposals. We opposed the ballot initiative proposal to introduce a carbon fee in Washington state in the US in November 2018. The poor design of the policy would have harmed Washington’s economy without significantly reducing carbon emissions. The terms of the proposal exempted six of the biggest polluters in the state, effectively subsidizing some companies at the expense of others. The ballot initiative was not passed by voters. We continued to work with legislative leaders in the state in 2019 and supported a cap and trade bill, which we believe would work to most effectively lower carbon emissions.” (BP.SR, p. 9; see also BP.TPS6)
“Therefore, we call on governments, including at the UNFCCC negotiations in Paris and beyond – to: (1) introduce carbon pricing systems where they do not yet exist at the national or regional levels and (2) create an international framework that could eventually connect national systems.” (BP.FPS2, p. 1-2)
INDICATOR 5B. PARIS AGREEMENT Score: (2)
57

BP plc
Rationale: BP identifies some broad policies which it believes are necessary to meet the goals of the Paris Climate Agreement but does not explicitly endorse the Agreements temperature targets.
Source(s): “Our strategy is designed to grow shareholder value while also helping to
meet the dual challenge. We believe it is consistent with the climate goals of the Paris Agreement, which calls for the world to rapidly reduce greenhouse gas emissions in the context of sustainable development and eradicating poverty.” (BP.IR, p. 45)
“To meet the Paris goals, we believe the world must take strong action on a range of fronts: (1) Reducing emissions rather than promoting one energy source as the answer, (2) Improving energy efficiency, (3) Using and deploying new technologies, such as carbon capture, use and storage and (4) Putting a price on carbon to help drive action in an efficient and cost-effective way.” (BP.SR, p. 7)
CRITERION 6 – HAS THE COMPANY BEEN PUBLICLY TRANSPARENT ABOUT ITS POSITION, ACTIONS, AND AFFILIATIONS WITH REGARD TO CLIMATE SCIENCE AND CLIMATE CHANGE? INDICATOR 6A. WEBPAGE DEDICATED TO CLIMATE CHANGE Score: (5) Rationale: BP maintains a separate webpage on its website devoted to climate
change. Source(s): (see BP.FPS5) INDICATOR 6B. STAND-ALONE SUSTAINABILITY REPORT WITH SPECIFIC REFERENCE TO CLIMATE CHANGE Score: (5) Rationale: BP’s sustainability report is easily accessible through its website and
contains a section dedicated to climate change, within the context of the broader energy transition.
58

BP plc
Source(s): (see BP.SR, p. 6) INDICATOR 6C. DISCLOSURE TO CDP Score: (1) Rationale: CDP website indicates “No Response” from BP for Climate Change 2018. Source(s): (see BP.CDP1) INDICATOR 6D. DISCLOSURE OF THIRD-PARTY RELATIONSHIPS AND LOBBYING ACTIVITIES Score: (1) Rationale: Though BP describes “the role of trade associations and the principles that
guide BP’s membership and participation,” it does not disclose its affiliations with or payments to specific trade associations or lobbying groups on its website or public filings.
Source(s): “We are members of multiple industry associations that offer opportunities
to share good practices and collaborate on issues of importance to our sector. We aim for alignment between our policies and those of trade associations, but understand that associations’ positions reflect a compromise of the assorted views of the membership.” (BP.SR, p. 65)
“We monitor our memberships of associations, and the positions or campaigns they undertake, to enable us to consider whether it remains appropriate. We will publicly dissent from a trade association position or resign our membership only by exception if there is material misalignment in our views. We provide a summary of our key association memberships to our board.” (BP.FPS4, p. 2)
INDICATOR 6E. REPORT ON CLIMATE RELATED RISK SCENARIOS Score: (1) Rationale: BP’s 2°C scenario review, though thorough from an industry standpoint,
lacks analysis of the potential impacts to the company itself.
59

BP plc
Source(s): “In the RT (i.e., rapid transition) scenario CO2 emissions fall by around 45% by 2040 relative to current levels. The scale of this reduction is broadly in the middle of a range of external projections which claim to be consistent with meeting the Paris climate goals, and is broadly similar to the reduction in carbon emissions in the IEA’s Sustainable Development Scenario.” (BP.FPS6, p. 115; see also BP.FPS6, p. 111-121)
60

Cabot Oil & Gas Corporation
III. Cabot Oil & Gas Corporation CRITERION 1 – WHAT IS THE COMPANY’S POSITION ON CLIMATE SCIENCE? INDICATOR 1A. CONSISTENTLY ACCURATE PUBLIC STATEMENTS ON CLIMATE SCIENCE AND THE CONSEQUENT NEED FOR SWIFT AND DEEP REDUCTIONS IN EMISSIONS FROM THE BURNING OF FOSSIL FUELS Score: (1) Rationale: Cabot misrepresents current scientific consensus on climate change
with subtle questioning language (e.g., “studies suggesting,” “some experts believe”) in the sections of its disclosures that reference climate science.
Source(s): “In response to studies suggesting that emissions of carbon
dioxide and certain other gases may be contributing to global climate change, the United States Congress has considered, but not enacted, legislation to reduce emissions of greenhouse gases from sources within the United States between 2012 and 2050.” (Cabot.10K, p. 20)
“...some experts believe climate change poses potential physical risks, including an increase in sea level and changes in weather conditions, such as an increase in changes in precipitation and extreme weather events.” (Cabot.10K, p. 31)
CRITERION 2 – WHAT MEASURES IS THE COMPANY TAKING TO REDUCE ITS CARBON FOOTPRINT? INDICATOR 2A. GHG EMISSIONS TARGETS Score: (1) Rationale: Cabot’s disclosures highlight various emissions reduction “efforts”
(e.g., phasing out diesel generators) and note that the company is reducing GHG emissions from “all sources.” Still, Cabot’s efforts lack
61

Cabot Oil & Gas Corporation
the characteristics of a formal GHG reduction plan (e.g., timetables, targets).
Source(s): “Cabot is committed to the responsible reduction of GHG emissions.
Our initial GHG data gathering program was implemented in 2011 and we have been engaged in extensive efforts to reduce our GHG emissions from all sources, including heaters, pneumatic devices, drilling rigs, venting and flaring in completion operations, engines in completion operations and fugitive methane...One of the initiatives we undertook was to use compressed natural gas to displace gasoline and diesel to fuel our own vehicles and power drilling equipment. For every unit of compressed natural gas we burn instead of gasoline or diesel in our operations — in drilling and transportation vehicles — we reduce our CO2e emissions by at least 25 percent. Another example of these efforts is our program to install and replace manual pneumatic controllers with zero-bleed controllers. Cabot’s internal policy has been to install zero-bleed pneumatic controllers at all new facilities operating on natural gas or employ instrument air and convert all existing controllers to zero-bleed or remove them from service. In 2016, Cabot completed the conversion of the existing sources to zero-bleed, resulting in a reduction of GHG emissions equivalent to removing 3,356 passenger vehicles from the road for one year. As of the 2nd quarter 2017, Cabot no longer operates any high bleed pneumatic controllers. Similarly, Cabot continues the process of phasing out diesel generators in favor of transitioning our oil well pads to electric power. Through this effort, we have been able to continuously reduce the number of diesel generators at our facilities with plans to phase out all diesel generator usage where operating conditions permit. The CH4 reduction from the total diesel generators retired in recent years is equivalent to the energy use of 2,864 homes for one year.” (Cabot.CWS1)
“Our strategy is, and has been, simple: invest in the highest- return projects within our anticipated levels of cash flow annually, divest assets that do not compete for capital based on our internal return thresholds, and maintain a strong balance sheet. This mindset has established Cabot as one of the leading returns-focused companies in the exploration and production industry, and one that can compete favorably for investor capital when compared
62

Cabot Oil & Gas Corporation
against all sectors across the broader equity market.” (Cabot.AR, p. 2)
INDICATOR 2B. GHG EMISSIONS REDUCTIONS Score: (5) Rationale: Cabot’s GHG emissions intensity has decreased in each of the last
two reporting years and has decreased by over 20% over the last two reporting years.
Source(s): [see Supplemental Data] INDICATOR 2C. R&D INTO LOW-CARBON TECHNOLOGIES Score: (1) Rationale: Neither Cabot’s disclosures nor website note a commitment to
investing in in-house and/or third-party R&D into low-carbon technologies.
Source(s): INDICATOR 2D. USE OF AN INTERNAL PRICE ON CARBON Score: (1) Rationale: Though Cabot notes that its investment decisions are based upon
price assumptions “representative of a range of anticipated economic conditions,” the company does not explicitly discuss carbon pricing in its disclosures, website or public comments.
Source(s): “These decisions [investment and operating decisions] are based on
a number of factors, including estimates of proved reserves, and varying price and cost assumptions considered more representative of a range of anticipated economic conditions.” (Cabot.10K, p. 100)
63

Cabot Oil & Gas Corporation
CRITERION 3 – IS CLIMATE SCIENCE INTEGRAL TO THE GOVERNANCE AND OVERSIGHT OF THE COMPANY? INDICATOR 3A. DELINEATION OF RISKS AND RISK MANAGEMENT PROCEDURES RELATED TO CLIMATE CHANGE INDICATOR 3AI. REGULATORY RISKS Score: (3) Rationale: Cabot’s disclosures identify specific existing and proposed climate-
related laws and regulations that might affect it (e.g., EPA regulation of GHG emissions, particularly methane, under the Clean Air Act) and offer some discussion about possible impacts on the company.
Source(s): “...the United States Congress has considered, but not enacted,
legislation to reduce emissions of greenhouse gases from sources within the United States between 2012 and 2050. In addition, many states have already taken legal measures to reduce emissions of greenhouse gases, primarily through the planned development of greenhouse gas emission inventories and/or regional greenhouse gas cap and trade programs. The EPA has also begun to regulate carbon dioxide and other greenhouse gas emissions under existing provisions of the Clean Air Act. This includes regulation of methane emissions from new and modified sources in the oil and gas sector. A 2016 information collection request made to oil and natural gas facilities by the EPA in connection with its intention at the time to regulate methane emissions from existing sources was withdrawn in March 2017. If we are unable to recover or pass through a significant portion of our costs related to complying with current and future regulations relating to climate change and GHGs, it could materially affect our operations and financial condition...Future legislation or regulations adopted to address climate change could also make our products more or less desirable than competing sources of energy.” (Cabot.10K, p. 20)
“Commodity prices are subject to wide fluctuations in response to...a variety of additional factors that are beyond our control. These factors include but are not limited to the following:... the nature and extent of domestic and foreign governmental regulations and
64

Cabot Oil & Gas Corporation
taxation, including environmental and climate change regulation.” (Cabot.10K, p. 21)
“...legislative and regulatory responses related to GHG emissions and climate change may increase our operating costs. The United States Congress has previously considered legislation related to GHG emissions. There have also been international efforts seeking legally binding reductions in GHG emissions. The United States was actively involved in the negotiations at the 21st Conference of the Parties of the United Nations Framework Convention on Climate Change in Paris, which led to the creation of the Paris Agreement. The Paris Agreement requires countries to review and "represent a progression" in their nationally determined contributions, which set emissions reduction goals, every five years. The United States signed the Paris Agreement in April 2016. However, on August 4, 2017, the United States formally communicated to the United Nations its intent to withdraw from participation in the Paris Agreement, which entails a four-year process. In response to the announced withdrawal plan, a number of state and local governments in the United States have expressed intentions to take GHG-related actions. Increased public awareness and concern regarding climate change may result in more state, regional and/or federal requirements to reduce or mitigate GHG emissions.” (Cabot.10K, p. 30)
“...the passage of any federal or state climate change laws or regulations in the future could result in increased costs to (i) operate and maintain our facilities, (ii) install new emission controls on our facilities and (iii) administer and manage any GHG emissions program. If we are unable to recover or pass through a significant level of our costs related to complying with climate change regulatory requirements imposed on us, it could have a material adverse effect on our results of operations and financial condition...Legislation or regulations that may be adopted to address climate change could also affect the markets for our products by making our products more or less desirable than competing sources of energy.” (Cabot.10K, p. 30)
INDICATOR 3AII. PHYSICAL RISKS
65

Cabot Oil & Gas Corporation
Score: (3) Rationale: Cabot acknowledges physical climate-related risks facing its
business, but the company’s analysis of those physical risks provides little detail about the potential impacts on Cabot’s operations.
Source(s): “...some experts believe climate change poses potential
physical risks, including an increase in sea level and changes in weather conditions, such as an increase in changes in precipitation and extreme weather events. In addition, warmer winters as a result of global warming could also decrease demand for natural gas. To the extent that such unfavorable weather conditions are exacerbated by global climate change or otherwise, our operations may be adversely affected to a greater degree than we have previously experienced, including increased delays and costs. However, the uncertain nature of changes in extreme weather events (such as increased frequency, duration, and severity) and the long period of time over which any changes would take place make any estimations of future financial risk to our operations caused by these potential physical risks of climate change unreliable.” (Cabot.10K, p. 31)
INDICATOR 3AIII. MARKET AND OTHER INDIRECT RISKS AND OPPORTUNITIES Score: (3) Rationale: Though Cabot’s disclosures note various indirect risks related to
climate change generally (i.e., possible difficulty accessing capital, decreased demand), they also highlight the company’s particular exposure to supply and demand factors unique to northeast Pennsylvania, where the company’s operations are concentrated.
Source(s): “...warmer winters as a result of global warming could also decrease
demand for natural gas.” (Cabot.10K, p. 31)
“Climate change, the costs that may be associated with its effects, and the regulation of greenhouse gas (GHG) emissions have the potential to affect our business in many ways,
66

Cabot Oil & Gas Corporation
including increasing the costs to provide our products and services, reducing the demand for and consumption of our products and services (due to change in both costs and weather patterns), and the economic health of the regions in which we operate, all of which can create financial risks.” (Cabot.10K, p. 31)
“...to the extent financial markets view climate change and GHG emissions as a financial risk, this could negatively impact our cost of, and access to, capital.” (Cabot.10K, p. 20)
“Our producing properties are geographically concentrated in the Marcellus Shale in northeast Pennsylvania. At December 31, 2018, substantially all of our proved developed reserves and equivalent production were attributable our properties located in the Marcellus Shale. As a result of this concentration, we may be disproportionately exposed to the impact of regional supply and demand factors, state and local political forces and governmental regulation, processing or transportation capacity constraints, market limitations, severe weather events, water shortages or other conditions or interruption of the processing or transportation of oil, natural gas or NGLs in the region.” (Cabot.10K, p. 23)
INDICATOR 3B. DELEGATION OF BOARD MEMBERS AND/OR COMMITTEES WITH EXPLICIT OVERSIGHT OF CLIMATE CHANGE POLICY Score: (1) Rationale: Cabot’s board-level Safety & Environmental Affairs (S&E)
Committee maintains oversight of “environmental, health and safety matters,” but that committee’s charter does not specifically reference climate change or sustainability.
Source(s): “An integral component of our EHS program is the Safety &
Environmental Affairs (S&E) Committee of our Board of Directors. This committee is one of the few in our industry to focus solely on environmental, health and safety matters at every regular board meeting and underscores our commitment to ensure that Cabot is a leader in our peer group in responsible, sustainable operations. The S&E Committee was formed in 1991 to help provide
67

Cabot Oil & Gas Corporation
oversight of the increasingly complex nature of safety and environmental regulations and to oversee our continued commitment to corporate responsibility.” (Cabot.CWS2; see also Cabot.CCC1)
INDICATOR 3C. DOES THE COMPANY SUPPORT CLIMATE-RELATED SHAREHOLDER RESOLUTIONS? Score: (3) Rationale: Cabot has not faced any climate-related shareholder resolutions put
forward by established networks of socially responsible investors during the reporting period.
Source(s): (see Cabot.PRXY1; Cabot.PRXY2; Ceres – Climate and
Sustainability Shareholder Resolutions Database; SEC – Division of Corporate Finance 2019; SEC – Division of Corporate Finance 2018)
CRITERION 4 – WHAT ARE THE COMPANY’S AFFILIATIONS WITH THIRD PARTIES THAT SPREAD DISINFORMATION ON CLIMATE SCIENCE? INDICATOR 4A. THE AMERICAN LEGISLATIVE EXCHANGE COUNCIL (ALEC) Score: (3) Rationale: Cabot is not cited by Source Watch or DeSmogBlog as having ever
been affiliated with the association. Source(s): (see Source Watch - ALEC; DeSmogBlog – ALEC) INDICATOR 4B. THE AMERICAN PETROLEUM INSTITUTE (API) Score: (1) Rationale: Cabot is a current member of API and CEO Dan Dinges serves on
API’s Board of Directors. Source(s): (see Cabot.CWS3; API – Members; DeSmogBlog – API)
68

Cabot Oil & Gas Corporation
INDICATOR 4C. THE NATIONAL ASSOCIATION OF MANUFACTURERS (NAM) Score: (3) Rationale: Cabot is not listed on NAM’s website as a current member of the
association’s executive committee, and company is not mentioned by DeSmogBlog as having ever been affiliated with association.
Source(s): (see NAM – Board of Directors; DeSmogBlog – NAM)
INDICATOR 4D. THE WESTERN STATES PETROLEUM ASSOCIATION (WSPA) Score: N/A Rationale: Cabot is not listed as a corporate member on WSPA's website, and
the company has no operations in the association’s jurisdiction. Source(s): (see WSPA – Member Companies; DeSmogBlog – WSPA) INDICATOR 4E. AMERICAN FUEL AND PETROCHEMICAL MANUFACTURERS (AFPM) Score: (3) Rationale: Cabot is not listed as a current member on AFPM’s website, and
company is not mentioned by DeSmogBlog as having ever been affiliated with association.
Source(s): (see AFPM – Membership Directory; DeSmogBlog – AFPM) CRITERION 5 – DOES THE COMPANY PUBLICLY SUPPORT THE NEED FOR CLIMATE POLICY AND REGULATIONS? INDICATOR 5A. REGULATIONS, CARBON TAX, EMISSIONS TRADING, RENEWABLE ENERGY, CCS, ETC.
69

Cabot Oil & Gas Corporation
Score: (2) Rationale: Cabot’s disclosures do not express support for or against even a
general category of climate policies and regulations. Source(s): “During the promulgation of regulatory programs with potential
impact on the oil and gas industry, Cabot actively participates with our industry peers during the rule commenting periods in support of regulatory outcomes that are conducive to our stakeholder partnerships and in alignment with the operations and practices of the oil and gas industry.” (Cabot.CWS4)
INDICATOR 5B. PARIS AGREEMENT Score: (1) Rationale: Cabot’s disclosures are silent on the need for policies and/or
regulations to advance the Paris Climate Agreement. Source(s): CRITERION 6 – HAS THE COMPANY BEEN PUBLICLY TRANSPARENT ABOUT ITS POSITION, ACTIONS, AND AFFILIATIONS WITH REGARD TO CLIMATE SCIENCE AND CLIMATE CHANGE? INDICATOR 6A. WEBPAGE DEDICATED TO CLIMATE CHANGE Score: (1) Rationale: Cabot’s website contains a page entitled “Air Quality Management,”
but that page makes no reference to climate change. Source(s): (see Cabot.CWS5) INDICATOR 6B. STAND-ALONE SUSTAINABILITY REPORT WITH SPECIFIC REFERENCE TO CLIMATE CHANGE Score: (1)
70

Cabot Oil & Gas Corporation
Rationale: Cabot does not produce a corporate responsibility, CSR, or sustainability report.
Source(s): INDICATOR 6C. DISCLOSURE TO CDP Score: (1) Rationale: CDP website indicates “No response” from Cabot for Climate
Change 2018. Source(s): (see Cabot.CDP1) INDICATOR 6D. DISCLOSURE OF THIRD-PARTY RELATIONSHIPS AND LOBBYING ACTIVITIES Score: (5) Rationale: Cabot discloses it’s affiliations with and payments made to trade
associations and lobbying groups on the company’s website. Source(s): (see Cabot.CWS6) INDICATOR 6E. REPORT ON CLIMATE RELATED RISK SCENARIOS Score: (1) Rationale: Cabot has not produced and published an analysis on what a 2°C or
lower increase in global temperature would mean for its businesses, strategies, and financial planning.
Source(s):
71

Canadian Natural Resources
IV. Canadian Natural Resources CRITERION 1 – WHAT IS THE COMPANY’S POSITION ON CLIMATE SCIENCE? INDICATOR 1A. CONSISTENTLY ACCURATE PUBLIC STATEMENTS ON CLIMATE SCIENCE AND THE CONSEQUENT NEED FOR SWIFT AND DEEP REDUCTIONS IN EMISSIONS FROM THE BURNING OF FOSSIL FUELS Score: (2) Rationale: Climate science is not referenced in any of Canadian Natural’s
disclosures (e.g., website, stewardship report, Form 40-F, annual report).
Source(s): “Canada’s crude oil and natural gas resources are safely and
responsibly developed with world-leading standards, under comprehensive regulatory oversight, emissions regulations and programs, carbon pricing regimes and investments in carbon capture and storage. As the world’s demand for energy increases, there will need to be significant oil and natural gas resources developed to meet demand, and Canada is well-positioned to be a global leader in supplying crude oil and natural gas in a lower carbon energy future. At Canadian Natural, we believe that strong environmental policy, regulation and performance standards, together with innovation and technology, are necessary for an effective approach to greenhouse gas (GHG) emissions management.” (CNRL.CWS1)
CRITERION 2 – WHAT MEASURES IS THE COMPANY TAKING TO REDUCE ITS CARBON FOOTPRINT? INDICATOR 2A. GHG EMISSIONS TARGETS Score: (1) Rationale: Beyond a long-term aspirational target of net zero emissions for its
oil sands operations and a methane emissions reduction plan pursuant to Albertan law, Canadian Natural’s “GHG management
72

Canadian Natural Resources
strategy” does not include quantitative emissions intensity target(s) of any kind. Rather, Canadian Natural’s goal is to “reduce emissions intensity to be below the global crude average.” Further, though Canadian Natural uses project-specific emissions reduction targets, the company does not disclose what those targets are.
Source(s): “Canadian Natural is strongly committed to reducing GHG emissions
with a long term aspirational target of net zero emissions in our oil sands operations.” (CNRL.CDP1, p. 31)
“...we will continue to improve as we work to ensure methane emissions are 45% lower than baseline by 2025.” (CNRL.CDP1, p. 31)
“GHG Management Goal and Strategy: With a strong commitment to continuously reducing GHG emissions intensity, Canadian Natural has developed a pathway to reduce emissions intensity to be below the global crude average...When we recognize our carbon capture initiatives, our current Oil Sands Mining and Upgrading operations GHG emissions intensity is only slightly higher than the average intensity for all global crude oils, with a pathway to be below the average with further advances in technology underway.” (CNRL.SR, p.14)
“Canadian Natural’s overall scope 1+2 emission intensity decreased by 5.0 % in 2018 compared to 2017. Canadian Natural targets continuous improvements in production efficiencies and associated GHG intensity reductions.” (CNRL.CDP1, p. 30)
“As part of our integrated GHG management strategy we integrate emissions reduction in project planning and operations; leverage technology to create value and enhance performance; and focus on continuous improvement to drive long-term emissions reductions.” (CNRL.CDP1, p. 19)
INDICATOR 2B. GHG EMISSIONS REDUCTIONS Score: (3)
73

Canadian Natural Resources
Rationale: Canadian Natural’s GHG emissions intensity has increased in one of the last two reporting years but decreased as a whole over the last two reporting years.
Source(s): [see Supplemental Data] INDICATOR 2C. R&D INTO LOW-CARBON TECHNOLOGIES Score: (2) Rationale: Canadian Natural has committed to funding R&D into low-carbon
technologies but does not disclose an internal low-carbon R&D budget or its contribution to third-party R&D into low-carbon technologies (e.g., COSIA, PTAC).
Source(s): “During 2018, the Company filed Scientific Research and
Experimental Development claims of approximately $265 million (2017 – $345 million; 2016 – $549 million) relating to qualifying research and development expenditures for Canadian income tax purposes.” (CNRL.AR, p. 34)
“Canadian Natural is a founding member and active participant in Canada’s Oil Sands Innovation Alliance (COSIA). Through COSIA, Canadian Natural, along with other oil sands operators, is sharing valuable research and development information and technologies. This is an unparalleled collaboration effort to improve industry’s environmental performance in the course of our operations. As one of the largest COSIA contributors, Canadian Natural has an important role in helping to meet the industry’s goal. We know that the investments we are making now to lower our GHG emissions will create long-term value for generations to come, all while delivering the safe, secure, reliable and environmentally responsible energy the world needs. To date, companies have contributed 981 technologies at a development cost of $1.4 billion to improve environmental performance through COSIA. 163 of these technologies have been shared in the GHG Environmental Performance Area portfolio alone. Additionally, we are a member of the Petroleum Technology Alliance Canada (PTAC) with 500 projects launched to date,
74

Canadian Natural Resources
worth ~$310 million.” (CNRL.CDP1, p.26; see also CNRL.AR, p. 32)
“In addition to current projects and innovative operating practices, we support the US$20 million NRG COSIA Carbon XPRIZE. This global competition is intended to identify new technologies that will transform CO2 emissions from industrial facilities into valuable and usable products. The governments of Canada and Alberta, together with industry partners and the Shepard Energy Centre (a joint venture of ENMAX and Capital Power); have invested in the development of a $20 million Alberta Carbon Conversion Technology Centre (ACCTC). The ACCTC is a facility where NRG COSIA Carbon XPRIZE finalists are testing their technologies and one of the few places in the world where carbon conversion technologies can be tested on a large, commercial scale.” (CNRL.CDP1, p. 18)
“Canadian Natural supports the development of responsible energy sources, including renewables, as part of the global energy mix that will be needed to meet the world’s energy needs. Renewable energy is supported by natural gas electricity, and as a lower GHG intensive source of energy, natural gas is an integral part of our plan and part of the pathway to long-term emission reductions. Natural gas has less than half the carbon footprint compared to coal and is an important part of the global plan to reduce GHG emissions. Canadian Natural is actively evaluating and developing a wide range of unique projects with the potential to make a significant difference in emission reduction, including opportunities to take waste CO2 emissions and transform them into valuable products.” (CNRL.CDP1, p. 29)
“We believe that supporting research while developing and adopting innovative technology is the best way to reduce GHG emissions.” (CNRL.CWS1)
“The Company’s integrated GHG emissions reduction strategy includes: 1) integrating emission reduction in project planning and operations; 2) leveraging technology to create value and enhance performance; 3) investing in research and development and supporting collaboration; 4) focusing on continuous improvement
75
Canadian Natural Resources
to drive long-term emissions reduction; 5) leading in carbon capture and sequestration/storage; 6) engaging proactively in policy and regulatory development (including trading capacity and offsetting emissions); and, 7) considering and developing new business opportunities and trends.” (CNRL.AR, p. 44)
INDICATOR 2D. USE OF AN INTERNAL PRICE ON CARBON Score: (2) Rationale: Canadian Natural uses a price on carbon in project planning in
jurisdictions with carbon pricing regimes, but does not disclose the price.
Source(s): “Canadian Natural uses an internal price of carbon to evaluate
returns on future projects under different potential carbon regulations, and for evaluating emission reduction projects.” (CNRL.CDP1, p. 33)
[Provide details of how your organization uses an internal price on carbon] ”At a project level, for those projects that face a carbon cost or have an opportunity to generate carbon credits.” (CNRL.CDP1, p. 48)
“The Company’s integrated GHG emissions reduction strategy includes...integrating emission reduction in project planning and operations.” (CNRL.AR, p. 44)
“Several of our natural gas plants in British Columbia (BC) have REMVue units attached to their compressor engines. These units include a fuel management system that tightly controls the mixture of air and fuel gas going into the engine (like modern fuel injection), lowering the emissions created in the process. BC’s provincial offset standards and carbon pricing are helping drive this innovative offset project. Adding this technology has increased engine efficiency by 15% on average.” (CNRL.CWS4)
76
Canadian Natural Resources
CRITERION 3 – IS CLIMATE SCIENCE INTEGRAL TO THE GOVERNANCE AND OVERSIGHT OF THE COMPANY? INDICATOR 3A. DELINEATION OF RISKS AND RISK MANAGEMENT PROCEDURES RELATED TO CLIMATE CHANGE INDICATOR 3AI. REGULATORY RISKS Score: (3) Rationale: Canadian Natural pinpoints some specific existing climate-related
regulations that affect it (e.g., Alberta and UK GHG reduction regulations), but offers limited analysis as to potential impacts, including financial, on the company specifically.
Source(s): “Such risks and uncertainties include, among others...government
regulations and the expenditures required to comply with them (especially safety and environmental laws and regulations and the impact of climate change initiatives on capital expenditures and production expenses.” (CNRL.AR, p. 14)
“The Company is exposed to various operational risks inherent in the exploration, development, production and marketing of crude oil and NGLs and natural gas and the mining, extracting and upgrading of bitumen into SCO. These inherent risks include, but are not limited to, the following:...Future legislative and regulatory developments related to environmental regulation.” (CNRL.AR, pp. 41-42)
“The crude oil and natural gas industry is experiencing incremental increases in costs related to environmental regulation, particularly in North America and the North Sea. Existing and expected legislation and regulations require the Company to address and mitigate the effect of its activities on the environment. The Company believes that it meets all existing environmental standards and regulations and has included appropriate amounts in its capital expenditure budget to continue to meet current environmental protection requirements. Increasingly
77

Canadian Natural Resources
stringent laws and regulations may have an adverse effect on the Company’s future net earnings.” (CNRL.AR, p. 42)
“In Alberta, GHG reduction regulations came into effect July 1, 2007, affecting facilities emitting more than 100 kilotonnes of CO2e annually, and those facilities that elect to “opt-in” to the regulation. The carbon price in Alberta is currently $30/tonne for emissions above the regulated limits. Eight of the Company’s operated facilities (the facilities at Horizon and AOSP, the Primrose/Wolf Lake in situ heavy crude oil facilities, the Kirby South in situ heavy crude oil facility, the Peace River in situ heavy crude oil facility, the Hays sour natural gas plant, the Wapiti gas plant, and the Brintnell power generation facility) are subject to compliance under the regulation. The non-operated Scotford Upgrader is also subject to compliance under the regulations. The non-operated North West Redwater bitumen upgrader and refinery became subject to a reduction target on January 1, 2019.” (CNRL.AR, p. 44)
“In the UK, GHG regulations have been in effect since 2005. In Phase 1 (2005 – 2007) of the UK National Allocation Plan, the Company operated below its CO2 allocation. In Phase 2 (2008 – 2012) the Company’s CO2 allocation was decreased below the Company’s operations emissions. In Phase 3 (2013 – 2020) the Company’s CO2 allocation was further reduced. The Company continues to focus on implementing reduction programs based on efficiency audits to reduce CO2 emissions at its offshore facilities and on trading mechanisms to ensure compliance with requirements now in effect.” (CNRL.AR, p. 44)
INDICATOR 3AII. PHYSICAL RISKS Score: (2) Rationale: Canadian Natural’s disclosures relating to physical risks facings its
operations do not include a discussion of climate change as a contributor to those risks.
78

Canadian Natural Resources
Source(s): “The Company is exposed to various operational risks inherent in the exploration, development, production and marketing of crude oil and NGLs and natural gas and the mining, extracting and upgrading of bitumen into SCO. These inherent risks include, but are not limited to, the following:...Environmental impact risk associated with exploration and development activities, including GHG...business interruptions because of unexpected events such as fires or explosions whether caused by human error or nature, severe storms and other calamitous acts of nature, blowouts, freeze-ups, mechanical or equipment failures of facilities and infrastructure and other similar events affecting the Company or other parties whose operations or assets directly or indirectly impact the Company and that may or may not be financially recoverable.” (CNRL.AR, pp. 41-42)
INDICATOR 3AIII. MARKET AND OTHER INDIRECT RISKS AND OPPORTUNITIES Score: (1) Rationale: Canadian Natural’s disclosures do not address its market or indirect
risks related to climate change. Source(s): INDICATOR 3B. DELEGATION OF BOARD MEMBERS AND/OR COMMITTEES WITH EXPLICIT OVERSIGHT OF CLIMATE CHANGE POLICY Score: (1) Rationale: Though Canadian Natural’s “GHG Operations Strategy Committee”
maintains partial oversight of climate change-related corporate governance, it is not a formal board committee. Further, Canadian Natural’s public disclosures do not identify a current board member responsible for climate change-related corporate governance.
Source(s): “Our business strategy is influenced by incorporating knowledge of
climate change risks, including current and potential policies and regulations, into decisions made by our Management Committee. Our governance approach includes: Management Committee is
79

Canadian Natural Resources
responsible for the identification, assessment and management of climate change risks...GHG Operations Strategy Committee is responsible for climate change strategy and issue prioritization, as well as overseeing our working groups that manage and coordinate GHG reduction and technology projects across the Company. This committee also assesses and provides input on current and developing GHG policy and regulation...Board of Directors is responsible for overseeing and ensuring that the Management Committee has appropriate and effective measures in place to manage climate-related risk.” (CNRL.SR, p. 15)
INDICATOR 3C. DOES THE COMPANY SUPPORT CLIMATE-RELATED SHAREHOLDER RESOLUTIONS? Score: (3) Rationale: Canadian Natural has not faced any climate-related shareholder
resolutions put forward by established networks of socially responsible investors during the reporting period.
Source(s): (see Ceres – Climate and Sustainability Shareholder Resolutions
Database; SEC – Division of Corporate Finance 2019; SEC – Division of Corporate Finance 2018)
CRITERION 4 – WHAT ARE THE COMPANY’S AFFILIATIONS WITH THIRD PARTIES THAT SPREAD DISINFORMATION ON CLIMATE SCIENCE? INDICATOR 4A. THE AMERICAN LEGISLATIVE EXCHANGE COUNCIL (ALEC) Score: (3) Rationale: Canadian Natural is based in Canada and has no operations in the
association’s jurisdiction. Further, the company is not cited by Source Watch or DeSmogBlog as having ever been affiliated with the association.
Source(s): (see Source Watch - ALEC; DeSmogBlog – ALEC)
80

Canadian Natural Resources
INDICATOR 4B. THE AMERICAN PETROLEUM INSTITUTE (API) Score: (3) Rationale: Canadian Natural is based in Canada and is neither in API’s current
membership list nor noted by DeSmogBlog as having ever been affiliated with association.
Source(s): (see API – Members; DeSmogBlog – API) INDICATOR 4C. THE NATIONAL ASSOCIATION OF MANUFACTURERS (NAM) Score: (3) Rationale: Canadian Natural is based in Canada and is neither on NAM’s
current BOD list nor noted by DeSmogBlog as having ever been affiliated with association.
Source(s): (see NAM – Board of Directors; DeSmogBlog – NAM) INDICATOR 4D. THE WESTERN STATES PETROLEUM ASSOCIATION (WSPA) Score: N/A Rationale: Canadian Natural is based in Canada and has no operations in the
association’s jurisdiction. Further, the company is neither mentioned by DeSmogBlog as having ever been affiliated with the association nor listed as a corporate member on WSPA’s website.
Source(s): (see WSPA – Member Companies; DeSmogBlog – WSPA) INDICATOR 4E. AMERICAN FUEL AND PETROCHEMICAL MANUFACTURERS (AFPM) Score: (3)
81

Canadian Natural Resources
Rationale: Canadian Natural is based in Canada and is neither in AFPM’s current membership list nor noted by DeSmogBlog as having ever been affiliated with association.
Source(s): (see AFPM – Membership Directory; DeSmogBlog – AFPM) CRITERION 5 – DOES THE COMPANY PUBLICLY SUPPORT THE NEED FOR CLIMATE POLICY AND REGULATIONS? INDICATOR 5A. REGULATIONS, CARBON TAX, EMISSIONS TRADING, RENEWABLE ENERGY, CCS, ETC. Score: (3) Rationale: Though much of Canadian Natural’s advocacy for/against climate
change-related policies and regulations appear to be conducted behind closed doors, the company has publicly supported carbon pricing programs that make an “allowance for competitiveness impacts on energy-intensive trade-exposed (EITE) sectors.” Note that Alberta’s Climate Leadership Plan, which Canadian Natural supports, was initiated outside of the scope of the reporting period.
Source(s): “Carbon tax...Support with minor exceptions...Working with the
Canadian Association of Petroleum Producers and directly with policy makers and regulators to provide advice and analysis on potential regulations...Support carbon pricing programs (which may or may not include a carbon tax), if there is allowance for competitiveness impacts on energy-intensive trade-exposed (EITE) sectors, and if a significant portion of revenue is used for developing technologies that will reduce carbon emissions. Propose measures for EITE sectors to minimize competitiveness impact and reduce carbon leakage (e.g., performance standards based on benchmarking; offsetting fiscal measures).” (CNRL.CDP1, pp. 49-50)
“We have taken significant steps to reduce our GHG emissions with an integrated GHG management strategy that involves...engaging proactively in policy and regulation to effectively manage
82

Canadian Natural Resources
climate risks and opportunities, including trading capacity and offsetting emissions.” (CNRL.SR, p. 14)
“The Company, through the Canadian Association of Petroleum Producers, is working with Canadian legislators and regulators as they develop and implement new GHG emission laws and regulations.” (CNRL.AR, p. 44)
“Air pollutant standards and guidelines are being developed federally and provincially and the Company is participating in these discussions. Ambient air quality and sector based reductions in air emissions are being reviewed. Through Company and industry participation with stakeholders, guidelines are being developed that adopt a structured process to emission reductions that is commensurate with technological development and operational requirements.” (CNRL.AR, p. 44)
“Canadian Natural supports Alberta’s Climate Leadership Plan that incents ongoing innovation and technology investment in the oil and natural gas sector, as well as the federal and provincial goals to reduce methane emissions by 45% by 2025.” (CNRL.CWS3)
“Winds of change are blowing through Alberta’s energy sector. Alberta announced Sunday it will cap oil sands emissions, implement a carbon tax and phase out coal power, replacing most of it with wind. Premier Rachel Notley announced the Climate Leadership Plan Sunday at the Telus World of Science with backing from the oil industry, First Nations and environmental organizations in what she called an “unprecedented level of consensus.”...Industry has had its battles with Alberta’s NDP government, but representatives from Suncor, Shell, Cenovus and Canadian Natural Resources Ltd. spoke in support of the plan Sunday.” (CNRL.TPS1)
INDICATOR 5B. PARIS AGREEMENT Score: (2) Rationale: Canadian Natural has made a general statement of support for
policies that enable the use of Internationally Transferred Mitigation
83
Canadian Natural Resources
Outcomes (ITMOs), which it believes support the Paris Climate Agreement, but the company has not explicitly endorsed the Agreement’s temperature goals.
Source(s): “Article 6 of Paris Agreement...Support policies that enable the use
of ITMOs (Internationally Transferred Mitigation Outcome)...Working with the Canadian Association of Petroleum Producers and directly with Canadian policy makers and regulators to provide advice on the importance of ITMOs to achieving global GHG reductions...Enable ITMOs under the Paris Agreement. Production of many Canadian products, including oil and natural gas, are at a lower GHG intensity than many competing suppliers globally, meaning that increased Canadian production would help lower global GHG emissions by displacing higher-intensity production.” (CNRL.CDP1, p. 50)
CRITERION 6 – HAS THE COMPANY BEEN PUBLICLY TRANSPARENT ABOUT ITS POSITION, ACTIONS, AND AFFILIATIONS WITH REGARD TO CLIMATE SCIENCE AND CLIMATE CHANGE? INDICATOR 6A. WEBPAGE DEDICATED TO CLIMATE CHANGE Score: (5) Rationale: Canadian Natural maintains a separate webpage on its website
devoted to climate change. Source(s): (see CNRL.CWS1) INDICATOR 6B. STAND-ALONE SUSTAINABILITY REPORT WITH SPECIFIC REFERENCE TO CLIMATE CHANGE Score: (5) Rationale: Canadian Natural’s sustainability report is easily accessible through
its website and contains a section dedicated to climate change. Source(s): (see CNRL.SR, pp. 14-17)
84

Canadian Natural Resources
INDICATOR 6C. DISCLOSURE TO CDP Score: (5) Rationale: CDP website indicates “Submitted” from Canadian Natural
Resources for Climate Change 2019. Source(s): (see CNRL.CDP2) INDICATOR 6D. DISCLOSURE OF THIRD-PARTY RELATIONSHIPS AND LOBBYING ACTIVITIES Score: (3) Rationale: Canadian Natural’s website describes the company’s “collaboration”
with a number of industry associations, but does not disclose any payments made to those associations or indicate whether the noted collaborations capture the totality of the company’s memberships.
Source(s): “Collaboration that improves industry’s collective performance is
playing an important role in ensuring competitiveness and a sustainable industry that meets Canada’s and the world’s energy needs for the long-term. ”We are not an industry of the past. The natural resource sector is critical to the sustainability of our economy,” says Joy Romero, Vice-President, Technology and Innovation. “As innovators, we need to collaborate and join our intellectual capital and finances to continue to increase productivity and reduce our carbon footprint.” Our industry was founded on technology and innovation, and by joining forces with our peers, that is exactly what will help ensure it remains sustainable and productive for years to come. A number of collaborative efforts have been taking place to harness a common commitment to environmental improvement, through Canada’s Oil Sands Innovation Alliance (COSIA), Clean Resource Innovation Network (CRIN) and Petroleum Technology Alliance Canada (PTAC), with universities directly or through our industry associations like the Canadian Association of Petroleum Producers (CAPP), and through government agencies like Natural Sciences and Engineering Research Council of Canada (NSERC).” (CNRL.CWS2)
85

Canadian Natural Resources
INDICATOR 6E. REPORT ON CLIMATE RELATED RISK SCENARIOS Score: (1) Rationale: Though Canadian Natural discloses that it has conducted climate
change-related scenario analysis, the company fails to provide sufficient detail to ascertain whether those scenarios include a 2°C or lower increase in global temperature.
Source(s): “Canadian Natural reviews external scenario analyses of climate
change from energy firms/agencies and on that basis developed two internal scenarios in order to assess business risk. Across the range of ambitious climate change scenarios, the expectation is that there will be substantial global production and consumption of crude oil and natural gas for decades to come. As result of Canadian Natural’s GHG management strategy, our reserves face limited risk even under more ambitious climate change scenarios.” (CNRL.SR, p. 15)
86

Cenovus Energy
V. Cenovus Energy CRITERION 1 – WHAT IS THE COMPANY’S POSITION ON CLIMATE SCIENCE? INDICATOR 1A. CONSISTENTLY ACCURATE PUBLIC STATEMENTS ON CLIMATE SCIENCE AND THE CONSEQUENT NEED FOR SWIFT AND DEEP REDUCTIONS IN EMISSIONS FROM THE BURNING OF FOSSIL FUELS Score: (2) Rationale: Cenovus recognizes global concern for climate change in various
public platforms, but does not address climate science in its disclosures.
Source(s): “We recognize that there are growing concerns globally about the
effects of climate change and that the transition to a lower-carbon economy is already underway.” (Cenovus.CWS1)
Cenovus has long recognized the need to assess and manage climate change related risks. We believe that thriving in a highly competitive, lower-carbon economy must be a priority for our industry and for Canada. That requires new solutions to solve the emissions and energy demand challenges our world faces.” (Cenovus.CO2R, p. 2)
CRITERION 2 – WHAT MEASURES IS THE COMPANY TAKING TO REDUCE ITS CARBON FOOTPRINT? INDICATOR 2A. GHG EMISSIONS TARGETS Score: (1) Rationale: Beyond a methane emissions reduction plan pursuant to Albertan
law, Cenovus’ goals with respect to GHG emissions reductions do not include quantitative targets of any kind, much less a specific temperature goal or target. Further, the company’s current GHG reduction efforts are not company-wide, as they only apply to Cenovus' upstream operations.
87

Cenovus Energy
Source(s): “While direct GHG emissions have increased with production on an
absolute basis, we continue to work on technologies that will result in reductions in GHG emissions intensity from our upstream oil and natural gas operations.” (Cenovus.CO2R, p. 7)
“Our goals and targets...Continuously improve our upstream emissions performance to reduce GHG emissions and compliance costs and fuel gas usage, while positioning us for more stringent GHG regulations in the future.” (Cenovus.SR, p. 31)
“Recognizing that over 80 percent of the emissions from Cenovus’s operations in 2016 were directly exposed to a price on carbon, we have a strong economic incentive to reduce our GHG emissions. We have consistently outperformed our regulatory emissions requirements under Alberta’s Specified Gas Emitters Regulation across our Foster Creek and Christina Lake oil sands operations. We are also preparing to meet a new target to reduce methane emissions from our oil and gas production by 45 percent by 2025.” (Cenovus.CO2R, p. 7)
INDICATOR 2B. GHG EMISSIONS REDUCTIONS Score: (3) Rationale: Cenovus’ GHG emissions intensity has increased in one of the last
two reporting years but decreased as a whole over the last two reporting years.
Source(s): [see Supplemental Data] INDICATOR 2C. R&D INTO LOW-CARBON TECHNOLOGIES Score: (3) Rationale: Cenovus has publicly committed to both internally develop and
externally fund “cleantech innovations” (e.g., Cenovus is the co-founder of Evok Innovations, a venture fund to which it will contribute $50 million over the next ten years) but has not disclosed its total
88

Cenovus Energy
budget dedicated to R&D into low-carbon technologies, with investments allocated by technology.
Source(s): “In addition to developing our own technologies, we are collaborating
with peers, academics, other industries and entrepreneurs from around the world. We are taking a strategic approach, focusing on technology projects that have the greatest chance of addressing key environmental and economic challenges faced by Cenovus and its industry peers. Many of these cleantech innovations that are being developed in Canada also have the potential to address environmental challenges faced by other industries and jurisdictions around the globe.” (Cenovus.SR, p. 10)
“Cenovus is a co-founder, along with Suncor Energy and the BC Cleantech CEO Alliance, of Evok Innovations, a first-of-its-kind $100 million investment partnership. Evok’s mission is to connect the energy industry and the global clean technology community to accelerate the development and commercialization of early- stage cleantech solutions addressing the toughest economic and environmental challenges facing the oil and gas industry. That includes the challenge of significantly reducing or eliminating CO2 emissions from the production of oil through to its end use.” (Cenovus.SR, p. 11)
“Cenovus and Suncor have committed to provide up to $50 million each over 10 years to fund Evok Innovations...These ventures address an array of environmental and economic challenges in the energy industry ranging from a light-weight boom for marine spill response, to an intelligent visual monitoring solution that reduces operational costs, emissions and safety risks, to a novel new process to generate industrial scale hydrogen from natural gas.” (Cenovus.CWS2)
“In 2015, with support from eight member companies, including Cenovus, COSIA teamed up with NRG Energy to sponsor the US$20 million NRG COSIA Carbon XPRIZE. The competition is a cross- border, cross-industry effort to promote and advance the discovery and development of technologies that could contribute to a cleaner energy future by launching an entirely new commercial
89

Cenovus Energy
industry - converting carbon dioxide (CO2) emissions into valuable products.” (Cenovus.SR, p. 11)
INDICATOR 2D. USE OF AN INTERNAL PRICE ON CARBON Score: (2) Rationale: Although Cenovus cites specific carbon pricing to which it is subject
to or will be subject to by law, the company is vague about how these prices factor into the company’s internal pricing scheme. Moreover, though Cenovus discloses a marginal carbon price it uses when considering “investments in GHG emissions reduction technology,” it is unclear whether the quoted price would be applied to analysis of other investments, such as new facilities.
Source(s): “Carbon pricing and scenario analysis: Before we finalize plans for
new oil sands projects, we assess the projects’ future GHG emissions, and alternatives for reducing those emissions, by conducting scenario analysis. This helps us better understand the technology and capital required to build projects that can be competitive both on a cost and carbon basis.” (Cenovus.SR, p. 31)
“At our oil sands facilities, we are subject to carbon pricing on the portion of our emissions that exceeds industry-wide benchmarks. We have a strong economic incentive to reduce every tonne of carbon dioxide equivalent (CO2e). When we consider investments in GHG emissions reduction technology, we make investments based on the marginal carbon price. The marginal price is equal to the regulated carbon price which is currently $30 per tonne CO2e across most of our operations. The regulated price is expected to increase to $50 per tonne CO2e by 2022, further incenting investment in emissions mitigation technology.” (Cenovus.CO2R, p. 6)
CRITERION 3 – IS CLIMATE SCIENCE INTEGRAL TO THE GOVERNANCE AND OVERSIGHT OF THE COMPANY?
90

Cenovus Energy
INDICATOR 3A. DELINEATION OF RISKS AND RISK MANAGEMENT PROCEDURES RELATED TO CLIMATE CHANGE INDICATOR 3AI. REGULATORY RISKS Score: (4) Rationale: Cenovus pinpoints specific existing and proposed climate-related
laws and regulations that may impact it, including some analysis as to whether those laws and regulations will have a material impact on the company’s business, including its financial position.
Source(s): “Various federal, provincial and U.S. state governments have
announced intentions to regulate GHG emissions. Some of these regulations are in effect while others remain in various phases of review, discussion or implementation. Adverse impacts to our business as a result of comprehensive GHG legislation and regulations may include: increased compliance costs, permitting delays and substantial costs to generate or purchase emission credits or allowances, all of which may increase operating expenses and reduce demand for crude oil and certain refined products. While Cenovus’s operations are subject to carbon pricing in the provinces where we operate, our assets remain competitive. Under the Alberta Climate Leadership Plan (CLP), Cenovus’s oil sands and Deep Basin operations are subject to the carbon pricing regime for large industrial emitters. Our Deep Basin oil and natural gas operations in British Columbia are subject to a carbon tax. Cenovus expects Alberta and British Columbia’s provincial carbon pricing to meet or exceed the Canadian federal government’s backstop national carbon pricing regime whereby emissions costs will increase to $40 per tonne in 2021 and $50 per tonne in 2022. In addition to GHG emissions pricing, provincial and federal governments are expected to finalize measures to reduce methane emissions from oil and gas activities by 45 percent by 2025. Under the Alberta CLP, the province has also committed to limiting oil sands emissions to a province-wide total of 100 megatonnes per year. Cenovus does not expect the emissions limit will impede our ability to obtain the necessary environmental and regulatory approvals for new oil sands development, as we have over 800,000 barrels per day of
91

Cenovus Energy
regulatory-approved oil sands production capacity including the current 390,000 barrels per day of installed capacity. Further, we do not expect the emissions limit will impede the continued operation of our existing oil sands projects given our best-in-class reservoir and emissions performance.” (Cenovus.CO2R, p. 5)
“In the future, we anticipate the majority of regulations impacting our operations will be designed in a way that strikes a balance between improving environmental performance and maintaining the economic competitiveness of energy-intensive and trade-exposed sectors.” (Cenovus.CO2R, p. 4)
INDICATOR 3AII. PHYSICAL RISKS Score: (2) Rationale: Cenovus' disclosures relating to physical risks facings its operations
do not include a discussion of climate change as a contributor to those risks.
Source(s): The risk factors and uncertainties that could cause Cenovus’s
actual results to differ materially include...the occurrence of unexpected events such as fires, severe weather conditions, explosions, blow-outs, equipment failures, transportation incidents and other accidents or similar events. (Cenovus.40F, p. 1)
“Our crude oil and natural gas operations are subject to all of the risks normally incidental to: (i) the storing, transporting, processing, refining and marketing of crude oil, natural gas and other related products; (ii) drilling and completion of crude oil and natural gas wells; and (iii) the operation and development of crude oil and natural gas properties including, but not limited to: encountering unexpected formations or pressures; premature declines of reservoir pressure or productivity; fires; explosions; blowouts; gaseous leaks; power outages; migration of harmful substances into water systems; oil spills; uncontrollable flows of crude oil, natural gas or well fluids; failure to follow operating procedures or operate within established operating parameters; equipment failures and other accidents; adverse weather
92

Cenovus Energy
conditions; pollution; and other environmental risks.” (Cenovus.AR, p. 44)
INDICATOR 3AIII. MARKET AND OTHER INDIRECT RISKS AND OPPORTUNITIES Score: (2) Rationale: Cenovus’ disclosures make passing mention of disruptive
technologies, but do not meaningfully address market or other indirect risks related to climate change.
Source(s): “Cenovus is exposed to a number of risks through the pursuit of our
strategic objectives. Some of these risks impact the oil and gas industry as a whole and others are unique to our company. Failure to manage significant risks to our business, including those related to GHG emissions, could have a material adverse effect on our reputation, financial condition, results of operations and cash flows.” (Cenovus.CO2R, p. 4)
“We monitor the potential impact of disruptive technologies, such as electric vehicles (EVs), that have the potential to displace hydrocarbon demand. While there have been significant advancements in EV technology and battery costs, a recent IEA study concludes that EV technology remains at an early deployment stage, with mass market adoption projected to be about 10 to 20 years away. According to a recent Bloomberg New Energy Finance forecast, EVs will only displace eight million barrels of transport fuel per day by 2040. Even with the displacement of oil from increasing sales of EVs, most major forecasts project 105 to 120 million barrels per day in global liquids demand by 2040.” (Cenovus.CO2R, p. 3)
INDICATOR 3B. DELEGATION OF BOARD MEMBERS AND/OR COMMITTEES WITH EXPLICIT OVERSIGHT OF CLIMATE CHANGE POLICY Score: (1) Rationale: Cenovus’ Safety, Environment and Responsibility (SER) committee
allegedly maintains oversight of the company’s GHG risks and
93

Cenovus Energy
liabilities, but its charter does not explicitly mention climate change as an issue that is under the committee’s oversight.
Source(s): “To ensure our Board members are effective in their roles as
stewards of Cenovus, it’s critical they understand how climate change related risks relate to our company, the industry and our regulatory environment. In addition to receiving regular briefings on climate change and related topics, the Board conducts an extensive annual review of risk factors for Cenovus, including climate change related risks, as part of the preparation of the company’s annual MD&A and AIF. The Board also engages on the topic of climate change and Cenovus’s ability to remain resilient under a variety of low-carbon-future scenarios as part of its strategy development process. In addition, the Safety, Environment and Responsibility (SER) Committee of the Board reviews and reports to the Board on issues relating to climate change, Cenovus’s GHG emissions risks and related liabilities.” (Cenovus.SR, p. 31; see also Cenovus.CCC1)
INDICATOR 3C. DOES THE COMPANY SUPPORT CLIMATE-RELATED SHAREHOLDER RESOLUTIONS? Score: (2) Rationale: Cenovus recommended against a shareholder resolution put forward
by Fonds de Solidarité des Travailleurs du Québec (FTQ) asking the company to set greenhouse gas emission targets aligned with the goals of the Paris Climate Agreement.
Source(s): “The following shareholder proposal was submitted by Fonds de
Solidarité des Travailleurs du Québec (FTQ) for consideration at the 2019 annual meeting of shareholders: Resolved: That Cenovus Energy Inc. (“Cenovus”) set and publish science-based greenhouse gas (GHG) emissions reduction targets that are aligned with the goal of the Paris Agreement1 to limit global average temperature increase to well below 2 degrees Celsius relative to pre-industrial levels. These targets should cover the direct and indirect methane and other GHG emissions of Cenovus’ operations over medium and long-term time horizons. Such targets should be quantitative, subject to regular review, and progress
94

Cenovus Energy
against such targets should be reported to shareholders on an annual basis...The Board recommends voting AGAINST this proposal for the following reasons. While the proposal aligns with Cenovus’s values relating to environmental performance and reducing greenhouse gas (“GHG”) emissions intensity, we believe that the approach contemplated in the proposal is not the best approach for Cenovus’s business nor is it aligned with the company’s focus on enhancing shareholder value.” (Cenovus.PRXY1, p. 47; see also Ceres – Climate and Sustainability Shareholder Resolutions Database; SEC – Division of Corporate Finance 2019; SEC – Division of Corporate Finance 2018)
CRITERION 4 – WHAT ARE THE COMPANY’S AFFILIATIONS WITH THIRD PARTIES THAT SPREAD DISINFORMATION ON CLIMATE SCIENCE? INDICATOR 4A. THE AMERICAN LEGISLATIVE EXCHANGE COUNCIL (ALEC) Score: (3) Rationale: Cenovus is based in Canada and has no operations in the
association’s jurisdiction. Further, the company is not cited by Source Watch or DeSmogBlog as having ever been affiliated with the association.
Source(s): (see Source Watch - ALEC; DeSmogBlog – ALEC) INDICATOR 4B. THE AMERICAN PETROLEUM INSTITUTE (API) Score: (3) Rationale: Cenovus is based in Canada and is neither in API’s current
membership list nor noted by DeSmogBlog as having ever been affiliated with association.
Source(s): (see API – Members; DeSmogBlog – API) INDICATOR 4C. THE NATIONAL ASSOCIATION OF MANUFACTURERS (NAM)
95

Cenovus Energy
Score: (3) Rationale: Cenovus is based in Canada and is neither on NAM’s current BOD
list nor noted by DeSmogBlog as having ever been affiliated with association.
Source(s): (see NAM – Board of Directors; DeSmogBlog – NAM) INDICATOR 4D. THE WESTERN STATES PETROLEUM ASSOCIATION (WSPA) Score: N/A Rationale: Cenovus is based in Canada and has no operations in the
association’s jurisdiction. Further, the company is neither mentioned by DeSmogBlog as having ever been affiliated with the association nor listed as a corporate member on WSPA’s website.
Source(s): (see WSPA – Member Companies; DeSmogBlog – WSPA) INDICATOR 4E. AMERICAN FUEL AND PETROCHEMICAL MANUFACTURERS (AFPM) Score: (2) Rationale: Cenovus is listed as an “Associate Member” on AFPM’s website, but
currently does not hold a leadership position in the association. Source(s): (see AFPM – Membership Directory; DeSmogBlog – AFPM) CRITERION 5 – DOES THE COMPANY PUBLICLY SUPPORT THE NEED FOR CLIMATE POLICY AND REGULATIONS? INDICATOR 5A. REGULATIONS, CARBON TAX, EMISSIONS TRADING, RENEWABLE ENERGY, CCS, ETC. Score: (2)
96

Cenovus Energy
Rationale: Cenovus has identified a general category of climate policy that it supports (e.g., the company has been actively lobbying the Canadian government to set a nationwide carbon price and supports a global price as well) but has at the same time actively opposed specific climate change-related policy proposals (e.g., criticism of an unamended version of Bill C-69) in its relevant jurisdictions during the reporting period. Note that Alberta’s Climate Leadership Plan, which Cenovus supports, was initiated outside of the scope of the reporting period.
Source(s): “Cenovus is supportive of a broad-based and globally
consistent price on carbon, with a portion of those revenues going to advance carbon-reduction technologies. We believe an international carbon price is the most fair and equitable way to ensure a global transition to a lower-carbon future. Carbon pricing, applied equally across all jurisdictions, will help avoid “emissions leakage” of energy-intensive activities to jurisdictions with less stringent GHG policy. It also allows emission-reduction activities to be deployed to where they occur most efficiently on a dollar per tonne basis. In the future, we anticipate the majority of regulations impacting our operations will be designed in a way that strikes a balance between improving environmental performance and maintaining the economic competitiveness of energy-intensive and trade-exposed sectors.” (Cenovus.CO2R, p. 4)
“Unless amended, the impact of Bill C-69 will be felt by all Canadians. The Bill will slow down an already complex review process and create even more uncertainty in the Canadian resource industry. This is not what Canada needs.” (Cenovus.CWS3)
“One example of our ongoing concern with Bill C-69 is that its language creates significant opportunities for groups whose only objective is to end oil and gas development in Canada to mount endless legal actions to prevent approved projects from getting built. The Trans Mountain Expansion project is a prime example. This approved project has been through the most exhaustive and rigorous regulatory review of any pipeline ever built, and yet it's been repeatedly stalled by vexatious legal action. While the government says Bill C-69 will fix that problem - it won't. It will only make matters worse by throwing the door open to even more
97

Cenovus Energy
potential legal challenges to approved projects. We proposed amendments that would restrict legal challenges to project approvals to matters of jurisdiction or significant errors in law. Those amendments have been rejected. Without this clarity of language, this will leave decisions by an expert regulatory body about the impact of a project on the environment or even on sex and gender open to wide interpretation and second guessing by the courts. The bill is also flawed because it does not provide certainty around timelines for project approvals. As drafted, there is too much wiggle room for approval deadlines to be repeatedly extended. Our proposed amendments would have provided certainty around hard deadlines, but the government has rejected those too.” (Cenovus.FPS1)
“We also continue to support the goals of Alberta’s Climate Leadership Plan – it addresses concerns about rising greenhouse gas emissions from the oil sands and shows the government and public that we’re serious about emissions reduction...Cenovus has engaged in the federal government’s assessment review process from the beginning, providing comments to the Expert Panel report (Building Common Ground: A New Vision for Impact Assessment in Canada.” Cenovus has also provided feedback to the House of Commons Standing Committee on Environment and Sustainable Development, as part of its study of Bill C-69 and comments were provided on the most recent consultation papers touching on the approach to the project list and time management regulation.” (Cenovus.FPS2, p. 2)
“Winds of change are blowing through Alberta’s energy sector. Alberta announced Sunday it will cap oil sands emissions, implement a carbon tax and phase out coal power, replacing most of it with wind. Premier Rachel Notley announced the Climate Leadership Plan Sunday at the Telus World of Science with backing from the oil industry, First Nations and environmental organizations in what she called an “unprecedented level of consensus.”...Industry has had its battles with Alberta’s NDP government, but representatives from Suncor, Shell, Cenovus and Canadian Natural Resources Ltd. spoke in support of the plan Sunday.” (Cenovus.TPS1)
98

Cenovus Energy
INDICATOR 5B. PARIS AGREEMENT Score: (1) Rationale: Cenovus makes no reference to the Paris Climate Agreement in its
public disclosures apart from noting the Canadian government’s ratification of the Agreement in 2016.
Source(s): “In 2016, the Government of Canada ratified the international Paris
Agreement on climate change and announced a new national carbon pricing regime (the “Carbon Strategy”). In 2018, the federal government finalized the Greenhouse Gas Pollution Pricing Act under the Carbon Strategy, which specifies (i) a carbon price on fossil fuels of $20 per tonne of carbon dioxide equivalent (“CO2e”) in 2019, rising by $10 per year to $50 per tonne CO2e in 2022 and (ii) an Output-Based Pricing System (“OBPS”) for industrial facilities with annual emissions of 50 kilotonnes of GHG per year or more.” (Cenovus.AR, p. 49)
CRITERION 6 – HAS THE COMPANY BEEN PUBLICLY TRANSPARENT ABOUT ITS POSITION, ACTIONS, AND AFFILIATIONS WITH REGARD TO CLIMATE SCIENCE AND CLIMATE CHANGE? INDICATOR 6A. WEBPAGE DEDICATED TO CLIMATE CHANGE Score: (5) Rationale: Cenovus maintains a separate webpage on its website devoted to
climate change. Source(s): (see Cenovus.CWS1) INDICATOR 6B. STAND-ALONE SUSTAINABILITY REPORT WITH SPECIFIC REFERENCE TO CLIMATE CHANGE Score: (5) Rationale: Cenovus’ sustainability report contains a section entitled “Emissions
and Energy Usage” which focuses on management’s approach to
99

Cenovus Energy
climate-related risk and the company’s “role in a lower-carbon future.”
Source(s): (see Cenovus.SR, p. 31) INDICATOR 6C. DISCLOSURE TO CDP Score: (1) Rationale: CDP website indicates “Declined to participate” from Cenovus for
Climate Change 2018. Source(s): (see Cenovus.CDP1) INDICATOR 6D. DISCLOSURE OF THIRD-PARTY RELATIONSHIPS AND LOBBYING ACTIVITIES Score: (5) Rationale: Cenovus discloses, by amount contributed, the politically oriented
organizations its supports through memberships and sponsorships, in its corporate responsibility report.
Source(s): (see Cenovus.SR, p. 15-16) INDICATOR 6E. REPORT ON CLIMATE RELATED RISK SCENARIOS Score: (1) Rationale: Cenovus’ disclosures relating to scenario analysis, including the IEA
WEO Sustainable Development Scenario, are extremely limited and explicitly exclude climate-related financial metrics” which the company views as not useful to investors at this time.
Source(s): “Cenovus believes that GHG regulations and the cost of carbon at
various price levels can be adequately accounted for as part of the business planning process. To mitigate uncertainty surrounding future emissions regulation, the Cenovus Leadership Team and Board regularly evaluate our development plans under a range of carbon-constrained scenarios. Maintaining industry-leading
100

Cenovus Energy
operating costs is expected to be vital to remaining competitive in the global market under aggressive low-carbon policy scenarios where carbon compliance costs are higher. With our best-in-class steam-to-oil ratios (SORs), we expect to have among the lowest emissions compliance costs among in situ operators in the oil sands industry. A low SOR also means lower capital and operating costs, lower energy usage, a smaller surface footprint and less water usage. Our low SOR, along with our continued efforts to reduce production costs, helps position Cenovus to remain competitive under a variety of scenarios, including ones where carbon pricing regulations are introduced to aggressively reduce GHG emissions.” (Cenovus.CO2R, p. 6)
“Given that forecasted policy assumptions vary widely between scenarios, Cenovus believes that disclosure of climate-related financial metrics are not useful to investors until consistent standards, assumptions and guidance are developed for scenario analysis...Cenovus’s view is most aligned with the International Energy Agency’s (IEA) World Economic Outlook (WEO) New Policies Scenario, where nations make efforts toward their climate targets while global oil demand continues to grow out to 2040.” (Cenovus.CO2R, p. 3)
“One of the methods we use to understand the impact of commodity price risk is to stress-test our corporate strategy against a variety of commodity price forecasts, including those that are more conservative than the IEA’s WEO Sustainable Development Scenario.” (Cenovus.CO2R, p. 5)
101

Chevron Corporation
VI. Chevron Corporation CRITERION 1 – WHAT IS THE COMPANY’S POSITION ON CLIMATE SCIENCE? INDICATOR 1A. CONSISTENTLY ACCURATE PUBLIC STATEMENTS ON CLIMATE SCIENCE AND THE CONSEQUENT NEED FOR SWIFT AND DEEP REDUCTIONS IN EMISSIONS FROM THE BURNING OF FOSSIL FUELS Score: (1) Rationale: Chevron incorrectly states that the IPCC’s Fifth Assessment Report
“concludes that there is warming of the climate system and that warming is due in part to human activity,” when in fact the report concludes that “it is extremely likely that human influence has been the dominant cause of the observed warming since the mid-20th century.” Further, Chevron creates a false choice by stating that efforts to combat climate change should be balanced with the need for reliable and affordable energy that supports social and economic development.
Source(s): “The IPCC Fifth Assessment Report concludes that there is warming
of the climate system and that warming is due in part to human activity. Chevron does not conduct original climate research. We align our activity with the principles noted above and with the processes for governance, risk management and strategy outlined in this report.” (Chevron.CO2R1, p. 20)
“The following four principles have guided our actions and policy views on climate change for the past decade...(Principle Two) Policies should be balanced and measured to ensure that long-term economic, environmental and energy security needs are all met; that costs are allocated in an equitable, gradual and predictable way; and that actions consider both GHG mitigation and climate change adaptation...(Principle Four) The costs, risks, trade-offs and uncertainties associated with GHG reduction and climate change adaptation efforts must be transparent and openly communicated to global consumers.” (Chevron.CO2R1, p. 20)
102

Chevron Corporation
“Although we cannot forecast exactly what will happen in the future, we believe Chevron’s governance, risk management and strategy processes are sufficient to mitigate the risks and capture opportunities associated with climate change.” (Chevron.CO2R1, p. 3)
“We work constructively with governments toward balanced policies to address potential climate change risks while providing access to reliable and affordable energy to support social and economic progress.” (Chevron.CO2R1, p. 20)
CRITERION 2 – WHAT MEASURES IS THE COMPANY TAKING TO REDUCE ITS CARBON FOOTPRINT? INDICATOR 2A. GHG EMISSIONS TARGETS Score: (2) Rationale: Chevron has established new GHG intensity reduction performance
measures related to flaring and methane, but has no company-wide plan for reducing GHG emissions. Moreover, Chevron’s actions are not in the service of a specific temperature goal or target.
Source(s): “Chevron does not support establishing targets associated with
the use of Chevron’s products (emissions related to the energy demand of consumers). We believe that compelling select oil and gas producers to unilaterally reduce their production or change their portfolios to align with a possible future energy mix does not advance the goals of the Paris Agreement. Doing so could result in companies like Chevron diverting resources away from their competitive strengths and could lead to less efficient companies—ones that may be less socially and environmentally responsible and may not be subject to public company oversight—increasing their share of fossil fuel production. This would neither serve the interests of our stockholders nor result in progress related to the Paris Agreement. It is our view that a decrease in overall fossil fuel emissions is not inconsistent with continued or increased fossil fuel production by the most efficient producers. Our strategy is to be among the most efficient producers. We support market-based mechanisms
103

Chevron Corporation
and set the performance measures outlined in this report consistent with this strategy and our view of the Paris Agreement.” (Chevron.CO2R2, p. 9)
“Chevron aims to reduce emissions intensity while improving our operations and supporting the objectives of society as expressed in the Paris Agreement. To this end, we are establishing two equity-based GHG intensity reduction performance measures to reduce GHG emissions intensity from 2016 to 2023: a 25 to 30 percent flaring intensity reduction and a 20 to 25 percent methane emissions intensity reduction. Assigning 2016 as the baseline year aligns with the year the Paris Agreement was ratified. Designating 2023 as the end measurement year also aligns with the Paris Agreement, which calls for the first global emissions “stocktake” in 2023 and every five years thereafter. We are applying these performance measures not just in our operations but on an equity basis across all our assets. These performance measures will be included in our CIP Scorecard, which affects variable compensation for our workforce.” (Chevron.CO2R2, p. 8)
“Since 2012, we have reduced flaring by 22 percent. We have developed internal country-specific plans to minimize gas flaring...Methane accounts for approximately 9 percent of Chevron’s total GHG emissions. Approximately one-quarter of the 9 percent is considered fugitive emissions, or leaks from equipment and piping; of the remaining emissions, most are generated by flaring and venting.” (Chevron.CO2R1, p. 38)
INDICATOR 2B. GHG EMISSIONS REDUCTIONS Score: (1) Rationale: Company’s GHG emissions intensity has increased in each of the
last two reporting years. Source(s): [see Supplemental Data] INDICATOR 2C. R&D INTO LOW-CARBON TECHNOLOGIES Score: (2)
104

Chevron Corporation
Rationale: Though Chevron discloses its high-level R&D budget and provides
some figures regarding its venture and CCUS investments, it has not disclosed a low-carbon R&D budget.
Source(s): “In 2018, Chevron joined the Oil and Gas Climate Initiative and
separately launched the Chevron Future Energy Fund. Both initiatives invest in technology designed to economically lower emissions.” (Chevron.10K, p. 17; see also Chevron.10K, p. 89)
“Chevron Technology Ventures established the Future Energy Fund to invest in emerging technologies that reduce carbon emissions. An initial commitment of $100 million launched the fund. A first investment went to ChargePoint, one of the largest operators of electric-vehicle charging networks, with 57,000 locations. ChargePoint is using this investment to expand its network in North America and Europe.” (Chevron.CR, p. 9; see also Chevron.CO2R2, pp. 16-17) “Chevron is engaged in every step of the energy technology development chain, from early-stage research to industrial- scale applications. Chevron was the first international oil company (IOC) with an integrated technology company that develops and manages technology across the business. Chevron Energy Technology Company (ETC) invests in fundamental research and development in partnership with world-class universities and laboratories. Our industry experts are working in collaboration with academic experts globally. Chevron was the first IOC with a venture capital arm. Chevron Technology Ventures (CTV) scans the globe to identify promising startups that can help develop emerging energy technologies we can test and transfer into our company. We know that new ideas can come from anywhere, from any industry, at any time, so we take an open-innovation approach to technology development and work in close collaboration with our operations worldwide. CTV screens several hundred opportunities and formally evaluates up to 200 of these opportunities per year. In doing so, we are positioning Chevron to compete profitably within the future energy landscape as those technologies become economical and competitive. As an example, in 2016, we invested in Novvi LLC to develop, market and distribute
105

Chevron Corporation
high-performance oils and lubricants from renewable sources.” (Chevron.CO2R1, p. 14)
“Chevron has invested approximately $1.1 billion in CCUS projects, which, once operational, are expected to reduce GHG emissions by about 5 million metric tons per year, approximately the equivalent of GHG emissions attributable to 620,000 U.S. homes’ annual electricity usage. In addition, Chevron has invested more than $75 million in CCUS research and development over the past decade.” (Chevron.CO2R2, p. 11)
INDICATOR 2D. USE OF AN INTERNAL PRICE ON CARBON Score: (2) Rationale: Chevron notes that it “assesses carbon pricing risks by considering
carbon costs” in its long-range forecasts, but has not disclosed that internal price.
Source(s): “Our business plans, impairment reviews, reserve accounting and
investment analysis include jurisdiction-specific carbon cost forecasts based on the projected actual cost of a specific asset. This is different from a “shadow” carbon price, which assumes a hypothetical price of carbon for investment analysis purposes. Similar to our forecast of commodity prices, the carbon cost forecasts used in our business are calculated using our dedicated resources, including proprietary information, modeling and analysis. The proprietary information and the analysis that go into these decisions are important to Chevron’s overall strategy, and attempts to force disclosure of our carbon cost forecasts, if successful, could erode our competitive advantage.” (Chevron.CO2R1, p. 25)
“In 2016, approximately 50 percent of Chevron’s total Scope 1 and Scope 2 equity greenhouse gas emissions were in regions with existing or developing carbon pricing policies. We use carbon prices in business planning, investment decisions, impairment reviews and reserves calculations.” (Chevron.CO2R1, p. 3)
106

Chevron Corporation
“These forecasts (i.e., long-range supply, demand and energy price forecasts) reflect long-range effects from renewable fuel penetration, energy efficiency standards, climate-related policy actions, and demand response to oil and natural gas prices. Additionally, the company assesses carbon pricing risks by considering carbon costs in these forecasts. The actual level of expenditure required to comply with new or potential climate change-related laws and regulations and amount of additional investments in new or existing technology or facilities, such as carbon dioxide injection, is difficult to predict with certainty and is expected to vary depending on the actual laws and regulations enacted in a jurisdiction, the company’s activities in it and market conditions.” (Chevron.10K, p. 21)
CRITERION 3 – IS CLIMATE SCIENCE INTEGRAL TO THE GOVERNANCE AND OVERSIGHT OF THE COMPANY? INDICATOR 3A. DELINEATION OF RISKS AND RISK MANAGEMENT PROCEDURES RELATED TO CLIMATE CHANGE INDICATOR 3AI. REGULATORY RISKS Score: (4) Rationale: Chevron’s Form 10-K offers an analysis of specific existing and
proposed climate-related regulations and laws (e.g., various specific cap-and-trade programs) and their possible effects on the company, including potential financial impacts.
Source(s): “International agreements and national, regional and state legislation
(e.g., California AB32, SB32 and AB398) and regulatory measures that aim to limit or reduce GHG emissions are currently in various stages of implementation. For example, the Paris Agreement went into effect in November 2016, and a number of countries are studying and may adopt additional policies to meet their Paris Agreement goals. In some jurisdictions, the company is already subject to currently implemented programs such as the U.S. Renewable Fuel Standard program, the European Union Emissions Trading System, and the California cap- and-trade program and related
107

Chevron Corporation
low carbon fuel standard obligations. Other jurisdictions are considering adopting or are in the process of implementing laws or regulations to directly regulate GHG emissions through similar or other mechanisms such as, for example, via a carbon tax (e.g., Singapore and Canada) or via a cap-and-trade program (e.g., Mexico and China). The landscape continues to be in a state of constant re-assessment and legal challenge with respect to these laws and regulations, making it difficult to predict with certainty the ultimate impact they will have on the company in the aggregate....The actual level of expenditure required to comply with new or potential climate change-related laws and regulations and amount of additional investments in new or existing technology or facilities, such as carbon dioxide injection, is difficult to predict with certainty and is expected to vary depending on the actual laws and regulations enacted in a jurisdiction, the company’s activities in it and market conditions.” (Chevron.10K, p. 20)
“Although the IEA’s World Energy Outlook scenarios anticipate oil and gas continuing to make up a significant portion of the global energy mix through 2040 and beyond given their respective advantages in transportation and power generation, if a new onset of regulation contributes to a decline in the demand for the company’s products, this could have a material adverse effect on the company and its financial condition.” (Chevron.10K, p. 20)
“The ultimate effect of international agreements and national, regional and state legislation and regulatory measures to limit GHG emissions on the company’s financial performance, and the timing of these effects, will depend on a number of factors. Such factors include, among others, the sectors covered, the GHG emissions reductions required, the extent to which Chevron would be entitled to receive emission allowance allocations or would need to purchase compliance instruments on the open market or through auctions, the price and availability of emission allowances and credits, and the extent to which the company is able to recover the costs incurred through the pricing of the company’s products in the competitive marketplace.” (Chevron.10K, p. 21)
INDICATOR 3AII. PHYSICAL RISKS
108

Chevron Corporation
Score: (3) Rationale: Chevron provides a few examples of the physical risks to its business
from extreme weather scenarios, and mentions climate change as a contributor to those risks, but provides few details about the nature of those risks.
Source(s): “For decades, Chevron has managed risks associated with the
impact of ambient conditions on our operations. Long-standing practices developed to manage these impacts are being applied and extended to reflect possible effects of climate change and to ensure the ongoing resilience of our infrastructure, both for current operations and for those being developed and considered. For example, to protect the facilities against possible storm surges, we spent $120 million on raising a dike at our Pascagoula, Mississippi, refinery and $16.2 million to construct a seawall at our Port Arthur, Texas, lubricants plant. As another example, the Chevron Engineering Standard for Metocean Design and Operating Conditions was recently updated based on the assessment of future potential impacts to Chevron’s marine facilities, such as potential changes in storm intensity, changes to sea level and changing water currents.” (Chevron.CO2R1, p. 8)
“Potential climate change risks are considered when conducting risk assessments at the business unit, operating company and enterprise levels.” (Chevron.CO2R1, p. 7)
“Chevron operates in both urban areas and remote and sometimes inhospitable regions. The company’s operations are therefore subject to disruption from natural or human causes beyond its control, including physical risks from hurricanes, severe storms, floods and other forms of severe weather, war, accidents, civil unrest, political events, fires, earthquakes, system failures, cyber threats and terrorist acts, any of which could result in suspension of operations or harm to people or the natural environment. Chevron's risk management systems are designed to assess potential physical and other risks to its operations and assets and to plan for their resiliency. While capital investment reviews and decisions incorporate potential ranges of physical risks such as storm severity
109

Chevron Corporation
and frequency, sea level rise, air and water temperature, precipitation, fresh water access, wind speed, and earthquake severity, among other factors, it is difficult to predict with certainty the timing, frequency or severity of such events, any of which could have a material adverse effect on the company's results of operations or financial condition.” (Chevron.10K, p. 19)
INDICATOR 3AIII. MARKET AND OTHER INDIRECT RISKS AND OPPORTUNITIES Score: (3) Rationale: Chevron’s disclosures offer some analysis with respect to shifting
consumer behavior, and explicitly addresses recent high-profile climate litigation in which it is a defendant, but offers limited analysis of potential financial impacts on the company due to such risks.
Source(s): “The SDS reflects a view different from broadly expected future
conditions and assumes the implementation of policies creating slower growth of energy demand and a more diverse fuel mix...We tested our portfolio against the prices we projected under the IEA’s SDS. Given Chevron’s strategic focus on Upstream’s most competitive assets and its actions to align Downstream & Chemicals around integrated and higher-margin activities, our portfolio is resilient, as measured against the SDS.” (Chevron.CO2R1, p. 33)
“In order to force an oil peak demand in the next two decades, a series of critical demand-reducing factors would need to occur simultaneously, apply across the entire slate of oil products and move at an unprecedented pace. Such a confluence of events in the next two decades would represent a historic and unprecedented revolution. Although current trends warrant consistent monitoring, they also suggest that peak demand is unlikely in the near or intermediate future.” (Chevron.CO2R1, p. 14)
“Many of these activities, such as consumers’ and customers’ use of the company’s products, as well as actions taken by the company’s competitors in response to such laws and regulations, are beyond the company’s control. In addition, increasing attention to climate change risks has resulted in an increased possibility of
110

Chevron Corporation
governmental investigations and additional private litigation against the company.” (Chevron.10K, p. 21)
“Governmental and other entities in California and other jurisdictions have filed legal proceedings against fossil fuel producing companies, including Chevron, purporting to seek legal and equitable relief to address alleged impacts of climate change. Further such proceedings are likely to be filed by other parties. The unprecedented legal theories set forth in these proceedings entail the possibility of damages liability and injunctions against the production of all fossil fuels that, while we believe remote, could have a material adverse effect on the company’s results of operations and financial condition. Management believes that these proceedings are legally and factually meritless and detract from constructive efforts to address the important policy issues presented by climate change, and will vigorously defend against such proceedings.” (Chevron.10K, p. 87)
INDICATOR 3B. DELEGATION OF BOARD MEMBERS AND/OR COMMITTEES WITH EXPLICIT OVERSIGHT OF CLIMATE CHANGE POLICY Score: (1) Rationale: Though Chevron’s board maintains oversight of the company’s
strategy and has various standing committees that “consider” climate change, the company’s climate-related corporate governance lacks structure and accountability. For example, in its charter, Chevron’s Public Policy Committee is tasked with social, political and environmental trend and risk analysis, but is not explicitly given oversight of climate change-related corporate governance.
Source(s): “...the full Board already has oversight of the Company’s
strategy, including the Company’s response to climate change, and has committees that also consider climate change issues.” (Chevron.PRXY1, p. 77)
“Chevron’s governance structure includes multiple avenues for the Board of Directors and executive leadership to exercise their oversight responsibilities with respect to climate change risks, including through our Public Policy, Strategy and Planning, and
111

Chevron Corporation
Global Issues committees, each of which meets regularly throughout the year.” (Chevron.CO2R1, p. 3)
“The PPC (i.e., Public Policy Committee) assists the Board by periodically assessing and advising on risks that may arise in connection with social, political, environmental and public policy aspects of Chevron’s business. As part of this effort, the PPC considers important issues relating to climate change, such as policy trends and their potential implications. The PPC makes recommendations for anticipating and adjusting to these trends so that the company can achieve its business goals and constructively participate in the public policy dialogue. It also reviews and makes recommendations for Chevron’s strategies related to corporate responsibility and reputation management....The Audit Committee analyzes potential financial risk exposures as part of Chevron’s enterprise risk management program, including potential financial risks associated with climate change.” (Chevron.CO2R1, pp. 4-5)
“Under the oversight of the Board, Chevron’s Executive Committee is composed of executive officers of Chevron. The Enterprise Leadership Team (ELT) and Global Issues Committee (GIC) are subcommittees of the Executive Committee....The ELT receives briefings from Chevron subject matter experts on topics such as geopolitical risk, technology changes, the policy landscape, market conditions and energy transitions. It also consults outside experts to discuss climate change issues. In addition to these topical discussions, the ELT reviews carbon cost forecasts, which are incorporated into all business units’ plans and, as appropriate, their carbon management plans....The GIC receives updates from subject matter experts on an array of climate change–related issues, such as carbon policy developments around the world, political developments, technological opportunities, and stockholder and stakeholder positions. The committee also reviews competitors’ climate change–related actions to understand how our peers are responding to the risks and opportunities of climate change.” (Chevron.CO2R2, p. 5; see also Chevron.CCC1)
INDICATOR 3C. DOES THE COMPANY SUPPORT CLIMATE-RELATED SHAREHOLDER RESOLUTIONS?
112

Chevron Corporation
Score: (1) Rationale: Chevron blocked multiple climate-related shareholder resolutions put
forward by established networks of socially responsible investors during the 2018 and 2019 proxy seasons.
Source(s): “Your Board recommends a vote AGAINST this proposal
because preparing the report requested is an unnecessary and inefficient use of Chevron’s resources, is detrimental to the interests of stockholders, and would not serve the broader objective of addressing climate change risk.” (Chevron.PRXY1, p. 75)
“We hereby respectfully request that the Staff concur in our view that the Proposal (i.e., that Chevron provide a report using quantitative indicators on the company’s actions beyond regulatory requirements to minimize methane emissions, particularly leakage, from the company’s hydraulic fracturing operations) may properly be excluded from the 2018 Proxy Materials pursuant to Rule 14a-8(i)(7) because the Proposal relates to the Company’s litigation strategy.” (Chevron.TPS1, p. 20)
(see also Ceres – Climate and Sustainability Shareholder Resolutions Database; SEC – Division of Corporate Finance 2019; SEC – Division of Corporate Finance 2018)
CRITERION 4 – WHAT ARE THE COMPANY’S AFFILIATIONS WITH THIRD PARTIES THAT SPREAD DISINFORMATION ON CLIMATE SCIENCE? INDICATOR 4A. THE AMERICAN LEGISLATIVE EXCHANGE COUNCIL (ALEC) Score: (2) Rationale: Though Chevron was a “Director Level” sponsor of the 2017 ALEC
Annual Conference, it did not renew its sponsorship for the associations’ 2018 conference. Still, unlike some of its peers Chevron remains a member of ALEC, and further has not taken
113

Chevron Corporation
concrete steps to distance itself from the ALEC's climate change deception.
Source(s): (see Chevron.TPS2; see also Source Watch - ALEC; DeSmogBlog
– ALEC) INDICATOR 4B. THE AMERICAN PETROLEUM INSTITUTE (API) Score: (1) Rationale: Chevron is a current member of API and has not concretely
distanced itself from API’s climate change deception. Further, CEO Michael Wirth is currently a member of API’s board of directors and executive committee.
Source(s): “Michael K. (Mike) Wirth, 58, is chairman of the board and chief
executive officer of Chevron Corporation...He also serves on the board of directors and executive committee of the American Petroleum Institute and is a member of the National Petroleum Council, Business Roundtable, The Business Council, International Business Council of the World Economic Forum, and the American Society of Corporate Executives.” (Chevron.CWS1; see also Chevron.FPS1; API – Members; DeSmogBlog – API)
INDICATOR 4C. THE NATIONAL ASSOCIATION OF MANUFACTURERS (NAM) Score: (2) Rationale: Chevron is a current member of NAM and has not concretely
distanced itself from NAM’s climate change deception.
(see Chevron.FPS1; NAM – Board of Directors; DeSmogBlog – NAM)
INDICATOR 4D. THE WESTERN STATES PETROLEUM ASSOCIATION (WSPA) Score: (1)
114

Chevron Corporation
Rationale: Chevron is a current member of WSPA, has not concretely distanced itself from WSPA’s climate change deception. Moreover, Vice President of Americas Products for Chevron’s West and Chemicals businesses, Brant Fish, was a director at WSPA as of 2016.
Source(s): (see Chevron.FPS1; WSPA – Member Companies; DeSmogBlog –
WSPA) INDICATOR 4E. AMERICAN FUEL AND PETROCHEMICAL MANUFACTURERS (AFPM) Score: (1) Rationale: Chevron is a current member of AFPM and has not concretely
distanced itself from AFPM’s climate change deception. Further, Chevron President of Manufacturing Michael Coyle is a member of AFPM’s executive committee.
Source(s): (see Chevron.TPS3, p. 28; Chevron.FPS1; AFPM – Membership
Directory; DeSmogBlog – AFPM) CRITERION 5 – DOES THE COMPANY PUBLICLY SUPPORT THE NEED FOR CLIMATE POLICY AND REGULATIONS? INDICATOR 5A. REGULATIONS, CARBON TAX, EMISSIONS TRADING, RENEWABLE ENERGY, CCS, ETC. Score: (2) Rationale: Chevron has not expressed support for federal or state policy action
on climate change, and its public statements warn against the unintended consequences of unilateral action by any country or jurisdiction. Further, Chevron contributed $500,000 to “NO on 1631,” a campaign opposing Washington State’s Initiative 1631.
Source(s): (see Chevron.TPS4) INDICATOR 5B. PARIS AGREEMENT
115

Chevron Corporation
Score: (2) Rationale: Chevron has made a general statement of support for policies to
advance the Paris climate agreement but has not explicitly endorsed he Agreement’s global temperature goal
Source(s): “Chevron sees the Paris Agreement as a first step toward a
global framework that is generally in line with the first of Chevron’s Policy Principles for Addressing Climate Change.” (Chevron.CO2R1, p. 20)
“In line with the aims of the Paris Agreement, Chevron supports the use of metrics to address climate change, while also maintaining our ability to supply affordable, reliable, ever-cleaner energy to meet global demand. Chevron also supports well-designed market-based mechanisms as an efficient way to advance lower-carbon outcomes while protecting energy reliability and economic prosperity. But Chevron does not support establishing targets associated with the use of Chevron’s products (emissions related to the energy demand of consumers). We believe that compelling select oil and gas producers to unilaterally reduce their production or change their portfolios to align with a possible future energy mix does not advance the goals of the Paris Agreement.” (Chevron.CO2R2, p. 9)
CRITERION 6 – HAS THE COMPANY BEEN PUBLICLY TRANSPARENT ABOUT ITS POSITION, ACTIONS, AND AFFILIATIONS WITH REGARD TO CLIMATE SCIENCE AND CLIMATE CHANGE? INDICATOR 6A. WEBPAGE DEDICATED TO CLIMATE CHANGE Score: (5) Rationale: Chevron maintains a separate webpage on its website devoted to
climate change. Source(s): (see Chevron.CWS2)
116

Chevron Corporation
INDICATOR 6B. STAND-ALONE SUSTAINABILITY REPORT WITH SPECIFIC REFERENCE TO CLIMATE CHANGE Score: (5) Rationale: Chevron’s sustainability report is easily accessible through its
website and contains a section dedicated to climate change. Source(s): (see Chevron.CR, p. 8) INDICATOR 6C. DISCLOSURE TO CDP Score: (1) Rationale: CDP website indicates “declined to participate” from Chevron for
Climate Change 2018. Source(s): (see Chevron.CDP1) INDICATOR 6D. DISCLOSURE OF THIRD-PARTY RELATIONSHIPS AND LOBBYING ACTIVITIES Score: (3) Rationale: Chevron only discloses trade association memberships with annual
dues greater than $100,000. Source(s): (see Chevron.FPS1) INDICATOR 6E. REPORT ON CLIMATE RELATED RISK SCENARIOS Score: (5) Rationale: Chevron produced and published a 2°C scenario report in the
reporting period detailing specific potential impacts on the company over different time horizons.
Source(s): “Overall, current trends support our reference-case-demand views.
Nevertheless, we regularly test downside scenarios, such as the IEA’s SDS, against our baseline views. The SDS reflects a view
117

Chevron Corporation
different from broadly expected future conditions and assumes the implementation of policies creating slower growth of energy demand and a more diverse fuel mix...To test the SDS, we input its demand projections into our proprietary model of supply and commodity prices and tested our portfolio against the new price tracks generated to meet the SDS level of demand.” (Chevron.CO2R1, p. 30)
“We tested our portfolio against the prices we projected under the IEA’s SDS. Given Chevron’s strategic focus on Upstream’s most competitive assets and its actions to align Downstream & Chemicals around integrated and higher-margin activities, our portfolio is resilient, as measured against the SDS. Short-term impact (0-10 years)...Upstream: Our portfolio is diverse in maturity, geography and asset class. In the next few years, we are scheduled to complete the majority of the capital spending on a number of major capital projects, including the Kazakhstan Future Growth Project, Gorgon and Wheatstone. Although lower prices can mean less total cash flow, the Kazakhstan Future Growth Project, Gorgon and Wheatstone will generate cash even in an environment that lacks substantial price growth and will produce resources for decades to come...A diverse portfolio mitigates risk and enables us to take advantage of new opportunities that may arise from climate-induced changes in industry economics...Downstream & Chemicals: The Downstream portion of our business is resilient in the short term due to actions we have taken to increase feedstock flexibility, such as our recent investments in Richmond, California, and Singapore. We have made targeted investments to strengthen our fuels value chains in our refining and marketing business, focusing on higher-return segments, such as lubricants, additives and petrochemicals, and divesting assets that did not strategically fit our portfolio, such as refineries in the United Kingdom, New Zealand and South Africa. The sale of the latter is currently underway....” (Chevron.CO2R1, p. 33)
118

Cimarex Energy Co.
VII. Cimarex Energy Co. CRITERION 1 – WHAT IS THE COMPANY’S POSITION ON CLIMATE SCIENCE? INDICATOR 1A. CONSISTENTLY ACCURATE PUBLIC STATEMENTS ON CLIMATE SCIENCE AND THE CONSEQUENT NEED FOR SWIFT AND DEEP REDUCTIONS IN EMISSIONS FROM THE BURNING OF FOSSIL FUELS Score: (1) Rationale: Cimarex misrepresents current climate science by suggesting the
impact of GHG emissions on the earth’s climate is uncertain (e.g., its Form 10-K states “Studies have suggested that emission of certain gases, commonly referred to as greenhouse gases (“GHGs”), may be impacting the earth’s climate”) and implies an inherent tradeoff between affordable energy and climate solutions (e.g., “we have to compare the magnitude of potential negative impacts to the irreplaceable benefits of oil and gas”).
Source(s): “Studies have suggested that emission of certain gases, commonly
referred to as greenhouse gases (“GHGs”), may be impacting the earth’s climate.” (Cimarex.10K, p. 22)
“Finally, we take seriously concerns over the climate impact of oil and gas energy. It is widely accepted that human generation of greenhouse gasses has a warming effect on our climate. To make good decisions about energy, we have to compare the magnitude of potential negative impacts to the irreplaceable benefits of oil and gas—including their ability to help us adapt to an inherently dangerous climate. Affordable energy is vital for creating the infrastructure and technology needed to protect ourselves from climate dangers. It makes possible resilient buildings, air conditioning and heating, early warning systems and many other climate protection tools. Thanks to technology powered by abundant and affordable energy, especially oil and gas, we enjoy the safest climate in the history of humanity.” (Cimarex.CWS1)
119

Cimarex Energy Co.
CRITERION 2 – WHAT MEASURES IS THE COMPANY TAKING TO REDUCE ITS CARBON FOOTPRINT? INDICATOR 2A. GHG EMISSIONS TARGETS Score: (2) Rationale: Cimarex’s GHG emissions reduction plan does not include
quantitative target(s) and only calls for reducing the company’s methane emissions; thus it is neither in service of the Paris Climate Agreement nor a specific temperature goal or target.
Source(s): “We prioritized our efforts to reduce our higher emission sources and
will continue to do so in the future. Additional projects in 2017 should provide further reductions in methane emissions, and we are continuing to review and identify further enhancements we can implement at our existing facilities. We are also incorporating the information we have gathered from our reviews into the design of future production facilities, enabling us to reduce our carbon footprint on future facilities of similar size and capacity. Another area of focus has been flow-back operations following hydraulic fracturing of wells. Since 2015, Cimarex has been reducing these emissions by utilizing green completions on all flow-back operations. Green completions flow through temporary or permanent production equipment, which prevents venting directly to the atmosphere.” (Cimarex.CWS2)
“We support sensible efforts to reduce emissions. At Cimarex, we have comprehensive processes in place to mitigate emissions, improve efficiencies and contribute to long-term solutions to manage the impact of climate change and the associated operational and financial risks. With these processes in place, we expect a 20 to 25% reduction in our methane gas emissions by year-end 2018, compared to 2015 levels, despite expected increases in our oil and gas production.” (Cimarex.CWS3)
INDICATOR 2B. GHG EMISSIONS REDUCTIONS Score: (1)
120

Cimarex Energy Co.
Rationale: Cimarex’s GHG emissions intensity has increased in each of the last two reporting years.
Source(s): [see Supplemental Data] INDICATOR 2C. R&D INTO LOW-CARBON TECHNOLOGIES Score: (1) Rationale: Cimarex has not publicly committed to invest R&D into low-carbon
technologies and has not disclosed a budget dedicated to R&D into low-carbon technologies.
Source(s): INDICATOR 2D. USE OF AN INTERNAL PRICE ON CARBON Score: (1) Rationale: Cimarex does not use an internal price on carbon in investment
decisions. Source(s): CRITERION 3 – IS CLIMATE SCIENCE INTEGRAL TO THE GOVERNANCE AND OVERSIGHT OF THE COMPANY? INDICATOR 3A. DELINEATION OF RISKS AND RISK MANAGEMENT PROCEDURES RELATED TO CLIMATE CHANGE INDICATOR 3AI. REGULATORY RISKS Score: (3) Rationale: Cimarex pinpoints specific existing and proposed climate-related
regulations and laws that may affect it, but offers little detail on how the company in particular would be affected.
121

Cimarex Energy Co.
Source(s): “The U.S. Congress and various states have been evaluating, and in some cases implementing, climate-related legislation and other regulatory initiatives that restrict emissions of GHGs. In December 2009, the EPA published its findings that emissions of GHGs present an endangerment to public health and the environment because emissions of such gases are contributing to the warming of the earth’s atmosphere and other climatic changes. Based on these findings, the EPA adopted regulations under existing provisions of the Federal Clean Air Act that establish Prevention of Significant Deterioration (“PSD”) and Title V permit reviews for GHG emissions from certain large stationary sources. Facilities required to obtain PSD and/or Title V permits under EPA’s GHG Tailoring Rule for their GHG emissions also may be required to meet “Best Available Control Technology” standards that will be established by the states or, in some cases, by the EPA on a case-by-case basis. The EPA has also adopted rules requiring the monitoring and reporting of GHG emissions from specified sources in the United States, including, among others, certain oil and gas production facilities on an annual basis, which includes certain of our operations. In recent proposed rulemaking, EPA is widening the scope of annual GHG reporting to include not only activities associated with completion and workover of gas wells with hydraulic fracturing and activities associated with oil and gas production operations, but also completions and workovers of oil wells with hydraulic fracturing, gathering and boosting systems, and transmission pipelines. While Congress has from time to time considered legislation to reduce emissions of GHGs, there has not been significant activity in the form of adopted legislation to reduce GHG emissions at the federal level in recent years. In the absence of such federal climate legislation, a number of state and regional efforts have emerged that are aimed at tracking and/or reducing GHG emissions by means of cap and trade programs that typically require major sources of GHG emissions, such as electric power plants, to acquire and surrender emission allowances in return for emitting those GHGs. In January 2015, President Obama announced a series of administration actions to reduce methane emissions, including rulemaking by the EPA and the BLM as well as updating of standards by the Department of Transportation’s Pipeline and Hazardous Materials Administration. The previous administration intended to promulgate proposed climate change
122

Cimarex Energy Co.
rulemaking aimed at reducing GHG emissions by 45% by 2025 compared to 2012 levels. These proposals target both new and existing sources. On January 22, 2016, the Department of the Interior announced its proposed emissions mandate on oil and gas producers who operate on federal and Indian lands. While this rule was finalized in November of 2016, it is currently being challenged by several states and industry. While we expect new legislation and regulations to increase the cost of business, at this time it is not possible to quantify the impact on our business. Any such future laws and final regulations that require reporting of GHGs or otherwise limit emissions of GHGs from our equipment and operations could require us to incur costs to develop and implement best management practices aimed at reducing GHG emissions, install and maintain emissions control technologies, as well as monitor and report on GHG emissions associated with our operations, which would increase our operating costs, and such requirements also could adversely affect demand for the oil and gas that we produce.” (Cimarex.10K, p. 22)
INDICATOR 3AII. PHYSICAL RISKS Score: (3) Rationale: Cimarex’s disclosures acknowledge the physical risks facing the
company and include a discussion of climate change as a contributor to those risks, but offer few or no details about the nature of those risks, their magnitude, or how they may impact the company in particular.
Source(s): “Potential physical risks resulting from climate change may be
event driven (including increased severity of extreme weather events, such as hurricanes or floods) or longer-term shifts in climate patterns that may cause sea level rise or chronic heat waves. Potential physical risks may cause direct damage to assets and indirect impacts such as supply chain disruption. Potential physical risks also include changes in water availability, sourcing, and quality, which could impact drilling and completions operations. These physical risks could cause increased costs, production disruptions, and lower revenues.” (Cimarex.10K, p. 24)
123

Cimarex Energy Co.
INDICATOR 3AIII. MARKET AND OTHER INDIRECT RISKS AND OPPORTUNITIES
Score: (3)
Rationale: Cimarex provides some detail and examples of how it might be affected by market and other indirect risks and opportunities related to climate change, but provides limited analysis of their potential financial impacts for the company.
Source(s): “Technology Risk. Technological improvements or innovations that support the transition to a lower-carbon, more energy efficient economic system may have a significant impact on Cimarex. The development and use of emerging technologies such as renewable energy, battery storage, and energy efficiency may lower demand for oil and gas, resulting in lower prices and revenues, and increase our costs...Market Risk. Markets could be affected by climate change through shifts in supply and demand for certain commodities, especially carbon-intensive commodities such as oil and gas and other products dependent on oil and gas, as climate-related risks and opportunities are increasingly taken into account. This could lower demand for our oil and gas production, resulting in lower prices and lower revenues. Market risk also may take the form of limited access to capital as investors shift investments to less carbon-intensive industries and alternative energy industries. In addition, there have also been efforts in recent years to influence the investment community, including investment advisers and certain sovereign wealth, pension, and endowment funds promoting divestment of fossil fuel equities and pressuring lenders to limit funding to companies engaged in the extraction of fossil fuel reserves. Such environmental activism and initiatives aimed at limiting climate change and reducing air pollution could interfere with our business activities, operations, and ability to access capital. Furthermore, claims have been made against certain energy companies alleging that GHG emissions from oil, NGL, and gas operations constitute a public nuisance under federal and/or state common law. As a result, private individuals or public entities may seek to enforce environmental laws and regulations against us and could allege personal injury, property damages, or other liabilities. While we are currently not a party to any such litigation, we could be named in
124

Cimarex Energy Co.
actions making similar allegations. An unfavorable ruling in any such case could significantly impact our operations and could have an adverse impact on our financial condition...Reputation Risk. Climate change has been identified as a potential source of reputational risk tied to changing customer or community perceptions of an organization’s contribution to or detraction from the transition to a lower-carbon economy. This could lower demand for our oil and gas production, resulting in lower prices and lower revenues as consumers avoid carbon-intensive industries. This may also put pressure on investment managers to shift investments to less carbon-intensive industries and alternative energy industries, limiting our access to capital.” (Cimarex.10K, p. 23)
INDICATOR 3B. DELEGATION OF BOARD MEMBERS AND/OR COMMITTEES WITH EXPLICIT OVERSIGHT OF CLIMATE CHANGE POLICY Score: (1) Rationale: Cimarex has no board member or committee dedicated to climate
change-related corporate governance Source(s): INDICATOR 3C. DOES THE COMPANY SUPPORT CLIMATE-RELATED SHAREHOLDER RESOLUTIONS? Score: (3) Rationale: Cimarex has not faced any climate-related shareholder resolutions
put forward by established networks of socially responsible investors (e.g. As You Sow, Australian Coalition for Corporate Responsibility, Climate Action 100+, Follow This, the Interfaith Center on Corporate Responsibility).
Source(s): (see Ceres – Climate and Sustainability Shareholder Resolutions
Database; SEC – Division of Corporate Finance 2019; SEC – Division of Corporate Finance 2018)
125

Cimarex Energy Co.
CRITERION 4 – WHAT ARE THE COMPANY’S AFFILIATIONS WITH THIRD PARTIES THAT SPREAD DISINFORMATION ON CLIMATE SCIENCE? INDICATOR 4A. THE AMERICAN LEGISLATIVE EXCHANGE COUNCIL (ALEC) Score: (3) Rationale: Information is unavailable to determine Cimarex’s affiliation with the
association or group. Source(s): (see Source Watch - ALEC; DeSmogBlog – ALEC) INDICATOR 4B. THE AMERICAN PETROLEUM INSTITUTE (API) Score: (2) Rationale: Cimarex is listed as a corporate member on API’s webpage. Source(s): (see API – Members; DeSmogBlog – API) INDICATOR 4C. THE NATIONAL ASSOCIATION OF MANUFACTURERS (NAM) Score: (3) Rationale: Information is unavailable to determine Cimarex’s affiliation with the
association or group. Source(s): (see NAM – Board of Directors; DeSmogBlog – NAM) INDICATOR 4D. THE WESTERN STATES PETROLEUM ASSOCIATION (WSPA) Score: N/A Rationale: Cimarex is based in Colorado and has no existing operations in the
association’s relevant jurisdiction.
126

Cimarex Energy Co.
Source(s): (see WSPA – Member Companies; DeSmogBlog – WSPA) INDICATOR 4E. AMERICAN FUEL AND PETROCHEMICAL MANUFACTURERS (AFPM) Score: (3) Rationale: Information is unavailable to determine Cimarex’s affiliation with the
association or group. Source(s): (see AFPM – Membership Directory; DeSmogBlog – AFPM) CRITERION 5 – DOES THE COMPANY PUBLICLY SUPPORT THE NEED FOR CLIMATE POLICY AND REGULATIONS? INDICATOR 5A. REGULATIONS, CARBON TAX, EMISSIONS TRADING, RENEWABLE ENERGY, CCS, ETC. Score: (2) Rationale: Cimarex has not publicly expressed support for climate policies and
regulations during the reporting period. Source(s): INDICATOR 5B. PARIS AGREEMENT Score: (1) Rationale: Cimarex makes no reference to the Paris Climate Agreement on its
website, Form 10-K or other public disclosures. Source(s):
127
Cimarex Energy Co.
CRITERION 6 – HAS THE COMPANY BEEN PUBLICLY TRANSPARENT ABOUT ITS POSITION, ACTIONS, AND AFFILIATIONS WITH REGARD TO CLIMATE SCIENCE AND CLIMATE CHANGE? INDICATOR 6A. WEBPAGE DEDICATED TO CLIMATE CHANGE Score: (1) Rationale: Cimarex maintains a webpage entitled “Air Quality,” but there is no
mention of climate change. Source(s): (see Cimarex.CWS4) INDICATOR 6B. STAND-ALONE SUSTAINABILITY REPORT WITH SPECIFIC REFERENCE TO CLIMATE CHANGE Score: (1) Rationale: Cimarex does not produce a CSR or Sustainability report. Source(s): INDICATOR 6C. DISCLOSURE TO CDP Score: (1) Rationale: CDP website indicates “Declined to participate” from Cimarex for
Climate Change 2018. Source(s): (see Cimarex.CDP1) INDICATOR 6D. DISCLOSURE OF THIRD-PARTY RELATIONSHIPS AND LOBBYING ACTIVITIES Score: (1) Rationale: Cimarex does not disclose affiliations with or payments to trade
associations or lobbying groups on its website or public filings
128

Cimarex Energy Co.
Source(s): INDICATOR 6E. REPORT ON CLIMATE RELATED RISK SCENARIOS Score: (1) Rationale: Cimarex has not produced a 2°C report Source(s):
129

Concho Resources
VIII. Concho Resources CRITERION 1 – WHAT IS THE COMPANY’S POSITION ON CLIMATE SCIENCE? INDICATOR 1A. CONSISTENTLY ACCURATE PUBLIC STATEMENTS ON CLIMATE SCIENCE AND THE CONSEQUENT NEED FOR SWIFT AND DEEP REDUCTIONS IN EMISSIONS FROM THE BURNING OF FOSSIL FUELS Score: (1) Rationale: Concho misrepresents current climate science in its Form 10-K by
noting that “...some scientists have concluded that increasing concentrations of GHGs in the earth’s atmosphere may produce climate changes.”
Source(s): “It should also be noted that some scientists have concluded that
increasing concentrations of GHGs in the earth’s atmosphere may produce climate changes that have significant physical effects, such as increased frequency and severity of storms, droughts, and floods and other climatic events.” (Concho.10K, p. 7)
CRITERION 2 – WHAT MEASURES IS THE COMPANY TAKING TO REDUCE ITS CARBON FOOTPRINT? INDICATOR 2A. GHG EMISSIONS TARGETS Score: (1) Rationale: Concho has invested money in emissions reduction activities, but
there is no indication that the company has a plan or the initiative to reduce its GHG emissions.
Source(s): “Concho seeks to minimize greenhouse gas (GHG) and other
emissions from our operations and efforts to reduce emissions are underway throughout our operations. In order to capture and retain as much gas as possible we have installed emission control and gas capture equipment across our operations. We have
131

Concho Resources
invested heavily in emission control equipment for vapor recovery, closed vent systems, custody transfer units, combustors and flares. These investments have reduced methane and volatile organic compounds (VOC) emissions associated with crude oil production and storage at our facilities. Additional emissions reduction investments are made incrementally as new facilities are brought online.” (Concho.CWS1)
INDICATOR 2B. GHG EMISSIONS REDUCTIONS Score: (3) Rationale: Concho’s GHG emissions intensity has increased in one of the last
two reporting years but decreased as a whole over the last two reporting years.
Source(s): [see Supplemental Data] INDICATOR 2C. R&D INTO LOW-CARBON TECHNOLOGIES Score: (1) Rationale: Concho has not publicly committed to invest R&D into low-carbon
technologies and has not disclosed a budget dedicated to R&D into low-carbon technologies.
Source(s): INDICATOR 2D. USE OF AN INTERNAL PRICE ON CARBON Score: (1) Rationale: Concho does not use an internal price on carbon in investment
decisions. Source(s):
132

Concho Resources
CRITERION 3 – IS CLIMATE SCIENCE INTEGRAL TO THE GOVERNANCE AND OVERSIGHT OF THE COMPANY? INDICATOR 3A. DELINEATION OF RISKS AND RISK MANAGEMENT PROCEDURES RELATED TO CLIMATE CHANGE INDICATOR 3AI. REGULATORY RISKS Score: (3) Rationale: Concho pinpoints specific existing climate-related laws and
regulations that may affect it but does not detail how the company in particular would be affected.
Source(s): “In response to findings that emissions of carbon dioxide, methane
and other “greenhouse gases” (“GHGs”) present an endangerment to public health and the environment, the EPA has issued regulations to restrict emissions of GHGs under existing provisions of the CAA. These regulations include limits on tailpipe emissions from motor vehicles and preconstruction and operating permit requirements for certain large stationary sources. The EPA has also adopted rules requiring the reporting of GHG emissions from specified large GHG emission sources in the United States, as well as certain onshore oil and natural gas production facilities, on an annual basis, including GHG emissions resulting from the completion and workover operations of hydraulically fractured oil wells. Recent federal regulatory action with respect to climate change has focused on methane emissions. As noted above, both the EPA and the BLM finalized rules in 2016 that limit methane emissions from upstream oil and natural gas exploration and production operations. Increased regulation of methane and other GHGs have the potential to result in increased compliance costs and, consequently, adversely affect our operations. The adoption of legislation or regulatory programs to reduce emissions of GHGs could require us to incur increased operating costs, such as costs to purchase and operate emissions control systems, to acquire emissions allowances, or to comply with new regulatory or reporting requirements. Any such legislation or regulatory programs could also increase the cost of consuming, and thereby reduce
133

Concho Resources
demand for, the oil and natural gas we produce. Reduced demand for the oil and natural gas that we produce could also have the effect of lowering the value of our reserves. Consequently, legislation and regulatory programs to reduce emissions of GHGs could have an adverse effect on our business, financial condition and results of operations.” (Concho.10K, p. 11)
INDICATOR 3AII. PHYSICAL RISKS Score: (3) Rationale: Concho’s misrepresentation of current climate science aside, the
company generally acknowledges the physical risks facing its operations (e.g., severe weather) and includes discussion of climate change as a contributor to those risks.
Source(s): “It should also be noted that some scientists have concluded that
increasing concentrations of GHGs in the earth’s atmosphere may produce climate changes that have significant physical effects, such as increased frequency and severity of storms, droughts, and floods and other climatic events. If any such effects were to occur, they could have an adverse effect on our financial condition and results of operations.” (Concho.10K, p. 11)
INDICATOR 3AIII. MARKET AND OTHER INDIRECT RISKS AND OPPORTUNITIES Score: (2) Rationale: Concho notes that climate change-related legislation and/or
regulations restricting emissions of GHGs may reduce demand for oil and natural gas, offers some commentary on potential financing challenges and briefly discusses the potential for climate-related litigation, but offers limited analysis on potential impacts on the company in particular.
Source(s): “The adoption of legislation or regulatory programs to reduce
emissions of GHGs could require us to incur increased operating costs, such as costs to purchase and operate emissions control
134

Concho Resources
systems, to acquire emissions allowances, or to comply with new regulatory or reporting requirements. Any such legislation or regulatory programs could also increase the cost of consuming, and thereby reduce demand for, the oil and natural gas we produce. Reduced demand for the oil and natural gas that we produce could also have the effect of lowering the value of our reserves. Consequently, legislation and regulatory programs to reduce emissions of GHGs could have an adverse effect on our business, financial condition and results of operations.” (Concho.10K, p. 11)
“...there have also been efforts in recent years to influence the investment community, including investment advisors and certain sovereign wealth, pension and endowment funds promoting divestment of fossil fuel equities and pressuring lenders to limit funding to companies engaged in the extraction of fossil fuel reserves. Such environmental activism and initiatives aimed at limiting climate change and reducing air pollution could interfere with our business activities, operations and ability to access capital. Finally, increasing attention to the risks of climate change has resulted in an increased possibility of lawsuits or investigations brought by public and private entities against oil and natural gas companies in connection with their GHG emissions. Should we be targeted by any such litigation or investigations, we may incur liability, which, to the extent that societal pressures or political or other factors are involved, could be imposed without regard to the causation of or contribution to the asserted damage, or to other mitigating factors. The ultimate impact of GHG emissions-related agreements, legislation and measures on our company’s financial performance is highly uncertain because the Company is unable to predict with certainty, for a multitude of individual jurisdictions, the outcome of political decision-making processes and the variables and tradeoffs that inevitably occur in connection with such processes.” (Concho.10K, p. 21)
INDICATOR 3B. DELEGATION OF BOARD MEMBERS AND/OR COMMITTEES WITH EXPLICIT OVERSIGHT OF CLIMATE CHANGE POLICY
Score: (1)
135

Concho Resources
Rationale: Concho has no board member or committee dedicated to climate change-related corporate governance. Note that the charter of Concho’s board-level Health, Safety, Environment and Reserves Committee, which was amended after the reporting period for this study, still remains void of any reference to climate change.
Source(s): (see Concho.CCC1) INDICATOR 3C. DOES THE COMPANY SUPPORT CLIMATE-RELATED SHAREHOLDER RESOLUTIONS? Score: (4) Rationale: Concho has made a commitment to NYS CRF to implement request
to produce a 2 degree scenario report. Source(s): (see Ceres – Climate and Sustainability Shareholder Resolutions
Database; SEC – Division of Corporate Finance 2019; SEC – Division of Corporate Finance 2018)
CRITERION 4 – WHAT ARE THE COMPANY’S AFFILIATIONS WITH THIRD PARTIES THAT SPREAD DISINFORMATION ON CLIMATE SCIENCE? INDICATOR 4A. THE AMERICAN LEGISLATIVE EXCHANGE COUNCIL (ALEC) Score: (3) Rationale: Information is unavailable to determine Concho’s affiliation with
ALEC. Source(s): (see Source Watch - ALEC; DeSmogBlog – ALEC) INDICATOR 4B. THE AMERICAN PETROLEUM INSTITUTE (API) Score: (3) Rationale: Concho is not mentioned by DeSmogBlog as having ever been
affiliated with API, nor is the company listed as a corporate member on the association's website.
136

Concho Resources
Source(s): (see API – Members; DeSmogBlog – API) INDICATOR 4C. THE NATIONAL ASSOCIATION OF MANUFACTURERS (NAM) Score: (3) Rationale: Information is unavailable to determine Concho’s affiliation with the
association or group. Source(s): (see NAM – Board of Directors; DeSmogBlog – NAM) INDICATOR 4D. THE WESTERN STATES PETROLEUM ASSOCIATION (WSPA) Score: N/A Rationale: Concho is based in Texas and has no operations in the association’s
jurisdiction. Source(s): (see WSPA – Member Companies; DeSmogBlog – WSPA) INDICATOR 4E. AMERICAN FUEL AND PETROCHEMICAL MANUFACTURERS (AFPM) Score: (3) Rationale: Information is unavailable to determine Concho’s affiliation with the
association or group. Source(s): (see AFPM – Membership Directory; DeSmogBlog – AFPM) CRITERION 5 – DOES THE COMPANY PUBLICLY SUPPORT THE NEED FOR CLIMATE POLICY AND REGULATIONS? INDICATOR 5A. REGULATIONS, CARBON TAX, EMISSIONS TRADING, RENEWABLE ENERGY, CCS, ETC.
137

Concho Resources
Score: (2) Rationale: Concho has not publicly expressed support for climate policies and
regulations during the reporting period. While the company does mention climate policy and regulations in its Form 10-K, it is only in the context of regulatory risk.
Source(s): “The adoption of legislation or regulatory programs to reduce
emissions of GHGs could require us to incur increased operating costs, such as costs to purchase and operate emissions control systems, to acquire emissions allowances, or to comply with new regulatory or reporting requirements. Any such legislation or regulatory programs could also increase the cost of consuming, and thereby reduce demand for, the oil and natural gas we produce. Reduced demand for the oil and natural gas that we produce could also have the effect of lowering the value of our reserves. Consequently, legislation and regulatory programs to reduce emissions of GHGs could have an adverse effect on our business, financial condition and results of operations.” (Concho.10K, p. 11)
INDICATOR 5B. PARIS AGREEMENT Score: (1) Rationale: Concho mentions the Paris Agreement in its Form 10K in the context
of potential regulations, but offers no statement of support for policies or regulations that advance the Agreement
Source(s): “…in 2015, the United States participated in the United Nations
Conference on Climate Change, which led to the creation of the Paris Agreement. The Paris Agreement requires countries to review and “represent a progression” in their intended nationally determined contributions, which set GHG emission reduction goals, every five years beginning in 2020. However, in June 2017, President Trump announced that the United States plans to withdraw from the Paris Agreement and seek negotiations either to reenter the Paris Agreement on different terms or establish a new framework agreement. The Paris Agreement provides for a four-year exit
138

Concho Resources
process beginning in November 2016, which would result in an effective exit date of November 2020. The United States’ adherence to the exit process or the terms on which the United States may reenter the Paris Agreement or a separately negotiated agreement are unclear at this time.” (Concho.10K, p. 11)
CRITERION 6 – HAS THE COMPANY BEEN PUBLICLY TRANSPARENT ABOUT ITS POSITION, ACTIONS, AND AFFILIATIONS WITH REGARD TO CLIMATE SCIENCE AND CLIMATE CHANGE? INDICATOR 6A. WEBPAGE DEDICATED TO CLIMATE CHANGE Score: (1) Rationale: Concho’s website contains a page dedicated to “Air Quality” but that
page makes no reference to climate change. Source(s): (see Concho.CWS1) INDICATOR 6B. STAND-ALONE SUSTAINABILITY REPORT WITH SPECIFIC REFERENCE TO CLIMATE CHANGE Score: (1) Rationale: Concho did not produce a corporate responsibility, CSR, or
sustainability report during the reporting period. Source(s): INDICATOR 6C. DISCLOSURE TO CDP Score: (1) Rationale: Concho did not respond to the CDP’s Climate Change 2018
questionnaire. Source(s): (see Concho.CDP1)
139

Concho Resources
INDICATOR 6D. DISCLOSURE OF THIRD-PARTY RELATIONSHIPS AND LOBBYING ACTIVITIES Score: (1) Rationale: Concho does not disclose payments to trade associations or
lobbying groups in its public disclosures. Source(s): INDICATOR 6E. REPORT ON CLIMATE RELATED RISK SCENARIOS Score: (1) Rationale: Concho did not produce 2°C scenario report during the reporting
period. Source(s):
140

ConocoPhillips
IX. ConocoPhillips CRITERION 1 – WHAT IS THE COMPANY’S POSITION ON CLIMATE SCIENCE? INDICATOR 1A. CONSISTENTLY ACCURATE PUBLIC STATEMENTS ON CLIMATE SCIENCE AND THE CONSEQUENT NEED FOR SWIFT AND DEEP REDUCTIONS IN EMISSIONS FROM THE BURNING OF FOSSIL FUELS Score: (1) Rationale: ConocoPhillips misrepresents current scientific consensus on
climate change with subtle questioning language (e.g., “while uncertainties remain”). Further, ConocoPhillips creates a false choice by stating that efforts to combat climate change should be balanced with the need for reliable and affordable energy that supports social and economic development.
Source(s): “ConocoPhillips recognizes that human activity, including the burning
of fossil fuels, is contributing to increased concentrations of greenhouse gases (GHG) in the atmosphere that can lead to adverse changes in global climate....While uncertainties remain, we continue to manage greenhouse gas emissions in our operations and to integrate climate change related activities and goals into our business planning.” (ConocoPhillips.CWS1)
“Building balanced energy policies is challenging, and we recognize that no one has all the answers. As economies around the world continue to develop, fossil fuels will play an important role in meeting the growing global demand for energy. Meeting the challenge of taking action on climate change while providing adequate, affordable supplies of reliable energy will require financial investments, skilled people, technical innovation and responsible stewardship from policy makers, energy producers and consumers. We are committed to doing our part.” (ConocoPhillips.CWS1)
CRITERION 2 – WHAT MEASURES IS THE COMPANY TAKING TO REDUCE ITS CARBON FOOTPRINT?
141

ConocoPhillips
INDICATOR 2A. GHG EMISSIONS TARGETS Score: (2) Rationale: ConocoPhillips has a company-wide climate change action plan for
reducing its GHG emissions intensity, but that plan is not in the service of a specific temperature goal or target.
Source(s): In 2017, in accordance with our strategy, we set a public long-term
GHG emissions target based on the architecture of the Paris Agreement, with an aspiration to become a leader in GHG climate-related risk management.” (ConocoPhillips.CO2R1, p. 26)
“We have a long-term target to reduce our GHG emissions intensity from five to 15 percent by 2030 from a Jan. 1, 2017 baseline. The target will support innovation on efficiency and emissions reduction, GHG regulatory risk mitigation and climate-related risk management throughout the lifecycles of our assets. There are similarities in how we framed this target and the framing of the Paris Agreement. The Paris process uses “Nationally Determined Contributions” (NDCs) to set interim performance targets that are reviewed on a five- year basis to move toward achieving the agreement’s objective. We intend to review and adjust our performance target in a similar way. Our performance will be based on gross operated GHG emissions, stated in carbon dioxide-equivalent terms, divided by our gross operated production, stated in barrels of oil equivalent. The target is set in relation to our Scope 1 emissions and Scope 2 gross operated emissions as these are the emissions over which we have the most control. The target covers all GHGs, but in practice will likely apply to carbon dioxide and methane emissions as our emissions of other greenhouse gases are not material. The target informs climate goals at the business level. We intend to report our progress against the target on an annual, calendar-year basis.” (ConocoPhillips.CO2R1, p. 34; see also ConocoPhillips.CO2R2, p. 47)
“Since 2009, we have carried out discretionary projects that have reduced our annual GHG emissions by almost 7 million tonnes
142

ConocoPhillips
CO2e compared to business as usual.” (ConocoPhillips.CO2R1, p. 32)
“Our GHG intensity target does not cover Scope 3 emissions. As an exploration and pro- duction company with no downstream assets we have no control over how the raw materials we produce are transformed into other products or consumed. We do, however, calculate our Scope 3 emissions annually based on net equity production numbers.” (ConocoPhillips.CO2R1, p. 33)
INDICATOR 2B. GHG EMISSIONS REDUCTIONS Score: (3) Rationale: ConocoPhillips’ GHG emissions intensity has increased in one of the
last two reporting years but decreased as a whole over the last two reporting years.
Source(s): [see Supplemental Data] INDICATOR 2C. R&D INTO LOW-CARBON TECHNOLOGIES Score: (2) Rationale: Much of the low-carbon R&D ConocoPhillips cites relates to its
operations in the oil sands, and the company’s discussion is largely anecdotal. Further, ConocoPhillips does not provide a breakdown of specific low-carbon investments and the company’s overall R&D budget decreased compared to the last reporting year.
Source(s): “Technology will play a major role in addressing GHG emissions,
whether through reducing fugitive emissions or lowering the energy intensity of our operations or value chain. In Canada we are sponsoring an XPRIZE to support development of innovative ways to reuse carbon associated with steam generation in the oil sands. Our annual MACC process identifies and prioritizes our emissions-reduction opportunities from operations based on the cost per tonne of carbon dioxide equivalent abated. This data helps identify projects that might become viable in the future through further research, development and deployment. As a result of this
143

ConocoPhillips
work, we have focused our near-term technology investments on reducing both costs and emissions where feasible, such as improving the steam-to-oil ratio in the oil sands. One new research and development effort is the non-condensable gas co-injection pilot program to reduce the energy required in oil extraction.” (ConocoPhillips.CO2R1, p. 19)
“While uncertainties remain, we continue to manage greenhouse gas emissions in our operations and to integrate climate change related activities and goals into our business planning. Our corporate action plan focuses on the following areas...Leveraging technology innovation to explore new business opportunities.” (ConocoPhillips.SR, p. 107)
INDICATOR 2D. USE OF AN INTERNAL PRICE ON CARBON Score: (3) Rationale: ConocoPhillips discloses its internal price on carbon for investment
decisions in countries without existing carbon pricing regulations, but only utilizes this price for projects of significant cost and environmental impact. Absent regulation, ConocoPhillips does not use carbon pricing to evaluate smaller projects. Further, it is unclear what price of carbon, if any, the company uses in “climate-related risk assessments,” or whether this assessment is substantially different from the sensitivity analysis the company uses for projects of greater cost and potential environmental impact.
Source(s): “…in countries without existing or imminent GHG regulation, all
capital projects with a cost of $150 million or greater, or which result in a change to annual emissions in excess of 25,000 metric tons of CO2 equivalent, are required to perform a sensitivity analysis that includes carbon cost as part of the project’s economic analysis.” (ConocoPhillips.CWS2)
“The company uses a range of estimated future costs of GHG emissions for internal planning purposes, including an estimate of $40 per metric tonne applied beginning in the year 2024 as a sensitivity to evaluate certain future projects and opportunities. The company does not use an estimated market cost of GHG
144

ConocoPhillips
emissions when assessing reserves in jurisdictions without existing GHG regulations.” (ConocoPhillips.CO2R1, p. 31)
“The company uses a range of estimated future costs of GHG emissions for internal planning purposes, including an estimated market cost of GHG emissions of $40 per metric tonne applied beginning in the year 2024 to evaluate certain future projects and opportunities. The company does not use an estimated market cost of GHG emissions when assessing reserves in jurisdictions without existing GHG regulations.” (ConocoPhillips.10K, p. 69)
“A climate-related risk assessment is conducted on any project that costs more than $50 million net and is expected to emit more than 25,000 metric tons CO2 equivalent (CO2(e)) net to ConocoPhillips during any year of its lifespan. This assessment is mandatory for investment approval. Project teams for qualifying projects are required to assess the potential risks and opportunities associated with GHG emissions, GHG regulation and a physically changing climate. The climate risk assessment guideline provides a framework for project teams to...Evaluate the potential cost of GHG emissions in project economics.” (ConocoPhillips.CO2R1, p. 31)
CRITERION 3 – IS CLIMATE SCIENCE INTEGRAL TO THE GOVERNANCE AND OVERSIGHT OF THE COMPANY? INDICATOR 3A. DELINEATION OF RISKS AND RISK MANAGEMENT PROCEDURES RELATED TO CLIMATE CHANGE INDICATOR 3AI. REGULATORY RISKS Score: (4) Rationale: ConocoPhillips offers a detailed analysis of existing and proposed
climate-related laws and regulations, including their potential impacts on the company and the company’s current mitigation efforts.
145
ConocoPhillips
Source(s): “Our business is subject to numerous laws and regulations relating to the protection of the environment, which are expected to continue to have an increasing impact on our operations in the United States and in other countries in which we operate.” (ConocoPhillips.10K, p. 23)
“Regulations to address climate-related risk, including GHG emissions, are a short-term risk for several of our businesses. For example, regulations issued by the Alberta government in 2007 under the Climate Change and Emissions Act require any existing facility with emissions equal to or greater than 100,000 metric tons of carbon dioxide or equivalent per year to reduce the net emissions intensity, with reduction increases over time. The cost of compliance and investment in emissions-intensity reduction technologies influence investment decisions for the Canada business unit. We are purchasing carbon offsets while evaluating and developing technology opportunities to reduce emissions for existing and new facilities. A good example of technology development is our piloting of flow control devices at our oil sand operations, which have improved steam-to-oil ratios by up to 15%, thereby decreasing GHG intensity. GHG or carbon taxes are another near-term risk in some jurisdictions where we operate. For example, in our Norway business unit, we are managing the risk with specific actions to study emissions reduction opportunities and we also evaluate project economics with full CO2 tax and European Union emissions allowance costs.” (ConocoPhillips.CO2R2, p. 19)
“Our mediumterm time horizon is six to 10 years, during which we can complete most major projects and revise our portfolio significantly if required....Offset requirements have been identified as both a mediumterm risk and as an opportunity for some business units. For example, the Clean Energy Regulator in Australia has established the Emissions Reduction Fund for the sale and purchase of offsets. Since 2006, Darwin LNG has supported the West Arnhem Land Fire Abatement (WALFA) carbon offset program. Through this project, indigenous rangers in West Arnhem Land in the Northern Territory have offset almost two million tonnes of CO2e that would have resulted from wildfires by utilizing early dry-season preventive burning. In 2014, the WALFA project was formally recognized as an eligible offset program under the
146
ConocoPhillips
Australian federal government’s Carbon Farming Initiative. During Emissions Reduction Fund abatement auctions, savannah- burning projects from across Australia have been successful in selling contracts for carbon abatement — all using the methodology pioneered by WALFA.” (ConocoPhillips.CO2R2, p. 19)
“European Emissions Trading Scheme (ETS), the program through which many of the European Union (EU) member states are implementing the Kyoto Protocol. Our cost of compliance with the EU ETS in 2018 was approximately $5.6 million (net share before-tax)...The Alberta Carbon Competitiveness Incentive Regulation (CCIR) requires any existing facility with emissions equal to or greater than 100,000 metric tonnes of carbon dioxide, or equivalent, per year to meet an industry benchmark intensity. The total cost of these regulations in 2018 was approximately $4 million...The U.S. EPA’s announcement on March 29, 2010 (published as “Interpretation of Regulations that Determine Pollutants Covered by Clean Air Act Permitting Programs,” 75 Fed. Reg. 17004 (April 2, 2010)), and the EPA’s and U.S. Department of Transportation’s joint promulgation of a Final Rule on April 1, 2010, that triggers regulation of GHGs under the Clean Air Act, may trigger more climate-based claims for damages, and may result in longer agency review time for development projects... While the United States announced its intention to withdraw from the Paris Agreement, there is no guarantee that the commitments made by the United States will not be implemented, in whole or in part, by U.S. state and local governments or by major corporations headquartered in the United States. In addition, our operations continue in countries around the world which are party to, and have not announced an intent to withdraw from, the Paris Agreement. The implementation of current agreements and regulatory measures, as well as any future agreements or measures addressing climate change and greenhouse gas emissions, may adversely impact the demand for our products, impose taxes on our products or operations or require us to purchase emission credits or reduce emission of greenhouse gases from our operations. As a result, we may experience declines in commodity prices or incur substantial capital expenditures and compliance, operating, maintenance and remediation costs, any of which may have an adverse effect
147

ConocoPhillips
on our business and results of operations.” (ConocoPhillips.10K, p. 68)
INDICATOR 3AII. PHYSICAL RISKS Score: (4) Rationale: ConocoPhillips notes the physical risks to specific facilities and areas
of operation from climate change, as well as potential duration and the company’s mitigation options.
Source(s): “Physical climate risk is a long-term risk for our business. In
some parts of the U.S. we have identified potential storm severity as a risk for future operations, based on previous storms and flooding. Science suggests that future extreme weather events may become more intense or more frequent, thus placing at risk our operations in coastal regions and areas susceptible to typhoons or hurricanes.” (ConocoPhillips.CO2R2, p. 20)
“The costs associated with interrupted operations will depend on the duration and severity of any physical event and the damage and remedial work to be carried out. Financial implications could include business interruption, damage or loss of production uptime and delayed access to resources and markets. For example, a three-day shutdown of all U.S. Gulf Coast production would cause $18.5 million in lost revenue, based on the 2017 average realized price of $39.19 per barrel of oil equivalent (BOE). It is likely that not all our area production would be affected, as assets further inland are less susceptible to hurricanes than assets in the Gulf of Mexico...Chronic physical changes are a medium-term risk for some of our operations. Temperature extremes could impact facilities located in Arctic regions if warmer temperatures reduce the length of the ice road season and restrict well and facility construction times. Mitigation measures could include utilizing gravel road connections to reduce reliance on ice roads, pre-packing to extend the start of ice road season and constructing roads that prevent permafrost thawing.” (ConocoPhillips.CO2R1, p. 16-19; see also ConocoPhillips.CO2R2, pp. 19, 23)
148
ConocoPhillips
“...although our business operations are designed and operated to accommodate expected climatic conditions, to the extent there are significant changes in the earth’s climate, such as more severe or frequent weather conditions in the markets where we operate or the areas where our assets reside, we could incur increased expenses, our operations could be adversely impacted, and demand for our products could fall.” (ConocoPhillips.10K, p. 24)
INDICATOR 3AIII. MARKET AND OTHER INDIRECT RISKS AND OPPORTUNITIES Score: (3) Rationale: ConocoPhillips provides some detail as to indirect risks the company
faces (e.g., availability of capital, development of new technologies, energy conservation and reduced demand for fossil fuels) and acknowledges various climate liability lawsuits in which it is named as a defendant, but the company’s analysis lacks detail.
Source(s): “Furthermore, increasing attention to global climate change has
resulted in an increased likelihood of governmental investigations and private litigation, which could increase our costs or otherwise adversely affect our business. In 2017 and 2018, cities, counties, a state government, and a trade association in California, New York, Washington, Rhode Island and Maryland have filed lawsuits against several oil and gas companies, including ConocoPhillips, seeking compensatory damages and equitable relief to abate alleged climate change impacts. ConocoPhillips is vigorously defending against these lawsuits. The ultimate outcome and impact to us cannot be predicted with certainty, and we could incur substantial legal costs associated with defending these and similar lawsuits in the future.” (ConocoPhillips.10K, p. 24)
“Compliance with policy changes that create a GHG tax, emissions trading scheme or GHG reductions could significantly increase product costs for consumers and reduce demand for natural gas- and oil-derived products. Demand could also be eroded by conservation plans and efforts undertaken in response to global climate-related risk, including plans developed in connection with the Paris agreement. Many governments also
149

ConocoPhillips
provide, or may in the future provide, tax advantages and other subsidies to support the use and development of alternative energy technologies that could impact demand for our products. However, there are also opportunities associated with increased demand for lower-carbon energy sources such as natural gas.” (ConocoPhillips.CO2R1, p. 18) “In the United States, some additional form of regulation may be forthcoming in the future at the federal and state levels with respect to GHG emissions. Such regulation could take any of several forms that may result in the creation of additional costs in the form of taxes, the restriction of output, investments of capital to maintain compliance with laws and regulations, or required acquisition or trading of emission allowances. We are working to continuously improve operational and energy efficiency through resource and energy conservation throughout our operations.” (ConocoPhillips.10K, p. 68)
INDICATOR 3B. DELEGATION OF BOARD MEMBERS AND/OR COMMITTEES WITH EXPLICIT OVERSIGHT OF CLIMATE CHANGE POLICY Score: (1) Rationale: Though ConocoPhillips’ board maintains oversight of climate-related
strategy and specific company committees have tasks related to climate change, ConocoPhillips’ climate-related corporate governance lacks structure and accountability. For example, in its charter ConocoPhillips’ Public Policy Committee is tasked with social, political and environmental trend and risk analysis, but is not explicitly given oversight of climate change-related corporate governance. Further, ConocoPhillips’ Executive Leadership Team is not a board-level committee and company executives charged with “managing climate-related issues” are not members of ConocoPhillips’ board of directors.
Source(s): “The ConocoPhillips Board of Directors oversees our position
on climate change and related strategic planning and risk management policies and procedures, including those for managing climate-related risks and opportunities. The board delegates certain elements of its climate oversight functions to one or
150

ConocoPhillips
more of its five standing committees: Executive, Audit and Finance, Human Resources and Compensation, Directors’ Affairs, and Public Policy.” (ConocoPhillips.CO2R2, p. 6)
“The Public Policy Committee (PPC) is responsible for identifying, evaluating and monitoring climate-related trends and risks that could affect business activities and performance. The PPC reviews sustainable development (SD) as a standing agenda item, including briefngs and discussions on SD strategic priorities to advance the SD risk management process, implementation of the greenhouse gas (GHG) emissions intensity reduction target, and the use of reporting and disclosure frameworks such as the Task Force on Climate-related Financial Disclosures (TCFD). Other topics include climate-related risk scenarios and climate-related risk management strategy implementation. Issues considered by the PPC are regularly reported to the full board.” (ConocoPhillips.CO2R2, p. 6)
“The Executive Leadership Team (ELT) manages day-to-day climate-related risks and opportunities and assists the businesses in implementing climate-related plans. Responsibility for managing climate-related issues rests with the chief operating officer (COO) and the senior vice president (SVP), Government Affairs, who report directly to the chief executive officer. The COO serves as the ELT’s climate change champion, with overall accountability for corporate planning and development, including corporate strategy and long-range planning.” (ConocoPhillips.CO2R2, p. 6; see also ConocoPhillips.CCC1)
INDICATOR 3C. DOES THE COMPANY SUPPORT CLIMATE-RELATED SHAREHOLDER RESOLUTIONS? Score: (3) Rationale: ConocoPhillips faced no climate-related shareholder resolutions
during the reporting period. Source(s): “Our shareholder resolution process provides investors the
opportunity to raise ESG concerns with our leadership. While we take those concerns seriously and respect the right for shareholders to
151

ConocoPhillips
file resolutions, we find it is most productive to engage when an issue is identified and shared early.” (ConocoPhillips.SR, p. 5)
(see also Ceres – Climate and Sustainability Shareholder Resolutions Database; SEC – Division of Corporate Finance 2019; SEC – Division of Corporate Finance 2018)
CRITERION 4 – WHAT ARE THE COMPANY’S AFFILIATIONS WITH THIRD PARTIES THAT SPREAD DISINFORMATION ON CLIMATE SCIENCE? INDICATOR 4A. THE AMERICAN LEGISLATIVE EXCHANGE COUNCIL (ALEC) Score: (4) Rationale: ConocoPhillips has left ALEC, but did not state explicitly that it was
due to the ALEC’s position on climate science being inconsistent with the company’s.
Source(s): (see Source Watch - ALEC; see also DeSmogBlog – ALEC) INDICATOR 4B. THE AMERICAN PETROLEUM INSTITUTE (API) Score: (1) Rationale: ConocoPhillips is a current member of API and has not concretely
distanced itself from API’s climate change deception. Further, CEO Ryan Lance is currently a member of API’s executive committee.
Source(s): (see ConocoPhillips.CWS3; see also ConocoPhillips.FPS1; API –
Members; DeSmogBlog – API) INDICATOR 4C. THE NATIONAL ASSOCIATION OF MANUFACTURERS (NAM) Score: (1) Rationale: ConocoPhillips is a current member of NAM and has not concretely
distanced itself from NAM’s climate change deception. Further,
152

ConocoPhillips
ConocoPhillips’ senior vice president of government affairs, Andrew Lundquist, is on the NAM board of directors.
Source(s): (see NAM – Board of Directors; see also ConocoPhillips.FPS1;
DeSmogBlog – NAM) INDICATOR 4D. THE WESTERN STATES PETROLEUM ASSOCIATION (WSPA) Score: (2) Rationale: ConocoPhillips is a current member of WSPA and has not concretely
distanced itself from WSPA’s climate change deception. Source(s): (see ConocoPhillips.FPS1; see also WSPA – Member Companies;
DeSmogBlog – WSPA) INDICATOR 4E. AMERICAN FUEL AND PETROCHEMICAL MANUFACTURERS (AFPM) Score: (3) Rationale: ConocoPhillips is not a current member of AFPM, and there is no
record of the company joining the trade association. Source(s): (see ConocoPhillips.TPS1; see also AFPM – Membership Directory;
DeSmogBlog – AFPM) CRITERION 5 – DOES THE COMPANY PUBLICLY SUPPORT THE NEED FOR CLIMATE POLICY AND REGULATIONS? INDICATOR 5A. REGULATIONS, CARBON TAX, EMISSIONS TRADING, RENEWABLE ENERGY, CCS, ETC. Score: (3) Rationale: Though ConocoPhillips supports a specific carbon tax plan (i.e., the
Climate Leadership Council’s revenue-neutral Carbon Dividends
153

ConocoPhillips
Plan), that plan currently has no congressional sponsor. Further, ConocoPhillips’ extensive “Public Policy Engagement” section of its website makes no mention of support for current proposed policies and/or regulations in the company’s relevant jurisdictions apart from the Paris Agreement, whose temperature goal the company has not explicitly endorsed.
Source(s): “Creating secure and affordable energy, while achieving the goals of
the 2015 Paris Agreement, will require collaboration between the natural gas and oil industry and governments, citizens and businesses.” (ConocoPhillips.SR, p. 13)
“A revenue-neutral carbon tax that is transparent, predictable and cost effective to administer would be an effective policy option. Any carbon pricing mechanism should result in some relief via the elimination of other laws and regulations aimed at reducing or controlling carbon and other GHG emissions. Any proposed tax should be revenue-neutral and used in such a way as to minimize economic impact.” (ConocoPhillips.CWS4)
“At the COP-21 meeting in Paris in 2015 almost 200 countries agreed on a new global emission reduction framework starting in 2020. In 2017, President Trump announced that the U.S. would withdraw from the agreement. Prior to this announcement, we took actions to advocate for the U.S. to stay in the agreement. ConocoPhillips Chairman and CEO Ryan Lance publicly expressed his view that it was good for the U.S. to remain in the agreement.” (ConocoPhillips.CWS5)
INDICATOR 5B. PARIS AGREEMENT Score: (2) Rationale: ConocoPhillips has made a general statement of support for policies
to advance the Paris climate agreement but has not explicitly endorsed the Agreement’s global temperature goal.
Source(s): “We believe...The Paris Agreement and public opinion trends will
yet lead governments around the world to regulate and price GHG emissions more stringently, and that our interests are best served
154

ConocoPhillips
by proactively engaging on climate-related policy.” (ConocoPhillips.CWS4)
“In 2017, in accordance with our strategy, we set a public long-term GHG emissions target based on the architecture of the Paris Agreement, with an aspiration to become a leader in GHG climate-related risk management.” (ConocoPhillips.CO2R1, p. 26) “Creating secure and affordable energy, while achieving the goals of the 2015 Paris Agreement, will require collaboration between the natural gas and oil industry and governments, citizens and businesses.” (ConocoPhillips.SR, p. 13)
CRITERION 6 – HAS THE COMPANY BEEN PUBLICLY TRANSPARENT ABOUT ITS POSITION, ACTIONS, AND AFFILIATIONS WITH REGARD TO CLIMATE SCIENCE AND CLIMATE CHANGE? INDICATOR 6A. WEBPAGE DEDICATED TO CLIMATE CHANGE Score: (5) Rationale: ConocoPhillips maintains a separate webpage on its website
devoted to climate change. Source(s): (see ConocoPhillips.CWS6) INDICATOR 6B. STAND-ALONE SUSTAINABILITY REPORT WITH SPECIFIC REFERENCE TO CLIMATE CHANGE Score: (5) Rationale: ConocoPhillips’ sustainability report is easily accessible through its
website and contains a section dedicated to climate change. Source(s): (see ConocoPhillips.SR, p. 12) INDICATOR 6C. DISCLOSURE TO CDP Score: (5)
155

ConocoPhillips
Rationale: CDP website indicates “Submitted” from ConocoPhillips for Climate
Change 2018. Source(s): (see ConocoPhillips.CDP2) INDICATOR 6D. DISCLOSURE OF THIRD-PARTY RELATIONSHIPS AND LOBBYING ACTIVITIES Score: (3) Rationale: ConocoPhillips only discloses its trade association memberships
with annual dues greater than $50,000. Source(s): (see ConocoPhillips.FPS1) INDICATOR 6E. REPORT ON CLIMATE RELATED RISK SCENARIOS Score: (5) Rationale: ConocoPhillips provides a detailed simulation of how it might be
affected by the IEA’s Sustainable Development Scenario, and has incorporated the scenarios’ key findings into its corporate strategy (i.e., Climate Change Action Plan).
Source(s): “Our corporate strategy and Climate Change Action Plan reflect
several findings from our scenario analyses. We have acted to: Use a “fully loaded” cost of supply, including cost of carbon where legislation exists, as an important metric in Use a “fully loaded” cost of supply, including cost of carbon where legislation exists, as an important metric in our project authorization process. Our portfolio changes have created a resource base of 16 billion barrels of oil equivalent with less than a $40 per barrel cost of supply and an average cost of supply of less than $30 per barrel. Our strategic objective is to provide resilience in lower price environments, with any oil price above our cost of supply generating and after-tax fully burdened return greater than 10%....Identify and fund profitable emissions reduction projects, including methane emissions reductions. Reducing our Scope 1 and Scope 2 emissions intensity reduces the impact of and future regulations, or the
156

ConocoPhillips
introduction of carbon prices or taxes and helps maintain our low cost of supply into the future. We have upgraded the use of a marginal abatement curve (MACC) in Long-Range Planning to identify the most cost-effective emissions-reduction opportunities available to the company globally...Introduce a proxy cost of carbon into qualifying project sensitivities to help us be more resilient to climate- related risk in the short to medium term and provide the flexibility to remain resilient in the long term.” (ConocoPhillips.CO2R2, pp. 17-18)
“Our scenario analysis indicates that as the energy sector transitions, it will be important to be competitive on both cost of supply and carbon. We have adjusted our portfolio to concentrate on lower-cost production and have divested some of our higher-emissions-intensity natural gas and oil sands fields. We have also set a GHG emissions intensity-reduction target for our Scope 1 and Scope 2 emissions.” (ConocoPhillips.CO2R2, p. 22)
“The cost of supply of our resource base shown in the Metrics and Targets section supports our assertion that resources with the lowest cost of supply are most likely to be developed in scenarios with lower demand, such as the IEA’s Sustainable Development Scenario.” (ConocoPhillips.CO2R2, p. 26)
“As a result of our strategy and scenario work, we have focused capital on lower cost of supply resources, reducing our investments in oil sands and exiting deep water, while increasing our investments in unconventional oil projects.” (ConocoPhillips.CO2R2, p. 25)
“Our current climate-related risk scenarios were modeled with an end date of 2030. We are now updating and re-running our climate-related risk scenario models, extending them to 2040, before rerunning our scenarios and reviewing our climate- risk strategy to gain new insights and further align with the TCFD recommendations.” (ConocoPhillips.CO2R2, p. 16)
157

Devon Energy Corporation
X. Devon Energy Corporation CRITERION 1 – WHAT IS THE COMPANY’S POSITION ON CLIMATE SCIENCE? INDICATOR 1A. CONSISTENTLY ACCURATE PUBLIC STATEMENTS ON CLIMATE SCIENCE AND THE CONSEQUENT NEED FOR SWIFT AND DEEP REDUCTIONS IN EMISSIONS FROM THE BURNING OF FOSSIL FUELS Score: (2) Rationale: Devon does not address climate science on its website or in its public
disclosures and downplays the need to reduce GHG emissions by repeatedly noting the “potential impacts” climate change might have. Further, Devon presents a false dichotomy that suggests a choice must be made between economic energy supply and action to combat climate change.
Source(s): “Advancing our strategy: As we navigate a landscape of
uncertainty, Devon is focused specifically in areas we can control, such as streamlining our business and improving operational and financial efficiencies. These steps have strengthened our ability to compete, regardless of fluctuations in commodity prices.” (Devon.SR, p. 3)
“Oil and natural gas are vital to our way of life. At Devon, we support a consistent, reliable regulatory framework for energy; society depends on sound measures that are both effective and economically viable to ensure there is adequate supply today and in future decades.” (Devon.SR, p. 10)
“Our stakeholders have made known their concerns about the impacts that climate change could have on our long-range business plans, and we’re listening.” (Devon.CWS1)
“Devon and its stakeholders are committed to understanding the potential impacts of climate change on Devon’s long-range business plans. As part of Devon’s efforts to collaborate with its stakeholders and better understand the potential long-term impacts of a possible carbon-constrained future, Devon retained
158

Devon Energy Corporation
an outside consultant (ICF)1 to help assess Devon’s oil and natural gas portfolio in relation to these potential impacts.” (Devon.CO2R, p. 2)
“Devon expects development of new energy sources to continue. Meanwhile, it’s our job to produce the energy the world needs now, and to do it thoughtfully and responsibly. We execute our plans based on rigorous analysis of the global outlook for energy and the potential for new regulations, while recognizing concerns about climate change.” (Devon.CWS2)
“In recognition of the emerging relevance of and stakeholder interest in climate-change risks, Devon’s risk management has included, beginning in 2018, formal and ongoing consideration of the quantifiable effects of climate change on Devon’s portfolio.” (Devon.CO2R, p. 4)
CRITERION 2 – WHAT MEASURES IS THE COMPANY TAKING TO REDUCE ITS CARBON FOOTPRINT? INDICATOR 2A. GHG EMISSIONS TARGETS Score: (2) Rationale: Devon’s plan for reducing its GHG emissions is neither
comprehensive (i.e., only methane emissions are targeted in the plan) nor company-wide (i.e., the company’s intensity target only applies to its U.S. oil and natural gas operations).
Source(s): “Devon takes a proactive approach to reducing carbon dioxide
(CO2), methane and other greenhouse gases (GHG) that trap heat in the atmosphere. Reducing GHG emissions intensity is one of the guiding principles in our EHS Philosophy.” (Devon.SR, p. 18)
“Reducing emissions has been a long-standing focus at Devon, and we have documented our efforts and results in Carbon Disclosure Project (CDP) Climate Change Reports for 14 years.” (Devon.CWS3; see also Devon.SR, p. 18)
159

Devon Energy Corporation
“We announced in June 2019 that we’re establishing a target to limit methane emissions for U.S. oil and natural gas production operations. By 2025, we believe we can achieve a methane- intensity rate of 0.28 percent or lower. This methane intensity rate will be calculated based on emissions from Devon-operated oil and natural gas production facilities as a percentage of natural gas produced.” (Devon.SR, p. 19)
“We have taken major steps to reduce emissions at existing facilities by identifying and fixing leaks, and in 2017 expanded our leak detection and repair program to include valves, pumps and other equipment. These ongoing efforts have largely resolved the highest-risk issues, enabling us to reduce our emissions intensity over time.” (Devon.SR, p. 17)
INDICATOR 2B. GHG EMISSIONS REDUCTIONS Score: (2) Rationale: Company’s GHG emissions intensity has increased in one of the last
two reporting years and increased as a whole over the last two reporting years.
Source(s): [see Supplemental Data] INDICATOR 2C. R&D INTO LOW-CARBON TECHNOLOGIES Score: (2) Rationale: Devon generally notes its financial contribution to COSIA’s CCS
research, and specifically discloses funding provided for a CCS research center, but the company’s description of its recent technology investments do not reference any low-carbon R&D. Further, Devon has not disclosed a budget dedicated to in-house and/or third-party R&D into low-carbon technologies.
Source(s): “Devon Canada’s COSIA Technology Team had funding dedicated
to GHG reduction projects in 2017.” (Devon.CDP1, p. 20)
160

Devon Energy Corporation
“Devon has been working with competitors to invest in and development new technologies to reduce industry’s environmental impact for over a decade. For example, for the last six years Devon has invested in Canada’s Oil Sand Innovation Alliance, and as mentioned above has been a member of the Environmental Partnership and the Energy Water Initiative. Devon has also invested in IR camera technology for identifying methane leaks.” (Devon.CDP1, p. 12)
“Devon is a part of the NRG COSIA Carbon XPRIZE, a US$20M challenge to reimagine what we can do with CO2 emissions by incentivizing and accelerating the development of technologies that convert CO2 into valuable products. Devon’s $3.5 million investment in this prize helped to develop the Alberta Carbon Conversion Technology Centre, a groundbreaking carbon capture and conversion technology test centre.” (Devon.CDP1, p. 40)
“In recent years, we’ve been ramping up our investments in technology to become a leader among our peers. We’ve integrated advanced analytics, artificial intelligence (AI), machine learning and robotic process automation into our operations. Leveraging technology is essential to our “2020 Vision,” and to our plan to thrive and outperform our peers in any commodity price environment...Our recent focus has been on technologies to improve results for the subsurface (drilling and completions), production operations and water management.” (Devon.SR, p. 70)
INDICATOR 2D. USE OF AN INTERNAL PRICE ON CARBON Score: (2) Rationale: Devon discloses the internal carbon price it uses in investment
decisions but offers few details regarding how that price is employed in the company’s analysis of investments.
Source(s): “Regulatory carbon pricing applies to Devon’s Jackfish SAGD project
in Alberta. Carbon pricing is applied both at the division wide level (i.e., in the Devon Canada portfolio model), and at the individual project economics level...The internal carbon price
161

Devon Energy Corporation
escalates in accordance with Federal government commitments to increase carbon price (i.e., $40/tonne in 2021 and $50/tonne in 2022).” (Devon.CDP1, p. 44)
“In Alberta, GHG emissions are regulated under Alberta’s Carbon Competitiveness Incentive Regulation. This regulation puts a price on carbon and requires facilities to meet a product-based performance standard. There has been a price on carbon in Alberta since 2007.” (Devon.SR, p. 20)
“Climate-related regulations have caused Devon to invest in new equipment and personnel to comply with climate-related regulations and voluntary efforts. Accounting for carbon pricing on certain assets where it is applicable has affected capital allocation.” (Devon.CDP1, p. 13)
CRITERION 3 – IS CLIMATE SCIENCE INTEGRAL TO THE GOVERNANCE AND OVERSIGHT OF THE COMPANY? INDICATOR 3A. DELINEATION OF RISKS AND RISK MANAGEMENT PROCEDURES RELATED TO CLIMATE CHANGE INDICATOR 3AI. REGULATORY RISKS Score: (3) Rationale: Devon identifies specific existing and proposed climate-related laws
and regulations that may affect it (e.g., Canada’s Greenhouse Gas Pollution Pricing Act), but its analysis of possible effects particular to the company, including financial, is limited.
Source(s): “Continuing and increasing political and social attention to the issue
of climate change has resulted in legislative, regulatory and other initiatives, including international agreements, to reduce greenhouse gas emissions, such as carbon dioxide and methane. Policy makers at both the U.S. federal and state levels have introduced legislation and proposed new regulations designed to quantify and limit the emission of greenhouse gases. For example, both the EPA and the BLM have issued regulations for the control of methane
162

Devon Energy Corporation
emissions, which also include leak detection and repair requirements, for the oil and gas industry. Following the change in presidential administrations, however, the agencies have attempted to revise or rescind their previously issued methane standards. Litigation concerning these methane regulations and subsequent attempts to revise or rescind them is ongoing. Nevertheless, several states where we operate, including Wyoming, have already imposed venting and flaring limitations designed to reduce methane emissions from oil and gas exploration and production activities. With respect to more comprehensive regulation, federal and state initiatives to date have generally focused on the development of cap-and-trade or carbon tax programs. As generally proposed, a cap-and-trade program would cap overall greenhouse gas emissions on an economy-wide basis and require major sources of greenhouse gas emissions or major fuel producers to acquire and surrender emission allowances, while a carbon tax could impose taxes based on emissions from our operations and downstream uses of our products.” (Devon.10K, p. 20)
“Methane emissions from the oil and natural gas industries have been identified by policymakers and stakeholders as a significant source of GHG emissions. The U.S. began imposing regulations in 2012 to mitigate these emissions. Individual states had regulated emissions prior to this time and others have continued since then. The Canadian federal government and provincial governments have also announced or implemented methane regulations. Federal regulations announced in April 2018 are based on Canada’s target of 40-45% reduction of methane emissions from oil and natural gas by 2025. Fugitive and vented emissions from all segments of the natural gas industry comprise well less than 2% of natural gas production and many producers, including Devon, have made significant reductions in emissions through voluntary actions and in response to regulation. Significant additional reductions could require more aggressive measures, modifications to basic infrastructure, and changes to standard operating procedures. Some of the costs would be offset by the value of natural gas that is recovered through reduced losses of production, however, lower natural gas prices would decrease the value of the recovered natural gas and not all reductions would result in salable
163

Devon Energy Corporation
recovery. Achieving near-zero emissions would be very challenging.” (Devon.CO2R, p. 14)
“In addition to policies that aim to limit demand, proponents of tighter greenhouse gas emission standards are also proposing and supporting various initiatives that restrict fossil fuels development on the supply side. Examples of such supply-side policies include drilling bans (e.g., New York or Maryland), higher standards for drilling activity (e.g., increased drilling setback requirements in Colorado), organized efforts to oppose pipeline expansion projects (including appeals through the legal process), and imposition of additional regulatory hurdles (e.g., New York State water permitting requirements). Resistance to pipeline projects, in particular, creates greater uncertainty that projects reach completion and, therefore, increases the financial risk. All types of initiatives aimed at regulating access to oil and natural gas supply increase the cost of production and resource development.” (Devon.CO2R, p. 15)
“In Canada, greenhouse gas emissions are also being addressed at both the federal and provincial level. Devon will continue to be subject to Alberta’s climate change laws and regulations until at least 2021. Those laws and regulations include a legislated oil sands emission limit, with forthcoming regulations involving methane emissions reduction targets. Beginning January 2019, the Greenhouse Gas Pollution Pricing Act subjects all of Canada to a federal price on greenhouse gas emissions unless a province or territory has implemented a compliant carbon pricing regime. Litigation concerning the act is ongoing, and it is unclear how the act will ultimately treat provincial plans. In Alberta, large industrial emitters are subject to the Carbon Competitiveness Incentive Regulation (CCIR). The CCIR prices carbon, but provides cost protection to emission-intensive / trade-exposed industries, including Devon’s oil sands operations. The impact to our operations from these laws and regulations is expected to be minimal in the near term. Oil and gas facilities that are not subject to the CCIR are exempt from its economy-wide carbon levy until 2023.” (Devon.10K, pp. 20-21)
INDICATOR 3AII. PHYSICAL RISKS
164

Devon Energy Corporation
Score: (2) Rationale: Devon’s disclosures relating to physical risks facings its operations
do not include a discussion of climate change as a contributor to those risks. Note that although Devon includes some discussion of physical climate change-related risk to its operations in its Climate Change Assessment Report, climate change itself is not mentioned as a driver of “weather changes.”
Source(s): “Oil and natural gas extraction operations have been successful in
some of the most extreme environments across the planet. In the areas where Devon operates and plans to operate, we are confident in our ability to continue to operate in accordance with our plans. Devon, however, analyzes potential impacts due to natural disasters and short and medium-term weather changes when evaluating and planning future development. This analysis considers the likelihood of those events occurring and how Devon could mitigate the potential impact of those events. Devon has invested significant capital in developing technologies for using alternative sources of water, which will help to improve our ability to respond to lack of fresh water availability. Devon also plans in the medium term for potential infrastructure shut downs due to a variety of factors, and appropriate responses to each of them. This evaluation considers floods, tornados, hurricane risk, and other potential physical risks to infrastructure and Devon’s assets.” (Devon.CO2R, p. 14)
“...our oil and gas properties can become damaged, our operations may be curtailed, delayed or canceled and the costs of such operations may increase as a result of a variety of factors, including, but not limited to...adverse weather conditions and natural disasters, such as tornadoes, earthquakes, hurricanes and extreme temperatures.” (Devon.10K, p. 18)
“We rely on midstream facilities and systems to process our gas production and to transport our oil, gas and NGL production to downstream markets. All or a portion of our production in one or more regions may be interrupted or shut in from time to time due to losing
165

Devon Energy Corporation
access to plants, pipelines or gathering systems. Such access could be lost due to a number of factors, including, but not limited to, weather conditions and natural disasters, accidents, field labor issues or strikes. Additionally, the midstream operators may be subject to constraints that limit their ability to construct, maintain or repair midstream facilities needed to process and transport our production. Such interruptions or constraints could negatively impact our production and associated profitability.” (Devon.10K, p. 18)
INDICATOR 3AIII. MARKET AND OTHER INDIRECT RISKS AND OPPORTUNITIES
Score: (3)
Rationale: Devon notes various risks resulting from efforts to “promote a lower-carbon economy (e.g., subsidies for renewables), discusses the competitive advantages of its larger, more integrated, peers with respect to such a transition, and offers a detailed analysis of the possible financial impacts of activist-driven divestment. Further, Devon addresses the recent high-profile climate-related litigation in which the company is named as a co-defendant.
Source(s): “...other market and social initiatives resulting from the changing perception of climate change present risks for our business. For example, in an effort to promote a lower-carbon economy, there are various public and private initiatives subsidizing the development of alternative energy sources, including by mandating the use of specific fuels or technologies. These initiatives may reduce the competitiveness of carbon- based fuels, such as oil and gas. Moreover, certain financial institutions, funds and other sources of capital have begun restricting or eliminating their investment in oil and natural gas activities due to their concern regarding climate change. Such restrictions in capital could make it more difficult to secure funding to operate our business...governmental entities and other plaintiffs have brought, and may continue to bring, claims against us and other oil and gas companies for purported damages caused by the alleged effects of climate change. These and the other regulatory, social and market risks relating to climate change described above
166

Devon Energy Corporation
could result in unexpected costs, increase our operating expense and reduce the demand for our products, which in turn could lower the value of our reserves and have a material adverse effect on our profitability, financial condition and liquidity.” (Devon.10K, p. 21)
“In recent years, activists concerned about climate change have campaigned for investors to divest from companies involved in the production and sale of fossil fuels. A number of institutional investors have announced plans to divest or active consideration of such plans. Some stakeholders may be concerned that an increase in the scale of divestments could reduce the ability of Devon and other oil and natural gas companies to access capital. The direct potential of divestment efforts to limit Devon’s access to debt or equity capital may be minimal. A 2013 report from Oxford University concluded that the capacity of divestment to cause direct financial damage to oil and natural gas companies is severely limited by several factors. Chief among these is the large universe of neutral lenders and investors—especially in the North American market in which Devon operates—that will value oil and natural gas investments based on their intrinsic value as defined by expected future cash flows, correcting for any decrease in demand for debt or equity motivated by non-value concerns. Similarly, as Bloomberg New Energy Finance has noted, the scale of global oil and natural gas investments and the high probability of significant future demand makes divestment from oil and natural gas more challenging than divestment from coal. While the political salience of the divestment movement is linked to reputational and policy risks, the former do not normally limit access to capital and the latter are addressed elsewhere in this report.” (Devon.CO2R, p. 15)
“Our financial condition, results of operations and the value of our properties are highly dependent on the general supply and demand for oil, gas and NGLs, which impact the prices we ultimately realize on our sales of these commodities...Such volatility is likely to continue in the future due to numerous factors beyond our control, including, but not limited to...the price and availability of alternative fuels; technological advances affecting energy consumption and production.” (Devon.10K, p. 17)
167

Devon Energy Corporation
“In addition, many of our larger competitors may have a competitive advantage when responding to factors that affect demand for oil and gas production, such as changing worldwide price and production levels, the cost and availability of alternative fuels and the application of government regulations.” (Devon.10K, p. 23)
INDICATOR 3B. DELEGATION OF BOARD MEMBERS AND/OR COMMITTEES WITH EXPLICIT OVERSIGHT OF CLIMATE CHANGE POLICY Score: (1) Rationale: Devon’s Environmental, Social and Governance (ESG) Steering
Committee, though tasked with monitoring and communicating to the board on ESG issues, is not a board-level committee.
Source(s): “To be sure we’re identifying and appropriately addressing the issues
that could impact our sustainability, we have established an ESG Steering Committee. This committee has been given the authority to ensure that the appropriate level of attention is focused on ESG issues. With the committee’s guidance, we have produced this report [i.e. 2018 Sustainability Report] highlighting the programs we’re working on today, the practices we’ve been cultivating since Devon was founded in 1971, and the performance we expect to achieve going forward.” (Devon.SR, p. 3)
“Devon’s Environmental, Social and Governance (ESG) Steering Committee reviews our air emissions performance and programs in the context of an evolving regulatory, legal and stakeholder landscape. Current and emerging issues are communicated to Devon’s senior leaders to inform their deliberations about managing risk and ensuring compliance with regulations and laws.” (Devon.SR, p. 16)
INDICATOR 3C. DOES THE COMPANY SUPPORT CLIMATE-RELATED SHAREHOLDER RESOLUTIONS? Score: (1)
168
Devon Energy Corporation
Rationale: In 2019, Devon blocked a shareholder proposal from The George Gund Foundation asking the company to identify and disclose targets that are aligned with the goals of the Paris Agreement.
Source(s): (see Devon.TPS1, p. 4; see also Ceres – Climate and Sustainability
Shareholder Resolutions Database; SEC – Division of Corporate Finance 2019)
CRITERION 4 – WHAT ARE THE COMPANY’S AFFILIATIONS WITH THIRD PARTIES THAT SPREAD DISINFORMATION ON CLIMATE SCIENCE? INDICATOR 4A. THE AMERICAN LEGISLATIVE EXCHANGE COUNCIL (ALEC) Score: (2) Rationale: Devon was a "Director" level sponsor of the 2014 ALEC Annual
Conference and a "Trustee” level sponsor of the 2015 ALEC Annual Conference, and there is no evidence to suggest that it is no longer affiliated with the group.
Source(s): (see Source Watch - ALEC; see also DeSmogBlog – ALEC)
INDICATOR 4B. THE AMERICAN PETROLEUM INSTITUTE (API) Score: (1) Rationale: Devon is a current member of API and Dave Hager, President and
Chief Executive Officer of Devon, is a member of API’s board of directors.
Source(s): (see Devon.CWS4, see also API – Members; DeSmogBlog – API) INDICATOR 4C. THE NATIONAL ASSOCIATION OF MANUFACTURERS (NAM) Score: (1)
169

Devon Energy Corporation
Rationale: Devon is a current member of NAM and J. Larry Nichols, Chairman Emeritus of Devon, serves on NAM’s board of directors.
Source(s): (see Devon.CWS5; see also NAM – Board of Directors;
DeSmogBlog – NAM) INDICATOR 4D. THE WESTERN STATES PETROLEUM ASSOCIATION (WSPA) Score: N/A Rationale: Devon is not listed as a corporate member on WSPA's website, and
the company has no operations in the association’s jurisdiction. Source(s): (see WSPA – Member Companies; DeSmogBlog – WSPA) INDICATOR 4E. AMERICAN FUEL AND PETROCHEMICAL MANUFACTURERS (AFPM) Score: (3) Rationale: Devon is not listed as a current member on AFPM’s website, and
company is not mentioned by DeSmogBlog as having ever been affiliated with association.
Source(s): (see AFPM – Membership Directory; DeSmogBlog – AFPM) CRITERION 5 – DOES THE COMPANY PUBLICLY SUPPORT THE NEED FOR CLIMATE POLICY AND REGULATIONS? INDICATOR 5A. REGULATIONS, CARBON TAX, EMISSIONS TRADING, RENEWABLE ENERGY, CCS, ETC. Score: (2) Rationale: Devon’s disclosures with respect to the company’s support for
climate policies and regulations (e.g., “the company would support reasonable measures to encourage electric generation from natural
170

Devon Energy Corporation
gas”) are vague, and do not indicate support for even a general category of climate policy.
Source(s): “Devon is active in the development of public policy. In 2017, we
engaged with the federal Bureau of Land Management on its methane rule, with the Oklahoma Governor’s Coordinating Council on Seismic Activity, and with the state of New Mexico on its methane emissions regulatory framework.” (Devon.SR, p. 47)
“While Devon believes free markets tend to find the best, most cost effective solutions to public policy problems, the company would support reasonable measures to encourage electric generation from natural gas.” (Devon.CDP1, p. 45)
“The Devon Energy Corporation Political Action Committee (DECPAC) is investing in Devon's future by providing resources to candidates at the state and federal levels who support policies such as: Responsible tax treatment for the oil and natural gas industry; Continued regulation of hydraulic fracturing by states; Responsible access to domestic energy sources; Reasonable regulation of air and water.” (Devon.FPS1, p. 2)
“We actively advocate on matters of public interest...At all levels of government, important decisions about energy and the economy require good information and honest consideration. We inform and engage policymakers, the public and our employees as we advocate for principles and positions in the legislative and regulatory process.” (Devon.SR, p. 47)
INDICATOR 5B. PARIS AGREEMENT Score: (1) Rationale: Devon’s website and public disclosures are silent on the need for
policies and/or regulations to advance the Paris Climate Agreement. Source(s):
171
Devon Energy Corporation
CRITERION 6 – HAS THE COMPANY BEEN PUBLICLY TRANSPARENT ABOUT ITS POSITION, ACTIONS, AND AFFILIATIONS WITH REGARD TO CLIMATE SCIENCE AND CLIMATE CHANGE? INDICATOR 6A. WEBPAGE DEDICATED TO CLIMATE CHANGE Score: (5) Rationale: Devon maintains a separate webpage on its website devoted to
climate change. Source(s): (see Devon.CWS6) INDICATOR 6B. STAND-ALONE SUSTAINABILITY REPORT WITH SPECIFIC REFERENCE TO CLIMATE CHANGE Score: (5) Rationale: Devon's sustainability report is easily accessible through its website
and contains a section dedicated to climate change. Source(s): (see Devon.SR, p. 21) INDICATOR 6C. DISCLOSURE TO CDP Score: (5) Rationale: CDP website indicates “Submitted” from Devon for Climate Change
2018. Source(s): (see Devon.CDP2) INDICATOR 6D. DISCLOSURE OF THIRD-PARTY RELATIONSHIPS AND LOBBYING ACTIVITIES Score: (3)
172

Devon Energy Corporation
Rationale: Devon’s disclosures provide some insight into the its major affiliations with trade associations, but the company does not provide a comprehensive list of its memberships.
Source(s): “Devon participates in business and industry associations,
trade groups and advocacy organizations to make our views known on a variety of proposed rules and laws. We also provide our employees with information and perspective to discuss industry issues with their friends and neighbors, and encourage them to participate in the electoral process (Devon.SR, p. 47)
“Like its peers, Devon is a member of and actively engages in various industry and trade groups (organized under section 501(c)(6) of the Internal Revenue Code) in the United States. These associations engage in setting industry standards and promoting educational initiatives regarding issues that affect our industry, as well as engaging in lobbying activities that seek to promote legislative solutions that are sound and responsible while generally advancing Devon’s business goals and interests. In 2018, Devon paid approximately $4.7 million in dues to 501(c)(6) organizations. In excess of 75% of that total is attributed to the following organizations: The American Petroleum Institute, The US Chamber of Commerce, The National Association of Manufacturers, The Oklahoma State Chamber of Commerce, Oklahoma Oil and Gas Association and the New Mexico Oil and Gas Association. Approximately $1.8 million of the total contributions were considered non-deductible by the IRS and went towards grassroots and industry advocacy activities.” (Devon.FPS2, p. 2)
INDICATOR 6E. REPORT ON CLIMATE RELATED RISK SCENARIOS Score: (5) Rationale: Devon has produced and published a “Climate Change Assessment
Report” which offers an analysis of what a 2°C or lower increase in global temperature would mean for its businesses, strategies, and financial planning.
173

Devon Energy Corporation
Source(s): “Devon retained an outside consultant (ICF)1 to help assess Devon’s oil and natural gas portfolio in relation to these potential impacts. During this assessment, Devon evaluated several possible future climate change scenarios in order to quantify the risks to Devon from aggressive global carbon reduction-policies, modeled through 2050. Devon evaluated pricing scenarios and model results from both ICF and the widely-referenced International Energy Agency (IEA) .” (Devon.CO2R, p. 2)
“In recognition of the emerging relevance of and stakeholder interest in climate-change risks, Devon’s risk management has included, beginning in 2018, formal and ongoing consideration of the quantifiable effects of climate change on Devon’s portfolio. Devon’s risk evaluation uses a scenario analysis of technology and market conditions that considers pricing scenarios that are at least as challenging as IEA’s Sustainable Development Scenario and runs through at least 2040 (this report analyzes through 2050) .” (Devon.CO2R, p. 4)
“Model results indicate that aggressive low-carbon scenarios will reduce oil, natural gas, and natural gas liquids (NGLs) prices by 23-37%; even in such low-carbon scenarios, the model results suggest that Devon’s current portfolio is likely to be resilient to these potential impacts. Based on the comparison of projected regional price impacts with estimated regional breakeven prices for each of Devon’s major assets, Devon concludes that its assets are likely to be well-positioned to remain profitable even in an aggressive low-carbon scenario. Model results under some low-carbon scenarios (e.g., the IEA Sustainable Development Scenario) reflect that oil, natural gas, and NGLs prices will be robust and Devon’s current portfolio is likely to thrive under these scenarios.” (Devon.CO2R, p. 5)
174
Encana Corporation
XI. Encana Corporation CRITERION 1 – WHAT IS THE COMPANY’S POSITION ON CLIMATE SCIENCE? INDICATOR 1A. CONSISTENTLY ACCURATE PUBLIC STATEMENTS ON CLIMATE SCIENCE AND THE CONSEQUENT NEED FOR SWIFT AND DEEP REDUCTIONS IN EMISSIONS FROM THE BURNING OF FOSSIL FUELS Score: (2) Rationale: Encana recognizes global concern for climate change in its various
public platforms, as well as the challenges climate change presents, but does not address climate science in its public disclosures. Further, Encana downplays the need to reduce GHG emissions by frequently advocating for balanced solutions that do not jeopardize economic growth.
Source(s): “We recognize the world continues to balance climate change with
the critical need to provide affordable, reliable energy. We are focused on minimizing the impact of our operations as we deliver some of the energy that contributes to our society’s health, quality of life and prosperity.” (Encana.SR, p. 5)
“Our world is striving to understand and balance the impacts of climate change with the critical need for affordable, reliable energy. We are committed to minimizing the impact of our operations as we deliver the energy that contributes to society’s health, quality of life and prosperity. Meeting growing energy needs while addressing greenhouse gas emissions is a complex challenge. Encana is focused on improving greenhouse gas emissions performance. Government policies define our goals, but we maintain flexibility so that industry can develop effective and efficient solutions. Climate change is a global concern. Encana is committed to engaging with our stakeholders, including governments and the public, in addressing concerns related to climate change. Encana is working with industry partners to inform regulatory development while participating in voluntary programs, such as the Environmental Partnership, which is aimed at reducing emissions, sharing industry
175

Encana Corporation
best practices and tracking emerging technologies.” (Encana.CWS1; see also Encana.SR, p. 3)
“Canada and the world are currently facing a significant challenge in meeting growing demand for safe, reliable and affordable energy, while also responding to the impacts of climate change and the need to transition to a lower carbon energy system/economy over the next several decades. These two imperatives can be complimentary if addressed in a balanced and responsible manner over time, cutting both costs and greenhouse gas (“GHG”) emissions via balanced solutions that allow for growth in investment and jobs.” (Encana.FPS1, p. 1)
CRITERION 2 – WHAT MEASURES IS THE COMPANY TAKING TO REDUCE ITS CARBON FOOTPRINT? INDICATOR 2A. GHG EMISSIONS TARGETS Score: (1) Rationale: Encana has disclosed no quantitative targets or plan for reducing
GHG emissions beyond current legal requirements. Source(s): “Encana is focused on improving greenhouse gas emissions
performance. We also align best practices for emission reduction strategies and coordinated regulatory responses with industry partners and government agencies.” (Encana.SR, p. 3)
INDICATOR 2B. GHG EMISSIONS REDUCTIONS Score: (1) Rationale: Company’s GHG emissions intensity has increased in each of the
last two reporting years. Source(s): [see Supplemental Data] INDICATOR 2C. R&D INTO LOW-CARBON TECHNOLOGIES
176

Encana Corporation
Score: (1) Rationale: Encana has not committed to investing in R&D into low-carbon
technologies and has not disclosed a budget dedicated to that purpose.
Source(s): “Encana supports new technology developers through
participation in various studies. We participated in a Colorado State University study funded by the EPA to research the efficacy of infrared cameras. This research will set a baseline that new technologies can be compared against for future approval and use to meet leak detection and repair (LDAR) regulatory requirements.” (Encana.CWS2)
INDICATOR 2D. USE OF AN INTERNAL PRICE ON CARBON Score: (2) Rationale: Encana “considers” carbon pricing in its investment decisions but
has neither disclosed a price nor explained how it is employed. Source(s): “Encana considers climate-related risks in our financial and
strategic scenario analysis. This includes analyzing long-term impacts of commodities pricing, carbon pricing and the long-term financial impacts associated with climate change, among other things.” (Encana.SR, p. 5)
CRITERION 3 – IS CLIMATE SCIENCE INTEGRAL TO THE GOVERNANCE AND OVERSIGHT OF THE COMPANY? INDICATOR 3A. DELINEATION OF RISKS AND RISK MANAGEMENT PROCEDURES RELATED TO CLIMATE CHANGE INDICATOR 3AI. REGULATORY RISKS Score: (3) Rationale: Encana pinpoints specific existing and proposed climate-related laws
and regulations that may affect it, and in some cases indicates that
177

Encana Corporation
it has a response plan in place, but does not detail potential impacts specific to the company.
Source(s): “A number of federal, provincial and state governments have
announced intentions to regulate greenhouse gases and certain air pollutants. These governments are currently developing regulatory and policy frameworks to deliver on their announcements. The Canadian federal government along with certain provinces and territories, including Alberta and British Columbia, have announced a pan-Canadian climate change framework that is consistent with the outcome reached at the 21st Conference of the Parties in Paris and which includes imposing an economy wide cost on carbon emissions in Canada by 2023. The Alberta government outlined its Climate Leadership Plan which includes four key areas, one of which is targeting a 45 percent reduction in methane gas emissions from oil and gas operations by 2025, to be achieved through equipment replacement and leak detection and repair regulations. Both Alberta and British Columbia have implemented a provincial carbon tax; Alberta introduced a carbon levy in January 2017 of C$20 per tonne of CO2e, which increased to C$30 per tonne of CO2e in 2018 while British Columbia has an established carbon levy of C$30 per tonne of CO2e, increasing by C$5 per tonne of CO2e per year starting April 1, 2018 until it reaches C$50 per tonne of CO2e in 2021. In October of 2018, the United States Environmental Protection Agency (“EPA”) issued a reconsideration reforming the rules that regulate methane emissions from the oil and gas industry. Public comment on the proposed revised regulations closed in December 2018 and the new regulations are expected to be finalized in 2019. Encana’s cost of complying with emerging climate and cost of carbon regulations is not currently forecast to be material to the Company, however as these and additional federal and regional programs are in their early implementation stage or under development, Encana is unable to predict the total future impact of the potential regulations upon its business. Therefore, it is possible that the Company could face future increases in operating costs in order to comply with legislation governing emissions.” (Encana.10K, p. 31)
178

Encana Corporation
“Encana meets the Environmental Protection Agency’s (EPA) GHG regulatory requirements in the US. In Canada, the oil and gas sector will be subject to new regulations that are designed to ensure that the sector’s methane emissions are reduced by 40 – 45 percent by 2025, relative to 2012 emissions. We have a plan in place to ensure that we will achieve compliance with the new regulations when they come into force. Encana actively participates with trade organizations to provide input to regulatory agencies on the development and implementation of GHG regulations. We also work with industry partners and government agencies to align best practices for emission reduction strategies and coordinated regulatory responses.” (Encana.CWS2)
INDICATOR 3AII. PHYSICAL RISKS Score: (2) Rationale: Encana’s discussion of the physical risks it faces (e.g., adverse
weather) does not reference climate change as a contributor to those risks.
Source(s): “In addition, all of Encana’s operations will be subject to all of the
risks normally incident to the transportation, processing, storing and marketing of natural gas, oil, NGLs and other related products, drilling and completion of natural gas and oil wells, and the operation and development of natural gas and oil properties, including encountering unexpected formations or pressures, premature declines of reservoir pressure or productivity, blowouts, equipment failures and other accidents, sour gas releases, uncontrollable flows of natural gas, oil or well fluids, adverse weather conditions and other natural disasters, spills and migration of hazardous chemicals, pollution and other environmental risks.” (Encana.10K, p. 33)
“Risks and uncertainties that may affect these outcomes include: ability to generate sufficient cash flow to meet obligations; commodity price volatility; ability to secure adequate transportation and potential pipeline curtailments; variability and discretion of Encana's board of directors (the “Board of Directors”) to declare and
179

Encana Corporation
pay dividends, if any; timing and costs of well, facilities and pipeline construction; business interruption, property and casualty losses or unexpected technical difficulties, including impact of weather.” (Encana.10K, p. 6)
INDICATOR 3AIII. MARKET AND OTHER INDIRECT RISKS AND OPPORTUNITIES Score: (2) Rationale: Encana’s disclosures briefly discuss the competitive forces shaping
the energy transition, and offer some risk analysis of recent high-profile climate-related litigation in which the company is named as a co-defendant, but do not meaningfully address market or other indirect risks related to climate change.
Source(s): “In 2015, the Financial Stability Board established the Task Force on
Climate- Related Financial Disclosures (TCFD) to develop guidance on climate-related financial reporting...Encana is exploring the TCFD recommendations while continuing our ongoing priority assessment efforts. As part of the Encana’s Board of Director’s Mandate, the Board is required to annually review and adopt a strategic planning process and approve the corporate strategic plan, which considers among other things, opportunities and risks to the business...Encana’s business strategy is risk-based and focused on identifying ESG related issues of importance to our key stakeholders that have the potential to impact our strategy. Encana considers climate-related risks in our financial and strategic scenario analysis. This includes analyzing long-term impacts of commodities pricing, carbon pricing and the long-term financial impacts associated with climate change, among other things...Encana continues to analyze and address risk on a short and long-term basis, making agile adjustments as needed. Our annual ESG priority assessment provides an analysis of key issues that can impact our strategy.” (Encana.SR, p. 5)
“The oil and gas industry also competes with other industries focused on providing alternative forms of energy to consumers. Competitive forces can lead to cost increases or result in an oversupply of oil, NGLs or natural gas.” (Encana.10K, p. 24)
180

Encana Corporation
“Further, certain local governments, stakeholders and other groups have made claims against companies in the oil and gas industry, including the Company, relating to the purported causes and impact of climate change. These claims have, among other things, resulted in litigation, shareholder proposals and local ballot initiatives targeted against certain companies and the oil and gas industry generally. As these claims are in their early stages, the Company is unable to assess the impact of such claims on its business, but the defense of such matters may be costly and time consuming and could have a material adverse effect on the Company’s reputation.” (Encana.10K, p. 31)
INDICATOR 3B. DELEGATION OF BOARD MEMBERS AND/OR COMMITTEES WITH EXPLICIT OVERSIGHT OF CLIMATE CHANGE POLICY Score: (1) Rationale: Encana’s board-level CREHS committee is largely focused on health
and safety, and makes no reference to climate change-related oversight in its charter.
Source(s): “Encana’s Board Committees play a key role in risk oversight and
are responsible for ensuring appropriate identification and management of environment, social and governance (ESG)-related issues. The Board is assisted by the Corporate Responsibility, Environment, Health and Safety Committee (CREHS), which is responsible for reviewing and reporting to the Board actions and initiatives undertaken to mitigate ESG risks on a regular basis in addition to matters that may affect our activities, plans, strategies or reputation. CREHS also reviews and makes recommendations on Encana policies, standards and practices regarding sustainability, including climate related issues.” (Encana.CWS3)
“Corporate governance at Encana is about accountability and transparency throughout the company. Encana’s Board of Directors is responsible for oversight of Environmental, Social and Governance (ESG) issues.” (Encana.SR, p. 2; see also Encana.CCC1)
181

Encana Corporation
INDICATOR 3C. DOES THE COMPANY SUPPORT CLIMATE-RELATED SHAREHOLDER RESOLUTIONS? Score: (3) Rationale: Encana has not faced any climate-related shareholder resolutions
put forward by established networks of socially responsible investors during the reporting period.
Source(s): (see Ceres – Climate and Sustainability Shareholder Resolutions
Database; SEC – Division of Corporate Finance 2019) CRITERION 4 – WHAT ARE THE COMPANY’S AFFILIATIONS WITH THIRD PARTIES THAT SPREAD DISINFORMATION ON CLIMATE SCIENCE? INDICATOR 4A. THE AMERICAN LEGISLATIVE EXCHANGE COUNCIL (ALEC) Score: (3) Rationale: While Encana was a ‘Director’ level sponsor of 2011 ALEC Annual
Conference, information is unavailable to determine company’s present affiliation.
Source(s): (see Source Watch - ALEC; see also DeSmogBlog – ALEC) INDICATOR 4B. THE AMERICAN PETROLEUM INSTITUTE (API) Score: (1) Rationale: Encana is a current member of API and CEO Doug Suttles is a
member of API’s Board of Directors. Source(s): “Over the course of his career, Doug has volunteered his time and
talents to community organizations across North America. Doug is a member of the National Petroleum Council and sits on the Board of Directors of the American Petroleum Institute, the American
182

Encana Corporation
Exploration & Production Council, the Independent Petroleum Association of America and the National Association of Manufacturers.” (Encana.CWS4; see also API – Members; DeSmogBlog – API)
INDICATOR 4C. THE NATIONAL ASSOCIATION OF MANUFACTURERS (NAM) Score: (1) Rationale: Encana is a current member of NAM and CEO Doug Suttles is a
member of NAM’s Board of Directors. Source(s): “Over the course of his career, Doug has volunteered his time and
talents to community organizations across North America. Doug is a member of the National Petroleum Council and sits on the Board of Directors of the American Petroleum Institute, the American Exploration & Production Council, the Independent Petroleum Association of America and the National Association of Manufacturers.” (Encana.CWS4; see also NAM – Board of Directors; DeSmogBlog – NAM)
INDICATOR 4D. THE WESTERN STATES PETROLEUM ASSOCIATION (WSPA) Score: N/A Rationale: Encana is based in Canada and has no operations in the
association’s jurisdiction. Further, the company is neither mentioned by DeSmogBlog as having ever been affiliated with the association nor listed as a corporate member on WSPA’s website.
Source(s): (see WSPA – Member Companies; DeSmogBlog – WSPA) INDICATOR 4E. AMERICAN FUEL AND PETROCHEMICAL MANUFACTURERS (AFPM) Score: (3)
183

Encana Corporation
Rationale: Encana is based in Canada and is neither in AFPM’s current membership list nor noted by DeSmogBlog as having ever been affiliated with association.
Source(s): (see AFPM – Membership Directory; DeSmogBlog – AFPM) CRITERION 5 – DOES THE COMPANY PUBLICLY SUPPORT THE NEED FOR CLIMATE POLICY AND REGULATIONS? INDICATOR 5A. REGULATIONS, CARBON TAX, EMISSIONS TRADING, RENEWABLE ENERGY, CCS, ETC. Score: (2) Rationale: Encana’s high-level climate policy “principles” do not express
support for even a general category of climate policies and regulations.
Source(s): “For regulations to effectively reduce emissions without
destroying value, we believe the following principles should guide the development of climate change policy...Balance: Policy should deliver economic growth, environmental protection, a secure and reliable energy supply and should be harmonized across jurisdictions, to the extent that is practical. Competitiveness: Policy should maintain competitiveness among the energy-intensive trade-exposed (EITE) industries, ensure compatibility with major trading and economic partners and support long-term capital investments in the upstream oil and gas sector. Efficiency: Policy should define success through emission reduction objectives while maintaining the emitters’ maximum technical and economic flexibility to achieve those objectives. Technology: Policy should encourage technologies to reduce emissions without dictating solutions.” (Encana.CWS1)
INDICATOR 5B. PARIS AGREEMENT Score: (2)
184

Encana Corporation
Rationale: Encana makes no reference to the Paris Climate Agreement in its public disclosures apart from noting the adoption of a pan-Canadian climate change framework that followed Canadian government’s ratification of the Agreement in 2016.
Source(s): CRITERION 6 – HAS THE COMPANY BEEN PUBLICLY TRANSPARENT ABOUT ITS POSITION, ACTIONS, AND AFFILIATIONS WITH REGARD TO CLIMATE SCIENCE AND CLIMATE CHANGE? INDICATOR 6A. WEBPAGE DEDICATED TO CLIMATE CHANGE Score: (5) Rationale: Encana maintains a separate webpage on its website entitled
“Environment” that has a section discussing climate change. Source(s): (see Encana.CWS1) INDICATOR 6B. STAND-ALONE SUSTAINABILITY REPORT WITH SPECIFIC REFERENCE TO CLIMATE CHANGE Score: (1) Rationale: Encana’s 6-page “Sustainability Snapshot” includes one paragraph
devoted to climate change. Source(s): (Encana.SR, p. 3) INDICATOR 6C. DISCLOSURE TO CDP Score: (5) Rationale: CDP website indicates “Submitted” from Encana for Climate Change
2018, though the report is not available from CDP’s website nor made available by Encana on its website.
Source(s): (Encana.CDP1)
185

Encana Corporation
INDICATOR 6D. DISCLOSURE OF THIRD-PARTY RELATIONSHIPS AND LOBBYING ACTIVITIES Score: (3) Rationale: Encana discloses donations made to trade associations, public
policy organizations and academic research initiatives in excess of $25,000.
Source(s): “Encana believes that active and constructive engagement in public
policy is an important part of responsible corporate citizenship. We support trade associations, public policy organizations and academic research initiatives to inform public dialogue on issues that impact Encana and the oil and gas industry. Encana also actively engages with elected officials, regulatory agencies, legislative staff, public service and the public. Our goal is to provide our perspective on key issues and to advocate for a reasonable public policy and effective regulatory framework for oil and gas development...The trade associations, public policy organizations and academic research initiatives to which we provided over US$25k in funding to in 2017 are listed below.” (Encana.CWS5)
INDICATOR 6E. REPORT ON CLIMATE RELATED RISK SCENARIOS Score: (1) Rationale: Encana did not produce and publish a 2°C scenario report in the
reporting period. Source(s): “We complete an annual priority assessment to identify ESG risks
which could impact our corporate strategy. We use third-party research, stakeholder consultation and our own proprietary assessment to analyze all ESG risks against two criteria: importance to stakeholders and impact to strategy. In this report, we will discuss four of our top priorities from our 2017 assessment. The results of this exercise are communicated to the executive team and the Board.” (Encana.CWS6)
186

Eni S.p.A.
XII. Eni S.p.A. CRITERION 1 – WHAT IS THE COMPANY’S POSITION ON CLIMATE SCIENCE? INDICATOR 1A. CONSISTENTLY ACCURATE PUBLIC STATEMENTS ON CLIMATE SCIENCE AND THE CONSEQUENT NEED FOR SWIFT AND DEEP REDUCTIONS IN EMISSIONS FROM THE BURNING OF FOSSIL FUELS Score: (3) Rationale: Although ENI affirms the Paris Agreement’s 2°C temperature target
and consistently accurately characterizes the scientific consensus on climate change, the company contradicts itself with respect to the urgent need for deep reductions in the burning of fossil fuels.
Source(s): “The scientific community has established a link between climate
change and increasing GHG concentration in the atmosphere.” (Eni.20F, p. 21)
“Prices of oil and natural gas have a history of volatility due to many factors that are beyond Eni’s control. These factors include among other things...rising commitment of the world nations and the civil society to addressing the issue of global warming and climate change by reducing the release in the atmosphere of greenhouse gases (“GHG”) produced by the consumption of hydrocarbons in human activities.” (Eni.20F, p. 5)
“Eni recognizes the scientific evidence on climate change of the Intergovernmental Panel on Climate Change (IPCC) and aims at playing a leadership role in the energy transition process, backing the targets included in the Paris Agreement.” (Eni.SR, p. 18)
“In October 2018 the Intergovernmental Panel on Climate Change (IPCC) stated, in a new report, that in order to limit global warming to 1.5°C, the world economy would need to undertake a deeper and complex transformation. We recognize that meeting this challenge in the next decades requires an even more rapid escalation, both in term of size and speed, of changes than were foreseen in the Paris Agreement. Currently, this scenario has yet
187

Eni S.p.A.
to be complemented by a full set of pricing and other operating assumptions, which once available from the IPCC or other sources will be deeply analyzed by the Company for the purpose of updating stress-testing models and methodologies.” (Eni.20F, p. 30)
“Eni recognizes that the main challenge in the energy sector is providing efficient and sustainable access of local communities to energy resources, while combating climate change...Eni’s business model envisages a path to decarbonisation with the ambition to lead the Company to become carbon neutral in the long term, aiming at maximize efficiency and reduce direct emissions through the compensation of residual emissions, promoting an energy mix with a low carbon impact. In the long term, Eni supports a change of energy paradigm and a conversion of the current consumption pattern towards a more sustainable and rational one, leveraging on the principles of circular economy, pursuing a path to conversion by exploiting the group’s expertise and positioning in the downstream business.” (Eni.SR, p. 7)
“...At the same time, it is necessary to combat climate change, limiting emissions of climate-changing gases into the atmosphere and contributing to the gradual decarbonization of the energy system through an energy transition.” (Eni.SR, p. 6)
“Within the framework of the Paris Agreement and adopting the language of the Sustainable Development Goals (SDGs) set out in the United Nations 2030 Agenda, Eni recognizes the need to actively intervene in the fight against climate change through an accurate integrated strategy that is implemented in our path to decarbonization...” (Eni.SR, p. 3)
CRITERION 2 – WHAT MEASURES IS THE COMPANY TAKING TO REDUCE ITS CARBON FOOTPRINT? INDICATOR 2A. GHG EMISSIONS TARGETS Score: (2)
188
Eni S.p.A.
Rationale: ENI’s “path to decarbonization” includes both medium and long-term targets and a GHG offset mechanism, but its “path” is not a company-wide plan as it only applies to the company’s upstream portfolio.
Source(s): “To strengthen the resiliency of our oil&gas portfolio, we are fully
committed to reduce the energy intensity at our oil and gas projects...By 2030 we are targeting to achieve net zero emissions in our upstream business (on equity basis) by: (1) Increasing efficiency to minimize direct upstream CO2 emissions. As part of this target by 2025 we plan to eliminate gas process flaring and reduce methane emissions by 80%; and, (2) offsetting residual upstream emissions through large forestry projects.” (Eni.20F, p. 30; see also Eni.SR, p. 19; Eni.CO2R, p. 14)
“Our path to decarbonization has four main drivers that concern both our core business activities and new energy perspectives: The first is to retain a portfolio of oil&gas projects that we believe are resilient to a low carbon scenario; The second is our action plan to lower CO2 emissions in all our operations, particularly to reduce the energy intensity at our exploration and production activities and improve energy efficiency across all business lines; Thirdly, we intend to grow our business of power generation produced by renewable sources, to develop the forestry business, to increase production of bio-fuels and to execute several industrial projects designed to recycle organic waste and other civil waste aiming at producing energy or raw materials to produce bio-fuels or bio-chemicals as well as to revitalize dismissed or decommissioned industrial sites; Finally, R&D will play a key role in our decarbonization strategy.” (Eni.20F, p. 29)
“The objective for 2025 is to reduce upstream emission intensity by 43% compared to 2014. This objective will contribute to the target of improving the operating efficiency index by 2% a year by 2021 compared to 2014 and it will be pursued by all Eni business units.” (Eni.SR, p. 12)
“Eni recognizes the scientific evidence on climate change of the Intergovernmental Panel on Climate Change (IPCC) and aims at playing a leadership role in the energy transition process, backing the targets included in the Paris Agreement. In its strategy, Eni
189

Eni S.p.A.
has defined a clear path to decarbonization made out of short, medium and long term actions.” (Eni.SR, p. 18)
“Within its decarbonization strategy, Eni plans to offset part of its emissions using carbon credits generated by projects aiming to conserve, restore and manage forests. These projects aim to reduce deforestation and forest degradation and preserve the biodiversity, ensuring also economic and social co-benefits for local communities. In particular, these projects intend to enable economic diversification activities, with the creation of new employment, easing local development, consistently with the National Development Plans and the Agenda 2030. Rational use of forest resources allows also to promote more sustainable domestic behavior through clean cooking.” (Eni.SR, p. 21)
INDICATOR 2B. GHG EMISSIONS REDUCTIONS Score: (1) Rationale: Company’s GHG emissions intensity has increased in each of the
last two reporting years. Source(s): [see Supplemental Data] INDICATOR 2C. R&D INTO LOW-CARBON TECHNOLOGIES Score: (3) Rationale: Though Eni has publicly committed to R&D in low-carbon
technologies and discloses the percentage of total R&D allocated to its decarbonization strategy, the firm’s low-carbon R&D budget is not sufficiently broken down by technology.
Source(s): “In 2018, Eni’s overall expenditure in R&D amounted to €197
million which were almost entirely expensed as incurred (€185 million in 2017 and €161 million in 2016).” (Eni.20F, p. 75; see also Eni.AR, p. 111)
“Over the next four years, the Company plans to invest €33 billion in the business, representing a modest increase from the previous
190

Eni S.p.A.
plan...Projects to support the Company’s long-term decarbonization targets and the development of the circular economy and renewables are expected to be assigned 9% of the Group overall budget for capital expenditures...we will invest approximately €3 billion in projects intended to reduce GHG emissions including projects designated to cut volumes of flared gas, to grow the green business and to develop the circular economy. Approximately 50% of those expenditures will be directed to build new power generation capacity from renewable sources (mainly photovoltaic cells and to a lesser extent wind power) at our industrial hubs in Italy, or as part of an integrated design with selected E&P initiatives outside Italy, targeting an installed production capacity of 1.6 gigawatt at the end of the plan period.” (Eni.20F, pp. 119-120; see also Eni.CO2R, p. 16)
“Overall spending in the four-year period 2019-22 for decarbonization, the circular economy and renewables is approximately €3.6 billion (it includes €0.5 billion for scientific and technological research activities designed to support these issues). In particular, these dedicated investments share is equal to the 9% of the total investments envisaged for the coming 4 years.” (Eni.SR, p. 21)
“Eni launched the “Energy Transition” R&D program with the aim of developing new technologies to promote the widespread use of natural gas, making easier its production and transport, widening its uses and favoring the decarbonization of the whole value chain. In particular, the research deals with three areas of interest: (a) Natural gas transportation, transformation and uses, (b) H2S management, (c) CO2 management.” (Eni.20F, p. 77)
INDICATOR 2D. USE OF AN INTERNAL PRICE ON CARBON Score: (4) Rationale: Eni discloses the internal price on carbon it uses when evaluating all
new investments and describes generally how it is employed. Source(s): “To test the resilience of new projects, Eni assesses potential
costs associated with GHG emissions when evaluating all new
191

Eni S.p.A.
capital projects. New projects’ internal rates of return are stress-tested against two sets of assumptions: i) Eni’s management estimation of a cost per ton of carbon dioxide (CO2) equivalent of 40 $/tonnes in real terms 2015, which is applied to the total GHG emissions of each capital project, while retaining the management scenario for hydrocarbons prices; and ii) the hydrocarbon prices and cost of CO2 emissions adopted in the International Energy Agency (IEA) Sustainable Development Scenario “IEA SDS”. This stress test is performed on a regular basis, to monitor the progress of each project. The review performed at the end of 2018 indicated that the internal rates of return of Eni’s ongoing projects in aggregate should not be substantially affected by a carbon pricing mechanism. The project development process features a number of checks that may require the development of detailed GHG and energy management plans.” (Eni.20F, p. 29)
CRITERION 3 – IS CLIMATE SCIENCE INTEGRAL TO THE GOVERNANCE AND OVERSIGHT OF THE COMPANY? INDICATOR 3A. DELINEATION OF RISKS AND RISK MANAGEMENT PROCEDURES RELATED TO CLIMATE CHANGE INDICATOR 3AI. REGULATORY RISKS Score: (4) Rationale: Eni pinpoints existing and proposed climate-related laws and
regulations impacting the company in particular (e.g., supranational Carbon Pricing Mechanisms), noting potential financial impacts, and provides some discussion regarding the company’s mitigation efforts.
Source(s): “We believe that the Company will continue to incur significant
amounts of expenses in order to comply with pending environmental, health and safety protection and safeguard regulations, particularly in order to achieve any mandatory or voluntary reduction in the emission of GHG in the atmosphere and cope with climate change and water quality of discharges, as well as availability.” (Eni.20F, p. 78)
192

Eni S.p.A.
“Today, about half of the GHG direct emissions coming from Eni operated assets are already included in national or supranational Carbon Pricing Mechanisms, such as the European Emission Trading Scheme. Eni expects that more governments will adopt similar schemes and that a growing share of the Group’s GHG emissions will be subject to carbon-pricing and other forms of climate regulation in the short to medium term. Eni expects that governments require companies to apply technical measures to reduce their GHG emissions. Eni is already incurring operating costs related to its participation in the European Emission Trading Scheme, whereby Eni is required to purchase on the open markets emission allowances in case its GHG emissions exceed freely-assigned emission allowances (see Note 27 to the Financial Statements). In 2018 to comply with this carbon emissions scheme, Eni purchased on the open market allowances corresponding to 12.7 million tonnes of CO2 emissions. In certain jurisdictions, Eni is also subject to carbon pricing schemes in Norway. Due to the likelihood of new regulations in this area, Eni expects additional compliance obligations with respect to the release, capture, and use of carbon dioxide that could result in increased investments and higher project costs for Eni and could have a material adverse effect on Eni’s operating costs and results of operations, cash flow, financial condition, business prospects and shareholders’ returns. Eni also expects that governments will also require companies to apply technical measures to reduce their GHG emissions.” (Eni.20F, p. 21)
“At the international level, in 2018 an agreement was reached within the IMO (International Maritime Organization) on the adoption of an initial strategy to reduce greenhouse gas emissions from the shipping sector. Also in the light of this regulatory development, Eni has strengthened its commitment to the development of green business and renewable sources.” (Eni.AR, p. 109)
INDICATOR 3AII. PHYSICAL RISKS Score: (4)
193

Eni S.p.A.
Rationale: Eni acknowledges climate change as a contributing factor to the potential physical risks facing its business and provides a detailed analysis of which of its operational segments are most likely to be impacted.
Source(s): “The scientific community has concluded that increasing global
average temperatures produces significant physical effects, such as the increased frequency and severity of hurricanes, storms, droughts, floods or other extreme climatic events that could interfere with Eni’s operations and damage Eni’s facilities. Extreme and unpredictable weather phenomena can result in material disruption to Eni’s operations, and consequent loss of or damage to properties and facilities, as well as a loss of output, loss of revenues, increasing maintenance and repair expenses and cash flow shortfall.” (Eni.20F, p. 21)
“Significant changes in weather conditions in Italy and in the rest of Europe from year to year may affect demand for natural gas and some refined products. In colder years, demand for such products is higher. Accordingly, the results of operations of the Gas & Power segment and, to a lesser extent, the Refining & Marketing business, as well as the comparability of results over different periods may be affected by such changes in weather conditions.” (Eni.AR, p. 101)
“Eni’s oil and natural gas offshore operations are particularly exposed to health, safety, security and environmental risks...In 2018, approximately 56% of Eni’s total oil and gas production for the year derived from offshore fields, mainly in, Libya, Norway, Angola, Egypt, the Gulf of Mexico, Italy, Congo, Indonesia, Venezuela, the United Arab Emirates, the United Kingdom and Nigeria. Offshore operations in the oil and gas industry are inherently riskier than onshore activities…furthermore, offshore operations are subject to marine risks, including storms and other adverse weather conditions and vessel collisions, as well as interruptions or termination by governmental authorities based on safety, environmental and other considerations. Failure to manage these risks could result in injury or loss of life, damage to property or environmental damage, and could result in regulatory action, legal
194

Eni S.p.A.
liability, loss of revenues and damage to Eni’s reputation and could have a material adverse effect on Eni’s future growth prospects, results of operations, cash flows, liquidity, reputation and shareholders’ returns.” (Eni.20F, pp. 9-10)
“Eni’s operations are often conducted in difficult and/or environmentally sensitive locations such as the Gulf of Mexico, the Caspian Sea and the Arctic. In such locations, the consequences of any incident could be greater than in other locations.” (Eni.20F, p. 9)
INDICATOR 3AIII. MARKET AND OTHER INDIRECT RISKS AND OPPORTUNITIES Score: (2) Rationale: Eni offers an analysis of how it might be affected by indirect risks and
opportunities related to climate change, including potential financial impacts, but has not specifically discussed recent high-profile climate litigation in which it is a defendant (i.e., County of San Mateo v. Chevron Corp.).
Source(s): “Climate change is analysed, evaluated and managed by
considering energy transition aspects (market scenario, regulatory and technological evolution, reputational issues) and physical phenomena. The analysis is carried out using an integrated and cross-cutting approach which involves specialist departments and business lines and considers the related risks and opportunities…In the IEA Sustainable Development Scenario5 (WEO 2018), taken as a reference to assess the risks of the energy transition, fossil fuels are expected to continue to play a central role in the energy mix...Natural gas, which grows also in the SDS scenario, represents an opportunity for strategic repositioning for energy companies, due to its lower carbon intensity, the possibility of integration with renewable sources in electricity production and the prospects of growing hydrogen production....There is residual uncertainty linked to the effect that regulatory developments and breakthrough technologies could have on the scenario (i.e., the IEA Sustainable Development Scenario), with a consequent impact on the Company business model.” (Eni.AR, p. 109)
195

Eni S.p.A.
“Eni expects that the achievement of the Paris Agreement goal of holding the increase in global average temperature to less than 2°C above pre-industrial levels, or the more stringent goal advocated by the Intergovernmental Panel on Climate Change (IPCC) to limit global warming to 1.5°C, will strengthen the global response to the threat of climate change and spur governments to introduce further measures and policies targeting the reduction of GHG emissions, which will reduce local demand for fossil fuels, thus negatively affecting global demand for oil and natural gas. Eni’s business depends on the global demand for oil and natural gas. If existing or future laws, regulations, treaties, or international agreements related to GHG and climate change, including incentives to preserve energy or use alternative energy sources, technological breakthrough in the field of renewable energies or mass-adoption of electric vehicles reduce the worldwide demand for oil and natural gas by a large amount, Eni’s results of operations, cash flow, financial condition, business prospects and shareholders’ returns may be significantly and adversely affected.” (Eni.20F, p. 21)
“...technological development in the field of renewable energy production and storage and in the efficiency of electric vehicles could have impacts on the demand for hydrocarbons and therefore on the business. Scientific and technological research is therefore one of the levers on which Eni’s decarbonization strategy is based.” (Eni.AR, p. 109)
“In case of a structural decline in hydrocarbons prices, the Company may review the carrying amounts of oil and gas properties and this could result in recording material asset impairments. Finally, lower oil and gas prices could result in the de-booking of proved reserves, if they become uneconomic in this type of environment. These risks may adversely impact the Group’s results of operations, cash flow, liquidity, business prospects and shareholder returns, including dividends and the share prices.” (Eni.AR, p. 88)
“...there is a reputational risk linked to the fact that oil companies are increasingly perceived by institutions and the general
196

Eni S.p.A.
public as the entities responsible of the global warming due to GHG emissions across the value chain and in particular related with the use of energy products. This could possibly make Eni’s shares less attractive to investment funds and individual investors who have been more and more assessing the risk profile of companies against their carbon footprint when making investment decisions. This trend could have a material adverse effect on the price of our securities and our ability to access equity or other capital markets. Additionally, the World Bank has announced plans to stop financing upstream oil and gas projects in 2019. Similarly, according to press reports, other financial institutions also appear to be considering limiting their exposure to certain fossil fuel projects. Accordingly, our ability to use financing for future projects may be adversely impacted. This could also adversely impact our potential partners’ ability to finance their portion of costs, either through equity or debt.” (Eni.20F, p. 20)
“Growing worldwide public concern over greenhouse gas (GHG) emissions and climate change, as well as increasingly regulations in this area, could adversely affect the Group’s business and reputation, increase its operating costs and reduce its results of operations, cash flow, financial condition, business prospects and shareholders returns. Those risks may emerge in the short and medium-term, as well as over the long-term.” (Eni.20F, p. 20)
“Further, in some countries, governments and regulators have filed lawsuits seeking to hold fossil fuel companies, including Eni, liable for costs associated with climate change. Losing any of these lawsuits could have a material adverse effect on our results of operations, cash flows, liquidity and business prospects.” (Eni.20F, p. 21)
INDICATOR 3B. DELEGATION OF BOARD MEMBERS AND/OR COMMITTEES WITH EXPLICIT OVERSIGHT OF CLIMATE CHANGE POLICY Score: (3)
197

Eni S.p.A.
Rationale: Eni’s Board of Directors maintains an internal "Sustainability and Scenarios” committee with explicit oversight of climate change-related corporate governance.
Source(s): “The Board of Directors (BoD) plays a central role in managing the
main aspects linked to climate change...On the subject of climate change, the Board of Directors is supported mainly by three committees of directors: Sustainability and Scenarios Committee, Control and Risk Committee and Remuneration Committee.” (Eni.CO2R, p. 4)
“At its meeting of 13 April 2017, the Board of Directors formed four internal Committees to provide advice and offer proposals: the Control and Risk Committee, the Remuneration Committee (Compensation Committee until 15 March 2018), the Nomination Committee and the Sustainability and Scenarios Committee.” (Eni.CWS1)
“In accordance with the By-laws, the Committee (i.e., the Sustainability and Scenarios Committee) provides recommendations and advice to the Board of Directors on scenarios and sustainability issues, i.e. the processes, projects and activities aimed at ensuring the Company’s commitment to sustainable development along the value chain, particularly with regard to: health, well-being and safety of people and communities; respect and protection of rights, particularly of the human rights; local development; access to energy, energy sustainability and climate change; environment and efficient use of resources; integrity and transparency; and innovation.” (Eni.CCC1, p. 3; see also Eni.SR, p. 11)
INDICATOR 3C. DOES THE COMPANY SUPPORT CLIMATE-RELATED SHAREHOLDER RESOLUTIONS? Score: (3) Rationale: Eni has not faced any climate-related shareholder resolutions put
forward by established networks of socially responsible investors during the reporting period.
198

Eni S.p.A.
Source(s): (see Ceres – Climate and Sustainability Shareholder Resolutions Database; SEC – Division of Corporate Finance 2019)
CRITERION 4 – WHAT ARE THE COMPANY’S AFFILIATIONS WITH THIRD PARTIES THAT SPREAD DISINFORMATION ON CLIMATE SCIENCE? INDICATOR 4A. THE AMERICAN LEGISLATIVE EXCHANGE COUNCIL (ALEC) Score: (3) Rationale: Eni is based in Italy and has no operations in the association’s
jurisdiction. Company is not cited by Source Watch or DeSmogBlog as having ever been affiliated with the association.
Source(s): (see Source Watch - ALEC; DeSmogBlog – ALEC) INDICATOR 4B. THE AMERICAN PETROLEUM INSTITUTE (API) Score: (3) Rationale: Eni is based in Italy and is neither in API’s current membership list
nor noted by DeSmogBlog as having ever been affiliated with association.
Source(s): (see API – Members; DeSmogBlog – API) INDICATOR 4C. THE NATIONAL ASSOCIATION OF MANUFACTURERS (NAM) Score: (3) Rationale: Eni is based in Italy and is neither in NAM’s current BOD list nor
noted by DeSmogBlog as having ever been affiliated with association.
Source(s): (see NAM – Board of Directors; DeSmogBlog – NAM)
199

Eni S.p.A.
INDICATOR 4D. THE WESTERN STATES PETROLEUM ASSOCIATION (WSPA) Score: N/A Rationale: Eni is based in Italy and has no operations in the association’s
jurisdiction. Further, Eni is neither mentioned by DeSmogBlog as having ever been affiliated with the association nor listed as a corporate member on WSPA’s website.
Source(s): (see WSPA – Member Companies; DeSmogBlog – WSPA) INDICATOR 4E. AMERICAN FUEL AND PETROCHEMICAL MANUFACTURERS (AFPM) Score: (3) Rationale: Eni is based in Italy and is neither in AFPM’s current membership list
nor noted by DeSmogBlog as having ever been affiliated with association.
Source(s): (see AFPM – Membership Directory; DeSmogBlog – AFPM) CRITERION 5 – DOES THE COMPANY PUBLICLY SUPPORT THE NEED FOR CLIMATE POLICY AND REGULATIONS? INDICATOR 5A. REGULATIONS, CARBON TAX, EMISSIONS TRADING, RENEWABLE ENERGY, CCS, ETC. Score: (4) Rationale: Eni (1) has supported carbon pricing generally and is a part of Paying
for Carbon and the Carbon Pricing Leadership Coalition, (2) is a member of the Oil & Gas Climate Initiative to encourage collaboration with industry peers to promote solutions such as CCUS and (3) is a member of the Make Power Clean initiative which has advocated in favor of climate change-related legislation (e.g., “Regulation on the Internal Market for Electricity”) before the Council of the EU.
200
Eni S.p.A.
Source(s): “Our industry faces a challenge: we need to meet greater energy
demand with less CO2. We are ready to meet that challenge and we are prepared to play our part. We firmly believe that carbon pricing will discourage high carbon options and reduce uncertainty that will help stimulate investments in the right low carbon technologies and the right resources at the right pace. We now need governments around the world to provide us with this framework and we believe our presence at the table will be helpful in designing an approach that will be both practical and deliverable.” (Eni.FPS1)
“...in the Oil & Gas sector, Eni is playing a leading role in many important partnerships and, in particular, with the Oil & Gas Climate Initiative and the Paying for Carbon Coalition, which aim at defining concrete solutions, in both the short and long term, for the energy transition to a low carbon future.” (Eni.CWS2)
“Europe can build a cleaner future for its citizens – but only with the right electricity market design. As the vote in the ITRE committee approaches, we call on you to act consistently and endorse the proposal to limit access to capacity mechanisms to plants emitting 550g CO2/kWh or less as a way of ensuring a cleaner power supply for all Europeans. To make a difference, the 550g carbon criterion should enter into force as quickly as possible, for all power plants, and cover the widest possible scope. Limiting exceptions and insisting on a rapid implementation is the best way to ensure Europe meets its ambitious climate objectives, unlocking the potential of cleaner energy supply and promoting renewables’ growth. The European Parliament can be once again the voice of ambition and leadership by defending the right of European citizens to have energy policies that work towards our climate goals...This letter is endorsed by: BNE, Eni, ESIA (European Semiconductor Industry Association), ESTELA (European Solar Thermal Electricity Association), Eurogas, EBA (European Biogas Association), First Solar, Gas Natural Fenosa, Gassco, Joule Assets, NOROG (Norsk Olje & Gass), Nordex Acciona, PKA, REstore, Siemens, Shell, SNAM, SMA, Solar Power Europe, Statoil, Total, VaasaETT, Voltalis, Wintershall.” (Eni.TPS1)
INDICATOR 5B. PARIS AGREEMENT
201

Eni S.p.A.
Score: (4) Rationale: Eni has explicitly endorsed the Paris Climate Agreement’s global
temperature targets and actively campaigned for legislation that would further the goals of the Agreement (i.e., Make Power Clean Initiative).
Source(s): “On November 4, 2016, the Paris Agreement entered into force,
exactly 30 days after the date on which the last of at least 55 Parties to the Convention accounting in total for at least an estimated 55% of the total global greenhouse gas emissions have deposited their instruments of ratification. To date, the 185 Parties have ratified the Convention. This important step in the common international Climate Change strategy sets out a global action plan to put the world on track to avoid dangerous climate change by limiting global warming to well below 2°C. By the ratification of the Convention, the governments agreed to limit the increase to 1.5°C, since this would significantly reduce risks and the impacts of climate change.” (Eni.20F, p. 78)
“We share the objectives of the Paris agreement to keep global warming <2°.” (Eni.FPS2, p. 21)
“Eni welcomed the success of the Paris meeting and joined the Paris Pledge for Action initiative, put forward by President Laurent Fabius to demonstrate the commitment of non-governmental stakeholders to adopting clear rules in line with the objectives of the Accords.” (Eni.CWS3)
“Within the framework of the Paris Agreement and adopting the language of the Sustainable Development Goals (SDGs) set out in the United Nations 2030 Agenda, Eni recognizes the need to actively intervene in the fight against climate change through an accurate integrated strategy that is implemented in our path to decarbonization, as detailed in the dedicated report.” (Eni.SR, p. 3)
“As the E.U. debates reforming the Electricity Market Design, a coalition of energy companies and association operating in Europe has called on the commission to make any new legislation consistent
202

Eni S.p.A.
with E.U. energy and climate policy. The coalition launched an initiative called Make Power Clean, in an attempt to promote an EU electricity market that can deliver cleaner power across the region. A letter, signed by the likes of Eni, Shell, WindEurope, Siemens, and Total, praises the proposal to introduce a carbon eligibility criterion, but urges the commission to ensure that undue compensation doesn’t end up being paid to the highest polluting power plants...In short, the Make Power Clean movement wants to ensure that only the cleaner technologies are eligible for capacity remuneration mechanisms. Right now, the least clean power plants are eligible for public money, something which is putting the goals of the Paris agreement in jeopardy.” (Eni.CWS4)
CRITERION 6 – HAS THE COMPANY BEEN PUBLICLY TRANSPARENT ABOUT ITS POSITION, ACTIONS, AND AFFILIATIONS WITH REGARD TO CLIMATE SCIENCE AND CLIMATE CHANGE? INDICATOR 6A. WEBPAGE DEDICATED TO CLIMATE CHANGE Score: (5) Rationale: Eni maintains a separate webpage on its website devoted to climate
change. Source(s): (Eni.CWS5) INDICATOR 6B. STAND-ALONE SUSTAINABILITY REPORT WITH SPECIFIC REFERENCE TO CLIMATE CHANGE Score: (5) Rationale: Eni produces a sustainability report that is easily accessible from the
website and that has a section on decarbonization, which is the de facto section on climate change.
Source(s): (see Eni.SR, p. 20) INDICATOR 6C. DISCLOSURE TO CDP
203

Eni S.p.A.
Score: (5) Rationale: CDP website indicates “Submitted” from Eni for Climate Change
2018. Source(s): (see Eni.CDP2) INDICATOR 6D. DISCLOSURE OF THIRD-PARTY RELATIONSHIPS AND LOBBYING ACTIVITIES Score: (3) Rationale: Eni notes that it “...works with the academic community, civil society,
institutions and businesses to research specific solutions for sustainable development,” and lists several associations with which it “partners” (e.g., IPIECA), but does not state whether the short list includes all of the firm’s memberships.
Source(s): “In its relations with institutions, Eni also works through the trade
associations that represent it in Italy, Europe and the rest of the world. In this context, it recognises the importance that the climate positions of the associations to which it belongs do not conflict with the decarbonization strategy so as not to compromise support for the objectives of the Paris Agreement. In this context, Eni has started a detailed mapping of the positions relating to climate change of the main associations to which it belongs in order to verify the absence of conflicts with respect to its decarbonization strategy or to take action in cases where misalignments are found.” (Eni.CO2R, p. 35)
INDICATOR 6E. REPORT ON CLIMATE RELATED RISK SCENARIOS Score: (5) Rationale: Eni produced and published an analysis on what a 2°C or lower
increase in global temperature would mean for its businesses, strategies, and financial planning.
204
Eni S.p.A.
Source(s): “To analyse risks and opportunities, Eni refers to the IEA’s Sustainable Development Scenario (SDS), considered the most challenging for the path to decarbonization, since it is a “predefined objective” scenario which aims to contain emissions well below 2 °C in line with the objectives of the Paris Agreement, achieving universal access to energy and reducing local pollution.” (Eni.CO2R, p. 10)
“...in the New Policies Scenario (NPS) of the International Energy Agency (IEA), global energy demand is expected to grow by 27% by 2040 compared to 2017 levels, driven mainly by non-OECD Countries (+45%)...According to the IEA Sustainable Development Scenario (SDS), based on the baseline assumption of achieving the Paris target, emissions should be reduced by 46% in 2040 compared to 2017.” (Eni.SR, p. 6; see also Eni.SR, p. 18)
“...management performed a review of the recoverability of the book values of the Company’s oil & gas assets under the assumptions set forth in the IEA SDS...The hydrocarbons pricing assumptions of the IEA SDS scenario are more optimistic than Eni’s scenario, particularly the IEA SDS scenario projects crude oil prices to be much higher than Eni’s crude oil pricing assumptions. On the other hand, CO2 emissions costs under the IEA SDS assumptions will show a strong uptrend consistent with the goal of encouraging the adoption of low carbon technologies. Such CO2 emissions costs as estimated by the IEA SDS would reach up to 140 $ per ton in real terms in 2040, which is higher than Eni’s CO2 pricing trends and assumptions for the medium-long term. Nevertheless, the sensitivity test performed at Eni’s oil&gas CGUs under the IEA SDS assumptions indicated the resiliency of Eni’s asset portfolio in terms of carrying amounts and fair value, because the loss of value that would result from the higher CO2 costs assumed by the IEA SDS (in comparison to Eni’s projections) is outweighed by higher assumptions for crude oil prices assumed in the IEA SDS scenario.” (Eni.20F, p. 29)
“Eni’s hydrocarbon portfolio has a high incidence of natural gas (>50%), a bridge to a low-emission future. The main upstream projects being executed have a mean portfolio break-even point at a Brent price of $25 per barrel and are therefore resilient in low carbon scenarios.” (Eni.SR, p. 20; see also Eni.CO2R, p. 13)
205

Eni S.p.A.
“The return on the main investment projects is tested using a sensitivity to carbon pricing when the Final Investment Decisions (FID) is made and later during the six-monthly monitoring of projects, based on the following assumptions: (1) scenario of hydrocarbon prices and CO2 cost of Eni and (2) IEA SDS low-carbon scenario of hydro carbon prices and cost of CO2. The results of the most recent monitoring have highlighted marginal impacts on internal return rates. In addition, the portfolio composition and decarbonization strategy minimises the risk of stranded assets in the upstream sector thanks to: (1) a progressive reduction of the break-even of Oil & Gas projects by optimising the asset portfolio with a significant share of conventional gas; (2) near field exploration; (3) improved efficiency in development.” (Eni.CO2R, p. 23)
206

EOG Resources
XIII. EOG Resources CRITERION 1 – WHAT IS THE COMPANY’S POSITION ON CLIMATE SCIENCE? INDICATOR 1A. CONSISTENTLY ACCURATE PUBLIC STATEMENTS ON CLIMATE SCIENCE AND THE CONSEQUENT NEED FOR SWIFT AND DEEP REDUCTIONS IN EMISSIONS FROM THE BURNING OF FOSSIL FUELS Score: (1) Rationale: EOG misrepresents current climate science by subtly suggesting
that certain settled scientific assessments of climate change are uncertain (e.g., “climate change may be associated with...changes in temperature”). Further, EOG downplays the need to reduce GHG emissions by suggesting an inherent tradeoff between providing affordable sources of energy and taking action to combat climate change.
Source(s): “In addition, there has been public discussion that climate change
may be associated with more frequent or more extreme weather events, changes in temperature and precipitation patterns, changes to ground and surface water availability, and other related phenomena, which could affect some, or all, of our operations.” (EOG.10K, p. 20)
“EOG supports efforts to understand and address the contribution of human activities to global climate change. We believe climate change policies should be based on sound scientific and economic considerations and rely on market forces to efficiently encourage consumer conservation and the development of alternative energy sources. EOG also believes that any emission limits or standards should be based on reliable, available and economically feasible technology.” (EOG.SR, p. 10)
“Providing sustainable, low-cost energy means more jobs and more affordable energy for homes, schools and businesses. At EOG, we embrace all aspects of providing low-cost energy for a sustainable future.” (EOG.SR, p. 3)
207

EOG Resources
CRITERION 2 – WHAT MEASURES IS THE COMPANY TAKING TO REDUCE ITS CARBON FOOTPRINT? INDICATOR 2A. GHG EMISSIONS TARGETS Score: (1) Rationale: EOG has a “goal” of reducing emissions through various “normal
operating practices” (e.g., leak detection and repair, conservation measures), and cites an “emissions management system” to presumably aid in the achievement of that goal, but makes no mention of accompanying targets and/or timetables, indicating the company‘s efforts are not pursuant to a GHG reduction plan.
Source(s): “It is important to EOG — for environmental, operational and
economic reasons — to reduce emissions from its operations. Our practices and programs to pursue this goal are described in this report…” (EOG.SR, p. 10)
“EOG’s normal operating practices are designed to minimize emissions...Furthermore, EOG’s facilities are designed to minimize emissions and maximize recovery of vapors.” (EOG.SR, p. 11)
“EOG believes that its strategy to reduce GHG emissions throughout its operations is both in the best interest of the environment and a prudent business practice. EOG has developed a system that is utilized in calculating GHG emissions from its operating facilities. This emissions management system calculates emissions based on recognized regulatory methodologies, where applicable, and on commonly accepted engineering practices. EOG reports GHG emissions for facilities covered under the U.S. EPA's Mandatory Reporting of Greenhouse Gases Rule published in 2009, as amended.” (EOG.10K, p. 9)
INDICATOR 2B. GHG EMISSIONS REDUCTIONS Score: (1)
208

EOG Resources
Rationale: Company’s GHG emissions intensity has increased in each of the last two reporting years.
Source(s): [see Supplemental Data] INDICATOR 2C. R&D INTO LOW-CARBON TECHNOLOGIES Score: (1) Rationale: EOG’s disclosures offer general statements about investment in and
development of new technologies that might mitigate the company’s emissions, but do not specifically cite in-house and/or third-party R&D into low-carbon technologies.
Source(s): “EOG is also working with a number of technology companies
to develop water reuse technologies that can accommodate high volumes of produced water. In addition, EOG is conducting pilot projects using other technologies designed to recycle water for reuse. Each producing basin in North America has different challenges relating to geology, the geochemistry of the water and available infrastructure, and, therefore, different technologies are required in different basins.” (EOG.SR, p. 17)
“We use a variety of existing technologies and are constantly testing new technologies developed both internally and made available from third parties. These technologies reduce our overall fuel usage, increase fuel efficiency and drive down emissions.” (EOG.SR, p. 14)
INDICATOR 2D. USE OF AN INTERNAL PRICE ON CARBON Score: (1) Rationale: EOG's disclosures do not reference company use of an internal price
on carbon in its investment decisions. Source(s):
209
EOG Resources
CRITERION 3 – IS CLIMATE SCIENCE INTEGRAL TO THE GOVERNANCE AND OVERSIGHT OF THE COMPANY? INDICATOR 3A. DELINEATION OF RISKS AND RISK MANAGEMENT PROCEDURES RELATED TO CLIMATE CHANGE INDICATOR 3AI. REGULATORY RISKS Score: (3) Rationale: EOG identifies specific existing and proposed climate-related laws
and regulations that may affect it (e.g., EPA regulation of GHG emissions under the Clean Air Act), but its analysis of possible impacts particular to the company, including financial, is general.
Source(s): “Compliance with environmental laws and regulations increases
EOG's overall cost of business, but has not had, to date, a material adverse effect on EOG's operations, financial condition or results of operations. In addition, it is not anticipated, based on current laws and regulations, that EOG will be required in the near future to expend amounts (whether for environmental control facilities or otherwise) that are material in relation to its total exploration and development expenditure program in order to comply with such laws and regulations. However, given that such laws and regulations are subject to change, EOG is unable to predict the ultimate cost of compliance or the ultimate effect on EOG's operations, financial condition and results of operations.” (EOG.10K, p. 9)
“Local, state, federal and international regulatory bodies have been increasingly focused on GHG emissions and climate change issues in recent years. In addition to the U.S. EPA's rule requiring annual reporting of GHG emissions, the U.S. EPA has adopted regulations for certain large sources regulating GHG emissions as pollutants under the federal Clean Air Act. In May 2016, the U.S. EPA issued regulations that require operators to reduce methane emissions and emissions of volatile organic compounds (VOC) from new, modified and reconstructed crude oil and natural gas wells and equipment located at natural gas production gathering
210

EOG Resources
and booster stations, gas processing plants and natural gas transmission compressor stations.” (EOG.10K, p. 9)
“At the international level, in December 2015, the U.S. participated in the 21st Conference of the Parties of the United Nations Framework Convention on Climate Change in Paris, France. The Paris Agreement (adopted at the conference) calls for nations to undertake efforts with respect to global temperatures and GHG emissions. The Paris Agreement went into effect on November 4, 2016. However, the U.S. has announced its intention to withdraw from the Paris Agreement. In response, many state and local officials have stated their intent to intensify efforts to uphold the commitments set forth in the international accord.” (EOG.10K, p. 9)
“EOG is unable to predict the timing, scope and effect of any currently proposed or future investigations, laws, regulations or treaties regarding climate change and GHG emissions, but the direct and indirect costs of such investigations, laws, regulations and treaties (if enacted) could materially and adversely affect EOG's operations, financial condition and results of operations.” (EOG.10K, p. 9)
“Proposals and proceedings that might affect the oil and gas industry are considered from time to time by Congress, the state legislatures, the FERC and federal, state and local regulatory commissions, agencies, councils and courts. EOG cannot predict when or whether any such proposals or proceedings may become effective. It should also be noted that the oil and gas industry historically has been very heavily regulated; therefore, there is no assurance that the approach currently being followed by such legislative bodies and regulatory commissions, agencies, councils and courts will remain unchanged.” (EOG.10K, p. 8)
INDICATOR 3AII. PHYSICAL RISKS Score: (3)
211

EOG Resources
Rationale: EOG acknowledges that physical climate-related risks might impact its operations, but offers no details about potential impacts on the company’s operations in particular.
Source(s): “In addition, there has been public discussion that climate change
may be associated with more frequent or more extreme weather events, changes in temperature and precipitation patterns, changes to ground and surface water availability, and other related phenomena, which could affect some, or all, of our operations.” (EOG.10K, p. 20)
INDICATOR 3AIII. MARKET AND OTHER INDIRECT RISKS AND OPPORTUNITIES Score: (2) Rationale: EOG notes some issues associated with the energy transition (e.g.,
changing consumer behavior) and discusses the competitive advantages of its larger, more integrated, peers with respect to such a transition, but in general offers little commentary about the indirect risks from climate change facing the company.
Source(s): “We also recognize the increasing interest of our shareholders
and other stakeholders in how changes in carbon-related regulations and policy initiatives, the availability of alternative energy sources, and consumer behavior could each impact global demand and pricing for crude oil and any corresponding impacts to EOG.” (EOG.SR, p. 3)
“EOG's larger competitors may have a competitive advantage when responding to factors that affect demand for crude oil and natural gas, such as changing worldwide prices and levels of production and the cost and availability of alternative fuels. EOG also faces competition, to a lesser extent, from competing energy sources, such as alternative energy sources.” (EOG.10K, p. 7)
INDICATOR 3B. DELEGATION OF BOARD MEMBERS AND/OR COMMITTEES WITH EXPLICIT OVERSIGHT OF CLIMATE CHANGE POLICY Score: (1)
212

EOG Resources
Rationale: EOG has no board-level committee with explicit oversight of the
company’s climate change policy. Source(s): “Our Board retains primary responsibility for risk oversight. To
assist the Board in carrying out its oversight responsibilities, members of our senior management report to the Board on areas of risk to our company. For example, to assist our Board in carrying out its oversight responsibilities with respect to climate change-related risks, members of our senior management discuss climate change and environmental-related matters with our Board throughout the year and, at least annually, reviews with the Board our environmental performance as well as trends and industry comparisons.” (EOG.PRXY1, p. 8)
INDICATOR 3C. DOES THE COMPANY SUPPORT CLIMATE-RELATED SHAREHOLDER RESOLUTIONS? Score: (1) Rationale: EOG successfully blocked a resolution put forward by Trillium Asset
Management during the 2018 proxy season asking the company to “adopt company-wide, quantitative, time-bound targets for reducing greenhouse gas (GHG) emissions and issue a report, at reasonable cost and omitting proprietary information, discussing its plans and progress towards achieving these targets.”
Source(s): (see EOG.TPS1, p. 4; see also Ceres – Climate and Sustainability
Shareholder Resolutions Database; SEC – Division of Corporate Finance 2019)
CRITERION 4 – WHAT ARE THE COMPANY’S AFFILIATIONS WITH THIRD PARTIES THAT SPREAD DISINFORMATION ON CLIMATE SCIENCE? INDICATOR 4A. THE AMERICAN LEGISLATIVE EXCHANGE COUNCIL (ALEC) Score: (3)
213

EOG Resources
Rationale: EOG is is not cited by Source Watch or DeSmogBlog as having ever been affiliated with the association.
Source(s): (see Source Watch - ALEC; DeSmogBlog – ALEC)
INDICATOR 4B. THE AMERICAN PETROLEUM INSTITUTE (API) Score: (1) Rationale: Although EOG is not listed as a current member of API on the
association’s website, it is a member of one of the association’s initiatives. Further, EOG board member James Day is an honorary director of API.
Source(s): “In December 2017, EOG joined the API Environmental
Partnership, a landmark partnership of companies within the energy industry intended to accelerate improvements to environmental performance in operations across the country. One of the partnership’s goals is to accelerate emissions reductions.” (EOG.SR, p. 19)
“Mr. Day...is an honorary director of the American Petroleum Institute. (EOG.CWS1; see also API – Members; DeSmogBlog – API)
INDICATOR 4C. THE NATIONAL ASSOCIATION OF MANUFACTURERS (NAM) Score: (3) Rationale: EOG is not listed on NAM’s website as a current member of
association’s executive committee, and company is not mentioned by DeSmogBlog as having ever been affiliated with association.
Source(s): (see NAM – Board of Directors; DeSmogBlog – NAM) INDICATOR 4D. THE WESTERN STATES PETROLEUM ASSOCIATION (WSPA) Score: N/A
214

EOG Resources
Rationale: EOG is based in Texas and has no operations in the association’s
jurisdiction. Further, the company is neither mentioned by DeSmogBlog as having ever been affiliated with the association nor listed as a corporate member on WSPA’s website.
Source(s): (see WSPA – Member Companies; DeSmogBlog – WSPA)
INDICATOR 4E. AMERICAN FUEL AND PETROCHEMICAL MANUFACTURERS (AFPM) Score: (3) Rationale: EOG is not listed as a current member on AFPM’s website, and
company is not mentioned by DeSmogBlog as having ever been affiliated with association.
Source(s): (see AFPM – Membership Directory; DeSmogBlog – AFPM) CRITERION 5 – DOES THE COMPANY PUBLICLY SUPPORT THE NEED FOR CLIMATE POLICY AND REGULATIONS? INDICATOR 5A. REGULATIONS, CARBON TAX, EMISSIONS TRADING, RENEWABLE ENERGY, CCS, ETC. Score: (2) Rationale: EOG believes climate change policies should be, at least in part,
market-based, but the company has not identified even a general category of climate policy that it supports.
Source(s): “We believe climate change policies should be based on sound
scientific and economic considerations and rely on market forces to efficiently encourage consumer conservation and the development of alternative energy sources. EOG also believes that any emission limits or standards should be based on reliable, available and economically feasible technology.” (EOG.SR, p. 10)
215

EOG Resources
“Externally, we strive to promote policies through our membership and participation in trade associations that are consistent with EOG’s position on global climate change.” (EPG.CDP1)
“We also recognize the increasing interest of our shareholders and other stakeholders in how changes in carbon-related regulations and policy initiatives...could each impact global demand and pricing for crude oil and any corresponding impacts to EOG.” (EOG.SR, p. 3)
INDICATOR 5B. PARIS AGREEMENT Score: (1) Rationale: EOG’s website and public disclosures do not express public support
for policies or regulations to advance the Paris Agreement. Source(s): CRITERION 6 – HAS THE COMPANY BEEN PUBLICLY TRANSPARENT ABOUT ITS POSITION, ACTIONS, AND AFFILIATIONS WITH REGARD TO CLIMATE SCIENCE AND CLIMATE CHANGE? INDICATOR 6A. WEBPAGE DEDICATED TO CLIMATE CHANGE Score: (1) Rationale: EOG’s website includes a “Sustainability” page, but that page offers
little information generally, and does not mention climate change specifically.
Source(s): (see EOG.CWS3) INDICATOR 6B. STAND-ALONE SUSTAINABILITY REPORT WITH SPECIFIC REFERENCE TO CLIMATE CHANGE Score: (5)
216

EOG Resources
Rationale: EOG's sustainability report is easily accessible through its website and contains a section dedicated to climate change.
Source(s): (see EOG.SR, p. 10) INDICATOR 6C. DISCLOSURE TO CDP Score: (5) Rationale: CDP website indicates “Submitted” from EOG for Climate Change
2018. Source(s): (see EPG.CDP2) INDICATOR 6D. DISCLOSURE OF THIRD-PARTY RELATIONSHIPS AND LOBBYING ACTIVITIES Score: (3) Rationale: EOG’s CDP disclosure identifies trade associations of which the
company is a member and believes are “likely to take a position on climate change legislation,” but the company does not provide a comprehensive list of its affiliations with trade associations and/or lobbying groups.
Source(s): “Like other companies in the oil and gas industry, EOG participates
in various state and national trade associations in order to advance its business interests. EOG is not aware of any contributions made by these associations to political parties, candidates, organizations or campaigns that were funded with EOG membership dues. EOG acknowledges that it benefits from the time such trade associations spend engaged in efforts to educate lawmakers and voters on issues relevant to the oil and gas industry as a whole. These trade association activities are not, however, controlled by EOG. Moreover, these trade associations, which represent their collective membership and not individual member companies, take positions on a wide variety of matters, not all of which impact or are necessarily supported by EOG.” (see EPG.FPS1; see also EPG.CDP3; EPG.CDP4)
217

EOG Resources
INDICATOR 6E. REPORT ON CLIMATE RELATED RISK SCENARIOS Score: (1) Rationale: EOG did not produce and publish a 2°C scenario report in the
reporting period. Source(s):
218

Equinor
XIV. Equinor CRITERION 1 – WHAT IS THE COMPANY’S POSITION ON CLIMATE SCIENCE? INDICATOR 1A. CONSISTENTLY ACCURATE PUBLIC STATEMENTS ON CLIMATE SCIENCE AND THE CONSEQUENT NEED FOR SWIFT AND DEEP REDUCTIONS IN EMISSIONS FROM THE BURNING OF FOSSIL FUELS Score: (4) Rationale: Equinor consistently acknowledges the scientific evidence of climate
change in all company platforms and affirms the consequent need for swift and deep reductions in fossil fuel emissions, but does not highlight the urgency and importance of achieving global net-zero CO2 emissions to limit a rise in global temperature.
Source(s): “Equinor acknowledges the Intergovernmental Panel on Climate
Change’s (IPCC’s) scientific consensus of the influence human activities have on inducing climate change. Equinor aims to be a part of a global energy transformation and continue to turn natural resources into energy for people and progress for society.” (Equinor.CWS1)
“Methane is the second most important greenhouse gas contributing to human induced climate change.” (Equinor.SR. p. 21)
“Climate change is happening, energy markets are changing, and we know that the world needs a comprehensive transition of our energy systems. These facts are integrated into our strategies.” (Equinor.IR. p. 9)
“Achieving the ambitions of the Paris Climate Agreement will require significant efforts from governments, companies and wider society – significantly more than the current pledges made by countries. The urgent need for climate action has been highlighted by the Intergovernmental Panel on Climate Change’s Special Report on Global Warming of 1.5oC, launched in 2018.” (Equinor.SR. p. 15)
219

Equinor
“In our Climate Roadmap, we commit ourselves to pursuing the 2-degree goal that the signatories to the Paris Climate Agreement agreed upon. Succeeding in this ambition will require substantial change on Equinor’s part.” (Equinor.CWS2)
CRITERION 2 – WHAT MEASURES IS THE COMPANY TAKING TO REDUCE ITS CARBON FOOTPRINT? INDICATOR 2A. GHG EMISSIONS TARGETS Score: (2) Rationale: Equinor has a company-wide plan to reduce GHG emissions in
service of the Paris Agreement’s global temperature goal, but the company’s target is not science-based.
Source(s): “We aim to achieve, by 2030, annual CO2 emissions that are 3
million tonnes less than they would have been, had no reduction measure been implemented between 2017 and 2030. This includes our offshore operations in Norway.” (Equinor.SR. p. 19)
“To achieve the emission reduction target of 3 million tonnes of CO2 from 2017 to 2030, we pursue energy efficiency measures, electrification and other low-carbon energy sources at our installations. In 2018, we implemented several emission reduction measures, largely through better energy management, technical design and flaring reductions.” (Equinor.IR. p. 89)
“In 2018 Equinor maintained a carbon intensity of 9kg CO2 per barrel of oil equivalent (boe) for our operated upstream production, in line with our 2020 target of 9kg CO2/boe. This is considerably lower than the industry average of 18kg CO2/boe.” (Equinor.SR. p. 26; see also Equinor.IR. p. 89)
INDICATOR 2B. GHG EMISSIONS REDUCTIONS Score: (2)
220

Equinor
Rationale: Company’s GHG emissions intensity has increased in one of the last two reporting years and increased as a whole over the last two reporting years.
Source(s): [see Supplemental Data] INDICATOR 2C. R&D INTO LOW-CARBON TECHNOLOGIES Score: (4) Rationale: Equinor has publicly committed to funding R&D in low-carbon
technologies and its current and (expected) future low-carbon R&D budget is broken down by technology, but the company has published contradictory statements regarding future low-carbon R&D funding (e.g., “We expect around 15-20% of our annual investments to be directed towards new energy solutions in 2030, assuming we can access and mature profitable projects,” “By 2020, we expect to be devoting around 25% of research and development expenditure to new energy solutions and energy efficiency”).
Source(s): “Research and development (R&D) expenditures were USD 315
million, USD 307 million and USD 298 million in 2018, 2017 and 2016, respectively. R&D expenditures are partly financed by partners of Equinor operated licences. Equinor's share of the expenditures has been recognised as expense in the Consolidated statement of income.” (Equinor.IR. p. 172)
“2018 Milestones: Low-carbon R&D expenditure 21% of total (2020 target: 25%).” (Equinor.SR. p. 11)
“Our low-carbon R&D projects, including energy efficiency projects and projects with energy efficiency as a secondary effect, increased to around 21% of our total R&D expenditure. The total low-carbon R&D expenditure was around USD 66 million. R&D projects on CCS and renewables represented around 10% of the total R&D expenditure.” (Equinor.SR. p. 26)
“We expect around 15-20% of our annual investments to be directed towards new energy solutions in 2030, assuming we can access and mature profitable projects.” (Equinor.SR. p. 22)
221

Equinor
“We utilise a range of tools for the development of new technologies...Direct investment in technology start-up companies through Equinor Technology Invest venture activities.” (Equinor.IR. p. 24)
“The New Energy Solutions business area reflects Equinor’s aspirations to gradually complement its oil and gas portfolio with profitable renewable energy and other low-carbon energy solutions. Offshore wind, solar and carbon capture and storage have been key strategic focus areas in 2018.” (Equinor.IR. p. 43)
“By 2020, we expect to be devoting around 25% of research and development expenditure to new energy solutions and energy efficiency.” (Equinor.SR. p. 24)
INDICATOR 2D. USE OF AN INTERNAL PRICE ON CARBON Score: (4) Rationale: Equinor has disclosed the internal price on carbon it uses when
evaluating all investments and describes generally how it is employed.
Source(s): “Equinor’s investment principles take climate into consideration. We
require all potential projects to be assessed for carbon intensity and emission reduction opportunities, at every decision phase – from exploration and business development to project development and operations. We apply an internal carbon price of at least USD 55 per tonne of CO2 in investment analysis. In countries where the actual or predicted carbon price is higher than USD 55 per tonne of CO2, we apply the actual or expected cost, such as in Norway where both a CO2 tax and the EU Emission Trading System (EU ETS) apply.” (Equinor.IR. p. 89)
“Equinor has set ambitious emission reduction targets. Most of the emissions from our operated portfolio are subject to a carbon tax and part of EU’s emission trading system. Over time, we plan to invest in reduced deforestation corresponding to the emissions
222

Equinor
(operated) not covered by any CO2 price, aligned with our strong support for a global price on carbon.” (Equinor.SR. p. 25)
CRITERION 3 – IS CLIMATE SCIENCE INTEGRAL TO THE GOVERNANCE AND OVERSIGHT OF THE COMPANY? INDICATOR 3A. DELINEATION OF RISKS AND RISK MANAGEMENT PROCEDURES RELATED TO CLIMATE CHANGE INDICATOR 3AI. REGULATORY RISKS Score: (4) Rationale: Equinor discloses a detailed analysis of existing and proposed
climate change-related regulations and laws (e.g., EU fuel efficiency standards, upstream deregulation in the United States) and their possible effects on the company, including potential financial impacts.
Source(s): “Equinor expects and is preparing for regulatory changes and policy
measures targeted at reducing greenhouse gas emissions. Stricter climate regulations and policies could impact Equinor's financial outlook, whether directly through changes in taxation or other costs to operations and projects, or indirectly through changes in consumer behavior or technology developments. Equinor expects greenhouse gas emission costs to increase from current levels beyond 2020 and to have a wider geographical range than today. Other regulatory risks entail litigation risk and potential direct regulations, for example fuel efficiency standards (e.g. in the EU), restrictions on use of e.g. diesel vehicles and requirements to assess the use of power from shore for new offshore developments at the NCS. Climate-related policy changes may also reduce access to prospective geographical areas for exploration and production in the future. Disruptive developments may not be ruled out, possibly triggered by severe weather events affecting public perception and policy making.” (Equinor.IR. p. 80)
223

Equinor
“On both the federal and state levels (i.e., in the United States), the legislative and regulatory framework, and specific regulatory and legislative provisions affecting Equinor’s activities, are subject to the ebb and flow in administrative agencies as political parties and administrations change at the federal and state levels. Equinor continually monitors the pace of regulatory and legislative changes at all levels and engages in the stakeholder process through trade associations and direct comments to suggested regulatory and legislative regimes, in order to remain in compliance.” (Equinor.IR. pp. 51-52)
“Equinor's investments in US onshore producing assets will be subject to evolving regulations that could affect these operations and their profitability. In the United States, Federal agencies have taken steps to rescind, delay, or revise regulations seen as overly burdensome to the upstream oil and gas sector, including methane emission controls. Equinor supports Federal regulation of methane emissions and aims to operate in compliance with all current requirements. To the extent new or revised regulations impose additional compliance or data gathering requirements, Equinor could incur higher operating costs. Equinor has also joined voluntary emission reduction programmes (One Future and API’s Environmental Partnership) and implemented a climate roadmap to reduce CO2 and methane emissions.” (Equinor.IR. p. 86)
“Equinor's US operations use hydraulic fracturing which is subject to a range of applicable federal, state and local laws, including those discussed under the heading "Legal and Regulatory Risks". A case of subsurface migration of hydraulic fracturing fluids or a case of spillage or mishandling of hydraulic fracturing fluids during these activities could potentially subject Equinor to civil and/or criminal liability and the possibility of substantial costs, including environmental remediation. In addition, various states and local governments have implemented, or are considering, increased regulatory oversight of hydraulic fracturing through additional permit requirements, operational restrictions, disclosure requirements and temporary or permanent bans, which could make it more difficult to complete oil and natural gas wells in shale formations, cause operational delays, increase costs of
224

Equinor
regulatory compliance or in exploration and production, which could adversely affect Equinor's US onshore business and the demand for fracturing services.” (Equinor.IR. p. 81)
“The principal laws governing Equinor’s petroleum activities in Norway and on the NCS are the Norwegian Petroleum Act of 29 November 1996 (the Petroleum Act) and the regulations issued thereunder, and the Norwegian Petroleum Taxation Act of 13 June 1975 (the Petroleum Taxation Act). The Petroleum Act sets out the principle that the Norwegian State is the owner of all subsea petroleum on the NCS, that exclusive right to resource management is vested in the Norwegian State and that the Norwegian State alone is authorised to award licences for petroleum activities as well as determine its terms...If important public interests are at stake, the Norwegian State may instruct the operators on the NCS to reduce the production of petroleum. The last time the Norwegian State instructed a reduction in oil production was in 2002.” (Equinor.IR. p. 48)
INDICATOR 3AII. PHYSICAL RISKS Score: (3) Rationale: Equinor acknowledges climate change as contributor to the physical
risks facing its business, but does not identify how and to what degree its operations might be impacted.
Source(s): “Climate change could affect Equinor's operations through
restrained water availability, rising sea level, changes in sea currents and increasing extreme weather frequency.” (Equinor.IR. p. 81)
“The risks associated with Equinor's activities and operations are affected by external risk factors like difficult geographies, climate zones and environmentally sensitive regions.” (Equinor.IR. p. 80)
INDICATOR 3AIII. MARKET AND OTHER INDIRECT RISKS AND OPPORTUNITIES Score: (2)
225

Equinor
Rationale: Equinor offers an analysis of how climate change may present indirect opportunities and risks, but that analysis is largely generic and not unique to the company. Further, though Equinor partially discloses the results of a sensitivity analysis under various IEA scenarios, those scenarios do not isolate market and other indirect risks and opportunities resulting from climate change. Moreover, Equinor has not specifically discussed recent high-profile climate litigation in which it is a defendant (i.e., County of San Mateo v. Chevron Corp.).
Source(s): “A transition to a low carbon economy contributes to uncertainty over future demand and prices for oil and gas as described in the section “Oil and natural gas price risks”. Such price sensitivities of the project portfolio are illustrated in the “portfolio stress test” as described in section 2.12 and in the Annual Sustainability Report 2018. Increased demand for and improved cost-competitiveness of renewable energy, and innovation and technology changes supporting the further development and use of renewable energy and low-carbon technologies, represent both threats and opportunities for Equinor. The competitiveness of the choices Equinor makes regarding what renewable business opportunities are pursued and invested in is subject to risk and uncertainty...Increased concern over climate change could lead to increased expectations to fossil fuel producers, as well as a more negative perception of the oil and gas industry. This could lead to litigation and divestment risk and could have an impact on talent attraction and retention.” (Equinor.IR. p. 80)
“Stricter climate regulations and policies could impact Equinor's financial outlook, whether directly through changes in taxation or other costs to operations and projects, or indirectly through changes in consumer behavior or technology developments.” (Equinor.IR. p. 80)
“The uncertainty of the future of the oil industry in light of reduced oil and natural gas prices and climate policy changes, creates a risk in ensuring a robust workforce through industry cycles. The oil industry is a long-term business and needs to take a long-term perspective on workforce capacity and competence.
226

Equinor
Given the current extensive change agenda there is a risk that Equinor will fail to secure the right level of workforce competence and capacity.” (Equinor.IR. pp. 84-85)
“During the normal course of its business, Equinor is involved in legal proceedings, and several other unresolved claims are currently outstanding. The ultimate liability or asset, in respect of such litigation and claims cannot be determined at this time. Equinor has provided in its Consolidated financial statements for probable liabilities related to litigation and claims based on its best estimate. Equinor does not expect that its financial position, results of operations or cash flows will be materially affected by the resolution of these legal proceedings. Equinor is actively pursuing the above disputes through the contractual and legal means available in each case, but the timing of the ultimate resolutions and related cash flows, if any, cannot at present be determined with sufficient reliability.” (Equinor.IR. p. 201)
INDICATOR 3B. DELEGATION OF BOARD MEMBERS AND/OR COMMITTEES WITH EXPLICIT OVERSIGHT OF CLIMATE CHANGE POLICY Score: (3) Rationale: Equinor’s Board of Directors maintains an internal "Safety,
Sustainability and Ethics” committee (SSEC) with explicit oversight of climate-related corporate governance.
Source(s): “The corporate executive committee and Equinor ASA board of
directors (BoD) review and monitor sustainability issues, including climate-related business risks and opportunities and climate and sustainability aspects related to investment decisions. In 2018, personnel safety, cyber security, human rights, anti- corruption and climate-related risk were extensively discussed in board meetings.... The BoD safety, sustainability and ethics committee assists the BoD in its supervision of the company’s sustainability policies, systems and principles. This includes regular reviews of sustainability risk issues and sustainability performance and review of the sustainability report.” (Equinor.SR. p. 12)
227

Equinor
“The Committee (i.e., SSEC) will assist Equinor ASA’s (the Company’s) board of directors (the Board) in its supervision of the Company’s safety, security, sustainability, climate and ethics policies, systems and principles with the exception of aspects related to “Financial Matters”...As a preparatory body for the Board, the Committee shall: I. Supervise and assess the effectiveness, development and implementation of the Company’s safety, security, sustainability and climate policies, systems and principles.” (Equinor.CCC1, p. 1)
“The Committee (i.e., SSEC) will consist of up to five Board members, none of whom may have ties which, in the view of the Board, could affect the impartiality of the member’s assessments. The members and the chair of the Committee will be elected by the Board.” (Equinor.CCC1, p. 3)
“At year-end 2018, the safety, sustainability and ethics committee was chaired by Roy Franklin and the other members were Bjørn Tore Godal, Anne Drinkwater, Jonathan Lewis, Stig Lægreid (employee-elected board member) and Per Martin Labråten (employee-elected board member) .” (Equinor.IR. p. 120)
INDICATOR 3C. DOES THE COMPANY SUPPORT CLIMATE-RELATED SHAREHOLDER RESOLUTIONS? Score: (2) Rationale: Equinor recommended against a climate-related shareholder
resolution put forward by Follow This in 2019. Source(s): “The board’s response to item 9 “Proposal from shareholder
regarding setting medium and long-term quantitative targets that include Scope 1, 2 and 3 greenhouse gas emissions” raised to Equinor ASA’s annual general meeting 15 May 2019... Equinor is committed to playing an active and positive role in society’s decarbonisation through engagement, technology, operations, innovation and investments. Our activities do not include direct engagement with end users of products. However, we pursue projects in the areas of hydrogen and CCS, we strongly support carbon pricing and have launched plans to invest in natural carbon
228

Equinor
sinks in form of protection of tropical rainforest. The board of directors recommends the annual general meeting to vote against the proposal.” (Equinor.FPS1, p. 5; see also Ceres – Climate and Sustainability Shareholder Resolutions Database; SEC – Division of Corporate Finance 2019)
CRITERION 4 – WHAT ARE THE COMPANY’S AFFILIATIONS WITH THIRD PARTIES THAT SPREAD DISINFORMATION ON CLIMATE SCIENCE? INDICATOR 4A. THE AMERICAN LEGISLATIVE EXCHANGE COUNCIL (ALEC) Score: (3) Rationale: Equinor is based in Norway and is not cited by Source Watch or
DeSmogBlog as having ever been affiliated with association. Source(s): (see Source Watch - ALEC; DeSmogBlog – ALEC) INDICATOR 4B. THE AMERICAN PETROLEUM INSTITUTE (API) Score: (2) Rationale: Equinor is a current member of API association and has not taken
concrete steps to distance itself from group’s climate change deception.
Source(s): (see API – Members; DeSmogBlog – API) INDICATOR 4C. THE NATIONAL ASSOCIATION OF MANUFACTURERS (NAM) Score: (3) Rationale: Equinor is based in Norway and is neither in NAM’s current BOD list
nor noted by DeSmogBlog as having ever been affiliated with association.
229

Equinor
Source(s): (see NAM – Board of Directors; DeSmogBlog – NAM) INDICATOR 4D. THE WESTERN STATES PETROLEUM ASSOCIATION (WSPA) Score: N/A Rationale: Equinor is based in Norway and has no operations in the
association’s jurisdiction, not mentioned by DeSmogBlog as having ever been affiliated with the association and is not listed as a corporate member on WSPA’s website.
Source(s): (see WSPA – Member Companies; DeSmogBlog – WSPA) INDICATOR 4E. AMERICAN FUEL AND PETROCHEMICAL MANUFACTURERS (AFPM) Score: (3) Rationale: Equinor is based in Norway and is neither in AFPM’s current
membership list nor noted by DeSmogBlog as having ever been affiliated with association.
Source(s): (see AFPM – Membership Directory; DeSmogBlog – AFPM) CRITERION 5 – DOES THE COMPANY PUBLICLY SUPPORT THE NEED FOR CLIMATE POLICY AND REGULATIONS? INDICATOR 5A. REGULATIONS, CARBON TAX, EMISSIONS TRADING, RENEWABLE ENERGY, CCS, ETC. Score: (4) Rationale: Equinor has consistently publicly advocated for the adoption of
governmental carbon policies and is a member of the Make Power Clean initiative, which advocated in favor of recent climate change-related legislation (e.g., “Regulation on the Internal Market for Electricity”) before the Council of the EU.
230

Equinor
Source(s): “Europe can build a cleaner future for its citizens – but only with the
right electricity market design. As the vote in the ITRE committee approaches, we call on you to act consistently and endorse the proposal to limit access to capacity mechanisms to plants emitting 550g CO2/kWh or less as a way of ensuring a cleaner power supply for all Europeans. To make a difference, the 550g carbon criterion should enter into force as quickly as possible, for all power plants, and cover the widest possible scope. Limiting exceptions and insisting on a rapid implementation is the best way to ensure Europe meets its ambitious climate objectives, unlocking the potential of cleaner energy supply and promoting renewables’ growth. The European Parliament can be once again the voice of ambition and leadership by defending the right of European citizens to have energy policies that work towards our climate goals...This letter is endorsed by: BNE, Eni, ESIA (European Semiconductor Industry Association), ESTELA (European Solar Thermal Electricity Association), Eurogas, EBA (European Biogas Association), First Solar, Gas Natural Fenosa, Gassco, Joule Assets, NOROG (Norsk Olje & Gass), Nordex Acciona, PKA, REstore, Siemens, Shell, SNAM, SMA, Solar Power Europe, Statoil, Total, VaasaETT, Voltalis, Wintershall.” (Equinor.TPS1)
“Therefore, we call on governments, including at the UNFCCC negotiations in Paris and beyond – to: (1) introduce carbon pricing systems where they do not yet exist at the national or regional levels and (2) create an international framework that could eventually connect national systems.” (Equinor.FPS2, p. 1)
“In 2018, Equinor announced that we are ready to invest in the protection of tropical forest as soon as a well-functioning jurisdictional forest carbon market is in place for the private sector. The investments will be a supplement to our climate roadmap. Over time, we plan to invest in reduced deforestation corresponding to the emissions (operated) not covered by any CO2 price, aligned with strong support for a global price on carbon.” (Equinor.IR. p. 90)
“In the United States, Federal agencies have taken steps to rescind, delay, or revise regulations seen as overly burdensome to the
231
Equinor
upstream oil and gas sector, including methane emission controls. Equinor supports Federal regulation of methane emissions and aims to operate in compliance with all current requirements.” (Equinor.IR. p. 86)
INDICATOR 5B. PARIS AGREEMENT Score: (4) Rationale: Equinor has explicitly endorsed the Paris Climate Agreement’s
global temperature targets and actively campaigned for legislation that would further the goals of the Agreement (e.g., Make Power Clean Initiative).
Source(s): “Equinor supports the ambition set by the Paris Climate
Agreement to limit the average global temperature rise to well below two degrees Celsius compared to pre-industrial levels by 2100.” (Equinor.IR. p. 89)
“Limiting exceptions and insisting on a rapid implementation is the best way to ensure Europe meets its ambitious climate objectives, unlocking the potential of cleaner energy supply and promoting renewables’ growth. The European Parliament can be once again the voice of ambition and leadership by defending the right of European citizens to have energy policies that work towards our climate goals... Make Power Clean is a campaign that brings together companies and associations focused on ensuring that Europe’s future power market is consistent with the EU climate commitments and will provide cleaner energy for all.” (Equinor.TPS1)
CRITERION 6 – HAS THE COMPANY BEEN PUBLICLY TRANSPARENT ABOUT ITS POSITION, ACTIONS, AND AFFILIATIONS WITH REGARD TO CLIMATE SCIENCE AND CLIMATE CHANGE? INDICATOR 6A. WEBPAGE DEDICATED TO CLIMATE CHANGE Score: (5)
232

Equinor
Rationale: Equinor maintains a separate webpage on its website devoted to climate change.
Source(s): (see Equinor.CWS3) INDICATOR 6B. STAND-ALONE SUSTAINABILITY REPORT WITH SPECIFIC REFERENCE TO CLIMATE CHANGE Score: (5) Rationale: Equinor produces a sustainability report that is easily accessible from
its website and has a section dedicated to climate change (i.e., “Creating a Low-Carbon Advantage: Climate Change and Energy Transition”).
Source(s): (see Equinor.SR. p. 14) INDICATOR 6C. DISCLOSURE TO CDP Score: (5) Rationale: CDP website indicates “Submitted” from Equinor for Climate Change
2018. Source(s): (see Equinor.CDP2) INDICATOR 6D. DISCLOSURE OF THIRD-PARTY RELATIONSHIPS AND LOBBYING ACTIVITIES Score: (3) Rationale: Equinor’s website provides links to eight industry associations of
which it is a member, but does not disclose any payments made to those associations or indicate whether the relatively short list is inclusive.
Source(s): “Industry associations can often be better at representing the views
of an industry than individual companies and are often a valuable partner for regulators in developing new frame conditions for our industry. Equinor is a member of a number of industry
233

Equinor
associations and chambers of commerce promoting good practices and sustainable operations.” (Equinor.CWS4; see also Equinor.CWS5)
INDICATOR 6E. REPORT ON CLIMATE RELATED RISK SCENARIOS Score: (5) Rationale: Equinor produced and published an analysis on what a 2°C or lower
increase in global temperature would mean for its businesses, strategies, and financial planning.
Source(s): “In 2018, we tested our portfolio against the three scenarios, i.e.
the Current Policies, New Policies and Sustainable Development scenarios, in the World Energy Outlook 2018 report from the International Energy Agency.” (Equinor.IR. p. 90)
“Equinor annually conducts a price sensitivity analysis for our project and asset portfolio against the assumptions regarding commodity and carbon prices in the range of energy scenarios of the International Energy Agency (IEA), as presented in their World Energy Outlook report. This analysis is used to assess energy transition-related risks. The practice is in accordance with a shareholder resolution passed in 2015, suggesting that stress testing should be done against third-party scenarios to allow for comparability. The “project and asset portfolio” entails equity production, excluding exploration activities. However, our investment decision criteria, including the internal carbon price and discount rates, apply also to exploration projects. In 2018 we tested our portfolio against the IEA’s Current Policies, New Policies and Sustainable Development scenarios. The scenarios and assumptions are presented in the World Energy Outlook 2018 report (IEA). Equinor has not tested our portfolio against a 1.5°C scenario, as the IEA has so far not published such a scenario with corresponding oil, gas and carbon price assumptions. The four illustrative model pathways presented in the International Panel on Climate Change’s special report on the impacts of global warming of 1.5°C indicate that oil and gas demand would have to be significantly lower than in a 2°C scenario, and as such the potential downside for Equinor in a sensitivity analysis could be
234

Equinor
expected to be more significant. However, our sensitivity analysis does not take into account the fact that our portfolio would change to be more robust as the different scenarios unfold and materialise.” (Equinor.SR. p. 18)
“The analysis in this report is important input to our strategic priorities, but does not reflect our views and strategy.” (Equinor.CO2R. p. 3)
235

ExxonMobil
XV. ExxonMobil CRITERION 1 – WHAT IS THE COMPANY’S POSITION ON CLIMATE SCIENCE? INDICATOR 1A. CONSISTENTLY ACCURATE PUBLIC STATEMENTS ON CLIMATE SCIENCE AND THE CONSEQUENT NEED FOR SWIFT AND DEEP REDUCTIONS IN EMISSIONS FROM THE BURNING OF FOSSIL FUELS Score: (1) Rationale: ExxonMobil misrepresents current scientific consensus on climate
change with subtle questioning language (e.g., “limited guidance,” “spatial and temporal uncertainties”), and also creates a false choice between climate solutions and economic development.
Source(s): “Given the importance of energy, it is in the interest of every
government to increase access to reliable and affordable supplies for its citizens. That is why consumers should be concerned with policies that could have an adverse impact on energy production. Such restrictions could also impact the rate of economic development and the ability of nations to develop....While most scientists agree climate change poses risks related to extreme weather, sea-level rise, temperature extremes, and precipitation changes, current scientific understanding provides limited guidance on the likelihood, magnitude, or time frame of these events. Anticipating the likelihood of an event at the regional or local level in comparison to global averages is even more difficult....Given the spatial and temporal uncertainties of many extreme weather events, particularly with respect to future changes in climate, facilities are generally engineered to be resilient to extreme event “tails,” with the inclusion of additional safety factors built in to cover a number of engineering uncertainties.” (ExxonMobil.CWS1)
“ExxonMobil believes that the long-term objective of effective policy should be to reduce the risks of climate change at the lowest societal cost, while balancing increased demand for affordable energy and better addressing poverty, education, health and energy security concerns.” (ExxonMobil.CO2R1, p. 21)
236

ExxonMobil
“Transformation of the world’s energy system as envisioned by a 2oC scenario is unprecedented...A key consideration is the significant value for society in not prematurely foreclosing options or negating reliable, affordable and practical energy systems that billions of people depend upon.” (ExxonMobil.CO2R2, p. 53)
“...as people and nations look for ways to reduce risks of global climate change, they will continue to need practical solutions that do not jeopardize the affordability or reliability of the energy they need. Practical solutions to the world’s energy and climate challenges will benefit from market competition as well as well informed, well designed, and transparent policy approaches that carefully weigh costs and benefits. Such policies are likely to help manage the risks of climate change while also enabling societies to pursue other high priority goals around the world – including clean air and water, access to reliable, affordable energy, and economic progress for all people.” (ExxonMobil.10K, p. 43)
CRITERION 2 – WHAT MEASURES IS THE COMPANY TAKING TO REDUCE ITS CARBON FOOTPRINT? INDICATOR 2A. GHG EMISSIONS TARGETS Score: (2) Rationale: ExxonMobil’s GHG reduction measures lack the accountability of a
formal target (CEO Darren Woods’ Chairman’s letter characterizes the firm’s methane reduction efforts as "commitments"), are not company-wide and include a significant caveat; absolute emissions may nevertheless rise dependent on the “size and composition of our asset portfolio.”
Source(s): “In 2018 we announced GHG emissions reduction measures that
are expected to lead to considerable improvements in emissions performance when compared with 2016 levels. These included (1) 15 percent reduction in methane emissions by 2020 compared with 2016, (2) 25 percent reduction in flaring by 2020 compared with 2016, and (3) 10 percent GHG emissions intensity reduction at Imperial operated oil sands by 2023 compared with 2016...Our
237

ExxonMobil
commitment to mitigating emissions from our operations is unwavering. That said, it is important to understand that while ExxonMobil continues to strive to mitigate emissions, our absolute emission levels are impacted by the size and composition of our asset portfolio.” (ExxonMobil.CO2R1, p. 25)
INDICATOR 2B. GHG EMISSIONS REDUCTIONS Score: (3) Rationale: Company’s GHG emissions intensity has increased in one of the last
two reporting years but decreased as a whole over the last two reporting years.
Source(s): [see Supplemental Data] INDICATOR 2C. R&D INTO LOW-CARBON TECHNOLOGIES Score: (2) Rationale: Though ExxonMobil highlights some of its investments and
partnerships in low-carbon technology research, the discussion is largely anecdotal. Further, ExxonMobil does not disclose its low-carbon R&D expenses on a yearly basis.
Source(s): “We are conducting our own research both in-house and by working
with more than 80 leading universities around the world, including the Massachusetts Institute of Technology, Princeton University, The University of Texas, and Stanford University. Our research projects focus on developing algae-based biofuels, carbon capture and storage, breakthrough energy efficiency processes, advanced energy-saving materials, and other technologies. For example, ExxonMobil is working with Fuel Cell Energy Inc. to explore using carbonate fuel cells to economically capture CO2 emissions from gas-fired power plants. Our future results may depend in part on the success of our research efforts and on our ability to adapt and apply the strengths of our current business model to providing the energy products of the future in a cost-competitive manner.” (ExxonMobil.10K, p. 3)
238

ExxonMobil
“We also continued to advance our research into next-generation, breakthrough energy solutions, including biofuels, carbon capture and storage and technology to lower the energy intensity of industrial processes. Since 2000, we have invested more than $9 billion in lower-emission energy solutions.” (ExxonMobil.AR, p. 34)
“Research and development expenses totaled $1,116 million in 2018, $1,063 million in 2017, and $1,058 million in 2016.” (ExxonMobil.10K, p. 76; see also ExxonMobil.AR, p. 36)
INDICATOR 2D. USE OF AN INTERNAL PRICE ON CARBON Score: (2) Rationale: ExxonMobil discloses multiple proxy costs for carbon, but does not
detail how it uses the price(s) in its investment analysis. Source(s): The market has already acknowledged that, as a general matter,
“ExxonMobil’s carbon price is invisible to consumers” and is not publicly disclosed. Nevertheless, ExxonMobil has projected in its Outlook for Energy an implied cost of carbon reaching $60 per ton of CO2 emissions by 2030 for OECD countries and has noted that its proxy cost of carbon “in some geographies may approach $80/ton by 2040.” Aside from these broad ranges, ExxonMobil has not released a detailed set of the figures it uses to assess global energy demand or in project planning.” (ExxonMobil.TPS1, p. 9)
“For purposes of the Outlook, a proxy cost on energy-related CO2 emissions is assumed to reach about $80 per tonne on average in 2040 in OECD nations. China and other leading non-OECD nations are expected to trail OECD policy initiatives. Nevertheless, as people and nations look for ways to reduce risks of global climate change, they will continue to need practical solutions that do not jeopardize the affordability or reliability of the energy they need.” (ExxonMobil.10K, p. 43)
239

ExxonMobil
CRITERION 3 – IS CLIMATE SCIENCE INTEGRAL TO THE GOVERNANCE AND OVERSIGHT OF THE COMPANY? INDICATOR 3A. DELINEATION OF RISKS AND RISK MANAGEMENT PROCEDURES RELATED TO CLIMATE CHANGE INDICATOR 3AI. REGULATORY RISKS Score: (2) Rationale: Though ExxonMobil notes some instances of engagement with
policymakers on specific climate-related regulations, its descriptions of those discussions lack detail. Moreover, ExxonMobil fails to identify risks unique to the company from such existing and proposed climate-related regulations and laws.
Source(s): “We are also active in pursuing sound policies, and we support
reasonable, cost-effective regulations. For example, ExxonMobil submitted a letter to the EPA rulemaking docket indicating support for reasonable, cost-effective regulations to manage methane emissions from new and existing sources. We have also engaged with states advancing their own regulatory programs, most recently in New Mexico and Pennsylvania.” (ExxonMobil.CO2R1, p. 26)
“Due to concern over the risks of climate change, a number of countries have adopted, or are considering the adoption of, regulatory frameworks to reduce greenhouse gas emissions. These include adoption of cap and trade regimes, carbon taxes, minimum renewable usage requirements, restrictive permitting, increased efficiency standards, and incentives or mandates for renewable energy. Such policies could make our products more expensive, less competitive, lengthen project implementation times, and reduce demand for hydrocarbons, as well as shift hydrocarbon demand toward relatively lower-carbon sources such as natural gas. Current and pending greenhouse gas regulations or policies may also increase our compliance costs, such as for monitoring or sequestering emissions.” (ExxonMobil.10K, p. 3)
240

ExxonMobil
“In light of the multiple factors that will influence decisions to commercialize undeveloped resources, it is not possible to identify which specific assets ultimately will be commercialized and produced. As we consider the implied oil and natural gas demand to 2040 under the 2°C scenarios average, it is possible that some higher-cost assets, which could be impacted by many factors including future climate-related policy, may not be developed. We are confident, however, that the size, diversity and continued upgrading of our undeveloped resources, along with technology developments, will enable the ongoing replenishment of our proved reserves for decades to come under a range of potential future demand scenarios.” (ExxonMobil.CO2R1, p. 14)
“Throughout ExxonMobil’s businesses, new and ongoing measures are taken to prevent and minimize the impact of our operations on air, water and ground. These include a significant investment in refining infrastructure and technology to manufacture clean fuels, as well as projects to monitor and reduce nitrogen oxide, sulfur oxide and greenhouse gas emissions, and expenditures for asset retirement obligations. Using definitions and guidelines established by the American Petroleum Institute, ExxonMobil’s 2018 worldwide environmental expenditures for all such preventative and remediation steps, including ExxonMobil’s share of equity company expenditures, were $4.9 billion, of which $3.6 billion were included in expenses with the remainder in capital expenditures. The total cost for such activities is expected to increase to approximately $5.7 billion in 2019 and 2020. Capital expenditures are expected to account for approximately 30 percent of the total.” (ExxonMobil.10K, p. 1)
INDICATOR 3AII. PHYSICAL RISKS Score: (3) Rationale: ExxonMobil notes the physical risks climate change poses to its
business, but generalizes their nature, magnitude and impact. Source(s): “Our operations may be disrupted by severe weather events, natural
disasters, human error, and similar events. For example, hurricanes may damage our offshore production facilities or coastal refining and
241

ExxonMobil
petrochemical plants in vulnerable areas. Our facilities are designed, constructed, and operated to withstand a variety of extreme climatic and other conditions, with safety factors built in to cover a number of engineering uncertainties, including those associated with wave, wind, and current intensity, marine ice flow patterns, permafrost stability, storm surge magnitude, temperature extremes, extreme rainfall events, and earthquakes. Our consideration of changing weather conditions and inclusion of safety factors in design covers the engineering uncertainties that climate change and other events may potentially introduce.” (ExxonMobil.10K, p. 4)
“The Company assesses the risks posed by weather and other natural elements, and designs its facilities and operations in consideration of these risks. When considering physical environmental risks, we evaluate the type and location of our current and planned facilities. As an example, offshore facilities could be impacted by changes in wave and wind intensity as well as by changes in ice floe patterns, while onshore facilities could be vulnerable to sea level rise, changes in storm surge or geo-technical considerations.” (ExxonMobil.CO2R1, p. 33)
“ExxonMobil has long operated facilities in a wide range of challenging physical environments around the globe. Our history of design, construction and operations provides us with a solid foundation to address risks associated with different physical environments. The Company assesses the risks posed by weather and other natural elements, and designs its facilities and operations in consideration of these risks...ExxonMobil’s comprehensive approach and established systems enable us to manage a wide variety of possible outcomes, including risks associated with climate change.” (ExxonMobil.CO2R1, p. 33)
INDICATOR 3AIII. MARKET AND OTHER INDIRECT RISKS AND OPPORTUNITIES Score: (2) Rationale: Though ExxonMobil has set out a series of near and long-term
actions it believes are consistent with the shifting market for energy, the company provides little color as to how it will be specifically
242
ExxonMobil
impacted by the energy transition. Further, ExxonMobil fails to address the high-profile climate-related litigation in which the company is a defendant.
Source(s): “The 2018 Outlook for Energy anticipates global energy needs will
rise about 25 percent over the period to 2040, led by non-OECD countries. While the mix shifts toward lower- carbon-intensive fuels, the world will need to pursue all economic energy sources to meet this need….Our businesses are well-positioned for the continuing evolution of the energy system. Near-term actions, consistent with society’s energy requirements and environmental objectives, include: (1) Expanding the supply of cleaner-burning natural gas, (2) Transitioning our refining facilities to growing higher-value distillates, lubricants and chemical feedstocks, (3) Mitigating emissions from our own facilities through energy efficiency, cogeneration and reduced flaring, venting and fugitive emissions, including GHG intensity reduction in Imperial Oil Limited's (Imperial) operated oil sands facilities, (4) Supplying products that help others reduce their emissions, such as premium lubricants and fuels, lightweight materials, and special tire liners and (5) Engaging on policy to address the risks of climate change at the lowest cost to society Importantly, on a longer-term horizon, we are pursuing technologies to enhance existing operations and develop alternative energy technologies with lower carbon intensity, including: (1) Researching breakthroughs that make CCS technology more economic for power generation, industrial applications and hydrogen production, (2) Developing technologies to reduce energy requirements of refining and chemical manufacturing facilities and (3) Progressing advanced biofuels for transportation and chemicals.” (ExxonMobil.CO2R1, p. 2)
“Our reputation is an important corporate asset. An operating incident, significant cyber-security disruption, or other adverse event such as those described in this Item 1A may have a negative impact on our reputation, which in turn could make it more difficult for us to compete successfully for new opportunities, obtain necessary regulatory approvals, or could reduce consumer demand for our branded products. ExxonMobil’s reputation may also be harmed by events which negatively affect the image of our industry as a whole.” (ExxonMobil.10K, p. 5)
243

ExxonMobil
INDICATOR 3B. DELEGATION OF BOARD MEMBERS AND/OR COMMITTEES WITH EXPLICIT OVERSIGHT OF CLIMATE CHANGE POLICY Score: (1) Rationale: Though ExxonMobil’s cites its Public Issues and Contributions
Committee as maintaining some responsibility for climate change-related issues, that committee’s charter does not explicitly reference such authority.
Source(s): “ExxonMobil’s Board of Directors provides oversight of
Company risks, including climate change risks. These risks have the potential to manifest in a variety of ways, including through strategic, financial, operational, reputational and legal compliance matters.” (ExxonMobil.CO2R1, p. 4)
“...the PICC (Public Issues and Contributions Committee) regularly reviews ExxonMobil’s safety, health and environmental performance, including actions taken to identify and manage climate change risks and opportunities. The PICC is comprised of four independent directors who are appointed by the Board. A broad range of backgrounds and areas of expertise for individual PICC members ensures that the PICC is able to effectively evaluate and inform the Board on dynamic and complex issues such as climate change risks that span a range of disciplines.” (ExxonMobil.CO2R1, p. 5)
“The primary purposes of the Public Issues and Contributions Committee (the "Committee") are to review and provide advice, as the Committee deems appropriate, regarding the Corporation's policies, programs and practices on public issues of significance including their effects on safety, security, health and the environment; and to review and provide advice on the Corporation's overall contributions objectives, policies and programs.” (ExxonMobil.CCC1, p. 1)
INDICATOR 3C. DOES THE COMPANY SUPPORT CLIMATE-RELATED SHAREHOLDER RESOLUTIONS?
244

ExxonMobil
Score: (1) Rationale: ExxonMobil blocked multiple climate-related shareholder resolutions
put forward by As You Sow during 2018. Source(s): “For these reasons as well as those stated in the No-Action Letter,
we believe that the Company may exclude the Proposal (i.e., that ExxonMobil’s GHG emissions targets be "aligned with the greenhouse gas reduction goals established by the Paris Climate Agreement") because it has been substantially implemented by the Company, and the Company's practices, policies and procedures compare favorably to the Proposal.” (ExxonMobil.TPS2, p. 70)
“We agree with the Proponent Letter that the risks of climate change, and the potential impact to its current business and strategic direction, are important matters to the Company...We do not believe, however, that the Proposal can only be substantially implemented by having a separate board committee that has “climate” in its title...existing board committees that provide the same functional oversight as a separate committee sought in a shareholder proposal can effectively convey that a company’s policies, practices and procedures compare favorably with the guidelines of a proposal...The Company’s Public Issues and Contributions Committee (“PICC”) already addresses the objective of the Proposal to have key independent board members directly responsible, as fiduciaries, in the review and oversight of climate strategy and the impact of climate change. Because of its importance, climate-related matters are integrated into multiple aspects of the Company’s business and board oversight responsibilities, and are not treated as discrete specialty topics to be separately addressed, because the Company believes this could miss many of the interconnections between these issues and result in inferior oversight and management of these issues.” (ExxonMobil.TPS3, p. 4)
“The Company believes that the Proposal (i.e., that ExxonMobil, with board oversight, publish a report, omitting proprietary information and prepared at reasonable cost, assessing the public health risks of expanding petrochemical operations and
245

ExxonMobil
investments in areas increasingly prone to climate change-induced storms, flooding, and sea level rise) may be properly omitted from the 2019 Proxy Materials pursuant to Rule 14a-8(i)(7) because it relates to the Company's ordinary business operations and Rule 14a-8(i)(10) because the Company has already substantially implemented the Proposal.” (ExxonMobil.TPS4, p. 13)
“The Board recommends you vote AGAINST this proposal (Item 8 – “Report on Risks of Gulf Coast Petrochemical Investments,” submitted by As You Sow) for the following reasons: ExxonMobil invests only in petrochemical plants or other operations where the potential public health risk can be managed to safe and acceptable levels. Therefore, the report requested by the proponent is not necessary.” (ExxonMobil.PRXY1, p. 62)
(see also Ceres – Climate and Sustainability Shareholder Resolutions Database; SEC – Division of Corporate Finance 2019)
CRITERION 4 – WHAT ARE THE COMPANY’S AFFILIATIONS WITH THIRD PARTIES THAT SPREAD DISINFORMATION ON CLIMATE SCIENCE? INDICATOR 4A. THE AMERICAN LEGISLATIVE EXCHANGE COUNCIL (ALEC) Score: (4) Rationale: Though ExxonMobil did not elaborate on its decision to exit ALEC,
the company nevertheless announced in July 2018 that it had discontinued its membership in the trade association.
Source(s): “ExxonMobil Mobil said on Thursday it ended its association with the
American Legislative Exchange Council, a conservative political group that several other prominent U.S. corporations have left in recent years. “We review our memberships on an annual basis and this year have decided to discontinue our membership in ALEC,” ExxonMobil spokesman Scott Silvestri said.” (ExxonMobil.TPS5; see also Source Watch - ALEC; DeSmogBlog – ALEC)
246

ExxonMobil
INDICATOR 4B. THE AMERICAN PETROLEUM INSTITUTE (API) Score: (1) Rationale: ExxonMobil is a current member of API and has not concretely
distanced itself from API’s climate change deception. Further, ExxonMobil CEO Darren Woods is currently the Chairman of API.
Source(s): (see ExxonMobil.CWS2; see also API – Members; DeSmogBlog –
API) INDICATOR 4C. THE NATIONAL ASSOCIATION OF MANUFACTURERS (NAM) Score: (1) Rationale: ExxonMobil is a current member of NAM and has not concretely
distanced itself from NAM’s climate change deception. Further, ExxonMobil Senior Vice President Neil Chapman is a member of NAM’s Executive Committee.
Source(s): (see NAM – Board of Directors; see also DeSmogBlog – NAM) INDICATOR 4D. THE WESTERN STATES PETROLEUM ASSOCIATION (WSPA) Score: (2) Rationale: ExxonMobil is a current member of WSPA and not concretely
distanced itself from WSPA’s climate change deception. Source(s): (see WSPA – Member Companies; see also DeSmogBlog – WSPA) INDICATOR 4E. AMERICAN FUEL AND PETROCHEMICAL MANUFACTURERS (AFPM) Score: (1) Rationale: ExxonMobil is a current member of AFPM and has not concretely
distanced itself from AFPM’s climate change deception. Further,
247

ExxonMobil
ExxonMobil Senior Vice President of Global Operations Dave Brownell is a member of AFPM’s executive committee.
Source(s): (see ExxonMobil.TPS5, p. 28; see also AFPM – Membership
Directory; DeSmogBlog – AFPM) CRITERION 5 – DOES THE COMPANY PUBLICLY SUPPORT THE NEED FOR CLIMATE POLICY AND REGULATIONS? INDICATOR 5A. REGULATIONS, CARBON TAX, EMISSIONS TRADING, RENEWABLE ENERGY, CCS, ETC. Score: (3) Rationale: Though ExxonMobil supports a specific carbon tax plan (i.e., the
Climate Leadership Council’s revenue-neutral Carbon Dividends Plan), that plan currently has no congressional sponsor and ExxonMobil has not publicly backed other specific proposed policies and/or regulations in the company’s relevant jurisdictions.
Source(s): “For more than a decade, ExxonMobil has supported an economy-
wide price on CO2 emissions as an efficient policy mechanism to address GHG emissions. Consistent with this position, ExxonMobil is also a founding member of the Climate Leadership Council (CLC). Formed in 2017, the CLC calls for the adoption of a carbon fee with the revenues returned to Americans coupled with regulatory simplification.” (ExxonMobil.CO2R1, p. 21)
INDICATOR 5B. PARIS AGREEMENT Score: (2) Rationale: ExxonMobil has made a general statement of support for policies to
advance the Paris climate agreement but has not explicitly endorsed the Agreement’s global temperature goal.
Source(s): “ExxonMobil supports the work of the Paris signatories,
acknowledges the ambitious goals of this agreement and
248
ExxonMobil
believes the company has a constructive role to play in developing solutions.” (ExxonMobil.CWS3)
“We understand that dealing successfully with climate change risks will require a coordinated effort involving individuals, governments and industry leaders around the world. ExxonMobil supports the 2015 Paris Agreement.” (ExxonMobil.CO2R1, p. 1)
CRITERION 6 – HAS THE COMPANY BEEN PUBLICLY TRANSPARENT ABOUT ITS POSITION, ACTIONS, AND AFFILIATIONS WITH REGARD TO CLIMATE SCIENCE AND CLIMATE CHANGE? INDICATOR 6A. WEBPAGE DEDICATED TO CLIMATE CHANGE Score: (5) Rationale: ExxonMobil maintains a separate webpage on its website devoted to
climate change. Source(s): (see ExxonMobil.CWS4) INDICATOR 6B. STAND-ALONE SUSTAINABILITY REPORT WITH SPECIFIC REFERENCE TO CLIMATE CHANGE Score: (5) Rationale: ExxonMobil’s sustainability report is easily accessible through its
website and contains a section dedicated to climate change. Source(s): (see ExxonMobil.SR, p. 16) INDICATOR 6C. DISCLOSURE TO CDP Score: (1) Rationale: CDP website indicates “No Response” from ExxonMobil for the
Climate Change 2018 survey. Source(s): (see ExxonMobil.CDP1)
249

ExxonMobil
INDICATOR 6D. DISCLOSURE OF THIRD-PARTY RELATIONSHIPS AND LOBBYING ACTIVITIES Score: (1) Rationale: ExxonMobil discloses its financial support for various organizations
that provide "public information and policy research” (e.g., American Enterprise Institute, Brookings Institution), but not its affiliation with or payments to trade associations.
Source(s): “ExxonMobil provides support to a variety of think tanks, trade
associations and coalitions in order to promote informed dialogue and sound public policy on matters pertinent to the Corporation’s interests....Our support does not constitute an endorsement of every policy position or point of view expressed by a recipient organization. We conduct an annual evaluation of the merits of each organization and reserve the right to initiate, sustain or withdraw support at any time. Some of the support provided to these organizations may be used by the firms for lobbying...In 2018, ExxonMobil reported federal lobbying expenses totaling $11.2 million in its public Lobbying Disclosure Act filings. This total includes expenses associated with the costs of employee federal lobbying, as well as those portions of payments to trade associations, coalitions and think tanks that are spent on federal lobbying.” (ExxonMobil.FPS1)
“ExxonMobil provides support to organizations that promote international relationships, institutions with strong research capabilities that contribute to informed policy decision-making, and organizations that assess public policy alternatives on issues of importance to the petroleum and petrochemical industries. In 2017, worldwide contributions for public information and policy research totaled almost $5.8 million, of which $5.7 million was within the United States.” (ExxonMobil.FPS2, p. 1)
INDICATOR 6E. REPORT ON CLIMATE RELATED RISK SCENARIOS Score: (5)
250

ExxonMobil
Rationale: ExxonMobil produced and published a 2°C scenario report in the reporting period and noted specific potential impacts on the company.
Source(s): “Based on currently anticipated production schedules, we estimate
that by 2040 a substantial majority of our year-end 2017 proved reserves will have been produced. Since the 2°C scenarios average implies significant use of oil and natural gas through the middle of the century, we believe these reserves face little risk from declining demand...For the remaining year-end 2017 proved reserves that are projected to be produced beyond 2040, the reserves are generally associated with assets where the majority of development costs are incurred before 2040. While these proved reserves may be subject to more stringent climate-related policies in the future, targeted investments could mitigate production-related emissions and associated costs. In addition, these assets have generally lower risk given the technical knowledge that accumulates over many decades of production. Accordingly, the production of these reserves will likely remain economic even under the 2°C scenarios average.” (ExxonMobil.CO2R1, p. 13; see also ExxonMobil.CO2R2)
251

ExxonMobil
“As noted before, the world will continue to require significant investment in both liquids and natural gas, even under the assessed 2°C scenarios. Under the 2°C scenarios average, ExxonMobil still would need to replenish approximately 35 billion oil-equivalent barrels of proved reserves by 2040, assuming the Company retains its current share of global production over that time period...In light of the multiple factors that will influence decisions to commercialize undeveloped resources, it is not possible to identify which specific assets ultimately will be commercialized and produced. As we consider the implied oil and natural gas demand to 2040 under the 2°C scenarios average, it is possible that some higher-cost assets, which could be impacted by many factors including future climate-related policy, may not be developed. We are confident, however, that the size, diversity and continued upgrading of our undeveloped resources, along with technology developments, will enable the ongoing replenishment of our proved reserves for decades to come under a range of potential future demand scenarios. We test our investments over a wide range of commodity price assumptions and market conditions. Notably, the IEA’s estimates of future prices under its 2°C pathway fall within the range we use to test our investments. Additionally, over our long history we have successfully competed in periods where supply exceeds demand. In such a business environment, the lowest cost of supply will be advantaged. ExxonMobil’s long-standing focus on efficiency and continuous improvement will position us to compete successfully.” (ExxonMobil.CO2R1, p. 14)
“...a portion of our non-proved resources represent unconventional liquids assets in the United States. These assets have shorter development cycles than other capital-intensive resources, which we believe make this class of assets resilient under the 2°C scenarios average. Natural gas assets form another portion of our non-proved resources. The 2°C scenarios average anticipates demand growth of this cleaner-burning fuel in the future, making these assets resilient under the 2°C scenarios average. Our remaining undeveloped liquids resources, in some cases, may not be attractive investments under the 2°C scenarios average, assuming no advances in technology, processes or designs. However, the carrying value of these undeveloped liquids resources is less than 5 percent of ExxonMobil’s total net book value of
252

ExxonMobil
property, plant and equipment as of September 30, 2018.” (ExxonMobil.CO2R1, p. 15; see also )
[see also ExxonMobil_FPS_2018_OutlookForEnergy, page 44]
253

Galp Energia, SGPS, S.A.
XVI. Galp Energia, SGPS, S.A. CRITERION 1 – WHAT IS THE COMPANY’S POSITION ON CLIMATE SCIENCE? INDICATOR 1A. CONSISTENTLY ACCURATE PUBLIC STATEMENTS ON CLIMATE SCIENCE AND THE CONSEQUENT NEED FOR SWIFT AND DEEP REDUCTIONS IN EMISSIONS FROM THE BURNING OF FOSSIL FUELS Score: (2) Rationale: Galp candidly acknowledges a shifting energy paradigm and
highlights the urgency and importance of achieving global net-zero CO2 emissions in the second half of the century, but does not meaningfully address climate science in its public disclosures. Moreover, Galp indicates support for a “gradual transition to a low carbon economy,” which suggests it does not affirm the need for swift and deep reductions in emissions from the burning of fossil fuels.
Source(s): “It is consensual that the global energy mix will continue to evolve
over the coming decades, and that energy companies will play a key role in promoting the transition to a lower carbon economy.” (Galp.IR, p. 12)
“Galp’s strategy involves the development of a competitive and diversified upstream portfolio, integrated with an efficient and competitive downstream business, constantly adapting to the needs of our clients and based on innovative and differentiating solutions to help support the gradual transition to a low carbon economy.” (Galp.IR, p. 38)
“We seek the balance between meeting the energy needs and minimizing the carbon intensity of our activity.” (Galp.CWS1)
“The energy paradigm in the world is changing and Galp aims to play an active role in this transformation...” (Galp.CWS2)
“The decarbonisation of Portugal and the world is the major challenge for the next few years. The Paris Agreement brought with it several goals to be met by 2050. The transformation to
254

Galp Energia, SGPS, S.A.
reduce emissions has already begun and in itself represents a specific response to climate change. The National Energy and Climate Plan guarantees that the country could undergo a profound process of decarbonisation within a period of just 10 years. Decarbonisation “isn't easy, but it's possible”, declares Carlos Costa Pina. The Executive Director of Galp adds that “companies need to make a contribution and do their homework”, as a means of speeding up this process of global transformation. Meeting the challenge of energy transition and creating a low-carbon emission society demands a diversified range of alternatives. As such, Galp and other entities from the sector believe in the development of sustainable solutions that meet the current needs of energy, mobility and consumption. However, such an achievement will only be possible with help of everyone.” (Galp.CWS3)
“I think it’s important to remind people the challenges that await us in the future and the importance of doing our own homework, so we’re ready for those challenges...the biggest challenge is decarbonisation, the reduction of emission...We all have very ambitious goals, in our country, and in other countries around the world, for 2050. To that end companies must give their contribution and do their homework...I think today’s session with speakers from the International Energy Agency, from national authorities in the environmental field, and from the major oil and gas companies in the world, they all helped us to reflect further on this matter.” (Galp.CWS3)
“At Galp, we are committed to the following objectives...Committing to responsible corporate engagement in climate policy: acknowledging corporate engagement as a crucial factor in ratifying and complying with the Paris Climate Agreement.” (Galp.CWS4)
“The urgency and depth of the behavioural changes that we will have to operate in society in order to be successful in fighting climate change, as well as the instrumental role of energy companies - and the strength of their brands - in this process, confronts us with the greatest responsibility we have taken on throughout our history. As a company, we fully take on this responsibility in the scenarios we draw, in the strategies we outline
255

Galp Energia, SGPS, S.A.
and in the projects we have developed and where we invest in to provide our partners, stakeholders, clients and the society in general with the ability to transition to more sustainable behaviours.” (Galp.IR, pp. 95-96)
“Meet 2030 contributes to the implementation of the Paris Climate Agreement, which aims to achieve a zero-carbon economy in the second half of the century. Galp promoted and led the Meet 2030 project, with the following objectives: Create scenarios for Portugal to achieve carbon neutrality in 2030; Identify potential new economic activity sectors, innovation in processes and products, as well as the competitive advantages for companies to maintain medium and long-term sustainable growth; Identify solutions with higher added value and contributing to a policy action that helps define strategic priorities both at a national and international level.” (Galp.CWS5)
CRITERION 2 – WHAT MEASURES IS THE COMPANY TAKING TO REDUCE ITS CARBON FOOTPRINT? INDICATOR 2A. GHG EMISSIONS TARGETS Score: (2) Rationale: Galp’s plan for reducing GHG emissions is not company-wide, as the
company's stated objective of acquiring 100% renewable energy by 2021 only applies to the Galp’s operations in Portugal.
Source(s): “From 2021 onward, we are committed to acquiring 100%
renewable electricity in Portugal, expecting to reduce our total Scope 2 emissions to close to zero.” (Galp.FPS1, p. 17)
“Despite keeping oil and natural gas at the heart of our strategy, we will develop new solutions and explore business opportunities supported by low-carbon energy sources, where we expect to allocate 5-15% of our capital.” (Galp.IR, p. 37)
256

Galp Energia, SGPS, S.A.
“By 2022, we will have cut our carbon intensity by 25% at the Sines refinery and 15% at the Matosinhos refinery, based on the figures for 2013.” (Galp.IR, p. 71; see also Galp.FPS1, p. 17)
“Aware of the challenges inherent in a transition to a low carbon economy, Galp has made a strategic commitment to gradually diversify the portfolio by integrating energy solutions that lead to lower carbon emissions and new business models. As an integrated energy player our current market presence puts us in a strong position to integrate current products with new services and business models during the decarbonization of the economy (Galp.CWS6)
INDICATOR 2B. GHG EMISSIONS REDUCTIONS Score: (5) Rationale: Company’s GHG emissions intensity has decreased in each of the
last two reporting years and has decreased by over 20% over the last two reporting years.
Source(s): [see Supplemental Data] INDICATOR 2C. R&D INTO LOW-CARBON TECHNOLOGIES Score: (3) Rationale: Galp has publicly committed to increase funding for R&D into low
carbon technologies and discloses some allocations (e.g., eco-efficiency projects), but does not break down the company’s low-carbon R&D budget.
Source(s): The investment in low-carbon energy and new business models
will account for c.5% of total capital by 2020, and 5% to 15% from 2020 onwards.“ (Galp.FPS1, p. 17)
“Industry, innovation and infrastructure: We promote the innovation and technological development, as well as the creation of sustainable, resilient and accessible infrastructure for all. More than €90m of R&D investment planned until 2021. €12.6m invested
257

Galp Energia, SGPS, S.A.
in R&D in the E&P in 2018.” (Galp.IR, p. 27; see also Galp.FPS1, p. 29)
“By 2023, we will have invested c.€66m in eco-efficiency projects, avoiding the emission of more than 150 kton of CO2e. By 2022, we will have cut our carbon intensity by 25% at the Sines refinery and 15% at the Matosinhos refinery, based on the figures for 2013.” (Galp.IR, p. 71)
“We have invested €13.5m in eco-efficiency in refining.” (Galp.FPS1, p. 25)
“As part of Galp’s low carbon strategy, we are preparing the development of sustainable renewable power generation projects, enabling integration with our electricity sales in the markets in which we operate. For that purpose, during 2018 we began acquiring licenses for solar power generation in Iberia.” (Galp.IR, p. 61)
“Faced with technological challenges resulting from our E&P activities, in 2018, we moved forward with the development of seven Carbon Capture, Utilisation and Storage related R&D and innovation projects within the following areas of interest: (1) Utilisation of CO2 as a feedstock in industrial processes; (2) Development of sustainable and competitive technologies for the separation of CO2/CH4 (3) Development of a new simulator to minimise the problems associated with oil flow production with a high CO2 content; and (4) Increasing the oil recovery factor through the reinjection of CO2, either standalone or mixed with water.” (Galp.IR, p. 70; see also Galp.FPS1, p. 30)
INDICATOR 2D. USE OF AN INTERNAL PRICE ON CARBON Score: (4) Rationale: Galp has disclosed the internal price on carbon it uses when
evaluating all investments and describes generally how it is employed. Still, it remains unclear whether the carbon intensity metric Galp applies to its value chain (i.e., inclusion of Scope 1-3 intensity metrics) is also employed in that analysis.
258

Galp Energia, SGPS, S.A.
Source(s): Galp is incorporating carbon into its project investment analysis, through two different mechanisms. We consider a carbon price ($40/tonCO2e) in all investment decision-making processes, which together with a due diligence analysis of the activity’s carbon intensity, ensures the alignment of our assets and operations with a lower carbon economy.” (Galp.IR, p. 65; see also Galp.IR, p. 142; Galp.FPS1, p. 20)
“Depending on investment amounts, the projects undertaken by the Company are rigorously analyzed, including resilience tests to different scenarios, and then submitted for approval to the Board of Directors or the Executive Committee. Projects’ approval process implies the expectation of not exceeding the estimated cost of capital and allowing an appropriate estimated return.” (Galp.IR, p. 145)
“In order to evaluate new projects and potential investments, Galp develops resilience tests to different scenarios for commodity prices and capital requirements and for demand and impacts in terms of carbon emissions.” (Galp.IR, p. 144)
“Also in 2018, Galp presented for the first time its carbon intensity adapted to its value chain and applicable to all business segments. The carbon intensity was calculated considering the emissions from its activities, including the scopes 1, 2 and 3 mentioned above, and the energy marketed by the various business segments, namely crude oil, natural gas, liquid fuels, biofuels and electricity.” (Galp.IR, p. 72)
CRITERION 3 – IS CLIMATE SCIENCE INTEGRAL TO THE GOVERNANCE AND OVERSIGHT OF THE COMPANY? INDICATOR 3A. DELINEATION OF RISKS AND RISK MANAGEMENT PROCEDURES RELATED TO CLIMATE CHANGE INDICATOR 3AI. REGULATORY RISKS Score: (3)
259

Galp Energia, SGPS, S.A.
Rationale: Galp notes a few specific existing and proposed climate-related laws and regulations and the potential impacts on the company, but in aggregate the company’s analysis is not comprehensive.
Source(s): “Galp has reflected in its reporting the increasing risks relating to
carbon pricing and its possible impact on operations. The price of emissions licenses granted under the European Union Emissions Trading System had a substantial increase in 2018, representing an opportunity to improve resource efficiency and the atmospheric emissions of our refining activities. We pursue the continuous improvement of the carbon and energy intensity of our refining system, setting ambitious targets, supported by a rolling plan for investments in operational eco-efficiency.” (Galp.IR, p. 65)
“The Company s downstream activities in Iberia are subject to political, legal and regulatory risks, with an emphasis on regulation and competition laws. Any changes at this level may also adversely impact the business context in which Galp operates. In addition, recent treaties, international agreements and regulations favouring lower-carbon sources of energy, which require companies to implement measures to reduce greenhouse gas and other associated emissions, give rise to additional compliance obligations with respect to emissions, the capture and use of carbon dioxide, which may result in higher investments and project execution costs (e.g. Sulphur IMO)...As part of the process for assessing any potential investments in different geographies, Galp evaluates the risk of the country’s legal and regulatory framework. This risk is continuously monitored, following the investment decision, in order to assess any changes that have been introduced by the country’s legislators or regulators. Galp analyses potential impacts and decides accordingly, in order to protect the interests of its stakeholders.” (Galp.IR, p. 145)
“The current IEA projections make it clear that current policies and those proposed up to the end of 2018 are not enough to meet the 20C commitment. On this basis, both the Portuguese and European governments are committed to developing a transition aligned with the climate targets. The European institutions and the Portuguese Government have established a long-term shared vision and a national roadmap for harnessing decarbonisation
260

Galp Energia, SGPS, S.A.
opportunities and meeting climate challenges. To achieve these expectations and targets over the next 30 years, energy consumption patterns will need to be realigned in the transportation, industrial and residential sectors.” (Galp.IR, p. 64)
“Galp’s bio-industrial unit in Sines, Enerfuel, focuses on the transformation of waste oils and waste animal fats into second generation FAME biodiesel. In addition, we are producers of second generation biofuels by co-processing vegetable oil together with gasoil, resulting in a final diesel fuel indistinguishable from diesel of fossil origin. In accordance with the goals established by the European Commission and the respective countries regarding the introduction of biofuels into Iberia, Galp will continue to pursue the goal of incorporating 10% into gasoline and diesel by 2020, using the various complementary renewable sources at its disposal. In 2018, we introduced about 130 thousand m3 of biofuels to comply with the legal obligation to put 7.5% of energy content from renewable sources for road transport in Portugal. In Spain, around 130 thousand m3 of biofuels were introduced, also in accordance with local legislation.” (Galp.IR, pp. 55-56)
INDICATOR 3AII. PHYSICAL RISKS Score: (4) Rationale: Galp acknowledges climate change as contributor to the physical
risks facing its business and identifies the operational segments particularly exposed to such physical risks.
Source(s): “Galp recognises the existence of various risks associated with
climate change and the energy transition...Physical risks, both event-driven (acute) and long-term (chronic), are identified in our risk management approach within the category of “Disruptive Events” as explained later in this report.” (Galp.IR, p. 65)
“The Company recognises that there are potential impacts on its business model resulting from regulatory changes and shifts in consumption patterns and technology. In parallel, it also considers there are risks associated with the physical impacts due to
261

Galp Energia, SGPS, S.A.
climate change. However, Galp highlights opportunities such as development of new products and services, energy efficiency gains, access to new markets and creation of a more resilient supply chain.” (Galp.IR, p. 142)
“The nature, technical complexity and diversity of Galp’s operations - particularly exploration and production in ultra-deep waters and in the refining process - expose the Company to a broad spectrum of disruptive EQSS risks. Included in this category are chronic physical risks (long- term changes in climatic patterns such as sustained high temperatures, the occurrence of successive droughts, change in precipitation patterns); acute physical hazards (civil unrest, war and terrorism, and natural disasters such as cyclones, hurricanes and floods); and operational contingencies relating to the characteristics of Galp’s activities... This type of event may negatively influence the Company’s reputation as well as the value of the Group’s assets and its profits...Galp also regularly promotes specific internal and external HSE audits and performs assessments on all of the assets it operates, with the objective of preventing accidents, protecting people and preserving operational performance, reputation and assets, through greater risk control in terms of operations and processes. In addition, the Company regularly monitors the operations of assets that are operated by third parties, within the powers that have been agreed under the Joint Operating Agreements.” (Galp.IR, p. 146)
INDICATOR 3AIII. MARKET AND OTHER INDIRECT RISKS AND OPPORTUNITIES Score: (4) Rationale: Galp provides a detailed analysis of how it might be affected by
indirect risks and opportunities related to climate change (e.g., competition from other industries, changing consumption patterns), including some discussion of potential financial impacts and the company’s strategy to mitigate such risks.
262

Galp Energia, SGPS, S.A.
Source(s): “The Company recognises that there are potential impacts on its business model resulting from regulatory changes and shifts in consumption patterns and technology...However, Galp highlights opportunities such as development of new products and services, energy efficiency gains, access to new markets and creation of a more resilient supply chain.” (Galp.IR, p. 142)
“Galp recognises the existence of various risks associated with climate change and the energy transition...Transition risks, including policy, legal, technological, market and reputational risks have been identified as the main risks faced by Galp, and these have been incorporated into our analysis of competition, legal and compliance, and markets.” (Galp.IR, p. 65)
“...lower prices may undermine Galp’s investment plans, and, on the other hand, the rising prices of oil or natural gas may affect the value and profitability of Galp’s assets. Changes in consumption patterns, especially those resulting from greater demand for solutions with lower carbon intensity, which may have a negative impact on the demand for oil and gas, may enhance Galp s risk exposure.” (Galp.IR, p. 144)
“In addition, the new energy paradigm, towards a shift in the way energy is produced, distributed and used, with a more or less accelerated transition to a low-carbon economy, involves changes in consumption and technological patterns that are very important challenges for Galp. The Company must be able to incorporate this trend into its strategy; otherwise, it will have a competitive disadvantage. Any event that prevents the implementation of Galp’s strategy may affect the profitability and, ultimately, the sustainability of the company...Being aware of the risks and opportunities accompanying the transition to a lower-carbon economy, Galp has committed to gradually diversifying its portfolio and to increasing its low-carbon power generation.” (Galp.IR, p. 145)
“The energy sector is extremely competitive. Additionally, due to technology developments, Galp may face competition from entities intervening in other industries or sectors that may integrate into the energy space...The intense competition may
263

Galp Energia, SGPS, S.A.
adversely affect Galp’s activity, as well as its operational and financial performance...In view of the existing competition in the Energy sector, the Company has defined an innovation agenda, being committed to the development of competences, both internally and through partnerships, that enable it to study, create and implement new and better technical and technological solutions. In spite of the fact that some of Galp s competitors are larger, with a potentially stronger financial capacity that may facilitate access to more resources, Galp has a diversified and competitive portfolio. This includes stakes in two of the largest development projects worldwide - the pre-salt play in the Santos basin in Brazil and the Rovuma LNG project in Mozambique.” (Galp.IR, p. 146)
“In line with the continuing adaptation to our customers’ needs and behaviours, Galp partnered with a start-up operating in the gas and power market at Spain. This investment enables us to reach 25 thousand customers in the Spanish G&P market, through a digital and innovative business model, adaptable to the customer needs, improving their efficiency and experience. In Portugal, aware of the current changes in energy consumption in the transportation sector, Galp has developed an electric transportation strategy which is focused on an integrated commercial offering, through the inclusion of electric transportation solutions in our G&P offer, and the implementation of a network of fast-charging points at our service stations in Portugal. In 2018, we had 18 fast-charging points on the main Portuguese highways, and we expect to install 18 more in 2019 in the two main Portuguese metropolitan areas. We have continued to seek to meet our customers’ expectations, which is why since 2016 Galp has provided Evologic diesel and gasoline, a new fuel range with additives allowing greater savings, extended engine life and greater efficiency.” (Galp.IR, p. 72)
“Technology is constantly changing, enabling the emergence of new disruptive players, some from non-energy sectors, leading to deep changes in the relationship between energy companies and their customers. At this field, Galp adapted and improved its digital strategy, improving digitalization and automation to better respond to both internal processes and customers’ needs. The growing demand
264

Galp Energia, SGPS, S.A.
for low-carbon energy is changing the consumption patterns of our customers and also opening an opportunity for the growth of natural gas, including LNG, bioenergy, renewables and hydrogen. Galp is taking advantage of the portfolio diversification opportunity, namely by increasing the share of natural gas in the oil and gas upstream portfolio, through the Mamba project, and developing solar power parks, with a first project in Portugal. As an integrated energy player, our current market presence puts us in a strong position to integrate current products with new services and business models during the decarbonisation of the economy.” (Galp.IR, p. 65)
“...Galp assesses and studies its brand reputation in all the countries it has commercial operations in, from Upstream to Downstream. This study is carried out every year by an independent Brand reputation and strength firm that ranks brands in the most diverse sectors in order of importance.” (Galp.IR, pp. 95-96)
INDICATOR 3B. DELEGATION OF BOARD MEMBERS AND/OR COMMITTEES WITH EXPLICIT OVERSIGHT OF CLIMATE CHANGE POLICY Score: (1) Rationale: Galp’s Sustainability Committee is tasked with the monitoring of
evolving climate-related issues, but its charter does not explicitly mention climate change as an issue that is under the committee’s oversight.
Source(s): “The Sustainability Committee was set up in 2012, with the aim of
creating sustainable value, and an accompanying mission to ensure the integration of the principles of sustainability in the management of the Group, by promoting good industry practices in all business and corporate areas. The committee is chaired by the lead independent director and vice-chairman of the Board of Directors, and its other permanent members are the Chairman of the Executive Committee, the executive director who coordinates the area of sustainability, the chief financial officer, the head of the EQS and Sustainability Department, the heads of the business areas, and the relevant corporate departments.” (Galp.IR, p. 125; see also Galp.CCC1; Galp.IR, p. 129)
265

Galp Energia, SGPS, S.A.
“Along with the Company’s performance, the business environment is monitored at Sustainability Committee meetings, ensuring that senior management monitor evolving climate-related issues.” (Galp.IR, p. 67; see also Galp.IR, p. 66)
INDICATOR 3C. DOES THE COMPANY SUPPORT CLIMATE-RELATED SHAREHOLDER RESOLUTIONS? Score: (3) Rationale: Galp has not faced any climate-related shareholder resolutions put
forward by established networks of socially responsible investors during the reporting period.
Source(s): (see Galp.PRXY1; Galp.PRXY2; see also Ceres – Climate and
Sustainability Shareholder Resolutions Database; SEC – Division of Corporate Finance 2019)
CRITERION 4 – WHAT ARE THE COMPANY’S AFFILIATIONS WITH THIRD PARTIES THAT SPREAD DISINFORMATION ON CLIMATE SCIENCE? INDICATOR 4A. THE AMERICAN LEGISLATIVE EXCHANGE COUNCIL (ALEC) Score: (3) Rationale: Galp is based in Portugal and is not cited by Source Watch or
DeSmogBlog as having ever been affiliated with association. Source(s): (see Source Watch - ALEC; DeSmogBlog – ALEC) INDICATOR 4B. THE AMERICAN PETROLEUM INSTITUTE (API) Score: (3) Rationale: Galp is based in Portugal and is neither in API’s current membership
list nor noted by DeSmogBlog as having ever been affiliated with association.
266

Galp Energia, SGPS, S.A.
Source(s): (see API – Members; DeSmogBlog – API) INDICATOR 4C. THE NATIONAL ASSOCIATION OF MANUFACTURERS (NAM) Score: (3) Rationale: Galp is based in Portugal and is neither in NAM’s current BOD list
nor noted by DeSmogBlog as having ever been affiliated with association.
Source(s): (see NAM – Board of Directors; DeSmogBlog – NAM) INDICATOR 4D. THE WESTERN STATES PETROLEUM ASSOCIATION (WSPA) Score: N/A Rationale: Galp is based in Portugal and has no operations in the association’s
jurisdiction. Further, Galp is neither mentioned by DeSmogBlog as having ever been affiliated with the association nor listed as a corporate member on WSPA’s website.
Source(s): (see WSPA – Member Companies; DeSmogBlog – WSPA) INDICATOR 4E. AMERICAN FUEL AND PETROCHEMICAL MANUFACTURERS (AFPM) Score: (3) Rationale: Galp is based in Portugal and is neither in AFPM’s current
membership list nor noted by DeSmogBlog as having ever been affiliated with association.
Source(s): (see AFPM – Membership Directory; DeSmogBlog – AFPM)
267

Galp Energia, SGPS, S.A.
CRITERION 5 – DOES THE COMPANY PUBLICLY SUPPORT THE NEED FOR CLIMATE POLICY AND REGULATIONS? INDICATOR 5A. REGULATIONS, CARBON TAX, EMISSIONS TRADING, RENEWABLE ENERGY, CCS, ETC. Score: (3) Rationale: Galp supports carbon pricing generally, and is actively involved in
various climate change-related initiatives of the Portuguese government, but has not expressed support for specific climate policies and/or regulations during the reporting period.
Source(s): “...both the Portuguese and European governments are
committed to developing a transition aligned with the climate targets [of the Paris Climate Agreement]. The European institutions and the Portuguese Government have established a long-term shared vision and a national roadmap for harnessing decarbonisation opportunities and meeting climate challenges...This paradigm [i.e., the energy transition] entails both challenges and opportunities, and calls for the full integration of climate variables into business planning and strategy, by assessing the resilience of companies in the face of energy transition, as well as reinforcing the significance of carbon pricing as a variable in decision making.” (Galp.IR, p. 64)
“Roadmap for Carbon Neutrality...The Portuguese Government launched this initiative with the aim of studying the technical and economic viability of trajectories for reducing greenhouse gas (GHG) emissions in Portugal by 2050, for a competitive and low-carbon economy, in line with Portugal's commitment of achieving carbon neutrality by 2050...Galp has actively followed this initiative as a stakeholder. Following an invitation from the Portuguese Government, Galp participated in the discussion of the working groups for the energy and mobility sector and presented its formal opinion about this Roadmap in the Public Consultation.” (Galp.CWS7)
INDICATOR 5B. PARIS AGREEMENT
268

Galp Energia, SGPS, S.A.
Score: (2) Rationale: Though Galp is a member of multiple international initiatives whose
goals include contributing to the implementation of the Paris Climate Agreement, Galp has not explicitly endorsed the Agreement’s temperature goals.
Source(s): “MEET 2030 is a project coordinated by BCSD Portugal, in
collaboration with Instituto Superior Técnico (IST), and other associated companies. It has also the participation of other stakeholders, including public entities and other national and international organizations. Meet 2030 contributes to the implementation of the Paris Climate Agreement, which aims to achieve a zero-carbon economy in the second half of the century. Galp promoted and led the Meet 2030 project, with the following objectives: Create scenarios for Portugal to achieve carbon neutrality in 2030; Identify potential new economic activity sectors, innovation in processes and products, as well as the competitive advantages for companies to maintain medium and long-term sustainable growth; Identify solutions with higher added value and contributing to a policy action that helps define strategic priorities both at a national and international level.” (Galp.CWS5)
“We endorse international principles and initiatives aligned with our commitments and strategy. Through this practice, we demonstrate our determination and our high level of commitment to all stakeholders...We joined the We Mean Business coalition, which is part of NAZCA Tracking Climate Action initiative of the United Nations Framework Convention on Climate Change (UNFCC). This platform, made up of a group of organizations working with the business sector and investors worldwide, promotes the transition to a low carbon economy in order to ensure sustainable economic growth. The platform also promotes proactive climate action, encouraging the creation of new policy landmarks within the context of climate change. At Galp, we are committed to the following objectives...Committing to responsible corporate engagement in climate policy: acknowledging corporate engagement as a crucial factor in ratifying and complying with the Paris Climate Agreement.” (Galp.CWS4)
269

Galp Energia, SGPS, S.A.
CRITERION 6 – HAS THE COMPANY BEEN PUBLICLY TRANSPARENT ABOUT ITS POSITION, ACTIONS, AND AFFILIATIONS WITH REGARD TO CLIMATE SCIENCE AND CLIMATE CHANGE? INDICATOR 6A. WEBPAGE DEDICATED TO CLIMATE CHANGE Score: (5) Rationale: Galp maintains a separate webpage on its website devoted to
climate change. Source(s): (see Galp.CWS8) INDICATOR 6B. STAND-ALONE SUSTAINABILITY REPORT WITH SPECIFIC REFERENCE TO CLIMATE CHANGE Score: (5) Rationale: Though Galp has not published a traditional standalone sustainability
report since 2015, its Integrated Annual Report and Sustainability Objectives and Goals report contain large sections devoted to sustainability issues.
Source(s): (see Galp.IR, pp. 62-89; Galp.FPS1, pp. 16-21)
INDICATOR 6C. DISCLOSURE TO CDP Score: (5) Rationale: CDP website indicates “Submitted” from Galp for Climate Change
2018. Source(s): (see Galp.CDP2) INDICATOR 6D. DISCLOSURE OF THIRD-PARTY RELATIONSHIPS AND LOBBYING ACTIVITIES Score: (1)
270

Galp Energia, SGPS, S.A.
Rationale: Galp has not disclosed its affiliations with or payments to trade associations or lobbying groups on its website or public filings.
Source(s): INDICATOR 6E. REPORT ON CLIMATE RELATED RISK SCENARIOS Score: (5) Rationale: Galp has produced and published an analysis on what a 2°C or lower
increase in global temperature would mean for its businesses, strategies, and financial planning.
Source(s): “The energy transition is guided by the sustainable development
scenario set out by the International Energy Agency (IEA)...The most recent World Energy Outlook report from the IEA makes it clear that a move towards renewables alone will not be sufficient, and calls for a more inclusive energy strategy, encompassing the development of hydrogen-based technologies, improvements in energy efficiency and the implementation of emerging mitigation technologies such as carbon capture, utilisation and storage (CCUS) .” (Galp.IR, p. 64; see also Galp.IR, p. 65)
“In a constantly changing world, in order to guarantee the sustainability of the Company, we test the resilience of our strategy to different scenarios of the future energy paradigm. We have built four contrasting scenarios, considering different levels of technological and political regulation disruption, and we deem these uncertainties critical for the energy sector. One of these scenarios is aligned with the International Energy Agency's Sustainable Development Scenario.” (Galp.CWS9)
“We recognise that new and innovative solutions will foster structural changes to energy consumption, which will become gradually more sustainable, at an economic, environmental and social level. Therefore, we have tested our strategy against a scenario of rapid change in the world energy mix, compatible with the global ambition to mitigate the increase in greenhouse gas emissions. Despite keeping oil and natural gas at the heart of our strategy, we will develop new solutions and explore business opportunities
271

Galp Energia, SGPS, S.A.
supported by low-carbon energy sources, where we expect to allocate 5-15% of our capital. Electrification is one of the key trends in the energy sector, and we intend to support our power retail offer with the supply of renewable energy. Among several options, we highlight solar, which has proven an increasingly competitive and flexible solution for both clients and energy companies.” (Galp.IR, p. 38; see also Galp.IR, pp. 35-37)
272

Hess
XVII. Hess CRITERION 1 – WHAT IS THE COMPANY’S POSITION ON CLIMATE SCIENCE? INDICATOR 1A. CONSISTENTLY ACCURATE PUBLIC STATEMENTS ON CLIMATE SCIENCE AND THE CONSEQUENT NEED FOR SWIFT AND DEEP REDUCTIONS IN EMISSIONS FROM THE BURNING OF FOSSIL FUELS Score: (1) Rationale: Though Hess explicitly supports the aim of the Paris Agreement’s
temperature targets, it repeatedly notes that climate change should be addressed within the context of other societal goals (e.g., human welfare, global economic development). Moreover, Hess misrepresents current climate science by mischaracterizing the conclusions of the Intergovernmental Panel on Climate Change’s October 2018 report.
Source(s): “While the Intergovernmental Panel on Climate Change (IPCC)
published a report in October 2018 that suggests that net emissions of carbon dioxide must fall 45 percent by 2030 and reach “net zero” by 2050 to limit global temperature rise to below 1.5°C, the IEA has yet to develop energy demand scenarios that reflect the IPCC’s assumption. Additionally, there are no known regulatory proposals for achieving the IPCC’s suggestion.” (Hess.SR. p. 42)
“Climate change is a significant global challenge that requires governments, businesses and civil society to work together on cost-effective policies. We believe climate risks can and should be addressed while also providing the safe, affordable and reliable energy necessary to ensure human welfare and global economic development in the context of the United Nations (U.N.) Sustainable Development Goals.” (Hess.SR. p. 39)
“Hess supports the aim of the Paris Agreement to limit global average temperature rise to well below 2°C.” (Hess.SR. p. 39)
“We recognize that climate change is a global environmental concern.” (Hess.10K. p. 15)
273

Hess
CRITERION 2 – WHAT MEASURES IS THE COMPANY TAKING TO REDUCE ITS CARBON FOOTPRINT? INDICATOR 2A. GHG EMISSIONS TARGETS Score: (3) Rationale: Hess has established a science-based company-wide GHG
emissions intensity reduction target in service of the Paris Climate Agreement’s global temperature goal (e.g., “Reduce our GHG emissions intensity by 25 percent for our 2014 portfolio of operated assets, by 2020”), but has not yet set a long-term target or a target that includes emissions from the end use of its products.
Source(s): “As part of Hess’ climate change strategy, we have established
three targets aligned with the TCFD’s criteria for target-setting. We have committed to: (1) Reduce our GHG emissions intensity by 25 percent for our 2014 portfolio of operated assets, by 2020 (versus a 2014 emissions baseline); (2) Reduce our flaring intensity by 50 percent for our 2014 portfolio of operated assets, by 2020 (versus a 2014 emissions baseline); (3) Lower methane emissions intensity to less than 0.47 percent across our U.S. onshore upstream operations by 2025.” (Hess.SR. p. 46)
“The WEO’s Sustainable Development scenario requires an ambitious 21 percent carbon intensity reduction by 2030 in order to be consistent with a less than 2°C aim. This 21 percent carbon intensity reduction figure is derived from the Sustainable Development scenario’s CO2 emissions divided by primary world energy demand in 2030 versus 2017. Hess’ 25 percent GHG intensity reduction target, referenced above, which was set in 2015 and is based on our operated Scope 1 and 2 GHG emissions divided by production, is aligned with the IEA’s Sustainable Development scenario 2030 goal and is consistent with the Paris Agreement’s 2°C ambition.” (Hess.SR. p. 46)
INDICATOR 2B. GHG EMISSIONS REDUCTIONS
274

Hess
Score: (3) Rationale: Company’s GHG emissions intensity has increased in one of the last
two reporting years but decreased as a whole over the last two reporting years.
Source(s): [see Supplemental Data] INDICATOR 2C. R&D INTO LOW-CARBON TECHNOLOGIES Score: (1) Rationale: Hess has neither publicly committed to investing in-house R&D into
low-carbon technologies nor disclosed a low-carbon R&D budget. Source(s): INDICATOR 2D. USE OF AN INTERNAL PRICE ON CARBON Score: (3) Rationale: Hess has set and has disclosed an internal price on carbon that it
employs in investment decisions only for “significant new projects.” Source(s): The value assurance reviews focus on economics, subsurface and
facility design, safety, environmental and socioeconomic considerations, regulatory requirements and other nontechnical risks. In order to evaluate the potential impact of carbon cost on project economics, we apply a carbon price of $40 per tonne to the forecasted greenhouse gas emissions from significant new projects.” (Hess.SR. pp. 13-14)
“We use $40/tonne to evaluate all significant new investments, unless this investment is in a country that currently has carbon regulations. In that instance, we would use whatever price is in effect in that country. For example, Hess has recently applied the $40/tonne shadow price of carbon when evaluating the Stampede project in the Gulf of Mexico in 2013 and the North Malay Basin project in Malaysia in 2016. The resulting outcome of applying this $40/tonne shadow price for carbon did not substantially impact the
275

Hess
Net Present Value of these projects and both were sanctioned.” (Hess.CDP1. p. 61)
“We conduct portfolio-specific carbon asset risk scenario planning, through which we apply the IEA’s carbon prices, which range from $8 per tonne in 2025 to $140 per tonne within the planning cycle, to evaluate the potential impact on our portfolio.” (Hess.SR. p. 40)
CRITERION 3 – IS CLIMATE SCIENCE INTEGRAL TO THE GOVERNANCE AND OVERSIGHT OF THE COMPANY? INDICATOR 3A. DELINEATION OF RISKS AND RISK MANAGEMENT PROCEDURES RELATED TO CLIMATE CHANGE INDICATOR 3AI. REGULATORY RISKS Score: (2) Rationale: Hess acknowledges risk associated with current or proposed
regulations and laws relating to climate change generally, but does not identify specific laws or regulations which might impact the company.
Source(s): “Climate change initiatives may result in significant operational
changes and expenditures, reduced demand for our products and adversely affect our business. We recognize that climate change is a global environmental concern. Continuing political and social attention to the issue of climate change has resulted in both existing and pending international agreements and national, regional or local legislation and regulatory measures to limit greenhouse gas emissions. These agreements and measures may require, or could result in future legislation and regulatory measures that require, significant equipment modifications, operational changes, taxes, or purchase of emission credits to reduce emission of greenhouse gases from our operations, which may result in substantial capital expenditures and compliance, operating, maintenance and remediation costs. In addition, our production is sold to third parties
276

Hess
that produce petroleum fuels, which through normal end user consumption result in the emission of greenhouse gases. Regulatory initiatives to reduce the use of these fuels may reduce demand for crude oil and other hydrocarbons and have an adverse effect on our sales volumes, revenues and margins. The imposition and enforcement of stringent greenhouse gas emissions reduction targets could severely and adversely impact the oil and gas industry and significantly reduce the value of our business. Furthermore, increasing attention to climate change risks has resulted in increased likelihood of governmental investigations and private litigation, which could increase our costs or otherwise adversely affect our business.” (Hess.10K. p. 15)
“Compliance with various existing environmental and pollution control regulations imposed by federal, state, local and foreign governments is not expected to have a material adverse effect on our financial condition or results of operations but increasingly stringent environmental regulations have resulted and will likely continue to result in higher capital expenditures and operating expenses for us and the oil and gas industry in general. We spent approximately $15 million in 2017 for environmental remediation. The level of other expenditures to comply with federal, state, local and foreign country environmental regulations is difficult to quantify as such costs are captured as mostly indistinguishable components of our capital expenditures and operating expenses.” (Hess.10K. p. 13)
“Stakeholder interest in this issue has continued in recent years, and in 2016 the U.S. EPA and the Bureau of Land Management finalized several regulations aimed at controlling fugitive methane and volatile organic compound (VOC) emissions. However, those regulations are now subject to administrative reconsideration as well as litigation challenges. Industry generally maintains that these regulations are largely unnecessary, as methane emissions have decreased at a time of growth in natural gas production and it is in industry’s best interest to monetize gas to generate additional revenue.” (Hess.SR. p. 51)
INDICATOR 3AII. PHYSICAL RISKS
277

Hess
Score: (3) Rationale: Hess acknowledges that physical climate-related risks could impact
its operations but does not detail the nature of those risks, their magnitude, or how they may impact the company in particular.
Source(s): “Hess considers the physical risks associated with climate
change – such as increased severity of storms, drought and flooding – for both new projects and existing operations through our ERM and value assurance processes. For example, meteorological and oceanographic studies undertaken for offshore developments include modeling that incorporates assumptions from the latest climate change science. Mitigations to address changing storm magnitude are incorporated into the design of our facilities, and severe weather management and business continuity plans are maintained for severe weather events such as Hurricane Harvey, a Category 4 storm that caused widespread flooding and damage to the Houston area in 2017. We also assess how climate change may impact water availability and water stress in the areas we operate using the World Resources Institute’s Aqueduct Tool.” (Hess.SR. p. 41)
“Deep-water assets, which include wells at a depth of more than 1,000 feet underwater, can, in certain circumstances, present unique challenges compared to land-based wells. In particular, because offshore wells tend to operate much deeper and under greater pressure, they present specific risks related to the containment of accidental discharges. Hess currently operates offshore production facilities in the Gulf of Mexico at the Baldpate, Tubular Bells and Stampede Fields – the latter of which achieved first oil in early 2018. These assets are subject to the U.S. federal government’s Safety and Environmental Management System regulations, which provide a systematic approach for identifying, managing and mitigating hazards.” (Hess.SR. p. 55)
INDICATOR 3AIII. MARKET AND OTHER INDIRECT RISKS AND OPPORTUNITIES Score: (3)
278
Hess
Rationale: Hess provides a detailed analysis of its energy transition risk via its
Carbon Asset Risk report (partially included in its 2018 Sustainability Report), but that report does not reference or discuss the specific market risks (e.g., technological advancements and the potential increase in the utilization of renewable energy and electric vehicles) that underlie the IEA scenarios. Hess does however, address the recent high-profile climate-related litigation in which the company is named as a co-defendant.
Source(s): “Climate change initiatives may result in significant operational
changes and expenditures, reduced demand for our products and adversely affect our business. We recognize that climate change is a global environmental concern...our production is sold to third parties that produce petroleum fuels, which through normal end user consumption result in the emission of greenhouse gases. Regulatory initiatives to reduce the use of these fuels may reduce demand for crude oil and other hydrocarbons and have an adverse effect on our sales volumes, revenues and margins. The imposition and enforcement of stringent greenhouse gas emissions reduction targets could severely and adversely impact the oil and gas industry and significantly reduce the value of our business. Furthermore, increasing attention to climate change risks has resulted in governmental investigations, and public and private litigation, which could increase our costs or otherwise adversely affect our business. For example, in 2017 certain municipalities and private associations in California, Rhode Island, and Maryland separately filed lawsuits against over 30 fossil fuel producers, including us, for alleged damages purportedly caused by climate change.” (Hess.10K. pp. 15-16)
“Transition risks are the risks associated with the rate of change in policy actions, technologies or market conditions aimed at the emission reductions, energy efficiencies, subsidies or taxes that may be needed to achieve climate-related aims. Evaluating the IEA’s GHG reduction scenarios in our carbon asset risk assessment enables us to take into account a broad range of transition risks.” (Hess.SR. p. 55)
279

Hess
“Our industry is highly competitive and many of our competitors are larger and have greater resources than we have. The petroleum industry is highly competitive and very capital intensive. We encounter competition from numerous companies in each of our activities, including acquiring rights to explore for crude oil and natural gas. To a lesser extent, we are also in competition with producers of alternative fuels or other forms of energy, including wind, solar and electric power, and in the future could face increasing competition due to the development and adoption of new technologies. Many competitors, including national oil companies, are larger and have substantially greater resources. Increased competition for worldwide oil and gas assets could significantly increase the cost of acquiring oil and gas assets. In addition, competition for drilling services, technical expertise and equipment may affect the availability of technical personnel and drilling rigs, resulting in increased capital and operating costs.” (Hess.10K. p. 16)
INDICATOR 3B. DELEGATION OF BOARD MEMBERS AND/OR COMMITTEES WITH EXPLICIT OVERSIGHT OF CLIMATE CHANGE POLICY Score: (1) Rationale: Hess’ Environment, Health and Safety (EHS) Subcommittee of the
Board’s Audit Committee allegedly maintains oversight of climate change-related corporate governance, but that committee’s charter does not reference such oversight.
Source(s): “Our Board of Directors is climate change literate and actively
engaged in overseeing Hess’ sustainability practices, working alongside senior management. The Environment, Health and Safety (EHS) Subcommittee of the Board’s Audit Committee provides oversight and makes recommendations to the full Board of Directors with respect to Hess’ policies, positions and systems for environment, health, safety, social responsibility, compliance and risk management. To ensure potential risks are considered in the development of company strategies and policies, we bring in subject matter experts to brief our Board on current and developing sustainability issues, including climate change.” (Hess.AR. p. 9)
280

Hess
“Our Vice President of EHS also met regularly with the EHS Subcommittee in 2018, and will meet with the EHS Committee moving forward, to provide progress updates on climate change-related issues and strategic initiatives, to review external drivers for strategy and reporting and to prioritize ongoing and future actions.” (Hess.SR. p. 11)
“In June 2019 the EHS Subcommittee was elevated to a fourth standalone committee of the Board of Directors, underpinning our commitment to evaluate sustainability risks at the highest level.” (Hess.SR. p. 11)
“The purpose of the Committee [EHS Committee] is to assist the Board with respect to (i) identifying, evaluating and monitoring EHS risks that could affect the Company’s business activities, performance and reputation, and (ii) developing recommendations to the Board for the formulation and adoption of policies, programs and practices to address such issues and risks.” (Hess.CCC1, p. 1)
INDICATOR 3C. DOES THE COMPANY SUPPORT CLIMATE-RELATED SHAREHOLDER RESOLUTIONS? Score: (1) Rationale: Hess blocked a shareholder resolution submitted by As You Sow
during the 2019 proxy season proposing the company report on how it can reduce its carbon footprint in alignment with the Paris Climate Agreement’s temperature goals.
Source(s): (see Hess.TPS1; see also Ceres – Climate and Sustainability
Shareholder Resolutions Database; SEC – Division of Corporate Finance 2019)
CRITERION 4 – WHAT ARE THE COMPANY’S AFFILIATIONS WITH THIRD PARTIES THAT SPREAD DISINFORMATION ON CLIMATE SCIENCE? INDICATOR 4A. THE AMERICAN LEGISLATIVE EXCHANGE COUNCIL (ALEC)
281

Hess
Score: (3) Rationale: Hess is not cited by Source Watch or DeSmogBlog as having ever
been affiliated with the association. Source(s): (see Source Watch - ALEC; DeSmogBlog – ALEC) INDICATOR 4B. THE AMERICAN PETROLEUM INSTITUTE (API) Score: (1) Rationale: Hess is listed as a member of API on the association website and
company’s CEO, John Hess, serves on API’s Executive Committee. Source(s): “John B. Hess is Chief Executive Officer of Hess Corporation.
Mr. Hess led the Fortune 500 company through a strategic transformation from an integrated oil company into a pure play E&P company. Mr. Hess recently served on the Secretary of Energy Advisory Board Quadrennial Review Task Force. He is a member of the Board of Directors of KKR & Company and the Board of Trustees at the Center for Strategic and International Studies. He is also a member of The Business Council, the Trilateral Commission and the Council on Foreign Relations, and serves on the Executive Committee of the American Petroleum Institute.” (Hess.CWS1; see also API – Members; DeSmogBlog – API)
INDICATOR 4C. THE NATIONAL ASSOCIATION OF MANUFACTURERS (NAM) Score: (3) Rationale: Hess is not listed on NAM’s website as a current member of the
association’s executive committee, and the company is not mentioned by DeSmogBlog as having ever been affiliated with association.
Source(s): (see NAM – Board of Directors; DeSmogBlog – NAM)
282

Hess
INDICATOR 4D. THE WESTERN STATES PETROLEUM ASSOCIATION (WSPA) Score: N/A Rationale: Hess is based in New York and has no existing operations in the
association’s jurisdiction. Source(s): (see WSPA – Member Companies; DeSmogBlog – WSPA)
INDICATOR 4E. AMERICAN FUEL AND PETROCHEMICAL MANUFACTURERS (AFPM) Score: (3) Rationale: Hess is not listed as a current member on AFPM’s website, and the
company is not mentioned by DeSmogBlog as having ever been affiliated with association.
Source(s): (see AFPM – Membership Directory; DeSmogBlog – AFPM) CRITERION 5 – DOES THE COMPANY PUBLICLY SUPPORT THE NEED FOR CLIMATE POLICY AND REGULATIONS? INDICATOR 5A. REGULATIONS, CARBON TAX, EMISSIONS TRADING, RENEWABLE ENERGY, CCS, ETC. Score: (2) Rationale: Hess has not publicly expressed support for climate-related public
policy on its public platforms (e.g., company website, Form 10-K, annual report, sustainability report).
Source(s): INDICATOR 5B. PARIS AGREEMENT Score: (2)
283

Hess
Rationale: Hess’ sustainability report and other public platforms consistently
support the “aims” of the Paris Climate Agreement but do not explicitly endorse the Agreement’s temperature targets and are silent on the need for policies and/or regulations to advance the Agreement.
Source(s): “Hess is committed to developing oil and gas resources in an
environmentally responsible and sustainable way. Our business planning includes actions we will undertake to continue reducing our carbon footprint in keeping with the findings of the U.N. Intergovernmental Panel on Climate Change and the aim of the Paris Agreement to limit global average temperature rise to well below 2°C.” (Hess.SR. p. 2)
“Hess supports the aim of the Paris Agreement to limit global average temperature rise to well below 2°C.” (Hess.SR. p. 39)
“While the Intergovernmental Panel on Climate Change (IPCC) published a report in October 2018 that suggests that net emissions of carbon dioxide must fall 45 percent by 2030 and reach “net zero” by 2050 to limit global temperature rise to below 1.5°C, the IEA has yet to develop energy demand scenarios that reflect the IPCC’s assumption. Additionally, there are no known regulatory proposals for achieving the IPCC’s suggestion.” (Hess.SR. p. 42)
CRITERION 6 – HAS THE COMPANY BEEN PUBLICLY TRANSPARENT ABOUT ITS POSITION, ACTIONS, AND AFFILIATIONS WITH REGARD TO CLIMATE SCIENCE AND CLIMATE CHANGE? INDICATOR 6A. WEBPAGE DEDICATED TO CLIMATE CHANGE Score: (5) Rationale: Hess maintains a separate webpage on its website devoted to
climate change. Source(s): (see Hess.CWS2)
284

Hess
INDICATOR 6B. STAND-ALONE SUSTAINABILITY REPORT WITH SPECIFIC REFERENCE TO CLIMATE CHANGE Score: (5) Rationale: Hess' sustainability report is easily accessible through its website
and contains a section dedicated to climate change. Source(s): (Hess.SR. p. 39) INDICATOR 6C. DISCLOSURE TO CDP Score: (5) Rationale: CDP website indicates “Submitted” from Hess for Climate Change
2018. Source(s): (Hess.CDP2) INDICATOR 6D. DISCLOSURE OF THIRD-PARTY RELATIONSHIPS AND LOBBYING ACTIVITIES Score: (3) Rationale: Hess’ Sustainability Report includes a list of the company’s
memberships and associations that received more than $50,000 from Hess in 2018.
Source(s): “A list of memberships and associations that received more
than $50,000 from Hess in 2018 can be found on page 63. We recognize that our positions do not always align with all formal positions of the associations, organizations and collaborative working groups in which we participate. Our funding should not be considered a direct endorsement of the entire range of activities undertaken by these associations, organizations or collaborative working groups. To address concerns related to potential misalignment, we publish our positions on key sustainability issues in this annual report.” (Hess.SR. p. 16; see also Hess.SR. p. 63)
INDICATOR 6E. REPORT ON CLIMATE RELATED RISK SCENARIOS
285

Hess
Score: (5) Rationale: Hess produced and published a “Climate Change Assessment
Report” which offers an analysis of what a 2°C or lower increase in global temperature would mean for its businesses, strategies, and financial planning.
Source(s): “Hess has chosen to model the three main scenarios detailed in the
International Energy Agency (IEA) 2018 World Energy Outlook (WEO) against our own base case, which is explained later in this section. Furthermore, the TCFD recommends that organizations use a 2°C or lower scenario to test portfolio resilience – in other words, a scenario under which global warming is kept to within 2°C of preindustrial levels. Such scenarios usually feature reductions in demand for oil, natural gas and coal; growth in clean technologies; and a reshaping of trade flows, among other assumptions. The Sustainable Development scenario in the IEA’s 2018 WEO (discussed further below), which is part of Hess’s modeling, fits within this recommendation.” (Hess.CO2R. p. 1)
“...there is a wide divergence in oil, natural gas and carbon prices between the two IEA scenarios [IEA’s New Policies and Sustainable Development scenarios]. For Hess, oil and natural gas prices (and the underlying demand that drives them) are likely to be the most immediate concern, while the impact of carbon pricing is also relevant.” (Hess.CO2R. p. 3)
“We have tested the robustness of Hess’ asset portfolio and intended forward investments under multiple scenarios, including the IEA’s Sustainable Development scenario. We note that the latter is fully aligned with the Paris Agreement’s aim of holding the increase in the global average temperature to well below 2°C. At the oil, natural gas and carbon prices established in our base case, the Hess portfolio remains resilient, and our pipeline of forward intended investments provides strong financial returns even under the Sustainable Development scenario, the IEA’s most challenging scenario in terms of GHG emission reductions.” (Hess.CO2R. p. 4)
286

Imperial Oil
XVIII. Imperial Oil CRITERION 1 – WHAT IS THE COMPANY’S POSITION ON CLIMATE SCIENCE? INDICATOR 1A. CONSISTENTLY ACCURATE PUBLIC STATEMENTS ON CLIMATE SCIENCE AND THE CONSEQUENT NEED FOR SWIFT AND DEEP REDUCTIONS IN EMISSIONS FROM THE BURNING OF FOSSIL FUELS Score: (2) Rationale: Imperial’s disclosures do not address climate science and the
company has downplayed the need to reduce GHG emissions (e.g., urging "practical solutions” to reduce the risks of climate change).
Source(s): “Imperial has the same concerns as people everywhere – to provide
the world with needed energy while reducing GHG emissions. Imperial is committed to taking action on climate change and believes that the long-term objective of a climate change policy should be to reduce the risk of serious impacts to humanity and to ecosystems at minimum societal cost, while recognizing the importance of safe, reliable, affordable and abundant energy for global economic development.” (Imperial.CO2R, p. 15)
“As policymakers develop mechanisms to meet the goals set in Paris, we encourage them to focus on reducing the greatest amount of emissions at the lowest cost to society. At the same time we urge them to recognize important shared humanitarian needs, including providing reliable and affordable energy to improve living standards. Ensuring Imperial does its part to reduce the risks of climate change is a priority and we are working hard across our businesses to find effective solutions.” (Imperial.SR, p. 4)
“As people and nations look for ways to reduce risks of global climate change, they will continue to need practical solutions that do not jeopardize the affordability or reliability of the energy they need.” (Imperial.10K, p. 40)
287

Imperial Oil
CRITERION 2 – WHAT MEASURES IS THE COMPANY TAKING TO REDUCE ITS CARBON FOOTPRINT? INDICATOR 2A. GHG EMISSIONS TARGETS Score: (2) Rationale: Imperial’s GHG reduction plan targets a reduction in total emissions
intensity rather than total emissions, and is thus not science-based nor in service of a specific temperature goal or target. Further, the plan does not apply to Imperial’s refining operations, only its oil sands operations, and is thus not company-wide.
Source(s): “The application of next-generation oil recovery technology at
Imperial’s Cold Lake in-situ operations, improvements in reliability at our Kearl mining facility and continuous improvements in energy efficiency are expected to be key drivers behind the reductions, which are anticipated to result in a 10 percent decrease in greenhouse gas emissions intensity by 2023, compared with 2016 levels.” (Imperial.SR, p. 5)
“At Imperial, we strive to protect tomorrow, today. To that end, we recently announced an anticipated 10 percent decrease in greenhouse gas emissions intensity at our oil sands operations by 2023, compared with 2016 levels. We intend to achieve this target through the application of next- generation oil recovery technology at our Cold Lake in-situ operations, improvements in reliability at our Kearl mining facility and continuous improvements in energy efficiency.” (Imperial.SR, p. 2)
INDICATOR 2B. GHG EMISSIONS REDUCTIONS Score: (1) Rationale: Company’s GHG emissions intensity has increased in each of the
last two reporting years. Source(s): [see Supplemental Data] INDICATOR 2C. R&D INTO LOW-CARBON TECHNOLOGIES
288

Imperial Oil
Score: (2) Rationale: Imperial has disclosed its cumulative financial commitment to a
research initiative to reduce the climate change-related impacts of oil sands development, and repeatedly highlights the company’s “access” to ExxonMobil’s substantial R&D spending, but generally offers few details about its low-carbon activities. Moreover, Imperial does not disclose a budget for R&D into low-carbon technologies.
Source(s): “Over the last 20 years, we have spent more than $2.1 billion in
research and technology development. We continue to invest more than $150 million on research annually...” (Imperial.SR, p. 3)
“Imperial’s future technology plans are supported by a nearly 100-year commitment to research in Canada and more than $2.1 billion investment over the past 20 years.” (Imperial.CO2R, p. 11) “Through our relationship with ExxonMobil [ExxonMobil owns approximately 69.6 percent of the outstanding shares of Imperial Oil Limited], we have access to global R&D spending of ~$1 billion per year and access to industry-leading insights and experts at all times. ExxonMobil is at the forefront of developing many exciting technologies, including research on advanced biofuels and carbon capture and storage (CCS), which can play big roles in a lower- carbon future.” (Imperial.SR, p. 11)
“Imperial could leverage ExxonMobil’s research on advanced biofuels, as well as carbon capture and storage (CCS). ExxonMobil is at the forefront of developing these exciting technologies, many of which could play a significant role in a lower-carbon future.” (Imperial.CO2R, p. 14)
“Imperial is expanding the use of liquid addition to steam for enhancing recovery (LASER) at Cold Lake and, following a successful $100 million multi-year pilot, is evaluating the first commercial application of cyclic solvent process (CSP) technology.” (Imperial.CO2R, p. 11)
289

Imperial Oil
“In addition to our in-house research, we partner with academic institutions, industry peers and third-party companies to accelerate the pace of environmental performance improvement in Canada. Imperial is a charter member of Canada’s Oil Sands Innovation Alliance (COSIA). COSIA member companies have shared 981 distinct technologies and innovations that cost more than $1.4 billion to develop.” (Imperial.SR, p. 10)
“Institute for Oil Sands Innovation: we are the founding sponsor of IOSI at the University of Alberta. Through the institute, university experts are conducting groundbreaking research to address a variety of environmental challenges associated with oil sands development, including climate change. To date, we have contributed $24M in funding to this institute.” (Imperial.FPS.CWS1)
“In 2017, Imperial contributed $500,000 to 20 projects at 10 Canadian universities, including funding for energy efficiency technologies.” (Imperial.CO2R, p. 12)
INDICATOR 2D. USE OF AN INTERNAL PRICE ON CARBON Score: (2) Rationale: Imperial acknowledges using carbon pricing in its investment
decisions, and notes that the company is already subject to Canadian federal and provincial carbon pricing regulations, but does not disclose the price on carbon it currently employs.
Source(s): “Nationally determined contributions (NDC’s) provide important
signals on government expectations related to the general direction and pace of likely policy initiatives to address climate risk. The Canadian Federal government has signed on to the Paris Agreement and is implementing an action plan to achieve Canada’s international commitments under the Pan Canadian Framework effective January 1, 2019. Canadian federal and provincial governments will define the price on carbon into future years. Imperial’s significant investments include and consider these inputs.” (Imperial.CO2R, p. 23)
290

Imperial Oil
“Imperial is very disciplined when evaluating projects under various economic conditions. Where appropriate, the company applies sensitivities to evaluate projects for robustness over their intended life time. This is consistent with the objective of building long-term value for Imperial’s shareholders and stakeholders. The company tests its capital investments against many uncertainties, which may include but are not limited to, technology, cost, geopolitics, material services, labour availability, infrastructure and logistics, regulatory, and environment including carbon pricing.” (Imperial.CO2R, p. 23)
CRITERION 3 – IS CLIMATE SCIENCE INTEGRAL TO THE GOVERNANCE AND OVERSIGHT OF THE COMPANY? INDICATOR 3A. DELINEATION OF RISKS AND RISK MANAGEMENT PROCEDURES RELATED TO CLIMATE CHANGE INDICATOR 3AI. REGULATORY RISKS Score: (2) Rationale: Imperial notes the general existence of risk associated with current
or proposed regulations and laws relating to climate change, but does not pinpoint specific laws or regulations and does not identify effects particular to the company.
Source(s): “Due to concern over the risks of climate change, a number of
provinces and the Government of Canada have adopted, or are considering the adoption of, regulatory frameworks to reduce greenhouse gas emissions. These include adoption of carbon emissions pricing, cap and trade regimes, carbon taxes, emissions limits, increased efficiency standards, low carbon fuel standards and incentives or mandates for renewable energy. Such policies could make Imperial’s products more expensive and less competitive, reduce or delay available business opportunities, reduce demand for hydrocarbons, and shift hydrocarbon demand toward lower greenhouse gas emission energy sources. Current and pending greenhouse gas regulations or policies may also increase compliance and abatement costs, lengthen project evaluation and
291

Imperial Oil
implementation times, impact reserves evaluations and affect operations. Increased costs may not be recoverable in the market place and could reduce the global competitiveness of the company's crude oil, natural gas and refined products.” (Imperial.10K, p. 21)
“International accords and underlying regional and national regulations covering greenhouse gas emissions continue to evolve with uncertain timing and outcome, making it difficult to predict their business impact. Imperial’s estimates of potential costs related to greenhouse gas emissions align with applicable provincial and federal regulations. Additionally, Imperial uses ExxonMobil’s Outlook for Energy as a foundation for estimating energy supply and demand requirements from various energy sources and uses, and the Outlook for Energy takes into account policies established to reduce energy related greenhouse gas emissions. The climate accord reached at the Conference of the Parties (COP 21) in Paris set many new goals, and many related policies are still emerging. The Outlook for Energy reflects an environment with increasingly stringent climate policies and is consistent with the aggregation of Nationally Determined Contributions which were submitted by signatories to the United Nations Framework Convention on Climate Change (UNFCCC) 2015 Paris Agreement. The Outlook for Energy seeks to identify potential impacts of climate related policies, which often target specific sectors. It estimates potential impacts of these climate related policies on consumer energy demand by using various assumptions and tools – including, depending on the sector, application of a proxy cost of carbon or assessment of targeted policies (i.e., automotive fuel economy standards). As people and nations look for ways to reduce risks of global climate change, they will continue to need practical solutions that do not jeopardize the affordability or reliability of the energy they need.” (Imperial.10K, p. 40)
“In 2018, Imperial’s margins strengthened, benefitting from widening crude differentials and strong product prices. As described in more detail in Item 1A. “Risk factors”, proposed carbon policy and other climate related regulations, as well as continued biofuels mandates, could have negative impacts on the downstream
292

Imperial Oil
business. Imperial’s integration across the value chain, from refining to marketing, enhances overall value across the fuels business.” (Imperial.10K, p. 41)
INDICATOR 3AII. PHYSICAL RISKS Score: (2) Rationale: Imperial’s disclosures relating to physical risks facing its operations
do not include a discussion of climate change as a contributor to those risks.
Source(s): “Imperial conducts risk assessments for ongoing operations,
projects, products etc., to identify and address potential hazards. Assessed risks are prioritized and managed as appropriate to the nature and magnitude of the risk. Decisions are clearly documented and followed up. Risks include, but are not limited to, supply and demand interruptions, extreme weather, government and political factors, and risks associated with exploration and development, operations, and cybersecurity.” (Imperial.CO2R, p. 22)
“Imperial has operated many facilities in Canada, over many decades, under adverse weather conditions...The company carefully considers the potential for physical and environmental risks in the design, construction, and operation of facilities. Internal design practices utilize available environmental data on infrequent, extreme events (such as forest fires or flooding) to improve facility design. Temperature extremes, especially cold, can be challenging to all Canadian operations. In addition to design considerations, Imperial has procedures to ensure the safety of both personnel and equipment while operating under extreme ambient conditions.” (Imperial.CO2R, p. 24)
INDICATOR 3AIII. MARKET AND OTHER INDIRECT RISKS AND OPPORTUNITIES Score: (2)
293
Imperial Oil
Rationale: Imperial's disclosures note the evolving societal demand for energy, but do not meaningfully address market or other indirect risks related to climate change that might specifically impact the company.
Source(s): “Integration and diversification: adapting to shifts in product demand
- As society’s choices for lower carbon energy sources and technologies evolve, Imperial recognizes that demand for some products it produces may shift or decrease over time. The company continuously strives to strengthen its competitiveness and adapts its business model to customers’ needs...Highly integrated upstream, downstream and chemicals business...Cost-advantaged feedstocks for refineries & chemical plant...Sustained petroleum products growth...Balance sheet strength and optionality.” (Imperial.CO2R, p. 15)
“Demand related factors which could impact Imperial’s results include economic conditions, where periods of low or negative economic growth will typically have an adverse impact on results; technological improvements in energy efficiency; seasonal weather patterns, which affect the demand for our products, including lower demand for gasoline, impacting Downstream results in the winter; increased competitiveness of alternative energy sources; new product quality regulations; technological changes or consumer preferences that affect the market for petroleum products, such as technological advances in energy storage that make wind and solar more competitive for power generation or increased consumer demand for alternative fueled or electric vehicles; and broad-based changes in personal income levels.” (Imperial.10K, p. 19)
“Imperial’s major operating sites are located outside of water-short areas, include mitigation for low water availability, and have systems in place to focus on conservation, efficiency and productivity opportunities. These aspects manage Imperial’s exposure to current and future water risks.” (Imperial.SR, p. 8)
INDICATOR 3B. DELEGATION OF BOARD MEMBERS AND/OR COMMITTEES WITH EXPLICIT OVERSIGHT OF CLIMATE CHANGE POLICY Score: (1)
294
Imperial Oil
Rationale: Imperial maintains a board-level committee (i.e, Public Policy and
Corporate Responsibility Committee) allegedly responsible for assessment of carbon risk, but that committee’s charter only references oversight of the "long term impacts of public policy on corporate performance.”
Source(s): “Imperial’s Board of Directors is responsible for identifying
principal risks, including climate- related risks and for overseeing implementation of appropriate systems to manage such risks.” (Imperial.CO2R, p. 20)
“Our Board of Directors is responsible for the stewardship of the company and routinely reviews sustainability issues through participation on various committees.” (Imperial.SR, p. 21)
“The Public Policy and Corporate Responsibility Committee (PP&CRC) assists the Board by providing oversight on environmental, health and safety performance along with legislative compliance and the assessment of potential long-term impacts of public policy on corporate performance, including climate change risk. Risk management occurs at multiple levels of the business as part of Imperial’s risk management process. The Management Committee, which includes the chairman of the Board and chief executive officer ensure all risks, including climate risks, are addressed throughout the company. The company provides an annual report to the PP&CRC on environmental performance including GHG emissions.” (Imperial.CO2R, p. 20)
“The primary purpose of the public policy and corporate responsibility committee (the 'committee') is to review and provide advice, as the committee deems appropriate, regarding the corporation's policies, programs and practices on public issues of significance including their effects on safety, health and the environment. This includes environmental, health and safety performance, along with compliance with legislation, and the assessment of long term impacts of public policy on corporate performance.” (Imperial.10K, p. 169)
295

Imperial Oil
INDICATOR 3C. DOES THE COMPANY SUPPORT CLIMATE-RELATED SHAREHOLDER RESOLUTIONS? Score: (2) Rationale: Imperial recommended against a shareholder resolution put forward
by Fonds de Solidarité des Travailleurs du Québec (FTQ) during the 2018 proxy season asking the company to report on water-related risks and opportunities resulting from, in part, a “changing climate.”
Source(s): “The following shareholder proposal was submitted by Fonds de
Solidarité des Travailleurs du Québec (FTQ) for consideration at the annual meeting of shareholders...Managing and reporting on water-related risks and opportunities helps companies compete in a business environment characterized by finite natural resources, a changing climate, regulatory development and heightened public expectations of corporation behavior...The company currently provides very limited information to investors describing the company’s water risks and water risk management... RESOLVED: That Imperial Oil Limited (“Imperial”) respond to the CDP Water information request in 2018 or issue a standalone report to shareholders (at a reasonable cost and omitting proprietary information) detailing the company’s assessment of its water related-risks and its mitigation plan related to those risks...The Board recommends voting AGAINST this proposal for the following reasons...Imperial believes its management and disclosure with respect to water resources and risk provides the necessary transparency.” (Imperial.PRXY1 p. 87; see also Ceres – Climate and Sustainability Shareholder Resolutions Database; SEC – Division of Corporate Finance 2019; SEC – Division of Corporate Finance 2018)
CRITERION 4 – WHAT ARE THE COMPANY’S AFFILIATIONS WITH THIRD PARTIES THAT SPREAD DISINFORMATION ON CLIMATE SCIENCE? INDICATOR 4A. THE AMERICAN LEGISLATIVE EXCHANGE COUNCIL (ALEC) Score: (3)
296

Imperial Oil
Rationale: Imperial is based in Canada and has no existing operations in the
association’s jurisdiction, and further is not cited by InfluenceMap, Source Watch, or DeSmogBlog as having ever been affiliated with association. Note that ExxonMobil, the majority owner of Imperial, left ALEC in July 2018 for undisclosed reasons.
Source(s): (see Source Watch - ALEC; DeSmogBlog – ALEC) INDICATOR 4B. THE AMERICAN PETROLEUM INSTITUTE (API) Score: (3) Rationale: Imperial is based in Canada and is neither in API’s current
membership list nor noted by DeSmogBlog as having ever been affiliated with association. Note that ExxonMobil, the majority owner of Imperial, is a current member of API and has not concretely distanced itself from API’s climate change deception. Further, ExxonMobil CEO Darren Woods is currently the Chairman of API.
Source(s): (see API – Members; DeSmogBlog – API) INDICATOR 4C. THE NATIONAL ASSOCIATION OF MANUFACTURERS (NAM) Score: (3) Rationale: Imperial is based in Canada and is neither on NAM’s current BOD
list nor noted by DeSmogBlog as having ever been affiliated with association. Note that ExxonMobil, the majority owner of Imperial, is a current member of NAM and has not concretely distanced itself from NAM’s climate change deception. Further, ExxonMobil Senior Vice President Neil Chapman is a member of NAM’s Executive Committee.
Source(s): (see NAM – Board of Directors; DeSmogBlog – NAM) INDICATOR 4D. THE WESTERN STATES PETROLEUM ASSOCIATION (WSPA)
297

Imperial Oil
Score: N/A Rationale: Imperial is based in Canada and has no operations in the
association’s jurisdiction. Further, the company is neither mentioned by DeSmogBlog as having ever been affiliated with the association nor listed as a corporate member on WSPA’s website. Note that ExxonMobil, the majority owner of Imperial, is a current member of WSPA and has not concretely distanced itself from WSPA’s climate change deception.
Source(s): (see WSPA – Member Companies; DeSmogBlog – WSPA)
INDICATOR 4E. AMERICAN FUEL AND PETROCHEMICAL MANUFACTURERS (AFPM) Score: (3) Rationale: Imperial is based in Canada and is neither in AFPM’s current
membership list nor noted by DeSmogBlog as having ever been affiliated with association. Note that ExxonMobil, the majority owner of Imperial, is a current member of AFPM and has not concretely distanced itself from AFPM’s climate change deception. Further, ExxonMobil Senior Vice President of Global Operations Dave Brownell is a member of AFPM’s executive committee.
Source(s): (see AFPM – Membership Directory; DeSmogBlog – AFPM) CRITERION 5 – DOES THE COMPANY PUBLICLY SUPPORT THE NEED FOR CLIMATE POLICY AND REGULATIONS? INDICATOR 5A. REGULATIONS, CARBON TAX, EMISSIONS TRADING, RENEWABLE ENERGY, CCS, ETC. Score: (2) Rationale: Imperial supports carbon pricing generally but has at the same time
actively opposed specific climate policy proposals (e.g., criticism of an unamended version of Bill C-69) in its relevant jurisdictions during the reporting period.
298

Imperial Oil
Source(s): “Imperial supports an economy-wide price on carbon dioxide
emissions as an efficient policy mechanism to address GHG emissions.” (Imperial.CO2R, p. 15)
“We support the Paris Agreement and advocate for carbon policies that ensure a uniform and predictable cost of carbon across the economy.” (Imperial.CO2R, p. 1)
“We support the objective of a rigorous, comprehensive environmental assessment process to ensure Canada’s resources are developed responsibly. We believe that the process should hold industry accountable to high standards while being clear in its requirements, and predictable in its outcomes. Unfortunately, as currently written, Bill C-69 does not achieve these objectives. Amendments by the Senate to Bill C-69 have been characterized as industry-friendly -- that simply is not true. These amendments were adopted following nationwide input and extensive consultation, thoughtful negotiation and compromise on the part of industry. It’s time to be clear and candid with Canadians that there needs to be a balance between environmental protection and economic opportunity. Bill C-69 simply does not achieve that balance. This bill, in its current form, is unworkable from a major investor perspective, and continues to perpetuate a climate of regulatory risk and uncertainty. When I speak with our investors, domestic and abroad, they tell me Canada’s regulatory uncertainty has a negative effect on how they view political and regulatory risk. Many increasingly say they no longer view Canada as an attractive place to invest. This ultimately impacts not only investment in our economy, but also people’s jobs and personal growth opportunities. This sad state is one of the reasons Imperial decided to slow down our $2.6B investment in the Aspen oil sands project earlier this year. Should Bill C-69 become law in its current form, we will unfortunately need to deeply consider any and all future investment growth opportunities.” (Imperial.TPS1)
“Climate change is a global issue that requires the collaboration of governments, companies, consumers and other stakeholders to create worldwide solutions. We engage a variety of stakeholders on climate change issues to advocate for responsible policies
299

Imperial Oil
that would be effective in addressing the risks of climate change.” (Imperial.SR, p. 6)
INDICATOR 5B. PARIS AGREEMENT Score: (2) Rationale: Imperial has made only general statements of support for the goals
of the Paris Agreement. Source(s): “Imperial supports the work of the Paris signatories,
acknowledges the ambitious goals of this agreement and believes the company has a constructive role to play in developing solutions.” (Imperial.SR, p. 4)
“While the current NDCs do not appear to achieve a 2°C scenario, the Paris Agreement is a positive step in addressing the risks of climate change.” (Imperial.CO2R, p. 6)
“Because there are multiple potential options for energy efficiency and decarbonization, there are also numerous theoretical paths to a 2°C outcome. Given limited global resources and the wide range of global societal priorities, such as poverty, education, health, security, affordable energy, and climate change, approaches to address these issues will need to be as economically efficient as possible. Inefficient approaches to address the risks of climate change can divert resources and detract from society’s ability to address other important priorities. Due to the unprecedented change that would be needed in the global energy system to achieve a 2°C outcome, Imperial believes that only those scenarios that employ the full complement of technology options are likely to provide the most economically efficient paths.” (Imperial.CO2R, p. 7)
CRITERION 6 – HAS THE COMPANY BEEN PUBLICLY TRANSPARENT ABOUT ITS POSITION, ACTIONS, AND AFFILIATIONS WITH REGARD TO CLIMATE SCIENCE AND CLIMATE CHANGE? INDICATOR 6A. WEBPAGE DEDICATED TO CLIMATE CHANGE
300

Imperial Oil
Score: (5) Rationale: Imperial maintains a separate webpage on its website devoted to
climate change. Source(s): (Imperial.FPS.CWS2) INDICATOR 6B. STAND-ALONE SUSTAINABILITY REPORT WITH SPECIFIC REFERENCE TO CLIMATE CHANGE Score: (5) Rationale: Imperial’s sustainability report is easily accessible through its
website and contains a section dedicated to climate change. Source(s): (see Imperial.SR, p. 4) INDICATOR 6C. DISCLOSURE TO CDP Score: (1) Rationale: CDP website indicates “No response” from Imperial for Climate
Change 2018. Source(s): (see Imperial.CDP) INDICATOR 6D. DISCLOSURE OF THIRD-PARTY RELATIONSHIPS AND LOBBYING ACTIVITIES Score: (1) Rationale: Imperial does not disclose affiliations with or payments to trade
associations or lobbying groups on its website or public filings and the company urged shareholders to vote against a proposal at its 2018 Annual Meeting that called for such a disclosure.
Source(s): (see Imperial.PRXY1, p. 87) INDICATOR 6E. REPORT ON CLIMATE RELATED RISK SCENARIOS
301

Imperial Oil
Score: (5) Rationale: Imperial, in partnership with ExxonMobil, has produced and
published a 2°C scenario analysis detailing potential impacts on the company’s competitiveness due to climate change.
Source(s): “Over the coming decades, oil and natural gas will continue to play a
critical role in meeting the world’s energy demand, even considering the assessed 2°C scenarios discussed in the previous section. The following is intended to address the potential impacts to Imperial’s upstream assets through 2040 and beyond, considering the average of the assessed 2°C scenarios’ oil and natural gas growth rates (2°C scenarios average)...Based on currently anticipated production schedules, Imperial estimates that in 2040 more than half of its year-end 2018 proved reserves will have been produced. As Imperial continues to develop projects over time, it expects that annual production estimates will change...In addition to Imperial’s upstream assets, effective regulatory processes and strong social and environmental performance are key enablers for responsible development. Although Imperial’s upstream assets may be subject to more stringent climate policies in the future, it is the company’s view that these upstream assets will continue to improve in competitiveness. Operational knowledge gained over time, and a relentless focus on efficiency, cost reductions and the development and deployment of pace- setting technologies, matched to high quality resources, will help sustain the company’s strong competitive status. In consideration of the significant global investment needed to meet global oil and gas demand and the potential imbalance in 2040, (absent future investment), Imperial’s assets are clearly supported by ample demand, provided they remain globally competitive.” (Imperial.CO2R, p. 10)
302

Inpex
XIX. Inpex CRITERION 1 – WHAT IS THE COMPANY’S POSITION ON CLIMATE SCIENCE? INDICATOR 1A. CONSISTENTLY ACCURATE PUBLIC STATEMENTS ON CLIMATE SCIENCE AND THE CONSEQUENT NEED FOR SWIFT AND DEEP REDUCTIONS IN EMISSIONS FROM THE BURNING OF FOSSIL FUELS Score: (2) Rationale: Inpex discusses climate change on most company platforms, but not
through the lens of climate science, rather only global concern over the issue.
Source(s): “INPEX recognizes climate change as a critical issue as the
international community seeks to achieve the long-term goals laid out in the Paris Agreement as part of a global-scale transition to a low carbon society. INPEX complies with the national regulations of each country based on the Paris Agreement in order to evaluate and manage climate change-related risks and opportunities in an appropriate manner, and conduct its business while responding to society’s two key requirements, which are the stable provision of energy through conventional sources such as oil, natural gas and renewable energies and the reduction of greenhouse gas emissions.” (Inpex.FPS1; see also Inpex.SR, p. 37)
“While reducing our own carbon footprint in our operations, we will work to continuously increase our corporate value by conducting operations flexibly to respond to changes in the business environment between now and 2040.” (Inpex.AR, p.7)
CRITERION 2 – WHAT MEASURES IS THE COMPANY TAKING TO REDUCE ITS CARBON FOOTPRINT? INDICATOR 2A. GHG EMISSIONS TARGETS Score: (2)
303
Inpex
Rationale: Inpex’s efforts to reduce GHG emissions are not in the service of a specific temperature goal or target, in some cases only apply to the company’s operations in Japan, and largely consist of improvements to data collection, reporting and analysis.
Source(s): “We strive to enhance our governance system, business strategies,
risk & opportunity assessments and management of emissions in order to proactively contribute to a low-carbon society based on the long-term targets outlined in the Paris Agreement.” (Inpex.SR, p. 6)
“In our Health, Safety and Environmental Policy, we have declared that we will pursue every effort to reduce GHG emissions and adhere to the GHG emissions management process. To achieve the goals of this declaration, we were involved in the following programs in Fiscal 2017: (1) Compilation, analysis, and reporting of GHG emissions and (2) Construction of a statistical collection and reporting framework for methane leaks.” (Inpex.SR, p.42)
“We participate in the Japan Business Federation’s (Nippon Keidanren) Commitment to a Lower Carbon Society Plan and is implementing initiatives to prevent climate change. Through this initiative, the Japan Petroleum Development Association (JPDA) has set targets of reducing GHG emissions by 5% from the fiscal 2005 level by 2020 and by 28% from the fiscal 2013 level by 2030. The reduction rates identified as 2020 and 2030 targets far exceed the most recent target rates indicated by the Japanese government. As of fiscal 2017, JPDA GHG emissions were reduced by 8.0% compared to the fiscal 2005 level and by 19.4% compared to the fiscal 2013 level. We will cooperate with other JPDA members and undertake further GHG emissions reduction to achieve the 2020 and 2030 targets.” (Inpex.SR, p. 42)
INDICATOR 2B. GHG EMISSIONS REDUCTIONS Score: (3) Rationale: Company’s GHG emissions intensity has increased in one of the last
two reporting years but decreased as a whole over the last two reporting years.
304

Inpex
Source(s): [see Supplemental Data] INDICATOR 2C. R&D INTO LOW-CARBON TECHNOLOGIES Score: (2) Rationale: Inpex has stated a commitment to fund R&D into low-carbon
technologies, but the company’s plans (e.g., become a geothermal operator in Japan) lack detail, particularly with respect to monetary figures.
Source(s): “Research and development expenses included in general and
administrative expenses and cost of sales amounted to ¥1,984 million and ¥978 million ($9,203 thousand) for the years ended March 31, 2017 and 2018, respectively.” (Inpex.AR, p.75)
“Given the expectations of a transition to a low-carbon society in the future, we see opportunities to improve our corporate value while fulfilling our corporate social responsibilities through initiatives to develop geothermal power generation in Japan. Going forward, we will seek to become a geothermal development operator in Japan and help tackle a variety of challenges.” (Inpex.SR, p. 43)
“To realize Vision 2040, we have put in place specific targets and initiatives for the period from fiscal 2018 to fiscal 2022 under our Medium-term Business Plan 2018-2022. In concrete terms, and over the five-year period of the plan, we will allocate approximately ¥2.5 trillion from pre-exploration operating cash flows in order of priority to (1) the reduction of interest-bearing debt (2) shareholder returns and (3) investments for future growth (investments totaling ¥1.7 trillion, of which 30% will be used to fund new projects including exploration costs).” (Inpex.AR, p.12)
INDICATOR 2D. USE OF AN INTERNAL PRICE ON CARBON Score: (3) Rationale: Inpex discloses an internal price on carbon it uses when evaluating
investments in jurisdictions with an NDC framework, and describes
305

Inpex
generally how that price is employed (i.e., sensitivity analysis), but does address whether the company accounts for a price on carbon when evaluating investments in countries that have not yet developed NDCs.
Source(s): “From a risk assessment perspective, we incorporated an internal carbon price in the method used to evaluate risk when assessing economic value on the assumption that the countries in which we currently operate will adopt a carbon price policy in the future. By factoring in this internal carbon price in our assessment of economic value, we are positioning CO2 emissions as a key consideration in the investment decision-making process.” (Inpex.AR, p.13)
“We also introduced an internal carbon price in October 2017 and applied it to economic evaluation. The objective is to conduct sensitivity analysis for increasing financial risk due to introducing a carbon pricing policy (such as cap-and-trade or a carbon tax) in each country under the Paris Agreement. The internal carbon price has been set to US$35/t CO2-e (2018 real). This price will be reviewed each year.” (Inpex.AR, p.39)
“National emissions reduction policies implemented that result in a requirement to pay for emissions through purchase of credits or offsets. INPEX currently budgets for emissions costs in jurisdictions where a carbon pricing mechanism exists, using the legislative framework in place in that area. This is based on INPEX's forecast of carbon prices in those jurisdictions and the forecast of emissions exposed under the legislation. E.g., Australian operations forecast the facility emissions and compare to the safeguard baseline to provide a forecast of exposure. This risk covers the possibility that budgeted carbon costs may be insufficient (i.e., the carbon price is higher than currently forecast) or that jurisdictions that are not currently exposed to a carbon price introduce one.” (Inpex.CDP1, p.13)
CRITERION 3 – IS CLIMATE SCIENCE INTEGRAL TO THE GOVERNANCE AND OVERSIGHT OF THE COMPANY?
306

Inpex
INDICATOR 3A. DELINEATION OF RISKS AND RISK MANAGEMENT PROCEDURES RELATED TO CLIMATE CHANGE INDICATOR 3AI. REGULATORY RISKS Score: (2) Rationale: Inpex notes the general existence of risk associated with current or
proposed climate-related regulations and laws (e.g., deregulation of electricity, gas and LNG markets in Japan) but does not identify effects particular to the company.
Source(s): “There is ongoing action to address global climate change, which
includes the adoption of the Paris Agreement at the 21st Session of the Conference of the Parties to the United Nations Framework Convention on Climate Change (COP21) and the national policies that support this agreement. Against this backdrop, measures are being pursued worldwide aimed at reducing greenhouse gas (GHG) emissions that cause climate change and global warming. Pursuant to our position paper, Corporate Position on Climate Change, the INPEX Group is undertaking measures in specific areas such as corporate governance, business strategies, risk and opportunity assessments, the management of emissions, and information disclosure in order to proactively reduce GHG emissions and participate in the transition to low carbon society to achieve the long-term goals of the Paris Agreement. In the event that individual countries strengthen national climate change policies to help achieve the goals of the Paris Agreement and/or there are changes or additions to environmental laws, regulations, and standards, the INPEX Group would be required to implement additional countermeasures and, in turn, incur cost burdens that could impact the Group’s performance.” (Inpex.AR, p.86)
“With the electricity, gas and LNG markets in Japan and overseas experiencing a process of deregulation in a wide variety of ways, the need to adopt a market-centric approach is becoming all the more important in order to carry out the initiatives set out under the Company’s Vision 2040 and Medium-term Business Plan 2018-2022. This market-centric approach entails the
307

Inpex
supply of essential products at a price and time the market considers appropriate.” (Inpex.AR, p.11)
“...in the event of changes to or the strengthening of the environmental laws, regulations, and standards (including support measures for the promotion of new, renewable energies) of the countries in which we operate, it may be necessary for the Group to devise additional measures with an associated cost burden and it could affect on the financial results of the Group.” (Inpex.AR, p.86)
INDICATOR 3AII. PHYSICAL RISKS Score: (3) Rationale: Inpex has identified its Ichthys LNG Project as facing physical
climate-related risks, but the company’s analysis offers few details about the nature or magnitude of that risk.
Source(s): “Transition risks are those primarily related to the transition from the
current society to the future, low carbon society. Risks may materialize in the areas of policy and legal risk, technology risk, market risk, and reputation risk. Physical risks refer to the physical risks of climate change. Risks may include acute risks such as increased severity of extreme weather events (i.e. cyclones and floods), and chronic risks such as changes in precipitation patterns and extreme variability in weather patterns, rising mean temperature, and rising sea levels. (Inpex.FPS2, p. 22)
“Physical Risks – Long Term – Project operations impacted by increase in abnormal events relating to climate risks / Project operations are impacted by increasing average temperatures, changing precipitation patterns, and rising sea levels: Ichthys LNG Project: Impact of large tropical cyclones on the design of offshore facilities and of rising sea levels on the placement of terrestrial facilities.” (Inpex.SR, p. 40)
INDICATOR 3AIII. MARKET AND OTHER INDIRECT RISKS AND OPPORTUNITIES
308

Inpex
Score: (2) Rationale: Inpex’s discussion of its indirect risks and opportunities related to
climate change is extremely limited, and does not include an analysis of potential impacts on the company specifically.
Source(s): “A large percentage of crude oil prices and natural gas prices in
overseas businesses are determined by international market conditions. In addition, those prices fluctuate significantly in response to the influence of a variety of factors including global or local supply and demand as well as trends and conditions in the global economy and financial markets. The vast majority of these factors are beyond the control of the Company. In this regard, INPEX is not in a position to accurately predict movements in future crude oil and natural gas prices.” (Inpex.AR, p.86)
“Despite the Japanese market facing many challenges, including site restrictions, wind power generation is being promoted through fixed price purchasing scheme with conditions that are competitive by international standards. At the end of 2017, we took our first step toward developing a wind power generation business in Japan to help address local needs and challenges. We are currently building experience in this business field, and will study ways in which to contribute to Vision 2040 going forward.” (Inpex.SR, p. 44)
INDICATOR 3B. DELEGATION OF BOARD MEMBERS AND/OR COMMITTEES WITH EXPLICIT OVERSIGHT OF CLIMATE CHANGE POLICY Score: (1) Rationale: Inpex does not have a formal board committee dedicated to climate
change-related corporate governance. Source(s): “In accordance with the Company’s recognition that climate change
is a critical business issue, the Board of Directors seeks to maintain its oversight and expand the Company’s involvement. Specifically, the Corporate Position on Climate Change was resolved at the board meeting, and we published our position paper in 2015 (last revised
309

Inpex
in July 2018). This position paper will normally be reviewed each year and any revisions will require approval by the Board of Directors. Starting in 2018, the results of our assessment of risks and opportunities arising from climate change, which are determined by the Executive Committee, will be reported to the Board of Directors and will serve as a basis for reviewing the position paper... Targets relating to climate change are also set by the Executive Committee. Actions that address climate change in the form of qualitative targets are spelled out in Mid-term Business Plan 2018–2022 regarding governance, business strategies, risk and opportunity assessment, GHG emissions management, and information disclosure. We provide incentives for the executives in charge of business planning depending on the progress of initiatives to achieve these targets. In June 2018, the Climate Change Strategy Group was established within the Corporate Strategy & Planning Unit in order to promote action against climate change and create a framework for responding to this critical business issue.” (Inpex.SR, p. 39)
“The Board of Directors has delegated assessment of climate change-related risks to the Executive Committee, and the results of the Executive Committee’s assessments are reported to the Board of Directors.” (Inpex.SR, p. 17)
INDICATOR 3C. DOES THE COMPANY SUPPORT CLIMATE-RELATED SHAREHOLDER RESOLUTIONS? Score: (3) Rationale: Inpex has not faced any climate-related shareholder resolutions put
forward by established networks of socially responsible investors. Source(s): (see Ceres – Climate and Sustainability Shareholder Resolutions
Database; SEC – Division of Corporate Finance 2019; SEC – Division of Corporate Finance 2018)
CRITERION 4 – WHAT ARE THE COMPANY’S AFFILIATIONS WITH THIRD PARTIES THAT SPREAD DISINFORMATION ON CLIMATE SCIENCE?
310

Inpex
INDICATOR 4A. THE AMERICAN LEGISLATIVE EXCHANGE COUNCIL (ALEC) Score: (3) Rationale: Inpex is based in Japan and is not cited by Source Watch or
DeSmogBlog as having ever been affiliated with association. Source(s): (see Source Watch - ALEC; DeSmogBlog – ALEC) INDICATOR 4B. THE AMERICAN PETROLEUM INSTITUTE (API) Score: (3) Rationale: Inpex is based in Japan and is neither in API’s current membership
list nor noted by DeSmogBlog as having ever been affiliated with association.
Source(s): (see API – Members; DeSmogBlog – API) INDICATOR 4C. THE NATIONAL ASSOCIATION OF MANUFACTURERS (NAM) Score: (3) Rationale: Inpex is based in Japan and is neither in NAM’s current BOD list nor
noted by DeSmogBlog as having ever been affiliated with association.
Source(s): (see NAM – Board of Directors; DeSmogBlog – NAM) INDICATOR 4D. THE WESTERN STATES PETROLEUM ASSOCIATION (WSPA) Score: N/A Rationale: Inpex is based in Japan and has no operations in the association’s
jurisdiction, not mentioned by DeSmogBlog as having ever been
311

Inpex
affiliated with the association and is not listed as a corporate member on WSPA’s website.
Source(s): (see WSPA – Member Companies; DeSmogBlog – WSPA) INDICATOR 4E. AMERICAN FUEL AND PETROCHEMICAL MANUFACTURERS (AFPM) Score: (3) Rationale: Inpex is based in Japan and is neither in AFPM’s current
membership list nor noted by DeSmogBlog as having ever been affiliated with association.
Source(s): (see AFPM – Membership Directory; DeSmogBlog – AFPM) CRITERION 5 – DOES THE COMPANY PUBLICLY SUPPORT THE NEED FOR CLIMATE POLICY AND REGULATIONS? INDICATOR 5A. REGULATIONS, CARBON TAX, EMISSIONS TRADING, RENEWABLE ENERGY, CCS, ETC. Score: (2) Rationale: Inpex discloses some of the company’s country-specific private
outreach with governmental institutions, and notes its membership in trade associations which advocate for an international price on carbon, but the company itself has not identified a general category of climate policy that it supports.
Source(s): “...we comply with national regulations of each country in which we
operate, including those introduced to support the international policy framework for greenhouse gas (GHG) emissions reductions. Our businesses will work with governments and other stakeholders to address the two societal demands of meeting energy needs and reducing greenhouse gas (GHG) emissions; to achieve a balance between the two.” (Inpex.SR, p. 37)
312

Inpex
“INPEX is supportive of the aims of the Paris Agreement and the long-term goals it presents to the global economy. The objective of climate change policy should be to reduce the risk of a serious impact to society and ecosystems, while recognizing the importance of abundant, reliable and accessible energy for the world’s growing population. In order to be appropriate, policies to manage the risks of climate change should be science-based, extend globally, be market-driven, and provide businesses with a degree of medium term certainty whilst being flexible to progressive amendments as understanding of the climate change risks develops. For the oil and gas industry to play its role in reducing global GHG emissions, it is important to have a mechanism enabling companies to select economically feasible options without compromising competitiveness.” (Inpex.FPS3, p. 10)
“Australia: INPEX actively participates in the development of Federal policy frameworks through consultation processes relating to policy changes and via the Australian Petroleum Production and Exploration Association (APPEA) when appropriate...Indonesia: Participate in GHG and climate change discussions with Government of Indonesia and research institutions. Furthermore, involvement in Indonesian’s policy making on GHG through Indonesian Petroleum Association (IPA).” (Inpex.FPS3, p. 10)
“APPEA supports a national climate change policy that delivers abatement at least cost and facilitates investment outcomes consistent with there being an international price on carbon. Natural gas as a fuel, particularly in power generation, can improve emissions outcomes in Australia, while LNG exports can help reduce the growth in global greenhouse emissions. Therefore, APPEA supports removing regulatory impediments to increased use of gas. APPEA continues to work to ensure Australian petroleum industry remains internationally competitive and that any government climate change policy does not hinder the sector’s growth...INPEX is a vocal contributor to a number of working groups within APPEA that are focused on climate change issues and provide industry support in discussions with policymakers. INPEX representatives regularly provide opinion on APPEA positions, was part of the task force that
313

Inpex
developed APPEA's policy principles and continues to be involved in other technical working groups as the need arises.” (Inpex.CDP2)
INDICATOR 5B. PARIS AGREEMENT Score: (2) Rationale: Inpex has made a general statement expressing support of policies
and/or regulations to advance the Paris Agreement but not explicitly endorsed the Paris Agreement’s goal of keeping global temperature increase well below 2°C.
Source(s): “Global energy demand is expected to grow as a result of a
combination of population growth and economic improvement. Access to reliable and affordable energy is essential to the growth of strong economies, sustained improvement in quality of life and the eradication of poverty in emerging markets. To meet this demand, it is essential that there is appropriate utilization of all available energy sources including oil, natural gas, and renewable energy – within the context of reducing net emissions over time to also achieve the long-term goals of the Paris Agreement.” (Inpex.FPS3, p.4)
“INPEX is supportive of the aims of the Paris Agreement and the long-term goals it presents to the global economy. The objective of climate change policy should be to reduce the risk of a serious impact to society and ecosystems, while recognizing the importance of abundant, reliable and accessible energy for the world’s growing population.” (Inpex.FPS3, p.10)
“As energy demand is anticipated to grow, the international community will need to work proactively to reduce greenhouse gas emissions and create a low- carbon society if it is to achieve the targets in the 2015 Paris Agreement.” (Inpex.SR, p. 5)
“We strive to enhance our governance system, business strategies, risk & opportunity assessments and management of emissions in order to proactively contribute to a low-carbon society based on the long-term targets outlined in the Paris Agreement.” (Inpex.SR, p. 6; see also Inpex.FPS1)
314
Inpex
CRITERION 6 – HAS THE COMPANY BEEN PUBLICLY TRANSPARENT ABOUT ITS POSITION, ACTIONS, AND AFFILIATIONS WITH REGARD TO CLIMATE SCIENCE AND CLIMATE CHANGE? INDICATOR 6A. WEBPAGE DEDICATED TO CLIMATE CHANGE Score: (5) Rationale: Inpex maintains a separate webpage on its website devoted to
climate change. Source(s): (see Inpex.CWS1) INDICATOR 6B. STAND-ALONE SUSTAINABILITY REPORT WITH SPECIFIC REFERENCE TO CLIMATE CHANGE Score: (5) Rationale: Inpex produces a sustainability report that is easily accessible from
its website and has a section dedicated to climate change. Source(s): (see Inpex.SR, p. 37) INDICATOR 6C. DISCLOSURE TO CDP Score: (5) Rationale: CDP website indicates “Submitted” from Inpex for Climate Change
2018. Source(s): (see Inpex.CDP3) INDICATOR 6D. DISCLOSURE OF THIRD-PARTY RELATIONSHIPS AND LOBBYING ACTIVITIES Score: (3) Rationale: Inpex participates in various "external initiatives,” and though some
of those initiatives are in fact trade associations and lobbying groups,
315

Inpex
the company does not disclose any payments made to such groups or whether the list is inclusive.
Source(s): “In response to the needs of global society, we promote sustainability
practices and participate in both domestic and overseas initiatives, such as the United Nations Global Compact, the International Association of Oil & Gas Producers (IOGP), the Australian Petroleum Production & Exploration Association (APPEA), the Extractive Industries Transparency Initiative (EITI), IPIECA, the Japan Petroleum Development Association (JPDA), and Japan Natural Gas Association.” (Inpex.SR, p. 8; see also Inpex.CWS2)
INDICATOR 6E. REPORT ON CLIMATE RELATED RISK SCENARIOS Score: (5) Rationale: Inpex produced and published an analysis on what a 2°C or lower
increase in global temperature would mean for its businesses, strategies, and financial planning.
Source(s): “With regard to energy demand scenarios and the transition to a low-
carbon society, we have set the IEA 3 ’s New Policies Scenario as the base case scenario, and will also consider transition scenarios including a scenario of additional growth in demand for renewable energy and electric vehicles compared to the New Policies Scenario, spurred by cost reductions based on market principles, and a scenario with stronger climate change policies in various nations, based on the Paris Agreement. We assess how effectively its business strategies are able to respond to a number of scenarios including a 2°C scenario.” (Inpex.SR, p. 40)
“For this scenario entailing a further shift from the IEA New Policies Scenario to a low-carbon society (i.e., IEA’s Sustainable Development Scenario), we acknowledge the uncertain prospects for a large increase in oil prices. Under these conditions, we assume in the Medium- term Business Plan 2018-2022 that oil prices will trend within the $50 to $70/bbl range with a gradual increase to $70/bbl. During this time, our target is to reduce production costs to $5/bbl (excluding royalties) for oil
316

Inpex
and natural gas upstream businesses, and we maintain financial and corporate resilience even if the crude oil price drops to US$50/bbl. In addition, in order to promote low-carbon footprint in operations, we promote development of natural gas, enhance renewable energy initiatives, and manage emissions from operations. We also participate in Proof of Concept trials for CCS, which captures and stores CO2. In Vison 2040 we will further promote a low-carbon footprint in operations. We aim to be a key player in natural gas development and supply, mainly focusing on Asia and Oceania, as well as Japan to expand the company’s domestic gas supply chain – which our development and supply of natural gas has so far focused on, and create a global gas value chain. In the field of renewable energy, we aim for renewable energy projects to account for 10% of our project portfolio in the long term. For CCS, we will develop technologies for the practical application of CCS. Accordingly, while reducing our own carbon footprint in operations, we will work to continuously increase corporate value by maintaining the flexibility to respond to changes in the business environment between now and 2040.” (Inpex.SR, p. 41)
317

Marathon Oil
XX. Marathon Oil CRITERION 1 – WHAT IS THE COMPANY’S POSITION ON CLIMATE SCIENCE? INDICATOR 1A. CONSISTENTLY ACCURATE PUBLIC STATEMENTS ON CLIMATE SCIENCE AND THE CONSEQUENT NEED FOR SWIFT AND DEEP REDUCTIONS IN EMISSIONS FROM THE BURNING OF FOSSIL FUELS Score: (1) Rationale: Marathon’s website acknowledges global concern surrounding
climate change but does not address climate science and suggests an inherent tradeoff between meeting global energy demand and addressing climate change. Climate change generally and GHG mitigation specifically are not highlighted in the company’s public platforms, apart from mention of the former in Marathon’s annual report, but only then in the context of regulatory risk and compliance.
Source(s): “Marathon Oil recognizes the concern about the impact of
greenhouse gas (GHG) and other air emissions on global climate and air quality, and the market changes that could occur as a result of climate change regulations. At the same time, we recognize the need for reliable and affordable energy and petrochemical feedstock to fuel global economic progress, and the important role oil and natural gas are projected to play in meeting long-term global demand.” (Marathon.SR, p. 50)
CRITERION 2 – WHAT MEASURES IS THE COMPANY TAKING TO REDUCE ITS CARBON FOOTPRINT? INDICATOR 2A. GHG EMISSIONS TARGETS Score: (1) Rationale: Marathon has a self-described strategy for mitigating GHG
emissions, but that strategy amounts to practices implemented without regard to any company-wide targets or other emission reduction goals.
318

Marathon Oil
Source(s): “To manage these risks, we work to quantify and mitigate our
GHG emissions, use well-established business processes to evaluate climate change risk in our investment decisions, and engage with external stakeholders to understand their perspectives.” (Marathon.SR, p. 50)
“Marathon Oil takes action to find and develop oil and natural gas safely and responsibly, including by reducing greenhouse gas (GHG) and other air emissions from our operations. Our efforts reduce our exposure to potential changes in climate change regulations, which could increase the costs of emitting GHGs or reduce demand for oil and gas over time. We continuously evaluate and implement strategies and technologies, and annually review cost-effective methods to reduce air emissions from our operations throughout the drilling and production lifecycle. In 2017, we assisted in establishing The Environmental Partnership as a founding member. In early 2016, our Oklahoma asset set a goal to reduce methane intensity in the asset by at least 50 percent by 2020. We surpassed that goal by the end of 2017.” (Marathon.SR, p. 55)
INDICATOR 2B. GHG EMISSIONS REDUCTIONS Score: (3) Rationale: Company’s GHG emissions intensity has increased in one of the last
two reporting years but decreased as a whole over the last two reporting years.
Source(s): [see Supplemental Data] INDICATOR 2C. R&D INTO LOW-CARBON TECHNOLOGIES Score: (1) Rationale: Marathon has not publicly committed to investing in R&D into low-
carbon technologies and has not disclosed a budget for such activities.
Source(s):
319

Marathon Oil
INDICATOR 2D. USE OF AN INTERNAL PRICE ON CARBON Score: (1) Rationale: Marathon integrates a cost of carbon into expense and revenue
models for its U.K. assets as required by British regulations, and stress tests new investments using third-party commodity price forecasting, incorporating factors such as climate change-related regulatory risk and the market penetration of renewable energy, but does not include a uniform price that reflects the cost of CO2 emissions from company-wide operations.
Source(s): “Additionally, the cost of carbon is factored into expense and
revenue models for assets in the U.K., where carbon trading regulations are in place.” (Marathon.SR, p. 51)
CRITERION 3 – IS CLIMATE SCIENCE INTEGRAL TO THE GOVERNANCE AND OVERSIGHT OF THE COMPANY? INDICATOR 3A. DELINEATION OF RISKS AND RISK MANAGEMENT PROCEDURES RELATED TO CLIMATE CHANGE INDICATOR 3AI. REGULATORY RISKS Score: (2) Rationale: Marathon notes the general existence of legislative and regulatory
efforts to regulate GHG emissions but does not pinpoint specific laws or regulations, despite noting potential impacts these laws could have on the company.
Source(s): “We believe it is likely that the scientific and political attention to
issues concerning the extent, causes of and responsibility for climate change will continue, with the potential for further regulations that could affect our operations. Our operations result in greenhouse gas emissions. Currently, various legislative or regulatory measures to address greenhouse gas emissions (including carbon dioxide, methane and nitrous oxides) are in various phases of
320

Marathon Oil
review, discussion or implementation in countries where we operate, including the U.S. and the European Union. Internationally, the United Nations Framework Convention on Climate Change finalized an agreement among 195 nations at the 21st Conference of the Parties in Paris with an overarching goal of preventing global temperatures from rising more than 2 degrees Celsius. The agreement includes provisions that every country take some action to lower emissions, but there is no legal requirement for how or by what amount emissions should be lowered. The EPA has also finalized regulations targeting new sources of methane emissions from the oil and gas industry. Finalization of new legislation, regulations or international agreements in the future could result in increased costs to operate and maintain our facilities, capital expenditures to install new emission controls at our facilities, and costs to administer and manage any potential greenhouse gas emissions or carbon trading or tax programs. These costs and capital expenditures could be material. Although uncertain, these developments could increase our costs, reduce the demand for crude oil and condensate, NGLs and natural gas, and create delays in our obtaining air pollution permits for new or modified facilities.” (Marathon.10K, p. 18)
INDICATOR 3AII. PHYSICAL RISKS Score: (2) Rationale: Marathon generally notes the physical risks it faces, such as
weather, but does not include a discussion of climate change as a contributor to those risks.
Source(s): “Our United States and International operations are subject to
unplanned occurrences, including blowouts, explosions, fires, loss of well control, spills, tornadoes, hurricanes and other adverse weather, tsunamis, earthquakes, volcanic eruptions or nuclear or other disasters, labor disputes and accidents. These same risks can be applied to the third-parties which transport our products from our facilities. A prolonged disruption in the ability of any pipelines, rail cars, trucks, or vessels to transport our production could contribute to a business interruption or increase costs.” (Marathon.10K, p. 22)
321

Marathon Oil
INDICATOR 3AIII. MARKET AND OTHER INDIRECT RISKS AND OPPORTUNITIES Score: (1) Rationale: Marathon’s filings address recent high-profile climate litigation in
which it is a defendant but not its (shifting) market or other indirect risks related to climate change.
Source(s): “Government entities and other groups have filed lawsuits in several
states and other jurisdictions seeking to hold a wide variety of companies that produce fossil fuels liable for the alleged impacts of the greenhouse gas emissions attributable to those fuels. The lawsuits allege damages as a result of global warming and the plaintiffs are seeking unspecified damages and abatement under various tort theories. Marathon Oil has been named as a defendant in several of these lawsuits, along with numerous other companies. Similar lawsuits may be filed in other jurisdictions. While the ultimate outcome and impact to us cannot be predicted with certainty, we believe that the claims made against us are without merit and will not have a material adverse effect on our consolidated financial position, results of operations or cash flow.” (Marathon.10K, p. 12)
INDICATOR 3B. DELEGATION OF BOARD MEMBERS AND/OR COMMITTEES WITH EXPLICIT OVERSIGHT OF CLIMATE CHANGE POLICY Score: (1) Rationale: Marathon’s board-level Health, Environmental, Safety and Corporate
Responsibility (HES&CR) Committee maintains broad oversight of the company’s sustainability policies but, per its charter, is not tasked with climate change-related corporate governance.
Source(s): “At the board level, the Health, Environmental, Safety and
Corporate Responsibility (HES&CR) Committee identifies and monitors trends, issues, practices and concerns related to a wide range of matters. These include public policy; legislation;
322

Marathon Oil
regulations; and political, charitable and educational contributions.” (Marathon.SR, p. 24)
“The purpose of the Committee is to assist the Board with respect to (i) identifying, evaluating and monitoring health, environmental, safety, social, public policy and political trends, issues and concerns that could affect the Company’s business activities and performance, (ii) analyzing the Company’s global reputation and developing recommendations to strategically position the Company to support its business objectives, and (iii) developing recommendations to the Board for the formulation and adoption of policies, programs and practices concerning health, environmental, safety, social, public policy and political issues.” (Marathon.CCC1, p.1)
INDICATOR 3C. DOES THE COMPANY SUPPORT CLIMATE-RELATED SHAREHOLDER RESOLUTIONS? Score: (4) Rationale: Shareholders UUA and Portico Benefits agreed to withdraw their
2019 AGM resolution for Marathon to issue a climate change report in the coming year after a commitment from Marathon.
Source(s): "In the coming year, we will commit to amend" our board charter to
indicate that the Health, Environmental, Safety and Corporate Responsibility Committee "has responsibility for climate-related risks and will release a substantial expansion of our sustainability report's discussion of climate change risks by publishing a climate report which will be organized using the framework [TCFD's] four elements." (Marathon.TPS1)
(see also Ceres – Climate and Sustainability Shareholder Resolutions Database; SEC – Division of Corporate Finance 2019, SEC – Division of Corporate Finance 2018)
CRITERION 4 – WHAT ARE THE COMPANY’S AFFILIATIONS WITH THIRD PARTIES THAT SPREAD DISINFORMATION ON CLIMATE SCIENCE?
323

Marathon Oil
INDICATOR 4A. THE AMERICAN LEGISLATIVE EXCHANGE COUNCIL (ALEC) Score: (3) Rationale: Although Marathon was once a part of the ALEC’s Energy,
Environment and Agriculture Task Force in 2012, information is unavailable to determine company’s current affiliation.
Source(s): (see Source Watch - ALEC; DeSmogBlog – ALEC) INDICATOR 4B. THE AMERICAN PETROLEUM INSTITUTE (API) Score: (1) Rationale: Marathon is listed as a corporate member on API’s website and
company CEO was listed as a board member in the most recent listing as of 2016. No information suggests that this is no longer the case.
Source(s): (see API – Members; see also DeSmogBlog – API) INDICATOR 4C. THE NATIONAL ASSOCIATION OF MANUFACTURERS (NAM) Score: (1) Rationale: Marathon is listed on NAM’s website as a current member of the
Association’s Board of Directors. Source(s): (see NAM – Board of Directors; see also DeSmogBlog – NAM) INDICATOR 4D. THE WESTERN STATES PETROLEUM ASSOCIATION (WSPA) Score: N/A Rationale: Marathon is based in Texas and has no operations in the
association’s jurisdiction.
324
Marathon Oil
Source(s): (see WSPA – Member Companies; DeSmogBlog – WSPA) INDICATOR 4E. AMERICAN FUEL AND PETROCHEMICAL MANUFACTURERS (AFPM) Score: (3) Rationale: Information unavailable to determine Marathon’s affiliation with
association or group. Source(s): (see AFPM – Membership Directory; DeSmogBlog – AFPM) CRITERION 5 – DOES THE COMPANY PUBLICLY SUPPORT THE NEED FOR CLIMATE POLICY AND REGULATIONS? INDICATOR 5A. REGULATIONS, CARBON TAX, EMISSIONS TRADING, RENEWABLE ENERGY, CCS, ETC. Score: (2) Rationale: Marathon has not publicly expressed support for climate policies and
regulations during the reporting period, instead mentioning them neutrally and only in the reference of regulatory risk and compliance.
Source(s): “Through the Enterprise Risk Management process, overseen
by our board of directors, we examine regulatory changes, commodity price fluctuations and other risks that could impact the Company beyond the current planning cycle.” (Marathon.SR, p. 51)
INDICATOR 5B. PARIS AGREEMENT Score: (1) Rationale: Marathon has neither publicly expressed support for the Paris
Agreement nor policies and/or regulations to advance it.
325

Marathon Oil
Source(s): “Additional climate change laws and regulations will continue to evolve as guided by U.S. policy and global agreements such as those adopted by the 2015 United Nations Climate Change Conference.” (Marathon.SR, p. 50)
CRITERION 6 – HAS THE COMPANY BEEN PUBLICLY TRANSPARENT ABOUT ITS POSITION, ACTIONS, AND AFFILIATIONS WITH REGARD TO CLIMATE SCIENCE AND CLIMATE CHANGE? INDICATOR 6A. WEBPAGE DEDICATED TO CLIMATE CHANGE Score: (5) Rationale: Marathon maintains a separate webpage dedicated to climate
change. Source(s): (see Marathon.CWS1) INDICATOR 6B. STAND-ALONE SUSTAINABILITY REPORT WITH SPECIFIC REFERENCE TO CLIMATE CHANGE Score: (5) Rationale: Marathon produces a Corporate Sustainability Report that is easily
accessible through its website. Source(s): (see Marathon.SR, p. 50) INDICATOR 6C. DISCLOSURE TO CDP Score: (1) Rationale: CDP’s website indicates "no response” from Marathon for Climate Change 2018. Source(s): (see Marathon.CDP1)
326

Marathon Oil
INDICATOR 6D. DISCLOSURE OF THIRD-PARTY RELATIONSHIPS AND LOBBYING ACTIVITIES Score: (3) Rationale: Marathon’s discloses political and trade association payments in
excess of $35,000. Source(s): (see Marathon.FPS1) INDICATOR 6E. REPORT ON CLIMATE RELATED RISK SCENARIOS Score: (1) Rationale: Marathon has not produced and published an analysis on what a 2°C
or lower increase in global temperature would mean for its businesses, strategies, and financial planning.
Source(s):
327

Noble Energy, Inc.
XXI. Noble Energy, Inc. CRITERION 1 – WHAT IS THE COMPANY’S POSITION ON CLIMATE SCIENCE? INDICATOR 1A. CONSISTENTLY ACCURATE PUBLIC STATEMENTS ON CLIMATE SCIENCE AND THE CONSEQUENT NEED FOR SWIFT AND DEEP REDUCTIONS IN EMISSIONS FROM THE BURNING OF FOSSIL FUELS Score: (1) Rationale: Noble maintains a webpage devoted to climate change and GHG
emissions but neither that page nor the company’s public disclosures address current climate science. Further, Noble misrepresents current climate science by significantly understating the scientific consensus on climate change; the company asserts that the link between human activity and climate change is a “complex issue.”
Source(s): “Domestic and international responses to climate and related
energy issues are matters of public policy consideration. We are currently in a period of increasing uncertainty as to these matters and, at this time, it is difficult to anticipate how the current US Administration, or other entities, may act on existing or new laws and regulations. As compared with certain large multi-national, integrated energy companies, we do not conduct fundamental research regarding the scientific inquiry of climate change. However, we will continue to closely monitor all relevant developments in this regard.” (Noble.10K, p. 32)
“Within the oil and natural gas industry and its stakeholders, there is clear evidence of an increasing awareness of climate change issues.” (Noble.CDP1, p. 21)
CRITERION 2 – WHAT MEASURES IS THE COMPANY TAKING TO REDUCE ITS CARBON FOOTPRINT? INDICATOR 2A. GHG EMISSIONS TARGETS Score: (1)
328

Noble Energy, Inc.
Rationale: Noble notes progress in reducing emissions on its website and in its
sustainability report, but this progress is not pursuant to a wider plan. Moreover, according to its CDP response, Noble “...currently do[es] not utilize emission reduction targets.”
Source(s): “We are committed to complying with all applicable air quality rules
and environmental regulations. In addition, we look for economic opportunities to prevent or reduce emissions even beyond compliance...Continuous improvement in reducing emissions continues to be one of our top environmental priorities. To minimize these emissions, we employ best management practices such as instrument air pneumatic devices. We also use available direct pipeline takeaway access when possible.” (Noble.SR, p. 47)
“Noble places high importance on achieving compliance with all applicable air quality rules and regulations. We have teams that work to interpret these regulatory requirements, implement them and achieve compliance. Overall in 2017, our global direct greenhouse gas emissions decreased by four percent. During the year, we acquired Clayton Williams Energy, which had extensive holdings in Texas. Emissions from these operations have been added in our environmental database and emissions inventory. The newly acquired assets are being upgraded to comply with our standard operating practices (SOPs), which include an audit of all facilities, analysis and corrective planning and completion of all upgrades. Notably, these new operations have contributed to a 67 percent increase in our global indirect greenhouse gas emissions (a smaller measure driven primarily by higher electricity use). As a result, our total greenhouse gas emissions intensity, measured as tons of carbon dioxide equivalent per thousand barrels of oil equivalent production, rose slightly, from 13 to 14. We anticipate that our efforts - completed and ongoing - to bring the newly acquired assets up to our operating standards will bring reductions in these areas. The foregoing explanation exemplifies why it can be misleading to establish absolute emissions targets. As such, Noble continues to evaluate options for the most representative ways to target emissions. The new Climate Program will consider targeting options.” (Noble.CDP1, pp. 27-28)
329

Noble Energy, Inc.
“Please also see Section C12 for discussion on proactive measures Noble currently takes to reduce methane emissions while increasing operating efficiencies, even though we currently do not utilize emission reduction targets.” (Noble.CDP1, p. 28)
INDICATOR 2B. GHG EMISSIONS REDUCTIONS Score: (2) Rationale: Company’s GHG emissions intensity has increased in one of the last
two reporting years and increased as a whole over the last two reporting years.
Source(s): [see Supplemental Data] INDICATOR 2C. R&D INTO LOW-CARBON TECHNOLOGIES Score: (1) Rationale: Noble has not provided information regarding any low-carbon
investments in its CDP disclosure, and the company’s other disclosures do not reference R&D into low carbon technologies, much less a budget.
Source(s): (see Noble.CDP1, p. 70) INDICATOR 2D. USE OF AN INTERNAL PRICE ON CARBON Score: (1) Rationale: Noble currently does not use an internal price on carbon in
investment decisions, though the company notes in its CDP response that it anticipates doing so in the next two years.
Source(s): (see Noble.CDP1, p. 76) CRITERION 3 – IS CLIMATE SCIENCE INTEGRAL TO THE GOVERNANCE AND OVERSIGHT OF THE COMPANY?
330

Noble Energy, Inc.
INDICATOR 3A. DELINEATION OF RISKS AND RISK MANAGEMENT PROCEDURES RELATED TO CLIMATE CHANGE INDICATOR 3AI. REGULATORY RISKS Score: (2) Rationale: Noble’s Form 10-K references specific legislative and regulatory
efforts to regulate GHG emissions, particularly in Colorado (e.g., new CDPHE regulations), but does not detail effects particular to the company (i.e., as opposed to other exploration and production companies with significant operations in that state).
Source(s): “The state environmental agency, the Colorado Department of
Public Health and Environment (CDPHE), likewise has adopted measures to regulate air emissions, water protection, and waste handling and disposal relating to our crude oil and natural gas exploration and production. For air, the CDPHE has extended the EPA’s emissions standards for crude oil and natural gas operations to directly control methane. In the state of Colorado, we have historically encountered initiatives to regulate, limit or ban hydraulic fracturing or other facets of crude oil and natural gas exploration, development or operations. For example, in November 2018, a majority of Colorado voters voted against Proposition #112, which, if passed, would have significantly limited, or in some cases prevented, the future development of crude oil and natural gas and demand for our midstream services in areas where we currently conduct operations. If similar regulatory measures are adopted, we could incur additional costs to comply with any of its requirements or may experience delays and/or curtailment in the permitting or pursuit of our exploration, development, or production activities. Such compliance costs and delays, curtailments, limitations, or prohibitions could have a material adverse effect on our cash flows, results of operations, financial condition, and liquidity. It is likely these types of initiatives will continue into the future in Colorado, and efforts by the US Administration to modify federal oil and gas related regulations could intensify the risk of anti-development efforts from grass roots opposition. Some of the counties and municipalities where we operate in Colorado have adopted their own regulations or ordinances that impose
331

Noble Energy, Inc.
additional restrictions on our crude oil and natural gas exploration and production. To date these have not significantly impacted our operations.” (Noble.10K, pp. 21-22)
“We have experienced these efforts [trend toward increased anti-oil and gas development activity] in Colorado, recently and in the past, and it is likely they will continue into the future. For example, the State of Colorado General Assembly is currently developing a framework for future oil and gas development in the State. This initiative, together with increased pressure to allow local governments to control oil and gas operations within their borders, could result in new regulations that limit or ban hydraulic fracturing or other facets of crude oil and natural gas exploration or development in areas where we operate. We cannot predict the outcome of these initiatives or their impact on our operations.” (Noble.10K, p. 27)
“In recent years, the EPA has finalized a series of greenhouse gas (GHG) monitoring, reporting and emissions control rules for the oil and natural gas industry, and the US Congress has, from time to time, considered adopting legislation to reduce emissions. In addition, almost one-half of the states have already taken measures to reduce emissions of GHGs primarily through the development of GHG emission inventories and/or regional GHG cap- and-trade programs. At the international level, in December 2015, the US signed the Paris Agreement on climate change and pledged to take efforts to reduce GHG emissions and to conserve and enhance sinks and reservoirs of GHGs. The Paris Agreement entered into force in November 2016. However, in August 2017, the US notified the United Nations that it would be withdrawing from the Paris Agreement and begin negotiations to either re-enter or negotiate an entirely new agreement with more favorable terms for the US. The Paris Agreement sets forth a specific exit process, whereby a party may not provide notice of its withdrawal until three years from the effective date, with such withdrawal taking effect one year from such notice. While the US Administration expressed a clear intent to cease implementing the Paris Agreement, it is not clear how it plans to accomplish this goal, whether a new agreement can be negotiated, or what terms would be included in such an agreement. Furthermore, in response to the
332

Noble Energy, Inc.
announcement, many state and local leaders stated their intent to intensify efforts to uphold the commitments set forth in the international accord. The current state of development of the ongoing international climate initiatives and any related domestic actions make it difficult to assess the timing or effect on our operations or to predict with certainty the future costs that we may incur in order to comply with future international treaties, legislation or new regulations. However, future restrictions on emissions of GHGs, or related measures to encourage use of renewable energy could have a significant impact on our future operations and reduce demand for our products.” (Noble.10K, p. 22)
“Domestic and international responses to climate and related energy issues are matters of public policy consideration. We are currently in a period of increasing uncertainty as to these matters and, at this time, it is difficult to anticipate how the current US Administration, or other entities, may act on existing or new laws and regulations...Changes in international, federal or state laws and regulations regarding climate policy could have a significant negative impact on our ability to explore for and develop crude oil and natural gas resources or reduce demand for our products.” (Noble.10K, p. 32)
“...claims have been made against certain energy companies alleging that greenhouse gas emissions from oil and natural gas operations constitute a public nuisance under federal and/or state common law. As a result, private individuals or other entities may make claims against us for alleged personal injury, property damage, or other potential liabilities. While our business is not a party to any such litigation, we could be named in actions making similar allegations. An unfavorable ruling in any such case could impact our operations and could have an adverse impact on our financial condition.” (Noble.10K, p. 32)
INDICATOR 3AII. PHYSICAL RISKS Score: (3)
333

Noble Energy, Inc.
Rationale: Noble acknowledges physical climate change-related risks facing its business, but the company’s analysis of those physical risks lacks detail (e.g., facilities potentially impacted, mitigation efforts).
Source(s): “Additionally, there has been public discussion that climate change may be associated with extreme weather conditions such as more intense hurricanes, thunderstorms, tornadoes, drought and snow or ice storms, as well as rising sea levels. Extreme weather conditions can interfere with our production and increase our costs, and damage resulting from extreme weather may not be fully insured.” (Noble.10K, p. 32)
INDICATOR 3AIII. MARKET AND OTHER INDIRECT RISKS AND OPPORTUNITIES
Score: (2)
Rationale: Noble notes various indirect risks related to climate change (i.e., reputation harm, grass roots opposition to hydrocarbon development, the divestment movement), but does not detail how the company in particular might be impacted.
Source(s): “...efforts by the US Administration to modify federal oil and gas related regulations could intensify the risk of anti-development efforts from grass roots opposition.” (Noble.10K, p. 22)
“Companies in our industry can be the target of opposition to hydrocarbon development from stakeholder groups, including national, state and local governments, regulatory agencies, non-government organizations and public citizens. This opposition is focused on attempting to limit or stop hydrocarbon development in certain areas. Examples of such opposition include: efforts to reduce access to public and private lands; delaying or canceling permits for drilling or pipeline construction; limiting or banning industry techniques such as hydraulic fracturing, and/or adding restrictions on the use of water and associated disposal; imposition of set-backs on oil and gas sites; delaying or denying air-quality permits; advocating for increased regulations, punitive taxation, or citizen ballot initiatives or moratoriums on
334

Noble Energy, Inc.
industry activity; and the use of social media channels to cause reputational harm.” (Noble.10K, p. 27)
“Certain segments of the investor community have developed negative sentiment towards investing in our industry. Recent equity returns in the sector versus other industry sectors have led to lower oil and gas representation in certain key equity market indices. In addition, some investors, including investment advisors and certain sovereign wealth, pension funds, university endowments and family foundations, have stated policies to disinvest in the oil and gas sector based on their social and environmental considerations. Certain other stakeholders have also pressured commercial and investment banks to stop financing oil and gas and related infrastructure projects. Such developments, including environmental activism and initiatives aimed at limiting climate change and reducing air pollution, could result in downward pressure on the stock prices of oil and gas companies, including ours. This may also potentially result in a reduction of available capital funding for potential development projects, impacting our future financial results.” (Noble.10K, p. 36)
INDICATOR 3B. DELEGATION OF BOARD MEMBERS AND/OR COMMITTEES WITH EXPLICIT OVERSIGHT OF CLIMATE CHANGE POLICY Score: (3) Rationale: Noble recently expanded the scope of its former board-level
Environment, Health and Safety Committee, now called the Safety, Sustainability and Corporate Responsibility Committee, to explicitly include climate change as part of the mandate.
Source(s): “The Board’s four committees have responsibility over various key
aspects of our business and include the Audit Committee, Compensation, Benefits and Stock Option Committee, and Corporate Governance and Nominating Committee. In July 2018, our former Environment, Health and Safety Committee was reorganized into the Safety, Sustainability and Corporate Responsibility Committee to further align its primary responsibilities with the executive-level Sustainability and Corporate
335

Noble Energy, Inc.
Responsibility Committee and refine the focus of the committee.” (Noble.SR, p.9)
“In 2018, we expanded the purview of the former Environmental, Health and Safety Board Committee to oversee and guide the company’s Safety, Sustainability and Corporate Responsibility (SSCR) strategy and management, including initiatives in methane emission reduction, water management and climate assessment.” (Noble.AR, p.4)
“The overall purpose of the Safety, Sustainability and Corporate Responsibility Committee (the “Committee”) is to assist the Board in (1) identifying, evaluating and monitoring environmental, climate, health, safety, social, and public policy trends, issues and concerns and other corporate responsibility matters (collectively, “SSCR”) that could affect the Company's business activities, performance, and reputation and (2) determining whether the Company has appropriate policies, management systems, strategies and initiatives in place with respect to SSCR.” (Noble.CCC1, p.1)
INDICATOR 3C. DOES THE COMPANY SUPPORT CLIMATE-RELATED SHAREHOLDER RESOLUTIONS? Score: (2) Rationale: During the 2018 proxy season Noble recommended against a
climate-related shareholder resolution put forth by the Presbyterian Church, acting on behalf of other shareholders, seeking a two-degree scenario report.
Source(s): “We do not believe it would be in the best interest of our shareholders
to expend significant resources preparing an additional report that is premised on speculative planning scenarios and assumptions and would possibly include information that, while not necessarily proprietary in nature, may be valuable to our competitors.” (Noble.PRXY1, p. 25; see also Ceres – Climate and Sustainability Shareholder Resolutions Database; SEC – Division of Corporate Finance 2019; SEC – Division of Corporate Finance 2018)
336

Noble Energy, Inc.
CRITERION 4 – WHAT ARE THE COMPANY’S AFFILIATIONS WITH THIRD PARTIES THAT SPREAD DISINFORMATION ON CLIMATE SCIENCE? INDICATOR 4A. THE AMERICAN LEGISLATIVE EXCHANGE COUNCIL (ALEC) Score: (2) Rationale: According to SourceWatch, Noble was listed as a member of the
"2017 Annual Meeting Host Committee" and as a "Vice Chairman Level" sponsor for the 2017 ALEC Annual Meeting, and there is no evidence to suggest the company is no longer affiliated with ALEC.
Source(s): (see Source Watch - ALEC; see also DeSmogBlog – ALEC) INDICATOR 4B. THE AMERICAN PETROLEUM INSTITUTE (API) Score: (1) Rationale: Noble is a current member of API and has not taken concrete steps
to distance itself from its climate change deception. Further, Noble Chairman, President, and CEO David Stover serves on API's Executive Committee.
Source(s): “Dave [Noble CEO David L. Stover] serves on the executive
committee of the American Petroleum Institute and on the board of directors and executive committee of Junior Achievement in Houston.” (Noble.CWS1; see also API – Members, DeSmogBlog – API)
INDICATOR 4C. THE NATIONAL ASSOCIATION OF MANUFACTURERS (NAM) Score: (3) Rationale: Noble is not listed on NAM’s website as a current member of the
association’s executive committee, and company is not mentioned by DeSmogBlog as having ever been affiliated with association.
337

Noble Energy, Inc.
Source(s): (see NAM – Board of Directors; DeSmogBlog – NAM) INDICATOR 4D. THE WESTERN STATES PETROLEUM ASSOCIATION (WSPA) Score: N/A Rationale: Noble is not listed as a corporate member on WSPA's website, and
the company has no operations in the association’s jurisdiction. Source(s): (see WSPA – Member Companies; DeSmogBlog – WSPA) INDICATOR 4E. AMERICAN FUEL AND PETROCHEMICAL MANUFACTURERS (AFPM) Score: (3) Rationale: Noble is not listed as a current member on AFPM’s website, and
company is not mentioned by DeSmogBlog as having ever been affiliated with association.
Source(s): (see AFPM – Membership Directory; DeSmogBlog – AFPM) CRITERION 5 – DOES THE COMPANY PUBLICLY SUPPORT THE NEED FOR CLIMATE POLICY AND REGULATIONS? INDICATOR 5A. REGULATIONS, CARBON TAX, EMISSIONS TRADING, RENEWABLE ENERGY, CCS, ETC. Score: (4) Rationale: Noble has publicly expressed support for specific climate policies
and/or regulations (e.g., New Source Performance Standards (NSPS) OOOOa) which, although promulgated outside the scope of the reporting period, have undergone significant changes during 2018-2019.
338

Noble Energy, Inc.
Source(s): “Over the past five years, the U.S. federal agencies and state agencies have developed rules related to greenhouse gas emissions from Noble Energy’s operations. These rules have recently or are currently being reviewed and revised. Noble Energy engages deeply across the stakeholder spectrum to identify the potential for regulation and engage in the development of regulation. For example, in 2017 we worked with industry, environmental and government partners in Colorado on updates to Regulation 7, which, when originally promulgated in 2014, was the first ever direct regulation of methane. Noble is poised to comment on EPA’s NSPS OOOOa rule, which is expected to be undergo additional rule revisions soon.” (Noble.CDP1, pp. 18-19)
“Noble has engaged with U.S. EPA on likely forthcoming changes to the regulation of methane from oil and gas operations (OOOOa). We intend to comment on technical improvements to the regulation...OOOOa is the federal rule that directly regulates methane from new and modified air pollution sources. Noble supports this rule and, as with all regulations where we have developed experience complying with them, have suggestions for how they can achieve their goals more effectively and efficiently. We will continue to engage EPA and all regulatory agency partners in this manner.” (Noble.CDP1, p. 82)
“In 2017 Noble Energy participated in development of revisions to Colorado Regulation 7. We supported the Colorado Department of Public Health and Environment (CDPHE) staff recommendations and worked to garner broad support by industry trades and Environmental Defense Fund. The revisions altered LDAR frequency and related ozone and methane emissions strategies. An outcome of the rulemaking was an agreement to create a pneumatic controller task force to better understand how to better manage emissions from this equipment. Noble serves on this task force...The revisions to ACQQ Regulation 7 established additional emission control requirements and LDAR inspection frequencies, with little material impact on Noble Colorado operations due to our standard operating practices.” (Noble.CDP1, pp. 81-82; see also Noble.SR, p. 58)
INDICATOR 5B. PARIS AGREEMENT
339

Noble Energy, Inc.
Score: (1) Rationale: Noble has been silent on the need for policies and regulations to
advance the Paris Climate Agreement. Mention of the Paris Agreement is omitted from virtually all public company platforms, including Noble’s website and sustainability report. While the Paris Agreement is cited in Noble’s Form 10-K, it is only in the context of regulatory risk.
Source(s): “At the international level, in December 2015, the US signed the
Paris Agreement on climate change and pledged to take efforts to reduce GHG emissions and to conserve and enhance sinks and reservoirs of GHGs. The Paris Agreement entered into force in November 2016. However, in August 2017, the US notified the United Nations that it would be withdrawing from the Paris Agreement and begin negotiations to either re-enter or negotiate an entirely new agreement with more favorable terms for the US.” (Noble.10K, p. 22)
CRITERION 6 – HAS THE COMPANY BEEN PUBLICLY TRANSPARENT ABOUT ITS POSITION, ACTIONS, AND AFFILIATIONS WITH REGARD TO CLIMATE SCIENCE AND CLIMATE CHANGE? INDICATOR 6A. WEBPAGE DEDICATED TO CLIMATE CHANGE Score: (5) Rationale: Noble maintains a separate webpage on its website devoted to
climate change. Source(s): (see Noble.CWS2) INDICATOR 6B. STAND-ALONE SUSTAINABILITY REPORT WITH SPECIFIC REFERENCE TO CLIMATE CHANGE Score: (5)
340

Noble Energy, Inc.
Rationale: Noble produces a sustainability responsibility report that is easily accessible through its website and contains a section dedicated to climate change.
Source(s): (see Noble.SR, p. 47) INDICATOR 6C. DISCLOSURE TO CDP Score: (5) Rationale: CDP website indicates “Submitted” from Noble for Climate Change
2018. Source(s): (see Noble.CDP2) INDICATOR 6D. DISCLOSURE OF THIRD-PARTY RELATIONSHIPS AND LOBBYING ACTIVITIES Score: (5) Rationale: Noble provides a comprehensive list of trade associations to which it
is a member and includes the company’s relevant financial contributions.
Source(s): “The Company is involved in a number of industry groups that
support our legislative and regulatory evaluation process. Set forth below are the amounts of these payments reported as being used for political purposes.” (Noble.FPS1)
INDICATOR 6E. REPORT ON CLIMATE RELATED RISK SCENARIOS Score: (1) Rationale: Noble has yet to produce a 2°C scenario report. Source(s): “As part of our commitment to transparency, Noble Energy will
publish a climate resiliency report in 2019 informed by the framework of the Taskforce on Climate-related Financial
341

Noble Energy, Inc.
Disclosures and focused on our climate-related governance, strategy, risk management and performance.” (Noble.SR, p. 47)
342

Occidental Petroleum Corporation
XXII. Occidental Petroleum Corporation CRITERION 1 – WHAT IS THE COMPANY’S POSITION ON CLIMATE SCIENCE? INDICATOR 1A. CONSISTENTLY ACCURATE PUBLIC STATEMENTS ON CLIMATE SCIENCE AND THE CONSEQUENT NEED FOR SWIFT AND DEEP REDUCTIONS IN EMISSIONS FROM THE BURNING OF FOSSIL FUELS Score: (2) Rationale: Despite recent public comments by Occidental’s CEO
acknowledging both the reality of climate change and the urgency of a response, Occidental does not address climate science on its website or public disclosures.
Source(s): “That’s [Carbon capture technology] important to us,” Hollub said.
“We believe climate change is real. We believe we need to do what’s necessary to reduce emissions, and we have the expertise to do it.” (Occidental.TPS1)
“I’m thinking about the long term for our shareholders,” Vicki Hollub, Occidental chief executive, told the Financial Times in Houston. “We believe if you’re not addressing these [climate] issues today, you’re going to be behind the game.” (Occidental.TPS2)
“Occidental is committed to be part of the climate solution and continues to develop and implement practical innovations to preserve the environment and reduce our emissions. Our business decision-making process integrates climate change-related issues with other business priorities to help us effectively manage greenhouse gas (GHG) emissions, the social and economic impacts of Occidental's energy use and further the company's commitment to be an efficient, low-cost producer of oil and gas and commodity chemicals.” (Occidental.CWS1)
“We work with governments, companies, peer companies in our industry sector and civil society organizations to facilitate the
343

Occidental Petroleum Corporation
development of viable global policies and regulatory frameworks.” (Occidental.CWS2)
“As noted in the Strategy section of this report, CCUS is an essential mechanism to achieving the atmospheric CO2 reduction goals of the Paris climate accord, and a central component of Occidental’s climate-related sustainability strategy.” (Occidental.CO2R, p. 61)
CRITERION 2 – WHAT MEASURES IS THE COMPANY TAKING TO REDUCE ITS CARBON FOOTPRINT? INDICATOR 2A. GHG EMISSIONS TARGETS Score: (2) Rationale: Occidental has not committed to absolute GHG emission reductions,
rather the company has committed to (1) eliminate routine flaring by 2030 and (2) set 2030 direct emissions intensity and methane emissions intensity targets by the end of 2019. As such, Occidental’s plan is not in the service of a specific temperature goal or target.
Source(s): “Stakeholders have also inquired about interim milestones for targets
such as our goal to eliminate routine flaring by 2030, and requested timelines for establishing other GHG emissions reduction targets. In response, we are currently developing an approach with interim milestones for our commitment to eliminate routine flaring by 2030, and in this report we have committed to establishing in 2019 a direct CO2e emissions intensity reduction goal for 2030, with interim milestones, and a methane emissions intensity reduction target.” (Occidental.CO2R, p. 24)
“We are committed to responsible environmental performance and emissions reductions. In 2019, [we] will set and disclose 2030 direct CO2e emissions intensity and methane emissions intensity targets for our oil and gas operations.” (Occidental.CO2R, p. 10)
INDICATOR 2B. GHG EMISSIONS REDUCTIONS
344

Occidental Petroleum Corporation
Score: (1) Rationale: Company’s GHG emissions intensity has increased in each of the
last two reporting years. Source(s): [see Supplemental Data] INDICATOR 2C. R&D INTO LOW-CARBON TECHNOLOGIES Score: (2) Rationale: Occidental recently launched Oxy Low Carbon Ventures (OLCV), a
wholly owned subsidiary, in order to expand the company’s carbon capture and enhanced oil recovery capabilities. Still, Occidental has not disclosed the unit’s low-carbon R&D budget nor the size of the equity investments the unit has made in emerging carbon capture technology companies.
Source(s): “Occidental recently launched Low Carbon Ventures, a new
business unit that, among other things, seeks to identify and develop commercial opportunities to extend our competitive advantages in carbon dioxide enhanced oil recovery (CO2 EOR) and carbon capture, utilization, and storage (CCUS) and investing in and developing technologies to drive cost efficiency. Occidental is an industry leader in applying these technologies and it provides a key long-term competitive advantage for the company.” (Occidental.CWS3)
“Occidental is at various stages of evaluating or implementing a wide range of new projects with GHG emission reduction potential, including Carbon Capture Utilization and Storage (CCUS), Carbon Capture and Storage (CCS) and Carbon Capture and Utilization (CCU). Occidental is also evaluating emerging or improving existing technologies around these carbon reduction potentials.” (Occidental.CDP1, p. 15)
“During 2018, Occidental brought together innovative and diverse leaders from across the organization to form Oxy Low Carbon Ventures (OLCV), a wholly owned subsidiary, dedicated to
345
Occidental Petroleum Corporation
pursuing low-carbon business opportunities. The OLCV team has a dual objective — to enhance profitability and sustainability of our businesses while meeting the challenge of reducing atmospheric GHG concentrations. These business opportunities will be pursued through low-carbon technology, projects and services. An additional aspect of Occidental’s low-carbon pursuits is to enable and create partnerships for improved business and climate solutions. Looking forward, collaboration in technology and low-carbon value chain opportunities will be critical to the speed and scaled deployment necessary for both enhanced profitability and carbon reduction. The OLCV team led the development of our low-carbon strategy, which includes three main pathways to decarbonization: emissions reduction, reduced energy consumption and reduction of atmospheric CO2 concentrations.” (Occidental.CO2R, p. 37)
“In January 2019, OLCV made an equity investment in Carbon Engineering, a Canadian developer of technology that captures CO2 directly from the atmosphere. The captured CO2 can supply CO2 EOR or be converted to fuels for sale...This technology has the potential to increase Occidental’s anthropogenic CO2 supply and aid in offsetting Occidental’s overall GHG emissions.” (Occidental.CO2R, p. 44)
INDICATOR 2D. USE OF AN INTERNAL PRICE ON CARBON Score: (3) Rationale: Occidental utilizes an internal price on carbon in its investment
decisions, and explains generally how it is used (i.e., only involving capital commitments in excess of $5 million).
Source(s): “...as part of our commitment to informed capital planning and risk
management, we include an assumed price on carbon in our capital approval process for the purpose of sensitivity modeling. This modeling allows our capital planners and senior management to analyze the long-term risks of exposure to carbon prices when extending the operating life or reserves of existing fields or entering new projects, while simultaneously instilling a culture of carbon-price sensitivity in our capital planning. For 2019, we have
346

Occidental Petroleum Corporation
increased our assumed price on CO2 emissions from $40 per metric ton to $50 per metric ton for new projects with a capital commitment of greater than $5 million. Based on the emissions intensity for Occidental’s worldwide oil and gas operations, this translates to a cost of about $1.80 per BOE.” (Occidental.CO2R, p. 29)
CRITERION 3 – IS CLIMATE SCIENCE INTEGRAL TO THE GOVERNANCE AND OVERSIGHT OF THE COMPANY? INDICATOR 3A. DELINEATION OF RISKS AND RISK MANAGEMENT PROCEDURES RELATED TO CLIMATE CHANGE INDICATOR 3AI. REGULATORY RISKS Score: (2) Rationale: Occidental acknowledges the general existence of risk associated
with current and proposed regulations and laws relating to climate change but specific polices (e.g., Clean Air Act, EPA’s methane rule) are not discussed in the context of risk and potential effects particular to the company are not identified.
Source(s): “Continuing political and social attention to the issue of climate
change has resulted in both existing and pending international agreements and national, regional and local legislation and regulatory programs to reduce greenhouse gas emissions. In December 2009, the EPA determined that emissions of carbon dioxide, methane and other greenhouse gases endanger public health and the environment because emissions of such gases are, according to the EPA, contributing to warming of the Earth’s atmosphere and other climatic changes. Based on these findings, the EPA began adopting and implementing regulations to restrict emissions of greenhouse gases under existing provisions of the Clean Air Act. For example, the EPA issued rules restricting methane emissions from hydraulically fractured and refractured gas wells, compressors, pneumatic controls, storage vessels, and natural gas processing plants.” (Occidental.10K, p. 7)
347

Occidental Petroleum Corporation
“In the absence of federal legislation to significantly reduce emissions of greenhouse gases to date, many state governments have established rules aimed at reducing greenhouse gas emissions, including greenhouse gas cap and trade programs. Most of these cap and trade programs work by requiring major sources of emissions, such as electric power plants, or major producers of fuels, such as refineries and natural gas processing plants, to acquire and surrender emission allowances. In the future, the United States may also choose to adhere to international agreements targeting greenhouse gas reductions. These and other government actions relating to greenhouse gas emissions could require Occidental to incur increased operating and maintenance costs, such as costs to purchase and operate emissions control systems, to acquire emissions allowances, pay carbon taxes, or comply with new regulatory or reporting requirements, or they could promote the use of alternative sources of energy and thereby decrease demand for oil, natural gas and other products that Occidental’s businesses produce. Any such legislation or regulatory programs could also increase the cost of consuming, and thereby reduce demand for, oil, natural gas and other products produced by Occidental’s businesses and lower the value of its reserves. Consequently, government actions designed to reduce emissions of greenhouse gases could have an adverse effect on Occidental’s business, financial condition, results of operations, cash flows and reserves.” (Occidental.10K, p. 7)
INDICATOR 3AII. PHYSICAL RISKS Score: (3) Rationale: Occidental’s financial disclosures do not acknowledge climate
change as a contributor to the physical risks facing its operations, but the company’s carbon disclosures include a discussion about potential physical risks resulting from long-term shifts in the climate. Still, apart from briefly mentioning U.S. Gulf Coast facilities prone to serious weather events, Occidental’s discussion of specific physical climate-driven risks that might impact the company lacks detail.
348

Occidental Petroleum Corporation
Source(s): “Occidental’s businesses may experience catastrophic events. The occurrence of events such as hurricanes, floods, droughts, earthquakes or other acts of nature, well blowouts, fires, explosions, pipeline ruptures, chemical releases, crude oil releases, including maritime releases, releases into navigable waters, and groundwater contamination, material or mechanical failure, industrial accidents, physical attacks, abnormally pressured or structured formations and other events that cause operations to cease or be curtailed may negatively affect Occidental’s businesses and the communities in which it operates. Coastal operations are particularly susceptible to disruption from extreme weather events. Any of these risks could adversely affect our ability to conduct operations or result in substantial losses to us.” (Occidental.10K, p. 8)
“Other potential physical or resource risks that could arise from long-term shifts in climate, including water or raw material scarcity, changes or disruptions in energy markets, geopolitical risks, or other supply and logistics challenges, are considered in our routine business planning and ERM processes.” (Occidental.CO2R, p. 32)
“Occidental’s business and risk assessments include analyses of potential physical impacts such as flooding or natural resource stresses. The company has several facilities located near the U.S. Gulf Coast or other regions prone to weather events capable of producing life-threatening conditions, facility damage or operational interruptions. Effective planning and mitigation improve access to and the safe and efficient operation of these and other dependent facilities, as well as our workers’ communities. In addition to holding third-party insurance with respect to certain weather-related losses, Occidental’s Health, Environment and Safety Management System integrates such issues — ranging from those that are event-driven to those that are the result of a systemic change — into our risk and operations management structure. Facilities exposed to tropical storm risks are hardened against severe weather events and routinely inspected and have historically weathered such events without casualties or major damage. These facilities have emergency preparedness and
349

Occidental Petroleum Corporation
response plans that are initiated in advance of identified storms.” (Occidental.CO2R, p. 32)
INDICATOR 3AIII. MARKET AND OTHER INDIRECT RISKS AND OPPORTUNITIES
Score: (2)
Rationale: Occidental generally references a shifting market and other indirect risks and opportunities related to climate change, including an acknowledgment of recent high-profile climate-related litigation in which the company is a defendant, but does not address how the company in particular might be impacted by indirect risks related to climate change.
Source(s): “Any such legislation or regulatory programs could also increase the cost of consuming, and thereby reduce demand for, oil, natural gas and other products produced by Occidental’s businesses and lower the value of its reserves. Consequently, government actions designed to reduce emissions of greenhouse gases could have an adverse effect on Occidental’s business, financial condition, results of operations, cash flows and reserves. There also have been efforts in recent years to influence the investment community, including investment advisers and certain sovereign wealth, pension and endowment funds promoting divestment of fossil fuel equities and pressuring lenders to limit funding to companies engaged in the extraction of fossil fuel reserves. Such environmental activism and initiatives aimed at limiting climate change and reducing air pollution could interfere with our business activities, operations and ability to access capital...It is difficult to predict the timing and certainty of such government actions and the ultimate effect on Occidental, which could depend on, among other things, the type and extent of greenhouse gas reductions required, the availability and price of emissions allowances or credits, the availability and price of alternative fuel sources, the energy sectors covered, and Occidental’s ability to recover the costs incurred through its operating agreements or the pricing of the company’s oil, NGL, natural gas and other products.” (Occidental.10K, p. 8)
350

Occidental Petroleum Corporation
“Finally, increasing attention to climate change risks has resulted in an increased possibility of governmental investigations and additional private litigation against Occidental without regard to causation or our contribution to the asserted damage, which could increase our costs or otherwise adversely affect our business. We have been named in certain private litigation relating to these matters.” (Occidental.10K, p. 8)
INDICATOR 3B. DELEGATION OF BOARD MEMBERS AND/OR COMMITTEES WITH EXPLICIT OVERSIGHT OF CLIMATE CHANGE POLICY Score: (3) Rationale: While the charter of Occidental’s board-level Environmental
Committee explicitly notes its responsibility to review “climate-related risks and opportunities,” the charter of Occidental’s Governance Committee only notes that the committee's purpose is to, among other things, “review the Corporation’s Human Rights Policy and related social responsibility programs and practices.” Further, though Occidental highlights the environmental background of the current chair of its Environmental Committee, the chairperson is not a member of Occidental’s board of directors.
Source(s): “Pursuant to its charter, this committee [Environmental, Health and
Safety Committee (Environmental Committee)] reviews climate-related risks and opportunities as part of our risk management processes.” (Occidental.CO2R, p. 21; see also Occidental.CCC1)
“JOHN FEICK, executive chairman of an environmental services provider with broad experience in the environmental, health and safety areas, chairs the Environmental Committee...” (Occidental.CO2R, p. 22)
“Pursuant to its charter, this committee [Corporate Governance, Nominating and Social Responsibility Committee (Governance Committee)] oversees stockholder engagement and disclosures regarding ESG and sustainability matters.” (Occidental.CO2R, p. 21)
351

Occidental Petroleum Corporation
“SPENCER ABRAHAM, a former U.S. Secretary of Energy who spearheaded the department’s research and development efforts in the areas of hydrogen fuel cells and clean coal technology, serves on our Governance and Compensation Committees. (Occidental.CO2R, p. 22; see also Occidental.CCC2)
INDICATOR 3C. DOES THE COMPANY SUPPORT CLIMATE-RELATED SHAREHOLDER RESOLUTIONS? Score: (3) Rationale: Company has not faced any climate-related shareholder resolutions
put forward by established networks of socially responsible investors during the reporting period.
Source(s): (see Ceres – Climate and Sustainability Shareholder Resolutions
Database; SEC – Division of Corporate Finance 2019; SEC – Division of Corporate Finance 2018)
CRITERION 4 – WHAT ARE THE COMPANY’S AFFILIATIONS WITH THIRD PARTIES THAT SPREAD DISINFORMATION ON CLIMATE SCIENCE? INDICATOR 4A. THE AMERICAN LEGISLATIVE EXCHANGE COUNCIL (ALEC) Score: (4) Rationale: Occidental left ALEC in 2014 but did not state explicitly it was
because he company’s position on climate change was inconsistent with the association’s.
Source(s): “As we discussed, Occidental has made payments to ALEC in 2014
after publication of the 2014 Proxy Statement for membership dues in the amount of $10,000 and a scholarship fund contribution to the amount of $2,500. However, Occidental’s state lobbyists met last month and one of the issues they discussed was whether there was any interest in continuing to support ALEC. They concluded that there are other associations at the state-level that provide equal or greater value. Accordingly, there are no plans to
352

Occidental Petroleum Corporation
continue Occidental’s membership in, or make further payments to, ALEC. You indicated that you would convey this information to the groups who follow this issue so that Occidental should cease to be included in lists of ALEC supporters. Additionally, we discussed your concern that, as a member of the Chamber of Commerce and the American Petroleum Institute, Occidental could be presumed to share the positions taken by those organizations on climate change and EPA regulations. Occidental’s on-line disclosures currently state that we do not support all of the positions taken by organizations to which we belong. However, Occidental will strengthen that disclosure by referring the reader to the Social Responsibility section of our website to learn more about Occidental’s position on various issues, including those related to the environment, health and safety.” (Occidental.FPS1; see also Source Watch - ALEC; DeSmogBlog – ALEC)
INDICATOR 4B. THE AMERICAN PETROLEUM INSTITUTE (API) Score: (1) Rationale: Occidental is a current member of API and Occidental President and
CEO Vicki Hollub serves on API’s board of directors. Source(s): “Vicki Hollub is President and Chief Executive Officer of
Occidental. She has been a member of Occidental’s Board of Directors since 2015...Ms. Hollub serves on the boards of the American Petroleum Institute, Khalifa University for Science and Technology in Abu Dhabi, and Lockheed Martin. (Occidental.FPS2; see also API – Members; DeSmogBlog – API)
INDICATOR 4C. THE NATIONAL ASSOCIATION OF MANUFACTURERS (NAM) Score: (2) Rationale: Occidental is not listed on NAM’s website as a current member of
association’s executive committee. Still, SourceWatch notes that NAM’s 2008 Q1 lobbying disclosure form listed Occidental as a member of the association, and in 2015 Occidental included NAM on
353

Occidental Petroleum Corporation
its own list of trade associations to which it had contributed more than $50,000 in membership dues.
Source(s): (see Occidental.FPS3; SourceWatch – NAM; see also NAM – Board
of Directors, DeSmogBlog – NAM) INDICATOR 4D. THE WESTERN STATES PETROLEUM ASSOCIATION (WSPA) Score: N/A Rationale: Occidental is not listed as a corporate member on WSPA's website,
and the company has no operations in the association’s jurisdiction. Source(s): (see WSPA – Member Companies; DeSmogBlog – WSPA) INDICATOR 4E. AMERICAN FUEL AND PETROCHEMICAL MANUFACTURERS (AFPM) Score: (1) Rationale: Occidental is listed as a current member AFPM on the association’s
website and Burnis Hebert, President of OxyChem, is a current member of AFPM’s Board of Directors.
Source(s): (see Occidental.TPS3, p. 33; AFPM – Membership Directory; see
also DeSmogBlog – AFPM) CRITERION 5 – DOES THE COMPANY PUBLICLY SUPPORT THE NEED FOR CLIMATE POLICY AND REGULATIONS? INDICATOR 5A. REGULATIONS, CARBON TAX, EMISSIONS TRADING, RENEWABLE ENERGY, CCS, ETC. Score: (4) Rationale: Occidental is generally supportive of legislation to “spur commercial
deployment” of CCUS and has supported legislation which incentivizes CCUS and the use of anthropogenic CO2 in enhanced
354

Occidental Petroleum Corporation
oil recovery operations (e.g., the company supported enhancement of Section 45Q federal tax credit, which was subsequently passed by U.S. Congress in 2018 as part of the FUTURE Act).
Source(s): “We were one of the first U.S. companies to join the Oil and Gas
Climate Initiative (OGCI), a CEO-led effort by the world’s most influential energy companies. OGCI aims to reduce the industry’s carbon footprint and invest in economically viable low-carbon technologies that will lead the way for tomorrow’s new energy landscape. Working with the Carbon Capture Coalition and others, we helped pass the FUTURE Act, which incentivizes CCUS. We continue to partner with these groups to advance legislative support for CCUS research, development and deployment.” (Occidental.CO2R, p. 7)
“[Occidental] Supported legislation to expand and reform the Section 45Q federal tax credit (subsequently passed by U.S. Congress as the FUTURE Act) extends a federal tax credit for CO2 capture and sequestration and incentivizes the use of anthropogenic CO2 in EOR operations.” (Occidental.CDP1, p. 56)
“Under the California Low Carbon Fuel Standard (LCFS), which requires the oil industry to reduce the carbon-intensity of gasoline and diesel, a fuel provider meets its compliance obligation by ensuring that amount of credits it earns (or otherwise acquires from another party) is equal to, or greater than, the deficits it has incurred. Credits and deficits are generally determined based on the amount of fuel sold, the carbon intensity of the fuel, and the efficiency by which a vehicle converts the fuel into usable energy. Credits may be banked and traded within the LCFS market to meet obligations. Occidental may be eligible for credits if the LCFS Program recognizes "lower carbon" crude produced using CO2 EOR with captured anthropogenic CO2.” (Occidental.CDP1, p. 16)
“Occidental works with the Global Carbon Capture and Storage Institute to support Carbon Capture Utilization and Storage (CCUS) incentive legislation and fiscal policies to spur commercial deployment of technologies to enable the capture of anthropogenic CO2 and the permanent and safe geologic storing of CO2 underground. Occidental supports legislation and fiscal policies
355

Occidental Petroleum Corporation
to spur commercial deployment of technologies to enable the capture of anthropogenic CO2 and the permanent and safe geologic storing of CO2 underground.” (Occidental.CDP1, p. 56) “Carbon tax…Neutral…Occidental engages the U.S. EPA and Department of Energy, among other agencies, to explain our use of anthropogenic carbon dioxide (CO2) for enhanced oil recovery (EOR) operations… Any approach to regulating GHG emissions should be holistic. Occidental does not support efforts that regulate some sectors while omitting others.” (Occidental.CDP1, p. 56) “Mandatory carbon reporting…Support with minor exceptions…Occidental engages the U.S. EPA and associated state-level agencies on the EPA Greenhouse Gas Reporting Program (GHGRP), both directly and through its trade associations. Occidental monitors changes in applicable regulations, comments on technology, management systems for collecting and reporting data and provides information on testing and data collection to improve the GHGRP requirements and accuracy of the data collected.” (Occidental.CDP1, p. 56)
INDICATOR 5B. PARIS AGREEMENT Score: (2) Rationale: Occidental believes CCUS are “...an essential mechanism to
achieving the atmospheric CO2 reduction goals of the Paris climate accord,” and has supported specific legislation during the reporting period to incentivize CCUS, but the company has not explicitly endorsed the Agreement’s goal of keeping global temperature increase well below 2°C and pursuing efforts to limit it to 1.5°C.
Source(s): “As noted in the Strategy section of this report, CCUS is an essential
mechanism to achieving the atmospheric CO2 reduction goals of the Paris climate accord, and a central component of Occidental’s climate-related sustainability strategy. At this time, we believe GHG reporting frameworks do not fully reflect the overall impacts of tools or strategies necessary to achieving climate goals.” (Occidental.CO2R, p. 61)
356

Occidental Petroleum Corporation
“Occidental supports legislation and fiscal policies to spur commercial deployment of technologies to enable the capture of anthropogenic CO2 and the permanent and safe geologic storing of CO2 underground.” (Occidental.CDP1, p. 56)
“In support of our business goals and our carbon neutrality aspiration, we are developing a methodology to ensure transparency and robust measurement of our total carbon impact. Reductions that Occidental implements within its operational control, as well as those where we partner to achieve reductions, will be netted against our Scope 1-3 emissions. We believe this expansion of carbon measurement methodologies beyond the boundaries of traditional greenhouse gas accounting conventions is necessary to capture the variety of opportunities — such as avoided emissions, low-emission products and the withdrawal of CO2 from the atmosphere — where multiple parties have significant roles to play. Ultimately, if society is to achieve a well- below 2°C outcome, the contributions of those that facilitate emissions reductions or withdrawals of CO2 from the atmosphere should be recognized in a transparent way that further encourages similar actions.” (Occidental.CO2R, p. 13)
CRITERION 6 – HAS THE COMPANY BEEN PUBLICLY TRANSPARENT ABOUT ITS POSITION, ACTIONS, AND AFFILIATIONS WITH REGARD TO CLIMATE SCIENCE AND CLIMATE CHANGE? INDICATOR 6A. WEBPAGE DEDICATED TO CLIMATE CHANGE Score: (1) Rationale: Occidental’s website includes a “Social Responsibility -
Performance” section that includes a discussion about climate change, but the company does not maintain a separate webpage devoted to climate change.
Source(s): (see Occidental.CWS4) INDICATOR 6B. STAND-ALONE SUSTAINABILITY REPORT WITH SPECIFIC REFERENCE TO CLIMATE CHANGE
357

Occidental Petroleum Corporation
Score: (5) Rationale: Occidental produces a climate risk report that includes many
elements of a traditional sustainability report (e.g., explanation of the company’s climate change-related corporate governance structure, a discussion of emissions reductions measures currently employed).
Source(s): “This report highlights our recent efforts to address climate-
related risks and opportunities in our business. The report begins with an introductory letter from our President and CEO, highlighting some of our climate-related leadership and action in 2018 and 2019, including how we are exploring our carbon-neutral aspiration. We then provide an overview of progress on our 2018 commitments, climate-related governance and risk management processes and systems, planning and execution of climate strategies, and metrics and targets for reducing greenhouse gas (GHG) emissions. This report is organized in the four-element framework recommended by the Task Force on Climate-related Financial Disclosures (TCFD), a framework we support.” (Occidental.CO2R, p. 4)
INDICATOR 6C. DISCLOSURE TO CDP Score: (5) Rationale: CDP website indicates “Submitted” from Occidental for Climate
Change 2018. Source(s): (see Occidental.CDP2) INDICATOR 6D. DISCLOSURE OF THIRD-PARTY RELATIONSHIPS AND LOBBYING ACTIVITIES Score: (3) Rationale: Occidental only discloses its membership in trade associations to
which it has paid annual dues in excess of $50,000.
358

Occidental Petroleum Corporation
Source(s): “Occidental is a member of and an active participant in many trade and industry groups. Membership in these groups is necessary to stay abreast of issues impacting Occidental's business segments. While generally not the primary purpose of these organizations, many actively engage in lobbying on industry issues. These organizations represent a broad range of members and interests and Occidental does not always share the views of these organizations and their other members. Occidental annually provides a list of U.S. Trade Associations (PDF) of which Occidental is a member and to which it paid annual dues in excess of $50,000. At the direction of the Board of Directors, the Government Affairs Committee reviews, assesses and approves of Occidental's membership in such trade associations.” (Occidental.FPS4; see also Occidental.FPS5)
INDICATOR 6E. REPORT ON CLIMATE RELATED RISK SCENARIOS Score: (5) Rationale: Occidental’s “Climate-Related Risks and Opportunities” includes an
extensive analysis on what a 2°C or lower increase in global temperature would mean for its businesses, strategies, and financial planning.
Source(s): “We believe our strategy for resilience — utilizing and sequestering
CO2 at a price and volume that adjusts relative to potential economic or regulatory carbon constraints or incentives — is flexible enough to be attractive to investors in various carbon-constrained scenarios, while still aligning with the Paris climate accord goals.” (Occidental.CO2R, p. 32)
“We have analyzed our portfolio using the International Energy Agency’s 2018 Sustainable Development Scenario, and this analysis demonstrated no significant risk of stranded assets.” (Occidental.CO2R, p. 9)
“Some stakeholders inquired whether our portfolio review process and modeling included a scenario aligned with limiting the increase in global temperature to 1.5oC. In response, we have included additional detail on the Sustainable Development Scenario,
359

Occidental Petroleum Corporation
describing the scenario’s alignment with the goals of the Paris agreement and the scenario’s presence within the envelope of scenarios projecting a temperature rise below 1.5oC.” (Occidental.CO2R, p. 24)
“Portfolio impacts were assessed by applying the outcomes for the Sustainable Development Scenario for oil and natural gas prices and CO2 prices in the regions where we operate. At CO2 prices of $63 and $140 per metric ton for the U.S., as used in years 2025 and 2040 of the Sustainable Development Scenario, we estimate Occidental’s cost burden is approximately $1.70 and $3.80 per BOE on U.S. reserves. Oil and gas product prices under the Sustainable Development Scenario are generally higher than our reference case model prices calculated in accordance with SEC rules for reserves calculations. Considering product and CO2 prices under the Sustainable Development Scenario, proved reserves for U.S. assets modeled 1 percent lower, although NPV10 valuation showed no negative impact. For Occidental’s non-U.S. oil and gas assets, there is no negative impact to proved reserves or to NPV10 valuation. In aggregate, considering Occidental’s worldwide portfolio of oil and gas assets, there is no negative impact to proved reserves or NPV10 valuation. The Sustainable Development Scenario did not demonstrate a significant risk of stranded assets. Occidental has a robust resource base with a focus on short-cycle projects and disciplined cost management. Our CO2 EOR business, which has a low decline rate and fully-developed infrastructure, acts as a hedge against longer-cycle risks. In conducting the portfolio analysis, we did not include any estimate of the potential benefits that may result from expanded CCUS activities.” (Occidental.CO2R, p. 31)
“Although the Sustainable Development Scenario anticipates carbon emission pricing in several countries, for Occidental, this pricing still only applies to our U.S. oil and gas assets. Occidental does not have operations in the other countries where carbon prices were identified in the Sustainable Development Scenario. For our assessment of potential impacts of the Sustainable Development Scenario on our proved reserves, Occidental used a reference case model to represent our asset base at year-end 2018. The assessment was based on a representative portfolio of assets
360

Occidental Petroleum Corporation
that contained a majority of proved reserves from our U.S. and non-U.S. oil and gas locations reported in our 2018 Form 10-K. Planned capital spending and expected operating costs from the approved development plans that support the reserves were embedded in the model. The reference case model used the oil, natural gas liquids (NGL) and natural gas prices calculated in accordance with SEC rules for determining year-end 2018 proved reserves and computing the Standardized Measure of Discounted Future Net Cash Flows by application of a 10 percent discount factor (NPV10 valuation) as reported in Occidental’s 2018 Form 10-K.” (Occidental.CO2R, p. 30)
361
OMV
XXIII. OMV CRITERION 1 – WHAT IS THE COMPANY’S POSITION ON CLIMATE SCIENCE? INDICATOR 1A. CONSISTENTLY ACCURATE PUBLIC STATEMENTS ON CLIMATE SCIENCE AND THE CONSEQUENT NEED FOR SWIFT AND DEEP REDUCTIONS IN EMISSIONS FROM THE BURNING OF FOSSIL FUELS Score: (2) Rationale: OMV has downplayed the need to reduce GHG emissions in multiple
platforms by claiming that a balance must be struck (i.e., “oil and gas at its best”) between climate protection on the one hand and the need for reliable and affordable energy that supports social and economic development on the other.
Source(s): “As a socially responsible company, we must strike the right
balance between affordable energy, security of supply, and climate protection. We are firmly convinced that the responsible use of oil and the increased use of gas will contribute significantly to the transition toward a lower-carbon future.” (OMV.SR, p.3)
“Growing demand for energy and accelerating climate change pose immense challenges for the energy sector. The key lies in finding the balance between climate protection efforts, affordable energy, and reliable supply... To realize its mission of providing energy for a better life, OMV is committed to exploring the full potential of oil and gas at its best by following a responsible approach in producing, processing, and marketing oil and gas and petrochemical products.” (OMV.SR, p.12)
“The growing demand for energy and accelerating climate change pose immense challenges for the energy sector. The key lies in finding the balance between climate protection efforts, affordable energy, and reliable supply. This means producing and using oil and gas as sensibly and responsibly as possible to safeguard the energy supply.” (OMV.IR, p. 48)
362
OMV
“...gas in combination with renewables is currently the best answer to the challenges of climate change. The unavoidable exit from coal is only possible with gas, CNG cars as well as LNG for trucks and shipping could immediately lead to substantial reductions in CO2 emissions, and the power- to-gas technology will soon make it possible to store sustainable power.” (OMV.IR, p. 20)
“...if we were to switch from coal to gas for all power generation, we would reduce carbon emissions by 50 percent. We wouldn’t even need to develop any new technology to do this. It could be implemented immediately.” (OMV.IR, p. 27)
“Until the day when replacement technologies are found that can come close to meeting the growing demand for energy, we will not be able to forgo oil. The decisive factor is using it as carefully and responsibly as possible. This is what we refer to as “Oil & Gas at its best.” This means that in future we want to refine more oil and burn less of it for energy production.” (OMV.IR, p. 22)
CRITERION 2 – WHAT MEASURES IS THE COMPANY TAKING TO REDUCE ITS CARBON FOOTPRINT? INDICATOR 2A. GHG EMISSIONS TARGETS Score: (2) Rationale: OMV has implemented a company-wide plan to reduce the carbon
intensity of its operations (i.e., OMV Sustainability Strategy 2025), but that plan is not in the service of a specific temperature goal or target.
Source(s): “OMV is strongly committed to acting on climate change
mitigation and responsible resource management and has accordingly set targets to manage and reduce the carbon footprint of its operations and products. The principal targets are to reduce OMV’s overall operations carbon intensity by 19% by 2025 and to reduce the product carbon intensity by 4% by 2025, both compared with 2010. This will be achieved by improving energy efficiency across all operations and implementing projects that reduce direct GHG emissions and by increasing the share of natural
363

OMV
gas in our product portfolio.” (OMV.IR, p. 51; see also OMV.CDP1, p. 40)
“OMV made substantial business decisions in 2018, which will lead to a higher share of natural gas in the OMV Upstream production portfolio. OMV started the production of the mainly gas-based assets of Aasta Hansteen in Norway, continued the negotiations for the direct interest in the Russian gas extraction of the Achimov 4A/5A gas formation and will also benefit of the future gas production of SapuraOMV Upstream in Malaysia. Additionally, OMV extended the Russian natural gas supply contracts until 2040. The higher share of natural gas in OMV’s overall product portfolio will contribute to the reduction of the product portfolio’s carbon intensity.” (OMV.IR, p. 49)
“The carbon intensity of OMV’s product portfolio measures the CO2 equivalent emissions generated by the use of OMV’s products sold to third parties in t CO2 equivalent/toe sold.” (OMV.SR, p. 51)
“About 90% of OMV’s products are directly used for combustion. Scope 3 emissions from the use and processing of our products, as well as from purchased goods and services and capital goods, therefore constitute around 90% of our impact in terms of GHG emissions.” (OMV.SR, p. 51; see also OMV.SR, p. 103)
INDICATOR 2B. GHG EMISSIONS REDUCTIONS Score: (4) Rationale: Company’s GHG emissions intensity has decreased over the last two
reporting years. Source(s): [see Supplemental Data] INDICATOR 2C. R&D INTO LOW-CARBON TECHNOLOGIES Score: (3) Rationale: OMV has publicly committed to investing in low-carbon technologies
as part of OMV Sustainability Strategy 2025, but the company’s R&D
364

OMV
expenses are only partially broken down by technology. For example, though OMV repeatedly highlights it’s ReOil research project (i.e., recycling plastics into valuable synthetic crude for fuels and petrochemical applications), it does not disclose the financial resources the company has committed solely to ReOil or similar low-carbon technologies.
Source(s): “OMV has clustered its innovation activities in the following
areas: Future Mobility, Circular Plastics Economy, Sustainable Refinery, Innovative Petrochemicals, Digitalization, and Optimized Drilling, Production, and Reserves. The Group’s research and development (R&D) expenses increased from EUR 33 mn in 2017 to EUR 40 mn in 2018. Out of total R&D expenses in 2018, EUR 7.9 mn (or 20%) were directed to the areas of Co-Processing, ReOil, advanced fuels, hydrogen mobility, and other activities in the Downstream business segment.” (OMV.SR, p. 57)
“OMV intends to allocate significant resources to the implementation of the Sustainability Strategy 2025. For example, up to EUR 500 mn will be invested in innovative energy solutions such as ReOil and Co-Processing.” (OMV.SR, p. 12)
“The current focus on research and development activities continues to improve recovery rates and the lifetimes of mature fields and enable highly efficient exploration of oil and gas fields even in challenging environments.” (OMV.IR, p. 70)
INDICATOR 2D. USE OF AN INTERNAL PRICE ON CARBON Score: (2) Rationale: OMV uses an internal price on carbon and explains generally how it
is employed, but the company does not disclose the price. Source(s): “Already in 2015, we also introduced an internal carbon price to
test our investment decisions. Using the carbon price we run sensitivity analyses of project financials with increased operating expenses (OPEX) from carbon costs. The internal carbon price allows us to factor in the hypothetical carbon costs into investment estimates and the engineering designs of the projects.
365

OMV
Such analyses protect the value of our new investments under future scenarios with increased carbon costs and increase business resilience to potential changes in climate-related taxes or trading schemes. It also increases the transparency of additional economic incentives for carbon emissions reduction initiatives.” (OMV.SR, p. 48)
CRITERION 3 – IS CLIMATE SCIENCE INTEGRAL TO THE GOVERNANCE AND OVERSIGHT OF THE COMPANY? INDICATOR 3A. DELINEATION OF RISKS AND RISK MANAGEMENT PROCEDURES RELATED TO CLIMATE CHANGE INDICATOR 3AI. REGULATORY RISKS Score: (3) Rationale: OMV pinpoints a few existing and proposed climate change-related
laws and regulations and identifies effects particular to the company (e.g., legislation covering offshore operations in Romania, IMO regulations relating to heavy fuel oil yields), but in aggregate the company’s analysis is not comprehensive.
Source(s): “In the top-down approach, the relevant central corporate units
identify the following risks and opportunities, and analyze their potential impact on OMV’s business. Risks: Current and emerging regulations in line with international public-sector initiatives such as the Paris Agreement and their subsequent transposition into national law in the countries in which OMV operates, resulting in limits on GHG emissions by the energy industry.” (OMV.SR, p. 47)
“We follow political and regulatory initiatives (both at EU and national levels) in our areas of interest, including energy, environment, climate change, trade, and others. OMV has a dedicated department for Public Affairs activities. We are fully in line with all reporting obligations on national and EU level and we are fully compliant with all transparency requirements.” (OMV.SR, p. 75)
366
OMV
“Risks related to the EU Emissions Trading System are separately recorded and aggregated for the Group as a whole. Furthermore, OMV is monitoring emerging regulations related to climate change and decarbonization in all operating countries...The OMV Group is exposed to a wide range of health, safety, security, and environmental risks that could result in significant losses.” (OMV.IR, p. 267)
“New legislation covering offshore operations came into force on November 17, 2018, providing the regulatory framework for offshore projects in the Romanian section of the Black Sea. This current legislative environment does not provide the necessary prerequisites for a multi-billion investment decision. OMV Petrom remains keen to see the Black Sea developed and will therefore continue the dialogue with the authorities to understand the way forward.” (OMV.IR, p. 67)
“OMV is well positioned to capture the benefits of marine fuel market changes in 2020 from new IMO regulations. OMV’s site flexibility allows to further reduce its low heavy fuel oil yield of 2% with no additional investments by 2020. Western refineries will become heavy fuel oil free by 2025.” (OMV.IR, p. 45)
INDICATOR 3AII. PHYSICAL RISKS Score: (3) Rationale: OMV acknowledges climate change as contributor to the physical
risks facing its business, but does not identify how and to what degree its operations might be impacted.
Source(s): “The integrity of OMV’s operating facilities, loss prevention, proactive
risk management, and acting on climate change mitigation are essential for reaching OMV’s HSSE vision of “ZERO harm – NO losses.” (OMV.IR, p. 51)
“We see climate change to have a limited impact on our business plans and objectives in the medium term. However, management
367
OMV
pays close attention to climate-change-related long-term risks and opportunities and takes these into account in strategic decision-making...In the bottom-up approach, climate-change-related risks are identified using the standardized methodology of the EWRM process. The following risks are taken into account on this basis: (1) Acute physical risks related to the impact of extreme weather conditions and other climate-change-related events on the business performance and continuity of OMV’s operational assets and (2) Chronic physical risks related to the availability of operational resources, such as water, following changes in precipitation patterns and extreme variability in weather patterns, rising mean temperatures, or rising sea levels.” (OMV.SR, p. 47)
INDICATOR 3AIII. MARKET AND OTHER INDIRECT RISKS AND OPPORTUNITIES Score: (3) Rationale: OMV details how it might be affected by market and other indirect
risks and opportunities related to climate change, particularly demand-side risks, but does not provide corresponding financial analysis.
Source(s): “In the top-down approach, the relevant central corporate units
identify the following risks and opportunities, and analyze their potential impact on OMV’s business...Reputation risks stemming from the increasing number of investors who include a company’s environmental and social responsibility as a high-weight criterion in their investment decision-making process, whether for reasons of internal policy or due to regulatory pressure for public investment transparency regarding sustainability issues...Development of innovative technologies that represent a commercially viable and environmentally friendly alternative to fossil fuels, and subsequent evaluation of the opportunities for increasing OMV’s capacity to produce high-value non-fuel products, such as petrochemicals...Increasing demand for natural gas as the cleanest fossil fuel in terms of GHG emissions and the subsequent opportunity to leverage OMV’s strong presence in the natural gas sector by increasing its share in the
368

OMV
Company’s portfolio relative to oil-based products.” (OMV.SR, p. 47)
“...European demand for natural gas will likely overtake demand for oil in relative and absolute terms by 2030, while regional hydrocarbon extraction is expected to decline. This caused us to focus on preparing the required infrastructure for natural gas delivery and capturing a greater share of natural gas supply. We launched the production of the mainly gas-based assets of Aasta Hansteen in Norway and continued negotiations for a direct interest in the Russian gas extraction business of the Achimov 4A / 5A gas formation. Additionally, OMV extended the Russian natural gas supply contracts until 2040.” (OMV.SR, p. 51)
“Economic development will drive the significant increase in the demand for petrochemical products. In Asia alone, it is set to see a 70% rise by 2030.30 OMV’s Downstream refining segment can maximize on this opportunity by providing the feedstock for high-quality petrochemical products... By 2025, OMV plans to increase the production of petrochemicals in Europe by 12%, bringing it to 2.8 mn t. Increasing the share of petrochemicals in our product portfolio will reduce its carbon intensity, as the use of petrochemical products does not produce CO2 emissions in contrast to the use of combusted fuel products.” (OMV.SR, p. 53)
“OMV recognizes provisions for litigations if these are more likely than not to result in obligations. Management is of the opinion that litigations, to the extent not covered by provisions or insurance, will not materially affect the Group’s financial position.” (OMV.IR, p. 185)
INDICATOR 3B. DELEGATION OF BOARD MEMBERS AND/OR COMMITTEES WITH EXPLICIT OVERSIGHT OF CLIMATE CHANGE POLICY Score: (1) Rationale: OMV does not have a formal board committee dedicated to climate
change-related governance.
369

OMV
Source(s): “Sustainability-related topics (including issues relating to climate change mitigation) are fully integrated into the overall governance structure of the Company. These topics have the same weight as any other business consideration and, following the Company’s responsible approach to business, are integrated into the daily operation and management processes of the Company...Each Group function reports directly to the Executive Board on the relevant social and environmental issues. They include reporting on progress in the implementation of sustainability strategy targets, presenting important events with regard to the material topics, and submitting for approval the implementation of sustainability initiatives.” (OMV.SR, p. 15)
“The Sustainability & Reporting department is part of Corporate Affairs and has a Group-wide coordination function. It is responsible for steering, providing advice on, and reporting on sustainability-related topics to internal and external stakeholders. Sustainability & Reporting steers and coordinates the development and the implementation of the Sustainability Strategy.” (OMV.SR, p. 16)
“The Executive Board reports to the Supervisory Board on a regular and ad-hoc basis...The Executive Board is the highest managing body of the Company. The Supervisory Board appoints members of the Executive Board, monitors and supervises its decisions, and advises the Executive Board on strategy development. The Executive Board approves the Sustainability Strategy as part of the Corporate Strategy 2025 and is accountable to the Supervisory Board for its implementation.” (OMV.SR, p. 16)
INDICATOR 3C. DOES THE COMPANY SUPPORT CLIMATE-RELATED SHAREHOLDER RESOLUTIONS? Score: (3) Rationale: OMV has not faced any climate-related shareholder resolutions put
forward by established networks of socially responsible investors.
370

OMV
Source(s): (see Ceres – Climate and Sustainability Shareholder Resolutions Database; SEC – Division of Corporate Finance 2019; SEC – Division of Corporate Finance 2018)
CRITERION 4 – WHAT ARE THE COMPANY’S AFFILIATIONS WITH THIRD PARTIES THAT SPREAD DISINFORMATION ON CLIMATE SCIENCE? INDICATOR 4A. THE AMERICAN LEGISLATIVE EXCHANGE COUNCIL (ALEC) Score: (3) Rationale: OMV is based in Austria and has no existing operations in the
association’s jurisdiction. Company not mentioned by Source Watch or DeSmogBlog as having ever been affiliated with association.
Source(s): (see Source Watch - ALEC; DeSmogBlog – ALEC) INDICATOR 4B. THE AMERICAN PETROLEUM INSTITUTE (API) Score: (3) Rationale: OMV is based in Austria and is neither in API’s current membership
list nor noted by DeSmogBlog as having ever been affiliated with association.
Source(s): (see API – Members; DeSmogBlog – API) INDICATOR 4C. THE NATIONAL ASSOCIATION OF MANUFACTURERS (NAM) Score: (3) Rationale: OMV is based in Austria and is neither in NAM’s current BOD list nor
noted by DeSmogBlog as having ever been affiliated with association.
Source(s): (see NAM – Board of Directors; DeSmogBlog – NAM)
371

OMV
INDICATOR 4D. THE WESTERN STATES PETROLEUM ASSOCIATION (WSPA) Score: N/A Rationale: OMV is based in Austria and has no operations in the association’s
jurisdiction, not mentioned by DeSmogBlog as having ever been affiliated with the association and is not listed as a corporate member on WSPA’s website.
Source(s): (see WSPA – Member Companies; DeSmogBlog – WSPA) INDICATOR 4E. AMERICAN FUEL AND PETROCHEMICAL MANUFACTURERS (AFPM) Score: (3) Rationale: OMV is based in Austria and is neither in AFPM’s current
membership list nor noted by DeSmogBlog as having ever been affiliated with association.
Source(s): (see AFPM – Membership Directory; DeSmogBlog – AFPM) CRITERION 5 – DOES THE COMPANY PUBLICLY SUPPORT THE NEED FOR CLIMATE POLICY AND REGULATIONS? INDICATOR 5A. REGULATIONS, CARBON TAX, EMISSIONS TRADING, RENEWABLE ENERGY, CCS, ETC. Score: (2) Rationale: OMV monitors political developments in the countries in which it
operates but has not publicly expressed support for specific proposed climate policies or regulations during the reporting period.
Source(s): “We follow political and regulatory initiatives (both at EU and
national levels) in our areas of interest, including energy,
372

OMV
environment, climate change, trade, and others. OMV has a dedicated department for Public Affairs activities.” (OMV.SR, p. 75)
“OMV is monitoring emerging regulations related to climate change and decarbonization in all operating countries.” (OMV.IR, p. 78)
INDICATOR 5B. PARIS AGREEMENT Score: (2) Rationale: OMV has released a general statement acknowledging the goals of
the Paris Agreement without specifically supporting the Agreement and its temperature targets.
Source(s): “OMV recognizes that climate change is one of the most
important global challenges. The responsibility for a solution is in the hands of the entire community and requires global action. OMV is committed to the goals of the Paris Climate Change Agreement and implements climate action measures. OMV aims to cover growing energy needs in a carbon-efficient manner.” (OMV.FPS1, p. 22; see also OMV.IR, p. 49)
“We recognize climate change as one of the most important global challenges today and acknowledge the goals set forth by the Paris Climate Change Agreement. We aim to find the right industrial-scale solutions for a lower-carbon world. Reducing emissions from operations is an important strategic target for OMV, demonstrating our commitment to this material sustainability topic. Our carbon efficiency agenda focuses on process optimization, energy efficiency, and delivering projects that reduce our direct GHG emissions.” (OMV.SR, p. 48)
CRITERION 6 – HAS THE COMPANY BEEN PUBLICLY TRANSPARENT ABOUT ITS POSITION, ACTIONS, AND AFFILIATIONS WITH REGARD TO CLIMATE SCIENCE AND CLIMATE CHANGE? INDICATOR 6A. WEBPAGE DEDICATED TO CLIMATE CHANGE
373

OMV
Score: (5) Rationale: OMV maintains a separate webpage on its website devoted to
climate change. Source(s): (see OMV.CWS1) INDICATOR 6B. STAND-ALONE SUSTAINABILITY REPORT WITH SPECIFIC REFERENCE TO CLIMATE CHANGE Score: (5) Rationale: OMV’s sustainability report is easily accessible through its website
and contains a section dedicated to climate change. Source(s): (see OMV.SR, p. 46) INDICATOR 6C. DISCLOSURE TO CDP Score: (5) Rationale: CDP website indicates “Submitted” from OMV for Climate Change
2019. Source(s): (see OMV.CDP.2) INDICATOR 6D. DISCLOSURE OF THIRD-PARTY RELATIONSHIPS AND LOBBYING ACTIVITIES Score: (5) Rationale: OMV discloses its affiliations with trade associations and lobbying
groups and the list in inclusive. Source(s): “OMV is member of a wide range of sector-specific associations
and initiatives. The full list of memberships can be found in the OMV Sustainability Report.” (OMV.CWS2; see also OMV.SR, p. 123)
INDICATOR 6E. REPORT ON CLIMATE RELATED RISK SCENARIOS
374

OMV
Score: (5) Rationale: In its public disclosures OMV details how it might be affected by a
2°C scenario, and has incorporated the various key findings from the IEA scenarios’ into its corporate strategy.
Source(s): “OMV aligns the boundaries and time horizons of its business
strategy with the foreseen short-, medium-, and long-term risks and impacts of climate-related policies and energy sector developments. Scenarios consistent with the goal of limiting the global temperature increase to no more than 2°C by reducing greenhouse gas emissions are of utmost importance for our strategic considerations as they imply fundamental changes to the current energy market. During the strategy review and planning processes, OMV has taken into account scenarios reflecting various aspects of potential economic, technological, and social developments and their implications for the energy market and, consequently, for our business. The results of our analysis have shown what impact different national and international emissions targets will have on the passenger and freight fleet in Europe and OMV core markets. This influenced OMV’s business objectives and strategy...OMV uses the International Energy Agency (IEA) New Policies (NP) Scenario as a reference for the future market framework, given that it incorporates current and announced (not yet fully realized) policies, targets, and plans. Based on the IEA NP Scenario, we forecasted the development of the oil and gas demand in Europe and in the OMV core markets until 2025. The results of the analysis show an expected increase in petrochemical and jet fuel production volumes and a decrease in gasoline, diesel, and heating and fuel oil volumes. In general, according to the IEA NP Scenario, the changing demand will lead to a less carbon-intensive fuel mix. The IEA 450 Scenario was used by OMV as a downside sensitivity option to determine how the existing and future OMV business portfolio would perform in such a business scenario. We continue to perform sensitivity analyses based on the IEA Sustainable Development Scenario, which incorporates the 450 Scenario, to determine OMV’s position relative to global and regional primary energy demands. The targets of our Corporate Strategy 2025 are developed in accordance
375

OMV
with the forecasted market developments up to 2025. As a result, the Corporate Strategy 2025 foresees an increase in the share of natural gas relative to oil in Upstream and a shift to higher-value-added products for industrial use, such as petrochemicals. The targets for the Sustainability Strategy are aligned with the production and operational targets of the Corporate Strategy(see OMV.SR, p. 48)
376

Pioneer Natural Resources
XXIV. Pioneer Natural Resources CRITERION 1 – WHAT IS THE COMPANY’S POSITION ON CLIMATE SCIENCE? INDICATOR 1A. CONSISTENTLY ACCURATE PUBLIC STATEMENTS ON CLIMATE SCIENCE AND THE CONSEQUENT NEED FOR SWIFT AND DEEP REDUCTIONS IN EMISSIONS FROM THE BURNING OF FOSSIL FUELS Score: (1) Rationale: Pioneer misrepresents climate science by suggesting that there is
not consensus among the scientific community with respect to global warming (e.g., “some scientists have concluded that increasing concentrations of GHGs in the Earth's atmosphere may produce climate changes that have significant physical effects”).
Source(s): “Climate change is an important priority for Pioneer and our
stakeholders. As such, our strategy is to manage our environmental footprint proactively and limit emissions of methane and other greenhouse gases from our operations. We are committed to working with industry and communities to address our impacts to the environment while ensuring the supply of sustainable, abundant and affordable energy.” (Pioneer.SR, p. 17)
“Finally, it should be noted that some scientists have concluded that increasing concentrations of GHGs in the Earth's atmosphere may produce climate changes that have significant physical effects, such as increased frequency and severity of storms, floods, droughts and other extreme climatic events.” (Pioneer.AR, p. 25)
CRITERION 2 – WHAT MEASURES IS THE COMPANY TAKING TO REDUCE ITS CARBON FOOTPRINT? INDICATOR 2A. GHG EMISSIONS TARGETS Score: (1)
377
Pioneer Natural Resources
Rationale: Pioneer has no plan (e.g., quantitative targets) for reducing GHG
emissions from its operations. Source(s): “In addition to Pioneer’s commitment to achieve compliance with
federal and state requirements, Pioneer goes beyond compliance by developing proactive strategies to reduce emissions through research, industry partnerships, operational best practices, and strategic planning.” (Pioneer.SR, p. 17)
“…asset divestitures have contributed to emission reductions; however, proactive efforts to control emissions and improve operations, such as our efforts in LDAR, vapor recovery unit (VRU) utilization, and emissions research have also contributed to these reductions.” (Pioneer.SR, p. 18)
“While Pioneer’s future growth strategy focuses mainly on low-cost oil production in the Midland Basin, we are also a sizable producer of associated natural gas.” (Pioneer.SR, p. 17)
INDICATOR 2B. GHG EMISSIONS REDUCTIONS Score: (5) Rationale: Company’s GHG emissions intensity has decreased in each of the
last two reporting years and has decreased by over 20% over the last two reporting years.
Source(s): [see Supplemental Data] INDICATOR 2C. R&D INTO LOW-CARBON TECHNOLOGIES Score: (1) Rationale: Pioneer’s disclosures do not reference in-house and/or third-party
R&D into low-carbon technologies, rather only industry partnerships focused on GHG mitigation technology.
Source(s):
378

Pioneer Natural Resources
INDICATOR 2D. USE OF AN INTERNAL PRICE ON CARBON Score: (1) Rationale: Pioneer’s disclosures do not reference company use of an internal
price on carbon in its investment decisions. Source(s): CRITERION 3 – IS CLIMATE SCIENCE INTEGRAL TO THE GOVERNANCE AND OVERSIGHT OF THE COMPANY? INDICATOR 3A. DELINEATION OF RISKS AND RISK MANAGEMENT PROCEDURES RELATED TO CLIMATE CHANGE INDICATOR 3AI. REGULATORY RISKS Score: (3) Rationale: Pioneer pinpoints specific existing and proposed climate change-
related laws and regulations that may impact it (e.g., the EPA's 2016 rule and the BLM's 2016 rule), but does not detail effects particular to the company.
Source(s): “Climate change continues to attract considerable public, political
and scientific attention. As a result, numerous proposals have been made, and are likely to continue to be made, at the international, national, regional and state levels of government to monitor and limit emissions of GHGs. These efforts have included consideration of cap-and-trade programs, carbon taxes, GHG reporting and tracking programs, and regulations that directly limit GHG emissions from certain sources. The adoption and implementation of any federal or state legislation or regulations that require reporting of GHGs or otherwise restrict emissions of GHGs from the Company's equipment and operations could require the Company to incur increased operating costs, such as costs to purchase and operate emissions control systems, acquire emissions allowances or comply with new regulatory or reporting requirements.” (Pioneer.AR, p. 12)
379

Pioneer Natural Resources
“...numerous proposals have been made and are likely to continue to be made at the international, national, regional and state levels of government to monitor and limit emissions of GHGs. These efforts have included consideration of cap-and-trade programs, carbon taxes, GHG reporting and tracking programs, and regulations that directly limit GHG emissions from certain sources. In November 2018, the Trump Administration released the second volume of the fourth interagency National Climate Assessment that is issued pursuant to federal law. The current version outlines potentially severe climate-related impairments for the United States' environment, economy and public health, which are indicated to worsen over time unless significant measures are taken to, among other things, reduce GHG emissions. This assessment could serve as a basis for increasing governmental pursuit of policies to restrict GHG emissions.” (Pioneer.AR, p. 24)
“In the U.S., no comprehensive climate change legislation has been implemented at the federal level to date. In the absence of federal GHG-limiting legislation, the EPA has determined that GHG emissions present a danger to public health and the environment and has adopted rules under authority of the CAA that, among other things, establish certain permits and construction reviews designed to allow operations while ensuring the prevention of significant deterioration in air quality by GHG emissions from large stationary sources that are already potential sources of significant pollutant emissions. The Company could become subject to these permitting requirements and be required to install "best available control technology" to limit emissions of GHGs from any new or significantly modified facilities that the Company may seek to construct or modify in the future. The EPA has also adopted rules requiring the reporting of GHG emissions on an annual basis from specified GHG emission sources in the United States, including certain oil and gas production facilities, which include certain of the Company's facilities. Federal agencies also have begun directly regulating emissions of methane, a GHG, from oil and gas operations. In 2016, the EPA published a final rule establishing New Source Performance Standards, known as Subpart OOOOa, that require certain new, modified or reconstructed facilities in the oil and gas sector to reduce certain methane gas and
380

Pioneer Natural Resources
volatile organic compound emissions. These Subpart OOOOa standards expand previously issued New Source Performance Standards, published by the EPA in 2012 and known as Subpart OOOO, by using certain equipment-specific emissions control practices. However, in June 2017, the EPA published a proposed rule to stay certain portions of these Subpart OOOOa standards for two years and revisit the entirety of the 2016 standard, but the rule has not been finalized. Rather, in February 2018, the EPA finalized amendments to certain requirements of the 2016 final rule and, in September 2018, the agency proposed additional amendments that included rescission or revision of certain requirements such as fugitive emission monitoring frequency. Furthermore, in 2016, the BLM published a final rule to reduce methane emissions by regulating venting, flaring and leaking from oil and gas operations on public lands. However, in September 2018, the BLM published a final rule that rescinds most of the requirements in the 2016 final rule and codifies the BLM's prior approach to venting and flaring. The rescission of the requirements in the 2016 final rule is being challenged in federal court...Compliance with the EPA's 2016 rule and the BLM's 2016 rule, to the extent either are in effect, or with any future federal or state methane regulations could, among other things, require installation of new emission controls on some of the Company's equipment and significantly increase the Company's capital expenditures and operating costs.” (Pioneer.AR, pp. 24-25)
INDICATOR 3AII. PHYSICAL RISKS Score: (3) Rationale: Pioneer acknowledges the physical risks climate change poses to its
facilities, but does not elaborate on how the company in particular might be impacted.
Source(s): “...the potential physical effects of climate change could disrupt
the Company's production and cause it to incur significant costs" for additional information.” (Pioneer.AR, p. 12)
381

Pioneer Natural Resources
“Climate change legislation and regulatory initiatives restricting emissions of GHGs could result in increased operating costs and reduced demand for the oil, NGLs and gas the Company produces, while the potential physical effects of climate change could disrupt the Company's production and cause it to incur significant costs in preparing for or responding to those effects.” (Pioneer.AR, p. 24)
“Finally, it should be noted that some scientists have concluded that increasing concentrations of GHGs in the Earth's atmosphere may produce climate changes that have significant physical effects, such as increased frequency and severity of storms, floods, droughts and other extreme climatic events. If any such effects were to occur, they could have a material adverse effect on the Company's exploration and production operations.” (Pioneer.AR, p. 25)
INDICATOR 3AIII. MARKET AND OTHER INDIRECT RISKS AND OPPORTUNITIES Score: (2) Rationale: Pioneer’s disclosures offer minimal discussion regarding the indirect
impacts climate change might have on its industry, and even less on how the company in particular might be impacted.
Source(s): “...new legislation or regulatory programs as well as conservation
plans and efforts undertaken in response to climate change could also materially and adversely affect demand for the oil, NGLs and gas the Company produces and lower the value of its reserves. Depending on the severity of any such limitations, the effect on the value of the Company's reserves could be material.” (Pioneer.AR, p. 25)
“Non-governmental activism directed at shifting funding away from companies with energy-related assets could result in limitations or restrictions on certain sources of funding for the energy sector. In addition, increasing attention to the risks of climate change has resulted in an increased possibility of lawsuits brought by public and private entities against oil and gas companies in
382

Pioneer Natural Resources
connection with their GHG emissions. Should the Company be targeted by any such litigation, it may incur substantial costs, which, to the extent that societal pressures or political or other factors are involved, could be imposed without regard to the causation of or contribution to the asserted damage, or to other mitigating factors.” (Pioneer.AR, p. 25)
INDICATOR 3B. DELEGATION OF BOARD MEMBERS AND/OR COMMITTEES WITH EXPLICIT OVERSIGHT OF CLIMATE CHANGE POLICY Score: (1) Rationale: Pioneer's Health, Safety and Environment Committee (HSE)
maintains broad oversight of company health, safety and environmental practices, including the company’s “sustainable development program,” but that committee’s charter does not explicitly reference oversight of climate change-related issues.
Source(s): “The purpose of the [Health, Safety and Environmental]
Committee is to assist the Board with its responsibilities relating to oversight for Pioneer’s health, safety and environmental practices and to monitor management’s efforts in creating a culture of safety and environmental protection. The Committee will primarily fulfill this responsibility by carrying out the activities enumerated in Section V of this Charter, and will perform such other functions as the Board may assign from time to time.” (Pioneer.CCC1, p. 1)
“The Committee’s principal responsibility is one of oversight. The Company’s management is responsible for ensuring that the Company complies with laws, regulations and Company policies and procedures relating to health, safety and environmental protection. Without limiting the generality of the foregoing statements, the Committee shall have authority, including budgetary and fiscal authority, and is entrusted with the responsibility, to perform the following actions...Receive reports from management regarding, and provide oversight for, the health, safety and environmental aspects of the Company’s sustainable development program.” (Pioneer.CCC1, p. 2-3)
383

Pioneer Natural Resources
INDICATOR 3C. DOES THE COMPANY SUPPORT CLIMATE-RELATED SHAREHOLDER RESOLUTIONS? Score: (3) Rationale: Pioneer has not faced any climate-related shareholder resolutions
put forward by established networks of socially responsible investors during the reporting period.
Source(s): (see Pioneer.PRXY1; Pioneer.PRXY2; Ceres – Climate and
Sustainability Shareholder Resolutions Database; SEC – Division of Corporate Finance 2019; SEC – Division of Corporate Finance 2018)
CRITERION 4 – WHAT ARE THE COMPANY’S AFFILIATIONS WITH THIRD PARTIES THAT SPREAD DISINFORMATION ON CLIMATE SCIENCE? INDICATOR 4A. THE AMERICAN LEGISLATIVE EXCHANGE COUNCIL (ALEC) Score: (2) Rationale: Pioneer was a "Trustee" level sponsor of the 2014 ALEC Annual
Conference, and there is no evidence to suggest that it is no longer affiliated with the group.
Source(s): (see Source Watch - ALEC; see also DeSmogBlog – ALEC) INDICATOR 4B. THE AMERICAN PETROLEUM INSTITUTE (API) Score: (2) Rationale: Though Pioneer is not listed as a current member on API’s website,
the company has disclosed nearly $1m in contributions made to API during 2018.
Source(s): (see API – Members; Pioneer.FPS1; see also DeSmogBlog – API)
384

Pioneer Natural Resources
INDICATOR 4C. THE NATIONAL ASSOCIATION OF MANUFACTURERS (NAM) Score: (3) Rationale: Pioneer is not listed on NAM’s website as a current member of
association’s executive committee, and the company is not mentioned by DeSmogBlog as having ever been affiliated with association.
Source(s): (see NAM – Board of Directors; DeSmogBlog – NAM) INDICATOR 4D. THE WESTERN STATES PETROLEUM ASSOCIATION (WSPA) Score: N/A Rationale: Pioneer is not listed as a corporate member on WSPA's website, and
the company has no operations in the association’s jurisdiction. Source(s): (see WSPA – Member Companies; DeSmogBlog – WSPA) INDICATOR 4E. AMERICAN FUEL AND PETROCHEMICAL MANUFACTURERS (AFPM) Score: (3) Rationale: Pioneer is not listed as a current member on AFPM’s website, and
company is not mentioned by DeSmogBlog as having ever been affiliated with association.
Source(s): (see AFPM – Membership Directory; DeSmogBlog – AFPM) CRITERION 5 – DOES THE COMPANY PUBLICLY SUPPORT THE NEED FOR CLIMATE POLICY AND REGULATIONS? INDICATOR 5A. REGULATIONS, CARBON TAX, EMISSIONS TRADING, RENEWABLE ENERGY, CCS, ETC.
385

Pioneer Natural Resources
Score: (2) Rationale: Pioneer has not publicly expressed support for climate policies and
regulations in its relevant jurisdictions during the reporting period. Source(s): INDICATOR 5B. PARIS AGREEMENT Score: (1) Rationale: Pioneer’s disclosures do not reference the Paris Climate Agreement
apart from broadly mentioning the circumstances surrounding its adoption.
Source(s): “Internationally, in late 2015, the U.S. joined other countries in
entering into a United Nations sponsored non-binding agreement in Paris, France for nations to limit their GHG emissions through individually determined emission reduction goals every five years beginning in 2020. In August 2017, the U.S. State Department informed the United Nations of the United States' intention to withdraw from this Paris agreement, which provides for a four-year exit process beginning when it took effect in November 2016.” (Pioneer.10K, p. 25)
CRITERION 6 – HAS THE COMPANY BEEN PUBLICLY TRANSPARENT ABOUT ITS POSITION, ACTIONS, AND AFFILIATIONS WITH REGARD TO CLIMATE SCIENCE AND CLIMATE CHANGE? INDICATOR 6A. WEBPAGE DEDICATED TO CLIMATE CHANGE Score: (1) Rationale: Pioneer’s website includes a webpage entitled “Environmental,” but
that page does not mention climate change and serves largely as a gateway for your company’s sustainability report.
Source(s): (see Pioneer.CWS1)
386

Pioneer Natural Resources
INDICATOR 6B. STAND-ALONE SUSTAINABILITY REPORT WITH SPECIFIC REFERENCE TO CLIMATE CHANGE Score: (5) Rationale: Pioneer produces a sustainability report that is easily accessible from
its website and has a section dedicated to climate change (i.e., “Climate Change Statement and Restricted Carbon Scenario Analysis”).
Source(s): (see Pioneer.SR, p. 17) INDICATOR 6C. DISCLOSURE TO CDP Score: (1) Rationale: CDP website indicates “No response” from Pioneer for Climate
Change 2018. Source(s): (see Pioneer.CDP1) INDICATOR 6D. DISCLOSURE OF THIRD-PARTY RELATIONSHIPS AND LOBBYING ACTIVITIES Score: (5) Rationale: Pioneer discloses payments made to trade and business
associations in excess of $25,000 in its sustainability report and discloses “organizations we have alliances with” and payments made to trade and business associations which have used portion of the company’s dues and other payments for lobbying or political expenditures on its website.
Source(s): “All Pioneer lobbying and advocacy expenditures are made in the
United States. In 2018, Pioneer made significant financial contributions (more than $25,000) to the following trade and business associations, which we considered strategic partners...” (Pioneer.SR, p. 51; see also Pioneer.FPS1; Pioneer.FPS2)
387

Pioneer Natural Resources
INDICATOR 6E. REPORT ON CLIMATE RELATED RISK SCENARIOS Score: (5) Rationale: Though Pioneer’s 2°C scenario analysis relies heavily on third-party
estimates it identifies at least some company-specific strengths under low-carbon scenarios (e.g., Pioneer’s current capital allocation).
Source(s): “In addition to our efforts to limit emissions from our activities, we
assess the potential impact of growing alternative energy sources and climate change policy on global fossil fuel demand and Pioneer long-term business prospects…As part of Pioneer’s strategic planning process, management prepares and reviews with the Board of Directors long-term scenarios under varying assumptions to stress test the company’s business outlook. When evaluating possible future business scenarios, Pioneer considers several published energy forecasts and analyses by leading official agencies such as, but not limited to: The U.S. Energy Information Administration’s (EIA) International Energy Outlook, The Organization of Petroleum Exporting Countries’ (OPEC) World Oil Outlook, and The International Energy Agency’s (IEA) World Energy Outlook. Pioneer also engages private commodity market analysis firms to provide the company with industry and economic projections, which are utilized to test management’s assumptions of future business conditions.” (Pioneer.SR, p. 26; see also Pioneer.CO2R)
388

Repsol S.A.
XXV. Repsol S. A. CRITERION 1 – WHAT IS THE COMPANY’S POSITION ON CLIMATE SCIENCE? INDICATOR 1A. CONSISTENTLY ACCURATE PUBLIC STATEMENTS ON CLIMATE SCIENCE AND THE CONSEQUENT NEED FOR SWIFT AND DEEP REDUCTIONS IN EMISSIONS FROM THE BURNING OF FOSSIL FUELS Score: (3) Rationale: Repsol consistently recognizes the scientific evidence of climate
change and the necessity of transitioning to a new energy model, but does not affirm the need for swift and deep reductions in emissions from the burning of fossil fuels.
Source(s): “Repsol shares the concern of society about the effect human activity
is having on the climate and is firmly committed to the aspiration of limiting to 2oC the increase in the average global temperature of the planet, compared to pre-industrial levels, by the end of the century. As a signatory of the Paris Pledge for Action, Repsol supports the Paris Agreement and works to be an active part of the solution to climate change. Accordingly, Repsol will reinforce its strategy to reduce its carbon footprint, enabling us to reduce CO2 emissions by 2.1 million tons in 2020, compared to 2014 levels, with 85% of this objective achieved in 2018, and set even more ambitious objectives for 2025.” (Repsol.IR, Integrated Management Report, p. 3)
“...the fight against climate change introduces a paradigm shift that we call the energy transition. Having safe, affordable and clean energy is key to the development of our society and these factors must be taken into account in order to carry out a structured energy transition toward a lower carbon intensity that mitigates climate change. All of us, companies, public administrations and final consumers, must collaborate to tackle a challenge of this scale. At Repsol, we share society’s concern about the effects that human action causes on the climate and we work every day to be part of the solution. We are convinced that a new energy model based on innovation and technology is necessary
389

Repsol S.A.
and we are committed to an energy transition toward a low- emissions future. This transition will take decades and will require different technologies that are still emerging today, themselves not exempt of uncertainties surrounding their pace of evolution and use.” (Repsol.FPS1, p. 4)
“Oil and gas will continue to play a key role in the future, overcoming the double challenge of ensuring the well-being demanded by a growing number of people around the world and, at the same time, making possible the ambition set out in the Paris Agreement...The Oil & Gas sector will therefore be a key player in the transition toward a low-emissions future, increasing the efficiency of its operations, reducing its direct GHG emissions and evolving toward a lower carbon intensity energy mix, with a greater presence of natural gas and commitment to new forms of energy according to its strategies. The sector’s strong focus on innovation and technology will be key to playing a leading role in the energy transition and being part of the solution in the fight against climate change.” (Repsol.FPS1, p. 14)
“Repsol has the ambition to reduce its carbon intensity (t CO2 /GJ), in line with the International Energy Agency's Sustainable Development (SD) scenario, IEA (reduction from 40% to 2040), without forgetting that at the same time it must provide the energy that society needs for its development and well-being. (Repsol.FPS2, p. 22)
CRITERION 2 – WHAT MEASURES IS THE COMPANY TAKING TO REDUCE ITS CARBON FOOTPRINT? INDICATOR 2A. GHG EMISSIONS TARGETS Score: (3) Rationale: Repsol’s near-term GHG emission reduction plan is not science-
based, and the company’s long-term ambition to further reduce its emissions is not a formal target.
390

Repsol S.A.
Source(s): “Repsol has the ambition to reduce its carbon intensity (t CO2 /GJ), in line with the International Energy Agency's Sustainable Development (SD) scenario, IEA (reduction from 40% to 2040), without forgetting that at the same time it must provide the energy that society needs for its development and well-being.” (Repsol.FPS2, p. 22)
“Repsol’s commitment to sustainability has been constant over the years. It was the first company in the Oil & Gas sector to support the Kyoto Protocol and to communicate its ambition to reduce its carbon intensity by 40% by 2040.” (Repsol.FPS1, p. 9)
“The objective is to make progress with energy transition and to reduce emissions by Repsol’s operations and products, in line with the company’s commitment to the fight against climate change that it adopted at the Paris Conference of Parties (COP21). Repsol’s target for 2020 is to reduce its carbon intensity by 3% and CO2 emissions by 2.1 million tons.” (Repsol.IR, Integrated Management Report, p. 20)
“GHG emissions reduction Plan: The main commitment to climate change is reflected in the goal of reducing 2.1 million tons of CO2 equivalent by the end of the 2014-2020 period. In 2018, Repsol is continuously improving and taking actions that avoided the emission of 309.8 kt of CO2e, which means that since 2014, a reduction of nearly 85% of the target set for the entire period has been met. Repsol has established a new emission reduction target of 3 million tons of CO2e for the 2018-2025 period. This plan is a continuation of the 2014-2020 plan, although it is even more ambitious. The new target broadens the scope of action, which in the past has focused on energy efficiency measures, and is based on the following levers: (1) Reduction of methane emissions in Upstream, (2) Reduction of routine flared gas in Upstream, (3) Energy efficiency both in Upstream and Downstream and (4) Low carbon technologies and renewable energies.” (Repsol.IR, Integrated Management Report, p. 67)
“Our commitment is evident with the objective of reducing 2.1 Mt of2 eq emissions at the end of the 2014-2020 period, an objective that the Company has just extended to a new 2018-
391

Repsol S.A.
2025 Plan for the reduction of 3 Mt of CO2 eq emissions. At the same time, we have defined reduction targets to 2025 for methane emissions and for torch gas burning.” (Repsol.FPS2, p. 21)
“Reduction of carbon intensity: Repsol has defined a long-term carbon intensity indicator in terms of tCO2/GJ, which gages the company's commitment to providing society with the energy it demands (GJ) with the lowest possible emissions (tCO2). Repsol intends to reduce its carbon intensity (tCO2/GJ) in alignment with the International Energy Agency- IEA's Sustainable Development scenario (a 40% reduction by 2040), without forsaking the fact that it must simultaneously supply the energy society needs for its development and welfare. In order to demonstrate its commitment in the short run, the Company has also established a 3% carbon intensity reduction target by the year 2020. Reduction of methane emissions: Convinced of the importance of the role of natural gas in energy transition, Repsol has undertaken the objective of reducing methane emissions in its operated assets by 25% by the year 2025.” (Repsol.IR, Integrated Management Report, p. 68; see also Repsol.FPS2, p. 23)
INDICATOR 2B. GHG EMISSIONS REDUCTIONS Score: (4) Rationale: Company’s GHG emissions intensity has decreased over the last two
reporting years. Source(s): [see Supplemental Data] INDICATOR 2C. R&D INTO LOW-CARBON TECHNOLOGIES Score: (5) Rationale: Repsol has publicly committed to increase funding R&D in low-
carbon technologies and discloses both its expected future low-carbon R&D expenses, allocated by technology, and corporate venturing activity.
392

Repsol S.A.
Source(s): “2022 Objectives: Double investment in technology initiatives (40% of total spend on internal R&D projects) in line with the axes of the Sustainability Model, focusing on reducing greenhouse gas emissions, reducing environmental impacts on soils and water, the circular economy, new materials and green chemicals, and the generation and distribution of renewable electricity...Maintain a percentage investment in start-ups of over 80%, aligned with advanced mobility, the circular economy, new materials and green chemicals, generation and distribution of renewable electricity, digital technologies applied to E&P and reliability of operations, of total investment in 2019-2022...Deploy the digitalization program to all areas of the Company to promote new digital solutions that lead to efficient and sustainable power generation, optimize processes and satisfy the new ways of consuming energy.” (Repsol.FPS2, p. 26)
“Repsol Corporate Venturing aims to quicken the pace of incorporation of technologies and innovative business models in Company practices through an investment fund which will be used to buy into start-ups offering solutions of advanced mobility, energy diversification, new materials, the Circular Economy, the reliability of our operations or digital technologies applied to exploration and production. The Corporate Venturing operating model focuses on those 6 areas in order to complement Repsol's internal R+D capacities by bringing in external innovation. This is carried out by five-year funds investing in Start-ups. For the 2016-2020 fund, Repsol has committed to making a contribution of €85 million. In 2018, the fund had [€19] million invested. It currently holds over ten stakes and joint development projects in the fields defined in the model.” (Repsol.IR, Integrated Management Report, p. 91)
“Repsol Energy Ventures has a shareholding in the American company Principle Power Inc. This company owns a patent for semi-submersible floating structures for offshore wind generation...The Windfloat Atlantic project (three wind turbines with a total power of 25 MW) on the Portuguese coast is also in the construction phase...The contributions made by Repsol this project in 2018 amounted to €1.5 million, and the project is scheduled to
393

Repsol S.A.
commence operation toward the end of 2019.” (Repsol.IR, Integrated Management Report, p. 127)
“Between now and 2020 we will invest €12,500 million to increase oil and gas production and to improve key Downstream assets, clearly implementing international expansion in several businesses in this area. Another of the objectives set in the strategic plan 2018-2020 is to continue to make advances with the energy transition. We have therefore established a roadmap with ambitious objectives based on the development of low-emission business operations, in which we plan on investing €2,500 million between now and 2020.” (Repsol.IR, Integrated Management Report, p. 3)
“The new strategy for technology and corporate Venturing was approved in June with the objective of contributing to the Group’s results and sustainability. In the Technology area a focus has been on projects to reduce energy intensity and CO2 emissions, as well as on advanced mobility.” (Repsol.IR, Integrated Management Report, p. 8)
“Major development work is also ongoing on low-carbon intensity processes, and on obtaining advanced biofuels with a low carbon footprint from vegetable waste in projects such as ReWofuel. Some mention should also be made of development in the SUN2HY project to obtain H2 with a low carbon footprint using artificial photosynthesis processes. Following the initial lab pilots, in July 2018 Enagás was brought on board as a partner in the value chain to accelerate development of the production of hydrogen, using solar energy as the main source.” (Repsol.IR, Integrated Management Report, p. 90)
“A new area has also been created, known as Energy transition, to develop critical technologies in the new distributed-generation model: Energy Management System (EMS) and Virtual Asset Management (VAM).” (Repsol.IR, Integrated Management Report, p. 91)
394

Repsol S.A.
“Digitalization is now a reality in Repsol, with more than 130 digital initiatives underway and more than €90 million invested.” (Repsol.IR, Integrated Management Report, p. 92)
INDICATOR 2D. USE OF AN INTERNAL PRICE ON CARBON Score: (4) Rationale: Repsol has disclosed the internal price on carbon it uses when
evaluating all new investments and describes generally how it is employed.
Source(s): “We believe that a carbon price must be set for all productive
sectors worldwide as a key factor in policies to combat climate change. In this way, each ton of CO2 will come with a price for everyone, from industry to end consumers. This would have a knock-on effect on their actions, make them aware of the problem, and change their habits towards a more efficient model of consumption and production. The effect would be further strengthened with clear and transparent information on the costs and the repercussion on all those involved. Some advantages of carbon pricing are: (1) It offers a way to mitigate climate change at a lower cost for society; (2) It promotes innovative technologies that are compatible with the 2ºC scenario; (3) It gives companies an incentive to reduce their emissions by including the price in the final cost of all their products. Based on the above, at Repsol we have established internal carbon pricing that we apply to all of our new investments. We have established the following prices: US$ 25t/CO2 in 2018 and US$ 40t/CO2 from 2025 onwards…Internal carbon pricing enables us to: (1) Assess and make decisions about our current and future investments; (2) Ensure that the impact of our activities on climate change is monitored; (3) Determine how climate policies affect our investments; (4) Promote an energy-efficient design in the projects we undertake from the very beginning. (Repsol.CWS1)
“Carbon pricing is a critical element of climate policies aimed at carrying out the transition to a low-emissions future. Accordingly, for investment decision-making in new projects investments, Repsol has established an initial internal carbon price of $25/t
395

Repsol S.A.
CO2, with the aim of attaining $40/t CO2 in 2025.” (Repsol.IR, Integrated Management Report, p. 65)
CRITERION 3 – IS CLIMATE SCIENCE INTEGRAL TO THE GOVERNANCE AND OVERSIGHT OF THE COMPANY? INDICATOR 3A. DELINEATION OF RISKS AND RISK MANAGEMENT PROCEDURES RELATED TO CLIMATE CHANGE INDICATOR 3AI. REGULATORY RISKS Score: (4) Rationale: Repsol offers a detailed analysis of existing and proposed climate
change-related regulations and laws and their possible effects on the company, including potential financial impacts.
Source(s): “In 2019, the Downstream business aims to consolidate the good
performance of recent years and create new opportunities for growth and the creation of value. The main objectives are:...at the refining facilities, a global overhaul must be carried out in order to be prepared to maximize their profitability in the new regulatory scenario set by the International Maritime Organization (IMO) on fuel specifications for maritime transport.” (Repsol.IR, Integrated Management Report, p. 106)
“In Europe, the regulation concerning the carbon allowances market, the EU Emissions Trading System Directive (EU ETS) entered Phase III on January 1, 2013. This phase, which ends in 2020, marks the end of the generic allocation of carbon emission allowances, where some emissions, such as those related to electricity generation, will no longer benefit from free allocations, while others will be significantly reduced. The 2014 update to the EUETS Directive confirmed that refining activity in Europe was one of the sectors exposed to "Carbon Leakage" and would therefore continue to benefit from the free allocation of carbon allowances, partially covering its deficits. The provisions movements recognized in respect of carbon emission allowances
396

Repsol S.A.
used in 2018 and 2017 is as follows: During 2018 and 2017, the companies comprising the consolidation scope recognized emission allowances allocated free of charge under the Spanish National Allocation plan equivalent to 8 million tons of CO2, initially measured at €63 and €51 million, respectively (see Note 11). The net cost of carbon management amounted to 44 million euros in 2018 and 17 million euros in 2017.” (Repsol.FPS3, p. 82)
“The activities of Repsol, S.A. and its subsidiaries are subject to extensive regulation, whose key aspects are described below...Spain currently has a legislation which implements a liberalization of the Oil Industry, an example of which is the Hydrocarbons Sector Law 34/1998 of October 7 (“LSH”), which has been amended by several legislative acts. Law 2/2011, of March 4, on Sustainable Economy, modified the Hydrocarbons Sector Law, establishing binding guidelines for energy planning under criteria designed to contribute to the creation of a safe, costeffective, economically sustainable, and environmentallyfriendly energy system.” (Repsol.FPS3, pp. 100-101)
“In the Canadian provinces of British Columbia, Alberta and Saskatchewan where the majority of the Company’s exploration and production interests in Canada lie, the provincial governments own the majority of the subsurface mineral rights to crude oil and natural gas...In addition to the provincial regulations, the Canadian Federal Government has announced, as part of the PanCanadian Framework on Clean Growth and Climate Change, the possibility of provinces applying further increases to the price of carbon to $50 CDN per ton by 2022.” (Repsol.FPS3, p. 104)
“The short-medium term strategy is influenced by climate change issues that are more closely related to competitiveness (energy and CO2 costs), and by the regulatory framework of its activities. Repsol operates in areas with strict legislative requirements for energy and carbon (approximately 65% of our direct emissions of CO2 come from its units in Europe, the US and Canada). Pursuant to the Paris Agreement, countries' commitments will have a significant impact on climate policies. More specifically, the following
397

Repsol S.A.
legislative risks on the current business are worthy of note... In Europe, the 2020 and 2030 Energy and Climate packages, include a number of key directives, notably the Directive that regulates the Emissions Trading System (EU-ETS), the Energy Efficiency Directive and the Renewable Energies Directive. Specifically, the EU-ETS scheme affects our refineries and chemical facilities in Europe; their emissions are subject to carbon pricing on the European market. To mitigate these impacts, Repsol is reducing its CO2 emissions through energy efficiency actions, which allowed to reduce 4.9 million tons of GHG emissions in the 2006-2018 period. In this regard, Repsol has issued a green bond of €500 million applied to refinancing in the 2014-2020 period and financing in the 2017-2022 period for energy efficiency projects in its Refining and Chemical business units in Europe...Regulations on the Promotion of clean and efficient energy in road transport vehicles sets a specific average emissions target for the fleet of vehicles marketed by automotive companies. In particular, light vehicles have to reduce their emissions to 95 gr of CO2/km by 2020. Thus, Repsol has invested in its Refining business in order to have an advanced scheme in terms of complexity and flexibility to enable it to compete in changing scenarios of adaptation to future fuel demand scenarios de combustibles. In addition, the Company also identifies opportunities, supports projects and implements initiatives in renewable energy for transport, biofuels or use of automotive LPG, among others. Outside Europe, and in Canada specifically, it is important to consider the implementation of the Pan-Canadian Framework on Clean Growth and Climate Change, in which the federal government has set a carbon price pathway that will reach CAD$50/ton in 2022.” (Repsol.IR, Integrated Management Report, pp. 63-64)
“In the medium to long term, legislative developments on an international level (EU energy and climate roadmap for 2050, Sustainable finance: Action Plan of the European Commission for a greener and cleaner economy, and national contributions of other countries to the Paris Agreement) and local level (draft Climate Change and Energy Transition bill in Spain) will gradually be transposed in future legislative packages over the years. With regard to Spain, the draft bill sets the targets of reducing by 2030 the
398

Repsol S.A.
greenhouse gas emissions of the entire Spanish economy by at least 20% compared to 1990; achieving penetration of renewable source energy in final energy consumption of 35%; achieving by 2030 an electricity system with at least 70% of generated based on renewable source energy and improve energy efficiency by reducing the consumption of primary energy by at least 35% compared to the baseline pursuant to EU regulations., It also contains a proposal to prohibit from the year 2040, the registration and sale in Spain of cars and light commercial vehicles with direct CO2 emissions. Repsol advocates staying aligned with the targets set by the EU and adopting cost-efficient measures and maintaining technology neutrality in order to successfully tackle the energy transition. Repsol's strategy is focused on boosting the Company's resilience to these regulatory, frameworks, adapting its products and services to the evolution of the use of different energy sources to mitigate the impact of climate change. Carbon pricing is a critical element of climate policies aimed at carrying out the transition to a low-emissions future. Accordingly, for investment decision-making in new projects investments, Repsol has established an initial internal carbon price of $25/t CO2, with the aim of attaining $40/t CO2 in 2025.” (Repsol.IR, Integrated Management Report, pp. 64
“The energy industry and the Group’s activity is heavily regulated. The current regulatory framework affects aspects such as the environment, competition, taxation, industrial safety and IT security, among others. Any changes that may be made to the applicable standards or any deviations in their strict observance, or their interpretation, may adversely affect the business, results and financial position of the Repsol Group. In particular, the regulatory areas that generate this exposure of the Group include tax regulation and interpretation, the wide variety of environmental and safety legislation (environmental quality standards for products, air emissions and climate change, energy efficiency, extractive technologies, water discharges, remediation of soil and groundwater and the generation, storage, transport, treatment and final disposal of waste materials), accounting and transparency regulations and regulations governing data protection.” (Repsol.IR, Integrated Management Report, p. 119)
399

Repsol S.A.
INDICATOR 3AII. PHYSICAL RISKS Score: (4) Rationale: Repsol acknowledges climate change as contributor to the physical
risks facing its business. Further, the company highlights the risk of water stress resulting from climate change and Repsol’s mitigation efforts.
Source(s): “Repsol is taking measures to minimize these risks (i.e., “emerging
risks and climate change“) as well as the magnitude of potential impacts of climate change in natural resources, facilities and in the climate phenomena to which we are exposed: drought, flooding, temperature change, etc. To cite just two examples, Repsol operates in areas that may be affected by the water stress, which would affect the correct operation of our facilities. Thus, Repsol is developing adaptation plans aimed to anticipate and mitigate such situations as much as possible.” (Repsol.IR, Integrated Management Report, pp. 66-67; see also Repsol.FPS1, p. 24)
“Repsol uses water at its industrial centers and also in exploration and production activities. Ensuring a supply of this scarce resource with the proper quality and in the proper quantities is critical for maintaining operations at all its facilities...For this reason Repsol is working on integral water management to minimize the risks and impacts associated with it. For years it has been managing the risks to which its industrial refineries and chemical plants and exploration and production operations have been exposed. These risks are attributable to internal factors (types of usages and consumptions of water in the various processes, discharge treatment and quality etc.) and also external factors (availability, quality and ecosystems which are water collection sources or discharge facilities, competence for water resources etc.). To appraise these risks, the company uses the “Repsol Water Tool” developed in 2012 and upgraded in 2018, to improve useability and update some methodological aspects. Identifying and analyzing risks associated with water serves as a guide to implement and prioritize courses of action and initiatives at Company facilities to move towards sustainable water management.” (Repsol.IR, Integrated Management Report, p. 85)
400

Repsol S.A.
“To help us in this task, we have an in-house developed tool — the Repsol Water Tool (RWT) — which gives us a comprehensive view of how we manage this resource, as well as the risks associated with each facility both internally (how this resource is used and consumed in different processes, treatment and quality of discharge, etc.) and externally (availability, quality, and ecosystems that provide us with water or that are affected by discharge, competition for the water resource, etc.)...With its results, our experts identify the aspects to be improved and design specific action plans for each installation, focusing on three lines of work: improving our understanding of the environment and of how water is used, efficient management of water resources, and improving water treatment technologies. The goals and steps included in the action plans are designed considering both the local environment and facility-specific aspects.” (Repsol.CWS2)
INDICATOR 3AIII. MARKET AND OTHER INDIRECT RISKS AND OPPORTUNITIES Score: (2) Rationale: Repsol details how it might be affected by market and other indirect
climate-related risks and opportunities, including reputational concerns and shifting consumer behavior, but offers limited accompanying financial analysis. Further, Repsol has not specifically discussed recent high-profile climate litigation in which it is a defendant (i.e., County of San Mateo v. Chevron Corp.).
Source(s): “Repsol anticipates large trends, such as the increase in demand
for electricity and the key role of natural gas in the energy transition (Repsol has an Upstream gas portfolio of around 63% of production and 70% of reserves).” (Repsol.IR, Integrated Management Report, p. 63; see also Repsol.FPS2, p. 22)
“The manner of consuming energy will change over the coming years, representing evolution in the industry driven by technology and digitalization. By updating its Plan, Repsol is anticipating large trends, such as the increase in demand for electricity and the key role of gas in the energy transition and will develop new
401

Repsol S.A.
capacities and establish a profitable position as a long-term operator in this segment.” (Repsol.IR, Integrated Management Report, p. 20)
“The main emerging risks and climate change risks identified are as follows: Changes in the end use of energy that entail a reduction in demand for products supplied by the Company due either to the natural dynamic of the markets or driven by regulation. Causes for this phenomenon include energy savings and efficiency initiatives throughout the value chain of the energy sector, the electrification of the vehicle fleet, users’ preferences for innovative forms of mobility and so on...A shift in consumer behavior could result in a decrease in demand for automotive and industrial fuels. To mitigate this effect and anticipate such changes, Repsol is investing in projects of innovation and technology...” (Repsol.IR, Integrated Management Report, pp. 66-67)
“Fundraising to finance the development of certain energy projects, derived from the position that the financial sector or the investor may adopt in relation to the energy sector. Repsol has issued a 500 million-euro green bond applied to energy efficiency projects at its refining and chemical facilities in Europe and has a large base of ESG (Environmental, Social and Governance) investors among its shareholders.” (Repsol.FPS1, p. 25)
“Changes in the end use of energy, either as a result of natural market dynamics, those driven by regulation or by a greater awareness of society of climate change. Repsol has a wide-ranging mobility offer that includes alternative fuels such as AutoGas and high-octane gasolines, incorporates sustainable biofuels into its products, leads in recharging for electric mobility in Spain and participates in the carsharing initiative WiBLE with hybrid vehicles.” (Repsol.FPS1, p. 25)
“Repsol has updated the materiality study carried out in 2017, which reflects the significance of economic, social, environmental and corporate governance issues that are considered to have a high impact and importance both for the Company and for its stakeholders....in 2018 external sources (through desk research) have been incorporated into the materiality
402

Repsol S.A.
study to complete the qualitative analysis begun in 2017, such as trend and reputation analyses based on information in the media and sustainability studies and publications from the leading international organizations.” (Repsol.IR, Integrated Management Report, p. 121)
INDICATOR 3B. DELEGATION OF BOARD MEMBERS AND/OR COMMITTEES WITH EXPLICIT OVERSIGHT OF CLIMATE CHANGE POLICY Score: (1) Rationale: Repsol’s Integrated Report is inconsistent with respect to the explicit
climate change-related corporate governance of its board-level Executive Committee and Sustainability Committee, making it difficult to ascertain which committee, if any, maintains such oversight.
Source(s): “The Board of Directors and the Sustainability Committee play a
critical role in the Sustainability Model. The Board approves, at the proposal of the Sustainability Committee, the Company’s strategy and policy in sustainability and corporate governance, and the Committee, among other duties, knows and orients the policies, objectives and guidelines of environment, social and safety matters. In addition, the Company’s maintains an ongoing dialogue on social, corporate governance and environmental matters (ESG — Environmental, Social and Governance) with different stakeholders.” (Repsol.IR, Integrated Management Report, p. 61)
“...the Sustainability Committee's duties include analyzing the expectations of the Company's stakeholders and reporting them to the Board, and orienting and monitoring the Company's climate change objectives, action plans and practices. Strategic decisions on climate change and lines of action are set at the highest executive level. The Executive Committee (EC) has direct responsibility in the management of matters related to climate change. The EC also approves the multi-year objectives and annual targets for reduction of greenhouse gases (GHG). At least twice a year, or as often as necessary, the EC and the Sustainability Committee review information on execution of the climate change
403

Repsol S.A.
strategy and CO2 emission.” (Repsol.IR, Integrated Management Report, pp. 62-63)
“This Committee (i.e., the Sustainability Committee) is an internal body for information and advisory purposes created by the Board of Directors, without executive functions, but with information, advisory and proposal powers within its area of activity. The Committee consists of no fewer than three Directors, the majority of which must be Non-Executive. Its members are appointed by the Board of Directors, taking into account the expertise, skills and experience of the Directors and the duties of the Committee... The duties of this Committee include, among others, being familiar with and shaping the Group’s policies, objectives and guidelines on environmental, safety and social responsibility matters, analyzing and reporting to the Board of Directors on the expectations of the Company’s various stakeholders and supervising the relations with them, proposing to the Board of Directors the approval of a Sustainability Policy and reviewing and evaluating the management and control systems for non-financial risks.” (Repsol.IR, Annual Corporate Governance Report, p. 65)
INDICATOR 3C. DOES THE COMPANY SUPPORT CLIMATE-RELATED SHAREHOLDER RESOLUTIONS? Score: (3) Rationale: Repsol has not faced any climate-related shareholder resolutions put
forward by established networks of socially responsible investors. Source(s): (see Ceres – Climate and Sustainability Shareholder Resolutions
Database; SEC – Division of Corporate Finance 2019; SEC – Division of Corporate Finance 2018)
CRITERION 4 – WHAT ARE THE COMPANY’S AFFILIATIONS WITH THIRD PARTIES THAT SPREAD DISINFORMATION ON CLIMATE SCIENCE? INDICATOR 4A. THE AMERICAN LEGISLATIVE EXCHANGE COUNCIL (ALEC)
404

Repsol S.A.
Score: (3) Rationale: Repsol is based in Spain and is not cited by Source Watch or
DeSmogBlog as having ever been affiliated with association. Source(s): (see Source Watch - ALEC; DeSmogBlog – ALEC) INDICATOR 4B. THE AMERICAN PETROLEUM INSTITUTE (API) Score: (2) Rationale: Repsol is a current member of API association and has not taken
concrete steps to distance itself from group’s climate change deception.
Source(s): (see API – Members; see also DeSmogBlog – API) INDICATOR 4C. THE NATIONAL ASSOCIATION OF MANUFACTURERS (NAM) Score: (3) Rationale: Repsol is based in Spain and is neither in NAM’s current BOD list
nor noted by DeSmogBlog as having ever been affiliated with association.
Source(s): (see NAM – Board of Directors; DeSmogBlog – NAM) INDICATOR 4D. THE WESTERN STATES PETROLEUM ASSOCIATION (WSPA) Score: N/A Rationale: Repsol is based in Spain and has no operations in the association’s
jurisdiction. Further, Repsol is neither mentioned by DeSmogBlog as having ever been affiliated with the association nor listed as a corporate member on WSPA’s website.
Source(s): (see WSPA – Member Companies; DeSmogBlog – WSPA)
405
Repsol S.A.
INDICATOR 4E. AMERICAN FUEL AND PETROCHEMICAL MANUFACTURERS (AFPM) Score: (3) Rationale: Repsol is based in Spain and is neither in AFPM’s current
membership list nor noted by DeSmogBlog as having ever been affiliated with association.
Source(s): (see AFPM – Membership Directory; DeSmogBlog – AFPM) CRITERION 5 – DOES THE COMPANY PUBLICLY SUPPORT THE NEED FOR CLIMATE POLICY AND REGULATIONS? INDICATOR 5A. REGULATIONS, CARBON TAX, EMISSIONS TRADING, RENEWABLE ENERGY, CCS, ETC. Score: (4) Rationale: Repsol has publicly advocated for Spain to stay aligned with
emissions targets set by the EU (i.e., EU Energy and Climate Roadmap for 2050), but not explicitly advocated against the “Climate Change and Energy Transition” bill in Spain.
Source(s): “In the medium to long term, legislative developments on an
international level (EU energy and climate roadmap for 2050, Sustainable finance: Action Plan of the European Commission for a greener and cleaner economy, and national contributions of other countries to the Paris Agreement) and local level (draft Climate Change and Energy Transition bill in Spain) will gradually be transposed in future legislative packages over the years. With regard to Spain, the draft bill sets the targets of reducing by 2030 the greenhouse gas emissions of the entire Spanish economy by at least 20% compared to 1990; achieving penetration of renewable source energy in final energy consumption of 35%; achieving by 2030 an electricity system with at least 70% of generated based on renewable source energy and improve energy efficiency by reducing the consumption of primary energy by at least 35% compared to the
406

Repsol S.A.
baseline pursuant to EU regulations. It also contains a proposal to prohibit from the year 2040, the registration and sale in Spain of cars and light commercial vehicles with direct CO2 emissions. Repsol advocates staying aligned with the targets set by the EU and adopting cost-efficient measures and maintaining technology neutrality in order to successfully tackle the energy transition.” (Repsol.IR, Integrated Management Report, p. 64)
“Carbon pricing is a critical element of climate policies aimed at carrying out the transition to a low-emissions future.” (Repsol.IR, Integrated Management Report, p. 65)
“In Europe and in Spain, the Company has taken part in debates and public consultations, with the aim of working with the institutions and society in the development of different legislative initiatives.” (Repsol.IR, Integrated Management Report, p. 147)
“Repsol supports the 2030 Agenda for Sustainable Development of the United Nations and uses the 17 Sustainable Development Goals (SDGs) as a reference when defining its Sustainability priorities...For Repsol, the most efficient manner of contributing to the 2030 Agenda is by collaborating with other public and private institutions to exchange knowledge and technologies. To do this, the Company sees it as vital to align efforts within the framework of the SDG 17 (alliances to achieve goals).” (Repsol.IR, Integrated Management Report, pp. 59-60)
INDICATOR 5B. PARIS AGREEMENT Score: (4) Rationale: Repsol has explicitly endorsed the Paris Agreement’s goal of
keeping global temperature increase well below 2°C and pursuing efforts to limit it to 1.5°C and consistently supported policies and regulations to advance the Agreement and its temperature targets (e.g., EU Energy and Climate Roadmap for 2050).
Source(s): “We share society's concern about the effect that human activity is
having on the climate and we are firmly committed to the
407

Repsol S.A.
aspiration of limiting the increase in the planet's global average temperature to 2oC at the end of this century with regard to pre-industrial levels.” (Repsol.FPS2, p. 21)
“Repsol shares society's concerns regarding the effect of human activity on the climate. The Company is firmly committed to the ambition of limiting the average global temperature rise below 2°C above pre-industrial levels by the end of the century. As a signatory of the Paris Pledge for Action document, Repsol supports the agreement, and works towards being part of the climate change solution...This transition to a low-emissions future requires a holistic approach that means considering the costs and maturity of the emerging and available technologies without prejudging which of them will ultimately succeed. There are many possible paths towards a low-emissions future, in which Repsol has identified three common elements: enhanced energy efficiency and energy savings; emission reduction in the generation of electricity, where natural gas will be a key player, and the deployment of low-emission technologies in final sectors.” (Repsol.IR, Integrated Management Report, p. 63)
“Following the Paris Agreement, countries' commitments under their respective National Determined Contributions (NDCs) will have a significant impact on the development of new climate policies. As a signatory of the “Paris Pledge for Action” document, Repsol supports the agreement, and works toward being part of the climate change solution.” (Repsol.FPS3, p. 103)
“Following the invitations by the European Parliament and the European Council, the Commission's vision for a climate-neutral future covers nearly all EU policies and is in line with the Paris Agreement objective to keep the global temperature increase to well below 2°C and pursue efforts to keep it to 1.5°C.” (Repsol.TPS1)
CRITERION 6 – HAS THE COMPANY BEEN PUBLICLY TRANSPARENT ABOUT ITS POSITION, ACTIONS, AND AFFILIATIONS WITH REGARD TO CLIMATE SCIENCE AND CLIMATE CHANGE? INDICATOR 6A. WEBPAGE DEDICATED TO CLIMATE CHANGE
408

Repsol S.A.
Score: (5) Rationale: Repsol maintains a separate webpage on its website devoted to
climate change. Source(s): (see Respol.CWS3) INDICATOR 6B. STAND-ALONE SUSTAINABILITY REPORT WITH SPECIFIC REFERENCE TO CLIMATE CHANGE Score: (5) Rationale: Repsol’s detailed Global Sustainability Plan is similar to a tradiational
sustainability report, is easily accessible through its website, and contains a section dedicated to climate change.
Source(s): (see Repsol.FPS2, p. 21) INDICATOR 6C. DISCLOSURE TO CDP Score: (5) Rationale: CDP website indicates “Submitted” from Repsol for Climate Change
2018. Source(s): (see Repsol.CDP2) INDICATOR 6D. DISCLOSURE OF THIRD-PARTY RELATIONSHIPS AND LOBBYING ACTIVITIES Score: (3) Rationale: Repsol notes that “... We are also members of several organizations
and international initiatives,” and lists several associations with which it partners (e.g., IPIECA), but does not state whether the relatively short list includes all of the firm’s memberships.
Source(s): “In 2018, Repsol made no political contributions. Accordingly,
there were no breaches of the Code of Ethics and Conduct Code.
409

Repsol S.A.
Repsol is in favor of lobbying activity being carried out in a transparent manner.” (Repsol.IR, Integrated Management Report, p. 147)
“We are also members of several organizations and international initiatives: (1) International Association of Oil & Gas Producers (IOGP), a global forum for improving safety, the environment, and social performance by sharing knowledge and best practices with other members. (2) The Oil Spill Response Joint Industry Project, a collaboration between IOGP and ipieca, the global oil and gas industry association for environmental and social issues. (3) Concawe, the European oil companies organization for the protection of the environment and health, which leads research in matters related to air quality, emissions, soil contamination, waste, and product safety. (4) Center for Chemical Process Safety (CCPS), the association that works to improve process safety by developing practical guides for the chemical, pharmaceutical, and oil industries. (5) International Process Safety Group (IPSG), the global chemicals and petrochemicals sector network belonging to the Institution of Chemical Engineers (IChemE) which promotes best safety practices in processes focused on preventing and mitigating the risk of industrial accidents. (6) American Petroleum Institute (API), a business association that defends best practices in the US oil and natural gas industry.” (Repsol.CWS3)
INDICATOR 6E. REPORT ON CLIMATE RELATED RISK SCENARIOS Score: (5) Rationale: Repsol produced and published an analysis on what a 2°C or lower
increase in global temperature would mean for its businesses, strategies, and financial planning.
Source(s): “Long-term energy sector outlook: On a global scale,
hydrocarbons contribute more than half of the primary energy consumed. Specifically, 32% of global primary energy consumption is derived from oil, which is the most commonly used energy source. No major changes are expected in the coming years. According to the International Energy Agency (IEA), in the baseline scenario of its 2018 World Energy Outlook , oil will contract by 4 percentage
410

Repsol S.A.
points in the 2040 energy matrix compared to 2017, while natural gas will account for 25% of the estimated total energy demand of 17,715 million tons of oil equivalent.” (Repsol.IR, Integrated Management Report, p. 105)
“Repsol works with scenarios that are compatible with a 2oC future in order to identify new risks and opportunities in this transition and analyze the key levers and technologies that will contribute to achieving a low-emission future for the company...Repsol believes that these new scenarios offer a significant opportunity for innovation and investment in low GHG emission solutions. To this end, Repsol collaborates with different companies both directly and through international associations, including the Oil and Gas Climate Initiative (OGCI). As a result of these analyses, in the short and medium-term, Repsol establishes emission reduction plans to reduce carbon and energy intensity through the efficiency of its operations. The company recently extended its 2014-2020 plan for a new 2018-2025 plan, including, amongst other factors, units energy integration projects, process optimization and efficient facility operation. At the same time, objectives have been defined to reduce methane emissions and flared gas by 2025. Future scenarios foresee a significant replacement of coal by natural gas for power generation, as it is a fuel with lower CO2 emissions per energy unit, and offers greater performance in the generation of electricity. The shift from coal to natural gas fuels offers a major opportunity to achieve large-scale reductions of CO2 in a cost-efficient manner: that is, at a lower cost for society, where a structured transition to a low-emissions future is the most efficient way forward. Aligned with the energy transition, Repsol has taken the decision to enter into new ways of low carbon business such as renewable generation and the commercialization of natural gas and electricity, performing the first investments and setting growth targets by 2025. It also invests in sustainable mobility and contributes to the reduction of emissions through production and R&D into biofuels and advanced fuels. In the medium and long-term, CO2 Capture, Use and Storage (CCUS) is a factor to be taken into account in the CO2 emissions reduction policy in Repsol’s value chain. Repsol participates in R&D and demonstration projects of these technologies that may allow its
411

Repsol S.A.
industrial application on a large scale in the future. It also explores new technological ways of "zero emissions" or even negative emissions, such as the so-called "e-fuels", "green hydrogen", or natural carbon sinks.” (Repsol.IR, Integrated Management Report, p. 65)
412

Royal Dutch Shell
XXVI. Royal Dutch Shell CRITERION 1 – WHAT IS THE COMPANY’S POSITION ON CLIMATE SCIENCE? INDICATOR 1A. CONSISTENTLY ACCURATE PUBLIC STATEMENTS ON CLIMATE SCIENCE AND THE CONSEQUENT NEED FOR SWIFT AND DEEP REDUCTIONS IN EMISSIONS FROM THE BURNING OF FOSSIL FUELS Score: (4) Rationale: Shell notes the dual challenge of climate change (i.e., providing
affordable energy while protecting the environment), but does not present the two priorities as mutually exclusive. Further, Shell consistently acknowledges the scientific evidence of climate change and affirms the consequent need for swift and deep reductions in emissions from the burning of fossil fuels. Still, Shell does not highlight the urgency and importance of achieving global net-zero CO2 emissions to keep temperature rise well below two degrees Celsius and limit risks to society and ecosystems.
Source(s): “Shell agrees with the Intergovernmental Panel on Climate
Change (IPCC) 1.5°C special report, which states that in order to limit warming to 1.5°C above pre-industrial levels, the world economy would need to transform in a number of complex and connected ways. Meeting this challenge would require an even more rapid escalation in the scale and pace of change in the coming decades than was foreseen in the Paris Agreement.” (Shell.IR, p. 71)
“Society faces a dual challenge: how to transition to a low-carbon energy future to manage the risks of climate change, while also extending the economic and social benefits of energy to everyone on the planet. This is an ambition that requires changes in the way energy is produced, used and made accessible to more people while drastically cutting emissions. We believe that the need to reduce GHG emissions, which are largely caused by burning fossil fuels, will transform the energy system in this century. This transformation will generate both challenges and opportunities for our existing and future portfolio.” (Shell.IR, p. 71)
413

Royal Dutch Shell
Shell is determined to help provide more and cleaner energy solutions. We fully support the Paris Agreement and we are driving our business strategy in the context of the energy transition and climate-related risks and opportunities.” (Shell.SR, p. 44)
“We need to go faster than society to achieve this ambition. Our starting point is higher than society’s because our portfolio has a different energy mix compared to the overall energy system. We do not have the large quantities of nuclear power, hydro power, wind, solar and large-scale primary biomass that the global energy system has.” (Shell.SR, p. 46)
CRITERION 2 – WHAT MEASURES IS THE COMPANY TAKING TO REDUCE ITS CARBON FOOTPRINT? INDICATOR 2A. GHG EMISSIONS TARGETS Score: (2) Rationale: Shell’s Net Carbon Footprint plan includes an “ambition” to set a
long-term science-based emissions reduction target for its Scope 1-3 emissions in line with a 2°C scenario, but at present the company’s plan only include modest near-term targets.
Source(s): “In 2017, Shell announced a long-term ambition to reduce the Net
Carbon Footprint of the energy products we sell - a carbon intensity measure that takes into account their full life-cycle emissions including customers’ emissions when they use these products - in step with society’s drive to meet the goal of the Paris Agreement on climate change. In December 2018, we also announced our intention to set short-term Net Carbon Footprint targets. In early 2019, we decided to set a Net Carbon Footprint target for 2021 of 2-3% lower than our 2016 Net Carbon Footprint of 79 grams of carbon-dioxide (CO2) equivalent per megajoule. We have linked nearer-term Net Carbon Footprint targets to executive remuneration.” (Shell.SR, p. 46)
414

Royal Dutch Shell
“Building public trust this year also involved strengthening our public commitment to the Paris Agreement on climate change. In our joint statement with institutional investors on behalf of Climate Action 100+, we have committed to operationalise our ambition of around 50% Net Carbon Footprint reduction by 2050, through the setting of short-term targets which will be linked to executive remuneration. Further, as part of our transparency efforts within remuneration, we have published our CEO Pay Ratio, in line with new legislation. Although this is not required until 2020, we were keen to publish this information early.” (Shell.IR, p. 95)
“Within this framework, our strategy is to keep increasing the share of low-carbon energy products in our portfolio, such as natural gas, biofuels, electricity and hydrogen. We will also develop carbon sinks. By broadening our focus to the full life-cycle emissions from the energy products that we sell to our customers, instead of solely on our operational emissions, we believe we will be better aligned with societal need and growing customer demand for more energy with lower life-cycle greenhouse gas emissions.” (Shell.SR, p. 46)
“To ensure our Net Carbon Footprint ambition is consistent with the Paris Agreement, we looked into how the world could achieve its goal. We published the results of this work as our Sky scenario. Using Sky, alongside work done by the International Energy Agency, we laid out a possible path that society could take towards Paris while also allowing enough energy use to enable living standards to rise. Our Net Carbon Footprint ambition is consistent with that path... Instead of solely focusing on our operational emissions, we will seek to reduce our Net Carbon Footprint mainly by increasing the proportion of lower-carbon products in the mix we sell to our customers. That means fewer products that come with higher levels of greenhouse gas emissions, and more and more products with lower-or-no emissions. We will also sell more natural gas. This is because it is a flexible partner to renewable energy sources and can be used to generate electricity with around half the greenhouse gases of coal. A further example is electricity produced using wind turbines or solar panels. Others are low-carbon biofuels and hydrogen.” (Shell.CWS1)
415

Royal Dutch Shell
“Although we have no immediate plans to move to a net-zero emissions portfolio, in November of 2017, we announced our ambition to reduce our net carbon footprint in accordance with society’s implementation of the Paris Agreement’s goal of holding global average temperature to well below 2°C above pre-industrial levels. Accordingly, assuming society aligns itself with the Paris Agreement’s goals, we aim to reduce our net carbon footprint, which includes not only our direct and indirect carbon emissions, associated with producing the energy products which we sell, but also our customers’ emissions from their use of the energy products that we sell, by 20% in 2035 and by 50% in 2050.” (Shell.CO2R1, p. 98)
INDICATOR 2B. GHG EMISSIONS REDUCTIONS Score: (3) Rationale: Company’s GHG emissions intensity has increased in one of the last
two reporting years but decreased as a whole over the last two reporting years.
Source(s): [see Supplemental Data] INDICATOR 2C. R&D INTO LOW-CARBON TECHNOLOGIES Score: (3) Rationale: Shell discloses its high-level R&D expenditures, as well as the
investment plans of its New Energies division, but the company’s low-carbon R&D budget is not broken down by technology and not all existing investments are described using monetary figures.
Source(s): “In 2018, research and development expenses were $986
million, compared with $922 million in 2017, and $1,014 million in 2016.” (Shell.IR, p. 14)
“Our New Energies business explores emerging opportunities linked to the energy transition and invests in those where we believe sufficient value is available. New Energies is an emerging opportunity, in which we plan to invest on average $1-2 billion
416

Royal Dutch Shell
a year until 2020 as we look for commercial investments that build on our strengths in new and fast-growing segments of the energy industry. We focus on new fuels for transport, such as advanced biofuels, hydrogen and charging for battery-electric vehicles; and power, including from low-carbon sources such as wind and solar as well as natural gas. Alongside our work in new fuels and power, we are exploring how digital technologies can best support our activities and customers.” (Shell.IR, p. 74)
“In 2018, we started work on 260 R&D projects with universities. Many of these focus on areas crucial for low-carbon energy systems, such as biomass, renewable power and electrochemical batteries.” (Shell.SR, p. 62)
“In 2018, we announced a new programme that will help start-ups working on emerging clean-energy technologies to accelerate their path to market. Shell GameChanger Accelerator focuses on technologies related to long-term energy storage and power grid management. The programme works with the US Department of Energy’s National Renewable Energy Laboratory and has so far identified four companies to support.” (Shell.SR, p. 62; see also Shell.CWS2)
INDICATOR 2D. USE OF AN INTERNAL PRICE ON CARBON Score: (3) Rationale: Shell uses country-specific Nationally Determined Contributions
(NDCs) to account for carbon costs when making investment decisions, but the company’s disclosures are not specific about whether it uses its prior flat project screening value (PSV) of $40/tonne of GHG emissions for countries that have not yet developed NDCs.
Source(s): “Consistent with our desire to stay in step with society’s progress
toward the goals of the Paris Agreement, in 2018, we moved away from using a flat project screening value (PSV) of $40/tonne of GHG emissions, to country-specific estimates of future carbon costs. These estimates were developed using the current Nationally Determined Contributions (NDCs) submitted by countries as part of
417

Royal Dutch Shell
the Paris Agreement. Accordingly, we believe they more accurately reflect society’s current implementation of the Paris Agreement rather than a flat $40/tonne PSV. By 2050, our estimates for some countries increase to $85/tonne of GHG emissions” (Shell.IR, p. 73)
“...projects in the most GHG-exposed asset classes are benchmarked against GHG intensity targets that reflect standards sufficient to allow them to compete and prosper in a more GHG-constrained future. These processes can lead to projects being stopped, designs being changed, and potential GHG mitigation investments being identified, in preparation for when regulation would make these investments commercially compelling. Our approach continues to evolve and become more sophisticated to reflect our increasing understanding of the shifting policy landscape and the differing pace of energy transitions underway in different regions...The emissions of energy consumers from their use of Shell energy products are for a large part covered by these NDCs.” (Shell.IR, p. 73)
CRITERION 3 – IS CLIMATE SCIENCE INTEGRAL TO THE GOVERNANCE AND OVERSIGHT OF THE COMPANY? INDICATOR 3A. DELINEATION OF RISKS AND RISK MANAGEMENT PROCEDURES RELATED TO CLIMATE CHANGE INDICATOR 3AI. REGULATORY RISKS Score: (2) Rationale: Shell notes the general existence of risk associated with current or
proposed regulations and laws relating to climate change, offers a few examples, and briefly describes the possible impacts of climate-related regulations on the company, but that description lacks specificity or details.
Source(s): “We assess our portfolio decisions, including divestments and
investments, against potential impacts from the transition to lower-carbon energy. These include higher regulatory costs linked to carbon emissions and lower demand for oil and gas….The portfolio
418

Royal Dutch Shell
changes we are making reduce the risk of having assets that are uneconomic to operate, or oil and gas reserves that are uneconomic to produce because of changes in demand or CO2 regulations.” (Shell.CO2R2, p. 30)
“Rising climate change concerns have led and could lead to additional legal and/or regulatory measures which could result in project delays or cancellations, a decrease in demand for fossil fuels, potential litigation and additional compliance obligations. In December 2015, 195 nations adopted the Paris Agreement, which we fully support. The Paris Agreement aims to limit increases in global temperatures to well below two degrees Celsius. As a result, we expect continued and increased attention to climate change from all sectors of society. This attention has led, and we expect it to continue to lead, to additional regulations designed to reduce greenhouse gas (GHG) emissions...We expect that a growing share of our GHG emissions will be subject to regulation, resulting in increased compliance costs and operational restrictions...We also expect that GHG regulation, as well as emission reduction actions by customers, will continue to focus more on suppressing demand for fossil fuels, either through taxes, fees, incentives to promote the sale of electric vehicles or even through the future prohibition of sales of new diesel or gasoline vehicles. This could result in lower revenue and, in the long term, potential impairment of certain assets.” (Shell.IR, p. 16)
“Our operations are subject to extensive HSSE (i.e., health, safety, security and environment) regulatory requirements that often change and are likely to become more stringent over time. Governments could require operators to adjust their future production plans, as has been done in the Netherlands, affecting production and costs. We could incur significant additional costs in the future due to compliance with these requirements or as a result of violations of, or liabilities under, laws and regulations, such as fines, penalties, clean-up costs and third-party claims. Therefore, HSSE risks, should they materialise, could have a material adverse effect on our earnings, cash flows and financial condition.” (Shell.IR, p. 17)
419

Royal Dutch Shell
“The decline in costs of solar and wind generation, along with the electrification of the energy system, make the development of renewable energy resources increasingly attractive for society, and an attractive investment opportunity for Shell. However, regulatory uncertainty in some power markets could lead to uncertain long-term revenues. To avoid this, we are seeking to invest in projects that are commercially viable today. In addition, we will select the best technology option for each project, depending on the rapidly evolving technology landscape.” (Shell.CO2R2, p. 43)
INDICATOR 3AII. PHYSICAL RISKS Score: (3) Rationale: Despite explicitly recognizing climate change as a contributor to the
physical risks its businesses face and employing “a climate change risk management structure...which is supported by standards, policies and controls,” Shell offers few details about which of its operations are impacted, and to what degree.
Source(s): “...physical effects of climate change such as, but not limited to,
rise in temperature, sea-level rise and fluctuations in water levels could adversely impact both our operations and supply chains.” (Shell.IR, p. 16)
“Shell has a rigorous approach to understanding, managing and mitigating climate risks to its facilities. Shell also requires each business and function to monitor, communicate and report changes in the risk environment and the effectiveness of actions taken to manage identified risks on an ongoing basis. This is outlined in a toolkit for risk management including our Risk Management Manual and complementary guidance documents that cover specific aspects such as climate risk….Each Shell business unit needs to consider the acceptability of climate- related risks in their portfolios. To ensure that informed judgements are made, businesses senior managers present their current assessments of the likelihood of the climate-related risks discussed above materialising and their potential impact, along with summaries of current mitigation efforts underway within their business unit. Each risk is then
420

Royal Dutch Shell
categorised as either acceptable or as needing improvement.” (Shell.IR, pp. 75-76)
INDICATOR 3AIII. MARKET AND OTHER INDIRECT RISKS AND OPPORTUNITIES Score: (3) Rationale: Shell provides some examples of how it might be affected by market
risks and opportunities related to climate change (e.g., reputational harm, shifting consumer behavior), but offers limited analysis of their potential financial impacts for the company. Note that Shell does explicitly address recent high-profile climate-related litigation in which the company is a defendant.
Source(s): “By broadening our focus to the full life-cycle emissions from the
energy products that we sell to our customers, instead of solely on our operational emissions, we believe we will be better aligned with societal need and growing customer demand for more energy with lower life-cycle GHG emissions. Therefore, our strategy is to reduce our Net Carbon Footprint, mainly by increasing the proportion of lower-carbon products such as natural gas, biofuels, electricity and hydrogen in the mix of products we sell to our customers.” (Shell.IR, p. 77)
“We consider the resilience of our portfolio in the medium term by exploring potential ranges in oil prices, and their implications for Shell’s cash flows. To ensure that we challenge our thinking, these ranges go beyond the prices implied by our three main scenarios – Mountains, Oceans and Sky. In the longer term, after 2030, there is far more uncertainty. Here we use scenarios to consider how we could reshape Shell’s portfolio of products to meet the changing needs of society, depending on how the pace of transition develops.” (Shell.CO2R2, p. 27)
“We have demonstrated the strength of our integrated model. In the past three years, our Downstream business, which includes chemicals, marketing, and refining and trading, generated strong earnings. This helped offset the impact of the downturn in oil and gas prices on our Upstream and Integrated Gas businesses. It also
421

Royal Dutch Shell
demonstrated how each part of the energy system can be impacted differently by shifts in demand, supply and commodity prices.” (Shell.CO2R2, p. 29)
“Additionally, some groups are pressuring certain investors to divest their investments in fossil fuel companies. If this were to continue, it could have a material adverse effect on the price of our securities and our ability to access equity capital markets. The World Bank has also announced plans to stop financing upstream oil and gas projects in 2019. Similarly, according to press reports, other financial institutions also appear to be considering limiting their exposure to certain fossil fuel projects. Accordingly, our ability to use financing for future projects may be adversely impacted. This could also adversely impact our potential partners’ ability to finance their portion of costs, either through equity or debt.” (Shell.IR, p. 16)
“Our reputation is an important asset….Real or perceived failures of governance or regulatory compliance could harm our reputation. This could impact our licence to operate, damage our brand, reduce consumer demand for our branded products, harm our ability to secure new resources and contracts, and limit our ability to access capital markets and attract staff. Many other factors, including the materialisation of the risks discussed in several of the other risk factors, could negatively impact our reputation and could have a material adverse effect on our earnings, cash flows and financial condition.” (Shell.IR, p. 18)
“Further, in some countries, governments, regulators, organisations and individuals have filed lawsuits seeking to hold fossil fuel companies liable for costs associated with climate change. While we believe these lawsuits to be without merit, losing any of these lawsuits could have a material adverse effect on our earnings, cash flows and financial condition.” (Shell.IR, p. 16)
“In the USA, 12 lawsuits have been filed by several municipalities and one state against oil and gas companies, including Royal Dutch Shell plc. The plaintiffs seek damages for claimed harm to their public and private infrastructure from rising sea levels allegedly due to climate change caused by the
422
Royal Dutch Shell
defendants’ fossil fuel products. A similar suit has been filed by a crab fishing industry group claiming harm to their fisheries as a result of alleged ocean-related impacts of climate change. Management believes the outcome of these matters should be resolved in a manner favourable to Shell, however, there remains a high degree of uncertainty regarding the ultimate outcome of these lawsuits, as well as their potential effect on future operations, earnings, cash flows and Shell’s financial condition.” (Shell.IR, p. 212)
INDICATOR 3B. DELEGATION OF BOARD MEMBERS AND/OR COMMITTEES WITH EXPLICIT OVERSIGHT OF CLIMATE CHANGE POLICY Score: (1) Rationale: Though some of Shell’s board-level committees are tasked with
climate-related duties, the company has no board member or committee dedicated to climate change-related corporate governance.
Source(s): “The Board committees play an important role in assisting the Board
with regard to governance and management of climate change risks and opportunities...The role of the Corporate and Social Responsibility Committee (CSRC) is to review and advise the Board on Shell’s strategy, policies and performance in the areas of safety, environment, ethics and reputation. It regularly discusses the Company’s approach to combating climate change. In 2018, this included the energy transition, GHG emission targets (including advice to the Remuneration Committee), policy on methane, Shell’s Net Carbon Footprint and nature-based solutions….The Audit Committee has key responsibilities in assisting the Board in fulfilling its oversight responsibilities in relation to areas such as the effectiveness of the system of risk management and internal control. Any concerns regarding improvement needed are promptly reported to the Board.” (Shell.IR, p. 71)
“In December, Shell announced plans to set short-term targets for reducing the Net Carbon Footprint of the energy products it sells – a carbon intensity measure that includes our customers’ emissions when they use these products – and to link these targets to executive remuneration. This is an industry first. Shell’s Remuneration
423

Royal Dutch Shell
Committee will include a new performance condition linked to the transition to lower-carbon energy for the Long-term Incentive Plan grant starting in 2019, one year earlier than planned.” (Shell.IR, p. 9)
“A senior manager – the Executive Vice President for Safety and Environment – reporting directly to the Projects & Technology Director is accountable, among other things, for oversight of GHG issues. This manager s department includes the dedicated Group Carbon team, which is accountable for monitoring and examining the strategic implications of climate change for Shell and the impact of developments in governmental policy and regulation. The Group Carbon team is responsible for preparing proposed policy positions based on analysis within Shell and external input. The team also provides advice to Shell companies to ensure consistency in application of our core principles and policy tasks in interactions with policymakers. Reporting to the same manager is the HSSE & SP Assurance and Reporting team, which is accountable for the delivery of Shell’s non- financial reporting and for auditing the businesses performance against our HSSE & SP Control Framework requirements, including climate change risk management.” (Shell.IR, p. 72)
“The Royal Dutch Shell plc (the “Company”) Corporate and Social Responsibility Committee (the “Committee”) assists the Board of Directors of the Company (the “Board”) in reviewing the policies and conduct of the Shell Group of Companies with respect to the Shell General Business Principles (including Sustainable Development and the Health, Security, Safety, Environment and Social Performance (“HSSE&SP”) Policy), the Shell Code of Conduct and to major issues of public concern. The Committee also carries out certain oversight functions on behalf of the Board. (Shell.CCC1, p. 1)
INDICATOR 3C. DOES THE COMPANY SUPPORT CLIMATE-RELATED SHAREHOLDER RESOLUTIONS? Score: (3)
424

Royal Dutch Shell
Rationale: Follow This withdrew its 2019 filing asking Shell to, among other things, set concrete long-term targets aligned with the Paris Agreement, but not because of a commitment by Shell to take action on unresolved issues in the filing. Rather, Follow This withdrew its filing after “intensive discussions with the investors who have voted for our resolution in the past...to give Shell time.”
Source(s): “Although the intent of the resolution is to do something
meaningful, we are already doing exactly that. We are committed to reducing our own emissions as well as help our customers to reduce their emissions from the energy products we sell. We are acting in line with society as it moves towards the goal of the Paris agreement. And we are setting targets to get there and linking those to remuneration. The resolution asks that we confirm our ambition is not in line with a well-below-2°C pathway. Our ambition is explicitly designed to be consistent with the emission reductions needed to meet the goal of the Paris Agreement. Shell can and will make a contribution to the world’s effort to meet the goal of Paris. But it cannot ensure the world meets Paris. The whole world, all parts of society, need to contribute and act on this challenge together. The resolution asks Shell to set long-term targets instead of a long-term ambition. But a long-term target could drive a wedge between Shell and wider society, between Shell and its customers. If society changes more slowly, we will not be able to move as quickly as we would like and need the freedom to adjust our business priorities accordingly. If society changes its energy demands more quickly than expected, we intend to aid that acceleration and want to be free to do so. A long-term target would set the company on a path towards destroying value, tying the hands of future management to make the right decisions.” (Shell.FPS1, pp. 12-13; see also Shell.TPS1; Shell.PRXY1; Ceres – Climate and Sustainability Shareholder Resolutions Database; SEC – Division of Corporate Finance 2019; SEC – Division of Corporate Finance 2018)
CRITERION 4 – WHAT ARE THE COMPANY’S AFFILIATIONS WITH THIRD PARTIES THAT SPREAD DISINFORMATION ON CLIMATE SCIENCE?
425

Royal Dutch Shell
INDICATOR 4A. THE AMERICAN LEGISLATIVE EXCHANGE COUNCIL (ALEC) Score: (5) Rationale: Shell left ALEC in 2015, stating explicitly that it was leaving because
ALEC’s position on climate science was inconsistent with the company’s position.
Source(s): "ALEC advocates for specific economic growth initiatives, but its
stance on climate change is clearly inconsistent with our own," said Curtis Smith, a spokesman for Shell. "We have long recognized both the importance of the climate challenge and the critical role energy has in determining quality of life for people across the world. As part of an ongoing review of memberships and affiliations, we will be letting our association with ALEC lapse when the current contracted term ends early next year." (Shell.TPS2)
“In 2015, for example, we decided not to renew our membership of the American legislative exchange council (ALEC) in the USA because its stance on climate change was inconsistent with our own.” (Shell.FPS2, p. 8; see also Source Watch - ALEC; DeSmogBlog – ALEC)
INDICATOR 4B. THE AMERICAN PETROLEUM INSTITUTE (API) Score: (4) Rationale: Though Shell is a current member of and holds a leadership position
in API, it has taken different public positions on climate science than the association.
Source(s): “Shell is a member of the board of directors and the executive
committee.” (Shell.FPS2, p. 26)
“Shell and API have not always been aligned on support of specific climate-related policies. For example, at times, we have taken different public positions on proposals to regulate methane emissions....In 2015, API highlighted that climate change was a serious issue that needed to be addressed. API expressed concerns
426

Royal Dutch Shell
regarding the US approach to the Paris Agreement negotiations, highlighting the need for an approach that reduced emissions while protecting economic growth. Shell supports the goal of the Paris Agreement and publicly highlighted the risks of the USA withdrawing from the agreement...API has stated it will evaluate and respond to specific legislative carbon-pricing proposals. Shell has supported state and federal carbon- pricing initiatives, for example the California cap-and-trade programme.” (Shell.FPS2, p. 17; see also API – Members; DeSmogBlog – API)
INDICATOR 4C. THE NATIONAL ASSOCIATION OF MANUFACTURERS (NAM) Score: (4) Rationale: Though Shell is a current member of and holds a leadership position
in NAM (Odeh Khoury, Vice President of Trading & Supply Products Americas at Shell Trading US Company, is a member of NAM’s board of directors), it has taken different public positions on climate science than the association.
Source(s): Shell is a member of the board of directors.” (Shell.FPS2, p. 31)
“NAM has stated support for “the spirit of the Paris Agreement”, but has also expressed concerns that elements of this deal were not equitable for manufacturers in the USA. Shell supports the goal of the Paris Agreement.... Shell has supported sector-specific targets, for example the corporate Average Fuel economy (CAFE) standards, on which NAM took a different position... when the new Source Performance Standards (NSPS OOOOa) for methane emissions were announced in the ASA in 2016, NAM originally opposed the need for new regulation. now NAM has joined others in supporting the same position as Shell of reforming, not repealing, NSPS. In March 2019, Shell urged the EPA to continue to directly regulate methane from new and modified onshore oil and gas sources and, time permitting, propose a rule for existing sources.” (Shell.FPS2, p. 31; see also NAM – Board of Directors; DeSmogBlog – NAM)
427

Royal Dutch Shell
INDICATOR 4D. THE WESTERN STATES PETROLEUM ASSOCIATION (WSPA) Score: (4) Rationale: Though Shell is a current member of and holds a leadership position
in WSPA, it has taken different public positions on climate science than the association.
Source(s): “WSPA and Shell support similar policies on carbon pricing.
However, WSPA took a different approach to Shell in relation to the 2018 ballot initiative proposing a carbon tax in Washington state. WSPA launched a campaign opposing the initiative, calling it costly, unfair and ineffective...Shell decided against dedicating funds to the campaign opposing the initiative because of our general support for government-led carbon pricing, and because we did not consider it the right way to advance the debate. we made our position public in an opinion piece in the Seattle times newspaper signed by Shell’s chief executive officer.” (Shell.FPS2, p. 16; see also WSPA – Member Companies; DeSmogBlog – WSPA)
INDICATOR 4E. AMERICAN FUEL AND PETROCHEMICAL MANUFACTURERS (AFPM) Score: (5) Rationale: Shell left AFPM in 2019, stating explicitly that it was leaving because
AFPM’s position on climate science was inconsistent with the company’s position.
Source(s): “Shell has identified material misalignment on climate-related
policy positions with AFPM. On balance, having considered this misalignment and the benefits of membership, we have decided not to renew our membership of AFPM in 2020.” (Shell.FPS2, p. 24; see also AFPM – Membership Directory; DeSmogBlog – AFPM)
428

Royal Dutch Shell
CRITERION 5 – DOES THE COMPANY PUBLICLY SUPPORT THE NEED FOR CLIMATE POLICY AND REGULATIONS? INDICATOR 5A. REGULATIONS, CARBON TAX, EMISSIONS TRADING, RENEWABLE ENERGY, CCS, ETC. Score: (4) Rationale: Shell has consistently advocated for the adoption of governmental
carbon policies and is a member of the Make Power Clean initiative, which advocated in favor of recent cliamte change-related legislation (e.g., “Regulation on the Internal Market for Electricity”) before the Council of the EU.
Source(s): “Europe can build a cleaner future for its citizens – but only with the
right electricity market design. As the vote in the ITRE committee approaches, we call on you to act consistently and endorse the proposal to limit access to capacity mechanisms to plants emitting 550g CO2/kWh or less as a way of ensuring a cleaner power supply for all Europeans. To make a difference, the 550g carbon criterion should enter into force as quickly as possible, for all power plants, and cover the widest possible scope. Limiting exceptions and insisting on a rapid implementation is the best way to ensure Europe meets its ambitious climate objectives, unlocking the potential of cleaner energy supply and promoting renewables’ growth. The European Parliament can be once again the voice of ambition and leadership by defending the right of European citizens to have energy policies that work towards our climate goals...This letter is endorsed by: BNE, Eni, ESIA (European Semiconductor Industry Association), ESTELA (European Solar Thermal Electricity Association), Eurogas, EBA (European Biogas Association), First Solar, Gas Natural Fenosa, Gassco, Joule Assets, NOROG (Norsk Olje & Gass), Nordex Acciona, PKA, REstore, Siemens, Shell, SNAM, SMA, Solar Power Europe, Statoil, Total, VaasaETT, Voltalis, Wintershall.” (Shell.TPS3)
“Therefore, we call on governments, including at the UNFCCC negotiations in Paris and beyond – to: (1) introduce carbon pricing systems where they do not yet exist at the national or
429

Royal Dutch Shell
regional levels and (2) create an international framework that could eventually connect national systems. (Shell.FPS3)
INDICATOR 5B. PARIS AGREEMENT Score: (4) Rationale: Shell has made a general statement of support for policies and
regulations to advance the Paris Agreement and supported policies and/or regulations to advance the Paris Agreement and its temperature targets (e.g., Make Power Clean initiative).
Source(s): “We fully support the Paris Agreement’s goal to keep the rise in
global average temperature this century to well below two degrees Celsius above pre-industrial levels and to pursue efforts to limit temperature increase even further to 1.5 degrees Celsius.” (Shell.IR, p. 11)
“Europe can build a cleaner future for its citizens – but only with the right electricity market design. As the vote in the ITRE committee approaches, we call on you to act consistently and endorse the proposal to limit access to capacity mechanisms to plants emitting 550g CO2/kWh or less as a way of ensuring a cleaner power supply for all Europeans. To make a difference, the 550g carbon criterion should enter into force as quickly as possible, for all power plants, and cover the widest possible scope. Limiting exceptions and insisting on a rapid implementation is the best way to ensure Europe meets its ambitious climate objectives, unlocking the potential of cleaner energy supply and promoting renewables’ growth. The European Parliament can be once again the voice of ambition and leadership by defending the right of European citizens to have energy policies that work towards our climate goals...This letter is endorsed by: BNE, Eni, ESIA (European Semiconductor Industry Association), ESTELA (European Solar Thermal Electricity Association), Eurogas, EBA (European Biogas Association), First Solar, Gas Natural Fenosa, Gassco, Joule Assets, NOROG (Norsk Olje & Gass), Nordex Acciona, PKA, REstore, Siemens, Shell, SNAM, SMA, Solar Power Europe, Statoil, Total, VaasaETT, Voltalis, Wintershall.” (Shell.TPS3)
430

Royal Dutch Shell
CRITERION 6 – HAS THE COMPANY BEEN PUBLICLY TRANSPARENT ABOUT ITS POSITION, ACTIONS, AND AFFILIATIONS WITH REGARD TO CLIMATE SCIENCE AND CLIMATE CHANGE? INDICATOR 6A. WEBPAGE DEDICATED TO CLIMATE CHANGE Score: (5) Rationale: Shell maintains a separate webpage on its website devoted to
climate change. Source(s): (see Shell.CWS3) INDICATOR 6B. STAND-ALONE SUSTAINABILITY REPORT WITH SPECIFIC REFERENCE TO CLIMATE CHANGE Score: (5) Rationale: Shell’s sustainability report is easily accessible through its website
and contains a section dedicated to climate change. Source(s): (see Shell.SR, p. 44) INDICATOR 6C. DISCLOSURE TO CDP Score: (5) Rationale: CDP website indicates “Submitted” from Shell for Climate Change
2018. Source(s): (see Shell.CDP2) INDICATOR 6D. DISCLOSURE OF THIRD-PARTY RELATIONSHIPS AND LOBBYING ACTIVITIES Score: (5) Rationale: Shell produces a detailed document (i.e., Industry Associations
Climate Review) disclosing its relationship with trade associations.
431

Royal Dutch Shell
Source(s): (see Shell.FPS2) INDICATOR 6E. REPORT ON CLIMATE RELATED RISK SCENARIOS Score: (5) Rationale: Shell has produced and published a 2°C scenario report in the
reporting period. Source(s): “For over four decades, Shell has developed scenarios to deepen
our strategic thinking and consider the future….We share and regularly test our thinking and modelling with expert institutes, including the International Energy Agency (IEA) based in Paris, France, the Massachusetts Institute of Technology (MIT) Joint Program on the Science and Policy of Global Change (Cambridge, USA) and the Energy Information Administration (Washington, USA).” (Shell.CO2R2, p. 19)
“A preliminary internal risk assessment conducted indicates a financial risk of $1-4 billion impact from demand destruction in the market by 2030. This will be driven by several factors such as regulation, changes in consumer preference, policy and market dynamics. Factors such as variation in regulatory cost due to low carbon fuel directives and targets, and policy differences (e.g., explicit/implicit GHG policies) in different countries introduces a certain degree of uncertainty (moderate to high level) in our analysis.” (Shell.CDP1, p.24; see also Shell.CWS4)
432

Suncor Energy
XXVII. Suncor Energy CRITERION 1 – WHAT IS THE COMPANY’S POSITION ON CLIMATE SCIENCE? INDICATOR 1A. CONSISTENTLY ACCURATE PUBLIC STATEMENTS ON CLIMATE SCIENCE AND THE CONSEQUENT NEED FOR SWIFT AND DEEP REDUCTIONS IN EMISSIONS FROM THE BURNING OF FOSSIL FUELS Score: (3) Rationale: Though Suncor consistently acknowledges the scientific evidence of
climate change in all public company platforms and notes the need for urgent action, the company has not called for swift and deep reductions in emissions from the burning of fossil fuels.
Source(s): “There is general consensus that limiting the impact of climate
change requires the global average increase in temperature remain below 2°C, relative to pre-industrial levels.” (Suncor.CO2R, p. 3)
“Energy remains the backbone of a modern economy and contributes to much of our well-being. It is required to feed us, build and heat our homes, power manufacturing and facilitate transportation. At the same time, the science is clear that the world needs urgent action to reduce our carbon emissions and avoid the worst effects of climate change.” (Suncor.CWS1)
“That doesn’t mean it’s business as usual. Climate change is real – one of the most pressing challenges of our time – and we all have a shared responsibility to find solutions. Failing to act is not an option.” (Suncor.SR, p. 4)
CRITERION 2 – WHAT MEASURES IS THE COMPANY TAKING TO REDUCE ITS CARBON FOOTPRINT? INDICATOR 2A. GHG EMISSIONS TARGETS Score: (2)
433

Suncor Energy
Rationale: Suncor’s GHG emissions reduction plans is not science-based and,
as it only includes a reduction in the company’s Scope 1-2 GHG emissions intensity, is not in service of a specific temperature goal or target. Note that Suncor’s disclosures alternatively identify both Scope 1-2 GHG emissions (e.g., “reducing the total emissions intensity of the production of our oil and petroleum products by 30% by 2030”) and Scope 1-3 GHG emissions (e.g., “targeting a reduction in the total GHG emissions intensity of our oil and petroleum products by 30% by 2030”) as covered by its GHG reduction plan.
Source(s): “[Provide details of your emissions intensity target(s) and progress
made against those target(s)...Is this a science-based target?] No, and we do not anticipate setting one in the next 2 years...Our goal is a 30% reduction in GHG emissions intensity by 2030 (Scope 1 and 2 emissions only). If current production remained flat, we would expect a similar reduction in absolute emissions. However, planned production growth during this timeframe would add incremental absolute emissions, albeit at a lower GHG emissions intensity.” (Suncor.CDP1, p. 31)
“The scale of Suncor’s ambition is reflected in our sustainability goal to harness technology and innovation to contribute to a low-carbon economy. We are measuring our progress to meet this goal by targeting a reduction in the total GHG emissions intensity of our oil and petroleum products by 30% by 2030. We believe this target, together with our ongoing commitment to technology and innovation, puts us on the path to ultimately bending the curve on our absolute GHG emissions as well.” (Suncor.SR, p. 4)
“In 2016, we announced a greenhouse gas goal that we will work to harness technology and innovation to set us on a transformational pathway to a low-carbon energy system. We will measure our progress by reducing the total emissions intensity of the production of our oil and petroleum products by 30% by 2030.” (Suncor.CWS2)
“While our own emissions will continue to go up in the short term as we grow production, Suncor is taking steps – including
434
Suncor Energy
replacing coke-fired boilers and expanding cogeneration – that will help “green” the Alberta electrical grid.” (Suncor.SR, p. 15)
INDICATOR 2B. GHG EMISSIONS REDUCTIONS Score: (4) Rationale: Company’s GHG emissions intensity has decreased over the last two
reporting years. Source(s): [see Supplemental Data] INDICATOR 2C. R&D INTO LOW-CARBON TECHNOLOGIES Score: (3) Rationale: Suncor has publicly committed to funding R&D into low-carbon
technologies (e.g., through Evok Innovations), disclosed a low-carbon R&D budget for that purpose and provided some evidence of specific low-carbon technology allocations (e.g. digital technologies to “optimize current assets and develop next-generation facilities”), but not broken down its low-carbon R&D budget by technology.
Source(s): “For future growth, we know we can and will get beyond today’s
technologies. That will be necessary to contribute to Canada’s commitments to reduce its emissions, and ultimately, bend the curve on absolute emissions as well. Last year alone, we invested $350 million developing and deploying new technologies.” (Suncor.SR, p. 14)
“Suncor invested approximately $350 million in the development of innovative technology in 2017, and less than one - fifth of this expense was associated with GHG reductions.” (Suncor.CDP1, p. 23)
“Venture capital funding supports entrepreneurs to advance their ideas to commercialization and build businesses to market their technology world-wide. An example of this is Evok Innovations, a $100 million technology fund co-founded by the BC Cleantech CEO Alliance, Cenovus Energy Inc. and Suncor. Suncor and Cenovus
435

Suncor Energy
have each committed up to $50 million over 10 years to develop technologies to help address some of the most pressing environmental and economic challenges of our industry.” (Suncor.CWS3)
“In 2018, we invested approximately $635 million in technology development and deployment, and digital technologies as part of a robust strategy to optimize current assets and develop next-generation facilities...We already extensively use information technology across our business, investing $235 million in digital technologies in 2018.” (Suncor.CWS4; see also Suncor.CDP1, p. 28)
“In addition to our current partnerships in 111 MW of wind power, we continue to evaluate renewable energy investments that deliver economic, environmental and social benefits. We also are continuing to explore the opportunity to develop our first utility-scale solar photovoltaic facility in Alberta...We continue to look for low-carbon opportunities in our operations and evaluate new business opportunities in renewable fuels...We continue to invest in renewable fuels including our 2019 investment in Enerkem Inc. which manufactures biofuels and renewable chemical products from household garbage that would otherwise be destined to a landfill.” (Suncor.CWS5; see also Suncor.CDP1, p. 18)
“We continue to make long term tech investments towards step changes in in-situ production emissions intensity.” (Suncor.CDP1, p. 13; see also Suncor.CDP1, p. 75)
INDICATOR 2D. USE OF AN INTERNAL PRICE ON CARBON Score: (4) Rationale: Suncor discloses the internal price on carbon it uses when evaluating
all new investments and explains generally how that figure is used. Source(s): “Our internal management model for project and asset
development incorporates carbon pricing and our GHG goal prior to a commitment of significant resources, and ensures that all material climate change risks and opportunities are well
436

Suncor Energy
understood. The process allows for analysis of technical options, but also the regulatory and external stakeholder context to be recognized in decision-making.” (Suncor.CWS6)
“As part of its ongoing business planning, Suncor estimates future costs associated with CO2 emissions in its operations and the evaluation of future projects, based on the company's outlook for the carbon price under current and pending GHG regulations, using a price of $30/tonne of CO2e steadily increasing to approximately $100/tonne of CO2e in 2040 as a base case, applied against a range of policy design options. The company expects that GHG emissions regulation will continue to evolve with a carbon price signal that balances economic, environmental and energy security objectives. Suncor will continue to review the impact of future carbon-constrained scenarios on its business strategy.” (Suncor.40F, p. 53)
“Our carbon price outlook assumes the current carbon price will rise to $100 per tonne on an increasing percentage of our emissions, by 2040. As most of our facilities are currently regulated under various carbon pricing regimes, the impact of our outlook is built into our planning assumptions. Based on the outlook for new emissions regulations, we have updated our cost estimates. The production weighted average after-tax cash cost per barrel of global production over the period 2019 to 2028 has increased from 2018 and is now estimated at an average of $0.70 per barrel.” (Suncor.CWS7)
“The company business plan, investments and all capital decisions are tested against a range of variables, including our base and alternative carbon price outlook, to ensure an expectation of a competitive rate of return over the asset life. In 2018, we also developed an alternative case that takes a much higher view of future carbon prices. This alternative case serves as a “stress test” and adds confidence to capital decisions.” (Suncor.CO2R, p. 13)
“Our business planning process includes carbon prices that incorporate existing regulations and their expected trajectory, as they apply to our business. All investments are also sensitivity tested
437

Suncor Energy
under a range of carbon assumptions specific to that investment. In 2018, Suncor took a further step to embed a low-carbon scenario into our business and capital investment planning process to ensure all future business plans and investments are resilient under an accelerated energy systems transition.” (Suncor.CO2R, p. 21)
CRITERION 3 – IS CLIMATE SCIENCE INTEGRAL TO THE GOVERNANCE AND OVERSIGHT OF THE COMPANY? INDICATOR 3A. DELINEATION OF RISKS AND RISK MANAGEMENT PROCEDURES RELATED TO CLIMATE CHANGE INDICATOR 3AI. REGULATORY RISKS Score: (4) Rationale: Suncor provides a detailed analysis of existing and proposed climate
change-related regulations and laws and their possible effects on the company, including potential financial impacts. Still, apart from one instance (i.e., OSELA), Suncor has not disclosed whether those existing and proposed regulations and laws will have a material impact on liquidity, capital resources, or results of operations.
Source(s): “Based on the outlook for new emissions regulations, we have
updated our cost estimates. The production weighted average after-tax cash cost per barrel of global production over the period 2019 to 2028 has increased from 2018 and is now estimated at an average of $0.70 per barrel.” (Suncor.CWS8)
“Suncor anticipates that future amendments to environmental laws will result in the imposition of additional requirements on companies operating in the energy industry. A number of statutes, regulations and governance frameworks pertaining to environmental regulation are currently under development and, in some cases, proposed amendments have been issued by the provincial regulators that oversee oil sands development for comment by industry. These statutes, regulations and frameworks relate to issues such as tailings management,
438

Suncor Energy
water use, biodiversity, air emissions and land use. The company is committed to working with the appropriate regulatory bodies as they develop new policies, and to fully complying with all existing and new statutes, regulations and frameworks as they apply to the company's operations. In general, the impact of current and future environmental laws and regulations on the company's business and operations, including laws and regulations relating to climate change, remains uncertain. It is not possible to predict the nature of any future legislative requirements, including those currently set out in Bill C-69, or the impact the future requirements will have on the company and its business, financial condition and results of operations.” (Suncor.40F, pp. 51-52)
“Further, the Alberta (the OSELA) sets a limit of 100 Mt of CO2e per year in the oil sands sector, excluding emissions from cogeneration and new upgrading capacity, allowing for continued growth and development while the sector works to accelerate emissions reduction technologies and operational optimization. Current oil sands emissions are estimated to be 70 Mt/year, including existing upgrading capacity, but excluding cogenerated electricity sold to the Alberta power grid. The mechanics of implementation and enforcement of the OSELA remain under review by the Government of Alberta and it is not yet possible to predict the long-term impact on opportunities for Suncor.” (Suncor.40F, p. 54)
“...the mechanics of implementation and enforcement of the OSELA are currently under review and it is not yet possible to predict the impact on Suncor. However, such impact could be material.” (Suncor.40F, p. 61)
“In 2012, Canada and Alberta adopted the Joint Canada-Alberta Implementation Plan for Oil Sands Monitoring...The 2018 annual cost to Suncor under the Monitoring Plan is estimated to be approximately $13 million, including Suncor's net share of Syncrude compliance costs.” (Suncor.40F, pp. 56-57)
“In 2012, the Government of Alberta approved the Lower Athabasca Regional Plan (LARP). The LARP addresses land-use
439

Suncor Energy
management in the Lower Athabasca region of Alberta, which includes the area of the province in which Suncor's Oil Sands business is located...The management frameworks established under LARP formalize a number of regulatory tools used by the government to manage environmental aspects of oil sands development, including cumulative environmental effects management on a regional scale. As a result, LARP may require Suncor and Syncrude to have greater participation in the overall evaluation of environmental issues and emissions in the Lower Athabasca region.” (Suncor.40F, pp. 55-56)
“Governments at all levels in Canada are seeking to diversify transportation fleets to use lower carbon intensity fuels and, as a result, the transportation fueling landscape is expected to change over time. Reducing GHG emissions from the transportation sector is arguably one of the toughest challenges, in that transportation is fundamental to economic productivity and because liquid petroleum fuels are available at a relatively low cost and high energy density.” (Suncor.CO2R, p. 18)
“If the Canada-United States-Mexico Agreement (CUSMA) is ratified, Canada will no longer be subject to the proportionality provisions in the North American Free Trade Agreement’s (NAFTA) energy chapter...If CUSMA is not ratified and adopted by all three countries, this may alter the terms of trade for energy resources in a manner adverse to the company. This could have a material adverse effect on the sale and transportation of Suncor’s products within North America, which could have a significant negative impact on Suncor’s business, financial condition and results from operations.” (Suncor.AR, p. 66)
“The U.S. Environmental Protection Agency (U.S. EPA) has established a rule mandating that all large facilities (defined as facilities emitting greater than 25,000 tonnes of CO2e per year, which includes Suncor's refinery in Commerce City, Colorado) must report their GHG emissions. The mandate of the U.S. EPA is under review by the current administration. In June 2017, the withdrawal of the U.S. from the Paris Agreement was announced. The current administration has also overturned a number of decisions made by
440

Suncor Energy
the previous administration. Efforts have also been made at the state level to adopt legislation requiring entities to report on GHG emissions. Suncor continues to monitor these developments. The outcome of these changes in approach to GHG emissions is currently unclear and the impact on Suncor, including its Commerce City, Colorado refinery, is unknown at this time.” (Suncor.40F, p. 55)
“The European Union Emissions Trading Scheme (EU ETS) applies to Suncor's non-operated offshore U.K. and offshore Norway assets. The EU ETS requires that member countries set emissions limits for installations in their country covered by the scheme and assigns such installations an emissions cap. Installations may meet their cap by reducing emissions or by buying allowances from other participants. Phase III of EU ETS includes a transition from free allocation to auctioning allowances.” (Suncor.40F, p. 55)
INDICATOR 3AII. PHYSICAL RISKS Score: (2) Rationale: Suncor's discussion of the physical risks facing its business (e.g.,
adverse weather) does not note climate change as a contributor to those risks.
Source(s): “Project development and execution can also be impacted by,
among other things...The impact of weather conditions.” (Suncor.40F, pp. 63-64)
“In general, Suncor's operations are subject to operational hazards and risks such as, among others...severe winter climate conditions, prolonged periods of extreme cold or extreme heat, flooding, droughts and other extreme weather conditions...pollution and other environmental risks...In addition to the foregoing factors that affect Suncor's business generally, each business unit is susceptible to additional risks due to the nature of its business, including, among others, the following...E&P offshore operations occur in areas subject to hurricanes and other extreme weather
441

Suncor Energy
conditions, such as winter storms, pack ice, icebergs and fog. The occurrence of any of these events could result in production shut-ins, the suspension of drilling operations, damage to or destruction of the equipment involved and injury or death of rig personnel. Harsh weather conditions, particularly in the winter season, may also impact the successful execution of maintenance and start-up of operations.” (Suncor.40F, p. 59; see also Suncor.CO2R, p. 22)
INDICATOR 3AIII. MARKET AND OTHER INDIRECT RISKS AND OPPORTUNITIES Score: (3) Rationale: Suncor explicitly acknowledges the financial and reputational risk of
recent climate change-related litigation in which the company is a defendant and offers some analysis of the potential for future inter-industry competition, but provides limited financial analysis of such risks.
Source(s): “Natural gas prices in North America are affected by, among
other things, supply and demand, and by prices for alternative energy sources. Decreases in product margins or increases in natural gas prices could have a material adverse effect on Suncor’s business, financial condition, reserves and results of operations.” (Suncor.AR, p. 56)
“Market access for Suncor’s oil sands production may be constrained by insufficient pipeline takeaway capacity, including the lack of new pipelines due to an inability to secure required approvals and negative public perception. There is a risk that constrained market access for oil sands production, growing inland production and refinery outages could create widening differentials that could impact the profitability of product sales...The occurrence of any of the foregoing could have a material adverse effect on the company’s business, financial condition, reserves and results of operations.” (Suncor.AR, p. 56)
“The petroleum industry also competes with other industries in supplying energy, fuel and related products to consumers. The increasing volatility of the political and social landscape at
442
Suncor Energy
provincial, federal, territorial, state, municipal and international levels adds complexity...There is a risk that increased competition could cause costs to increase, put further strain on existing infrastructure and cause margins for refined and unrefined products to be volatile, and impact demand for Suncor’s products, which could have a material adverse effect on Suncor’s business, financial condition and results of operations.” (Suncor.AR, p. 58)
“The inability to develop, implement and monitor new technologies may impact the company’s ability to develop its new or existing operations in a profitable manner or comply with regulatory requirements, which could have a material adverse effect on Suncor’s business, financial condition, reserves and results of operations.” (Suncor.AR, p. 62)
“There is also a risk that Suncor could face litigation initiated by third parties relating to climate change, including litigation pertaining to GHG emissions, the production, sale, or promotion of fossil fuels and petroleum products, and/or disclosure. For example, the Board of County Commissioners of Boulder County, the Board of County Commissioners of San Miguel County and the City of Boulder, all of Colorado, have brought an action against Suncor and certain of its subsidiaries seeking, among other things, compensation for impacts they allege with respect to climate change...These developments and future developments could adversely impact the demand for Suncor's products, the ability of Suncor to maintain and grow its production and reserves, and Suncor's reputation, and could have a material adverse effect on Suncor's business, financial condition, reserves and results of operations.” (Suncor.40F, p. 61)
INDICATOR 3B. DELEGATION OF BOARD MEMBERS AND/OR COMMITTEES WITH EXPLICIT OVERSIGHT OF CLIMATE CHANGE POLICY Score: (1) Rationale: Suncor maintains a board-level committee (i.e, Environment, Health,
Safety and Sustainable Development Committee) with "ongoing oversight” of carbon risk, but that committee’s charter only references the objectives of “...operational risks, the environment,
443

Suncor Energy
health, safety and sustainable development performance and issues” and an annual review of the company’s sustainability reporting. Further, Suncor’s Chief Sustainability Officer, though visible at meetings of the full Board and the EHS&SD Committee, is not a member of the company’s Board of Directors.
Source(s): “The EHS&SD Committee assists the Board of Directors
by...reviewing and formulating recommendations to the Board of Directors with respect to the Corporation's strategies and policies pertaining to the environment, health, safety and sustainable development. The Committee does not have decision-making authority, except in the very limited circumstances described herein or where and to the extent that such authority is expressly delegated by the Board of Directors. The Committee conveys its findings and recommendations to the Board of Directors for consideration and, where required, decision by the Board of Directors.” (Suncor.CCC1)
“Carbon risk is considered one of Suncor’s principal risks. As such, it undergoes a regular Board of Directors review. This includes reviewing external trends, carbon risk pathways, and Suncor’s plans to mitigate those risks. Carbon risk is also brought forward to the Environment, Health, Safety and Sustainable Development Committee of the board on a quarterly basis for ongoing oversight.” (Suncor.CWS9; see also Suncor.SR, p. 24)
“Suncor’s sustainability journey gained increased emphasis in 2017 with the appointment of Eric Axford as the company’s first-ever Chief Sustainability Officer. Eric, formerly executive vice president, Business Services, is charged with providing further focus to Suncor’s multi-decade commitment to sustainable energy development. As reinforced in this conversation with Eric and Suncor’s Arlene Strom, the new position is part of a constantly evolving vision of sustainability that is integral to Suncor’s aspiration to be a trusted steward of valuable natural resources in a world transitioning to a low-carbon future...Both Eric and I [Arlene Strom] represent sustainability issues at every meeting of the Board’s Environment, Health & Safety and Sustainable Development Committee. Eric is also at the full Board meetings, representing these issues on a regular basis. And discussions around
444

Suncor Energy
sustainability – including issues of climate and carbon risk – are a full and robust part of Suncor’s annual strategy process. All of that helps set the right tone for oversight from the Board.” (Suncor.SR, pp. 13-15)
“[Chief Sustainability Officer Eric Axford] presents on sustainability matters at every meeting of the EHS&SD committee of the Board, and represents them at periodic Board reviews.” (Suncor.SR, p. 22)
INDICATOR 3C. DOES THE COMPANY SUPPORT CLIMATE-RELATED SHAREHOLDER RESOLUTIONS? Score: (3) Rationale: Suncor has not faced any climate-related shareholder resolutions put
forward by established networks of socially responsible investors during the reporting period.
Source(s): (see Ceres – Climate and Sustainability Shareholder Resolutions
Database; SEC – Division of Corporate Finance 2019; SEC – Division of Corporate Finance 2018)
CRITERION 4 – WHAT ARE THE COMPANY’S AFFILIATIONS WITH THIRD PARTIES THAT SPREAD DISINFORMATION ON CLIMATE SCIENCE? INDICATOR 4A. THE AMERICAN LEGISLATIVE EXCHANGE COUNCIL (ALEC) Score: (3) Rationale: Suncor is based in Canada and has no existing operations in the
association’s jurisdiction and is not cited by Source Watch or DeSmogBlog as having ever been affiliated with association.
Source(s): (see Source Watch - ALEC; DeSmogBlog – ALEC) INDICATOR 4B. THE AMERICAN PETROLEUM INSTITUTE (API)
445

Suncor Energy
Score: (3) Rationale: Suncor is based in Canada and is neither in API’s current
membership list nor noted by DeSmogBlog as having ever been affiliated with association.
Source(s): (see API – Members; DeSmogBlog – API) INDICATOR 4C. THE NATIONAL ASSOCIATION OF MANUFACTURERS (NAM) Score: (3) Rationale: Suncor is based in Canada and is neither on NAM’s current BOD list
nor noted by DeSmogBlog as having ever been affiliated with association.
Source(s): (see NAM – Board of Directors; DeSmogBlog – NAM) INDICATOR 4D. THE WESTERN STATES PETROLEUM ASSOCIATION (WSPA) Score: N/A Rationale: Suncor is based in Canada and has no operations in the
association’s jurisdiction. Further, the company is neither mentioned by DeSmogBlog as having ever been affiliated with the association nor listed as a corporate member on WSPA’s website.
Source(s): (see WSPA – Member Companies; DeSmogBlog – WSPA) INDICATOR 4E. AMERICAN FUEL AND PETROCHEMICAL MANUFACTURERS (AFPM) Score: (1) Rationale: Suncor is a current member of AFPM and Senior VP Refining &
Logistics Marc Mageau sits on the group’s Board of Directors.
446
Suncor Energy
Source(s): (see Suncor.TPS2, p. 33; see also AFPM – Membership Directory, DeSmogBlog – AFPM)
CRITERION 5 – DOES THE COMPANY PUBLICLY SUPPORT THE NEED FOR CLIMATE POLICY AND REGULATIONS? INDICATOR 5A. REGULATIONS, CARBON TAX, EMISSIONS TRADING, RENEWABLE ENERGY, CCS, ETC. Score: (2) Rationale: Suncor supports the harmonization of Canadian carbon pricing
policies but has at the same time actively opposed specific climate change policy proposals in its relevant jurisdictions during the reporting period (e.g., criticism of an unamended version of Bill C-69). Note that Alberta’s Climate Leadership Plan, which Suncor supports, was initiated outside of the scope of the reporting period.
Source(s): “Our support for climate leadership is not tied to any particular
government. We seek to contribute to the development of effective government policy in support of moving towards a low-carbon economy...We continue to advocate for environmental policies and regulations that help us address climate change, including supporting a broad-based price on carbon. If applied broadly across the economy to producers and consumers, it can be one of a suite of effective market and regulatory mechanisms to lower GHG emissions while promoting low-carbon innovation.” (Suncor.CWS10; see also Suncor.CO2R, p. 3)
“In Canada, there exists a “patchwork quilt” of carbon pricing policies across the provinces, as well as differences in complementary policies across provinces. Over time, this will mean higher costs than necessary. We advocate for both levels of government to ensure that policies work together.” (Suncor.SR, p. 28)
“We’re disappointed and concerned that this Bill jeopardizes future development and does not restore investor confidence in our industry and country. The Senate amendments were a
447

Suncor Energy
reflection of a diligent and robust effort to gather feedback from all Canadians and the Senate put forward a Bill that was balanced, workable and had broad support. Had these critical amendments been included, it would have done a lot to restore investor confidence. Instead, we will now risk further uncertainty to the detriment of future responsible Canadian resource development and jobs.” (Suncor.TPS1)
“The Government of Alberta’s Climate Leadership Plan, effective January 1, 2017, committed to phasing out 6,300 MWs of coal-fired generation in the province by 2030, replacing two-thirds of coal-fired production with renewable energy. Associated changes in legislation and market structure have spurred significant investment in renewable energy projects in Alberta...Suncor is excited about the renewable opportunities within the province and is well positioned to participate in the development of future projects. Our renewable development portfolio includes seven wind and four solar sites in southern Alberta, totalling more than 1,000 MW of potential development opportunities. These sites are in various stages of development.” (Suncor.SR, p. 19)
“In Alberta, the Climate Leadership Plan (CLP) will accelerate the transition from coal to renewable electricity and natural gas generation by 2030. The government is committed to replacing two-thirds of coal-generated electricity with renewables, primarily wind power, and with natural gas – such as power exported to the grid from Suncor’s cogeneration facilities. Renewable energy sources are proposed to comprise up to 5,000 MW of renewable capacity, which is estimated to be approximately 30% of Alberta’s total electricity. Suncor is an active proponent of increased cogeneration as a key part of the power mix in Alberta, particularly as the province transitions away from coal. Cogeneration provides reliable, base-load power to intermittent renewable power at the lowest GHG intensity of any hydrocarbon fuel. Collaboration between government and industry is the only way to accelerate the step changes needed for Alberta to transition from an “energy only” market design to a “capacity” market design. As the sixth largest electricity generator in Alberta and an industry player keenly focused on reducing its carbon footprint, Suncor works with policy
448

Suncor Energy
makers, industry partners and other stakeholders to increase investment in low-carbon power generation.” (Suncor.SR, p. 28)
INDICATOR 5B. PARIS AGREEMENT Score: (2) Rationale: Suncor has made a statement expressing support for policies and
regulations to advance the Paris Agreement without explicitly endorsing the Agreement’s goal of keeping global temperature increase well below 2°C. Note that Suncor’s 2019 Climate Risk and Resilience Report, which was published after the reporting period for this study, does include explicit support for the agreement’s 2°C goal.
Source(s): “There is general consensus that limiting the impact of climate
change requires the global average increase in temperature remain below 2°C, relative to pre-industrial levels. Suncor supports the approach outlined in the Paris Agreement to help address the challenge of climate change.” (Suncor.CO2R, p. 3)
“Suncor supports the approach outlined in the Paris Agreement to help address the challenge of climate change. It is intended to motivate countries to demonstrate climate leadership through their national commitments and we will continue to support that leadership in the countries where we operate. To achieve this objective, there must be significant advances in technology, a shift in consumer choice and the development of new energy systems, all of which take time.” (Suncor.SR, p. 47)
CRITERION 6 – HAS THE COMPANY BEEN PUBLICLY TRANSPARENT ABOUT ITS POSITION, ACTIONS, AND AFFILIATIONS WITH REGARD TO CLIMATE SCIENCE AND CLIMATE CHANGE? INDICATOR 6A. WEBPAGE DEDICATED TO CLIMATE CHANGE Score: (5) Rationale: Suncor maintains a separate webpage on its website devoted to
climate change.
449

Suncor Energy
Source(s): (see Suncor.CWS11) INDICATOR 6B. STAND-ALONE SUSTAINABILITY REPORT WITH SPECIFIC REFERENCE TO CLIMATE CHANGE Score: (5) Rationale: Suncor’s sustainability report is easily accessible through its website
and contains a section dedicated to climate change. Source(s): (see Suncor.SR, p. 46) INDICATOR 6C. DISCLOSURE TO CDP Score: (5) Rationale: CDP website indicates “Submitted” from Suncor for Climate Change
2018. Source(s): (see Suncor.CDP2) INDICATOR 6D. DISCLOSURE OF THIRD-PARTY RELATIONSHIPS AND LOBBYING ACTIVITIES Score: (3) Rationale: Suncor discloses its membership in organizations and trade
associations to whom it has donated in excess of $50,000. Source(s): (see Suncor.SR, p. 30) INDICATOR 6E. REPORT ON CLIMATE RELATED RISK SCENARIOS Score: (1) Rationale: Suncor’s Climate Risk and Resilience report does not include a 2°C
scenario analysis.
450

Suncor Energy
Source(s): “We use three long-term energy futures scenarios to test our business strategy. All of the scenarios are plausible and could affect our operating environment and business strategy in markedly different ways. Under each of these scenarios, including the one with the most aggressive decline in oil demand, we believe a substantial amount of oil will be required for decades as the world gets on track to meet its climate ambitions...Of these scenarios, “Autonomy” is the scenario we consider best represents the technology and policy context that would be essential to meet the aspiration of limiting cumulative emissions to 450 ppm. In 2019, Suncor is currently working on the development a 2°C scenario that we can use to test our business strategy beyond 2040.” (Suncor.CWS12; see also Suncor.CO2R)
451
Total S.A.
XXVIII. Total S.A. CRITERION 1 – WHAT IS THE COMPANY’S POSITION ON CLIMATE SCIENCE? INDICATOR 1A. CONSISTENTLY ACCURATE PUBLIC STATEMENTS ON CLIMATE SCIENCE AND THE CONSEQUENT NEED FOR SWIFT AND DEEP REDUCTIONS IN EMISSIONS FROM THE BURNING OF FOSSIL FUELS Score: (2) Rationale: Total’s public disclosures generically acknowledge humanity’s
contribution to rising global temperatures, but do not address current climate science. And while the company affirms the need for swift and deep reductions in GHG emissions from the burning of fossil fuels, it does so not in the context of climate science.
Source(s): “Climate change is a global risk for the planet and results from
various human actions such as energy production and consumption.” (Total.IR, p. 94)
“Climate change is one of the biggest challenges facing us collectively, as inhabitants of our planet. At Total, we believe that while oil companies are partly responsible for the problem, they can also be part of the solution.” (Total.CWS1)
“Coal and oil drove the transformations of the 19th and 20th centuries. But today, as environmental concerns become critically important, electricity – a secondary energy source – is increasingly being tapped to meet the needs of an ever-growing global population.” (Total.FPS1, p. 5)
“The IEA’s Sustainable Development Scenario lays out an integrated strategy for achieving multiple objectives related to energy, such as mitigating the impact on climate, improving air quality and ensuring universal access to modern energy services. A rapid decrease in carbon emissions consistent with the Paris Agreement is a crucial factor.” (Total.FPS1, p. 12)
452

Total S.A.
“To address the need for clean, affordable energy while complying with the IEA’s Sustainable Development Scenario, the world will need to curtail its use of coal for power generation and make greater use of low-carbon energy sources... At Total, we have taken this planetary imperative to heart. Confronted with a fast-growing and increasingly digital and distributed market, we created a new business segment — Gas, Renewables & Power (GRP) — tasked with managing the resources that will drive the energy transition... Natural gas is an essential partner to renewable energy for power generation, and we have made it a cornerstone of our strategy. As the lowest-carbon fossil fuel, gas could make up 60% of our oil and gas production mix within 20 years.” (Total.FPS1, p. 33)
“Carbon storage is a must for the planet to achieve carbon neutrality in the second half of the century.” (Total.FPS1, p. 9)
“TOTAL publicly announced its support for the TCFD and its recommendations during the summer of 2017, while noting that it is up to companies to define the information about climate-related risks and opportunities that are significant, which, consequently, are expected to be disclosed in financial filings, and the additional information that they choose to report on a voluntary basis...The Group considers that companies have a major role to play in shaping how these issues evolve and that the modalities of the application of scenarios and the use of metrics should be further studied.” (Total.IR, p. 203)
CRITERION 2 – WHAT MEASURES IS THE COMPANY TAKING TO REDUCE ITS CARBON FOOTPRINT? INDICATOR 2A. GHG EMISSIONS TARGETS Score: (2) Rationale: Total’s stated ambition to reduce the carbon intensity of its Scope 1-
3 GHG emissions by 15% by 2030 is not a formal target. Further, Total’s stated targets (e.g., to reduce Scope 1 & 2 GHG emissions on its operated oil & gas facilities from 46 Mt CO2e to less than 40
453

Total S.A.
Mt CO2e in 2025), while notable, are neither company-wide nor science-based.
Source(s): We have created a tool for measuring the carbon intensity of the
energy products we make available to our customers. That metric indicates the average of our products’ greenhouse gas emissions, from the time they are produced in our facilities to their end use by the customer. Total’s ambition is to reduce that carbon intensity by 15% between 2015 — the date of the Paris Agreement — and 2030. In the longer term, beyond 2030, our ambition is to pursue these efforts, or possibly to accelerate as new technologies become available and public policies are put in place, and reach a reduction of 25 to 35% by 2040.” (Total.FPS1, p. 6; see also Total.IR, p. 25)
“The Group intends to reduce its carbon intensity by 15% between 2015, the date of the Paris agreement, and 2030. This undertaking represents a responsible contribution by TOTAL to the Paris agreement targets and it also enables the Group to fulfill its mission to supply to as many people as possible a more affordable, more available and cleaner energy.” (Total.IR, p. 203)
“In February 2019, TOTAL announced a target to reduce GHG emissions (Scopes 1 & 2) on its operated oil & gas facilities from 46 Mt CO2e to less than 40 Mt CO2e in 2025.” (Total.IR, p. 203)
INDICATOR 2B. GHG EMISSIONS REDUCTIONS Score: (4) Rationale: Company’s GHG emissions intensity has decreased over the last two
reporting years. Source(s): [see Supplemental Data] INDICATOR 2C. R&D INTO LOW-CARBON TECHNOLOGIES Score: (4)
454

Total S.A.
Rationale: Total has publicly committed to funding in-house R&D into low-carbon technologies and disclosed some of the firm’s investment allocations by technology (e.g., CCUS, “low-carbon electricity value chain”).
Source(s): “In 2017, Total allocated more than USD 900 million to R&D
projects related to low-carbon technologies in the field of renewable energy, energy efficiency, biofuels and biobased products, and CCUS. A major step forward in our CCUS efforts is the current project by our Lacq Research Center to build a carbon capture demonstration unit that uses the VeloxoThermTM process, a technology developed by the Canadian start-up Inventys with help from a recent USD 11 million investment by OGCI Climate Investments. Our research will help accelerate the time to market of this innovative technology.” (Total.FPS1, p. 18)
“Total Energy Ventures (TEV) invests in the initial development phases of companies that offer technologies or economic models of strategic interest to TOTAL. These areas of interest include renewable energies, digital energy, energy storage and mobility services. Whereas historically TEV invested predominantly in Europe and the United States, the company started investing in 2018 in China. In particular, TEV signed an agreement with NIO Capital to cooperate and invest in the mobility segment...TEV also launched its investment platform dedicated to emerging markets, and in particular to companies developing business models for access to energy for people who are not connected to the grid. Initially, this activity will be focused on Africa.” (Total.IR, p. 55)
“We are constantly on the lookout for meaningful ways to improve energy access, for instance through our Energy Access Lab incubator, which has been active for several years. Total will soon be boosting development of those solutions through the Energy Access Fund managed by Total Energy Ventures. The fund will be open to outside partners, with an initial goal of USD 50 million.” (Total.FPS1, p. 43)
“TOTAL is developing along the whole of the low-carbon electricity value chain, from electricity generation, storage and sale to the end customer. As demand for electricity is expected to grow strongly in
455

Total S.A.
the coming decades, TOTAL intends to become a major player in this segment. To meet this target, TOTAL plans to invest $1.5 to $2 billion per year.” (Total.IR, p. 106) (see also Total.CDP1, p. 21)
“In order to take account of issues related to climate change in its strategy, E&P is focusing its oil investments on low break-even projects, developing the production of gas, integrating a CO2 price in its investment decisions and developing expertise in technologies for carbon capture, use and storage.” (Total.IR, p. 34)
“We are continuing our work to develop and deploy carbon capture, utilization and storage (CCUS) solutions through our role in Northern Lights, an ambitious research project under way in Norway, in partnership with Equinor (formerly Statoil) and Shell. Other R&D pilots and projects are also on the drawing board.” (Total.FPS1, p. 38)
“We plan to devote up to 10% of our overall R&D budget to research into CCUS technology. Through our membership in the OGCI, we are also working with other energy industry professionals to study carbon capture technology, global storage capacity and the challenges posed by commercial development of that technology.” (Total.FPS1, p. 40) (see also Total.CDP1, p. 23)
“TOTAL announced in February 2019 the creation of an entity dedicated to investments in natural carbon sinks, composed of experts in environment and agronomy, with an investment budget $100 million per year from 2020 onwards. Furthermore, actions of preservation and restoration of the forest are currently conducted.” (Total.IR, p. 106)
“In support of our expansion in low-carbon businesses, Total continues to acquire new businesses that are integral to our strategy and bring us new expertise. These acquisitions will enable us to reduce the carbon intensity of our energy solutions while still meeting the surging demand for electricity.” (Total.FPS1, p. 34)
INDICATOR 2D. USE OF AN INTERNAL PRICE ON CARBON
456

Total S.A.
Score: (4)
Rationale: Total has disclosed the internal price on carbon it uses when evaluating all investments and describes generally how it is employed.
Source(s): “In order to ensure the viability of its projects and long-term strategy in light of the challenges raised by climate change, the Group integrates, into the financial evaluation of investments presented to the Executive Committee, either a long-term CO2 price of $30 to $40 per ton (depending on the price of crude), or the actual price of CO2 in a given country if higher.” (Total.IR, p. 105)
“All investment, divestment or acquisition projects which are submitted to the Executive Committee for approval are assessed and reviewed with regards to their risks and impact, particularly environmental, before the final investment decision is made.” (Total.IR, p. 102)
“To ensure the viability of our projects and our long-term strategy with regard to climate change issues, we already apply an internal carbon price when evaluating our investments. Those evaluations assume a price of between USD 30 and USD 40 per ton (depending on the oil price scenario) or the currently applicable carbon price if it exceeds those amounts in a given country.” (Total.FPS1, p. 14)
CRITERION 3 – IS CLIMATE SCIENCE INTEGRAL TO THE GOVERNANCE AND OVERSIGHT OF THE COMPANY?
INDICATOR 3A. DELINEATION OF RISKS AND RISK MANAGEMENT PROCEDURES RELATED TO CLIMATE CHANGE
INDICATOR 3AI. REGULATORY RISKS
Score: (3)
457

Total S.A.
Rationale: Total provides a thorough analysis, including financial, of the EU-ETS supranational carbon pricing mechanism’s possible impacts on the company, but in aggregate its disclosures relating to climate-change related regulatory risks is not comprehensive.
Source(s): “Laws and regulations related to climate change as well as growing
concern of stakeholders may adversely affect the Group’s business and financial condition...regulations may change and require the Group to reduce, change or cease certain operations, and subject it to additional obligations with regards to the compliance of its facilities. This could have a negative effect on its activities and its financial situation, including operating income and cash flow. Regulations designed to gradually limit fossil fuel use may, depending on the GHG emission limits and time horizons set, negatively and significantly affect the development of projects, as well as the economic value of certain of the Group’s assets. In Europe, for example, the Group’s industrial facilities are part of the CO2 emissions quotas market (EU-ETS), and the financial risk incurred by purchasing these quotas on the market could increase due to the reform of the system that was approved in 2018. This emission quotas market is in its third phase. The Group estimates that about 25% of emissions subjected to EU-ETS are not covered by free quotas in the period 2013-2020 (phase 3) and to 30% or more from 2021 to 2030 (phase 4). At the end of 2018, the price of these quotas was about €20/t, and the Group expects this price to be higher than €30/t in phase 4. Internal studies conducted by TOTAL have shown that a long-term CO2 price of $40/t(1) applied worldwide would have a negative impact of around 5% on the discounted present value of the Group’s assets (upstream and downstream).” (Total.IR, p. 76)
“The financial risk related to the foreseeable purchase of CO2 emission allowances on the market is expected to rise due to the effects of the ongoing reform of the EU-ETS. Total’s main emitting sites located in Europe are complying with the European carbon market (EU-ETS). The risk for Total is a loss of competitiveness on the international scale, in particular towards competitors located outside the European Union, which are not subject to similar regulation. The implementation of the Market Stability Reserve which will come into effect in 2019,
458

Total S.A.
will reduce the amount of auctioned quotas in an attempt from the European Commission to drive the EU-ETS price up. 58% of scope1&2 2018 emission are from assets located in Europe.” (Total.CDP1, p. 17)
“In the maritime and inland waterway shipping industry, new and stricter European Union and international standards governing sulfur dioxide emissions are prompting ship owners to upgrade their fleets. Against that backdrop, LNG is uniquely suited to assume a larger role.” (Total.FPS1, p. 32)
INDICATOR 3AII. PHYSICAL RISKS Score: (5) Rationale: Total’s disclosures offer a highly detailed discussion of the physical
climate-related risks facits its business. Source(s): “TOTAL’s businesses operate in various regions, where the
potential physical impacts of climate change, including changes in weather patterns, are highly uncertain and may adversely impact the Group’s operating income...Climate change potentially has multiple effects that could harm the Group’s operations. The increasing scarcity of water resources may negatively affect the Group’s operations in some regions of the world, high sea levels may harm certain coastal activities, and the multiplication of extreme weather events may damage offshore and onshore facilities. These climate risk factors are continually assessed in the risk management and prevention plans...The Group believes that it is impossible to guarantee that the contingencies or liabilities related to the matters mentioned in this point 3.1.2 would not have a material adverse impact on its business, financial condition, including its operating income and cash flow, reputation, prospects or shareholder value, if such risks were to occur.” (Total.IR, p. 77)
“Another key factor in the resilience of our portfolio is the reliability of our facilities. The Intergovernmental Panel on Climate Change (IPCC) anticipates increasingly significant natural impacts over
459
Total S.A.
the coming decades, in certain regards and certain parts of the world. We assess the vulnerability of our facilities to those events and take the risk of both weather and seismic disasters into account when designing industrial facilities. Our studies have not identified any facilities that are unable to withstand the currently known consequences of climate change.” (Total.FPS1, p. 41)
“The effect of extreme events due to climate change may impact the robustness of our infrastructures or surrounding environment. In addition to assessing the vulnerability of Oil and Gas existing facilities, there is also a need to assess the vulnerability of nearby infrastructures (such as access roads), of surrounding populations (which include companies’ employees) etc. An example is the effect of severe flooding in Houston, TX. in 2017. Our internal procedures specifically call for the systematic assessment of the possible repercussions of climate change on our future projects. In-depth studies are carried out when the potential risk is significant relative to the existing safety margin. Our analyses include a review by type of risk - sea level, storms, temperature change and melting permafrost, among others. This risk is continually assessed in the risk management and prevention plans.” (Total.CDP1, p. 13)
“The tendency observed in recent years shows that hurricanes tend to become stronger than in the past. This could have an impact on the continuity of Total’s operations, especially in Exploration and Production, and Refing and Petrochemicals, in particular in cyclone-prone areas. These physical risks could affect Total’s business and value chain in the following way: The utilization rate of the production capacity could be less than expected in the event of major physical incident; The other consequences would be the repair costs to restore a normal situation and resume production, and a loss of revenue during the downtime; Geographical areas considered as highly exposed to hurricanes are the Gulf of Mexico and South-East Asia. In the USA, Total operates a refinery and a chemical plant in Port Arthur, Texas, and has some petrochemical plants in Texas. For Total, the financial implications are generally estimated on the basis on a number of days of lost production on a site and the corresponding loss of revenue (products not sold to customers during the downtime). For
460

Total S.A.
example, in average, a production stop of one month of a refinery would represent an operational loss of about 30 MUSD (one month corresponds to the average production stop faced during the last hurricanes in the USA). The potential financial implications of physical risks are limited when considering our global activities in 130 countries, so any weather-related event in a given country would only affect a small proportion of our activities at a given time. Given their locations, E&P production sites operated by Total have so far suffered relatively limited exposure to extreme weather events. Geographical areas considered as highly exposed to hurricanes are the Gulf of Mexico and South-East Asia. Total has implemented an active process in order to regularly conduct vulnerability studies of our facilities, and our internal procedures specifically call for the systematic assessment of the possible repercussions of climate change on future projects. In-depth studies are carried out when the potential risk is significant relative to the existing safety margin. Our analyses take into account the life span of our projects and their capacity to gradually adapt. To date, these studies have not identified any facilities that cannot withstand the consequences of climate change. For instance, the effect of climate change on the evolution of tropical cyclones offshore Australia has been accounted for to design Ichthys LNG development. For Upstream activities in particular, there is a dedicated team, coordinating specific studies for all assets: the annual cost (FTE + external studies) is approximately 1 M€, excluding additional costs potentially due to specific site surveys. Dealing with physical risks attached to new projects in more exposed areas is integrated into the engineering and economic characteristics of the projects.” (Total.CDP1, pp. 19-20)
INDICATOR 3AIII. MARKET AND OTHER INDIRECT RISKS AND OPPORTUNITIES Score: (2) Rationale: Total details some examples of how it might be affected by market
and other indirect risks and opportunities related to climate change, but has not explicitly discussed recent high-profile climate litigation
461

Total S.A.
in which it is a defendant (i.e., County of San Mateo v. Chevron Corp.).
Source(s): “Firstly, there is a risk incurred by rapidly changing modes of
energy production in favor of a lower-carbon energy mix that allows for a more limited share of fossil fuel. This could impact the Group’s business model, profitability, financial situation and shareholder value. The growing concern of certain stakeholders with regards to climate change could also have an impact on certain external financing of the Group’s projects or influence certain investors involved in the oil and gas sector.” (Total.IR, p. 76)
“In addition to the adverse effect on the Group’s revenues, margins and profitability, a prolonged period of low oil and natural gas prices could lead the Group to review its projects and the evaluation of its assets and oil and natural gas reserves. Prices for oil and natural gas may fluctuate widely due to many factors over which TOTAL has no control. These factors include... changes in demographics, notably population growth rates, and consumer preferences.” (Total.IR, pp. 74-75)
“Operational accidents in the oil and gas sector may cause the release of high quantities of pollutants / GHG emissions. The degraded reputation may result in a lack of confidence from investors and/or poor acceptability from stakeholders. A similar situation in terms of reputation may result from a slow reaction of the company to the energy transition.” (Total.CDP1, p. 13)
“Alongside natural gas, electricity is making a growing contribution to new forms of mobility, as consumers, municipal fleets and mass transit increasingly turn to electric vehicles. In addition to investing in battery development through Saft, Total is devising a number of electric charging solutions for municipalities, businesses, consumers and service station networks.” (Total.FPS1, p. 8)
“...we’re now providing natural gas and power to residential customers: our recent launch of Total Spring and our acquisition of Direct Energie will bring us closer to the consumer market and
462

Total S.A.
enhance our ability to anticipate demand for affordable, clean energy.” (Total.FPS1, p. 28)
“Some investors may divest from Total if they consider that some of our assets are stranded. For instance those with high carbon intensities (coal, oil sands, etc.). Indeed, the UNFCCC Paris Agreement has set a clear 2°C objective for the world, and has engaged countries to take action in order to reach this objective. If the world is to have a chance of not exceeding global warming of 2°C, a carbon budget should not be exceeded. This has led some analysts to consider that coal, oil and gas reserves of publicly listed companies are ‘unburnable’ – the so-called stranded assets.” (Total.CDP1, p. 16)
“Since 2016, there has been some legal cases involving oil and gas companies: some cases argue that some oil industry or other major fossil fuel producers should be held accountable for climate impacts. Other cases involve cities or local governments asking O&G companies to pay a fair share of their local climate change costs.” (Total.CDP1, p. 13)
“...the Company and several of its subsidiaries received claims issued by public entities in certain countries in view of financing the protective measures to be implemented in order to limit the consequences of climate change. The Group is subject to the risk of judicial actions in this area.” (Total.IR, p. 77)
“There are no governmental, legal or arbitration proceedings, including any proceeding of which the Company is aware that are pending or threatened against the Company, that could have, or could have had during the last 12 months, a material impact on the Group’s financial situation or profitability. Described below are the main administrative, legal and arbitration proceedings in which the Company and the other entities of the Group are involved...” (Total.IR, p. 85)
INDICATOR 3B. DELEGATION OF BOARD MEMBERS AND/OR COMMITTEES WITH EXPLICIT OVERSIGHT OF CLIMATE CHANGE POLICY Score: (3)
463

Total S.A.
Rationale: Total’s Board of Directors maintains an internal "Strategic & CSR”
committee whose rules of procedure were recently broadened to include CSR and climate-related corporate governance.
Source(s): “The Board of Directors relies on the work of four Committees
that it has constituted: the Audit Committee, the Governance and Ethics Committee, the Compensation Committee and the Strategy & CSR Committee.” (Total.20F, p. 5)
“TOTAL’s Board of Directors ensures that climate-related issues are incorporated into the Group’s strategy and examines climate change risks and opportunities during the annual strategic outlook review of the Group’s business segments...To carry out its work, the Board of Directors relies on its Strategic & CSR Committee, whose rules of procedure were changed in September 2017 then in July 2018 in order to broaden its missions in the realm of CSR and in questions relating to the inclusion of climate-related issues in the Group’s strategy.” (Total.IR, p. 105)
“The Strategy & CSR Committee had six members. With the exception of Mr. Pouyanne (i.e., Total’s CEO), who chairs the committee, all members of this Committee have been deemed independent by the Board of Directors (according to point 14.1 of the AFEP-MEDEF Code, directors representing the employee shareholders and directors representing employees are not taken into account when determining this percentage).” (Total.20F, p. 24)
“The rules of procedure of the Strategy & CSR Committee define the Committee’s duties as well as its working procedures. To allow the Board of Directors of TOTAL S.A. to ensure the Group’s development, the Strategy & CSR Committee’s duties include: (1) examining the Group’s overall strategy proposed by the Company’s Chief Executive Officer; (2) examining the Group’s corporate social and environmental responsibility (CSR) issues and, in particular, issues relating to the incorporation of the Climate challenge in the Group’s strategy; (3) examining operations that are of particular strategic importance; (4) reviewing the competitive environment, the main challenges the Group faces, including with regard to social and environmental responsibility, as well as the
464

Total S.A.
resulting medium and long-term outlook for the Group.” (Total.IR, p. 137)
“TOTAL’s Chairman and Chief Executive Officer, in compliance with the long-term strategic direction set by the Board of Directors, implements the strategy of the Group and its business segments while making sure climate change challenges are taken into account. He relies on the President, Group Strategy-Innovation, who is a member of the Executive Committee, to whom the Senior Vice President Strategy & Climate, and the Senior Vice President Climate report (refer to the Group organization chart in chapter 1). The Senior Vice President Climate chairs the Climate-Energy steering Committee, which mainly includes representatives of Strategy and HSE management from the various business segments. The mission of this Committee consists of structuring the Group’s approach to the climate.” (Total.IR, p. 105)
“To allow the Board of Directors of TOTAL S.A. to ensure the Group’s development, the Committee’s (i.e., Strategy & CSR committee) duties include...examining the Group's corporate social and environmental responsibility (CSR) issues and, in particular, issues relating to the incorporation of the Climate challenge in the Group's strategy.” (Total.CCC1, p. 1)
INDICATOR 3C. DOES THE COMPANY SUPPORT CLIMATE-RELATED SHAREHOLDER RESOLUTIONS? Score: (3) Rationale: Total has not faced any climate-related shareholder resolutions put
forward by established networks of socially responsible investors during the reporting period.
Source(s): (see Ceres – Climate and Sustainability Shareholder Resolutions
Database; SEC – Division of Corporate Finance 2019; SEC – Division of Corporate Finance 2018)
465

Total S.A.
CRITERION 4 – WHAT ARE THE COMPANY’S AFFILIATIONS WITH THIRD PARTIES THAT SPREAD DISINFORMATION ON CLIMATE SCIENCE? INDICATOR 4A. THE AMERICAN LEGISLATIVE EXCHANGE COUNCIL (ALEC) Score: (3) Rationale: Total is based in France and has no operations in the association’s
jurisdiction. Further, the company is not cited by Source Watch or DeSmogBlog as having ever been affiliated with the association.
Source(s): (see Source Watch - ALEC; DeSmogBlog – ALEC) INDICATOR 4B. THE AMERICAN PETROLEUM INSTITUTE (API) Score: (2) Rationale: Total is a current member of API, but presently does not hold a
leadership position in the association. Source(s): (see API – Members; see also DeSmogBlog – API) INDICATOR 4C. THE NATIONAL ASSOCIATION OF MANUFACTURERS (NAM) Score: (3) Rationale: Total is based in France and is neither in NAM’s current BOD list nor
noted by DeSmogBlog as having ever been affiliated with association.
Source(s): (see NAM – Board of Directors; DeSmogBlog – NAM) INDICATOR 4D. THE WESTERN STATES PETROLEUM ASSOCIATION (WSPA) Score: N/A
466

Total S.A.
Rationale: Total is based in France and has no operations in the association’s
jurisdiction, not mentioned by DeSmogBlog as having ever been affiliated with the association and is not listed as a corporate member on WSPA’s website.
Source(s): (see WSPA – Member Companies; DeSmogBlog – WSPA) INDICATOR 4E. AMERICAN FUEL AND PETROCHEMICAL MANUFACTURERS (AFPM) Score: (1) Rationale: Christophe Gerondeau, Senior Vice President Total Petrochemicals
& Refining USA, a Total subsidiary, is a member of AFPM’s board of directors.
Source(s): (see Total.TPS1, p. 33; see also AFPM – Membership Directory;
DeSmogBlog – AFPM) CRITERION 5 – DOES THE COMPANY PUBLICLY SUPPORT THE NEED FOR CLIMATE POLICY AND REGULATIONS? INDICATOR 5A. REGULATIONS, CARBON TAX, EMISSIONS TRADING, RENEWABLE ENERGY, CCS, ETC. Score: (4) Rationale: Total has publicly advocated for the adoption of governmental
carbon policies and is a member of the Make Power Clean initiative, which recently advocated in favor of specific climate-related legislation (e.g., “Regulation on the Internal Market for Electricity”) before the Council of the EU in 2019.
Source(s): “We are calling for the rapid adoption of pricing mechanisms that are
tailored to specific circumstances, such as geographical region or economic sector, and can be gradually linked. Currently, the most pressing issue is simply to promote the idea of carbon pricing in any
467

Total S.A.
form. For example, we support the immediate adoption of a floor price of approximately €20 per ton of carbon. This would strengthen the European Union emissions market and accelerate the switch to natural gas from coal for power generation. We have been campaigning toward this goal since 2015, notably through international initiatives that give our message a wider reach, such as the World Bank’s Carbon Pricing Leadership Coalition, of which Total has been a member since 2016. More recently, Total has joined the Climate Leadership Council as a founding member and endorsed its carbon dividends plan.” (Total.FPS1, p. 14)
“In 2014, Total decided to join the call of the United Nations Global Compact, which encourages companies to consider a CO2 price internally and publicly support the importance of such a price via regulation mechanisms suited to the local contexts. Total now also helps to deploy the World Bank’s Carbon Pricing Leadership Coalition (CPLC). Total advocates the introduction of carbon pricing frameworks in all countries.” (Total.CDP1, p. 82)
“In May 2015, six global oil and gas companies — BG, BP, Eni, Equinor (then Statoil), Shell and Total — sent an open letter to the United Nations Framework Convention on Climate Change (UNFCCC) and the Presidency of COP21 calling for the introduction of carbon pricing mechanisms. Their goal was to reduce uncertainty and promote more economically efficient methods to decrease carbon emissions worldwide.” (Total.FPS1, p. 15; see also Total.FPS2)
“Total supports one single GHG reduction target for Europe, as described in January 2014 in the European Energy and Climate Change package for 2030....Total supports the greenhouse gas emission reduction targets and the provisions approved in December 2008 in the European Energy and Climate Change package for 2020.” (Total.CDP1, p. 82)
“…Europe can build a cleaner future for its citizens – but only with the right electricity market design. As the vote in the ITRE committee approaches, we call on you to act consistently and endorse the proposal to limit access to capacity mechanisms to plants emitting 550g CO2/kWh or less as a way of ensuring a
468

Total S.A.
cleaner power supply for all Europeans. To make a difference, the 550g carbon criterion should enter into force as quickly as possible, for all power plants, and cover the widest possible scope. Limiting exceptions and insisting on a rapid implementation is the best way to ensure Europe meets its ambitious climate objectives, unlocking the potential of cleaner energy supply and promoting renewables’ growth. The European Parliament can be once again the voice of ambition and leadership by defending the right of European citizens to have energy policies that work towards our climate goals... Make Power Clean is a campaign that brings together companies and associations focused on ensuring that Europe’s future power market is consistent with the EU climate commitments and will provide cleaner energy for all…This letter is endorsed by: BNE, Eni, ESIA (European Semiconductor Industry Association), ESTELA (European Solar Thermal Electricity Association), Eurogas, EBA (European Biogas Association), First Solar, Gas Natural Fenosa, Gassco, Joule Assets, NOROG (Norsk Olje & Gass), Nordex Acciona, PKA, REstore, Siemens, Shell, SNAM, SMA, Solar Power Europe, Statoil, Total, VaasaETT, Voltalis, Wintershall.” (Total.TPS2)
INDICATOR 5B. PARIS AGREEMENT Score: (4) Rationale: Total has explicitly endorsed the Paris Climate Agreement’s global
temperature targets and actively campaigned for legislation that would further the goals of the Agreement (e.g., “Regulation on the Internal Market for Electricity”) through its membership in the Make Power Clean Initiative.
Source(s): “…Europe can build a cleaner future for its citizens – but only with
the right electricity market design. As the vote in the ITRE committee approaches, we call on you to act consistently and endorse the proposal to limit access to capacity mechanisms to plants emitting 550g CO2/kWh or less as a way of ensuring a cleaner power supply for all Europeans. To make a difference, the 550g carbon criterion should enter into force as quickly as possible, for all power plants, and cover the widest possible scope. Limiting exceptions and insisting on a rapid implementation is the
469

Total S.A.
best way to ensure Europe meets its ambitious climate objectives, unlocking the potential of cleaner energy supply and promoting renewables’ growth. The European Parliament can be once again the voice of ambition and leadership by defending the right of European citizens to have energy policies that work towards our climate goals... Make Power Clean is a campaign that brings together companies and associations focused on ensuring that Europe’s future power market is consistent with the EU climate commitments and will provide cleaner energy for all…This letter is endorsed by: BNE, Eni, ESIA (European Semiconductor Industry Association), ESTELA (European Solar Thermal Electricity Association), Eurogas, EBA (European Biogas Association), First Solar, Gas Natural Fenosa, Gassco, Joule Assets, NOROG (Norsk Olje & Gass), Nordex Acciona, PKA, REstore, Siemens, Shell, SNAM, SMA, Solar Power Europe, Statoil, Total, VaasaETT, Voltalis, Wintershall.” (Total.TPS2)
“Our shared ambition is for a 2°C future. It is a challenge for the whole of society. We are committed to playing our part.” (Total.TPS3)
“The IEA’s Sustainable Development Scenario lays out an integrated strategy for achieving multiple objectives related to energy, such as mitigating the impact on climate, improving air quality and ensuring universal access to modern energy services. A rapid decrease in carbon emissions consistent with the Paris Agreement is a crucial factor.” (Total.FPS1, p. 12)
“We acknowledge that the current trend of greenhouse gas emissions is in excess of what the Intergovernmental Panel on Climate Change (IPCC) says is needed to limit the temperature rise to no more than 2 degrees above pre-industrial levels...For us to do more, we need governments across the world to provide us with clear, stable, long-term, ambitious policy frameworks...We believe that a price on carbon should be a key element of these frameworks.” (Total.FPS2)
“Total is active in many joint initiatives, such as the Oil and Gas Climate Initiative (OGCI), with other energy majors. Moreover, we maintain a dialogue with national and regional governments, as
470

Total S.A.
well as provide support to start-ups through Total Energy Ventures. Only by mobilizing our collective energy can we tackle the full scale of the challenges posed by climate change.” (Total.FPS1, p. 6)
CRITERION 6 – HAS THE COMPANY BEEN PUBLICLY TRANSPARENT ABOUT ITS POSITION, ACTIONS, AND AFFILIATIONS WITH REGARD TO CLIMATE SCIENCE AND CLIMATE CHANGE? INDICATOR 6A. WEBPAGE DEDICATED TO CLIMATE CHANGE Score: (5) Rationale: Total maintains a separate webpage on its website devoted to
climate change. Source(s): (see Total.CWS2) INDICATOR 6B. STAND-ALONE SUSTAINABILITY REPORT WITH SPECIFIC REFERENCE TO CLIMATE CHANGE Score: (5) Rationale: Total produces a sustainability report (i.e., “Integrating Climate Into
Our Strategy”) that is easily accessible from its website and has a section dedicated to climate change (i.e., “Shaping Tomorrow’s Energy”).
Source(s): (see Total.FPS1, p. 12) INDICATOR 6C. DISCLOSURE TO CDP Score: (5) Rationale: CDP website indicates “Submitted” from Total for Climate Change
2019. Source(s): (see Total.CDP2)
471

Total S.A.
INDICATOR 6D. DISCLOSURE OF THIRD-PARTY RELATIONSHIPS AND LOBBYING ACTIVITIES Score: (5) Rationale: Total publishes a list of “professional associations which Total
supports or is a member.” Source(s): (see Total.CWS3, Total.FPS3) INDICATOR 6E. REPORT ON CLIMATE RELATED RISK SCENARIOS Score: (5) Rationale: Total’s 2018 “Integrating Climate Into Our Strategy” report includes
an analysis on what a 2°C or lower increase in global temperature would mean for its businesses, strategies, and financial planning (note that Total’s analysis is not a standalone section of the report).
Source(s): “Preparing for the future and becoming the responsible energy major
also means being able to rethink the way we do things so that we can reduce our environmental impact. We take steps to ensure continuous improvement and have fully integrated the 2°C Sustainable Development scenario put forward by the International Energy Agency (IEA) into our strategy to reduce our greenhouse gas emissions and enhance our energy efficiency.” (Total.CWS4)
“The IEA’s Sustainable Development Scenario lays out an integrated strategy for achieving multiple objectives related to energy, such as mitigating the impact on climate, improving air quality and ensuring universal access to modern energy services. A rapid decrease in carbon emissions consistent with the Paris Agreement is a crucial factor.” (Total.FPS1, p. 12)
“All IEA scenarios give an expanded role to natural gas in the global energy mix. Gas consumption is expected to climb by at least 20% to 2040, accounting for nearly one-quarter of energy demand worldwide...Thanks to strong investment and our commitment to keeping project costs down, natural gas accounted for nearly half
472

Total S.A.
of our overall production in 2017, compared to about 35% in 2005. We expect that figure to approach 60% within 20 years.” (Total.FPS1, p. 27)
“Electricity is coming to the forefront worldwide and in every scenario outlined by the IEA. By 2040, it will account for 40% of the rise in final consumption, the same share of growth as oil over the past 25 years. To address the need for clean, affordable energy while complying with the IEA’s Sustainable Development Scenario, the world will need to curtail its use of coal for power generation and make greater use of low-carbon energy sources...At Total, we have taken this planetary imperative to heart. Confronted with a fast-growing and increasingly digital and distributed market, we created a new business segment — Gas, Renewables & Power (GRP) — tasked with managing the resources that will drive the energy transition.” (Total.FPS1, p. 33)
“The IEA estimates that between now and 2040, renewable energies are likely to meet nearly 40% of the rise in global demand for primary energy. As their cost comes increasingly within reach (production costs have fallen 70% for photovoltaic solar power plants, 25% for wind power and 40% for batteries since 2010), renewable energies are assuming an even more integral role in Total’s ambition of supplying clean, affordable energy to as many people as possible. Thanks to our recent acquisitions, we have substantially expanded capacity for generating power from renewable sources. In addition to the utility-scale solar plants that Total Solar has designed in OECD countries, we are now poised to serve emerging markets with solar and wind power plants from Total Eren.” (Total.FPS1, p. 35)
“The IEA estimates that the reservoirs currently producing oil contain approximately 1.7 trillion barrels, and that 40% of the world’s current proved reserves could meet our oil needs for the period 2014-2035. However, it is thought that one-third of those needs will be met by reservoirs that are not yet in production or have yet to be discovered, and those fields could be more environmentally or financially advantageous than some reservoirs already discovered...We are focusing on assets with competitive production and processing costs and which meet the highest
473

Total S.A.
safety and environmental standards...Guided by that principle, Total acquired Maersk Oil, in the process becoming the second-largest operator in the North Sea. At the same time, we sold our stake in Norway’s Martin Linge field, where operating costs were high. Through those decisions, we are restructuring and expanding our presence in the strategic North Sea region and creating the potential for strong operational synergies.” (Total.FPS1, p. 41)
“The IEA 2018 World Energy Outlook anticipates three scenarios (New Policies Scenario (NPS), Current Policies Scenario (CPS) and Sustainable Development Scenario (SDS)). Among these scenarios, the NPS (central scenario of the IEA) and the SDS are important references for the Group...The NPS sees a significant increase in oil and gas demand until 2025 and then a slower growth until 2040 (despite a significant penetration of electric vehicles and, above all, significant efficiency gains). The SDS sees a decline in demand in the first half of the 2020s for oil and a stabilization after 2030 for gas due to the substitution efforts and an accelerated diffusion of efficiency gains.” (Total.IR, p. 275)
474

Woodside Petroleum
XXIX. Woodside Petroleum CRITERION 1 – WHAT IS THE COMPANY’S POSITION ON CLIMATE SCIENCE? INDICATOR 1A. CONSISTENTLY ACCURATE PUBLIC STATEMENTS ON CLIMATE SCIENCE AND THE CONSEQUENT NEED FOR SWIFT AND DEEP REDUCTIONS IN EMISSIONS FROM THE BURNING OF FOSSIL FUELS Score: (3) Rationale: Woodside has consistently acknowledged the scientific evidence of
climate change in all public company platforms and warned about the consequences of inaction, but has not affirmed the consequent need for swift and deep reductions in emissions from the burning of fossil fuels.
Source(s): “Woodside recognises the scientific consensus on climate
change and the challenge of providing safe, clean, affordable and reliable energy whilst reducing emissions. Woodside is committed to being part of the solution. We believe hydrocarbons will continue to be vital in meeting the world’s energy needs and that the benefits of natural gas, in particular, will see it play an increasingly important role globally both in the energy mix and in reducing greenhouse gas emissions.” (Woodside.FPS1)
“If we are going to succeed in our Paris goal of avoiding dangerous climate change, we all need to work together.” (Woodside.FPS2, p. 1)
“We do think gas needs to be part of the solution – but that’s not the only reason I support a global carbon price. The scientists have warned of the consequences of inaction. If we wait to see if they are right, it will be too late to act. So, prudence dictates that we think about what contribution we can make, individually and collectively, to limiting climate change and mitigating its effects. We owe it to our children and grandchildren. Business leaders are used to calculating risk and managing it. Clearly, the risk of inaction is too great. If we are to have a chance of transitioning to a lower-
475

Woodside Petroleum
carbon economy, large and experienced companies like Woodside will play a crucial role.” (Woodside.FPS3, p. 1)
“As we approach big investment decisions, we carefully weigh a range of factors. It’s an uncertain world, and we try to account for those uncertainties – around geopolitics, around climate change and the world’s response to it.” (Woodside.AR, p. 9)
CRITERION 2 – WHAT MEASURES IS THE COMPANY TAKING TO REDUCE ITS CARBON FOOTPRINT? INDICATOR 2A. GHG EMISSIONS TARGETS Score: (2) Rationale: Woodside’s plan for reducing GHG emissions is neither science-
based nor in the service of a specific temperature goal or target. Source(s): “Since 2016, we have improved our energy efficiency by 3.4%
against baseline performance and we are on track to achieve our 2020 target of 5%...Our goal is to improve our energy efficiency by 5% from baseline performance by 2020, and develop new opportunities for LNG to displace higher-emission fuels. Beyond this, leadership attention has progressed to considering sustainable and resilient longer-term targets.” (Woodside.SR, p. 26)
“We set annual targets to measure our performance on material sustainability topics and challenge ourselves to do better...2019 target of energy efficiency improvement against baseline performance (%) is measured relative to energy efficiency prior to 2016. This aligns with Woodside’s aim to improve energy efficiency by 5% by 2020, and includes both absolute emissions reductions and energy efficiency improvements of delivered projects. Sustainable emissions reductions, fuel and flare targets will still be monitored for performance.” (Woodside.SR, p. 9)
INDICATOR 2B. GHG EMISSIONS REDUCTIONS Score: (2)
476

Woodside Petroleum
Rationale: Company’s GHG emissions intensity has increased in one of the last
two reporting years and increased as a whole over the last two reporting years.
Source(s): [see Supplemental Data] INDICATOR 2C. R&D INTO LOW-CARBON TECHNOLOGIES Score: (1) Rationale: Woodside has not publicly committed to funding R&D into low-
carbon technologies and has not disclosed a budget for doing so. Source(s): “We work to reduce our (net) emissions intensity, through
improvements in our energy efficiency, investments in biosequestration projects and innovations in our production processes...We innovate to create opportunities within or adjacent to our assets, including in carbon management and integrated energy solutions, such as incorporating renewables and battery storage into our facilities' power supply.” (Woodside.CO2R, p. 2)
We aim to accelerate development of technology to manage Woodside’s carbon and greenhouse gas emissions. This requires a portfolio of abatement mechanisms across reduction, sequestration and uses of carbon. We actively monitor fugitive emissions and developments in renewables and high efficiency power generation.” (Woodside.FPS4)
“In late 2018, we established a dedicated, multidisciplinary team to build a portfolio of CO2 offset mechanisms considering reduction, sequestration and other uses of carbon. We also progressed plans to integrate industrial-scale solar power generation with gas-fired generation and battery storage for our future Burrup Hub LNG operations. Reducing fuel gas consumption on the Burrup Peninsula will increase the amount of gas available for LNG production, yielding both environmental and commercial benefits. In the longer term, we are exploring opportunities to commercially produce and export hydrogen.” (Woodside.SR, p. 40)
477

Woodside Petroleum
INDICATOR 2D. USE OF AN INTERNAL PRICE ON CARBON Score: (2) Rationale: Woodside employs an internal price on carbon but does not disclose
the price. Source(s): “We test the robustness of our investments against a range of
low-outcome and low-carbon scenarios. We set higher target metrics for investments with increased complexity and risk, and seek to preserve any upside potential. A typical metric required for investment is a target ungeared internal rate of return between 12% and 15%.” (Woodside.AR, p. 23)
“OBJECTIVE - Woodside recognises the scientific consensus on climate change and the challenge of providing safe, clean, affordable and reliable energy whilst reducing emissions. Woodside is committed to being part of the solution. We believe hydrocarbons will continue to be vital in meeting the world’s energy needs and that the benefits of natural gas, in particular, will see it play an increasingly important role globally both in the energy mix and in reducing greenhouse gas emissions. PRINCIPLES - Woodside will achieve the objective by:...Supporting lowest cost abatement through global carbon pricing.” (Woodside.FPS1)
CRITERION 3 – IS CLIMATE SCIENCE INTEGRAL TO THE GOVERNANCE AND OVERSIGHT OF THE COMPANY? INDICATOR 3A. DELINEATION OF RISKS AND RISK MANAGEMENT PROCEDURES RELATED TO CLIMATE CHANGE INDICATOR 3AI. REGULATORY RISKS Score: (2) Rationale: Woodside’s disclosures relating to risks associated with current or
proposed climate change-related laws and regulations neither
478

Woodside Petroleum
pinpoint specific laws or regulations nor identify effects particular to the company.
Source(s): “Risk: In each of the countries where we do business, Woodside is
subject to various national and local laws, regulations and approvals, and stakeholder expectations. These relate to the exploration, development, production, marketing, pricing, transportation and storage of our products, and changes or failure to comply with these may impact our licence to operate. Mitigation: As we increase our global footprint, we continue to strengthen our regulatory compliance framework and supporting tools. We also proactively maintain relationships with governments, regulators and stakeholders within countries in which we operate and those of interest.” (Woodside.AR, p. 60)
“Context: Woodside faces climate change related risks including changes in product demand, carbon pricing, uncertainty surrounding future regulatory frameworks and increased stakeholder expectations. Risk: Demand for oil and gas may subside as lower carbon substitutes take market share. Global climate change policy remains uncertain and has the potential to constrain Woodside’s ability to create and deliver stakeholder value from the commercialisation of our hydrocarbons. Mitigation: We are focusing on ensuring our portfolio is robust in a carbon constrained market, improving our energy efficiency, and maintaining engagement with key industry and government stakeholders. We are implementing strategies to diversify our product mix, diversify use of our products, broaden our customer base and increase our portfolio resilience.” (Woodside.AR, p. 62)
INDICATOR 3AII. PHYSICAL RISKS Score: (3) Rationale: Woodside acknowledges climate change as contributor to the
physical risks facing its business, and discusses mitigation efforts broadly, but does not identify how and to what degree its operations might be impacted.
479

Woodside Petroleum
Source(s): “We ensure our assets withstand any future physical impacts from
climate change and we monitor and apply the latest research in this area. This was recognised by the 2018 Carbon Disclosure Project report that ranked Woodside as first (best) in regards to managing physical risk out of our peer group.” (Woodside.SR, p. 27)
“Risk: Sustained, unplanned interruption to production may impact our licence to operate and financial performance. Our facilities are subject to operating hazards associated with major accident events, cyber-attack, inclement weather and disruption to supply chain, which can result in a loss of hydrocarbon containment, diminished production, additional costs, environmental damage or harm to our people, reputation or brand. Mitigation: Our world-class operational performance is based on an extensive framework of controls which enable the management of these risks. This includes production processes, drilling and completions and well integrity management processes, inspection and maintenance procedures and performance standards. This framework is supported by the ongoing engagement we have with regulators.” (Woodside.AR, p. 60)
INDICATOR 3AIII. MARKET AND OTHER INDIRECT RISKS AND OPPORTUNITIES Score: (3) Rationale: Woodside identifies market and other indirect risks and opportunities
related to climate change, but provides limited analysis of their potential financial impacts for the company.
Source(s): “Unsuccessful development and delivery of new technology and new
products through innovation may impact competitive advantage...We are reducing unit costs for developments and deploying technology solutions in new business opportunities to deliver our strategic objectives. We aim to respond nimbly to emerging trends, disruptive innovations and complementary technologies.” (Woodside.AR, p. 62)
480

Woodside Petroleum
“Demand for and pricing of our products remain sensitive to external economic and political factors, weather, natural disasters, introduction of new and competing supply, and change within buyer preferences for differing products and price regimes...Woodside mitigates the uncertainty associated with product demand by selling LNG in a portfolio manner and under long-term ‘take or pay’ sale agreements, in addition to the spot market. Our low cost of production and approach to balance sheet risk management further mitigate this exposure.” (Woodside.AR, p. 61)
“Woodside faces climate change related risks including changes in product demand...Demand for oil and gas may subside as lower carbon substitutes take market share...We are implementing strategies to diversify our product mix, diversify use of our products, broaden our customer base and increase our portfolio resilience.” (Woodside.AR, p. 62)
INDICATOR 3B. DELEGATION OF BOARD MEMBERS AND/OR COMMITTEES WITH EXPLICIT OVERSIGHT OF CLIMATE CHANGE POLICY Score: (3) Rationale: Woodside has one board committee with oversight of climate-related
governance. Source(s): “Responsibility for climate change issues ultimately rests with
the Woodside Board. The Board is supported and informed by the Sustainability Committee, which comprises six non-executive directors and meets twice a year. The executive leadership team provides bi-annual governance over climate change risks in line with the Woodside risk management process. The Vice President Health Safety Environment and Quality has day-to-day accountability for managing climate change risk on behalf of the Chief Operations Officer.” (Woodside.CWS1)
“The Sustainability Committee (Committee) will assist the Board to meet its oversight responsibilities in relation to the Company’s sustainability policies and practices...The duties of the Committee include reviewing, and making recommendations to the Board on, the Company’s policy and performance in relation to
481

Woodside Petroleum
sustainability-related matters, including...the environment...climate change.” (Woodside.CCC1, p. 1)
INDICATOR 3C. DOES THE COMPANY SUPPORT CLIMATE-RELATED SHAREHOLDER RESOLUTIONS? Score: (3) Rationale: Woodside has not faced any climate-related shareholder resolutions
put forward by established networks of socially responsible investors in the reporting period.
Source(s): (see Ceres – Climate and Sustainability Shareholder Resolutions
Database; SEC – Division of Corporate Finance 2019; SEC – Division of Corporate Finance 2018)
CRITERION 4 – WHAT ARE THE COMPANY’S AFFILIATIONS WITH THIRD PARTIES THAT SPREAD DISINFORMATION ON CLIMATE SCIENCE? INDICATOR 4A. THE AMERICAN LEGISLATIVE EXCHANGE COUNCIL (ALEC) Score: (3) Rationale: Woodside is based in Australia and is not cited by Source Watch or
DeSmogBlog as having ever been affiliated with association. Source(s): (see Source Watch - ALEC; DeSmogBlog – ALEC) INDICATOR 4B. THE AMERICAN PETROLEUM INSTITUTE (API) Score: (3) Rationale: Woodside is based in Australia and is neither listed as a member on
API’s website nor cited by Source Watch or DeSmogBlog as having ever been affiliated with association.
Source(s): (see API – Members; DeSmogBlog – API)
482

Woodside Petroleum
INDICATOR 4C. THE NATIONAL ASSOCIATION OF MANUFACTURERS (NAM) Score: (3) Rationale: Woodside is based in Australia and is neither in NAM’s current BOD
list nor noted by DeSmogBlog as having ever been affiliated with association.
Source(s): (see NAM – Board of Directors; DeSmogBlog – NAM) INDICATOR 4D. THE WESTERN STATES PETROLEUM ASSOCIATION (WSPA) Score: N/A Rationale: Woodside is based in Australia and has no operations in the
association’s jurisdiction. Further, Woodside is neither mentioned by DeSmogBlog as having ever been affiliated with the association nor listed as a corporate member on WSPA’s website.
Source(s): (see WSPA – Member Companies; DeSmogBlog – WSPA) INDICATOR 4E. AMERICAN FUEL AND PETROCHEMICAL MANUFACTURERS (AFPM) Score: (3) Rationale: Woodside is based in Australia and is neither in AFPM’s current
membership list nor noted by DeSmogBlog as having ever been affiliated with association.
Source(s): (see AFPM – Membership Directory; DeSmogBlog – AFPM) CRITERION 5 – DOES THE COMPANY PUBLICLY SUPPORT THE NEED FOR CLIMATE POLICY AND REGULATIONS?
483

Woodside Petroleum
INDICATOR 5A. REGULATIONS, CARBON TAX, EMISSIONS TRADING, RENEWABLE ENERGY, CCS, ETC. Score: (2) Rationale: Woodside has publicly called for a global carbon price and an
international offset framework, but nevertheless publicly opposed the Western Australian Environmental Protection Authority’s proposed assessment guidelines for GHG emissions which the company believes “…significantly oversteps Australia’s Paris emissions reduction targets and sets a standard that is beyond the current capacity of WA’s offset industry to safely and sustainably deliver.”
Source(s): “Our CEO has publicly advocated for a global carbon price as
the best way to drive the transition to a lower carbon world. In the absence of an appropriate carbon price, we risk a perverse outcome where the lowest cost of reliable supply into the market remains the greatest emitter of carbon, offsetting the benefits offered by renewables and low-carbon emitters. We continue to promote this position and our broader support for a competitive, lower carbon economy in our engagements with relevant stakeholders. This also extends to participation in global events including the UN climate change conference, COP24, held in Poland in December 2018.” (Woodside.SR, p. 27)
“International carbon offsets would be a big step forward in allowing emissions reduction to be achieved at the lowest global cost. We can progress that at the COP 24 in Poland in December by agreeing the rules for their application.” (Woodside.FPS5, p. 3)
“We support policies that deliver carbon abatement at lowest cost and enhance competitiveness.” (Woodside.CO2R, p. 2)
“A new Assessment Guideline for greenhouse gas emissions unveiled by the Western Australian Environmental Protection Authority (EPA) is inconsistent with Australia’s Paris climate goals and threatens WA jobs, Woodside CEO Peter Coleman said...“The EPA’s proposal significantly oversteps Australia’s Paris emissions reduction targets and sets a standard that is
484

Woodside Petroleum
beyond the current capacity of WA’s offset industry to safely and sustainably deliver. “National action on climate change is essential, but this imposition of an immediate ‘net zero’ emissions target for WA projects comes 30 years ahead of the Climate Change Authority’s recommendation to achieve that outcome in 2050. “Not only will this proposal put at risk new jobs, investment and domestic gas supplies, it positions WA at a competitive disadvantage in the global LNG marketplace. “The State Government should reject this approach and commit to tackling this important policy area in a way that complements our national emissions reduction targets and recognises WA’s aspirations not only for the environment but for a sustainable economic future,” he said.” (Woodside.FPS6)
“Last week the state’s Environmental Protection Authority issued a Guideline that makes clear it will recommend the State Government reject any industrial projects if they do not immediately reduce or offset their greenhouse gas emissions to zero. This significantly oversteps both the current national emissions reduction target under the Paris Agreement, of 26 to 28% by 2030, and the federal opposition’s preference for a 45% cut by 2030 and net zero by 2050...We are taking action to abate emissions - but the reality is the offset market in Australia is not yet able to deliver the immediate net zero that the EPA seeks. The EPA guideline sets a presently unachievable emissions reduction target and is effectively asking WA to once again underwrite the national effort.” (Woodside.FPS7)
INDICATOR 5B. PARIS AGREEMENT Score: (2) Rationale: Woodside repeatedly references the Paris Agreement when publicly
advocating for a global carbon price, but has not explicitly endorsed the Agreement’s goal of keeping global temperature increase well below 2°C and pursuing efforts to limit it to 1.5°C.
Source(s): “We can make more investments in cleaner energy if we have
stable policies at the national level that set Australia on a steady course to meet its Paris goals. It is that steadiness of intent that will give business clear signals and the confidence to invest in
485

Woodside Petroleum
projects that will create jobs and opportunities for Western Australians.” (Woodside.FPS2, p. 2)
“Without a global carbon price, we are stuck with a patchwork of national approaches, loosely Ecoordinated under the Paris Agreement. And so, we need to deal with the problems inherent in this piecemeal approach. As nations pursue different levels of ambition, trade and competitiveness issues arise across borders. We must consider the impact on Emissions Intensive Trade Exposed Industries. Otherwise, national action will be constrained by the needs of the most vulnerable sector.” (Woodside.FPS5, p. 3)
“Here in Australia, the lack of a clear roadmap from successive governments has left businesses uncertain what they can contribute. But the past decade has shown we cannot wait for government to lead on this. As business leaders, we are used to calculating risk and managing it. Clearly, the risk of inaction is too great. It is an era that will be ushered in by commercial imperatives. Governments do play a vital role in incentivising the development of lower-carbon energy sources and providing the certainty that industry needs to pursue them. But the demand will come from customers.” (Woodside.FPS5, p. 4)
CRITERION 6 – HAS THE COMPANY BEEN PUBLICLY TRANSPARENT ABOUT ITS POSITION, ACTIONS, AND AFFILIATIONS WITH REGARD TO CLIMATE SCIENCE AND CLIMATE CHANGE? INDICATOR 6A. WEBPAGE DEDICATED TO CLIMATE CHANGE Score: (5) Rationale: Woodside maintains a separate webpage on its website devoted to
climate change. Source(s): (see Woodside.CWS2) INDICATOR 6B. STAND-ALONE SUSTAINABILITY REPORT WITH SPECIFIC REFERENCE TO CLIMATE CHANGE
486

Woodside Petroleum
Score: (5) Rationale: Woodside’s sustainability report is easily accessible through its
website and contains a section dedicated to climate change. Source(s): (see Woodside.SR, p. 26) INDICATOR 6C. DISCLOSURE TO CDP Score: (5) Rationale: CDP website indicates “Submitted” from Woodside for Climate
Change 2018. Source(s): (see Woodside.CDP2) INDICATOR 6D. DISCLOSURE OF THIRD-PARTY RELATIONSHIPS AND LOBBYING ACTIVITIES Score: (5) Rationale: Woodside discloses its membership in Australian and International
"peak industry associations” on its website and in its public filings. Source(s): “Woodside is a member of a variety of industry associations through
which we advocate for sound decision-making on a range of topics important to our company and our stakeholders. While Woodside’s views do not always align with these associations, they facilitate important collaboration and information-sharing opportunities for our industry and the wider business community.” (Woodside.SR, p. 37)
“Woodside belongs to peak industry organisations that play multiple roles and make a contribution to civil society. These organisations set technical standards, share best practice, facilitate stakeholder engagement and give members a forum for policy discussions. They do not represent the views of any individual member. Woodside makes its own views on policy matters known through public statements and commitments. By participating in peak industry organisations, we can show leadership in our industry
487

Woodside Petroleum
and in the community. We have the opportunity to increase our awareness of policy issues, better understand stakeholder expectations and engage constructively on issues when we have something to add. We monitor the positions of organisations of which we are members and regularly review how they align with our objectives and principles. We are one voice amongst many in these groups and, as such, we seek to influence their positions on a range of policy issues. We consider our policy principles to be broadly aligned with the latest positions articulated by groups of which we are members.” (Woodside.CWS3)
INDICATOR 6E. REPORT ON CLIMATE RELATED RISK SCENARIOS Score: (5) Rationale: Woodside produced and published an analysis on what a 2°C or
lower increase in global temperature would mean for its businesses, strategies, and financial planning during the reporting period.
Source(s): “Woodside’s capital allocation framework provides flexibility to
optimise returns and risk in a range of macroeconomic scenarios...We test the robustness of our investments against a range of low-outcome and low-carbon scenarios.” (Woodside.AR, p. 23)
“In multiple scenarios, the demand for natural gas is expected to increase as a vital component of a clean energy future due to its benefits over other energy sources...We protect our existing investments by focusing on a competitive cost of supply, designing and reviewing our assets to withstand extreme environmental conditions and testing the resilience of our portfolio against a range of scenarios, including ‘2 degrees Celsius’ climate-related scenarios.” (Woodside.AR, p. 56)
“Investments are prioritised based on the level of resilience to a wide range of scenarios...Existing assets: financial resilience has been proven and Woodside invests in its existing assets to ensure sustained revenue generation, low production costs, high gross margins and a globally competitive cost of supply...Scarborough and Browse: financial resilience is strong as
488
Woodside Petroleum
these projects make use of existing infrastructure, leading to lower capital intensity than traditional greenfield LNG developments...Senegal SNE Phase 1: financial resilience is strong due to the lower upfront capital requirements and faster payback period than LNG developments and a production window that coincides with ongoing demand for oil...All other projects: our strategy review and capital allocation process ensure resilience of investment decisions.” (Woodside.CO2R, p. 4)
“In testing the resilience of our portfolio, we consider sensitivities across a range of variables, including commodity prices, carbon prices, exchange rates and interest rates. The values of these sensitivities are based on several internal and external scenarios, including the International Energy Agency (IEA) sustainable development scenario, which aligns with the Paris Agreement ambition to hold global temperature rises below 2 degrees Celsius this century.” (Woodside.CO2R, p. 5)
“Common features of internal and external scenarios: (1) energy demand is rising; (2) energy demand growth is strongest in Asia (3) demand for natural gas is increasing; (4) demand for renewables is increasing; (5) oil continues to play an important role; (6) carbon pricing is growing globally.” (Woodside.CO2R, p. 5)
“In all tested scenarios, both our existing assets and existing mature growth opportunities would make a positive contribution to shareholder value and operating cash flows...Our portfolio delivers a continual strong free cash flow, enabling us to make the investment choices that will deliver superior shareholder returns, whether that be in gas, oil or other new energy sources that leverage our core capabilities.” (Woodside.CO2R, p. 5)
489