climate and environmental risk screening for rural water supply … · 2019-11-11 · climate and...
TRANSCRIPT
Climate and environmental risk screening for rural water supply in EthiopiaA guidance note for programme staffRoger Calow, Eva Ludi, Andrew McKenzie and Seifu Kebede
February 2018
Report

Overseas Development Institute203 Blackfriars RoadLondon SE1 8NJ
Tel: +44 (0) 20 7922 0300 Fax: +44 (0) 20 7922 0399 Email: [email protected]
www.odi.org www.odi.org/facebook www.odi.org/twitter
Readers are encouraged to reproduce material from ODI publications for their own outputs, as long as they are not being sold commercially. As copyright holder, ODI requests due acknowledgement and a copy of the publication. For online use, we ask readers to link to the original resource on the ODI website. The views presented in this paper are those of the author(s) and do not necessarily represent the views of ODI.
© Overseas Development Institute 2018. This work is licensed under a Creative Commons Attribution-NonCommercial Licence (CC BY-NC 4.0).
Cover photo: Land degradation in Farta Woreda and across the Ethiopian Highlands more generally can pose a risk to rural water supply. E. Ludi, 2013

3
Acknowledgements
This guidance report is an output from the project Climate risk screening for rural water supply in Ethiopia. Research findings from the project are written up in a separate research report.
The authors would like to thank the Ministry of Water, Irrigation and Energy in Ethiopia for its strong support for this project, and in particular the steer provided by Ato Yohannes Ghebremedhen, former Director of the Rural Water Supply and Sanitation Directorate.
Particular thanks are also due to the staff from the Community-Led Accelerated Water, Sanitation and Hygiene project (COWASH) in Addis Ababa and Amhara Region who engaged so enthusiastically throughout in the planning and implementation of research, and provided vital support for the fieldwork in February 2013. In particular, Mr. Arto Suominen, Chief Technical Adviser for COWASH, played a key role throughout, and Ato Minilik Wube and many others from the COWASH Amhara office, South Gondar Zone and Farta Woreda, provided invaluable support in fieldwork.
The work presented in this report was funded by DFID-Ethiopia under Accountable Grant 103022 and the Government of Finland, with fieldwork co-funded by COWASH. The strong support of Arto Suominen (COWASH) and Morag Baird (formerly of DFID-Ethiopia) is gratefully acknowledged.
The authors would also like to thank Frank Greaves, Water and Sanitation Advisor for Tearfund, for preparing the flow diagram that introduces this guidance report.
Any mistakes in this report are the authors’ own.

4
Contents
Acknowledgements 3
List of tables and figures 6
Summary 8
Introduction 9
Why is the guidance important? 9
What does the guidance cover? 10
Step 1: Understanding water availability: tapping existing knowledge 12
Why is this important? 12
What does the guidance cover? 12
What activities are involved? 12
Step 2: Ensuring sustainability: estimating supply and demand 17
Why is it important? 17
What does the guidance cover? 18
What activities are involved? 18
Step 3: Protecting sites and sources: hazard assessment and mitigation 23
Why is it important? 23
What does the guidance cover? 23
What activities are involved? 23
Step 4: Keeping records: collecting and storing information 30
What data should be kept? 30
Why should data be kept? 30
Where should data be kept? 30
Further reading 31
Understanding water availability, catchment screening (Steps 1 and 2) 31
Environmental assessment and management (Step 3) 31

5
Annex: Additional reference material 33
Step 1: Understanding water availability 33
Step 2: Ensuring sustainability: estimating supply and demand 39
Step 3: Identifying and mitigating hazards 40

6
Tables
Summary of the guidance and steps 9
Table 1.1. Source type, functionality and access 15
Table 1.2. Source problems and their causes 15
Table 1.3. Yield of existing resources 16
Table 2.1. Minimum distances from sources of pollution 19
Table 2.2. Estimating water needs 19
Table 2.3. Estimating the catchment size and spring yield needed to meet demand 20
Table 3.1. Assessing the risk posed by gullies to water points 24
Table 3.2. Examples of degradation features and possible causes 27
Table 3.3. Assessing the severity of degradation features 28
Table 3.4. Possible corrective measures for main degradation features 29
Table A1. Groundwater potential of major hydrogeological environments in Ethiopia 33
Table A2. Example catchment protection plan 46
Table A3. Conservation interventions discussed in detail in Ethiopia’s community-based participatory watershed development guidelines 47
List of tables and figures
Figures
Flow diagram of key inputs needed to conduct the risk screening assessment and outputs expected 11
Figure 2.1. Scoping the best sites for a water point: the influence of drainage 17
Figure 2.2. Catchment sizing for different rainfall, recharge and demand scenarios 22
Figure 3.1. Integrating environmental risk assessment in water point siting 23
Figure 3.2: Environmental hazards that might affect a water source 24
Figure 3.3. Base maps with degradation threats and causes 25
Figure 3.4. Topographic base map showing areas of environmental degradation and initial identification of causes 26
Figure 3.5. Base map showing measures to address catchment degradation 28

7
Figure A1. Geological environments and groundwater availability 34
Groundwater occurence in basement rocks 34
Ground water occurence in riverside alluvium 34
Groundwater occurence in sedimentary rocks 34
Groundwater occurence in volcanic rocks 34
Figure A2. Examples of field identification sheets prepared for different volcanic environments in the Ethiopian Highlands 35
Figure A3. Diagram of a cut-off drain 40
Figure A4. Diagram of an artificial waterway 40
Figure A5. Diagram of vegetative check-dam with stem cuttings 41
Figure A6. Integrated gully control and catchment protection measures 42
Figure A7. Landslip prevention/rehabilitation 43
Figure A8. Diagram of an area closure 45
Figure A9. Diagram of a stone bund/terrace 45
Figure A10. Diagram of a soil bund (‘fanja juu’ in Swahili) 46

8
Summary
This report provides guidance on how to mitigate the risks to rural water supplies posed by climate, environmental degradation and growing demand. The focus is on groundwater-based, community-managed wells and springs: sources that are potentially most vulnerable to changes in recharge from rainfall, changes in demand from population growth, and environmental hazards such as floods.
The guidance covers four steps:
Step 1: Understanding water availability – tapping local knowledgeStep 2: Ensuring sustainability – estimating water supply and demandStep 3: Protecting sites and sources – identifying and mitigating risksStep 4: Keeping records – collecting and storing information
The aim is to show how WASH organisations, working in partnership with communities, can integrate a risk screening approach into projects and programmes. The approach can be used to screen both existing and planned water sources.
The tools and tips included under Steps 1-4 can be applied by woreda staff in the field without specialist geological or hydrogeological expertise, or specialist equipment. They can also be used by zonal, regional and national planners to inform programme design.
9
Introduction
1 Resilience in this context means the ability of groundwater resources to resist or buffer changes in climate and rainfall, and their ability to recover from such changes (MacDonald et al, 2011).
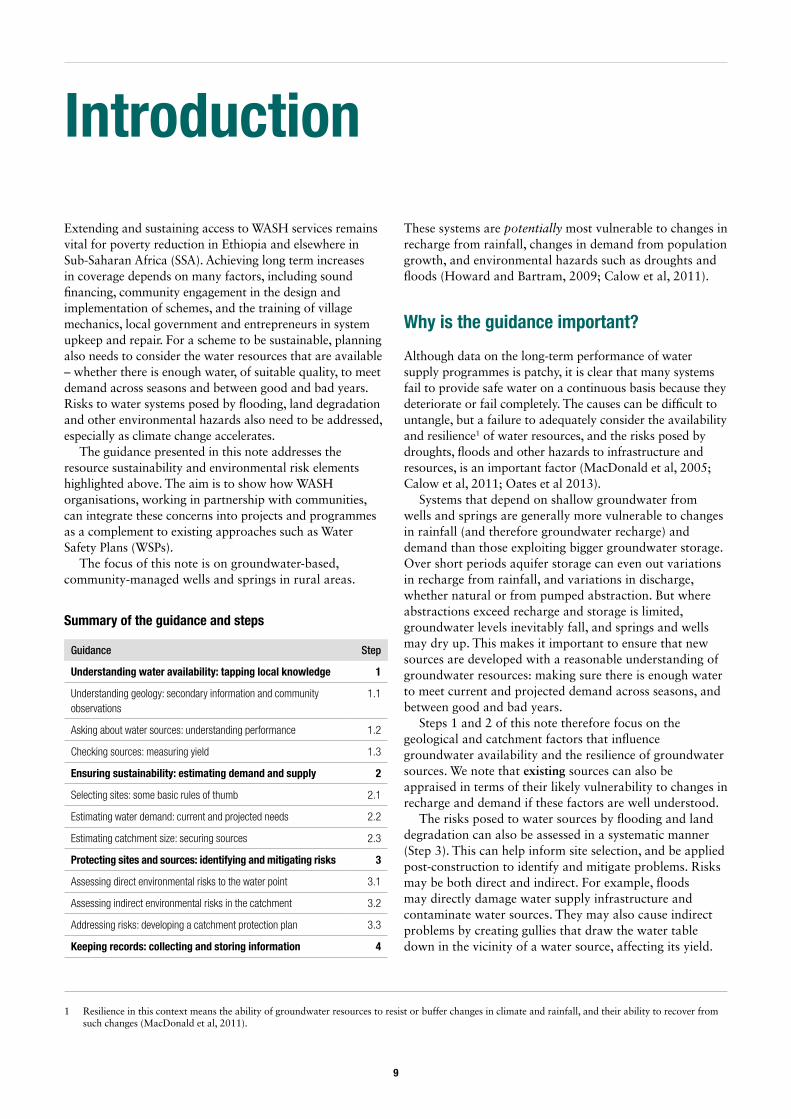
Extending and sustaining access to WASH services remains vital for poverty reduction in Ethiopia and elsewhere in Sub-Saharan Africa (SSA). Achieving long term increases in coverage depends on many factors, including sound financing, community engagement in the design and implementation of schemes, and the training of village mechanics, local government and entrepreneurs in system upkeep and repair. For a scheme to be sustainable, planning also needs to consider the water resources that are available – whether there is enough water, of suitable quality, to meet demand across seasons and between good and bad years. Risks to water systems posed by flooding, land degradation and other environmental hazards also need to be addressed, especially as climate change accelerates.
The guidance presented in this note addresses the resource sustainability and environmental risk elements highlighted above. The aim is to show how WASH organisations, working in partnership with communities, can integrate these concerns into projects and programmes as a complement to existing approaches such as Water Safety Plans (WSPs).
The focus of this note is on groundwater-based, community-managed wells and springs in rural areas.
These systems are potentially most vulnerable to changes in recharge from rainfall, changes in demand from population growth, and environmental hazards such as droughts and floods (Howard and Bartram, 2009; Calow et al, 2011).
Why is the guidance important?
Although data on the long-term performance of water supply programmes is patchy, it is clear that many systems fail to provide safe water on a continuous basis because they deteriorate or fail completely. The causes can be difficult to untangle, but a failure to adequately consider the availability and resilience1 of water resources, and the risks posed by droughts, floods and other hazards to infrastructure and resources, is an important factor (MacDonald et al, 2005; Calow et al, 2011; Oates et al 2013).
Systems that depend on shallow groundwater from wells and springs are generally more vulnerable to changes in rainfall (and therefore groundwater recharge) and demand than those exploiting bigger groundwater storage. Over short periods aquifer storage can even out variations in recharge from rainfall, and variations in discharge, whether natural or from pumped abstraction. But where abstractions exceed recharge and storage is limited, groundwater levels inevitably fall, and springs and wells may dry up. This makes it important to ensure that new sources are developed with a reasonable understanding of groundwater resources: making sure there is enough water to meet current and projected demand across seasons, and between good and bad years.
Steps 1 and 2 of this note therefore focus on the geological and catchment factors that influence groundwater availability and the resilience of groundwater sources. We note that existing sources can also be appraised in terms of their likely vulnerability to changes in recharge and demand if these factors are well understood.
The risks posed to water sources by flooding and land degradation can also be assessed in a systematic manner (Step 3). This can help inform site selection, and be applied post-construction to identify and mitigate problems. Risks may be both direct and indirect. For example, floods may directly damage water supply infrastructure and contaminate water sources. They may also cause indirect problems by creating gullies that draw the water table down in the vicinity of a water source, affecting its yield.
Guidance Step
Understanding water availability: tapping local knowledge 1
Understanding geology: secondary information and community observations
1.1
Asking about water sources: understanding performance 1.2
Checking sources: measuring yield 1.3
Ensuring sustainability: estimating demand and supply 2
Selecting sites: some basic rules of thumb 2.1
Estimating water demand: current and projected needs 2.2
Estimating catchment size: securing sources 2.3
Protecting sites and sources: identifying and mitigating risks 3
Assessing direct environmental risks to the water point 3.1
Assessing indirect environmental risks in the catchment 3.2
Addressing risks: developing a catchment protection plan 3.3
Keeping records: collecting and storing information 4
Summary of the guidance and steps
10
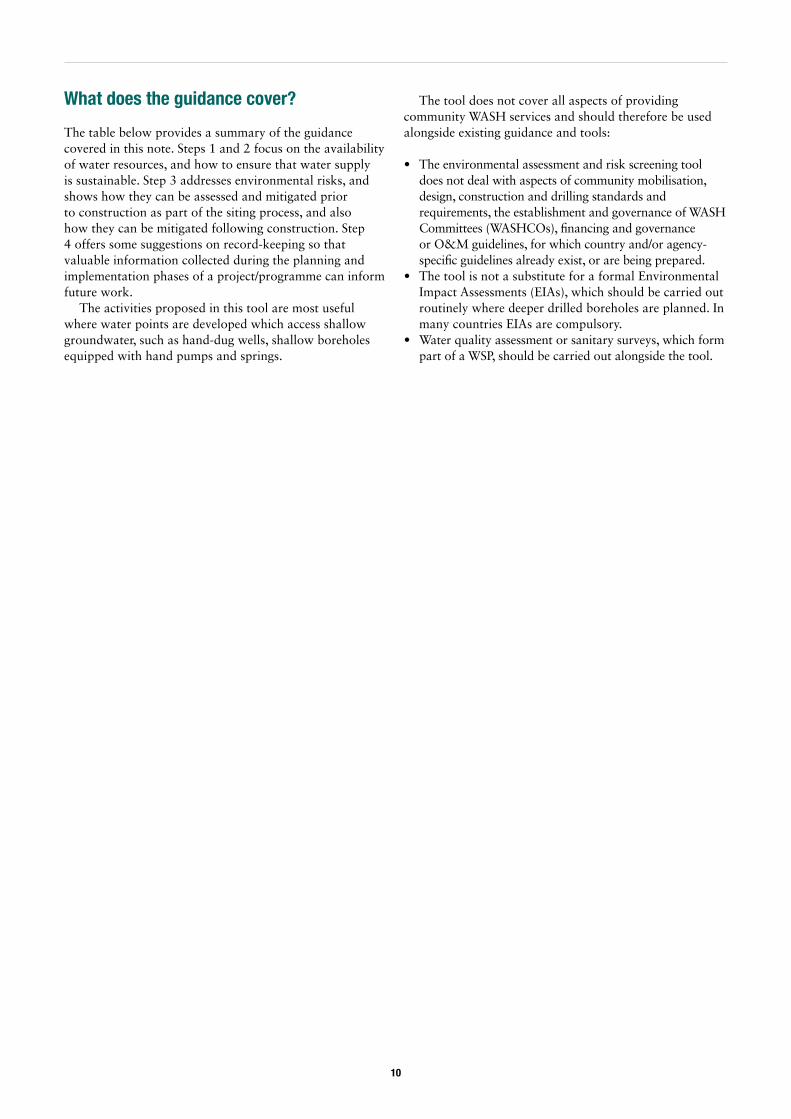
What does the guidance cover?
The table below provides a summary of the guidance covered in this note. Steps 1 and 2 focus on the availability of water resources, and how to ensure that water supply is sustainable. Step 3 addresses environmental risks, and shows how they can be assessed and mitigated prior to construction as part of the siting process, and also how they can be mitigated following construction. Step 4 offers some suggestions on record-keeping so that valuable information collected during the planning and implementation phases of a project/programme can inform future work.
The activities proposed in this tool are most useful where water points are developed which access shallow groundwater, such as hand-dug wells, shallow boreholes equipped with hand pumps and springs.
The tool does not cover all aspects of providing community WASH services and should therefore be used alongside existing guidance and tools:
• The environmental assessment and risk screening tool does not deal with aspects of community mobilisation, design, construction and drilling standards and requirements, the establishment and governance of WASH Committees (WASHCOs), financing and governance or O&M guidelines, for which country and/or agency-specific guidelines already exist, or are being prepared.
• The tool is not a substitute for a formal Environmental Impact Assessments (EIAs), which should be carried out routinely where deeper drilled boreholes are planned. In many countries EIAs are compulsory.
• Water quality assessment or sanitary surveys, which form part of a WSP, should be carried out alongside the tool.

11
Flow diagram of key inputs needed to conduct the risk screening assessment and outputs expected
These guidelines address the following questions regarding shallow groundwater development for rural water supply in Ethiopia: • Is there enough water of suitable quality to meet household demands across seasons and over the longer term? • What are the main environmental risks to ensuring a sustainable supply of safe water? • How can these risks be mitigated?
Source: Ludi, E., Calow, R. and F. Greaves (2015) Environmental assessment and risk screening for rural water supply. Guidance note developed for the SWIFT Consortium. London, ODI, Oxfam and Tearfund.
STEP 1. Understand how much water is available by tapping local knowledge
STEP 2. Determine amount of groundwater needed to meet demand and required size of well (recharge) area
Input See: Input See:
Basic geological map (detailed if available, or simple sketch map) with project water sources superimposed
1.1 Annotated sketch map and/or photos to identify the resilience/ vulnerability of the source site in terms of drainage
2.1
Expert hydro-geological advice where available (particularly where no mapped data or records exist)
1.1Measurement of distance to water sources from pollution hazards (contamination control measures needed if hazards are closer tan recommended minimum distance
2.1
Observation of exposed rock (to compare with summary of typical African geologies and their groundwater potential)
1.1 Est. of current and projected demand for water, based on assumptions about household size, per capita needs, population growth rate
2.2
Well records from the surround area (including data on geology, seasonal yield, reliability and water quality)
1.1 1.2
For wells: estimate of catchment area needed to meet demand and provide resilient supply, based on demand estimates above, rainfall data and assumptions about rainfall-groundwater recharge. Can be applied to planned or completed projects.
2.3
Local knowledge on behaviour and history of sources in the area 1.2 Estimate of actual catchment sizes for flat or hilly terrain 2.3
Simple yield measurement of existing sources (using bucket and stopwatch, or weir plate
1.3 For springs: It is also possible to compare spring yield (measured during the dry season) to current/future water demand
2.3
Output Output
a. Groundwater potential and avgerage yield estimates based on hydrological and geological understanding
b. Actual yield measurements of local sourcesc. Short narrative/tabular information on seasonal and long-term reliability
of the source, including water quality
d. Traffic light assessment of adequacy of catchment size for different rainfall recharge and water demand scenarios: adequate, small and marginal catchments
STEP 3. Identify and mitigate environmental hazards that pose a threat to sites and sources
STEP 4. Maintain records of the assessment, design and implementation of projects to inform future interventions
Input See: Input See:
Catchment walk/observation to develop sketch map of direct environmental hazards withing a 150 m radius of the water source (e.g. gully and rill erosion, landslips, landslides, cattle tracks)
3.1 • Geological field notes/data from geophysical surveys • Digging/drilling logs (incl. all data relating to drilling,
construction and geological/geophysical logging) for dry and successful wells
• Pumping test data • Seasonal water level observations • Records on water quality/observations of seasonal quality variations • Information on physical and legal access (e.g. land ownership) • Number of people using the scheme and estimate of amount of
water collected per person/household across different seasons • Any incident when water supply system was not functional,
reasons and actions undertaken • Records of corrective/remedial measures taken to address
direct and indirect environmental hazards • Water level across different seasons • Any chemical/biological/physical parameters from water testing
4
Assessment of severity of hazards (e.g. of gullies, floods and landslides, and need for remedial action/relocation of water point
3.1
Simple table to identify and outline causes of degradation features in the wider catchment (indirect environmental hazards) based on community discussion
3.2
Assessment of severity/extent of indirect environmental hazards (simple table constructed with community)
3.2
Discussion with partners/authorities/experienced local people on management processes for medium- to high-risk degradation processes (incorporate community representatives and consider also community-based ideas and solutions
3.3
Prepare table identifying corrective measures 3.3
Output Output
e. Remedial measures for direct hazards (e.g. protect against floodingf. Catchment and water point protection plan with corrective measures and
assigned responsibilities drawn up with community
g. Data records to be kept at local level and made available to local government WASH cluster, and to key networks that seek to build seasonal databases

12
Step 1: Understanding water availability: tapping existing knowledge
Why is this important?
Taking the time to collect existing information on the things that are likely to influence the availability and sustainability (and quality) of water for a village or group of households is important. This can help the project team assess (a) what water supply options (e.g. springs, wells, boreholes) are likely to be feasible and cost-effective; and (b) the likely yield and sustainability of water sources. This can save time and money later on, and means that only those options that are likely to be feasible are discussed with communities.
Taking the time to tap community knowledge can provide valuable information on which sources and locations are the most reliable. This information can also be used by the project team, in partnership with the community, to make informed choices on technical choices and siting. For example, older members of the community (particularly women) are likely to know which sources fail seasonally or in particularly dry years, and may be able to ‘tell the story’ of water development successes and failures in a local area.
What does the guidance cover?
• 1.1. Understanding the geology of the area to assess resource potential and inform technical choices (e.g. shallow wells, deeper boreholes, springs).
• 1.2. Asking about the performance of existing sources over time (yield, reliability, quality) to help decide on technical choices and sites.
• 1.3. Measuring the yield of existing sources to see whether they meet regulatory and/or local needs, and as an input to the catchment sizing process discussed in Step 2.
What activities are involved?
Step 1.1: Understanding local geology
Knowing ‘where you are’ in terms of underlying geology is a first step. This can be approached in two ways: (a) looking at secondary information (e.g. maps, well records) to assess groundwater potential and likely yields; and (b) follow-up observation in the project area – looking at rock outcrops
Comment: geology and groundwater
The underlying geology of an area will determine whether water is stored in underground formations, how much is stored, and the ease with which water can flow to a water point which determines the yield of an individual source.
Storage, in particular, affects the resilience of water supplies. Storage is a function of rock porosity. The most porous geologies (e.g. alluvial sediments, highly weathered hard rocks) can store large volumes of water, so that when recharge from rainfall or discharge through pumping occurs, changes in water levels are relatively small. However, if the porosity of the rocks is small (e.g. with mudstones, shales, unweathered hard rocks), changes in recharge or discharge will have a bigger impact on water levels and a well or spring can dry up.
Geology will also influence water point construction by affecting digability, the stability of the well wall during digging, well design (e.g. lining requirement) and the periodic requirement for dredging and cleaning.
The reference materials in the Appendix provide further information on geological environments and their groundwater potential.
Source: MacDonald et al. (2005); MacDonald and Calow (2010)

13
and exposed soil/rock profiles – to understand geology and groundwater conditions.
Key questions
• What is the geology of the area? What is their likely groundwater potential?
• How might geology vary within and around the community?
• What information or evidence (if any) did previous project teams/drillers leave behind that might help?
How to get answers:
• Consult a geological map of the area. What sorts of rock are likely to be present?
• Visit places where rocks are exposed. River valleys and hills are often good locations.
• Look at boulders in the village used for seats, grinding stones, etc. Where did they come from? What kind of rocks?
• Visit wells that have been dug previously and examine soil-rock profiles.
• Encourage people to investigate potential sites themselves e.g. by digging trial pits or using a shallow auger.
Table A1 in the Annex provides a summary of the main hydrogeological environments in Ethiopia and implications for groundwater development.
What next?
The information collected above – from secondary sources and/or field observation – could be used to draw a rough map of the project area showing geology, existing water points and springs (functional and non-functional) and likely
groundwater potential. Notes on the performance of existing water points (see Tables 1.1 and 1.2) could also be added. This will help focus discussion on which areas and source types are likely to provide the most reliable sources of water.
Hint: when to seek expert advice
If there is no previous experience of well digging or spring development in the project area, the advice of an experienced geologist should be sought to help decide (a) if well/spring development is feasible; and (b) well siting, if well development is feasible.
If previous wells have failed or do not provide water throughout the year, or if there is evidence of hard rock at shallow depths, alternative options (e.g. a borehole) should be considered.
If a large number of wells in a particular area are planned, it may be cost effective to employ a geologist and possibly geophysical techniques in the siting of wells, since the increased success rate my offset the extra cost of hiring a specialist.
Source: Republic of Sierra Leone (2014)
Hint: local observation
Field guidance sheets can be used to help the non-expert identify rocks in the field and place their water scheme in a geological context.
A field guidance sheet can help the user identify rocks at hand specimen scale, at outcrop scale and regional land setting scale. Photographs and block diagrams can be included as an aid. The photographs of hand specimens can be used to identify colour, texture and mineral composition of rocks for comparison with field specimens.
At outcrop scale a set of features of rocks (e.g. colour, layering, thickness) can be captured in index photographs. Such photographs can later be used by practitioners in the field as reference. The same applies to observation of regional geomorphologic setting. Geomorphology is an index to geology. It is much easier to describe geomorphology (such as dome forming, cliff forming, undulating, flat laying, plateau, valley forming, dissected, etc.) than to name rocks.
The Annex provides an example of a field guidance sheet prepared for project staff in the highlands of Ethiopia. Similar sheets may already be available in country, or could be developed with the help of a geologist.
Source: MacDonald et al (2005)

14
Hint: preparing maps as a guide to water point siting
This figure shows how hydrogeological field notes can be plotted on a geological base map.
This figure shows how a preliminary groundwater development plan can be developed from information collected in the field.
Source: MacDonald et al. (2005)
© NERC, 2005
© NERC, 2005
© NERC, 2005

15
Step 1.2: Understanding source behaviour
Asking communities about the performance of existing sources can provide useful information on which areas and sources provide the ‘best’ groundwater – the most reliable, as well as the highest quality and most accessible. This information can be used to inform the selection of new sites and sources, and/or the rehabilitation of existing ones. Note, however, the danger of projects simply developing new sources around existing ‘successes’: the result may be good on paper (another successful well!), but bad for the community (areas where groundwater conditions are more difficult, but where many people live, are avoided).
Key questions:
• What are the main sources of water available for use by the community, or by groups within it? What sources no longer provide water, and why?
• How does water availability vary between sources? Which are the most reliable, and why?
• How does availability from these sources change over time, e.g. across seasons and between good and bad years? What other factors affect the use and performance of sources, e.g. mechanical failures, environmental hazards, or the need to water livestock?
How to get answers:
The following tables can be used to capture information on the type, number and functionality of existing schemes, and on the reasons for any water supply problems.
Hint: how to get information on source use and behaviour
A good place to begin is with a map, drawn with community members, showing where different water sources are, what they are used for, and by whom. Notes can be added on the characteristics of these sources. If a rough geological map was prepared in Step 1.1, this can be used as the base.
Notes can be supplemented with more detailed water point histories, best conducted at the water sources themselves with women, exploring in detail changes in water levels, yields, recovery times, queuing etc. The aim is to build up a picture of which sources, in which areas, provide (or are likely to provide) the most reliable groundwater.
Source type No. No. of fully functional schemes
No. of schemes functional part year (in months)
No. of non-functional schemes
Access (open to all or restricted?)
Hand-dug well
Drilled well/borehole
Protected spring
Unprotected spring
Roof catchment
Open source (e.g. stream)
Other (specify)
Table 1.1. Source type, functionality and access
Scheme name and type Limited water found on drilling/digging
Collapse of wall or sediment
Hand pump failure Env. hazard (e.g. flood, erosion, gullying)
Water table decline; decline in spring yield
Other (specify)
Table 1.2. Source problems and their causes

16
Step 1.3: Measuring the yield of existing resources
As a further step, the yield of different water sources can be measured. Yield requirements within a programme are often standardised, or minimum target yields may be specified in national guidelines. Projected water demand for different numbers of people/households also influences the yield needed from a source (see Step 2, Table 2.3).
If the yield (in l/sec) for different seasons is not available, ask the following questions:
• How do people using this source describe its yield over the year (e.g. fluctuation between dry and wet season, months when source is dry, etc.)?
• Is the source producing enough water throughout the year for all users? If not, where do people get water from during the time when the spring is dry?
What next?
The information collected above will provide an indication of:
• Groundwater availability, groundwater quality, groundwater development potential and the likely cost of developing it (e.g. whether spring sources can be developed, or whether shallow groundwater can be accessed via wells).
• The likely resilience of groundwater resources and sources (based on an understanding or groundwater storage, and the behaviour of existing sources).
• The kinds of sources that may be feasible to develop, or rehabilitate (e.g. do existing technology types and designs provide reliable water supplies? If not, can they be developed/rehabilitated to meet target requirements, or do new sources need to be developed?
Hint: measuring yield of a spring
• Equipment needed to measure yield: bucket and stopwatch
• Measuring yield: How long does it take to fill a bucket of a known volume?
Example: 8 seconds to fill 10 l bucket. Yield = 10/8 = 1.25 l/sec
Ideally, spring yield should be measured during the dry season to assess whether the well or spring is viable (i.e. can meet demand). For a well equipped with a pump, information from the community on how much water can be extracted in a 24-hour period may be more valuable than an instantaneous measure of pump yield.
Source Dry season yield (l/sec or l/day)
Wet season yield (l/sec or l/day)
Table 1.3. Yield of existing resources

17
Step 2: Ensuring sustainability: estimating supply and demand
Why is it important?
Building on the initial assessment of groundwater resources carried out in Stage 1, we now ask: How much groundwater is needed to meet current and projected needs, and how big does the catchment (recharge) area of a well or spring need to be to provide this water?
Working through this step will help project staff identify potential sites for a well or spring that can provide water, at the required yield, on a continuous basis for domestic needs. A shortlist of sites, screened for their ability to provide resilient supplies, can then be discussed with communities.
If water sources are likely to be used for minor productive uses as well (see Step 1), then the yields of sources and catchment areas will need to be increased to meet the additional demand.
Note that the guidance provided here can also be applied to completed projects. In other words, an understanding of which sites are likely to provide reliable water can also help project staff identify which existing sites might fail to provide enough water during the dry season, or during drought. Marginal sites could be targeted for extra monitoring, or could be re-visited to develop additional ‘back-up’ sources.
Figure 2.1. Scoping the best sites for a water point: the influence of drainage
Illustration by Nick Barneby, Barneby Ltd.

18
What does the guidance cover?
• 2.1. Selecting sites: basic rules of thumb • 2.2. Estimating demand: how much water is needed? • 2.3. Estimating the catchment size needed to meet demand
What activities are involved?
Step 2.1: Selecting sites: rules of thumb
Before looking in detail at the catchment size needed to meet demand from a source, it is useful to look firstly at
the topography of the project area – the relief or terrain of the land. Figure 2.1 highlights some simple ‘rules of thumb’ for site selection.
A second important thing to consider is contamination risk. Table 2.1 below provides some similar ‘rules of thumb’ for minimising the risk of water contamination.
Comment: the importance of drainage
Steep slopes pose a challenge for siting water points. Water within an aquifer will naturally drain to the lower parts of a catchment. In the worst case, an aquifer may have adequate annual recharge, but be unable to sustain dry season yields as recharged water drains down slope.
For this reason both catchment area and topography (drainage) need to be considered when assessing the vulnerability of a water point to change – from climate variation, environmental degradation or changes in population and demand.
Comment: minimising the risk of contamination
The recommended distances above will not always be possible to achieve. In densely populated areas, for example, latrines might be closer to water sources than the recommended 30 m.
In such cases, it might be necessary to upgrade latrines from open pit to either sealed pit or latrines with septic tanks.
Hint: assessing drainage risks in the field
To assess the likelihood of rapid groundwater drainage, the difference in height between the lowest point within the capture radius of the site selected can be estimated visually. On steep slopes where the land falls away immediately and consistently below a well site, slope can be used as an estimator, converted to a height difference via a simple look-up table.
For a typical hand dug well, 10-20 m deep, we can assume that if the land falls away by more than the depth of the well within 100-150 m, the source is at risk of available water draining away in the dry season and threatening sustainability. In these circumstances, additional options may need to be considered (e.g. rainwater capture and storage; the development of both spring sources and wells).
Slope
> 20 m drop off within 150 m Highly vulnerable
10-20 m drop off within 150 m Vulnerable
5-10 m drop off within 150 m Possibly vulnerable
< 5 m drop off within 150 m Adequate
Comment: catchment areas for wells and springs
If a well is sited without an adequate catchment area, this increases the risk that it will be dry, or that dry season yields will be insufficient to meet community needs.
For a spring source, local knowledge is normally used to assess whether dry season flows are adequate, and so springs will not normally be developed if the catchment area cannot provide enough water.
In both cases (springs and wells), if catchment areas are marginal in relation to required yield and demand, then any reduction in recharge, whether from climate variability or catchment degradation, will put the source under strain.
Defining the catchment of an individual spring or well is simplest in hilly terrain, where the catchment boundary is clear. In flat terrain the catchment of a well is limited more by aquifer characteristics, so an understanding of aquifer properties is important.

19
Step 2.2: Estimating demand
To assess the catchment area needed to provide sustainable supply, water demand can be estimated based on the number of households that need to be served and their per capita water needs.
For domestic uses, i.e. drinking, food preparation, personal and domestic hygiene, a figure of 25 litres per capita per day (lcd) is used in the calculations below. This is because Ethiopia’s new Growth and Transformation Plan (GTP II) for the period 2015-20 is expected to raise target service level for rural areas from 15 lcd to 25 lcd. Field observations in Farta Wordea suggest that actual use is much lower – of the order of 10 lcd or less. In areas where there are fewer constraints on water availability and access, however, use is likely to increase, especially if sources are used to meet ‘productive’ needs such small-scale irrigation, brewing, brick-making or livestock watering.
The calculations below assume an average household size of five persons. This is the number commonly used in Ethiopian policy documents. Assumptions for per capita
water needs and household size can of course be changed to suit local conditions.
Step 2.3: Estimating the required catchment size (wells) or yield (springs)
The catchment area can be used to assess the vulnerability of a water supply system to change (be it climate variation,
Potential pollution hazard Min. distance from water source
Community-level solid waste dump 100 m
Storage and dumps of petroleum or pesticides 100 m
Slaughterhouses/areas where animals are slaughtered
50 m
Toilets/latrines (open pit) 30 m
Household waste dump 30 m
Stables/kraals 30 m
Main road 20 m
Rivers/lakes 20 m
Laundry place 20 m
Dwellings 10 m
Source: Collins (2000)
Table 2.1. Minimum distances from sources of pollution
Water use(assuming 5 persons per household, demand = 25 lcd)
No. of households
No. of people Daily needs(m3)
Annual needs (m3)
20 100 2.50 913
50 250 6.25 2,280
100 500 12.50 4,560
500 2,500 62.50 22,800
1,000 5,000 125.00 45,600
2,500 12,500 312.50 114,000
5,000 25,000 625.00 228,000
Table 2.2. Estimating water needs
Hint: estimating future demand
To ensure a source is capable of meeting future demand, it is important to estimate both the current number of households that will use the source and project future numbers – say in 10-15 years’ time.
Also remember that a new source may draw in additional users from the village and beyond.
Example:
Current population: 150 peopleGrowth rate: 2.5%/yearPopulation in 10 years’ time: 192Formula used: Nt = N0 x e(rt)
where:
Nt = Future population after t yearsN0 = Current populatione = Euler’s number = 2.718r = Growth rate (e.g. 0.025)t = Number of years
Hint: interpreting the catchment size table
In Table 2.3 below, the 10% figure gives the required catchment area assuming that 10% of rainfall infiltrates, and that all of this is available to a water point (an optimistic assumption – see comment above). Any existing water point that does not satisfy this criterion is unlikely to meet even current demands, and additional sources should be provided. A proposed site that fails to meet the criterion should only be developed if there are no better options, and as one of a number of water sources.
The 3% figure assumes that 30% of recharge is available to a well, and the 1% figure that only 10% of aquifer recharge is available. The latter assumption is much more cautious, and should produce water points that are relatively secure.
In areas of high demand, for instance peri-urban communities or where groundwater is pumped for irrigation, catchment zoning can give an indication of whether groundwater is vulnerable to overexploitation – for example where source catchments intersect each other.

20
environmental degradation, or changes in population and demand). If the catchment area is sufficiently large, the water point should, other factors being equal, be resilient to climate variability, and have some capacity to satisfy increases in demand. At the other extreme, catchment areas that are marginal with respect to the required yield are likely to be more vulnerable to change.
The required catchment area can be calculated as demand (in m3) divided by recharge (in m), or ‘recoverable recharge’.
Table 2.3 shows the required catchment area for a
source under different demand and groundwater recharge assumptions in an area receiving roughly 1,300 mm/annum of rainfall. The table also shows the required spring yields needed to meet different demands.
Here we assume that the catchment size is likely to be marginal if we base calculations on an optimistic rainfall-recharge-recoverable groundwater scenario: that recharge is 10% of rainfall, and all of this (10%) can be captured by a source. Small and adequate catchment area calculations are based on more cautious assumptions: that recoverable recharge is 3% and 1% of rainfall, respectively.
Once the rough catchment area in m2 is known, the area itself can be ‘walked’ out on the ground.
In flat terrain, the catchment can be viewed as a circle around the water source, and the radius of the circle used to ‘walk out’ distances from the source, although in these areas
Comment: a simplified water balance
A detailed assessment of the water balance of an aquifer in a catchment is complicated, requiring long term monitoring of rainfall, groundwater recharge, natural discharges (e.g. to base flows in rivers) and human withdrawals. However, simple methods can give reasonable estimates of the recharge area (i.e. catchment) needed to meet demand from a source based on rainfall data, assumptions about how much rainfall recharges groundwater resources, and the required yield of a source.
As a rule of thumb, and based on evidence from numerous empirical studies across Africa, recharge can be assumed as 10% of rainfall in areas with over 750mm of rainfall per year. In areas with less rainfall, the linear relationship between rainfall and recharge breaks down and recharge is related more to extreme rainfall events than averages.
Not all recharged water can be withdrawn from a well, borehole or spring. This is because some aquifer recharge will infiltrate deeper aquifers, discharge laterally to rivers, or evaporate back into the atmosphere. Extractable or recoverable recharge may therefore be only 10 - 30% of total recharge, equivalent to 1-3% of rainfall.
Source: Bonsor and MacDonald (2010).
Hint: calculating a catchment area for a source in flat terrain
Demand: 50 HH x 5 members x 25 l/day x 365 = 2,281,250 l/year
2,281,250 l/year ÷ 1000 = 2,281 m3/year
Minimum area: Recharge = 10% of rainfall of 1,300 mm = 130 mm
130mm ÷ 1,000 = 0.13 m/year
Required catchment area: 2,281m3/year ÷ 0.13 = 17,546 m2
Adequate area: Recharge = 1% of rainfall of 1,300 mm = 13 mm
13 mm ÷ 1000 = 0.013 m/year
Required catchment area: 2,281m3/year ÷ 0.013 = 175,460 m2
Demand (assuming 5 persons per household, demand = 25 lcd
Approx. catchment area for well (assuming 1,300mm avg. rainfall/year
Spring yield
No. of households
No. of persons
Daily needs (m3)
Annual needs (m3)
Marginal: recoverable recharge
10% of rainfall (m3)
Small: recoverable recharge 3% of
rainfaill (m3)
Adequate: recoverable recharge
3% of rainfall (m3)
l / sec
20 100 2.50 913 7,020 21,060 70,200 0.03
50 250 6.25 2,280 17,500 52,500 175,000 0.07
100 500 12.50 4,560 35,000 105,000 350,000 0.14
500 2,500 62.50 22,800 175,500 526,500 1,755,000 0.72
1,000 5,000 125.00 45,600 337,000 1,123,000 3,370,000 1.39
2,500 12,500 312.00 114,000 877,400 2,808,000 8,774,000 3.61
5,000 25,000 625.00 228,000 1,754,800 5,615,500 17,548,000 7.23
Table 2.3. Estimating the catchment size and spring yield needed to meet demand

21
Hint: comparing spring yield to demand
To assess whether the yield of a spring is sufficient to meet demand, calculate the total water demand of the population to be served annually and compare this to yield. The calculation of total yield should be done based on the lowest yield as measured during the dry season.
Demand: No. of households x no. of members per household x 25 l of water per day per capita x 365 days
Yield: spring yield (l/sec) x 60 sec x 60 min x 24 hours x 365 days
Example:
Demand: 245 households x 5 members x 25 l/day x 365 days = 11,178,125 l/year (11,178 m3/year)
Yield (during driest period): 1.25 l/sec x 60 sec x 60 min x 24 hours x 365 days = 39,420,000 l/year (39,420 m3/year)
Hint: measuring the required catchment area for a source
Example: flat terrain
Required catchment area: A = 17,546 m2
Circle: r=√(a/π) r=√(17,546 m2 / 3.14159) = 74 m
Square: √a √17,546 m2 = 132 m x 132 m
Example: hilly terrain
From the selected well site, estimate the length in metres of the catchment either visually or by pacing out upstream to the ridgeline. The width of the catchment is estimated by taking the distance between ridgelines. The catchment is the two measurements multiplied – see below.
Illustration: Nicky Barneby, Barneby Ltd.

22
it becomes more important to understand aquifer properties. To decide whether it is worth developing a spring, a
simple assessment is made comparing yield with demand, based on the population served, or likely to be served in future. As a precaution, the yield of the spring during the driest period of the year is used for the calculation.
The calculations above may appear daunting for some users. For this reason, they have been embedded in the ‘look up’ graphs (Figure 2.2). These allow users to find the catchment areas needed to meet demand for different numbers of households under different rainfall-recharge scenarios. Alternatively, they can be used to see if an existing well is likely to have a marginal, small or adequate catchment area.
For an existing well, select the graph closest to the mean annual rainfall for the community. Using measured or estimated catchment areas, plot the area on the vertical axis against the number of households served by the well. If the site plots in the red zone at the bottom of the graph, the well has an inadequate catchment for current demands. In the orange, marginal catchment zone, wells are likely to be very vulnerable to seasonal variation in rainfall. In the yellow area catchments are still small and vulnerable to environmental change. If a well is in the green zone this suggests it has an adequate catchment area, although its performance will depend on local aquifer properties and topography.
For a proposed well, the graph should be read upwards from the number of households to find areas associated with adequate, small and marginal catchments. Other factors being equal a site with an adequate catchment will be preferred. If the communities’ preferred sites have a marginal catchment, the risk of seasonal well failure should be explained before commencement of excavation.
Although primarily designed to assess shallow dug well catchments, the same graphs can be used to assess the security of spring sources. If dry season flow measurements suggest a spring is marginally able to support the desired number of households, a catchment area calculation can suggest whether the spring is likely to be vulnerable to low flow in particularly dry years.
Figure 2.2. Catchment sizing for different rainfall, recharge and demand scenarios

23
Step 3: Protecting sites and sources: hazard assessment and mitigation
Why is it important?
Well construction and spring development can have an impact on the environment (e.g. through cutting trees, temporary water pollution, improper disposal of dug out sub-soil). In addition, environmental hazards can have an impact on water sources – directly or indirectly. In particular:
• Gullies, floods and landslides can damage water infrastructure and affect water quality directly, for example through ingress or infiltration of contaminated water, or the collapse of unlined wells when soil becomes saturated.
• Degradation within the broader catchment can affect water resource conditions, indirectly compromising the sustainability of a source. For example, deep gullies can draw down the local water table beyond the depth of a well, and land degradation can affect runoff, infiltration and groundwater recharge.
Ultimately, the sustainability and resilience of a water system is influenced by how well a catchment of a water source can absorb rainfall through infiltration - water that will eventually feed into the (shallow) groundwater on which the water system depends.
What does the guidance cover?
• Assessing direct environmental hazards to the water point • Assessing indirect environmental degradation processes
in the catchment • Identifying measures to address direct and indirect
hazards via a catchment protection plan
Figure 3.1 summarises the decision-making process in relation to site selection.
Once a site has been identified (Steps 1 and 2), direct and indirect environmental hazards should be assessed. If there are direct hazards in the vicinity of the proposed
water point (Step 3.1), these need to be addressed. If that is not possible – because of the size of the hazard or the lack of financial or technical capacity – alternative sites may need to be considered.
Once a final site has been identified, indirect environmental hazards in the wider catchment of the water source should be identified (Step 3.2) and addressed (Step 3.3)
What activities are involved?
Step 3.1: Assessing direct hazards near a water point
A good place to start is with a map of the vicinity of the water point (approx. 150 m radius), whether planned or existing – showing the main hazards and degradation features. These may include gullies, areas affected by flooding, landslips or
Figure 3.1. Integrating environmental risk assessment in water point siting
Site pre-selection
Hazardassessment
Final siteselection
Catchmentprotection plan
Initial pre-selection of water scheme and site in a community
Assessment of direct environmental hazards that might affect the site
a) Keep original site and address environmental hazardb) Select alternative site if hazards cannot be addressed
Watershed protection plan to addressindirect threats such as degradation ofsoils, water and vegetation

24
areas prone to landslides. Pollution risks can also be included, such as latrines and waste dumps (see Table 2.1).
Degradation features that might not pose an immediate threat to the water point but left untreated might be a hazard in future (e.g. rills, cattle tracks developing into a gully, etc.) can also be included.
In order to decide whether to go ahead or not with final site selection, direct environmental threats should be assessed for their severity. If they are so severe that they cannot be resolved within reasonable limits, it might be better to identify alternative sites.
Gullies
Table 3.1 below provides a simple ‘traffic light’ system to identify whether gullies pose a major threat to water points.
If a gully of a given dimension and/or frequency is located downslope of the water point it often poses more of a threat to the source. In that case, consider relocating the water point and introducing gully rehabilitation measures. If downstream, the risk levels identified in the traffic light assessment (Table 3.1) should be elevated one level, i.e:
• If a gully of the dimension/frequency labelled ‘A’ in Table 3.1 is in the downslope area of the water point, classify as highest (‘severe’) threat level.
• If a gully of the dimension/frequency labelled ‘B’ in Table 3.1 is in the downslope area of the water point, classify as second highest (‘high’) threat level.
• If a gully of the dimension/frequency labelled ‘C’ in Table 3.1 is in the downslope area of the water point, classify as third highest (‘moderate’) threat level.
Figure 3.2: Environmental hazards that might affect a water source
Illustration: Nicky Barneby, Barneby Ltd.
1 = Gully
2 = Sediment deposition/flooding
3 = Cattletracks > possible beginning of a gully.
Dimension (length x width x depth = m3) OK
0-10 m3 11-25 m3 >25 m3 Low
No. in vicinity of water point 1 (C) (B) Moderate
2-3 (C) (B) (A) High
4 or more (B) (A) Severe
Example: length (25 m) x width (2 m) x depth (0.5 m) = 25 m3
Table 3.1. Assessing the risk posed by gullies to water points

25
Area affected by flooding
Regular flooding: If the area where a water point is to be constructed and its immediate environment (e.g. within a radius around the site of the water point of 150 m) is regularly flooded (e.g. during the rainy season) then consider the following actions:
• Relocate the site of the water point away from flood prone areas
• Raise the well head and seal the well to prevent any polluted flood water from entering the well
Hint: thinking about extremes
Also consider flooding that might happen less frequently – for example every 5 or 10 years.
Less frequent but very heavy floods can affect large areas and cause major damage, destroying water points, contaminating them or making them inaccessible.
Consider measures that might reduce the impacts of such extremes.
Hint: what to do about gullies
Gully or gullies in the vicinity of a water point need to be treated – i.e. if in a yellow-shaded cell. Consider identifying alternative locations for a water point if you identify several and or significant gullies – i.e. in a red-shaded cell.
In both cases, consult natural resource management experts or relevant guidelines for how to do this. In many countries, including Ethiopia, there are guidelines for rehabilitating or protecting watersheds (see Annex).
Very steep slope, high soil erosion rate despite terracing
Deep gully, expansion further up-slope
Badland – expansion into crop land
Medium steep slope, high soil erosion (sheet erosion and deep rills)
High runoff from village area because of compacted soil
Cattle tracks – might develop into gully
Heavily grazed, soil compaction
Water way without any protection – can develop into gully
Figure 3.3. Base maps with degradation threats and causes

26
• Manage water flows through cut-off drains, artificial water ways and levees
• Ensure areas from where floodwater originates is open-defecation free and free from other pollutants
• If water point is not accessible during periods of flooding, ensure alternative protected water sources are available.
Periodic flooding: Raise the well head and seal the well to prevent polluted water from entering the well.
Landslips/landslides
Landslips may be caused by different natural factors (e.g. weak or weathered geological material, differences in the permeability of material) and human factors (deforestation, cultivation of steep slopes, road construction). Most likely, a combination of both. They may occur on steep hillsides where vegetation is disturbed, for example along a foot path or where rills have developed as
Comment: catchment protection and groundwater recharge
Recharge to groundwater is highly dependent on prevailing climate, as well as land cover and underlying geology. Climate and land cover largely determine rainfall and evapotranspiration, whereas the underlying soil and geology dictate whether a water surplus (precipitation minus evapotranspiration) can be transmitted and stored in the sub-surface.
Land use change can have a very significant impact on groundwater recharge, and outcomes can be counterintuitive. For example, it is often assumed that planting trees and ‘re-vegetating’ catchments will increase groundwater recharge and availability. In practice the reverse can be true, because trees and perennial native vegetation can draw up and evaporate a lot more water than grass or crop land. So a decrease in runoff and greater soil moisture retention can still translate into less groundwater recharge if plants end up using more water.
There are no simple rules of thumb. In the uplands of Amhara, however, our judgement is that watershed protection measures of the kind prioritised in MERET-type programmes would be likely to have a positive influence on overall groundwater availability, and therefore rural water supply.
Source: Taylor et al 2013
Illustration: Nicky Barneby, Barneby Ltd.
Figure 3.4. Topographic base map showing areas of environmental degradation and initial identification of causes

27
a result of uncontrolled runoff. Landslips can also develop around springs because springs often appear at the junction of different rock formations. Landslips need to be treated, otherwise there is a danger that they expand and result in more damage.
Step 3.2: Assessing indirect environmental hazards in the wider catchment
Once a potential site for a water point has been identified and deemed safe, indirect environmental hazards in the wider catchment should be identified. This is important as natural resource degradation in the wider catchment can
affect the risk of flooding, and gullying that might draw down local water tables.
Changes in land use and land degradation can also have longer term impacts on groundwater conditions by affecting local water balances. Making predictions is difficult, however, because recharge to groundwater is strongly influenced by prevailing climate, as well as land cover and underlying geology (see comment box).
As a first step, a base map of the catchment of the water point should be drawn, main land cover units mapped and major degradation features identified. An example from the field is provided in Figure 3.3, and in three-dimensional form in Figure 3.4.
An assessment of the severity of indirect hazards can also be carried out. This can help establish priorities for action – see Table 3.3. Note that gullies or landslips identified in this step are those found in the wider catchment/watershed, and are not a direct threat to the water point.
Step 3.3: Developing a catchment protection plan
Using the base map drawn in Step 3.2 showing the main indirect hazards and areas where degradation processes are ongoing (Tables 3.2 and 3.3), appropriate mitigation measures can be identified.
For all degradation processes classified as medium or high risk, collaboration should be sought with relevant authorities or partners with expertise in natural resource management to identify the most appropriate conservation actions. Table 3.4 provides some examples of corrective measures. It also provides some ideas on what the underlying causes of degradation may be. Ideally, causes as well as symptoms should be addressed.
Once the main degradation features and corrective measures have been identified and drawn on the base map (Figure 3.5), a catchment protection plan should be elaborated and agreed by relevant stakeholders. The plan should detail where and what corrective measures should be actioned, how much labour needs to be invested, who should provide the labour and what additional materials might be required.
Degradation feature Location Possible reason
Gully • On grazing land • Overgrazing• Cattle tracks
• On crop land • Traditional furrows to drain excess water
• Ploughing up and down the slope
• On bush/forest land • Bush/forest clearing
• As a result of foot path/sealed area/cattle track
• Alignment• Lacking
maintenance
Sheet and rill erosion • On crop land • Land management practices
Flooding • On grazing land/crop land
• Inappropriate drainage
• Insufficient water infiltration
Landslips • On steep crop and grazing land
• Land management practices
Landslides • Along rivers• Around springs• On steep slopes
• Deforestation
Table 3.2. Examples of degradation features and possible causes
Hint: accounting for gender
Both men and women should be involved in drawing the catchment map, as this might reveal some gender-specific features.
For example, accessing water points on a steep slope might be more of an issue for women if they are mainly responsible for collecting water. Or certain areas may be used for defacation by different groups.

28
Description of degradation features Severity/extent of degradation Comments
None Low Medium High
Sheet/splash erosion on crop land
Rills on crop land
Gullies on crop land
Gullies on grazing land
Gullies on degraded land
Gullies in forest land
Sediment deposition
Cattle step
Landslip/landslide
Riverbank erosion
Deforestation
Notes: Rills can be smoothed out completely by normal land management/cultivation practices. Gullies are larger than rills and can no longer be smoothed out by normal cultivation practices, persistent.
Table 3.3. Assessing the severity of degradation features
Figure 3.5. Base map showing measures to address catchment degradation
Illustration: Nicky Barneby, Barneby Ltd.

29
Degradation feature Location Cause Corrective measures
Gullies Grazing land • Overgrazing• Cattle tracks
• Check dam• Fencing• Re-vegetation of gully and surrounding areas
Crop land • Traditional furrows to drain excess water• Ploughing up and down the slop
• Ploughing along the contours• Cut off drain and area closures above crop land to
reduce run-on and increase infiltration• Terracing• Check dam
Bush/forest land • Bush/forest clearing • Area closure• Cut and carry
As a result of foot path/sealed area/cattle track
• Alignment• Inefficient maintenance
• Re-alignment• Cut off drains• Stone paving and check structures
Sheet and rill erosion Crop land • Land management practices • Land management practices (e.g. contour ploughing, increasing organic matter content of the soil)
• Soil and stone bunds• Artificial water ways• Cut off drains above crop land
Flooding Grazing land/crop land • Inappropriate drainage• Insufficient water infiltration
• Artificial water ways• Cut off drains• Soil and/or stone bunds on crop land to enhance water
retention and infiltration• Area closures/afforestation on hilltops/steep slopes
Landslips Steep crop and grazing land • Land management practices • Soil and stone bunds on crop land• Area closures or afforestation• Retention walls (if serious)
Landslides a. Along riversb. Around springs
• Deforestation • Area closure• Afforestation• Retention walls• Fencing to avoid damange from livestock
Table 3.4. Possible corrective measures for main degradation features

30
Step 4: Keeping records: collecting and storing information
Once the water supply system is finished, it is a good idea to record, store and make available all relevant records. Information gathered from constructing a water point – even if the water point was unsuccessful – can be used to inform future WASH activities.
What data should be kept?
• Geological field notes from reconnaissance trips • Data from geophysical surveys (if any were carried out) • The digging or drilling report (log), including all data
relating to the drilling, construction and geological/geophysical logging, including all dry holes
• Data and results from pumping tests • Water level (using a dipper, if required) across
different seasons • Number of people using the scheme and estimate
of amount collected per person / household across different seasons
• Any incident when water supply system was not functional, reasons and actions undertaken
• Any incident when water supply system was damaged as a result of direct environmental hazards and actions undertake to fix the damage
• Any chemical, biological and physical parameters from water testing.
Why should data be kept?
This kind of information is helpful in building a picture of the hydrogeology of an area and can help better
inform future water scheme developments. For example, it may help governments to develop planning tools, it may help the district hydrogeologist to increase his/her understanding of the groundwater occurrence in the area and it can help implementing partners in their decisions to develop further water schemes.
Where should data be kept?
Collected data should be kept at local level and a copy should be made available to local and district authorities (e.g. at the office of the district water authority) and to implementing partners.
Hint: drilling logs
A drilling log is a written record of the soil layers and/or geological formations found at different depths. Soil/rock samples should be taken at regular depths (e.g. every meter) and described during the drilling or digging process. The soil/rock description is then recorded in the form of a drilling log. The drilling log will help to determine:
• The right aquifer for installation of the well-screen • Depth and length of the well-screen • Depth and thickness of the gravel pack • Location of the sanitary seal
Source: van der Wal (2010).
31
Further reading
Understanding water availability, catchment screening (Steps 1 and 2)
Bonsor, H. and MacDonald A. (2010) Groundwater and climate change in Africa: review of recharge studies, BGS Internal Report, IR/10/075, p. 30. Edinburgh: BGS. (nora.nerc.ac.uk/501776/1/IR-10-075_recharge_review.pdf).
Calow, R., Bonsor, H., Jones, L., Meally, S. O., Macdonald, A. and Kaur, N. (2011) Climate change, water resources and WASH: A scoping study. London:ODI.
Calow, R., Kebede, S., McKenzie, A. and Ludi, E. (2015) Climate Risk Screening for Rural Water Supply. Research Report. London: ODI
Collins, S. (2000) Hand-dug shallow wells. Series of manuals on drinking water supply, vol. 5. St. Gallen, CH: SKAT, Swiss Centre for Development Cooperation in Technology and Management. (www.rural-water-supply.net/en/resources/details/256).
Danert, K., Armstrong, T., Adekile, D., Duffau, B., Ouedraogo, I. and Kwei, C. (2010) Code of Practice for Cost Effective Boreholes. St Gallen, CH: RWSN.
Desta, L. and Adugna, B. (2012) A field guide on gully prevention and control. Addis Ababa, ET: Nile Basin Initiative.Doczi, J. and Ross, I. (2014) The economics of climate change adaptation in Africa’s water sector: A review and way
forward. London:ODI.Elliot, M., Armstrong, A., Lobuglio, J. and Bartram, J. (2011) Technologies for climate change adaptation – the water
sector. (T. e Lopez, dd.). Roskilde: UNEP.GWP, Unicef, HRW and ODI (2014). Strategic framework for WASH and climate resilient development.Howard, G. and Bartram, J. (2009) Vision 2030: the resilience of water supply and sanitation in the face of climate
change – summary and policy implications. Geneva, CH: World Health Organization. (www.who.int/water_sanitation_health/publications/vision_2030_summary_policy_implications.pdf).
ICE, Oxfam GB and WaterAid (2011) Managing water locally: an essential dimension of community water development. London: The Institution of Civil Engineers, Oxfam GB and WaterAid. (https://policy-practice.oxfam.org.uk/publications/managing-water-locally-an-essential-dimension-of-community-water-development-165794).
MacDonald, A., Davies, J., Calow, R. and Chilton, J. (2005) Developing groundwater: a guide for rural water supply. Bourton-on-Dunsmore, UK: ITDG Publishing.
MacDonald, A. and Calow, R.C. (2010) ‘Developing groundwater for secure rural water supplies in Africa’, Desalination 252 (2010): 129-139.
MacDonald, A., Bonsor, H.C., Calow, R.C., Taylor, R.G., Lapworth, D.J., Maurice, L., Tucker, J. and O’Dochartaigh, B.E. (2011) ‘Groundwater resilience to climate change in Africa’, British Geological Survey Open Report, OR/11/031, p. 25 (nora.nerc.ac.uk/15772/).
Ministry of Water Resources, Women’s Affairs Department (2005) Gender mainstreaming field manual for water supply and sanitation sub-sector. Addis Ababa, ET: MoWE.
Oates, N., Ross, I., Calow, R., Carter, R. and Doczi, J. (2014) Adaptation to climate change in water, sanitation and hygiene: assessing risks and appraising options in Africa. London: ODI.
Republic of Sierra Leone (2014) Technical guidelines for the construction and maintenance of hand-dug wells. Freetown: Government of Sierra Leone, Ministry of Water Resources and WSP. (www.rural-water-supply.net/en/resources/details/581).
Taylor, R.G., Scanlon, B., Doll, P., Rodell, M., van Beek, R., Wada, Y., Longuevergne, L., Leblanc, M., Famiglietti, J.S., Edmunds, M., Konikow, L., Green, T.R., Chen, J., Taniguchi, M., Biekens, M.F.P., MacDonald, A., Fan, Y., Maxwell, R.M., Yechieli, Y., Gurdak, J.J., Allen, D.M., Shamsudduha, M., Hiscock, K., Yeh, P.J.F., Holman, I. and Treidel, H. (2013) ‘Ground water and climate change’. Nature Climate Change, Review Article.
van der Wal, A. (2010) Understanding groundwater and wells in manual drilling. Instruction handbook for manual drilling teams on hydro-geology for well drilling, well installation and well development. Oosteind: Practica Foundation.
Environmental assessment and management (Step 3)
Desta, L., Carucci, V., Wendem-Agenehu, A., and Abebe, Y. (eds.) (2005) Community-based participatory watershed development: a guideline. Addis Ababa, ET: Ministry of Agriculture and Rural Development (Part 1 & 2). (https://docs.google.com/uc?id=0B1XvXj-Vi6cnYmVkNGQ3YjYtMjhiMC00ZGE3LWI3NWQtNzdiNzk3ZGU3YWUy&export=download).

32
Desta, L. and Adugna, B. (2012) A field guide on gully prevention and control. Addis Ababa, ET: Nile Basin Initiative, Eastern Nile Subsidiary Action Program (ENSAP), Eastern Nile Technical Regional Office (ENTRO), Eastern Nile Watershed Management Project. (http://www.bebuffered.com/downloads/ManualonGullyTreatment_TOTFinal_ENTRO_TBIWRDP.pdf).
Knoop, L., Sambalino, F. and van Steenbergen, F. (2012) Securing water and land in the Tana Basin: a resource book for water managers and practitioners. Wageningen: 3R Water Secretariat. (http://www.metameta.nl/wordpress/wp-content/uploads/2012/12/Tana-Manual.html)
Meder, K. (2011) Environment assessment and watershed action planning related to GiZ MHP projects: field manual. Addis Ababa, ET: GiZ.
TerrAfrica, WOCAT, FAO (2011) SLM in practice – guidelines and best practices for sub-Saharan Africa. Bern: WOCAT, Rome: TerrAfrica and FOA (https://www.wocat.net/en/knowledge-base/documentation-analysis/global-regional-books.html).
WOCAT (2007) Where the land is greener – case studies and analysis of soil and water conservation initiatives worldwide. Bern: WOCAT, CTA, FAO, UNEP, CDE, WOCAT. (https://www.wocat.net/en/knowledge-base/documentation-analysis/global-regional-books.html).

33
Annex: Additional reference material
Step 1: Understanding water availability
Hydrogeological sub-environment
Groundwater potential and avg. yields Groundwater targets and technologies
Crystalline basement rocks Highly weathered and/or fractured basement
Moderate0.1–1.0 l/s
• Fractures at the base of the deep weathered zone • Sub-vertical fracture zones
Dug wells can capture water from weathered zone
Poorly weathered or sparsely fractured basement
Low0.1–1.0 l/s
• Widely spaced fractures and localised pockets of deep weathering
Drilled boreholes, although failure rate can be high without careful siting
Consolidated sedimentary rocks
Sandstone Moderate – High1.0–20.0 l/s
• Coarse porous or fractured sandstone
Drilled boreholes
Mudstone and shale Low0.0–0.5 l/s
• Hard fractured mudstones • Igneous intrusions or thin limestone/sandstone layers
Dug wells
Limestones Moderate – High 1.0–100.0 l/s
• Fractures and solution enhanced fractures (dry valleys)
Springs, drilled boreholes. Failure rate can be high if boreholes not carefully sited
Unconsolidated sediments Major alluvial and coastal basins
High1.0–40.0 l/s
• Sand and gravel layers
Dug wells and drilled boreholes. Dug wells may require support during digging
Small dispersed deposits, such as river valley alluvium
Moderate1.0–20.0 l/s
• Thicker, well-sorted sandy/gravel deposits
Dug wells and drilled boreholes. Dug wells may require support during digging
Valley deposits in mountain areas
Moderate – High1.0–10.0 l/s
• Stable areas of sand and gravel, river-reworked volcanic rocks, blocky lava flows
Dug wells, drilled boreholes
Volcanic Rocks Extensive volcanic terrains
Low – HighLavas: 0.1–100.0 l/sAshes and pyroclastic rocks: 0.5-5.0 l/s
• Generally little porosity or permeability within the lava flows, but the edges and flow tops/bottoms can be rubbly and fractured; flow tubes can also be fractured
• Ashes are generally poorly permeable but have high storage and can drain water into underlying layers
Dug wells, springs, drilled boreholes
Source: based on MacDonald et al (2008).
Table A1. Groundwater potential of major hydrogeological environments in Ethiopia

34
Groundwater occurence in basement rocks
Ground water occurence in riverside alluvium
Source: MacDonald and Calow (2010).
Groundwater occurence in sedimentary rocks
Groundwater occurence in volcanic rocks
Figure A1. Geological environments and groundwater availability
35
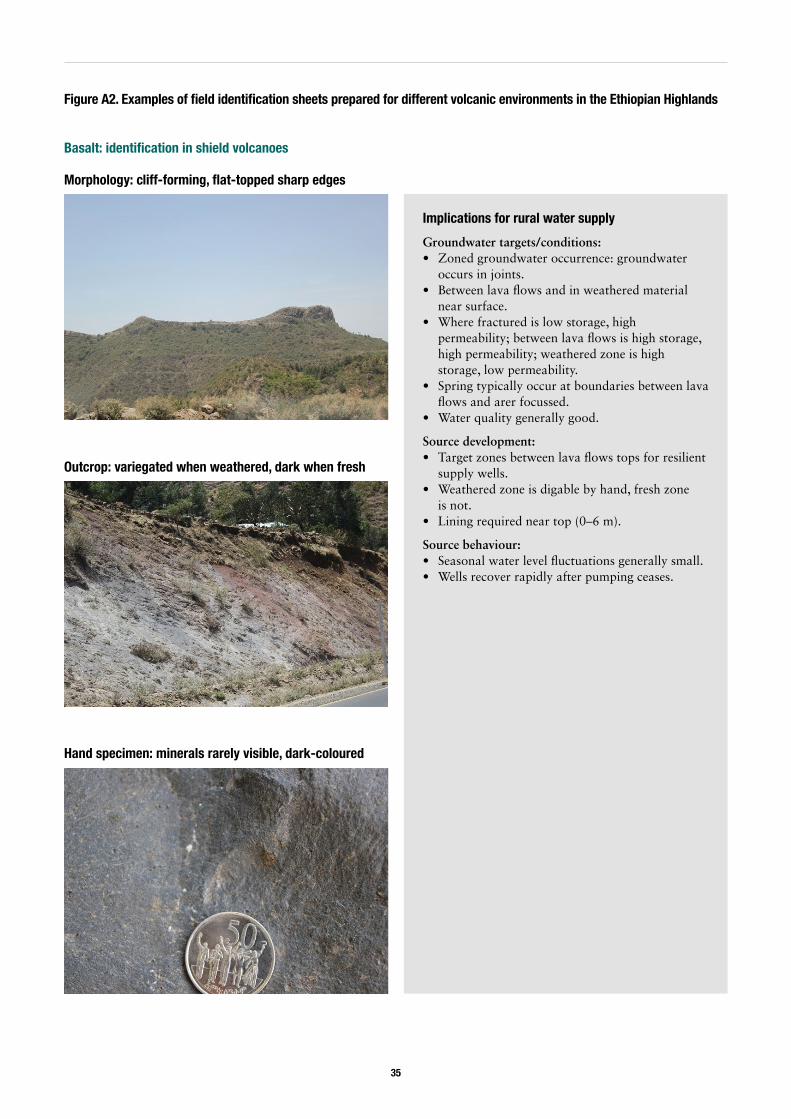
Figure A2. Examples of field identification sheets prepared for different volcanic environments in the Ethiopian Highlands
Basalt: identification in shield volcanoes
Morphology: cliff-forming, flat-topped sharp edges
Outcrop: variegated when weathered, dark when fresh
Hand specimen: minerals rarely visible, dark-coloured
Implications for rural water supply
Groundwater targets/conditions: • Zoned groundwater occurrence: groundwater
occurs in joints. • Between lava flows and in weathered material
near surface. • Where fractured is low storage, high
permeability; between lava flows is high storage, high permeability; weathered zone is high storage, low permeability.
• Spring typically occur at boundaries between lava flows and arer focussed.
• Water quality generally good.
Source development: • Target zones between lava flows tops for resilient
supply wells. • Weathered zone is digable by hand, fresh zone
is not. • Lining required near top (0–6 m).
Source behaviour: • Seasonal water level fluctuations generally small. • Wells recover rapidly after pumping ceases.

36
Trachyte: identification in shield volcanoes
Morphology: dome-forming
Outcrop: rounded-cliff, low-weathering
Hand specimen: visible crystals/minerals, grey colour, heavy
Implications for rural water supply
Groundwater targets/conditions: • Groundwater occurs in joints, between flow
contacts and in weathered upper part of the units (but weathering is low in trachytes).
• Low storage, low yield, low permeability. • Springs generally at flow contacts and focused type. • Water quality generally good.
Source development: • Difficult to dig as rock is hard and unweathered. • Drilled wells preferred, but still high risk.
Source behaviour: • Seasonal water level fluctuation is generally large. • Wells may take time to recover once drained.

37
Volcanic ash: identification in shield volcanoes
Morphology: gentle, undulating slopes; slope breaks when hard
Outcrop: light-coloured, friable, sugary texture
Hand specimen: light-weight porous
Implications for rural water supply
Groundwater targets/conditions • High groundwater storage but low permeability:
dug wells preferred over drilled boreholes. • Weathered rock may contain high levels of clay:
wells may have very low yields. • Springs generally diffuse discharge type: spring
boxes may need to be widened to capture multiple outlets.
• Water quality generally good, though may contain high fluoride.
Source development: • Weathered zone may be unstable: wells may need
lining, at least in the top part. • Wells may require periodic cleaning.
Source behaviour: • Modest water levels fluctuations between wet
and dry periods: yields, if adequate, should be sustainable through dry season.
Figure A2 (cont’d). Examples of field identification sheets prepared for different volcanic environments in the Ethiopian Highlands

38
Alluvial sediments: identification in shield volcanoes
Morphology: flat plain bounded by higher ground
Outcrop: occurs in foothills of mountains adjacent to rivers
Hand specimen: mix of clay, silt, sand, gravel, pebbles and cobbles
Implications for rural water supply
Groundwater targets/conditions: • Groundwater occurs in coarser part of formation,
and at contact between sediments and underlying bedrock.
• Underlying weathered and decomposed bedrock is a good water-bearing zone.
• High storage, high yield, medium to high permeability.
• Springs generally diffuse discharge type.
Source development: • High digability but vulnerable to collapse: lining
should be routine.
Source beaviours: • Low to medium water level fluctuation between
wet and dry periods. • If correctly sited, sources should be resilient to
rainfall variability.

39
Step 2: Ensuring sustainability: estimating supply and demand
Catchment screening approaches
Two methodologies can be used to assess the catchment areas needed for resilient sources: (1) the field-based approach described in Step 2; and (2) a GIS approach which is best suited to assessing the catchment size of existing water sources for vulnerability classification. The GIS approach is summarised below.
GIS methodology for water point vulnerability assessment
A GIS approach can be applied across districts or even regions to generate maps showing which sources might be vulnerable to change. The methodology requires accurate water point locations, a Digital Elevation Model (DEM) and a map of rainfall or groundwater recharge.
The methodology has several stages, firstly calculating the catchment area of a potential site, checking, in the case of hand dug wells, that there isn’t a risk of rapid groundwater drainage and assessing the water available within the catchment.
Step 1. Calculate catchment area
Springs: The catchment area of a spring can be derived by calculating the parts of the DEM from which water will flow to the spring site, assuming that infiltrated groundwater follows the same flow path as surface water would. As
locations of springs will not be known with precision, the catchment area for the area immediately surrounding the spring is calculated, and the highest catchment area is selected to account for errors in the terrain model and location.
Dug wells: A dug well creates a cone of depression in the water table that can draw groundwater from the surrounding areas, so the catchment area is calculated in a similar way to that of a spring, except the radius over which the catchment area is calculated is increased to account for the potential capture of groundwater by the cone of depression. Once again, the highest resulting catchment area is selected.
Step 2. Assess risk of rapid groundwater drainage
Dug wells: The elevation of the lowest point within the radius of the cone of depression is calculated, and compared to the elevation of the well site.
Step 3. Calculate yield of water from catchment area
The catchment area calculated in Step 1 is multiplied by the annual rate of groundwater recharge, or rainfall converted to recharge by empirical relationship, to calculate an annual volume of recharge.
Step 4. Classify sites
Sites are classified by comparing required source yield to the available catchment yield, and by the extent to which steep slopes may lead to drainage of the aquifer. As the low point will have been used in the calculation of yield, and so the assessment that there is a risk of rapid drainage must override the catchment yield assessment.
Catchment yield vs demand Slope
Demand > 100% recharge Highly vulnerable > 20 m drop off within 150 m Highly vulnerable
Demand from 100–30% of available recharge Vulnerable 20–10 m drop off within 150 m Vulnerable
Demand from 30–10% of available recharge Possibly vulnerable 10–5 m drop off within 150 m Possibly vulnerable
Demand < 10% of recharge Adequate < 5 m dropp off within 150 m Adequate

40
Step 3: Identifying and mitigating hazards
1. Direct damage to water points
Flood control: additional information
Cut-off drains above water point: A cut-off drain is a graded channel constructed to intercept and divert the surface runoff from higher ground/slopes to a water way, river, gully, eyc. Protecting downstream cultivated land, a village or a water point. Cut-off drains help to reduce run-on and safely drain excess runoff to the next waterway. If water points are built on heavily grazed and degraded areas (e.g. compacted soil, animal tracks), cut-off drains should be constructed at least 10m above the water point in case contaminated water is collected and should be deep and wide enough to drain runoff from a major rainfall event.
Artificial waterways: If flooding is a recurrent problem in the area where the water point would best be constructed, more sophisticated drainage structures might be necessary. These could include artificial waterways intercepting runoff within the catchment and draining it safely to the nearest natural water course. Protective measures within natural water courses might also be required to prevent further deepening and drawing down the water table.
Such measures should supplement conventional protection measures focusing on the design and construction of the water point itself. For example, the design and construction of protected wells typically includes (1) a concrete apron to direct surface water away from the well; (2) a sanitary seal (typically clay, grout or concrete) that extends at least 1-3m below ground to prevent the infiltration of contaminants; and (3) a method to access water that enables it to be sealed following use. Handpumps can be fitted to most wells to improve convenience and decrease the likelihood of contamination.
2. Gully protection/reclamation
If there are rills and gullies near water points or features such as cattle or foot paths that may lead to gully formation, these should be addressed. A variety of gully control techniques are discussed briefly below.1
The photo below shows gulley development that, left unchecked, will damage or destroy the nearby well.To effectively control gully development, three types of intervention are required:
1. Improvement of the gully catchment to reduce and regulate runoff volumes and peaks.
2. Diversion of runoff water up-stream of the gully area.
1 For further details see, for example: Desta, L. and Adugna, B. (2012) A field guide on gully prevention and control. Addis Ababa, ET: Nile Basin Initiative, Eastern Nile Subsidiary Action Program (ENSAP), Eastern Nile Technical Regional Office (ENTRO), Eastern Nile Watershed Management Project. (http://www.bebuffered.com/downloads/ManualonGullyTreatment_TOTFinal_ENTRO_TBIWRDP.pdf).
Figure A3. Diagram of a cut-off drain
Source: WOCAT Database Code T_eTH031en. Traditional cut-off drain. Case study compiled by Sabina Emy, Department of Geography, University of Basel, Basel, Switzerland. Technical Drawing: Sabina Emy.
Figure A4. Diagram of an artificial waterway
Source: Desta, L., Carucci, V., Wendem-Agenehu, A., and Abebe, Y., eds.
(2005) Community-based Participatory Watershed Development –
A guide. Ministry of Agriculture and Rural Development (MoARD),
Addis Abeba.

41
3. Stabilisation of gullies via structural/vegetative measures.
Most important, however, is preventing gullies developing in the first place, since gully rehabilitation can be costly and time consuming.
Preventative measures include:
• Land management practices to reduce runoff and enhance water infiltration. These include: soil and water conservation practices following a watershed approach, increased vegetation/canopy cover, forest/shrubland management, controlled grazing, soil fertility
management, and the stabilisation of large rills and small gullies.
• Runoff management, including: cut-off drains, retention and infiltration ditches, terraces, grass patches above areas where gullies might form, control of runoff from culverts, and runoff control from sealed surfaces and paths.
• Diversion of surface water above the gully: cut-off drains, diversion ditches, and stabilised artificial waterways).
The gully in Figure A6 is being reclaimed using check dams and re-vegetation along the gully banks. Once gullies have started to form, it is important to control them using appropriate structural and vegetative measures in the head area, and along the floor and the sides of the gully.
An expanding gully threatens a well in Yilmana Densa Woreda, Amhara. © Arto Suominen
Gully reclamation in Farta Woreda, Amhara. © Eva Ludi, 2013
Figure A5. Diagram of vegetative check-dam with stem cuttings
Source: WOCAT (2007) Where the land is greener: Case studies and analysis of soil and water conservation initiatives worldwide. Liniger, H.P. and Critchley, W. (eds.), Centre for Development and Environment, Institute of Geography, University of Bern, Bern. (p. 229ff). Case study compiled by Georg Heim, Langnau, Switzerland and Ivan Vargas, Cochabamba, Bolivia. Technical Drawing: Mats Gurtner.

42
A range of physical and biological measures can be used, with a combination of both often achieving the best results.
Common interventions include:
Gully head control
Gully heads are the most difficult part of a gully to treat, especially if the gully is deep because of the erosive power of falling water. First, cut-off drains are required to avoid further erosion, and check-dams close to the head should be constructed to trap sediments and raise floor levels. Re-vegetation should follow this process to further stabilise the gully head.
Gully reshaping
Steep gullies should be reshaped (with a slope of less than 45%) and re-planted. This requires that water flows are entirely diverted away from the gully.
• Reshaping and filling is done to decrease the angle of gully sides, create planting areas and encourage revegetation and stabilization, usually in small to medium-sized gullies where most runoff has been diverted into a stable waterway or drainage line.
• When these gullies are shaped and smoothed, vegetation can be established over the levelled gullies.
Structural check-dams within the gully
Check-dams are constructed across the gully bed to stop channel and/or bed erosion. By reducing the original gradient of the gully channel, check-dams reduce the velocity of water runoff and its erosive power. Run-off during peak flow is conveyed safely by check-dams. Check-dams can be constructed using different materials (e.g. brushwood, sandbags, loose stones, gabion, organic gabion (bamboo/reed) and arc-weir check dams
• Stone check-dams prevent the deepening and widening of the gully and trap sediments. Sediments accumulated behind a check-dam can be planted with crops or trees/shrubs and grass and can thus provide additional income.
• Brushwood check-dams are vegetative measures constructed with vegetative materials, branches, poles/posts and twigs. Plant species which can easily grow vegetatively through shoot cuttings are ideal for this purpose. The objective of a brushwood check-dam is to retain sediments and slow down runoff, and enhance the re-vegetation of gully areas.
Vegetative measures
Vegetation will protect the gully floor and banks from scouring, help slow down runoff and encourage the deposition of sediment. Depending on soil quality, water availability and steepness of gully sides, vegetation may establish itself naturally if runoff is adequately controlled.
Figure A6. Integrated gully control and catchment protection measures
Source: WOCAT (2007) Where the land is greener: Case studies and analysis of soil and water conservation initiatives worldwide. Liniger, H.P. and Critchley, W. (eds.), Centre for Development and Environment, Institute of Geography, University of Bern, Bern. (p. 233ff). Case study compiled by Georg Heim, Langnau, Switzerland and Ivan Vargas, Cochabamba, Bolivia. Technical Drawing: Mats Gurtner.

43
If conditions are more difficult, planting of vegetation – grasses, shrubs and trees – may be necessary. In all cases, exclusion of all animals is a precondition.
Suggested measures include:
• Bundling or wattle – a technique where fresh plant stems are bound together, then horizontally planted across the gully bed or along the sidewall and covered by soil). Over time, bundles will grow and serve as live check-dam;
• Layering (horizontal planting of fresh plant stems across the gully floor or reshaped sidewall);
• Gully bed plantation with water-loving or moisture tolerant trees, shrubs and grasses;
• retaining walls with bamboo-matting along gully side walls; • planting of trees, shrubs and grasses on gully sidewalls; • direct sowing (broadcasting) on gully beds and into
cracks on sidewalls during the rainy season; and • off-set plantation in areas adjacent to gullies to
prevent sideways extension of the gully and further encroachment of arable land.
Maintenance and management arrangements
Whether physical or vegetative measures (or both) have been used for rehabilitating a gully, regular maintenance of structures is vital. Structures should be observed for
damage, especially during the rainy season and after heavy storms. Damaged check-dams should be repaired immediately to avoid further damage and eventual collapse.
Once gullies have stabilised, they can be further used for productive purposes – planting of fodder grasses and trees or fruit trees offer good economic returns. Gullies usually straddle land belonging to several farmers (if affecting crop land) or a group of farmers (if affecting communal grazing areas). A critical component of every gully rehabilitation effort is to establish clear management rules and regulations together with the affected households.
A small landslip near a spring in Mweso, DRC. © Frank Greaves
Figure A7. Landslip prevention/rehabilitation
Source: WOCAT (2007) Where the land is greener: Case studies and analysis of soil and water conservation initiatives worldwide. Liniger, H.P. and Critchley, W. (eds.), Centre for Development and Environment, Institute of Geography, University of Bern, Bern. (p. 241ff). Case study compiled by Dileep K. Karna, Department of Soil Conservation and Watershed Management, District Conservation Office, Kathmandu, Nepal. Technical Drawing: Mats Gurtner.

44
3. Measures to protect areas vulnerable to landslips/landslides
Natural causes of landslides, including weak/weathered material, differences in the permeability of material or shrink-and-swell weathering, cannot be directly addressed. It is therefore important to protect the wider area where landslips/landslides happened in the past or are likely to happen in future.
Such protection is aimed at reducing disturbance through fencing (to avoid animal tracks from developing and preventing further destruction of vegetation cover), as this is vital for enhancing infiltration. Afforestation of a larger area around areas prone to landslips should also be considered as this will help to bind soil and reduce the impact of rainfall and runoff. Care needs to be taken, however, in terms of species selection; not all species are suitable.
Indirect damage to water points: degradation in the wider catchment can affect water sources
When catchments become degraded, the development of gullies can draw down water tables near water sources and affect their yield. Land degradation and land use change can also influence groundwater recharge and availability more widely, but outcomes from typical catchment protection measures can be difficult to predict. For example, planting trees and allowing native vegetation to grow back in some areas may reduce runoff and increase soil moisture, but could also reduce groundwater recharge. Much depends on local conditions, and expert advice should be sought on what kinds of catchment protection measures are likely to be appropriate to the risks identified in different agro-ecological environments.
Depending on the degradation features observed (see above), a wide range of corrective measures are potential available. Final selection will depend on the bio-physical and socio-economic environment.
Common interventions include:
Area closures
Area closures can improve land with degraded vegetation and/or soil by allowing natural regeneration.Area closures with or without additional tree/shrub planting are a common
measure on top of hills. Once areas are closed off and livestock and human interference stops, natural vegetation usually recovers quickly. This helps to reduce the impact of rainfall on bare soils, decrease the velocity of runoff and increase water infiltration (though not necessarily groundwater recharge). After two years, grass can be cut for livestock fodder. Other economic activities can be introduced into closed areas such as special fodder trees, fruit trees, or apiculture. Water harvesting structures such as hillside terraces, micro basins, eyebrow basins, etc. can also be introduced to enhance tree planting and water conservation.
Physical soil and water conservation on crop land
A range of technologies are available for soil and water conservation on crop land. These include soil and stone bunds and a range of different terraces. Depending on rainfall, structures are either graded (with a gradient of 1% towards the nearest water way or stream) to drain excess runoff or, on gentler strips of land can be left unploughed for grass strips to develop. Over time these develop into terraces. Grass strips are much cheaper to establish than bunds.
In areas with high rainfall – or highly concentrated rainfall – artificial waterways might have to be established to drain excess water into the nearest stream. Care needs to be taken to protect the floor of these waterways with grass cover and/or stones and check dams to prevent gulley development.
Cut-off drains
Cut-off drains above arable land or between grazing land and arable land help to drain excess runoff towards the closest stream. In drier areas, cut-off drains can also be used to divert water to ponds for irrigation or livestock watering. Cut-off drains are also important structures above gullies to prevent further gully development.
If water points are built on grazing land – areas that are often heavily grazed and degraded - cut-off drains should be constructed above the water point to protect it from floods. Because cut-off drains might intercept contaminated runoff which infiltrates into the soil, a distance between the cut-off drain and the water point of at least 10 m needs to be observed.

45
Figure A9. Diagram of a stone bund/terrace
Source: WOCAT (2007) Where the land is greener: Case studies and analysis of soil and water conservation initiatives worldwide. Liniger, H.P.
and Critchley, W. (eds.), Centre for Development and Environment, Institute of Geography, University of Bern, Bern. (p. 261ff). Case study
compiled by William Critchley, Vrije Universiteit, Amsterdam, Netherlands. Technical Drawing: Mats Gurtner.
Figure A8. Diagram of an area closure
Source: WOCAT (2007) Where the land is greener: Case studies and analysis of soil and water conservation initiatives worldwide. Liniger, H.P.
and Critchley, W. (eds.), Centre for Development and Environment, Institute of Geography, University of Bern, Bern. (p. 317ff). Case study
compiled by Daniel Danano, Addis Abeba, Ethiopia. Technical Drawing: Mats Gurtner.

46
Measure Location Quantity Work norms Cost (not incl. labour) Material
Unit Total
Soil bunds On cultivated fields with slope < 10%
25 km 150 PD / km Digging for tools, measuring tools, lines for demarcation
Water from roads From road drains and culverts to reservoir and re-charge ponds/pits
• 2 systems to re-charge pits (500 m3 each)
• 350 m of waterways• 6 gabions structure to
deviate water
1 m3/PD Digging tools, gabions, measuring tools, gravel, stones, plastic sheet lining
Gully plugs On all major gullies on base map
15 systems = 1,250 m3 0.5 PD/m3 Gabions, stones, digging tolls, measuring tools
Cut-off drain Between cultivated land and closed hillsides to intercept run-off
1 km = 500 m3 earthwork (1.0 m x 0.5 m)
0.75 m3/PD Digging tools, stones
Waterways Between fields to divert excess run-off to stream
2 km = 500 m3 (0.5 m x 0.5 m)
0.75 m3/PD Digging tools, stones
Re-charge ponds/pits Suitable locations 4 systems = 2,000 m3 1 m3/PD Digging tools, measuring tools, gravel, sand
Roof water harvesting On the roof of school in xyz Two ferrocement tanks (50 m3), gutters
Cement, iron mesh, 80 m of gutters, 20 m of PVC pipe, re-inforced iron bars, sand, tools
Seedling production In nurseries 100,000 15 PD/1,000 seedlings
PD = Person Days
Table A2. Example catchment protection plan
Figure A10. Diagram of a soil bund (‘fanja juu’ in Swahili)
Source: WOCAT (2007) Where the land is greener: Case studies and analysis of soil and water conservation initiatives worldwide. Liniger, H.P.
and Critchley, W. (eds.), Centre for Development and Environment, Institute of Geography, University of Bern, Bern. (p. 269ff). Case study
compiled by Donald Thomas; Kithinji Mutunga and Joseph Mburu, Ministry of Agriculture, Nairobi, Kenya. Technical Drawing: Mats Gurtner.

47
Conservation measure SWC guidelines (pp.)
Physical soil and water conservation
Level soil bund 69–70
Stone bund 71–72
Stone-faced soil bund 73–74
Level fanja juu 75–76
Bench terrace 77
Conservation tillage 78
Hillside terrace 79
Hillside terrace with trenches 80
Improved drainage and flood control
Waterways 83
Cut-off drains 84–85
Graded soil bund 86
Graded fanja juu 87
Improved surface drainage of vertisols 88–89
Water harvesting
Hand-dug well (for irrigation purposes) 93–94
Low-cost water lifting 95–96
Low-cost micro-ponds 97–98
Underground cisterns 99–100
Percolation pond/pit 101–103
Farm pond 104
Spring development 105–106
Drip irrigation system 107–108
Roof water harvesting 109
Farm dam 110
Riverbed or permeable rock dam 111–112
Small stone bund with run-on/run-off areas; narrow stone lines along contours; stone/soil bunds with run-on/run-off areas 113–116
Conservation bench terraces 117–118
Tie ridges 119–120
Zaï pits/planting pits 121–122
Large half moons 123
Diversion weirs 124
Soil fertility management and biological soil conservation
Compost-making 127–128
Fertilisation and manure application 129
Live check-dams 130
Mulching and crop residue management 131
Grass strips along contours 132
Stablilisation of physical structures and farm boundaries 133–134
Table A3. Conservation interventions discussed in detail in Ethiopia’s community-based participatory watershed development guidelines

48
Conservation measure SWC guidelines (pp.)
Vegetative fencing 135
Ley cropping 136
Integration of food/feed legums into cereal cropping systems 137
Inter-cropping 138
Crop rotation 139
Strip cropping 140
Agroforestry, forage development and forestry
Area closures 143–144
Micro-basins 145
Eyebrow basins 146
Herring bones 147
Micro-trenches 148
Trenches 149–150
Improved jobs 151
Multi-storey gardening 152
Seed collection 153–154
Gully control
Stone check-dams 157–158
Brushwood check-dams 159–160
Gully reshaping/filing and re-vegetation 161
Sediment storage and overflow gully control 162–163
Sediment storage and overflow soil bund 164–165
Note: interventions are grouped into different categories. In addition, pages in SWC guidelines where area of application, technical specifications, etc. are provided have been indicated.
Table A3 (cont’d). Conservation interventions discussed in detail in Ethiopia’s community-based participatory watershed development guidelines

Overseas Development Institute203 Blackfriars Road London SE1 8NJ
Tel: +44 (0) 20 7922 0300 Fax: +44 (0) 20 7922 0399Email: [email protected]
Shaping policy for development odi.org | @ODIdev
ODI is the UK’s leading independent think tank on international development and humanitarian issues.
Readers are encouraged to reproduce material for their own publications, as long as they are not being sold commercially. As copyright holder, ODI requests due acknowledgement and a copy of the publication. For online use, we ask readers to link to the original resource on the ODI website. The views presented in this paper are those of the author(s) and do not necessarily represent the views of ODI or our partners.
© Overseas Development Institute 2018. This work is licensed under a Creative Commons Attribution-NonCommercial Licence (CC BY-NC 4.0).
All ODI publications are available from www.odi.org
Cover photo: Land degradation in Farta Woreda and across the Ethiopian Highlands more generally can pose a risk to rural water supply. E. Ludi, 2013