climate change and agriculture paper greenhouse gas
TRANSCRIPT

CROP PAPER
* To whom all correspondence should be addressed. Email: [email protected]
CLIMATE CHANGE AND AGRICULTURE PAPER
Greenhouse gas emissions and energy use in UK grown short-day
strawberry (Fragaria xananassa) crops
Short title: GHG emissions & energy use in strawberries
D. J. WARNER
1*, M. DAVIES
2, N. HIPPS
2, N. OSBORNE
2, J. TZILIVAKIS
1 AND
K. A. LEWIS1
1Agriculture and Environment Research Unit, University of Hertfordshire, Hatfield,
Herts, AL10 9AB, UK
2 East Malling Research, New Road, East Malling, Kent, ME19 6BJ, UK
(Revised MS received 22 January 2010; Accepted 28 April 2010)
SUMMARY
Reducing greenhouse gas emissions and optimizing energy consumption is important
for mitigating climate change and improving resource use efficiency. Strawberry
(Fragaria xananassa Duch) crops are a key component of the UK soft fruit sector and
potentially resource-intensive crops. This is the first study to undertake a detailed
environmental impact assessment of all methods of UK strawberry production. A
total of 14 systems with six additional sub-systems grown for between 1 and 3 years
were identified. They were defined by the growing of short-day (Junebearer) or
everbearer varieties, organic production, covering with polytunnels or grown in the
open, soil-grown (with or without fumigation) or container-grown (with peat or coir
substrate) and summer or spring planted. Pre-harvest, the global warming potential

2
varied between 1.5 and 10.3 t CO2 equiv/ha per crop or 0.13 and 1.14 t CO2
equiv/tonne of class 1 fruit. Key factors included use of tunnels, mulch and irrigation,
sterilization of soil with fumigants, and use of peat substrate. Seasonal crops without
covers grown where rotation of sufficient length reduced Verticillium (System 4) were
the most efficient. System 4a (that did not use mulch) emitted 0.13 t CO2 equiv/t of
class 1 fruit. A second or third cropping year in soil grown systems prolonged the
effect of mulch and soil fumigants. Greenhouse gases from System 4 (with mulch)
averaged 0.30 t CO2 equiv/t of class 1 fruit after 3 years of cropping compared to 0.63
and 0.36 t CO2 equiv/t after 1 and 2 years respectively.
INTRODUCTION
Strawberries (Fragaria xananassa Duch) are an important component of the UK soft
fruit sector. The value of UK strawberry production has risen from £94 million in
2002 to £213 million n 2008 (Department for Environment, Food and Rural Affairs
(DEFRA) Agricultural Statistics 2009a). Production in the UK is predominantly
from ‘short-day’ (Junebearer) crops, harvested during June and July, of which the
main cultivar is cvar Elsanta. Most UK growers extend the growing season by
sequential planting of short-day crops and growing under covers (polytunnels).
Production may also be extended beyond the main season with everbearer cultivars,
plants able to flower at least twice per season (Hancock 1999), such as cvar Bolero
and cvar Everest, which crop between August and September (Simpson et al. 2002).
Climate change, one cause of which is increased atmospheric concentration of
greenhouse gases (GHG), is predicted to increase mean surface temperature and alter
precipitation patterns (Jenkins et al. 2007; Murphy et al. 2009). The Kyoto Treaty of
1997 committed industrialized nations to reduce GHG emissions by 5.2 % below

3
their 1990 levels during the first commitment period (the Quantified Emission
Limitation or Reduction Commitments (QELRC)) between 2008 and 2012 (DEFRA
2005). The UK Climate Change Act (2008) commits the UK to an 80 % reduction in
GHG emissions compared to 1990 by the year 2050. Carbon dioxide (CO2) is one of
six GHG covered by the Kyoto Protocol (IPCC 2006); others include nitrous oxide
(N2O), methane (CH4) hydrofluorocarbons (HFC), perfluorocarbons (PFC) and
sulphur hexafluoride (SF6). Each GHG has a different potential to cause global
warming but may be standardized on a single scale as CO2 equivalent (CO2 equiv), its
global warming potential (GWP). The time elapsed affects the GWP of a GHG and in
this case it has been calculated after 100 years (GWP100). Methane and N2O have a
GWP of 25 and 298 respectively.
Detailed life cycle analyses (LCA) pre-farm gate of current UK arable, livestock
and glasshouse horticultural production methods have been undertaken by a number
of authors (Blanke & Burdick 2005; Edwards-Jones et al. 2008, 2009; Hülsbergen &
Kalk 2001; Tzilivakis et al. 2005a, b; Williams et al. 2006; Milà i Canals et al. 2007).
Assessments of crops produced overseas include Ligouri et al. (2009) and Maraseni et
al. (2009). Foster et al. (2006) and Garnett (2006, 2007) have examined the entire
supply chain.
Strawberries may be grown by several different methods; 14 primary systems were
identified, nine of which used short-day varieties, with six additional sub-systems.
The analysis focuses on short-day varieties since everbearer crops are grown
concurrently as opposed to alternatively. The GWP100 and primary energy (PE, in
giga-joules (GJ)) were quantified per hectare (ha) and per tonne (t) of class 1 fruit
(berries that growers stated were suitable for sale fresh) for each system. It is the first
study to undertake a detailed environmental impact assessment (EIA) of all methods

4
of UK strawberry crop production. The results are discussed with respect to
minimizing two environmental burdens, GHG emissions and PE per unit area grown
while maintaining yields to optimize efficiency per tonne of output.
MATERIALS AND METHODS
Description of scenarios
A questionnaire devised by East Malling Research (EMR) obtained detailed
management descriptions from 20 individual farm enterprises of the strawberry
growing methods used on that farm (Table 1). The interviewees were either existing
EMR contacts or introduced via the suppliers K. G. Fruits Ltd and Berriworld Ltd.
They included several of the major English strawberry producers and enterprises were
situated within the three main strawberry growing regions of England. Each
management description included information on crop protection and fertilizer
(product, rate and timing), cultivations (type, timing and depth), water volume, if
covered with a polytunnel, type of growing media and typical yield of class 1 fruit/ha.
A system was not representative of an individual farm enterprise but was defined by
the following variables: use of short-day (Junebearer) or everbearer varieties,
conventional or organic production, covered with polytunnels or grown in the open,
soil-grown (with or without fumigation) or container-grown (with peat or coir
substrate) and summer or spring planted. Most systems cropped for 1 or 2 years,
systems 1, 2 and 4 cropped for up to 3 years. Individual farm enterprises often used
more than one system of production to enable sequential planting of crops.
Three geographic locations were chosen from key strawberry growing areas, the
spatial boundaries of which were defined using the Nomenclature of Units for
Territorial Statistics (NUTS) level 1 (Government Office Regions) (DEFRA 2009a).

5
It included the South-East (1006 ha) represented by Kent (0.59 of the production
within the South East region), the East of England (602 ha) represented by Norfolk
(0.55 of the East of England production) and the West Midlands (512 ha) represented
by Herefordshire (0.62 of the West Midlands production). Production occurred on a
range of soil types (sand, sandy clay loam (to represent loam soils) and clay) and
within areas that receive different quantities of rainfall annually (low, <600 mm per
annum; moderate, <600 – 700 mm; and high, >700 mm).
Global warming potential100 and primary energy
System boundaries accounted for upstream indirect (Scope 3) emissions of all
products used on the farm. The analysis was conducted up to and including controlled
atmosphere (CA) storage post-harvest. In 2008 the British Standards Institute (BSI)
introduced the Publicly Available Specification (PAS 2050) (BSI 2008) as a
standardized method for calculating the carbon footprint of a commodity. The present
study was undertaken before its publication and instead follows ISO 14044:2006 LCA
protocols (ISO 2006). Emissions from fuel consumption have been derived from the
Carbon Trust (2004) and Choudrie et al. (2008) and include the following:
1. Manufacture of crop protection chemicals, fertilizers, polyethylene and
galvanized steel for tunnels and mulch (including packaging and transport to
the farm). Materials such as low density polyethylene (LDPE) tunnel covers
whose lifetime is longer than one season were calculated on a per year basis.
2. Execution of field operations to account for type and working width of
machine, speed, operating depth and soil type.
3. Manufacture of machinery and its maintenance based on estimates of
operating lifetimes and depreciation.

6
Where only PE was available (for example pesticide manufacture), GHG emissions
have been calculated per MJ from the proportion of the given type of fuel used
multiplied by the CO2 equiv/MJ of that fuel. This calculation was done for each
component fuel and then summed.
Crop protection
The product, rate and timing of application for each system were provided by EMR,
S. Raffle (formerly of ADAS) and the grower interviews (Tables 2 & 3). Since
completion of the present study, review of EC Directive 91/414 has excluded paraquat
(a component of the herbicide PDQ) from Annex 1 and it is now no longer approved
for use in the UK. Chloropicrin has been voluntarily withdrawn (withdrawal date
December 2010) although it may be used until December 2011. The PE to
manufacture each pesticide has been calculated where possible by active ingredient
(Pimentel 1980; Green 1987) or an active ingredient (ai) from the same pesticide class
(Tzilivakis et al. 2005a, b). Where PE data representative of a particular class was
not available, the mean of herbicides, fungicides or insecticides was used. Primary
energy consumption during pesticide manufacture was between 67 MJ/kg ai
(halogenated hydrocarbons) and 460 MJ/kg ai (paraquat) (Pimentel 1980; Green
1987) excluding packaging, storage and transport equivalent to an additional 23
MJ/kg ai (Hülsbergen & Kalk 2001). The GHG emissions were calculated per MJ in
the following proportions: 0.40 electricity, 0.22 natural gas, 0.05 fuel oil and 0.33
naptha (Green 1987). Application by spraying used 1.7 litres/ha of diesel with a
further 29 MJ/ha to account for machinery depreciation (Hülsbergen & Kalk 2001).
Diesel released 39.6 MJ/l including extraction and transport (Hülsbergen & Kalk
2001). Where products were tank mixed they have been calculated as one spray

7
operation. Chloropicrin, applied at a rate of 200–400 litres/ha (The Assured Produce
Scheme 2009), was used as a fumigant and a mean application rate of 300 litres/ha
has been assumed.
Cultivations
Soil-grown systems were sub-soiled (350 mm), ploughed (200 mm) and lightly
cultivated (50 mm) before bed formation. Crops grown in containers on tables had no
soil tillage operations. Where containers were placed on beds the beds were ploughed
and lightly cultivated only. The PE consumed as a result of ploughing and sub-soiling
operations on various soil types were derived from regression equations described in
Kalk & Hülsbergen (1999), other operations from Hunt (1995) and Donaldson et al.
(1994) (Table 4). Bed formation and laying mulch cultivated 0.625 ha per ha of crop
(1.0 m and 0.6 m per bed and alley, respectively). Indirect PE of 143 MJ/ha to
include manufacture and maintenance of machinery (Hülsbergen & Kalk 2001) was
used.
Nutrition
Crop nutrition is summarized in Table 5. A base dressing of phosphorous (P) and
potassium (K) was applied to soil-grown crops in response to soil testing (MAFF
2000). Additional nutrients including nitrogen (N) were applied through the irrigation
system during the summer in response to leaf analyses. The chemical composition,
GHG emissions and PE during manufacture of each fertilizer product are given in
Table 6. The most modern ammonium nitrate fertilizer manufacturing plants have an
accumulated production cost of 30.5 MJ kg/N (Jenssen & Kongshaug 2003; Brentrup
& Pallière 2008). The present day ‘average Europe’ value (38.7 MJ/kg N) used in the

8
current study incorporates production from older plants. Diesel consumption (l/ha)
during application has been derived from regression equations (Kalk & Hülsbergen
1999) plus 28 MJ/ha to account for machinery depreciation (Hülsbergen & Kalk
2001). Farmyard manure (FYM) was assumed to be a by-product whose production
incurred no energy cost to the strawberry crop (it was attributed to the livestock
system from which it was generated). Its application used 20.8 litres/ha directly, 813
MJ/ha indirectly (Hülsbergen & Kalk 2001), 0.5 litres/t diesel to load (Dalgaard et al.
2001) and a mean 2.2 MJ/t/km to transport (Fealy & Schrőder 2008) over an
estimated 10 km.
Crop culture
A 0.05 mm thick polyethylene mulch 1.4 m wide was used to cover the beds of the
soil-grown crops before planting in both fumigated and non-fumigated crops. The low
density polyethylene (LDPE) used for tunnel covers, mulch and container bags
required 78 MJ/kg and emitted 0.0019 t CO2 equiv/kg (mean for European
polyethylene production) during its manufacture (Bousted 2003). The PE includes the
feedstock; however the feedstock carbon (C) is not emitted until disposed of
permanently. This will either be immediately as CO2 if burnt or gradually as CO2 and
CH4 during biodegradation within a landfill (Eggels 2001). Since the Waste
Management (England and Wales) Regulations 2006: Statutory Instrument (SI)
2006/937 prohibits on-farm burial or burning, disposal of the LDPE was assumed to
be via landfill. An estimated 0.05 of polyethylene decomposes after 100 years,
releasing 101 kg CO2/t and 14 kg CH4/t plus 2.7 kg CO2/t from fuel consumed during
processing (Eggels 2001). Fuel consumption during transport was estimated as an
additional 0.086 kg CO2 equiv/t/km (DEFRA 2009b) for two journeys of 133 km, the

9
average haulage distance by road for ‘miscellaneous manufactured goods’ in the UK
(National Statistics 2009) by a 38 t gross weight truck. The mulch lasted for the
lifetime of the crop (1–3 years).
Polytunnel dimensions were supplied by Haygrove Ltd. The hoops and legs
consisted of galvanized steel tube manufactured from a combination of primary and
secondary steel (UK mix, 24.4 MJ/kg) plus 7.5 MJ/kg for galvanizing (Hammond &
Jones 2008). The LDPE cover was attached by nylon rope (120 MJ/kg; Bousted
2000) with a 10-year lifespan.
The container systems used up to 6200 growbags/ha (grower interviews) with an
average lifespan of 2 years. The GWP100 and PE associated with their manufacture
were calculated on an annual as opposed to a per crop basis. Tables were constructed
from scrap or were ‘second hand’ and not reprocessed specifically for the purpose; 0.5
of the original 24.4 MJ/kg has been estimated for their manufacture. A high density
polyethylene (HDPE) trough (926 kg/m3, 77 MJ/kg; Bousted 2003) was situated
below the bags to act as support and trap drainage water.
Irrigation of soil-grown crops used a double line of T-tape (lifespan 3 years),
while table-grown crops used a permanent pipe (lifespan 10 years). Irrigation water
was applied for 154 days (grower interviews) and 0.5 h/day (EMR, personal
communication) (Table 1). It is acknowledged that some growers may irrigate for
longer periods each day but this data was not available from the interviews. An
estimated 52 MJ/mm/ha (Dalgaard et al. 2001) was consumed as diesel.
Post-harvest operations
Punnets were manufactured from HDPE. Strawberries were chilled then stored in a
CA for 12 h before despatch to the retail outlet. Energy consumption was based on
10
descriptions given in Mila i Canals et al. (2007). Transportation from packhouse to
retail outlet was calculated for 114 km (average haulage distance by road for
‘agricultural produce’ in the UK (National Statistics 2009)) by a 38 t gross weight
truck.
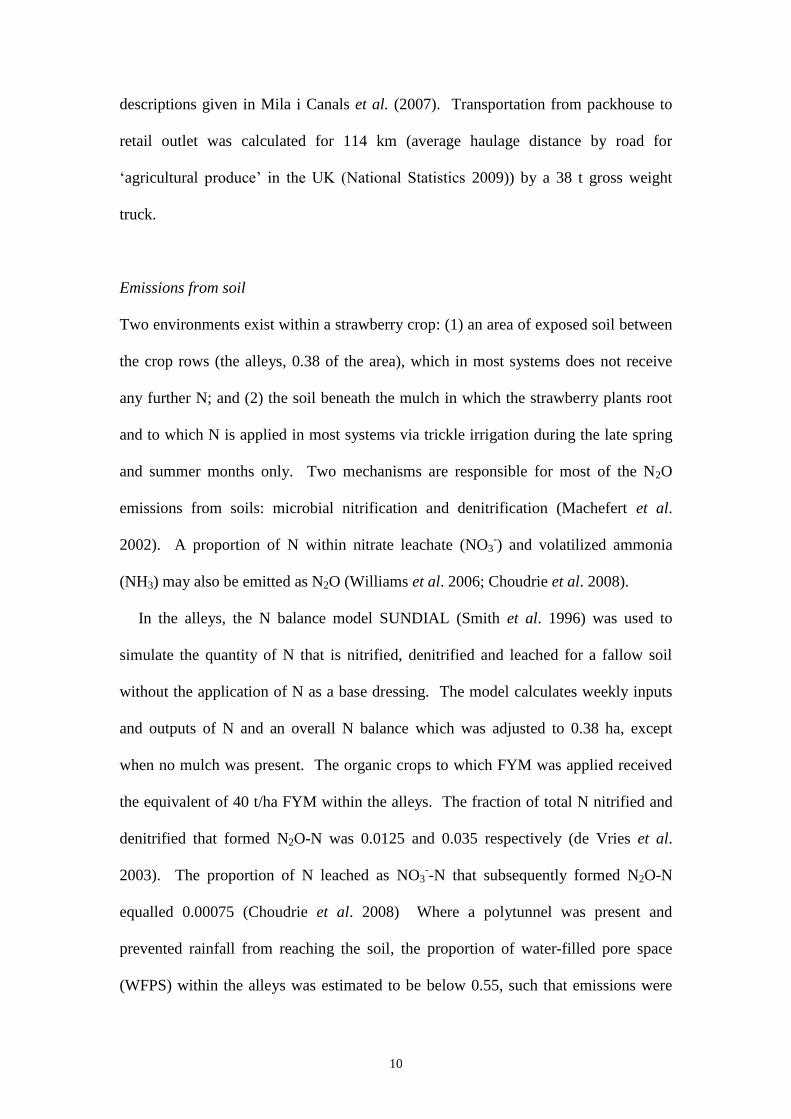
Emissions from soil
Two environments exist within a strawberry crop: (1) an area of exposed soil between
the crop rows (the alleys, 0.38 of the area), which in most systems does not receive
any further N; and (2) the soil beneath the mulch in which the strawberry plants root
and to which N is applied in most systems via trickle irrigation during the late spring
and summer months only. Two mechanisms are responsible for most of the N2O
emissions from soils: microbial nitrification and denitrification (Machefert et al.
2002). A proportion of N within nitrate leachate (NO3-) and volatilized ammonia
(NH3) may also be emitted as N2O (Williams et al. 2006; Choudrie et al. 2008).
In the alleys, the N balance model SUNDIAL (Smith et al. 1996) was used to
simulate the quantity of N that is nitrified, denitrified and leached for a fallow soil
without the application of N as a base dressing. The model calculates weekly inputs
and outputs of N and an overall N balance which was adjusted to 0.38 ha, except
when no mulch was present. The organic crops to which FYM was applied received
the equivalent of 40 t/ha FYM within the alleys. The fraction of total N nitrified and
denitrified that formed N2O-N was 0.0125 and 0.035 respectively (de Vries et al.
2003). The proportion of N leached as NO3--N that subsequently formed N2O-N
equalled 0.00075 (Choudrie et al. 2008) Where a polytunnel was present and
prevented rainfall from reaching the soil, the proportion of water-filled pore space
(WFPS) within the alleys was estimated to be below 0.55, such that emissions were

11
predominantly from nitrification (Machefert et al. 2002). The NH3 volatilized due to
application of FYM, assumed to be incorporated within 6–12 h, was quantified with
MANNER (Chambers et al. 1999). A mean 0.01 formed N2O-N (Choudrie et al.
2008). The widths of bags used in the container-grown systems were smaller than the
mulch and the area occupied by the alleys adjusted accordingly.
The second environment within the crop is beneath LDPE mulch (0.62 of the area).
Rainwater does not tend to penetrate the mulch (EMR personal communication) so its
movement through the soil profile was assumed to be negligible. The WFPS is likely
to be classed as low to intermediate (a proportion of < 0.55 WFPS) and so favour
nitrification (Machefert et al. 2002). During the late spring and summer (for 154
days) the soil beneath the mulch within the root zone is irrigated to field capacity (D.
Simpson, personal communication), to a proportion of c. 0.60 WFPS for most soils
(Davidson & Schimel 1996). Water sensors may be used to control irrigation such
that field capacity within these areas is not exceeded. At a WFPS of 0.60 there is
potential for both nitrification and denitrification to occur (Machefert et al. 2002) but
this is at the lower range for denitrification and considered by Skopp et al. (1990) to
be optimal conditions for aerobic processes (nitrification). Emission of N2O beneath
the mulch was estimated using the modelled nitrification values for within the alleys
and adjusted to 0.62 ha.
Peat extraction in Great Britain and Northern Ireland for horticultural use is
estimated to cause a mean loss of 49.9 kg C/m3 extracted (Choudrie et al. 2008). This
represents the sum of ‘on-site’ emissions (from the peatland in response to extraction)
and ‘off-site’ emissions (from the extracted peat used in growbags). In peat container
systems, each 1 m long bag contained 5 litres (0.005 m3) of dry peat, the equivalent of
31 m3/ha
crop.

12
RESULTS
Crop protection
Fumigated second year crops without covers had the largest PE and GWP100
associated with crop protection. Chloropicrin (1.66 kg/l bulk density (Green et al.
2009)) persists for the lifetime of the crop. The total PE for an assumed 300 litres/ha
application decreased from 45.9 to the equivalent of 22.9 and 15.2 GJ/ha per crop
respectively for 1, 2 and 3 cropping years. Over-wintering of strawberry crops
(maincrops) necessitates treatment of crown rot during the spring and additional
herbicide treatments in the autumn and winter. Covering a crop with a polytunnel
reduces incidence of Botrytis and number of fungicide sprays.
Nutrition
The crop N requirement was determined by type of growing media (soil grown and
type, peat or coir) (Table 5). Container-grown crops with coir (system 9) received the
largest dose of N, followed by systems that used peat (system 7 and 8). Field-grown
strawberry crops have a relatively low N demand (MAFF 2000). Nitrate fertilizer
releases N2O during manufacture (Jenssen & Kongshaug 2003) and GHG emissions
are proportionally greater than the PE (Table 6). In total, 0.57 t CO2 equiv/ha or 4.3
GJ/ha were attributed to nutrition (inclusive of P and K) of each soil grown crop, 1.14
t CO2 equiv/ha or 8.5 GJ/ha over 2 cropping years. Most growers applied mineral N
through the irrigation system with no further PE necessary for product application.
Loading, transport and application of 40 t/ha FYM emitted 0.38 t CO2 equiv/ha and
needed 5.7 GJ/ha but was distributed over the crop lifetime (2 cropping years).
13
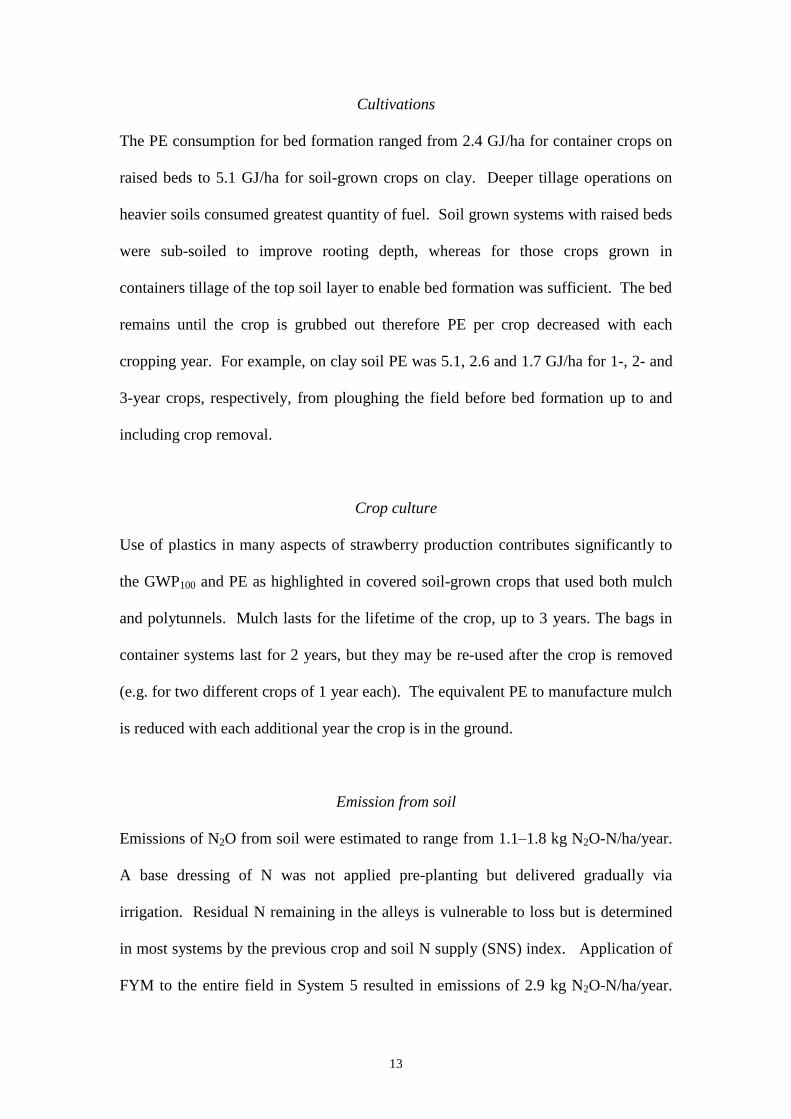
Cultivations
The PE consumption for bed formation ranged from 2.4 GJ/ha for container crops on
raised beds to 5.1 GJ/ha for soil-grown crops on clay. Deeper tillage operations on
heavier soils consumed greatest quantity of fuel. Soil grown systems with raised beds
were sub-soiled to improve rooting depth, whereas for those crops grown in
containers tillage of the top soil layer to enable bed formation was sufficient. The bed
remains until the crop is grubbed out therefore PE per crop decreased with each
cropping year. For example, on clay soil PE was 5.1, 2.6 and 1.7 GJ/ha for 1-, 2- and
3-year crops, respectively, from ploughing the field before bed formation up to and
including crop removal.
Crop culture
Use of plastics in many aspects of strawberry production contributes significantly to
the GWP100 and PE as highlighted in covered soil-grown crops that used both mulch
and polytunnels. Mulch lasts for the lifetime of the crop, up to 3 years. The bags in
container systems last for 2 years, but they may be re-used after the crop is removed
(e.g. for two different crops of 1 year each). The equivalent PE to manufacture mulch
is reduced with each additional year the crop is in the ground.
Emission from soil
Emissions of N2O from soil were estimated to range from 1.1–1.8 kg N2O-N/ha/year.
A base dressing of N was not applied pre-planting but delivered gradually via
irrigation. Residual N remaining in the alleys is vulnerable to loss but is determined
in most systems by the previous crop and soil N supply (SNS) index. Application of
FYM to the entire field in System 5 resulted in emissions of 2.9 kg N2O-N/ha/year.

14
System 4a (no crop 1st year) was grown on a sandy soil, given a base dressing of
mineral N fertilizer and did not use LDPE mulch. The first crop was grown over 2
years for which an estimated 3.0 kg N2O-N/ha resulted in total.
Global warming potential100 and primary energy per ha and per tonne of class 1 fruit
Short-day strawberry varieties had a GWP100 per ha pre-harvest of between 2.2 and
10.3 t CO2 equiv/ha per crop for 1 cropping year and a mean of 1.5 and 10.3 t CO2
equiv/ha per crop for 2 years. Systems were distinguished by use of peat substrate,
soil fumigants, and materials such as polyethylene and galvanized steel for mulch for
the tunnels. Other potentially significant emission sources included manufacture of
nitrate fertilizer, applied in greater quantities to coir systems, and N2O from soil in
fallow alleys to which FYM had been applied. The GWP100 pre-picking was smallest
in systems not covered and not fumigated. Emissions were greatest from covered peat
container grown systems (10.3 t CO2 equiv/ha) to which the oxidation of C in peat
(Choudrie et al. 2008) contributed significantly. Emissions were calculated on a per
year basis for an average container life-span of 2 years and as such a reduction in the
CO2 equiv/crop did not occur during the second year of cropping in contrast to soil
grown systems. Per tonne of class 1 fruit, the GWP100 was smallest in System 4a
(0.13 t CO2 equiv/t) as a result of low emissions/ha (1.5 – 2.2 t CO2 equiv) and a yield
of 23.8 and 11.0 t/ha during the first and second year, respectively. The GWP100 was
also small in the summer-planted system 2 (fumigated and grown in the open) (0.22 t
CO2 equiv/t) high yielding during both years, 27.0 and 23.0 t/ha respectively (Figs 1a,
b). Yields of 6.4, 13.5 and 13.5 t/ha during years 1–3 in System 4 meant relatively
low mean emissions of 0.30 t CO2 equiv/t after 3 years of cropping. Over 2 years the
GWP100 of the covered organic System 5 with FYM (0.37 t CO2 equiv/t) was similar

15
to the covered and non-fumigated System 3 (0.36 t CO2 equiv/t). The lower yielding
non-covered peat container System 8 (7.1 and 11.2 t/ha) had the largest emissions of
all the systems considered (1.14 t CO2 equiv/t).
Per crop the mean PE per ha (excluding post harvest operations) ranged from 15.8–
194.0 GJ/ha to one crop and 11.0–156.0 GJ/ha for two crops. The main constituents
of PE overall was the manufacture of polyethylene for polytunnels, mulch, container
bags and irrigation pipe, the manufacture of galvanized steel for tunnel supports, soil
fumigants and fuel consumed by delivery of irrigation water. Systems that did not use
covers or fumigants, such as System 4a (11.0–15.8 GJ/ha) and System 4 (42.9–65.2
GJ/ha), had the smallest input of PE/ha, while the summer-planted, covered and
fumigated System 1 on clay soil had the largest, due to bed preparation on heavier soil
and crop protection applied to an over-wintered as opposed to spring planted crop, in
addition to covers and fumigants. Coir systems needed 136.8–158.6 GJ/ha, a
significant factor being their demand for additional nutrients. Primary energy use per
tonne of class 1 fruit ranged from 0.6–14.3 GJ/t and was greatly reduced in all soil
grown systems when two or three crops were produced (Fig. 2). System 4a was the
most energy efficient, followed by Systems 4 and 2 (summer planted) after 2 years.
DISCUSSION
Strawberries may be grown under a variety of different production methods within the
UK. They include soil-grown (with or without fumigation), soil-grown under organic
production and container-grown (with a peat or coir substrate). With the exception of
the organic production systems, crops may be grown with or without cover by a
polytunnel. The present report focuses on two environmental burdens, GHG
emissions and PE consumption. The former ranged, pre-harvest, from 1.5–10.3 t CO2

16
equiv/ha/crop and the latter 11.0–194.0 GJ/ha/crop. For most systems this was
significantly greater than crops such as sugar beet (15.7–25.9 GJ/ha, Tzilivakis et al.
2005a), winter wheat (10.1–23.3 GJ/ha, Hülsbergen & Kalk 2001) and winter oilseed
rape (15.8 GJ/ha, Ingram et al. 2003), to which mineral N fertilizer manufacture has
tended to make the greatest contribution. Soil-grown strawberry crops have a
relatively low N requirement in comparison (MAFF 2000). Significant GHG
emissions and / or use of PE resulted from the post-extraction use of peat substrate,
the manufacture of soil fumigants, LDPE in polytunnel covers and mulch, galvanized
steel for tunnel supports and fuel consumed during the delivery of irrigation water.
The low input System 4a does not use any of these strategies and as such has GWP100
and PE similar to that of arable crops, significantly less than all other systems
considered.
System 4a was the only system that did not use a mulch to prevent weed growth
but applied additional herbicides during the first year instead. The non-cropping of
fruit during year 1 allowed the application of products with longer harvest intervals.
The GWP100 and PE associated with this herbicide programme were significantly less
than for the manufacture of LDPE mulch. It was the only example on sandy soil and
while effective on this soil type, crops grown on a clay soil may encounter greater
weed populations and require additional herbicide treatments, illustrated in other row
crops such as sugar beet (Tzilivakis et al. 2005a, b). The revision of EU Directive
91/414 involves withdrawal of selected herbicide active ingredients, which may alter
the effectiveness of agrochemical weed management. An area of land that allows
sufficient time between crops to prevent Verticillium is also necessary; however, in
contrast to the fumigated systems, this system will not be vulnerable to the voluntary
withdrawal of chloropicrin as part of Directive 91/414. All other systems used LDPE

17
mulch, the removal of which causes tearing and soil contamination that prevents re-
use. Mulch lasts for the lifetime of the beds, 1–3 years. As such, the embodied
environmental burdens are reduced significantly per ha with each additional cropping
year. System 4 with mulch was also one of the most efficient methods of production,
particularly when the yields of three crops were taken into account.
Polytunnels are used to protect crops from frost (in early crops produced out of
season) or rainfall during fruit set when damage to the flower causes misshapen fruit
(class 2) that most growers stated they did not sell. Tunnels allow production of fruit
earlier in the season and the sequential planting of crops. Further, they reduce the risk
of the pathogen Botrytis and the quantity of fungicide applied (S. Raffle, personal
communication). The use of tunnels may be critical in organic systems where
chemical treatment of Botrytis is not possible. Overall, the covered systems required
fewer chemical crop protection interventions since biological control with predatory
mites (Phytoselius) was also more effective. The materials needed to cover crops
make a notable contribution toward the GHG and PE balance of strawberry
production. The GWP100 and PE/t of class 1 fruit did, however, tend to be lower in
covered crops during the first year of production and favourable in container systems
that may crop for 1 year only (for example System 7 compared to 8). Systems grown
in the open had yield improvements after year 1 such that burdens/t of class 1 fruit
were smaller, particularly in year 3. Crops produced in season may be covered
(although none of the growers interviewed stated that they did so during the years
analysed) in order to protect crops from heavy rainfall, again to reduce the proportion
of class 2 fruit. The predicted increase in risk of extreme climatic events, particularly
summer storms (Jenkins et al. 2007; Murphy et al. 2009) may require more frequent
covering of crops for this purpose. Covered crops used greater volumes of irrigation

18
water although the impact on fuel use was reduced by many growers extracting ‘grey
water’ from boreholes and reservoirs instead of the mains. Mains water is estimated
to use 2.95 MJ/m3 (Wessex Water Ltd 2004), equivalent to 4.4 and 6.8 GJ/ha/year, in
non-covered and covered soil-grown crops, respectively. Soil water sensors offer
potential to maximize water use efficiency, decrease fuel used in its application and
reduce risk of N leaching and indirect emissions of N2O beneath the mulch. More
widespread adoption is recommended. Use of gutters to collect rainfall run-off from
tunnels for subsequent use in irrigation, although currently not widely adopted, would
also be beneficial not only to preserve grey water but prevent other environmental
impacts such as soil erosion.
Crop protection makes relatively minor contributions to the overall GHG and PE
balance in many crops due to small quantities of ai (Hülsbergen & Kalk 2001;
Tzilivakis et al. 2005a, b). Soil fumigants applied at 200–400 litres/ha with 0.94–1 ai
(Lainsbury 2009) are an exception. Fumigation is necessary where soil-borne
pathogens such as Verticillium wilt, caused primarily by V. dahliae in the UK
(Talboys et al. 1975), is established. Fumigation with chloropicrin requires 29.8–59.7
GJ/ha to manufacture including packaging, storage and transport (Pimentel 1980;
Green 1987). The fuel consumed by its application using a shank is greater than a
typical spray due to the number of field passes needed and the slow speed at which
the operation occurs (Hunt 1995; Hülsbergen & Kalk 2001). Verticillium is able to
survive for periods of up to 20 years as either dormant microsclerotia within the soil
or through its ability to infect a broad host range, involving weed species, between
rotations (Woolliams 1966; Green 1980). Its severity may depend on geographical
region and soil type (Talboys et al. 1975). Long rotations are usually required to
eliminate the need for fumigation (e.g. System 4), but where limited areas of land are

19
available there may be no alternative. Many growers already test the soil for
Verticillium and target fumigation as necessary, reducing the quantity applied without
compromising productivity; this is an important strategy. The voluntary withdrawal
of chloropicrin due to the review of EU Directive 94/414 means that infected areas
require alternative methods of soil sterilization. Steam sterilization consumes large
quantities of diesel (C. Mullins, personal communication) while the effectiveness of
biofumigation is currently unproven.
Predicted emissions of N2O from soil (1.1–3.0 kg N2O-N/ha) lay within the range
attributed to cultivated land by previous studies, from 0.7–2.4 kg N2O-N/ha/year
(Dobbie & Smith 2003), 1.4–3.7 kg N2O-N/ha/year (Kaiser et al. 1998) and 0.99–3.75
kg N2O-N/ha/year applicable to 0.69 of UK counties (Brown et al. 2002). The
greatest release (3.0 kg N2O-N/ha) came from the fallow alleys of systems to which
40 t/ha FYM was applied, since its precise targeting is difficult. Emissions of N2O
from soil in response to FYM application have been assigned to the strawberry crop
since the benefit of the N it contains is realized here. Nitrogen from FYM within the
alleys (approximately 0.38 of the total applied) is not utilized by the crop and remains
within the soil. This results in an increase in nitrification and denitrification (Smith et
al. 1996; Machefert et al. 2002), risk of N leaching and emission of N2O from soil.
The notable yield improvements from FYM increased efficiency through provision of
additional K (MAFF 2000) as well as N. The recommendation to apply 25 t/ha FYM
made by Lampkin (2004) would reduce the fuel consumed by its application and
haulage and in all probability the emission of N2O from soil within the alleys. The
impact on crop yield is unknown, but since the limiting nutrient is likely to be K as
opposed to N, the K could be supplemented with, for example, sylvinite (0.24 K2O).
Application of FYM tends to be during the summer pre-planting. This risks greater
20
volatilization of ammonia, a risk that may be mitigated if it is incorporated rapidly
into the soil immediately after application (Chambers et al. 1999; Moorby et al.
2007).
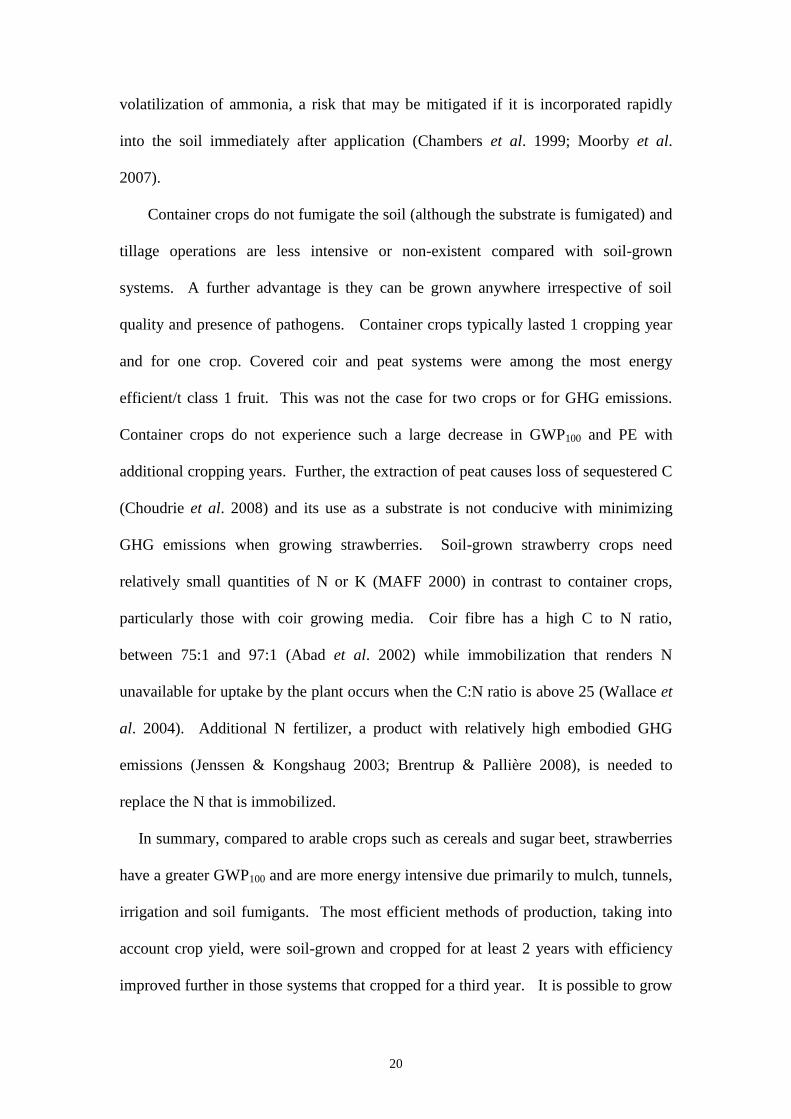
Container crops do not fumigate the soil (although the substrate is fumigated) and
tillage operations are less intensive or non-existent compared with soil-grown
systems. A further advantage is they can be grown anywhere irrespective of soil
quality and presence of pathogens. Container crops typically lasted 1 cropping year
and for one crop. Covered coir and peat systems were among the most energy
efficient/t class 1 fruit. This was not the case for two crops or for GHG emissions.
Container crops do not experience such a large decrease in GWP100 and PE with
additional cropping years. Further, the extraction of peat causes loss of sequestered C
(Choudrie et al. 2008) and its use as a substrate is not conducive with minimizing
GHG emissions when growing strawberries. Soil-grown strawberry crops need
relatively small quantities of N or K (MAFF 2000) in contrast to container crops,
particularly those with coir growing media. Coir fibre has a high C to N ratio,
between 75:1 and 97:1 (Abad et al. 2002) while immobilization that renders N
unavailable for uptake by the plant occurs when the C:N ratio is above 25 (Wallace et
al. 2004). Additional N fertilizer, a product with relatively high embodied GHG
emissions (Jenssen & Kongshaug 2003; Brentrup & Pallière 2008), is needed to
replace the N that is immobilized.
In summary, compared to arable crops such as cereals and sugar beet, strawberries
have a greater GWP100 and are more energy intensive due primarily to mulch, tunnels,
irrigation and soil fumigants. The most efficient methods of production, taking into
account crop yield, were soil-grown and cropped for at least 2 years with efficiency
improved further in those systems that cropped for a third year. It is possible to grow

21
strawberries in a low input system if cropped in season (without covers), if there is
sufficient land to permit a long rotation and if suitable soil conditions are present.
Covering crops allows their early and sequential production but in many cases at a
cost of increased GWP100 and PE. Class 2 fruit is typically not sold by growers
although to do so would reduce the environmental burdens per unit of output of UK
grown short-day strawberry crops.
This work was originally funded by the Department for the Environment, Food and
Rural Affairs (DEFRA) as part of project HH3606NSF (Sustainability of the UK
Strawberry Crop); crop management scenarios have since been updated for the
production of the present work. The authors thank growers and industry
representatives for their time in kind, Scott Raffle for advice on pest and disease
management and Dr David Simpson for advice on crop irrigation strategies.
REFERENCES
ABAD, M., NOGUERA, P., PUCHADES, R., MAQUIEIRA, A. & NOGUERA, V. (2002).
Physico-chemical and chemical properties of some coconut coir dusts for use as a
peat substitute for containerised ornamental plants. Bioresource Technology 82,
241–245.
THE ASSURED PRODUCE SCHEME. (2009). Assured Produce Crop Specific Protocol:
Strawberries (Crop ID: 31). London: Assured Food Standards.
BLANKE, M. M. & BURDICK, B. (2005). Food (miles) for thought: energy balance for
locally-grown versus imported apple fruit. Environmental Science & Pollution
Research 12, 125–127.

22
BOUSTED, I. (2000). Eco-profiles of the European Plastics Industry. Nylon 6.
Brussels, Belgium: European Centre for Plastics in the Environment.
BOUSTED, I. (2003). Eco-profiles of the European Plastics Industry. Polyolefins.
Brussels, Belgium: The Association of Plastics Manufacturers in Europe (APME).
BRENTRUP, F. & PALLIÈRE, C. (2008). GHG Emissions and Energy Efficiency in
European Nitrogen Fertiliser Production and Use. The International Fertiliser
Society Proceedings 639. York, UK: International Fertiliser Society.
BROWN, L., SYED, B., JARVIS, S. C., SNEATH, R. W., PHILLIPS, V. R., GOULDING, K. W.
T. & LIE, C. (2002). Development and application of a mechanistic model to
estimate emission of nitrous oxide from UK agriculture. Atmospheric Environment
36, 917–928.
BSI (2008). PAS 2050:2008. Specification for the assessment of the life cycle
greenhouse gas emissions of goods and services. Publicly Available Specification.
British Standards Institute, Carbon Trust, Department for Environment, Food and
Rural Affairs (Defra). ISBN 978 0 580 50978 0
THE CARBON TRUST. (2004). Energy and Carbon Conversions. Witney, UK: Carbon
Trust.
CHAMBERS, B. J., LORD, E. I., NICHOLSON, F. A. & SMITH, K. A. (1999). Predicting
nitrogen availability and losses following application of organic manure to arable
land: MANNER. Soil Use and Management 15, 137–143.
CHOUDRIE, S. L., JACKSON, J., WATTERSON, J. D., MURRELLS, T., PASSANT, N.,
THOMSON, A., CARDENAS, L., LEECH, A., MOBBS, D. C. & THISTLETHWAITE, G.
(2008). UK Greenhouse Gas Inventory, 1990 to 2006: Annual Report for
submission under the Framework Convention on Climate Change.
AEAT/ENV/R/2582. Didcot, UK: AEA Group.

23
CLIMATE CHANGE ACT (2008). Chapter 27. Crown Copyright 2008. The Stationery
Office Limited, UK.
DALGAARD, T., HALBERG, N. & PORTER, J. R. (2001). A model for fossil energy use
in Danish agriculture used to compare organic and conventional farming.
Agriculture, Ecosystems and Environment 87, 51–65.
DAVIDSON, E. A. & SCHIMEL, J. P. (1996). Microbial processes of production and
consumption of nitric oxide, nitrous oxide and methane. In Biogenic Trace Gases:
Measuring Emissions from Soil and Water (Eds P. A. Matson & R. C. Harriss), pp.
327–357. Oxford, UK: Blackwell Science.
DEPARTMENT FOR ENVIRONMENT, FOOD AND RURAL AFFAIRS (DEFRA). (2005).
Sustainable Development Action Plan – Just Jump Straight In. London: Crown
Copyright.
DEPARTMENT FOR ENVIRONMENT, FOOD AND RURAL AFFAIRS (DEFRA). (2009a).
Commodities. In Agriculture in the United Kingdom 2009, pp. 27–51.
http://www.defra.gov.uk/evidence/statistics/foodfarm/general/auk/latest/index.htm
(verified 19 May 2010).
DEPARTMENT FOR ENVIRONMENT, FOOD AND RURAL AFFAIRS (DEFRA) AND
DEPARTMENT OF ENERGY AND CLIMATE CHANGE (DECC). (2009b). The 2009
Guidelines to DEFRA / DECC’s GHG Conversion Factors for Company Reporting
(Annexes). London: DEFRA Publications.
DE VRIES, W., KROS, J., OENEMA, O. & DE KLEIN, J. (2003). Uncertainties in the fate
of nitrogen II: A quantitative assessment of the uncertainties in major nitrogen
fluxes in the Netherlands. Nutrient Cycling in Agroecosystems 66, 71–102.

24
DOBBIE, K.E. & SMITH, K.A. (2003). Nitrous oxide emission factors for agricultural
soils in Great Britain: the impact of soil water-filled pore space and other
controlling variables. Global Change Biology 9, 204–218.
DONALDSON, J.V.G., HUTCHEON, J.A., JORDAN, V.W.L. & OSBORNE, N.J. (1994).
Evaluation of energy usage for machinery operations in the development of more
environmentally benign farming systems. Aspects of Applied Biology 40, 87–91.
EDWARDS-JONES, G., MILÀ I CANALS, L., HOUNSOME, N., TRUNINGER, M., KOERBER,
G., HOUNSOME, B., CROSS, P., YORK, E. H., HOSPIDO, A., PLASSMANN, K., HARRIS,
I. M., EDWARDS, R. T., DAY, G. A. S., TOMOS, A. D., COWELL, S. J. & JONES, D. L.
(2008). Testing the assertion that ‘local food is best’: the challenges of an
evidence-based approach. Trends in Food Science & Technology 19, 265–274.
EDWARDS-JONES, G., PLASSMANN, K. & HARRIS, I. M. (2009). Carbon footprinting of
lamb and beef production systems: insights from an empirical analysis of farms in
Wales UK. The Journal of Agricultural Science, Cambridge 147, 707–719.
EGGELS, P. G., ANSEMS, A. M. M. & VAN DER VEN, B. L. (2001). Eco-efficiency of
Recovery Scenarios of Plastic Packaging. TNO-report ref R 2000/119. Brussels,
Belgium: Association of Plastics Manufacturers in Europe (APME).
FEALY, R. & SCHRŐDER, J. J. (2008). Assessment of Manure Transport Distances and
their Impact on Economic and Energy Costs. The International Fertiliser Society
Proceedings 642. York, UK: The International Fertiliser Society.
FOSTER, C., GREEN, K., BLEDA, M., DEWICK, P., EVANS, B., FLYNN, A. & MYLAN, J.
(2006). Environmental Impacts of Food Production and Consumption. A Report to
the Department for Environment, Food and Rural Affairs by Manchester Business
School. London: DEFRA.

25
GARNETT, T. (2006). Fruit and Vegetables and Greenhouse Gas Emissions:
Exploring the Relationship. Working paper produced as part of the work of the
Food Climate Research Network. FCRN working paper 06-01 Rev. A. Guildford,
UK: Centre for Environmental Strategy, University of Surrey.
GARNETT, T. (2007). Food Refrigeration: What is the Contribution to Greenhouse
Gas Emissions and How Might Emissions be Reduced? A working paper produced
as part of the Food Climate Research Network. Guildford, UK: Centre for
Environmental Strategy, University of Surrey.
GREEN, A., TZILIVAKIS, J. & LEWIS, K.A. (2009). Chloropicrin. In Pesticide
Properties Database (PPDB). Available online at:
http://sitem.herts.ac.uk/aeru/iupac/Reports/148.htm (verified 20 May 2010).
GREEN, M. (1987). Energy in pesticide manufacture, distribution and use. In Energy
in Plant Nutrition and Pest Control (Ed. Z. R. Helsel), pp. 165–177. Amsterdam:
Elsevier.
GREEN, R. J. (1980). Soil factors affecting survival of microsclerotia of Verticillium
dahliae. Phytopathology 70, 353–355.
HAMMOND, G. P. & JONES, C. I. (2008). Embodied energy and carbon in construction
materials. Proceedings of the ICE – Energy 161, 87–98.
HANCOCK, J. F. (1999). Strawberries. Wallingford, UK: CABI Publishing.
HÜLSBERGEN, K.J. & KALK, W.D. (2001). Energy Balances in Different Agricultural
Systems – Can they be Improved? The International Fertiliser Society Proceedings
476. York, UK: The International Fertiliser Society.
HUNT, D. (1995). Farm Power and Machinery Management. Ninth Edition. Ames,
Iowa, USA: Iowa State University Press.

26
INGRAM, J., TZILIVAKIS, J., WARNER, D. J., KEIGHTLY, S., KERR, S. & LEWIS, K. A.
(2003). Investigation of Varietal Characteristics Required for Sustainable
Agriculture. Final Report for Department for Environment, Food and Rural
Affairs (DEFRA) Project VSO128. London: DEFRA/NIAB.
INTERNATIONAL ORGANIZATION FOR STANDARDIZATION (2006). ISO 14044:2006.
Life Cycle Assessment: Requirements and Guidelines. Brussels, Belgium:
International Organization for Standardization.
INTERGOVERNMENTAL PANEL ON CLIMATE CHANGE (IPCC) (2006). 2006 Guidelines
for National Greenhouse Gas Inventories. Prepared by the National Greenhouse
Gas Inventories Programme, Eggleston H.S., Buendia L., Miwa, K. Ngara, T. and
Tanabe, K. (Eds). Institute for Global Environmental Strategies, Tokyo, Japan.
JENKINS, G., PERRY, M. & PRIOR, J. (2007). The Climate of the United Kingdom and
Recent Trends. Exeter, UK: Met Office Hadley Centre.
JENSSEN, T. K. & KONGSHAUG, G. (2003). Energy Consumption and Greenhouse Gas
Emissions in Fertiliser Production. The International Fertiliser Society
Proceedings 509. York, UK: The International Fertiliser Society.
KAISER, E. A., KOHRS, K., KUÈCKE, M., SCHNUG, E., HEINEMEYER, O. & MUNCH, J. C.
(1998). Nitrous oxide release from arable soil: importance of N-fertilization, crops
and temporal variation. Soil Biology and Biochemistry 30, 1553–1563.
KALK, W. D. & HÜLSBERGEN, K. J. (1999). Dieselkraftstoffeinsatz in der
Pflanzenproduktion. Landtechnik 54, 332–333.
KALTSCHMITT, M. & REINHARDT, A. (1997). Nachwachsende Energieträger.
Grundlagen, Verfahren, ökologische Bilanzierung. Braunschweig, Germany:
Vieweg Verlag.
27
LAINSBURY, M.A. (2009). UK Pesticides Guide 2009. Wallingford, Oxford: CAB
International,.
LAMPKIN, N., MEASURES, M. & PADEL, S. (2004). Organic Farm Management
Handbook, 6th
Edition. Aberystwyth, UK/Newbury, UK: University of Wales/Elm
Farm Research Centre.
LIGUORI, G., GUGLIUZZA, G. & INGLESE, P. (2009). Evaluating carbon fluxes in
orange orchards in relation to planting density. The Journal of Agricultural
Science, Camridge 147, 637–645.
LINDSTRÖM, O. (1980). The technology of peat. Ambio 9, 309–313.
MACHEFERT, S. E., DISE, N. B., GOULDING, K. W. T. & WHITEHEAD, P. G. (2002).
Nitrous oxide emission from a range of land uses across Europe. Hydrology and
Earth System Sciences 6, 325–337.
MARASENI, T. N., MUSHTAQ, S. & MAROULIS, J. (2009). Greenhouse gas emissions
from rice farming inputs: a cross-country assessment. The Journal of Agricultural
Science, Cambridge 147, 117–126.
MINISTRY OF AGRICULTURE, FISHERIES AND FOOD (MAFF). (2000). Fertiliser
Recommendations for Agricultural and Horticultural Crops (RB209). London: The
Stationary Office.
MILÀ I CANALS, L., COWELL, S. J., SIM, S. & BASSON, L. (2007). Comparing domestic
versus imported apples: a focus on energy use. Environmental Science and
Pollution Research 14, 338–344.
MOORBY, J. M., CHADWICK, D. R., SCHOLEFIELD, D., CHAMBERS, B. J. & WILLIAMS, J.
R. (2007). A Review of Research to Identify Best Practice for Reducing
Greenhouse Gases from Agriculture and Land Management. Final Report for
Department for Environment, Food and Rural Affairs (DEFRA) project AC0206

28
undertaken by the Institute for Grassland and Environmental Research.
Aberystwyth/Wolverhapmton: IGER/ADAS.
MURPHY, J. M., SEXTON, D. M. H., JENKINS, G. J., BOOTH, B. B. B., BROWN, C. C.,
CLARK, R. T.,COLLINS, M., HARRIS, G. R., KENDON, E. J., BETTS, R. A., BROWN, S.
J., HUMPHREY, K. A., MCCARTHY, M. P., MCDONALD, R. E., STEPHENS, A.,
WALLACE, C., WARREN, R., WILBY, R. & WOOD, R. A. (2009). UK Climate
Projections Science Report: Climate Change Projections. Exeter, UK: Met Office
Hadley Centre.
NATIONAL STATISTICS AND DEPARTMENT FOR TRANSPORT (2009).Transport Statistics
Bulletin: Road Freight Statistics 2008. Table 1.13c: Average length of haul by
commodity 1998–2008. Document SB(09)21. Crown copyright 2009. UK. .
PIMENTEL, D. (1980). Handbook of Energy Utilization in Agriculture. Boca Raton,
FL, USA: CRC Press Inc.
RICHARDS, I.R. (2001). The Fertiliser Directory. Nottingham, UK: Nottingham
University Press.
SKOPP, J., JAWSON, M. D. & DORAN, D.W. (1990). Steady state aerobic activity as a
function of soil water content. Soil Science Society of America 54, 1619–1625.
SIMPSON, D. W., BELL, J. A., HAMMOND, K. J. & WHITEHOUSE, A. B. (2002). The
latest strawberry cultivars from Horticulture Research International. Acta
Horticulturae 567.
SMITH, J. U., BRADBURY, N. J. & ADDISCOTT, T. M. (1996). SUNDIAL: A PC-based
system for simulating nitrogen dynamics in arable land. Agronomy Journal 88,
38–43.
TALBOYS, P. W., FRICK, E. L. & DAVIES, M. K. (1975). Duration of effects of
benomyl on growth and wilt (Verticillum dahliae) development in the strawberry,

29
cv. Cambridge Vigour, in relation to time of inoculation. Annals of Applied
Biology 81, 305–315.
TZILIVAKIS, J., JAGGARD, K., LEWIS, K. A., MAY, M. & WARNER, D. J. (2005a).
Environmental impact and economic assessment for UK sugar beet production
systems. Agriculture Ecosystems & Environment 107, 341–358.
TZILIVAKIS, J., WARNER, D. J., MAY, M., LEWIS, K. A. & JAGGARD, K. (2005b). An
assessment of the energy inputs and greenhouse gas emissions in sugar beet (Beta
vulgaris) production in the UK. Agricultural Systems 85, 101–119.
WALLACE, P., BROWN, S. & MCEWEN, M.J. (2004). To Support the Development of
Standards for Compost by Investigating the Benefits and Efficacy of Compost Use
in Different Applications. Project Code: STA0015. Banbury, UK: The Waste and
Resources Action Programme.
WESSEX WATER LTD. (2004). Striking the Balance. Bath, UK: Wessex Water.
WILLIAMS, A. G., AUDSLEY, E. & SANDARS, D. L. (2006). Determining the
Environmental Burdens and Resource Use in the Production of Agricultural and
Horticultural Commodities. Final Report on DEFRA Research Project IS0205.
London: DEFRA.
WOOLLIAMS, G. E. (1966). Host range and symptomatology of Verticillium dahliae in
economic, weed and native plants in interior British Columbia. Canadian Journal
of Plant Science 46, 661–66.

30
Table 1. Description of strawberry production systems: SPNP 2nd
: summer planted, non-covered 2nd
year; NP 2nd
: non-covered 2nd
year; NC 1st: no crop 1
st
year; SP: summer planted; RB/T: raised bed / table), cultivar type (JB = Junebearer, EB = Everbearer), soil type (SCL = sandy clay loam, C = clay, S =
sand, PB = peat bag, CB = coir bag), F = fumigation, Cov = covered with a polytunnel, Org = organic. The mean yield of class 1 fruit (t/ha) gives yield
range (number of examples) [mean yield 1 standard error of the mean] of class 1 fruit. A mean of 2300 and 1550 m3/ha/year of water was applied to
covered and non-covered soil grown crops respectively, 1640 and 1480 m3/ha/year to covered and non-covered container grown crops with peat respectively
and 2200 m3/ha/year to covered container crops that used coir
System & soil
type
Type Medium F Cov Org Mean yield class 1 fruit (t/ha)
1st crop 2
nd crop 3
rd crop
1 JB SCL yes yes – 8.0–21 (5)[13 2.2] 20–24 (4)[22 0.8] 16–22 (2)[19 3.2]
1 JB C yes yes – 14–23 (4)[19 2.0] 19–30 (3)[24 3.1] –
1 (SPNP 2nd
) JB SCL yes 1st year
only
– 20.0 (2) 12–13 (2)[13 0.5] –
1 (SPNP 2nd
) JB C yes 1st year
only
– 27.6 – –
1 (NP 2nd
) JB SCL yes 1st year
only
– 8–21 (5)[13 2.2] 17.1 –

31
2 JB SCL yes – – 7–10 (4)[8 0.6] 12–20 (4)[16 1.7] 10–11 (2)[10 0.3]
2 (SP) JB SCL yes – – 27.0 23.0 –
3 JB SCL – yes – 18.0 19.0 –
4 JB SCL – – – 6.4 13.5 13.5
4 (NC 1st) JB S – – – 23.8 11.0 –
5 (SP) JB SCL – yes yes 11.3 11.3 –
5 (SP) 40 t/ha
FYM
JB C – yes yes 17.0 20.0 –
6 (SP) JB SCL – – yes 5.0* 5.0* –
7 (RB/T) JB PB† – yes – 17–21 (4)[19 0.9] 10–8 (2)[19 9.1] –
8 (RB/T) JB PB † – – – 6–8 (2)[7 1.5] 6–16 (2)[11 4.9] –
9 (T) JB CB † – yes – 13–21 (4)[18 1.8] 24.5 –
*Hypothetical yield assumed based on lower yield than System 4
†Bags or tables placed on clay or sandy clay loam soil

32
Table 2. Pest and disease programme (product and rate of application per ha) with assumed application dates
for each strawberry production system 1st year. Second year covered and non-covered Junebearer crops
receive identical programmes to summer planted (SP) Systems 1 and 2 respectively (except Chloropicrin).
Alliette is not applied to second year container crops
System
Product
1 1
SP
1
NP 2nd
2 2
SP
3 4 4a
NC1st
*
5
SP
6
SP
7 8
9
Chloropicrin 200-
400 l
Feb July Feb Feb July – – – – – – – –
Aliette 80 WG 3.75
kg
– 02/03 – – 02/04 – – – – – – – –
Amistar 0.75 l 14/05 14/04 14/05 06/07 16/06 14/05 06/07 20/06 – – 14/05 06/07 14/05
Aphox 560 g 14/04
15/05
01/04
01/05
14/04
15/05
14/05
15/06
02/05
25/05
14/04
15/05
14/05
15/06
20/06
–
–
–
–
–
14/04
15/05
14/05
15/06
14/04
15/05
Apollo 50 SC 400
ml
– 04/04 – – 04/04 – – – – – – – –
Calypso 250 ml 14/04 – 14/04 14/04 – 14/04 14/04 – – – 14/04 14/04 14/04
Corbel 1 l –
–
20/07
04/08
–
–
–
–
25/07
08/08
–
–
–
–
–
–
–
–
–
–
–
–
–
–
–
–
DiPel DF 750 g 14/04 16/04 14/04 14/05 04/05 14/04 14/05 – – – 14/04 14/05 14/04
Frupica 0.6 kg
0.8 kg
11/05
20/05
12/04
05/05
11/05
20/05
05/07
–
15/06
–
11/05
20/05
05/07
–
–
–
–
–
–
–
11/05
20/05
05/07
–
11/05
20/05
Majestik 25 l –
–
–
–
–
–
–
–
–
–
–
–
–
–
–
–
14/04
15/05
21/05
22/06
–
–
–
–
–
–
Nimrod 1.4 l 28/05 28/05 28/05 15/07 28/06 28/05 15/07 – – – 28/05 15/07 28/05

33
PBI Slug Pellets 15
kg
15/05 15/04 15/05 15/06 25/05 15/05 15/06 – – – 15/05 15/06 15/05
Phytoseiulius 5-
25K
16/04 16/04 16/04 02/06 02/06 16/04 02/06 – 16/04 16/05 16/04 02/06 16/04
Plenum WG 0.4 kg – 15/03 – – 15/03 – – – – – – – –
Signum 1.8 kg –
–
–
–
–
–
12/06
26/06
22/05
05/06
–
–
12/06
26/06
–
–
–
–
–
–
–
–
12/06
26/06
–
–
Stroby WG 0.3 kg 04/05 05/04 04/05 – – 04/05 – – – – 04/05 – 04/05
Systhane 20EW
230 ml
28/04
18/05
28/03
19/04
28/04
18/05
05/06
19/06
15/05
29/05
28/04
18/05
05/06
19/06
–
–
–
–
–
–
28/04
18/05
05/06
19/06
28/04
18/05
Teldor 1.5 kg 28/04
18/05
28/05
28/03
19/04
28/04
28/04
18/05
28/05
15/06
–
–
28/06
–
–
28/04
18/05
28/05
15/06
–
–
–
–
–
–
–
–
–
–
–
28/04
18/05
28/05
15/06
–
–
28/04
18/05
28/05
Thianosan 2 kg – 15/03 – – 15/03 – – – – – – – –
*4aNC1st (2
nd year) (No Crop 1
st year): Draza (5 kg) 14/05; Dursban (1 l) 24/04; Unicrop Thianosan 1.5 kg
02/05 & 13/05; Frupica (0.6 kg) 21/05; Plenum WG (0.4 kg) 02/10; Scala (2 l) 11/06; Teldor (1.5 kg) 30/05
Formulations: Chloropicrin (995 g/kg); Aliette 80 WG (fosetyl-aluminium 800 g/kg); Amistar (azoxystrobin
250 g/l); Aphox (pirimicarb 500 g/kg); Apollo 50 SC (clofentezine 500 g/l); Calypso (thiacloprid 480 g/l);
Corbel (fenpropimorph 750 g/l); DiPel DF (B. thuringiensis 64 g/kg); Frupica (mepanipyrim 500 g/kg);
Majestik (plant extract 100 g/kg); Nimrod (bupirimate 250 g/l); PBI Slug Pellets (metaldehyde 30 g/kg);
Plenum WG (pymetrozine 500 g/kg); Scala (pyrimethanil 400 g/l); Signum (boscalid 267 g/kg and
pyraclostrobin 67 g/kg); Stroby WG (kresoxim methyl 500 g/kg); Systhane 20EW (myclobutanil 200 g/l);
Teldor (fenhexamid 500 g/kg); Thianosan (thiram 800 g/kg).

34
Table 3. Herbicide programme with assumed application dates for each strawberry production system 1st year.
Second year Junebearer crops receive identical programmes to summer planted Systems 1 and 2
System
Product
1 1
SP
1
NP 2nd
2 2
SP
3 4 4a
NC 1st
*
5
SP
6
SP
7 8
9
Alpha propachlor 5 l –
–
–
–
–
–
–
–
–
–
–
–
–
–
03/04
19/05
–
–
–
–
–
–
–
–
–
–
Beetup 2.5 l –
–
–
–
–
–
–
–
–
–
–
–
–
–
–
–
–
–
–
–
–
–
–
–
–
–
–
–
01/05
12/05
19/05
30/05
–
–
–
–
–
–
–
–
–
–
–
–
–
–
–
–
–
–
–
–
Dacthal 5 kg –
–
15/10
–
–
–
–
–
15/10
–
–
–
–
–
03/04
19/05
–
–
–
–
–
–
–
–
–
–
Dacthal 4.6 l – 15/12 – – 15/12 – – – – – – – –
Flexidor 125 1 l 15/03 – 15/03 15/03 – 15/03 15/03 – – – 15/03 15/03 15/03
Laser 1 l – – – – – – – 03/06 – – – – –
Partna 1.25 l – – – – – – – 03/06 – – – – –
Ramrod Flowable 5 l – 15/10 – – 15/10 – – – – – – – –
Stomp 400 SC 3.5 l 15/03 – 15/03 15/03 – 15/03 15/03 – – – 15/03 15/03 15/03
*4aNC1st (year 2): Devrinol (4.6 l) 03/03; Flexidor 125 (1 l) 13/12; Laser (2.25 l) 11/04 & 14/06; PDQ (5.5 l)
17/07; Stomp 400 SC (3.5 l) 13/12.
Formulations: Alpha propachlor (propachlor 500 g/l); Beetup (phenmedipham 114 g/l); Dacthal (chlorthal-
dimethyl 750 g/kg); Devrinol (napropamide 450 g/l); Flexidor 125 (isoxaben 125 g/l); Laser (cycloxydim 200
g/l); Partna (alkylphenol ethoxylate 100 g/kg): PDQ (paraquat + diquat 80:120 g/l): Ramrod Flowable
(propachlor 480 g/l): Stomp 400 SC (pendimethalin 400 g/l).

35
Table 4. Energy consumption (MJ/ha) for field operations derived from method described in Hunt (1995)
with additional data for proportion field efficiency (FE) to account for refuelling or filling (Donaldson et al.
1994)
Operation Implement Width
(m)
Force
(kN/m)
Power
(kW)
Speed
(km/h)
Time
(h/ha)
FE
Energy
(MJ/ha)
shallow cultivations (light
soils)
spike toothed harrow 3 0.60 60 8 0.4 0.85 164
shallow cultivations (heavy
soils)
field cultivator 3 2.65 75 7 0.5 0.85 253*
rotary hoe row cultivator
(shallow)
6 0.90 65 7 0.2 0.85 102
mow mower (cutter bar) 1 1.10 65 8 0.8 0.85 333†
bed formation field cultivator 1 2.65 75 6 1.0 0.85 513†
lay mulch and T-tape field cultivator
equivalent
1 2.65 75 4 1.6 0.85 769†
grub spring toothed
harrow
1 2.70 75 4 2.5 0.85 601‡
fumigation shank 1 0.60 60 3 2.1 0.80 872†
*two passes of a field cultivator (506 MJ/ha) required to create a seedbed on heavy (clay) soil, one pass on
sandy clay loam soil.
†beds only (62.5 beds/ha).
‡beds only (62.5 beds/ha), includes mulch removal. System 4 (no crop 1st year) with no mulch forward
speed 7 km/h (344 MJ/ha).

36
Table 5. Nutrition regime (kg/ha)
Scenario N P K MgO
1 40* 17.4 66.4 50
1 (SP) 40* 17.4 66.4 50
1 (NC 2nd
) 40* 17.4 66.4 50
2 40* 17.4 66.4 50
2 (SP) 40* 17.4 66.4 50
3 40* 17.4 66.4 50
4 40* 17.4 66.4 50
4a (NC 1st) 63† 17.4 66.4 50
5 (SP) 60 (240) ‡ / 0 61 (102) / 0 347 (386) / 0 0
6 (SP) 0 0 0 0
7 102* 36.6 93 50
8 102* 36.6 93 50
9 177* 40.1 272 65
*0.25 ammonium nitrate: 0.75 potassium nitrate applied via fertigation and 0 kg N/ha as a base dressing pre-
planting.
†ammonium nitrate
‡40 t/ha FYM. N available to crop (total N input) Scenario 5 and 6 applied 27 July.

37
Table 6. Chemical composition of fertilizer products and media, and energy and GWP for their manufacture (Brentrup & Pallière 2008; Jenssen &
Kongshaug 2003) excluding 1.3 MJ/kg packaging and transport (Kaltschmidt & Reinhardt 1997) unless stated otherwise
Product Composition Energy (MJ) GWP100
(t CO2 equiv)
ammonium nitrate 0.345 N 13.5 MJ/kg product 0.00217/kg product
ammonium sulphate 0.21 N; 0.6 SO3 6.0 MJ/kg product 0.00034/kg product
potassium nitrate 0.13 N; 0.45 K2O (K2O: 0.83 K) 11.3 MJ/kg product 0.00197/kg product
seaweed meal 0.13 N; 0.25 K2O 2.0* MJ/l product
triple superphosphate 0.48 P2O5 (P2O5: 0.436 P) 6.4 MJ/kg product 0.00035/kg product
sulphate of potash 0.5 K2O; 0.45 SO3 1.4 MJ/kg product 0.0001/kg product
magnesium sulphate 0.16 MgO (MgO: 0.6 Mg); 0.33 SO3 2.5† MJ/kg product
coir 3.05‡ MJ/kg dry
peat 0.02§ MJ/kg dry

38
*0.5 MJ/kg washing & shredding, 1.25 MJ/kg dried by 0.25 (50 MJ/t/0.1 mc, Daalgard et al., 2001), 1.3 MJ/kg packaging and transport (Kaltschmidt
& Reinhardt 1997), bulk density 0.7 kg/l (Richards 2001).
†mineral extraction 0.8 MJ/kg (Jenssen & Kongshaug 2003), packaging and transport 1.3 MJ/kg (Kaltschmidt & Reinhardt 1997) plus estimate for
processing.
‡1.56 kg/m growbag when dry, sterilization with chloropicrin (full rate) 0.13 MJ/kg dry, transport 2 km to storage and packaging area 0.2 l t/km
(Daalgard et al. 2001), shipped 8711 km from Sri-Lanka 0.006 kg CO2e/t/km (DEFRA 2009b; two journeys within UK port to supplier to grower, of
114 km each (average haulage distance by road for ‘crude materials ’, National Statistics 2009) by 38 t gross weight truck 0.086 kg CO2e/t/km
(DEFRA 2009b).
§ extraction needed 0.001 MJ/kg, and transport when dry and weighing 0.4 t/m (Lindström 1980) required 0.2 l/t/km (Daalgard et al. 2001) for an
average distance of 2 km to the storage and packaging area; 0.5 imported from Ireland, 0.5 extracted North and West of England; transport within and
from Ireland assumed 124 km by road and 150 km by ship, transport within the UK as two journeys 124 km each by 38 t gross weight truck 0.086 kg
CO2e/t/km (DEFRA 2009b).

39
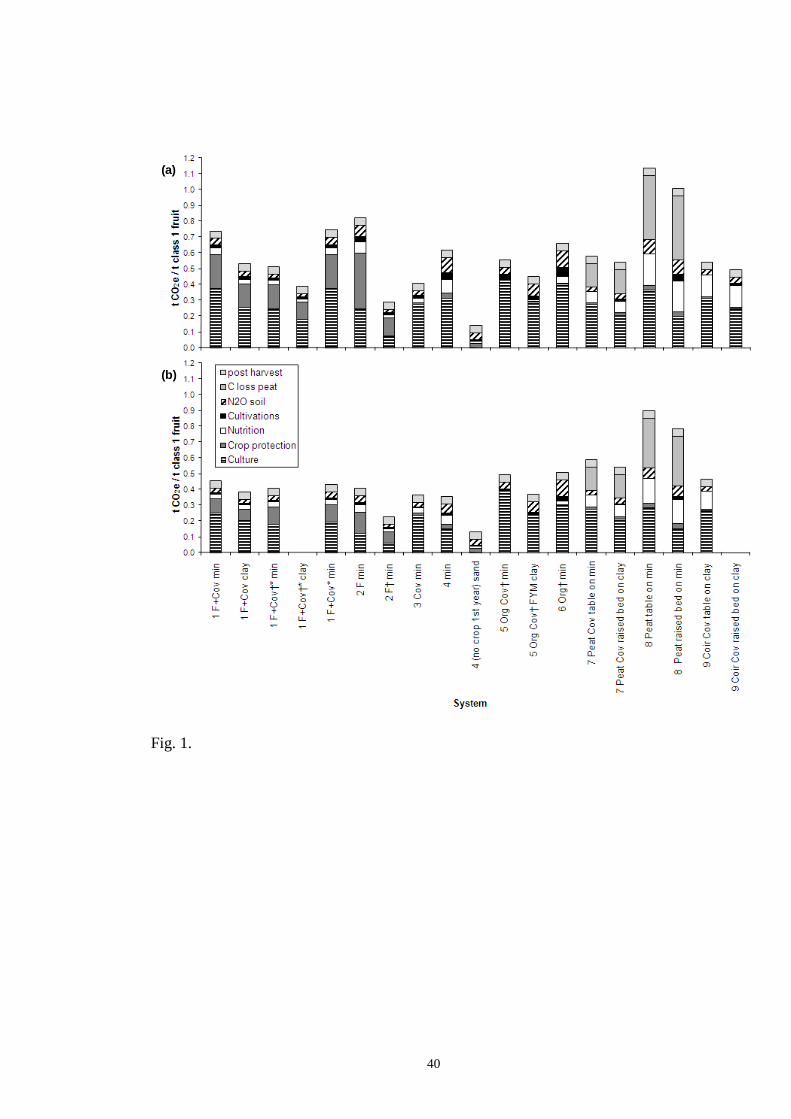
Fig. 1. Greenhouse gas emissions (t CO2 equiv) per tonne of class 1 fruit for each
production system (inclusive of post harvest operations) after (a) 1 and (b) 2 years of
cropping. F = fumigated, Cov = covered with a polytunnel, †summer planted, *no
cover year two. Total emissions (t CO2 equiv) per tonne of class 1 fruit after 3 years of
cropping (in brackets): system 1 F+Cov min (0.41), system 2 F min (0.37) and system 4
min (0.30).
Fig. 2. Input of energy (GJ) per tonne of class 1 fruit for each production system
(inclusive of post harvest operations) after (a) 1 and (b) 2) years of cropping. F =
fumigated, Cov = covered with a polytunnel, †summer planted, *no cover year two.
Total energy (GJ) per tonne of class 1 fruit after 3 years of cropping 1 F+Cov min
(7.49), 2 F min (5.05) and 4 min (3.85).
40
(a)
(b)
Fig. 1.

41
(a)
(b)
Fig. 2.