climate change and coral reefs - national oceanic and ... · climate change and coral reefs ......
TRANSCRIPT
American Samoa Teacher’s Guide Grades 7-12
1
Climate Change and Coral Reefs
A Teacher’s Guide for Middle and High School
American Samoa
Karen D. Bohnsack
American Samoa Teacher’s Guide Grades 7-12
2
FOR THE TEACHER: The purpose of the Climate Change and Coral Reefs Teacher’s Guide is to provide teachers in American Samoa
with lesson plans that will facilitate instruction on climate change and, more specifically, its impacts on the
Territory’s coral reefs. Coral reefs are an integral part of South Pacific island communities such as American
Samoa, and it is important for students to have a basic knowledge of the likely effects of climate change on these
valuable ecosystems. The provided lesson plans are themed and consist of an objective, relevant vocabulary
words, presentation points, and interactive classroom activities complete with materials lists and worksheets.
While the lessons are designed so that no outside knowledge on climate change and coral reefs is required, it is
recommended that teacher’s review other relevant information on this subject matter. This guide is intended for
students between grades 7 and 12 in American Samoa, and can be adapted to suit different grades.
VOCABULARY BY LESSON: INTRODUCTION:
• Climate • Weather • Atmosphere • Climate Change • Global Warming
• Industrial Revolution
LESSON 1:
• Carbon Dioxide • Greenhouse Gases • Greenhouse Effect • Carbon Source • Carbon Sink • Photosynthesis • Fossil Fuels
LESSON 2:
• Emissions • Carbon Footprint
LESSON 3:
• Reservoir • Carbon Cycle • Saturation • Acidic • Basic • pH Scale
• Ocean Acidification • Carbonic Acid
LESSON 4:
• Specific Heat Capacity • Polyp • Zooxanthellae
• Symbiotic Relationship • Nematocysts • Coral Bleaching
LESSON 5:
• Glacier • Ice Sheet • Thermal Expansion
LESSON 6:
• Mitigation • Adaptation • Resilience
American Samoa Teacher’s Guide Grades 7-12
3
GLOSSARY: Acidic: Term that describes substances such as
lemons and vinegar that have a pH less than 7. Adaptation: Efforts to cope with the effects
of climate change by reducing community
vulnerability. Atmosphere: The layer of gasses that surrounds the planet. Basic: Term that describes substances such
as soap and detergents that have a pH
greater than 7. Calcium Carbonate: Mineral dissolved in
seawater that is used by marine organisms
to make skeletons and shells. Carbon Cycle: The constant movement of
carbon between the oceans, atmosphere,
and land. Carbon Dioxide: A chemical compound made
of two oxygen atoms and one carbon atom. It
naturally exists as a gas in earth’s atmosphere. Carbon Footprint: The amount of carbon
dioxide released by an individual, household,
or business. Carbonic Acid: Substance created when
carbon dioxide dissolves in the ocean. Also
used for carbonating soft drinks. Carbon Sink: Anything that captures and
holds carbon dioxide. Carbon Source: Anything that releases CO2
into the atmosphere, including living, dead, or
non‐ living. Climate: The long term average of a region’s weather patterns.
Climate Change: A change in a region’s long‐ term weather patterns.
Coral Bleaching: When coral polyps
under stress expel their symbiotic algae
and turn white.
Ecosystem Services: The benefits a
natural resource provides for humans.
Emissions: Carbon Dioxide released from
activities such as driving and burning trash.
Food Chain: A representation of the
interactions between predators and prey in
an ecosystem.
Fossil Fuels: Natural resources such as coal
and petroleum. These substances are formed
over millions of years when the fossilized
remains of plants and animals are exposed to
heat and pressure in the earth’s crust.
Glacier: A giant mass of ice that moves over land.
Global Warming: An increase in earth’s
average temperature.
Greenhouse Gases: Gases in the atmosphere
that absorb and hold heat from the sun.
Greenhouse Effect: The process where CO2 in
the atmosphere absorbs heat from the sun
and naturally warms the earth.
Ice Sheet: Massive glaciers that cover over
20,000 square miles as land. Also known
as continental glaciers

American Samoa Teacher’s Guide Grades 7-12
4
Industrial Revolution: The period from the 18th
to 19th
century when there were major changes
in technology, manufacturing, agriculture and
transportation, beginning in Europe and
eventually spreading around the world. Limestone: A rock composed mostly of calcium carbonate. Mitigation: Addressing the cause of climate
change by reducing CO2 and other greenhouse
gas emissions into the atmosphere. Nematocysts: Stinging cells found on coral tentacles. Ocean Acidification: The decrease in the pH of the
world’s oceans, due to their absorption of excess
carbon dioxide from the atmosphere. pH Scale: Scale used to measure how acidic
or basic a substance is. It ranges from 0 to
14, with 7 being neutral, 0 to 7 being acidic,
and 7 to 14 being basic. Photosynthesis: The process where energy
from the sun is used to convert carbon
dioxide into sugars.
Plankton: Drifting, aquatic organisms.
Polyp: Marine animal that makes a coral reef.
Reservoir: Places where carbon is stored on
earth, such as in the atmosphere, oceans,
and in plants on land.
Resilience: The ability to recover from and adjust to a change.
Saturation: The limit beyond which oceans
will no longer be able to take up more CO2.
Specific Heat Capacity: The amount of
energy required to raise the temperature of
a substance by one degree.
Symbiotic Relationship: When two different
species work together and benefit each other.
Thermal expansion: The increase in volume
that occurs when water absorbs heat.
Weather: The general atmospheric conditions at a particular place and time.
Zooxanthellae: Marine algae that lives inside a coral polyp.

American Samoa Teacher’s Guide Grades 7-12
5
INTRODUCTION: WHAT IS CLIMATE CHANGE? OBJECTIVE: Review the topic of climate change with students and ensure that they know the difference between climate and weather, and climate change and global warming. VOCABULARY: Climate, Weather, Atmosphere, Climate Change, Global Warming, Industrial Revolution PRESENTATION:
• Climate is the long‐term average of a region’s weather patterns. In American Samoa the climate can be described as tropical, hot, and humid.
• This is different from weather, which describes the general atmospheric conditions at a
particular place and time. Remember, the atmosphere is the layer of gases that surrounds
the planet. So the weather basically describes what it is like outside, such as rainy, sunny
and hot, or breezy and cool.
• Climate change is what happens when there is a change in a region’s long term weather
patterns. When climate change occurs it affects the whole world, although different
regions may be affected in different ways.
• Global warming, which is a part of climate change, is when there is an increase in Earth’s average temperature.
• Climate change is not new to the earth. In fact, climate has historically varied throughout
space and time, from factors such as volcanic eruptions, differences in the amount of energy
released from the sun, and changes in earth’s orbit. These have resulted in both ice ages and
warm periods. For example, during the last ice age 20,000 years ago, ice covered much of the
North American continent, including parts of the United States mainland. In fact, the remains
of woolly mammoths have been discovered as far south as New York and Virginia, which
suggests that these states used to be covered in ice. Since that time, the earth naturally and
gradually warmed up to more modern temperatures.
• However, recently observed changes in climate are not caused by these natural factors, but by changes
in the atmosphere caused by humans since the Industrial Revolution. Does anyone
know what the Industrial Revolution is? It is the period from the 18th
to 19th
century when
there were major changes in technology, manufacturing, agriculture and transportation. It began in Europe and eventually spread around the world.
• Scientists estimate that Earth’s temperature is increasing much more quickly than in the
past, about 1°F over the past 100 years, largely as a result of human activities. • This rapid change in climate will have consequences for humans and the earth system.
American Samoa Teacher’s Guide Grades 7-12
6
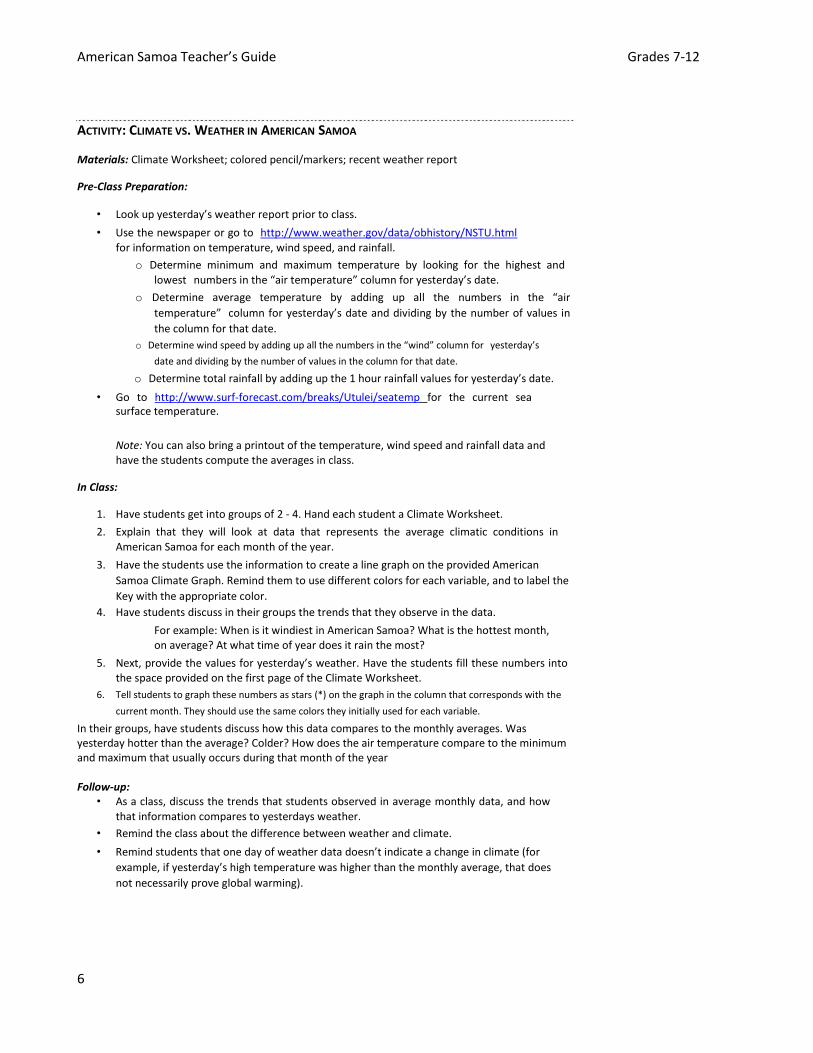
ACTIVITY: CLIMATE VS. WEATHER IN AMERICAN SAMOA Materials: Climate Worksheet; colored pencil/markers; recent weather report Pre‐Class Preparation:
• Look up yesterday’s weather report prior to class.
• Use the newspaper or go to http://www.weather.gov/data/obhistory/NSTU.html
for information on temperature, wind speed, and rainfall. o Determine minimum and maximum temperature by looking for the highest and
lowest numbers in the “air temperature” column for yesterday’s date. o Determine average temperature by adding up all the numbers in the “air
temperature” column for yesterday’s date and dividing by the number of values in
the column for that date. o Determine wind speed by adding up all the numbers in the “wind” column for yesterday’s
date and dividing by the number of values in the column for that date.
o Determine total rainfall by adding up the 1 hour rainfall values for yesterday’s date.
• Go to http://www.surf‐forecast.com/breaks/Utulei/seatemp for the current sea surface temperature.
Note: You can also bring a printout of the temperature, wind speed and rainfall data and have the students compute the averages in class.
In Class:
1. Have students get into groups of 2 ‐ 4. Hand each student a Climate Worksheet. 2. Explain that they will look at data that represents the average climatic conditions in
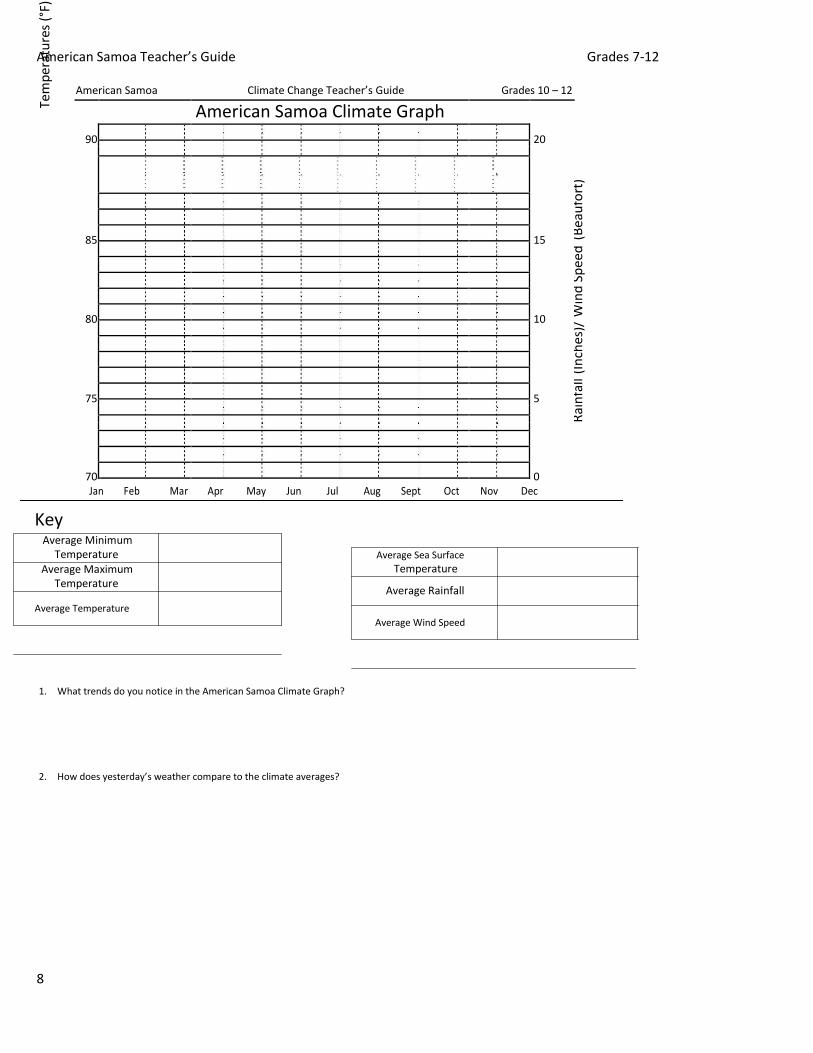
American Samoa for each month of the year. 3. Have the students use the information to create a line graph on the provided American
Samoa Climate Graph. Remind them to use different colors for each variable, and to label the
Key with the appropriate color. 4. Have students discuss in their groups the trends that they observe in the data.
For example: When is it windiest in American Samoa? What is the hottest month, on average? At what time of year does it rain the most?
5. Next, provide the values for yesterday’s weather. Have the students fill these numbers into the space provided on the first page of the Climate Worksheet.
6. Tell students to graph these numbers as stars (*) on the graph in the column that corresponds with the
current month. They should use the same colors they initially used for each variable. In their groups, have students discuss how this data compares to the monthly averages. Was yesterday hotter than the average? Colder? How does the air temperature compare to the minimum and maximum that usually occurs during that month of the year Follow‐up:
• As a class, discuss the trends that students observed in average monthly data, and how
that information compares to yesterdays weather. • Remind the class about the difference between weather and climate.
• Remind students that one day of weather data doesn’t indicate a change in climate (for
example, if yesterday’s high temperature was higher than the monthly average, that does
not necessarily prove global warming).
American Samoa Teacher’s Guide Grades 7-12
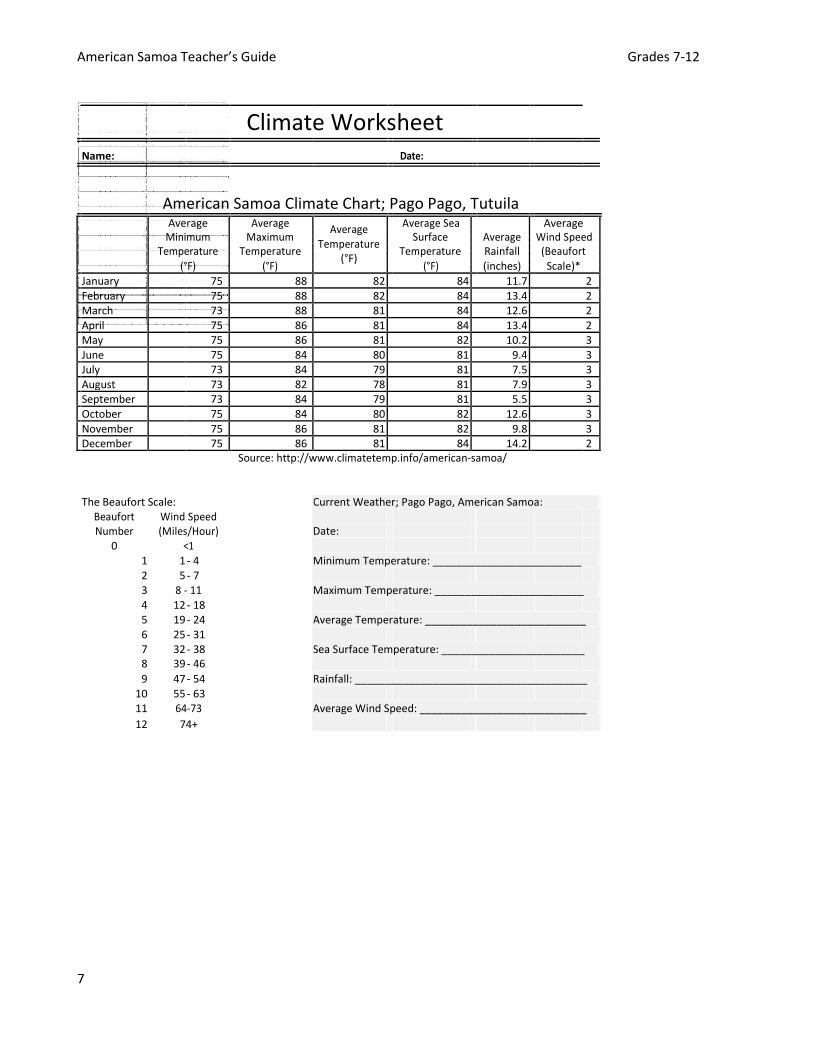
7
Climate Worksheet
Name: Date:
American Samoa Climate Chart; Pago Pago, Tutuila
Average Average Average Average Sea Average
Minimum Maximum Surface Average Wind Speed
Temperature
Temperature Temperature Temperature Rainfall (Beaufort
(°F)
(°F) (°F)
(°F) (inches)
Scale)*
January 75 88 82 84 11.7 2
February 75 88 82 84 13.4 2
March 73 88 81 84 12.6 2
April 75 86 81 84 13.4 2
May 75 86 81 82 10.2 3
June 75 84 80 81 9.4 3
July 73 84 79 81 7.5 3
August 73 82 78 81 7.9 3
September 73 84 79 81 5.5 3
October 75 84 80 82 12.6 3
November 75 86 81 82 9.8 3
December 75 86 81 84 14.2 2
Source: http://www.climatetemp.info/american‐samoa/
The Beaufort Scale: Current Weather; Pago Pago, American Samoa:
Beaufort Wind Speed
Number (Miles/Hour) Date:
0 <1
1 1 ‐ 4 Minimum Temperature: _________________________
2 5 ‐ 7
3 8 ‐ 11 Maximum Temperature: _________________________
4 12 ‐ 18
5 19 ‐ 24 Average Temperature: ___________________________
6 25 ‐ 31
7 32 ‐ 38 Sea Surface Temperature: ________________________
8 39 ‐ 46
9 47 ‐ 54 Rainfall: _______________________________________
10 55 ‐ 63
11 64‐73 Average Wind Speed: ____________________________
12 74+
American Samoa Teacher’s Guide Grades 7-12
8
Key
Average Minimum Temperature
Average Maximum Temperature
Average Temperature
Average Sea Surface
Temperature
Average Rainfall Average Wind Speed
1. What trends do you notice in the American Samoa Climate Graph?
2. How does yesterday’s weather compare to the climate averages?
American Samoa Climate Change Teacher’s Guide Grades 10 – 12
American Samoa Climate Graph
90
(Bea
ufo
rt)
20
85
15
Win
d S
pee
d
80
10
(In
ches
)/
75
5
Rai
nfa
ll
70
0
Jan Feb Mar Apr May Jun Jul Aug Sept Oct Nov Dec
Tem
per
atu
res
(°F)

American Samoa Teacher’s Guide Grades 7-12
9
LESSON 1: CARBON DIOXIDE AND THE GREENHOUSE EFFECT OBJECTIVE: Students will understand that gases such as carbon dioxide naturally exist in the atmosphere and create a greenhouse effect. They will also learn the ways in which humans increase
CO2 in the atmosphere, intensify the greenhouse effect, and contribute to climate change. They will
conduct two activities to observe the greenhouse effect and the influence of CO2 on temperature. VOCABULARY: Carbon Dioxide, Greenhouse Gases, Greenhouse Effect, Carbon Source, Carbon Sink, Photosynthesis, Fossil Fuels PRESENTATION 1A:
• What is carbon dioxide? Carbon dioxide is a chemical compound made of two oxygen atoms
and one carbon atom. It naturally exists as a gas in earth’s atmosphere. Its chemical formula
is CO2 (Write CO2 on the board so students are familiar with it). Carbon dioxide makes up
only a small amount, 0.039%, of the air in the atmosphere. It is also in the air humans and animals breathe out.
• What is a greenhouse? A greenhouse is a small glass house used to grow plants, especially
during the winter in cold places, because they trap the sun’s heat. (Draw a picture on the
board of a little house, with arrows representing the sun’s light and heat entering and being
trapped inside).
• CO2 and several other gases are known as greenhouse gases because they absorb and hold heat
from the sun, just like a greenhouse. (Draw a picture of the earth, with a circle representing
the atmosphere around it. Explain that CO2 exists in the atmosphere. Draw similar arrows
representing the sun’s light and heat entering and being trapped in the atmosphere). Some
other natural greenhouse gases are water vapor and ozone. Without these gases, heat would
escape back into space and the earth’s average temperature would be approximately ‐18°C
or 0°F.
• The process where CO2 in the atmosphere absorbs heat from the sun and naturally warms
the earth is known as the greenhouse effect.
• Describe the greenhouse effect by discussing what happens to a car that is left in the sunlight
with its windows rolled up. The car is hotter than it is outside because heat from the sun
enters through the glass and is not able to escape again.
• Remind students that there are many natural sources of CO2 in the atmosphere, including
human respiration, volcanic eruptions, the decay of dead plant and animal matter, and
forest fires. Anything that releases CO2 into the atmosphere, including living, dead, or non‐living, is a source of carbon dioxide.
• Because the level of CO2 in the atmosphere is relatively constant, there are also natural ways that it is removed from the atmosphere. These are known as “carbon sinks” and include anything
that absorbs and holds CO2. Discuss with the class what some sinks might be.
• Two major sinks include absorption by seawater and its use for photosynthesis by plants, algae and bacteria. Who knows what photosynthesis is? It is the process where energy from the sun is used to convert carbon dioxide into sugars. Photosynthesis releases oxygen as a waste product.

American Samoa Teacher’s Guide Grades 7-12
10
• Sources constantly release CO2 and sinks constantly take it in, so that carbon dioxide is
always cycling through the earth and atmosphere.
• Many human activities release CO2 into the atmosphere (Discuss what, like burning fossil fuels
for electricity and driving, cement production, and waste incineration). One of the main
sources of CO2 is from burning fossil fuels. What are fossil fuels? When plants and animals
die, their bodies turn into fossils. Over millions of years, these fossilized remains are exposed
to a lot of heat and pressure in the earth’s crust, and turn into fossil fuels such as coal and
petroleum. These fuels have a lot of carbon in them, so when we burn them, a lot of carbon
dioxide is released into the atmosphere. • Combined, human activities release so much CO2 that there are not enough sinks to balance
it out. As a result, the amount of carbon dioxide in the atmosphere is higher, which intensifies
the greenhouse effect.
• A stronger greenhouse effect means that heat which would have otherwise escaped into
space is now trapped in earth’s atmosphere. This is causing the earth to get warmer (remind
students that this is called global warming).

American Samoa Teacher’s Guide Grades 7-12
11
ACTIVITY 1: MODELING EARTH’S ATMOSPHERE Materials (for each team of 4 students): two plastic 2‐liter soda bottles (with caps); two 14oz or 16oz
plastic containers of similar color (deli or sour cream containers work well); scissors or knife; clear
tape; 2 thermometers; vinegar; baking soda; portable table lamp with 150 watt floodlight bulb; data
collection sheet; Watch (or other timer); 2 colored pencils/markers.
Note: If not enough materials are available for smaller groups, you can do one experiment
as a demonstration in front of the class. Encourage student involvement by designating
roles. • Remove labels from plastic bottles by soaking them in water.
In class:
1. Remind students about the greenhouse effect. 2. Explain that you will conduct an experiment to observe if increased greenhouse gases (i.e.
CO2) really do have an impact on earth’s temperature. You will use earth’s temperature
under the “normal” greenhouse effect as a basis of comparison. 3. Split students into teams of four and distribute the required materials. 4. Tell students that they will construct “experiment chambers”. Have each team cut off
the bottom 2 inches of each of the 2‐liter soda bottles.
5. Tape a thermometer, facing out, to the inside of each bottle. Make sure that the
temperature can be seen easily, without touching the bottle. Place each capped bottle into
a 14oz or 16oz plastic container base, and tape to seal. 6. Tell students that these experiment chambers represent identical models of earth’s
atmosphere. Now we will generate carbon dioxide in one chamber to simulate the increase
in CO2 that humans have caused in the atmosphere. 7. In one experiment chamber, first ensure that the 2L bottle is firmly taped to the plastic container base.
Next, remove the cap and add 2 tablespoons of vinegar. Finally, add ½ a teaspoon of baking soda and
quickly re‐cap the bottle. Explain to students that mixing vinegar
and baking soda together creates a simple reaction that generates carbon dioxide and water.
8. Cut out the labels provided on the data collection sheet and use them to mark which
bottle is normal air and which bottle has increased‐CO2. 9. Place experiment chambers, with taped thermometers, under the portable table lamp.
Ensure that the thermometers are facing toward the students, and turn on the light.
10. Have students collect temperature data from each thermometer every minute for 20 minutes, and record on the data collection sheet.
11. Turn off the portable lights. Have students graph their results on their data collection sheet,
using a different color for each bottle. Make sure to point out that the x‐axis and y axis are labeled, but that students need to fill in numbers for the temperature on the y‐axis based
on the data they collected. Also be sure to remind them to use the key to show which color represents each bottle.
Follow Up:
• Discuss as a class the graphed data from the normal air and increased CO2 bottles.
What happened? Why?
• How does this compare to the greenhouse effect of the earth’s atmosphere? Note: The
intact plastic bottle acts as a rough, simple model, but in reality the earth’s atmosphere is
much more complicated

American Samoa Teacher’s Guide Grades 7-12
12
Modeling Earth’s Atmosphere: Data Collection Sheet
Name: Date:
Temperature
Minute Normal Air Bottle Increased CO2 Bottle
1
2
3
4
5
6
7
8
9
10
11
12
13
14
15
16
17
18
19
20

American Samoa Teacher’s Guide Grades 7-12
13
Normal Air Increased CO2
Temperature Change Over Time in a Simulated Atmosphere
Tem
per
atu
re (
°F)
1 2 3 4 5 6 7 8 9 10 11 12 13 14 15 16 17 18 19 20
Time (Minutes)
Key Normal Air Increased CO2
American Samoa Teacher’s Guide Grades 7-12
14
LESSON 2: HOW MUCH CARBON DO YOU GENERATE? OBJECTIVE: Students will gain a better understanding of their personal CO2 contribution to the atmosphere by calculating their personal carbon footprint based on vehicle, electricity and natural gas
use in their household. VOCABULARY: Emissions, Carbon Footprint
*This lesson uses math skills, such as addition, multiplication, and division. PRESENTATION 2:
• Remind students that many human activities release carbon dioxide into the atmosphere. • Have class brainstorm some of the human sources of CO2. • The CO2 released from activities such as driving and burning trash are known as emissions.
They contribute to global warming by enhancing the greenhouse effect. • The amount of CO2 released by an individual, household, or business is known as a carbon
footprint. This is usually measured in pounds emitted per year. For example, every day, Fatima
drives her car 20 miles to go to work, go to church, or visit her family and friends. Over the
course of a year, this releases 7,300 pounds of CO2 into the atmosphere. Fatima also uses
electricity at work to run her computer, and at home she uses electricity for her refrigerator,
fan, lights and TV. Combined, this releases another 5,200 pounds of CO2 over the entire year.
Combined, these carbon dioxide emissions are Fatima’s carbon footprint. Fatima’s
carbon footprint is about 12,500 pounds of CO2 per year. ACTIVITY 2: CALCULATING PERSONAL CARBON FOOTPRINTS Materials: Chalkboard; calculators (at least 1 per group of 2 or 3 students); Carbon Footprint Worksheet (1 per student). Pre‐Class Preparation:
• Pass out the Carbon Footprint Worksheet at least 2 days before you plan to do this activity, so
that students can take it home and ask their family members to help them fill it out, if
necessary. It may be a good idea to assign it as homework to make sure students complete
the assignment. Only have students complete Section 1 at home. The rest of the worksheet
will be completed in class.
• Prior to the lesson, draw a chart on the chalkboard that it will be visible to the whole class. Include
“Name” and “Carbon Footprint” as column headings (see “Carbon Footprints” example chart provided).
This chart will be used to compare the students’ yearly carbon emissions.
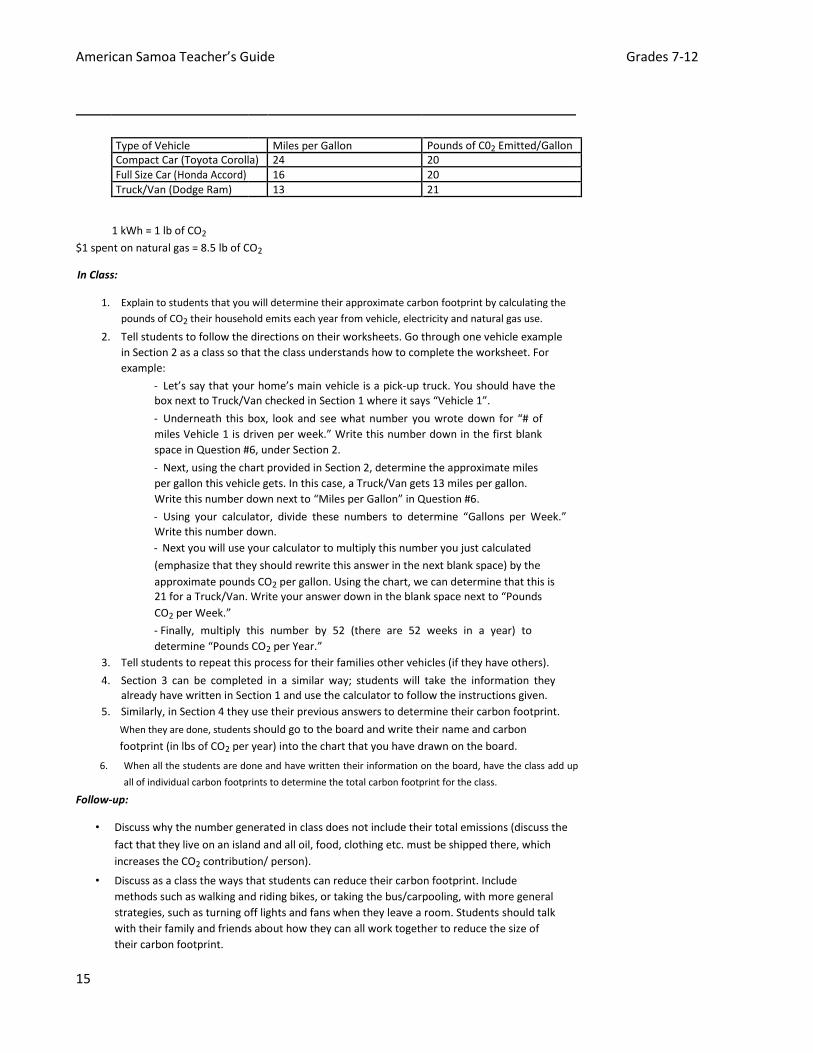
• Also, it may be handy to have the following information available to help students complete sections 2 and 3 of their worksheets (numbers are approximate).
American Samoa Teacher’s Guide Grades 7-12
15
$1 spent on natural gas = 8.5 lb of CO2 In Class:
1. Explain to students that you will determine their approximate carbon footprint by calculating the
pounds of CO2 their household emits each year from vehicle, electricity and natural gas use.
2. Tell students to follow the directions on their worksheets. Go through one vehicle example
in Section 2 as a class so that the class understands how to complete the worksheet. For
example:
‐ Let’s say that your home’s main vehicle is a pick‐up truck. You should have the box next to Truck/Van checked in Section 1 where it says “Vehicle 1”.
‐ Underneath this box, look and see what number you wrote down for “# of
miles Vehicle 1 is driven per week.” Write this number down in the first blank
space in Question #6, under Section 2.
‐ Next, using the chart provided in Section 2, determine the approximate miles
per gallon this vehicle gets. In this case, a Truck/Van gets 13 miles per gallon.
Write this number down next to “Miles per Gallon” in Question #6.
‐ Using your calculator, divide these numbers to determine “Gallons per Week.”
Write this number down. ‐ Next you will use your calculator to multiply this number you just calculated (emphasize that they should rewrite this answer in the next blank space) by the
approximate pounds CO2 per gallon. Using the chart, we can determine that this is 21 for a Truck/Van. Write your answer down in the blank space next to “Pounds
CO2 per Week.”
‐ Finally, multiply this number by 52 (there are 52 weeks in a year) to
determine “Pounds CO2 per Year.” 3. Tell students to repeat this process for their families other vehicles (if they have others). 4. Section 3 can be completed in a similar way; students will take the information they
already have written in Section 1 and use the calculator to follow the instructions given. 5. Similarly, in Section 4 they use their previous answers to determine their carbon footprint.
When they are done, students should go to the board and write their name and carbon
footprint (in lbs of CO2 per year) into the chart that you have drawn on the board. 6. When all the students are done and have written their information on the board, have the class add up
all of individual carbon footprints to determine the total carbon footprint for the class.
Follow‐up:
• Discuss why the number generated in class does not include their total emissions (discuss the fact that they live on an island and all oil, food, clothing etc. must be shipped there, which
increases the CO2 contribution/ person).
• Discuss as a class the ways that students can reduce their carbon footprint. Include
methods such as walking and riding bikes, or taking the bus/carpooling, with more general
strategies, such as turning off lights and fans when they leave a room. Students should talk
with their family and friends about how they can all work together to reduce the size of
their carbon footprint.
Type of Vehicle Miles per Gallon Pounds of C02 Emitted/Gallon Compact Car (Toyota Corolla) 24 20
Full Size Car (Honda Accord) 16 20
Truck/Van (Dodge Ram) 13 21
1 kWh = 1 lb of CO2

American Samoa Teacher’s Guide Grades 7-12
16
Section 1. 1) How many people live in your home?
2) How much electricity does your household use every month? *Note: Check your house's ASPA bill. Write down the number of kilowatt‐hours (kWh) used.
3) Does your household use natural gas? Yes No
If "Yes," how much does your household use every month? *Note: Check your ASPA bill. Write down the number of dollars spent on natural gas.
4) How many vehicles does your
family have?
5) What types of vehicles does your family have, and approximately how many miles do you drive
each vehicle per week? *Note: A Toyota Corolla is an example of a compact car, and a Honda Accord is an example of a Full Size Car.
Vehicle 1: Compact Car Full Size Car Truck/Van
# of miles Vehicle 1 is driven per week:
Vehicle 2:
Compact Car
Full Size Car
Truck/Van
# of miles Vehicle 2 is driven per week:
Vehicle 3:
Compact Car
Full Size Car
Truck/Van
# of miles Vehicle 3 is driven per week:
Section 2.
Use the following chart to answer Question 4.
Vehicle Type Miles per Gallon Pounds CO2 per Gallon Compact Car (ex. Toyota Corolla) 24 20 Full Size Car (ex. Honda Accord) 16 20 Truck/Van (ex. Dodge Ram) 13 21
6) Divide the number of miles each vehicle is driven per week (Question #5) by the "Miles per Gallon"
listed in the chart above to determine the number of gallons used per week. Next, multiply this answer by the "Pounds CO2 per Gallon" to determine pounds of CO2 released each week. Multiply this number by 52 to determine the yearly emissions for each vehicle.
Vehicle 1: # of Miles (________) ÷ Miles per Gallon (_______) = _________ Gallons per Week
Carbon Footprint Worksheet
Name: Date:

American Samoa Teacher’s Guide Grades 7-12
17
Gallons per Week (_______) x Pounds CO2 per Gallon (_______) = _______Pounds CO2 per Week
Pounds of CO2 released per week (_______) x 52 weeks per year = _______ Pounds CO2 per Year
Vehicle 2: # of Miles (________) ÷ Miles per Gallon (_______) = _________ Gallons per Week
Gallons per Week (_______) x Pounds CO2 per Gallon (_______) = ______ Pounds CO2 per Week
Pounds of CO2 released per week (_______) x 52 weeks per year = _______ Pounds CO2 per Year
Vehicle 3: # of Miles (________) ÷ Miles per Gallon (_______) = _________ Gallons per Week
Gallons per Week (_______) x Pounds CO2 per Gallon (_______) = ______ Pounds CO2 per Week
Pounds of CO2 released per week (_______) x 52 weeks per year = _______ Pounds CO2 per Year
Section 3.
Each kilowatt‐hour of electricity used creates approximately 1 pound of carbon dioxide. Multiply the number of kilowatt‐hours of electricity your household uses each month (the answer to Question #2 above) by 12 to determine the pounds of carbon dioxide your household generates each year from electricity use.
7) Kilowatt‐hours of electricity used per month (________) x 12 = ________ Pounds CO2 per Year
For each dollar spent on natural gas, approximately 8.5 pounds of carbon dioxide are emitted. Multiply the amount of money your family spends on natural gas each month (the answer to Question #3 above) by 8.5 to determine the pounds of carbon dioxide your household generates each month from natural gas use. Then multiply this number by 12 months to get the pounds of carbon dioxide per year.
8) Dollars spent on natural gas per month (________) x 8.5 = ________ Pounds CO2 per
Section 4.
Add up the "Pounds CO2 per Year" your household generates from each vehicle, electricity, and natural gas use. Divide this number by the number of people that live in your home (the answer to Question #1 above) to determine your personal carbon footprint.
Total Pounds CO2 per Year (________) ÷ Number of people living in your home (________) =
Your Carbon Footprint:________ Pounds CO2 per Year
American Samoa Teacher’s Guide Grades 7-12
18
LESSON 3: OCEAN ACIDIFICATION OBJECTIVE: Students will learn that some of the extra atmospheric CO2 is being absorbed by the oceans,
and that this extra CO2 can cause oceans to become more acidic. These points will be illustrated through
two experiments. VOCABULARY: Reservoir, Carbon Cycle, Saturation, Acidic, Basic, pH Scale, Ocean Acidification Carbonic Acid PRESENTATION 3A:
• As we discussed earlier, oceans are considered a “sink” of carbon dioxide. In fact, the ocean is
the largest reservoir of carbon dioxide on the planet and capable of absorbing great amounts of
CO2 from the atmosphere. Reservoirs are places where carbon is stored on earth, such as in the
atmosphere, oceans, and in plants and sediments on land. Carbon Dioxide is constantly cycled
between the oceans, land, and atmosphere. This movement is known as the carbon cycle.
• Oceans absorb large amounts of CO2 from the atmosphere because the gas pressure of CO2 is
often less in the ocean than the gas pressure of CO2 in the air. Human activities have released more
CO2 into the atmosphere so that the pressure of CO2 in the atmosphere has increased, which
allows more carbon dioxide to disperse into the oceans. However, some scientists believe
that the oceans are reaching saturation, which is the limit beyond which oceans will no longer
be able to take up more CO2. This may increase global warming because more carbon dioxide
will stay in the atmosphere and increase the greenhouse effect. A good way to describe
saturation is to have students think about what it is like when they eat candy. At first it is
really tasty and they want to eat lots and lots. However, at a certain point, they might start to
feel sick and not want to eat any more.
• Cold polar waters are capable of absorbing more excess CO2 from the atmosphere than
warmer tropical waters. This is because gases are more easily dissolved in cool water.
ACTIVITY 3A: WATER ABSORBS CO2 FROM THE AIR Materials: Two 1‐ liter plastic bottles; CO2 bottle or 2 sodas/mineral waters; rubber tubing; cold
water; warm water (not hot). In Class:
1. Tell students that they will observe how water absorbs CO2 from the air, and
compare absorption by cold and hot water. 2. Fill both plastic bottles about ¼ full of water: one with warm water and one with cold water 3. Add equal amounts of carbon dioxide to both bottles by using the CO2 bottle, or by
shaking a soda/mineral water bottle and using the rubber tubing to transfer it to a plastic
bottle.
4. Cap both bottles and shake them vigorously for the same amount of time. 5. Have students make observations about what happens to the bottles (the sides of the
bottles are sucked inwards).

American Samoa Teacher’s Guide Grades 7-12
19
Follow‐up:
• Discuss with the class why the sides of the bottle were sucked inwards. This happens because
the water absorbs the carbon dioxide gas from the air, so the gas volume inside the bottle
decreases. This is a rough approximation of what happens to some of the CO2 in the atmosphere
(it is absorbed by the oceans). Shaking the bottle makes more water surface area available to absorb the carbon dioxide gas from the air, so the absorption happens more
quickly (and is, therefore, easier to observe). Cold water absorbs more CO2 than warm water, so this bottle is sucked inwards more.
• Remember, although the oceans take up CO2, with more and more being taken up every
day, they may reach saturation and not be able to absorb more. PRESENTATION 3B:
• What is an acid? Substances can be either acidic or basic. Acidic things include lemons,
vinegar, and some basic things include soap and detergents. The pH scale is used to measure
how acidic or basic a substance is. It ranges from 0 to 14, with 7 being neutral, less than 7
being acidic, and greater than 7 being basic. • Draw this diagram on the board:
• Each number on the pH scale is an order of magnitude different (which means ten times greater or less)
than the ones next to it. Therefore, each pH value below 7 is ten times more acidic than the next higher
value. For example, a pH of 4 is ten times more acidic than a pH of 5, while a pH of 3 is ten times more
acidic than a pH of 4, and 100 (10 x 10) times more acidic than a pH of 5.
Similarly, a pH of 9 is ten times more basic than a pH of 8, while a pH of 10 is ten times more
basic than a pH of 9 and 100 times more basic than a pH of 8. Therefore, some things are
much more acidic or basic than others. Pure water is neutral and ocean water is slightly basic
(around a pH of 8).
• Have the class guess the pH of other common substances: lemon Juice‐2, black coffee‐5, urine‐6, baking soda‐9, soapy water‐12, bleach‐13.
• We’ve already observed how the ocean can absorb CO2 from the atmosphere and discussed
how the oceans absorb greater amounts of CO2 when more is present in the atmosphere.
This can cause ocean acidification, which is a secondary impact of climate change. Ocean
acidification is the decrease in the pH of the world’s oceans, due to their absorption of
excess carbon dioxide from the atmosphere.
• When CO2 dissolves in the ocean it reacts with seawater to create what is known as carbonic
acid. This is the same acid that is used for carbonation in soft drinks. Although it naturally
forms in the ocean, with higher levels of CO2 more acid is produced, which causes the ocean
to become more acidic. In fact, since the industrial revolution, the ocean’s pH has decreased
from 8.179 to 8.069. While this decrease of 0.11 does not look like a lot, because the
numbers on the pH scale are different from one another by an order of magnitude, this
change means that the ocean has gotten 30% more acidic. Scientists project that this increase
in acidity will continue, which may have consequences for marine life and corals.

American Samoa Teacher’s Guide Grades 7-12
20
ACTIVITY 3B: CARBON DIOXIDE MAKES WATER MORE ACIDIC Materials: Three wide‐mouth, clear containers, preferably with screw caps (large peanut butter or
jelly containers with labels removed work well); drinking straw; pH indicator solution; pH indicator
strip (this is not entirely necessary since the indicator solution shows a very general pH, but they are
useful for providing a more accurate pH reading); pipette or medicine dropper; floating candle;
matches or lighter; seawater (enough to fill each jar about ½ full); Acidification Worksheet.
Note: If enough materials are available, this activity can be done by the students in groups of 2‐4, with one set of materials per group.
Pre‐ class preparation:
• If necessary, remove labels from plastic bottles by soaking them in water. In Class:
1. Tell students that they will observe and measure how carbon dioxide can increase the acidity
of seawater. They will introduce CO2 both directly into the water, and into the air above it. 2. Explain that you will measure the approximate acidity of the water by using a pH indicator strip, which
turns different colors depending on the pH of the substance. Students will also be able to observe
changes in pH by adding an indicator solution, which turns yellow when water is acidic.
3. Fill all three containers approximately half full of seawater. Cut or tear out the labels
provided on the Acidification Worksheet (Control, Container #1, Container #2). Use them to
label the containers.
4. Measure the starting pH of all three containers. Dip a pH indicator strip into the water for 1 – 2 seconds
and compare the color to the provided color chart to determine the approximate pH.
5. Record these numbers in the “Before” column in the pH Chart provided on the Acidification Worksheet.
6. Use pipette or medicine dropper to add several drops of indicator to the water until they are the same
shade of green/blue. Be sure to add the same amount of indicator to each container.
7. Screw the cap on the container labeled “Control” and set aside. You may want to review the
concept of setting a control with the class. Discuss how the Control Container will be used
as a basis of comparison.
8. Use the straw to blow air (i.e. add CO2) into the seawater in Container #1. Blow until
the indicator changes from green to yellow (basic to acidic). 9. Measure the pH using a pH indicator strip and record in the “After” column in the pH
Chart provided on the Acidification Worksheet. 10. Screw the cap onto Container #1 and set aside. Observe how much the color of the
water changed by comparing it to the Control Container. 11. Point out that, although this demonstrates the concept that CO2 can increase ocean acidity,
we will not be blowing, or pumping, carbon dioxide directly into the ocean from the
atmosphere. Therefore, we will conduct a second test to see what happens when carbon
dioxide increases in the air above the water. 12. We will use a floating candle to represent human emissions into the atmosphere. 13. Place the floating candle in Container #2 and light it. 14. Screw the cap onto Container #2 and place it next to the Control Container (for easy
comparison). *Note the candle will go out once all the oxygen inside the container is
consumed. This is supposed to happen.
15. The pH will decrease much slower in this experiment, so it is best to let Container #2 sit for an hour before measuring the “After” pH.
16. Every 15 minutes, have students observe to see if there is any change in the indicator color
by comparing it to the color of the Control Container.
American Samoa Teacher’s Guide Grades 7-12
21
17. Finally, after an hour, measure the pH of Container #2 and record it in the “After” column of
the pH Chart. 18. Re‐measure the pH of the Control Container for comparison and record this number as well.
Follow‐up:
• Discuss with the class the difference between the containers.
• Explain that the water in the Container #1 changed color to yellow quickly because, by
directly adding CO2, you made the water acidic with carbonic acid.
• In Container #2, it took longer for the pH to decrease because the CO2 was added to the air
rather than directly into the water. This is more representative of the actual earth system
and what is currently happening with ocean acidification.
• Remind students that the point of this experiment was to show that ocean acidification can
occur with higher levels of CO2 in the atmosphere, and that even small decreases in pH lead to large increases in acidity
American Samoa Teacher’s Guide Grades 7-12
22
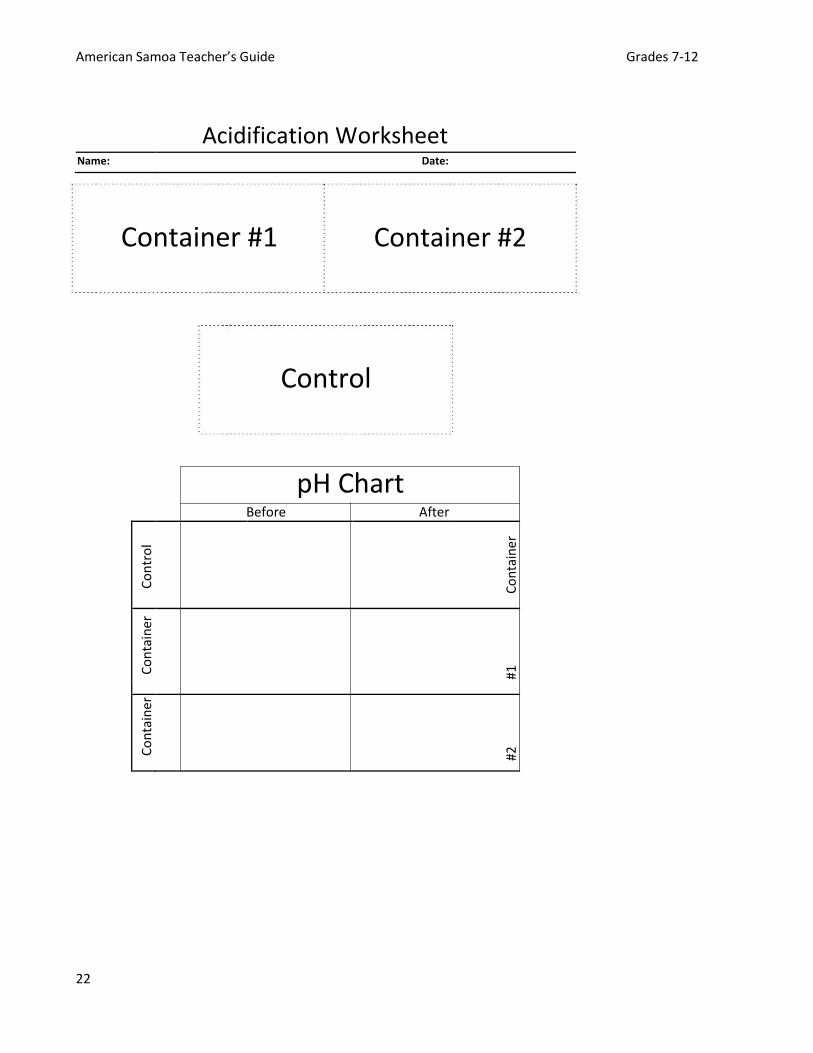
Acidification Worksheet
Name: Date:
Container #1 Container #2
Control
pH Chart
Before After
Co
ntr
ol
Co
nta
iner
Co
nta
iner
#1
Co
nta
iner
#2
American Samoa Teacher’s Guide Grades 7-12
23
LESSON 4: OCEAN WARMING AND CORAL BLEACHING OBJECTIVE: Students will learn more about the structure of coral, the importance of their symbiotic algae, and how ocean warming due to climate change can cause corals to bleach. VOCABULARY: Specific Heat Capacity, Polyp, Zooxanthellae, Symbiotic Relationship, Nematocysts, Coral Bleaching PRESENTATION 4A:
• In addition to causing atmospheric temperatures to rise, climate change can also lead to
ocean warming.
• Oceans have a high specific heat capacity. This is the amount of energy required to raise the
temperature of a substance by one degree. A high specific heat capacity means that it takes a
lot of heat to raise the temperature of water even a little bit. Therefore, the ocean can
absorb a lot of heat before its temperature rises.
• Because of this, there is a lag time between when extra CO2 is added to the atmosphere
and when changes are observable in the ocean’s temperature. The effects of human
activities are not instantly noticeable. • Still, because water is a naturally capable of absorbing heat, extra CO2 and heat in
the atmosphere will mean more heat in the oceans. • On the same note, even if all inputs of CO2 to the atmosphere stopped today, because of
the ocean’s ability to hold heat, it would take a long time for the ocean’s temperature to
decrease again.
• Scientists believe that oceans are already warmer than they were historically. This is a big
deal because the ocean covers 70% of the earth’s surface and can absorb a lot of heat
• It is interesting to point out that, because colder waters absorb more CO2 than warm
waters (as discussed earlier), warmer oceans in the future may not be able to absorb as
much CO2 from the atmosphere, which may increase the greenhouse effect.

American Samoa Teacher’s Guide Grades 7-12
24
ACTIVITY 4A: THE SPECIFIC HEAT CAPACITY OF WATER Materials: A pack of latex party balloons (white or clear is good so that students can see inside the balloon);
food coloring (optional, to make water easier to see); a small candle (a votive candle is best because it is
difficult to knock over); tap water; matches or lighter; fire extinguisher (precautionary). In‐Class:
1. Explain to students that you will demonstrate how water has a natural ability to absorb heat. 2. Choose 2 balloons. Inflate the first with air. If desired put a few drops of food coloring in the
second balloon, then fill it with water until it is approximately the size of a grapefruit (this
requires stretching the mouth of the balloon over the tap, and may need to be done prior to
class if there is no sink in the classroom). Now inflate the water balloon until it is the same
size as the first. 3. Light the candle. 4. Ask the class what they expect will happen to the air‐only balloon when it touches the
candle flame. After they have come up with an answer, warn students that the balloon will
pop and that they may want to cover their ears. 5. Hold the air‐only balloon over the flame. It will pop almost instantly. 6. Now, show the class the water‐filled balloon and ask them what they expect to happen
when it touches the candle flame. 7. Hold the water‐filled balloon over the candle. Be sure that the flame is only touching the part
of the balloon that is filled with water by lowering it over the candle (if the flame touches
sides of the balloon where there is air, it will pop). 8. Show the class that the balloon does not pop. Remove the balloon from the flame. The
black mark on the bottom of the balloon is not a burn mark, but is soot from the candle.
You can demonstrate this fact to the students by rubbing your finger over the mark.
Note: This activity should only be conducted as a demonstration. Be sure to highlight the
safety precautions you are taking and remind students to not conduct this experiment
without adult supervision. Follow‐up:
• Ask students why they think the balloon with the water did not pop.
• Explain that water has a higher specific heat capacity than air. The air in the first balloon
quickly heated up, which caused the latex to melt and the balloon to pop. In contrast, the
water inside the balloon absorbed the heat from the candle and transferred it away from
the latex. This prevents the latex from heating up enough to melt, so the balloon does not
pop.
• Relate this activity back to climate change. Because water has a high specific heat capacity,
it takes a lot of heat to raise the temperature of the oceans. But, because of human‐caused
climate change, warming trends in tropical oceans have already been observed. It is
important to emphasize that the oceans are huge and the fact that we have seen warming
means that considerable warming has occurred.
• Because oceans are naturally able to absorb heat, a consistently warmer atmosphere will also mean a warmer ocean.
American Samoa Teacher’s Guide Grades 7-12
25
PRESENTATION 4B:
• Corals naturally live in warm, shallow ocean waters, like those in the South Pacific Ocean around American Samoa. But, if waters get too warm, they are unhappy.
• It is important to understand a little more about the structure of coral to understand the
effect that warmer oceans may have.
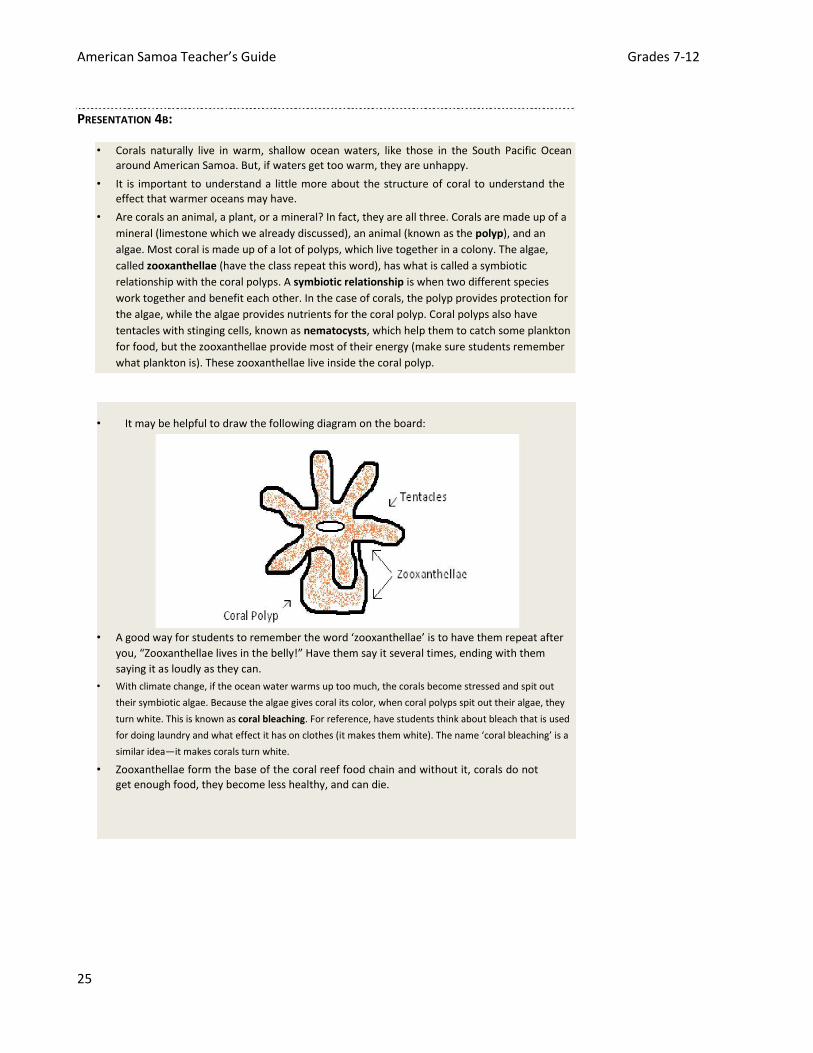
• Are corals an animal, a plant, or a mineral? In fact, they are all three. Corals are made up of a
mineral (limestone which we already discussed), an animal (known as the polyp), and an
algae. Most coral is made up of a lot of polyps, which live together in a colony. The algae,
called zooxanthellae (have the class repeat this word), has what is called a symbiotic
relationship with the coral polyps. A symbiotic relationship is when two different species
work together and benefit each other. In the case of corals, the polyp provides protection for
the algae, while the algae provides nutrients for the coral polyp. Coral polyps also have
tentacles with stinging cells, known as nematocysts, which help them to catch some plankton
for food, but the zooxanthellae provide most of their energy (make sure students remember
what plankton is). These zooxanthellae live inside the coral polyp.
• It may be helpful to draw the following diagram on the board:
• A good way for students to remember the word ‘zooxanthellae’ is to have them repeat after
you, “Zooxanthellae lives in the belly!” Have them say it several times, ending with them
saying it as loudly as they can.
• With climate change, if the ocean water warms up too much, the corals become stressed and spit out
their symbiotic algae. Because the algae gives coral its color, when coral polyps spit out their algae, they
turn white. This is known as coral bleaching. For reference, have students think about bleach that is used
for doing laundry and what effect it has on clothes (it makes them white). The name ‘coral bleaching’ is a
similar idea—it makes corals turn white.
• Zooxanthellae form the base of the coral reef food chain and without it, corals do not
get enough food, they become less healthy, and can die.
American Samoa Teacher’s Guide Grades 7-12
26
ACTIVITY 4A: CORAL POLYP FEEDING GAME Materials: A box of Fruit Loops; small paper Dixie Cups (enough so that each student has one). In‐Class: (This activity is best conducted outdoors)
1. Have students stand in a large group, facing the teacher. 2. Explain to the students that they are going to pretend that they are a healthy coral reef.
Each student is now a polyp and the whole class is “underwater”. 3. Ask students to remind you how coral polyps get their food (they should say by algae/
zooxanthellae, and by their tentacles. You may need to ask questions to lead them to
this correct answer). 4. Remind students the corals get the majority of their food from the zooxanthellae. 5. Pass out a small Dixie Cup full of Fruit Loops to each student (tell them not to eat it yet).
Have them hold the cup in front of their stomachs. This represents the food provided to the
coral by the zooxanthellae. 7. Have students hold their other hand up into the air to represent the coral polyp’s
tentacles. Tell students that there is plankton in the water, and that they should try to
catch them with their “tentacles”. (It may be necessary to remind students that coral
polyps do not push each other to get their food.) 8. Throw several handfuls of Fruit Loops into the air, over the group of students. The students
should try to catch them with their one extended hand. (Do not let students pick cereal up
from the ground. Tell them that a coral polyp would not be able to do that). Follow‐up:
• Ask students how mach “plankton” (i.e. Fruit Loops) they caught from the “water”. Ask if they got more
food by catching it with their tentacles, or from their zooxanthellae (i.e. the Dixie Cup).
• Students should not be very successful at catching Fruit Loops with one hand. Remind them that zooxanthellae are very important for corals to live.
• Now, ask the students to remind you what happens when corals get stressed by ocean water that is too
warm (coral bleaching happens, where corals spit out their zooxanthellae). Tell them that this would be
like if you came around and collected all the Dixie Cups full of Fruit Loops. Ask them what effect this
might have on a coral polyp (i.e. Do you think you would be hungry?).
• Remind students that in the oceans, when corals bleach, they can die.
• Tell students they can now eat the Fruit Loops from their Dixie Cups. You may want to have them help you pick up the Fruit Loops from the ground to throw away.
American Samoa Teacher’s Guide Grades 7-12
27
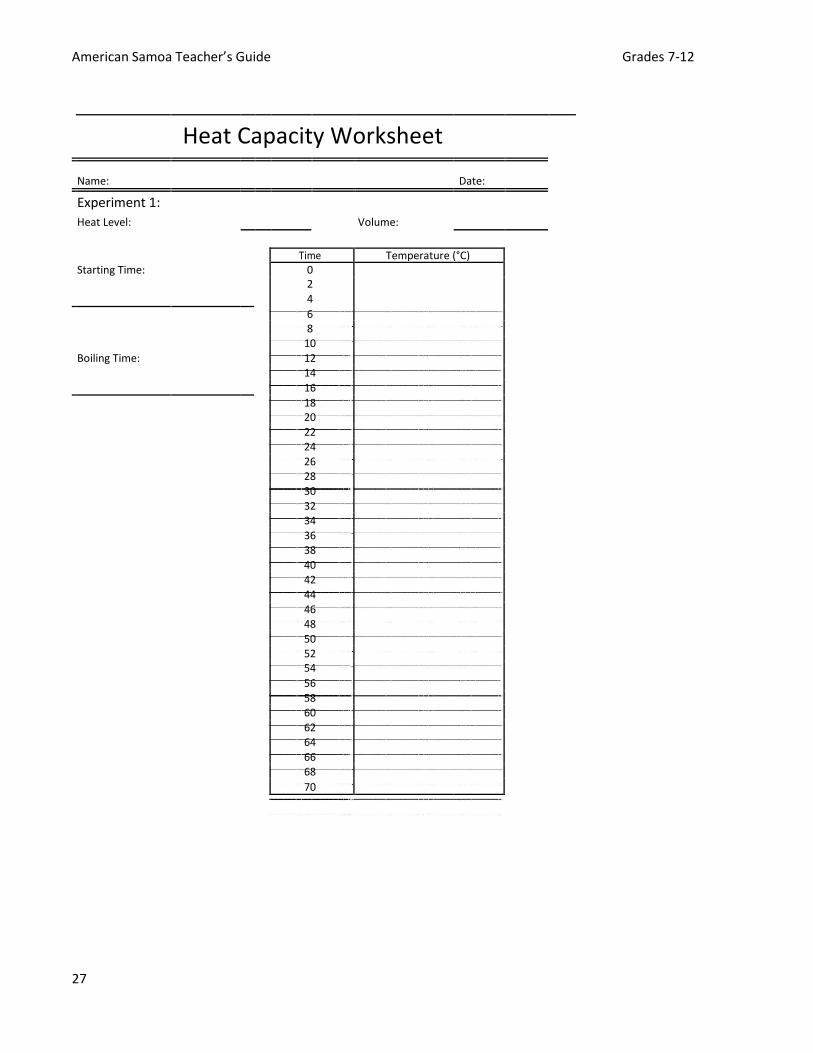
Heat Capacity Worksheet
Name: Date:
Experiment 1:
Heat Level: Volume:
Time Temperature (°C)
Starting Time: 0
2
4
6
8
10
Boiling Time: 12
14
16
18
20
22
24
26
28
30
32
34
36
38
40
42
44
46
48
50
52
54
56
58
60
62
64
66
68
70
American Samoa Teacher’s Guide Grades 7-12
28
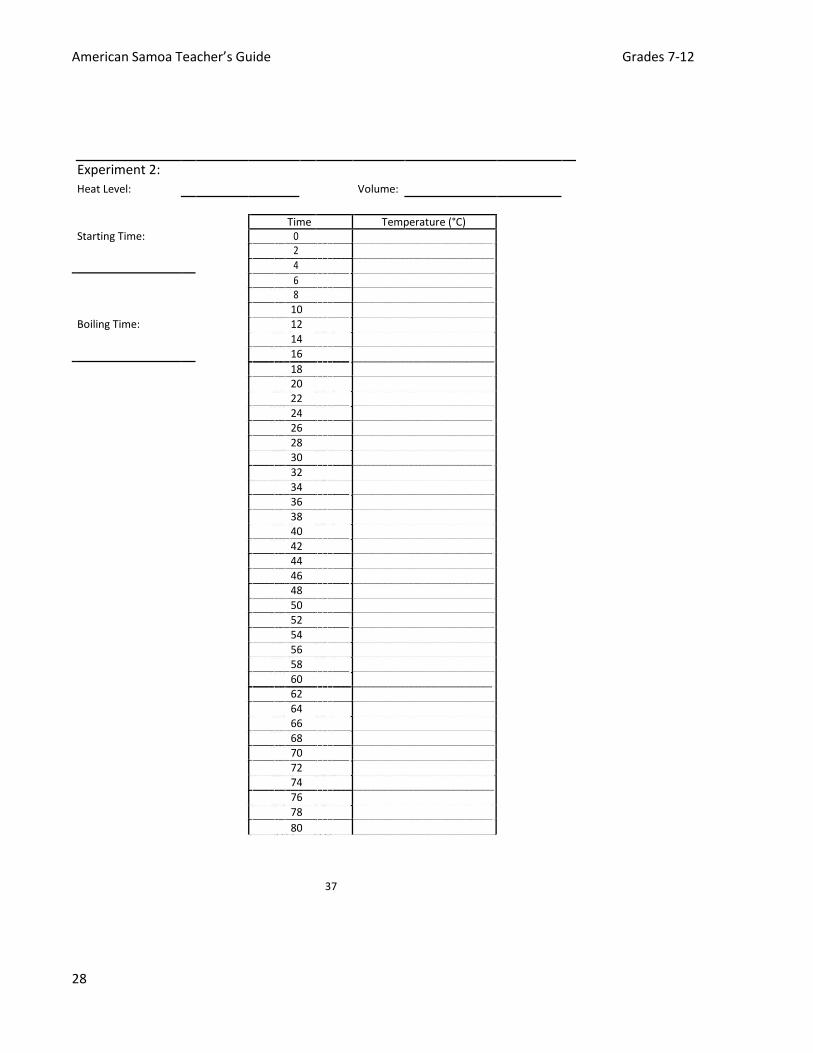
Experiment 2:
Heat Level: Volume:
Time Temperature (°C)
Starting Time: 0
2
4
6
8
10
Boiling Time:
12
14
16
18
20
22
24
26
28
30
32
34
36
38
40
42
44
46
48
50
52
54
56
58
60
62
64
66
68
70
72
74
76
78
80
37

American Samoa Teacher’s Guide Grades 7-12
29
American Samoa Climate Change Teacher’s Guide Grades 10 – 12
80
78
76
74
72
70
Tim
e
62
6
4 6
6
68
ove
r
54
56
58
6
0
Tem
per
atu
re
36
38
40
42
44
46
48
50
52
Tim
e (M
inu
tes)
Wat
er
26
28
30
32
34
V
olum
e 2:
in
22
24
Ch
ange
8
10
12
14
16
18
20
Vol
um
e 1:
6
Key
2
4
0
1 0 0 96
92
88
84
80
76
72
68
64
6 0 56
52
48
44
40
36
32
28
24
20
16
12
8 4
Temperature (°C)
38
American Samoa Teacher’s Guide Grades 7-12
30
LESSON 5: CLIMATE CHANGE AND SEA LEVEL RISE OBJECTIVE: Students will learn two ways that climate change can cause sea level to rise, and the potential impacts of sea level rise to an island community. VOCABULARY: Glacier, Ice Sheet, Thermal Expansion PRESENTATION 6:
• Another side effect of increasing global temperatures is sea level rise. • How do warmer temperatures cause the sea level to rise? There are 2 ways.
• 1) Warmer temperatures cause glaciers and ice sheets to melt. Glaciers are giant masses of ice that move
over land. Ice sheets, also known as continental glaciers, are massive glaciers that cover over 20,000
square miles of land. The Antarctic Ice Sheet is the largest in the world, which holds about 90% of the
fresh water on earth’s surface. If it gets too hot, glaciers and ice sheets will melt, which will add large
amounts of water to the ocean. Scientists estimate that if the Antarctic Ice Sheet melted completely, sea
level would rise by about 200 feet.
• Unlike glaciers and ice sheets, melting sea ice (ice that floats in the ocean, like giant ice
cubes) will not cause sea level to rise. This is because the amount of water created when
the sea ice melts is exactly the volume that was previously displaced by the ice. Water
cannot exist in the same place where the ice, so it moves out of the way, or is displaced.
• 2) The second way that warmer temperatures can cause sea level to rise is by thermal
expansion in the oceans. This thermal expansion occurs because when water absorbs heat,
its volume increases. (Remind students that we already discussed that, even though water
has a high specific heat capacity, oceans can absorb heat).
• Tell students that they have all most likely experienced this thermal expansion. Discuss how
there is a lot of water in the human body, and when we get hot, things like our fingers and
feet expand a little bit. Tell students to think about what happens when they wear rings or
how their feet feel in their sneakers after they have been playing sports.
• The Intergovernmental Panel on Climate Change (IPCC) estimates that sea level could rise between 0.6 and 2 feet or more in the next century.
• Sea level rise will impact American Samoa and other South Pacific islands by causing
increased coastal erosion, and flooding of low‐lying homes, villages and roadways. In
American Samoa, like other small tropical islands, our freshwater comes from underground
and could be contaminated by salt water from a higher sea level.
• Coral reefs help protect coastal areas from erosion. (Point out that waves break offshore,
instead of directly onto the seawall, because of corals). Therefore, if coral reefs are weak
and dying, the impacts of sea level rise could be worse. ACTIVITY 6A: GLOBAL WARMING CAUSES SEA LEVEL RISE
39

American Samoa Teacher’s Guide Grades 7-12
31
American Samoa Climate Change Teacher’s Guide Grades 10 – 12
Materials: A wide mouth, clear, container with screw‐top; hot plate (or other heating source); large
pot; ice cubes in a small bowl; tap water; blue food coloring; clear ruler; clear tape; narrow, clear
straw; clay; thermometer; Sea Level Rise Worksheet.
Note: If enough materials are available, this activity can be done by the students in groups
of 3 or 4, with one set of materials for each group except for the hot plate and large pot. All
handling of the hot plate will be conducted by the teacher in this activity. Be sure to give a
safety briefing about the dangers of the hot plate and handling hot substances. Pre‐Class Preparation:
• Prior to class, the teacher should make a hole in the screw‐top to fit the narrow straw, and
seal it with clay. If this activity will be done in smaller groups, all of the screw‐tops should be
prepared for each group. In‐Class:
1. Explain to students that they will observe the two ways that warmer temperatures will cause
sea level to rise. First, they will look at the difference between melting sea ice and glaciers,
and their effect on sea level. 2. To begin, tape the ruler to the clear container so that the numbers are clearly visible, and
water level can be measured without touching the container. 3. Place half of the ice cubes in the clear container. Allow the rest of the ice cubes to remain in
the bowl on the table.
4. Fill the clear container (where you have just placed several ice cubes) with water until the
container is about 2/3 full, and add several drops of food coloring to make the water line
more visible. 5. Immediately observe the height of the water in the container by looking at the ruler, and
record this number on the Sea Level Rise Worksheet. 6. Take the temperature of the water for reference, and also record it on the Sea Level
Rise Worksheet.
7. Explain to students that the clear container represents the ocean, the floating ice cubes represent
sea ice, and the ice cubes in the bowl represent glaciers and ice sheets on land.
8. Based on the lesson just given, ask students to predict what they think will happen to the water level when the ice melts.
9. Allow the ice cubes in the clear container to melt and have students again record the water
level. Once they have had an opportunity to make their own observations, discuss as a class
what happened to the water level (it should be the same level: floating sea ice on the ocean
will not raise the sea level when it melts).
10. By now, the remaining ice cubes in the bowl should have also melted. Remind students that this represents ice which was on land that has melted because of global warming.
11. Ask students what they think will happen to the ice that melts on land (it will run off into
the oceans).
40
American Samoa Teacher’s Guide Grades 7-12
32
12. Pour the melted ice water into the clear container, explaining that this represents melted
glacier water that is running off into the oceans.
13. Again, have students make note of the water level and record it on the Sea Level Rise Worksheet. Also, record the temperature again for reference.
14. Ask students what happened to the “sea level.” It will have risen because more water
entered the “ocean.” Follow‐up:
• What are the two ways that global climate change leads to sea level rise?
• Remind students that this experiment is a very small scale model of what will happen with
sea level rise. Although only small changes were observed in class, in reality glaciers and ice
sheets hold large amounts of water, and the ocean has a lot of volume which can thermally
expand and raise the sea level. • Again, discuss the possible consequences of a higher sea level.
ACTIVITY 5B: SHORELINE TUG‐OF‐WAR Materials: A strong rope that is long enough for tug‐of‐war (you may want to tie a piece of
colored fabric or use colored tape to mark the middle). In‐Class: (This activity is best conducted outdoors)
1. Describe how corals are important to buffer wave energy to protect the shoreline from erosion. Have
students imagine that the rope represents the shoreline/sediment on the coast.
2. Divide class into two teams: the Mighty Waves and the Colossal Corals. Have each team stand next to the rope, alternating sides.
3. Play tug‐of‐war. The teams should be well matched, so that the center of the rope doesn’t
move too much. Stop the game, and have the students place the rope back on the ground
(they will listen better if they are not holding the rope). 4. Talk about how, in a healthy tropical ecosystem, the corals effectively protect the shoreline
from erosion by wave action. This is illustrated by the fact that the rope, i.e. the shoreline, did
not move very much. 5. Next, tell the students that climate change weakens the Colossal Corals and some of them
die. Move a few students onto the Mighty Waves team, to signify that the corals have
gotten weaker.
7. Play tug‐of‐war again. This time the Waves should win by a little bit. Stop the game, and ask
the students why the Mighty Waves won. Tell the students that because the Coral was
weakened, the Waves were able to pull the sediment (i.e. the rope) into the ocean. Then,
tell students that more global warming causes sea level to rise. Move more Coral students
to the Waves team and play again. Stop the game and discuss how a higher sea level and
more waves lead to talk about more erosion. 8. Finally, talk about how people in American Samoa are working to protect corals and make
them healthy. Therefore, the Colossal Corals get stronger. Move several students back from
the Wave team to the Coral team and play again. This time the Colossal Corals should win.
Discuss that healthy corals may resist the effects of warmer water and bleaching, and help
protect the coastline from sea level rise and erosion.
American Samoa Teacher’s Guide Grades 7-12
33
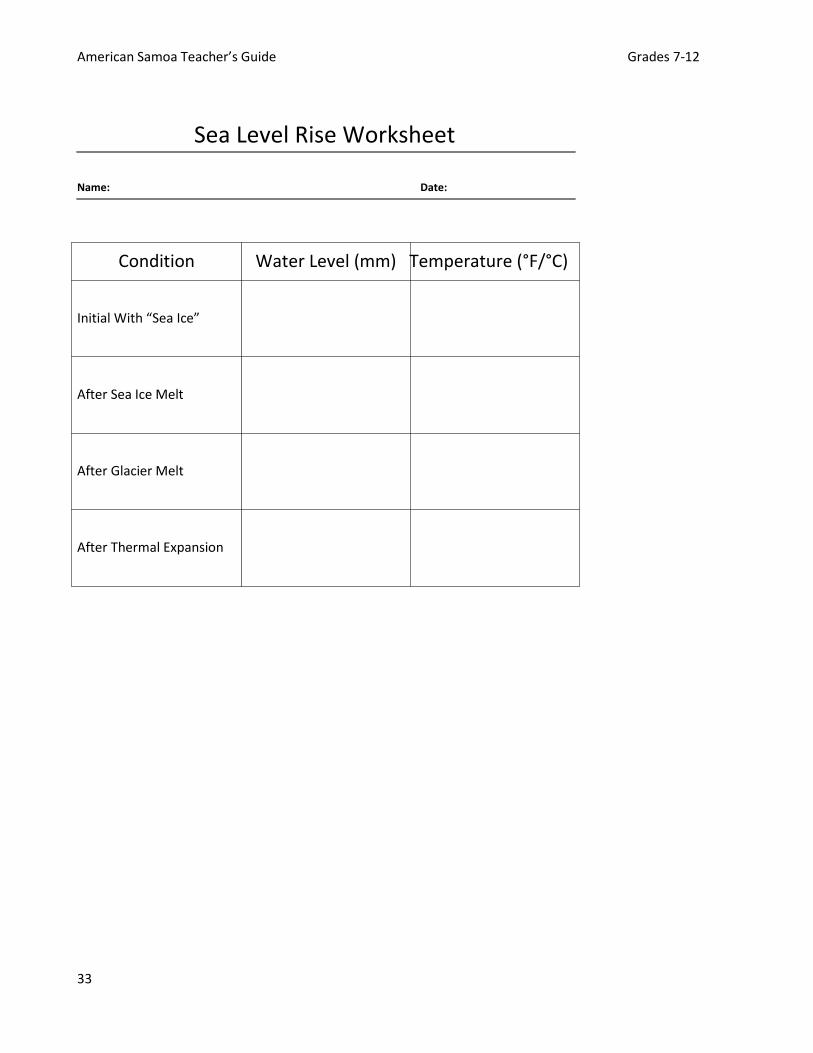
Sea Level Rise Worksheet Name: Date:
Condition Water Level (mm) Temperature (°F/°C)
Initial With “Sea Ice” After Sea Ice Melt After Glacier Melt After Thermal Expansion

American Samoa Teacher’s Guide Grades 7-12
34
LESSON 6: PROTECTING CORALS FROM CLIMATE CHANGE OBJECTIVE: Teach students ways that they can make a difference and protect coral reefs from climate change. This lesson includes an activity that recaps what they have learned in the previous climate change classes. VOCABULARY: Mitigation, Adaptation, Resilience PRESENTATION 6:
• We have spent the past several lectures discussing climate change and its impacts on coral reefs.
• In particular, ocean acidification, warmer oceans, and sea level rise will all have consequences for American Samoa.
• Luckily, it is not all hopeless. There are options for responding to climate change. In particular,
humans can oppose climate change through mitigation and adaptation. Mitigation deals
with the cause of climate change by reducing CO2 and other greenhouse gas emissions.
Meanwhile, adaptation involves coping with the effects of climate change by taking steps to reduce the vulnerability of our communities.
• What are some ways that we can mitigate climate change or, in other words, reduce our CO2
emissions? Have students brainstorm ideas. Some examples include: driving less, walking and
riding bikes more, using less electricity, and turning the lights off when you leave a room.
• Because American Samoa is an island, most of what we use must be shipped by boat or
plane. This releases a lot of carbon dioxide into the atmosphere. Therefore, another way to
reduce your carbon footprint is to eat more food that is grown locally.
• What about ways that we can adapt to climate change or, in other words, protect our
communities? Have students brainstorm ideas. One way, which has already been done in
American Samoa, is to install a seawall to protect the shoreline from sea level rise and
erosion. Protecting and planting coastal trees, such as mangroves, can also protect the
coast. Keeping the natural ecosystems, such as coral reefs, healthy is another way to help
defend your community against the effects of climate change.
• The best way to protect corals is to keep them healthy in the first place. Besides climate
change, other threats to coral reefs include overpopulation, fishing pressure, and land‐based
sources of pollution.
• Reducing the impacts of these threats will help keep corals strong and better able to
withstand ocean acidification and warming. The ability to recover from and adjust to a
change is known as resilience. If American Samoa’s coral reefs are resilient, they will have a
better chance of surviving the unavoidable consequences of climate change.
• What are some ways that we can improve coral reef resilience? We can improve coral reef resilience in
several ways. First we can keep the water clean by not throwing trash on the ground, because it will
end up as pollution in the ocean. We can also improve water quality by reducing pollution from
piggeries. Several new management measures exist which will help
44

American Samoa Teacher’s Guide Grades 7-12
35
American Samoa Climate Change Teacher’s Guide Grades 10 – 12
improve the operation of piggeries. It is also important not to stand or walk on live corals, which can harm the polyps.
• For more information on improved piggery practices in American Samoa, see:
http://www.samoanews.com/viewstory.php?storyid=13539&edition=1268820000 or
http://www.samoanewsonline.com/publicviewstory.php?storyid=6510&newspaperid=189
for reference.
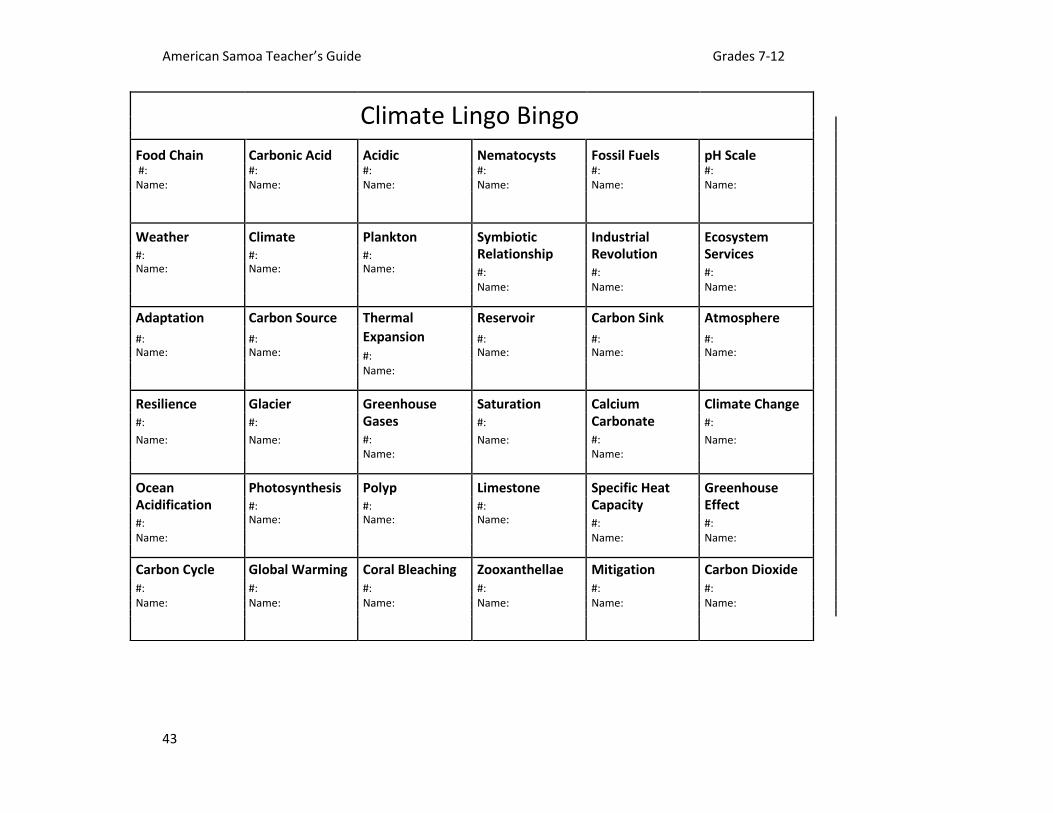
ACTIVITY 6: CLIMATE LINGO BINGO Materials: Definition cards; bingo cards (one for each student); paper clips; pencils/pens for the students; answer sheet for the teacher. Pre‐Class Preparation:
• Cut out the definition cards.
• Print out enough bingo cards so that each student in the class will have one. Note that there are a few different bingo cards.
• Attach one definition card to the back of each bingo card using a paper clip (the definition should
face outwards). If there are more definition cards than students, tape the remaining definition cards
to the chalkboard. If there are more students than definition cards, make duplicates of a few of the
definition cards and paper clip them to the bingo cards.
• It may be helpful to move desks to the sides of the room, or to play this game outside. In Class:
1. Tell students you are going to play a version of bingo, using the vocabulary that they
have learned over the past few climate change lessons.
2. The purpose of the game is to be the first student to fill in a horizontal, vertical, or diagonal row (Or, you
can choose to play where the first student to fill in their entire card is the winner).
3. Give each student a bingo card with the attached definition card. Point out that each
definition card has a number. Explain to the students that their job is to match the words on
their bingo cards with their definition by writing down the correct number. Students will
need to walk around the classroom and read the definitions on the back of their classmates’
cards in order to complete the game. When a definition matches one of their bingo card
words, the student should write down the person’s name and the definition number in the
correct spot on their bingo card. You should note that they will not find the answers to every
definition on their card (there are 40 vocabulary words and only 36 spaces on their card).
4. The game ends when a student has filled in a full horizontal, vertical or diagonal row (or the entire card), and shouts “Climate Lingo Bingo!”
5. Tell students that it is best if the hold their bingo cards up in front of them so that the bingo
card faces the student and the definition card faces out, towards the rest of the class. 6. When you are sure the students understand the directions, tell them to begin the game.
When a student gets “Climate Lingo Bingo,” be sure to check their answers using the
answer sheet. The word’s number should match the number it is given on the answer
sheet. Continue playing if the student’s answers are incorrect.

American Samoa Teacher’s Guide Grades 7-12
36
1 2 3
The long term average of The amount of energy Marine animal that makes a region’s weather required to raise the a coral reef. patterns. temperature of a
substance by one degree.
4 5 6
The process where CO2 in The increase in volume Term that describes the atmosphere absorbs that occurs when water substances such as heat from the sun and absorbs heat. lemons and vinegar that
naturally warms the have a pH less than 7.
earth.
7 8 9
A chemical compound A representation of the Marine algae that lives
made of two oxygen interactions between inside a coral polyp.
atoms and one carbon predators and prey in an
atom. It naturally exists ecosystem.
as a gas in earth’s
atmosphere.

American Samoa Teacher’s Guide Grades 7-12
37
10 11 12
Addressing the cause of The layer of gasses that Anything that captures climate change by surrounds the planet. and holds carbon dioxide.
reducing CO2 and other greenhouse gas emissions
into the atmosphere.
13 14 15
Gases in the atmosphere The ability to recover The general atmospheric
that absorb and hold heat from and adjust to a conditions at a particular
from the sun. change. place and time.
16 17 18
A rock composed mostly A giant mass of ice that Carbon Dioxide released
of calcium carbonate. moves over land. from activities such as
driving and burning trash.
48
American Samoa Teacher’s Guide Grades 7-12
38
American Samoa Climate Change Teacher’s Guide Grades 10 – 12
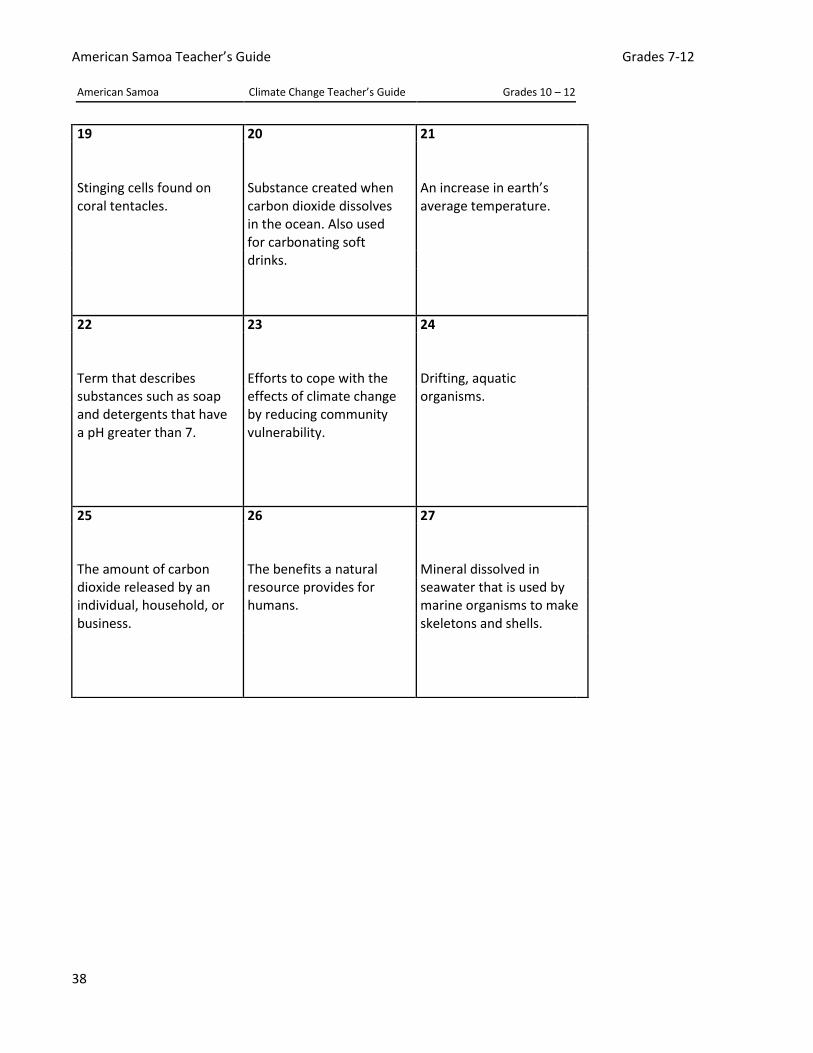
19 20 21
Stinging cells found on Substance created when An increase in earth’s coral tentacles. carbon dioxide dissolves average temperature. in the ocean. Also used
for carbonating soft
drinks.
22 23 24
Term that describes Efforts to cope with the Drifting, aquatic
substances such as soap effects of climate change organisms.
and detergents that have by reducing community
a pH greater than 7. vulnerability.
25 26 27
The amount of carbon The benefits a natural Mineral dissolved in
dioxide released by an resource provides for seawater that is used by
individual, household, or humans. marine organisms to make
business. skeletons and shells.

American Samoa Teacher’s Guide Grades 7-12
39
American Samoa Climate Change Teacher’s Guide Grades 10 – 12
28 29 30
Massive glaciers that cover When two different When coral polyps under over 20,000 square miles species work together and stress expel their as land. Also known as benefit each other. symbiotic algae and turn
continental glaciers. white.
31 32 33
The decrease in the pH of A change in a region’s long‐ Anything that releases CO2
the world’s oceans, due to term weather patterns. into the atmosphere, their absorption of excess including living, dead, or carbon dioxide from the non‐living. atmosphere.
34 35 36
Natural resources such as
coal and petroleum. These Scale used to measure how
substances are formed acidic or basic a substance The limit beyond which
over millions of years is. It ranges from 0 to 14, oceans will no longer be
when the fossilized with 7 being neutral, 0 to 7 able to take up more CO2. remains of plants and being acidic, and 7 to 14
animals are exposed to being basic.
heat and pressure in the
earth’s crust.

American Samoa Teacher’s Guide Grades 7-12
40
American Samoa Climate Change Teacher’s Guide Grades 10 – 12
37 38 39
The period from the 18th
to
The constant movement of 19
th century when there Places where carbon is
were major changes in stored on earth, such as in
carbon between the technology, the atmosphere, oceans,
oceans, atmosphere, and
manufacturing, agriculture and in plants on land.
land.
and transportation,
beginning in Europe and
eventually spreading
around the world.
40
The process where energy
from the sun is used to
convert carbon dioxide
into sugars.
Answer Key:
1. Climate 14. Resilience 28. Ice Sheet 2. Specific Heat 15. Weather 29. Symbiotic
Capacity 16. Limestone Relationship 3. Polyp 17. Glacier 30. Coral Bleaching 4. Greenhouse Effect 18. Emissions 31. Ocean Acidification 5. Thermal Expansion 19. Nematocysts 32. Climate Change 6. Acidic 20. Carbonic Acid 33. Carbon Source 7. Carbon Dioxide 21. Global Warming 34. Fossil Fuels 8. Food Chain 22. Basic 35. pH Scale 9. Zooxanthellae 23. Adaptation 36. Saturation 10. Mitigation 24. Plankton 37. Carbon Cycle 11. Atmosphere 25. Carbon Footprint 38. Industrial Revolution 12. Carbon Sink 26. Ecosystem Services 39. Reservoir 13. Greenhouse Gases 27. Calcium Carbonate 40. Photosynthesis

American Samoa Teacher’s Guide Grades 7-12
41
Climate Lingo Bingo
Calcium Ecosystem Symbiotic Emissions Resilience Carbon Footprint
Carbonate Services Relationship #: #: #:
#: #: #: Name: Name: Name:
Name: Name: Name:
Greenhouse Carbon Source Glacier Specific Heat Zooxanthellae Atmosphere
Effect #: #: Capacity #: #:
#: Name: Name: #: Name: Name:
Name: Name:
pH Scale Mitigation Climate Plankton Global Warming Photosynthesis
#: #: #: #: #: #:
Name: Name: Name: Name: Name: Name:
Carbonic Acid Fossil Fuels Saturation Acidic Polyp Thermal
#: #: #: #: #: Expansion
Name: Name: Name: Name: Name: #:
Name:
Ice Sheet Greenhouse Weather Industrial Adaptation Coral Bleaching
#: Gases #: Revolution #: #:
Name: #: Name: #: Name: Name:
Name: Name:
Carbon Cycle Basic Ocean Climate Change Food Chain Nematocysts
#: #: Acidification #: #: #:
Name: Name: #: Name: Name: Name:
Name:

American Samoa Teacher’s Guide Grades 7-12
42
Climate Lingo Bingo
Ecosystem Carbon Cycle Ocean Emissions Nematocysts Reservoir
Services #: Acidification #: #: #:
#: Name: #: Name: Name: Name:
Name:
Name:
Weather Greenhouse Climate Change Limestone Acidic Adaptation
#: Gases #: #: #: #:
Name: #: Name: Name: Name: Name:
Name:
Food Chain Ice Sheet Plankton Specific Heat Atmosphere Climate
#: #: #: Capacity #: #:
Name: Name: Name: #: Name: Name:
Name:
Industrial Carbon Dioxide pH Scale Greenhouse Photosynthesis Zooxanthellae
Revolution #: #: Effect #: #:
#: Name: Name: #: Name: Name:
Name: Name:
Carbonic Acid Thermal Carbon Footprint Mitigation Resilience Basic
#: Expansion #: #: #: #:
Name: #: Name: Name: Name: Name:
Name:
Coral Bleaching Saturation Carbon Sink Polyp Carbon Source Global Warming
#: #: #: #: #: #:
Name: Name: Name: Name: Name: Name:
American Samoa Teacher’s Guide Grades 7-12
43
Climate Lingo Bingo
Food Chain Carbonic Acid Acidic Nematocysts Fossil Fuels pH Scale
#: #: #: #: #: #:
Name: Name: Name: Name: Name: Name:
Weather Climate Plankton Symbiotic Industrial Ecosystem
#: #: #: Relationship Revolution Services
Name: Name: Name: #: #: #:
Name: Name: Name:
Adaptation Carbon Source Thermal Reservoir Carbon Sink Atmosphere
#: #: Expansion #: #: #:
Name: Name: #: Name: Name: Name:
Name:
Resilience Glacier Greenhouse Saturation Calcium Climate Change
#: #: Gases #: Carbonate #:
Name: Name: #: Name: #: Name:
Name: Name:
Ocean Photosynthesis Polyp Limestone Specific Heat Greenhouse
Acidification #: #: #: Capacity Effect
#: Name: Name: Name: #: #:
Name: Name: Name:
Carbon Cycle Global Warming Coral Bleaching Zooxanthellae Mitigation Carbon Dioxide
#: #: #: #: #: #:
Name: Name: Name: Name: Name: Name:
American Samoa Teacher’s Guide Grades 7-12
44
LESSON 8: CLIMATE CHANGE IN AMERICAN SAMOA AND THE WORLD OBJECTIVE: Students will gain insight into the full range of impacts if no actions are taken to reverse or reduce the effects of climate change. They will then compare localized consequences to climate change in
American Samoa with impacts that are likely to occur in various regions around the world. Students will
realize that climate change is truly global in scale, and that communities worldwide are faced with various
climate challenges. VOCABULARY: None.
*This lesson requires some knowledge of world geography. PRESENTATION 8A:
• In American Samoa, climate change will have impacts beyond those that occur on coral reefs.
• Although we have been discussing climate change impacts on coral reefs in American Samoa
in particular, it is important to remember that climate change will have impacts beyond
those that affect coral reefs.
• For example, water shortages may become more frequent in American Samoa and other
South Pacific locations such as Papua New Guinea, the Marshall Islands, Micronesia, Tonga,
and Fiji. These areas will also be faced with an increased risk of tropical cyclones.
• It is important to remember that climate change is a global event. Different areas of the
world will be affected in different ways, with impacts varying both on a local and regional
scale. Some areas will get a lot hotter, while others do not have much of a temperature
change. Computer models predict that climate change will shift rainfall patterns so that some
areas will suffer from prolonged drought, while others will have excessive rain and more
frequent flooding. In addition, sea level will vary in different regions of the world.
ACTIVITY 8: WORLD CLIMATE CHANGE WORKSHEET Materials (for each team of 2 – 4 students): IPCC projection maps for air temperature, sea level change, and precipitation patterns; blank world map; climate change “doodads”; scissors. In Class:
1. Split students into groups of 2 – 4 students. 2. For each group, pass out the attached IPCC projection maps for air temperature, sea
level change, and precipitation.
4. Explain that these are the projections for global changes in air temperature, sea level and rainfall patterns from the Intergovernmental Panel on Climate Change, which is a scientific body that reviews and assesses climate data produced by scientists all over the world to evaluate the risk of human‐caused climate change. Next, pass out a blank world map, a “Climate Change Doodads” sheet, and scissors.
5. Within their groups, have students cut out the doodads and place them on the world
map where they believe each climate change impact will take place, based on the IPCC
projections data. For example, students might place a “flooding” doodad in an area
where rainfall is projected to increase. It is not necessary to use all of the doodads.
6. You may want to help students brainstorm by going through each climate change doodad
and discussing it as a class. For example, for the “Increased Disease” doodad, ask students
questions such what causes disease, how are diseases spread etc. This way, students will
be inspired to think about the cause‐and‐effect relationship of some of the changes
displayed on the IPCC maps. Therefore, students may consider that mosquitoes carry

American Samoa Teacher’s Guide Grades 7-12
45
disease, and warmer temperatures mean more mosquitoes, so there will be more disease
where temperature increase is the greatest. Similarly, they may know that mosquitoes
breed in standing water, so increased rainfall might cause more standing water, and more
disease. For the “Glacier Melting” it may be a good idea to have students think about
where these exist as some may not be aware that both temperature and high altitudes
allow glaciers to exist in places such as in the Andes in South America, the Himalayas in
Asia, and even on Mt. Kilimanjaro in Africa.
Follow‐up:
• Discuss as a class where the groups placed their climate change doodads. Have the groups each give at least one example that they came up with, including an explanation.
• Explain that you will now provide a brief description (see Presentation 8B) of some
more detailed impacts that are projected in different regions around the world. • Tell students that they can rearrange their doodads based on this new information.
• After you complete this brief presentation, ask students to discuss what projected impacts
they found surprising, if there were any impacts they originally guessed correctly (using their
climate change doodads) based on the IPCC maps, and what they guessed incorrectly.
PRESENTATION 8B:
• Here is a brief overview of the impacts of climate change in different areas of the world:
• Africa: Some regions will experience a greater likelihood of drought and food shortages
from shorter growing seasons and degraded fish populations. Arid and semi‐arid regions
in north, west and east Africa are becoming drier, while equatorial and parts of southern
Africa are getting wetter. Coral and mangrove ecosystems will likely degrade. Overall,
many of the problems that Africa already deals with will get much worse.
• Asia: Glaciers are melting in the Himalayan Mountains which, besides the polar ice caps, contain the
greatest amount of fresh water on the planet and supply hundreds of millions of people. This will likely
increase rock avalanches and flooding in the region in the short term, followed by drought in the future.
Heavily populated coastal areas are also at risk of flooding, and food
American Samoa Teacher’s Guide Grades 7-12
46
shortages are likely due to decreased crop yields. The presence of disease is expected to rise in southeastern Asia, including an increase in cholera as coastal water temperature warms.
• Australia and New Zealand: South and eastern Australia will likely have water shortages.
Warming will affect a large part of the Great Barrier Reef, resulting in the loss of many species
of wildlife. Some coastal areas will have a higher risk of storms and flooding. Some cooler
areas, such as in New Zealand, may benefit from global warming through longer growing
seasons and greater crop yields.
• Europe: Reduced rainfall is predicted for central and eastern Europe, while more frequent
heat waves are expected to pose a health risk. Reduced water supplies and crop production
is likely in southern Europe, although northern Europe may benefit from a longer growing
season and increased crop productivity. Many areas will be at risk of flooding in the future.
• Latin America: Higher temperatures and lower soil moisture may cause some tropical forests
to be replaced by savannah (which means mostly grassland) ecosystems. Land in drier areas
will likely be degraded, causing declines in crops and livestock production and food shortages.
Some low‐lying regions will be prone to flooding by sea level rise, including coastal areas in El
Salvador, Uruguay and Argentina. Changing rainfall patterns and melting South American
glaciers will ultimately affect future fresh water supplies.
• North America: In the west, higher rates of snow melt will cause winter flooding and summer
droughts. The incidence of pests, disease, forest fires, and heat waves will likely increase,
which will have human health impacts. Severe weather and sea level rise will affect coastal
areas, such as in the southeast.
• Polar Regions (The Arctic and Antarctica): These areas will see a reduction in the thickness
and extent of ice sheets and glaciers, which will affect natural ecosystems and the habitat of
polar species.
• Small Islands: Small islands, such as those in the South Pacific and Caribbean will be affected
by sea level rise, increased storm activity, coastal erosion, and coral bleaching. Fresh water
resources will also likely be compromised.
• At this point, many of the expected impacts of climate change are projections based on
current data and computer models. The actual effects of climate change will vary regionally
and depend on a variety of factors, including:
‐Mitigation: The extent of efforts to prevent climate change, such as policies to reduce future greenhouse gas emissions.
‐Adaptation: How effectively communities act to reduce expected damages.
• We still have an opportunity to reduce the harmful effects of climate change. The efforts made today will determine the extent of climate change impacts in the future.

American Samoa Teacher’s Guide Grades 7-12
47
American Samoa Climate Change Teacher’s Guide Grades 10 – 12
58

American Samoa Teacher’s Guide Grades 7-12
48
American Samoa Climate Change Teacher’s Guide Grades 10 – 12
59
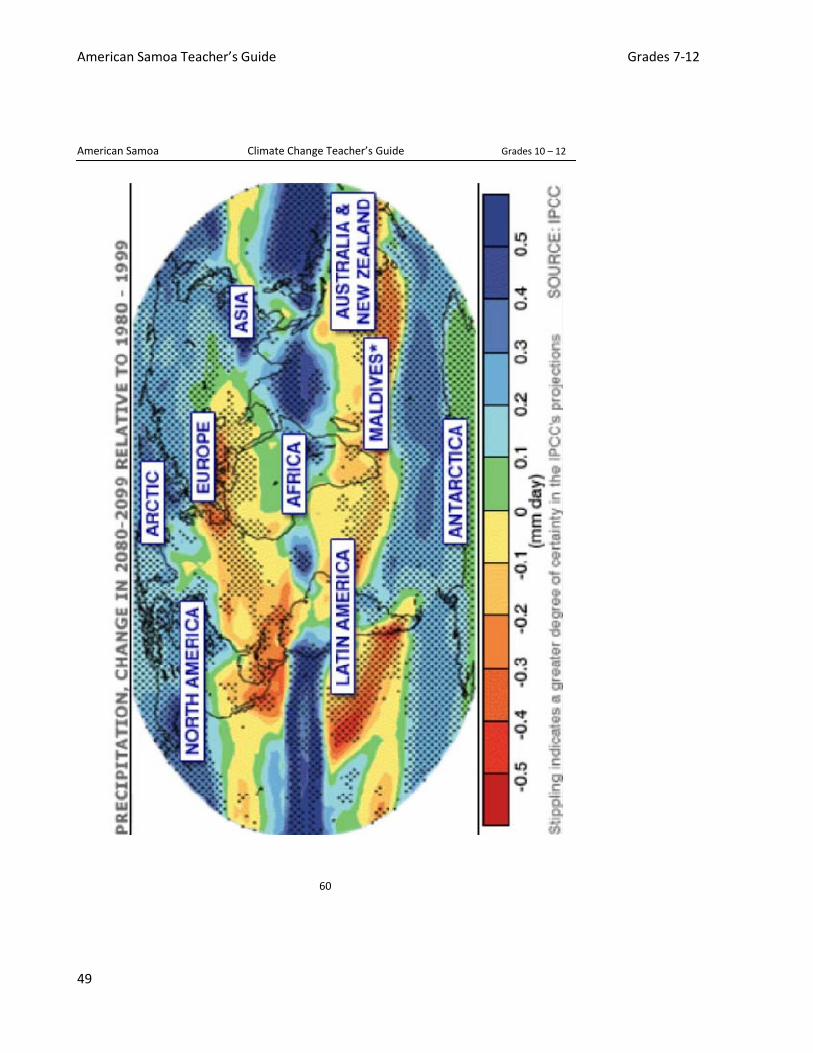
American Samoa Teacher’s Guide Grades 7-12
49
American Samoa Climate Change Teacher’s Guide Grades 10 – 12
60
American Samoa Teacher’s Guide Grades 7-12
50
American Samoa Climate Change Teacher’s Guide Grades 10 – 12
61

American Samoa Teacher’s Guide Grades 7-12
51
Climate Change Doodads
Extreme Storms:
Drought: Flooding: Sea Level Rise:

American Samoa Teacher’s Guide Grades 7-12
52
Elevated Sea Surface Temperature: Increased Disease: Food Shortages: Glacier Melting: Higher Crop Yield: