climate change and its impact on ocean variability - … · climate change and its impact on ocean...
TRANSCRIPT

9/18/2009
1
Climate change and its impact on ocean variability
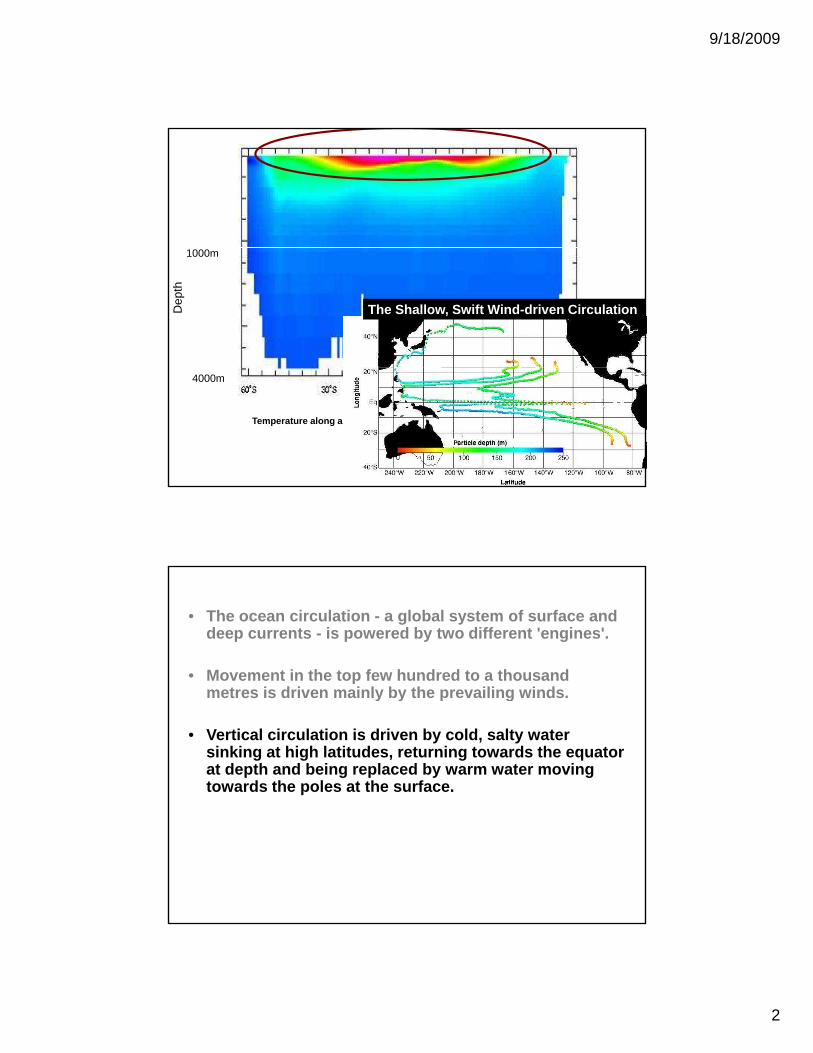
• The ocean circulation - a global system of surface a nd deep currents - is powered by two different 'engines '.
• Movement in the top few hundred to a thousand metres is driven mainly by the prevailing winds. metres is driven mainly by the prevailing winds.
9/18/2009
2
1000m
Dep
th
1000m
The Shallow, Swift Wind-driven Circulation
Temperature along a section in the mid-Pacific (152 W)
4000m
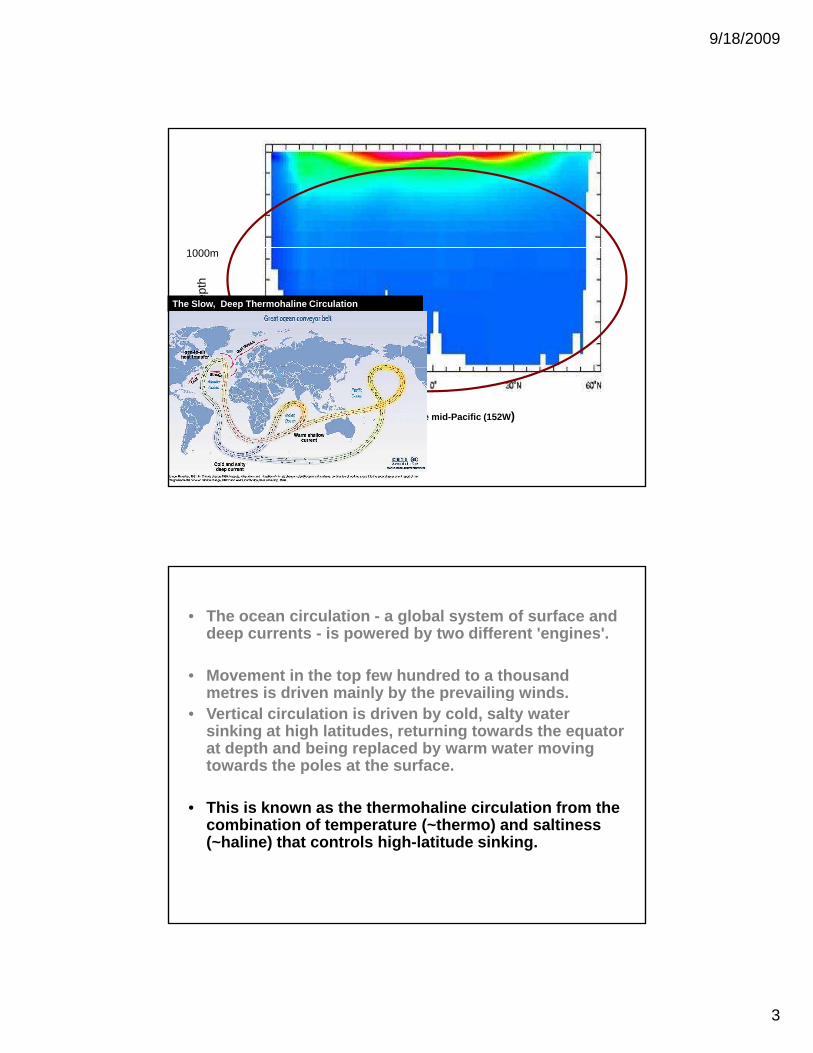
• The ocean circulation - a global system of surface a nd deep currents - is powered by two different 'engines '.
• Movement in the top few hundred to a thousand metres is driven mainly by the prevailing winds.metres is driven mainly by the prevailing winds.
• Vertical circulation is driven by cold, salty water sinking at high latitudes, returning towards the eq uator at depth and being replaced by warm water moving towards the poles at the surface.
9/18/2009
3
1000m
Dep
th
1000m
The Slow, Deep Thermohaline Circulation
Temperature along a section in the mid-Pacific (152 W)
4000m
• The ocean circulation - a global system of surface a nd deep currents - is powered by two different 'engines '.
• Movement in the top few hundred to a thousand metres is driven mainly by the prevailing winds. metres is driven mainly by the prevailing winds.
• Vertical circulation is driven by cold, salty water sinking at high latitudes, returning towards the eq uator at depth and being replaced by warm water moving towards the poles at the surface.
• This is known as the thermohaline circulation from the • This is known as the thermohaline circulation from the combination of temperature (~thermo) and saltiness (~haline) that controls high-latitude sinking.
9/18/2009
4
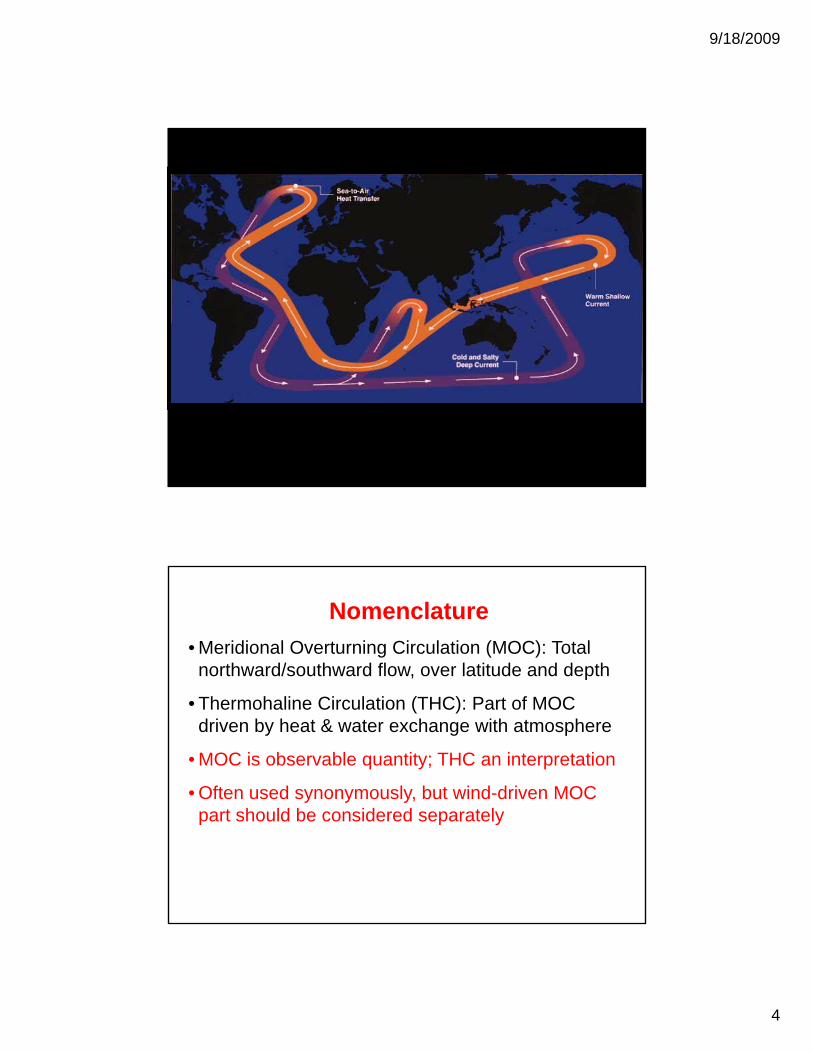
Nomenclature• Meridional Overturning Circulation (MOC): Total northward/southward flow, over latitude and depth
• Thermohaline Circulation (THC): Part of MOC driven by heat & water exchange with atmosphere
• MOC is observable quantity; THC an interpretation
• Often used synonymously, but wind-driven MOC part should be considered separatelypart should be considered separately

9/18/2009
5
Why does it matter?

9/18/2009
6
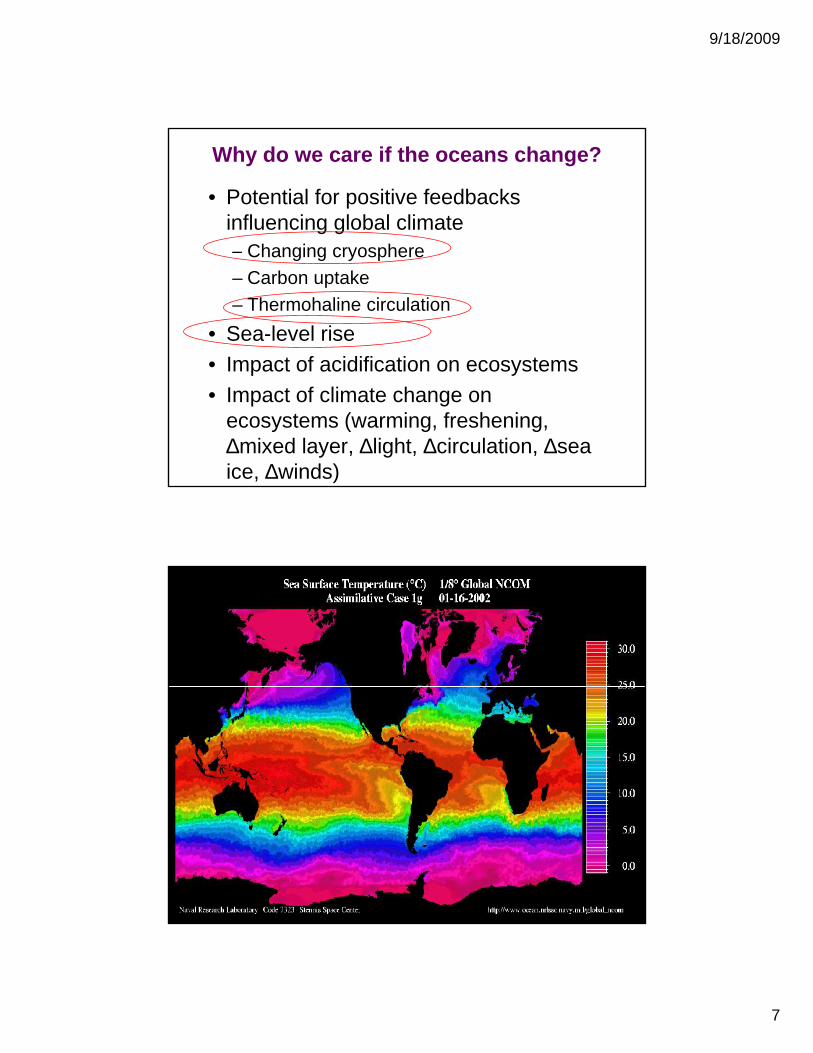
Why do we care if the oceans change?
Why do we care if the oceans change?
• Potential for positive feedbacks influencing global climate– Changing cryosphere– Changing cryosphere– Carbon uptake– Thermohaline circulation
• Sea-level rise• Impact of acidification on ecosystems• Impact of acidification on ecosystems• Impact of climate change on
ecosystems (warming, freshening, ∆mixed layer, ∆light, ∆circulation, ∆sea ice, ∆winds)
9/18/2009
7
Why do we care if the oceans change?
• Potential for positive feedbacks influencing global climate– Changing cryosphere– Changing cryosphere– Carbon uptake– Thermohaline circulation
• Sea-level rise• Impact of acidification on ecosystems• Impact of acidification on ecosystems• Impact of climate change on
ecosystems (warming, freshening, ∆mixed layer, ∆light, ∆circulation, ∆sea ice, ∆winds)

9/18/2009
8
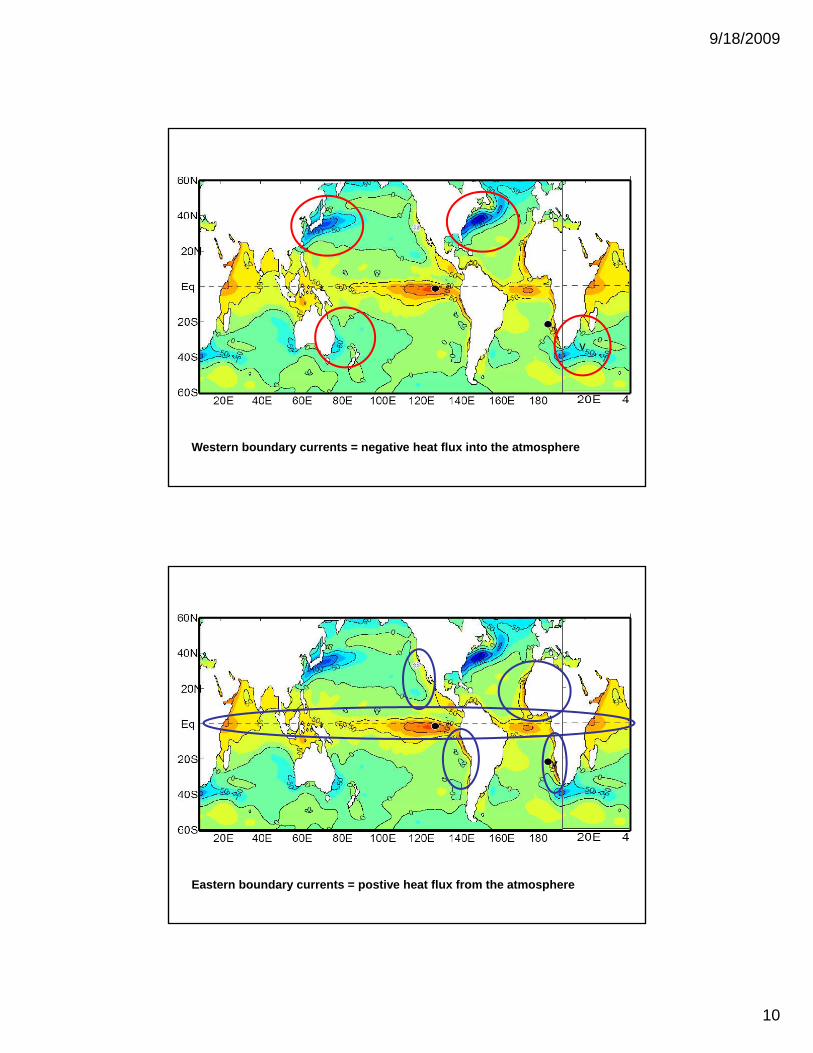
General pattern of the surface currents – a balance of heat

9/18/2009
9
• The ocean’s heat capacity is about 1,000 times larger than that of the atmosphere.times larger than that of the atmosphere.
• Heat flux related to ocean regions.
• The oceans net heat uptake since 1960 is • The oceans net heat uptake since 1960 is around 20 times greater than that of the atmosphere (Levitus et al., 2005).
Heat Flux across the Ocean/Atmosphere ( Watts/m 2) Da Silva
9/18/2009
10
v
Western boundary currents = negative heat flux into the atmosphere
v
Eastern boundary currents = postive heat flux from the atmosphere

9/18/2009
11
Meridional heat transport
Atlantic
T Anomaly (N-S sections)
Atlantic
Pacific
Indian
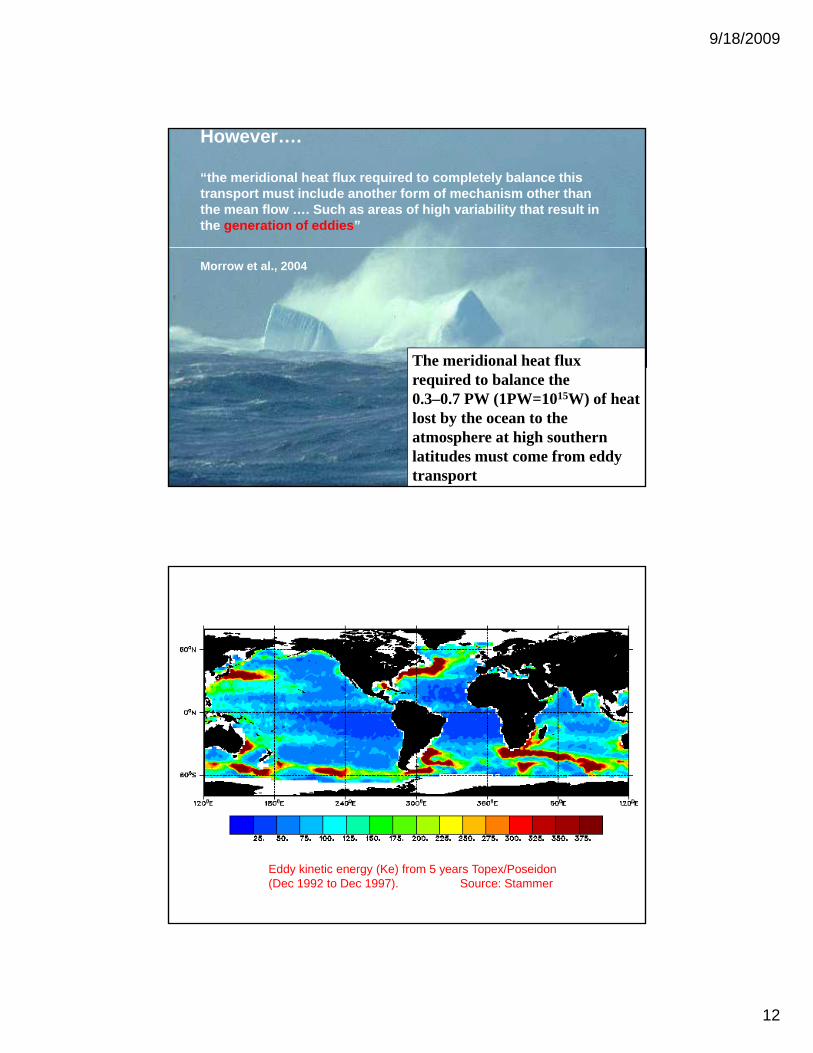
The heat anomaly is due to upwelling of anomalously warm deep layers in the Southern Ocean....role of eddies?
Results have shown that the majority of transport between ocean basins occurs within
the Southern Ocean
= ?
9/18/2009
12
However….
“the meridional heat flux required to completely ba lance this transport must include another form of mechanism ot her than the mean flow …. Such as areas of high variability t hat result in the generation of eddies ”
Morrow et al., 2004
The meridional heat flux The meridional heat flux required to balance the0.3–0.7 PW (1PW=1015W) of heat lost by the ocean to the atmosphere at high southern latitudes must come from eddy transport
Eddy kinetic energy (Ke) from 5 years Topex/Poseidon (Dec 1992 to Dec 1997). Source: Stammer
9/18/2009
13
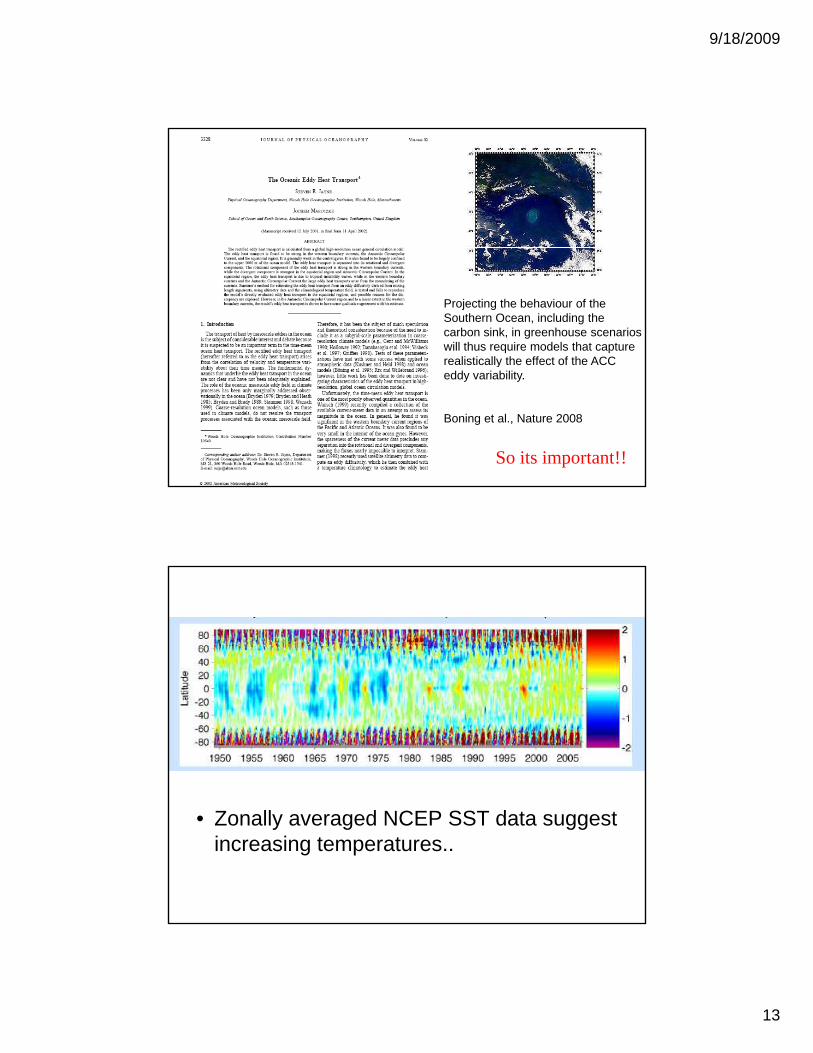
Projecting the behaviour of the Southern Ocean, including the carbon sink, in greenhouse scenarios will thus require models that capture realistically the effect of the ACC
So its important!!
realistically the effect of the ACCeddy variability.
Boning et al., Nature 2008
• Zonally averaged NCEP SST data suggest increasing temperatures..

9/18/2009
14
Energy content changes 1961–2003 (blue) and 1993–2003 (burgundy).
1000m
Dep
th
1000m
The Slow, Deep Thermohaline Circulation
Dep
th
Temperature along a section in the mid-Pacific (152 W)
4000m
9/18/2009
15
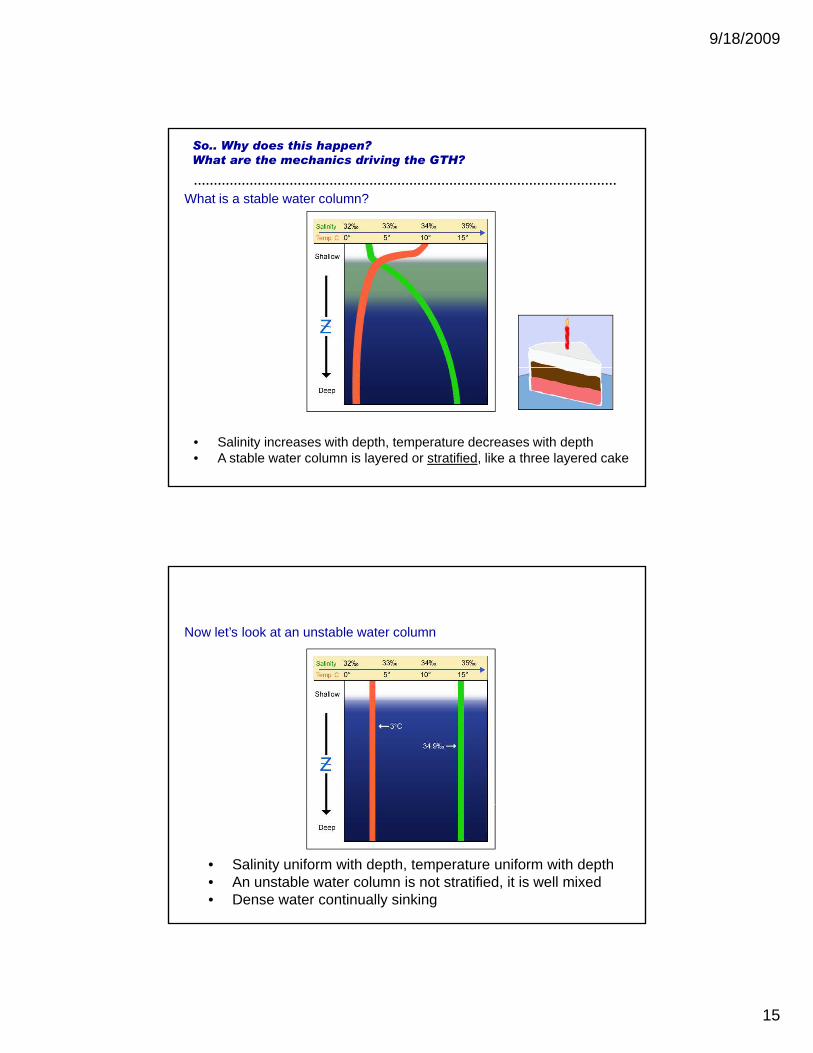
What is a stable water column?
So.. Why does this happen?
What are the mechanics driving the GTH?
• Salinity increases with depth, temperature decreases with depth• A stable water column is layered or stratified, like a three layered cake
Now let’s look at an unstable water column
• Salinity uniform with depth, temperature uniform with depth• An unstable water column is not stratified, it is well mixed• Dense water continually sinking

9/18/2009
16
• Where is coldest surface water? ~ at the poles
• A component of salt – through brine rejection..
• At the poles, the water column is unstable and is well mixed because of sinking cold and salty watermixed because of sinking cold and salty water

9/18/2009
17
1. South Pole off coast of Antarctica• Antarctic Bottom Water (AABW)
~ 1°C, 34.7 ppt~ densest water in the ocean
The instability of the higher latitudes gives rise to deep water
formation
NADW and AABW form NADW and AABW form at surface, sink and then spread out in horizontal direction at the bottom of the ocean
9/18/2009
18
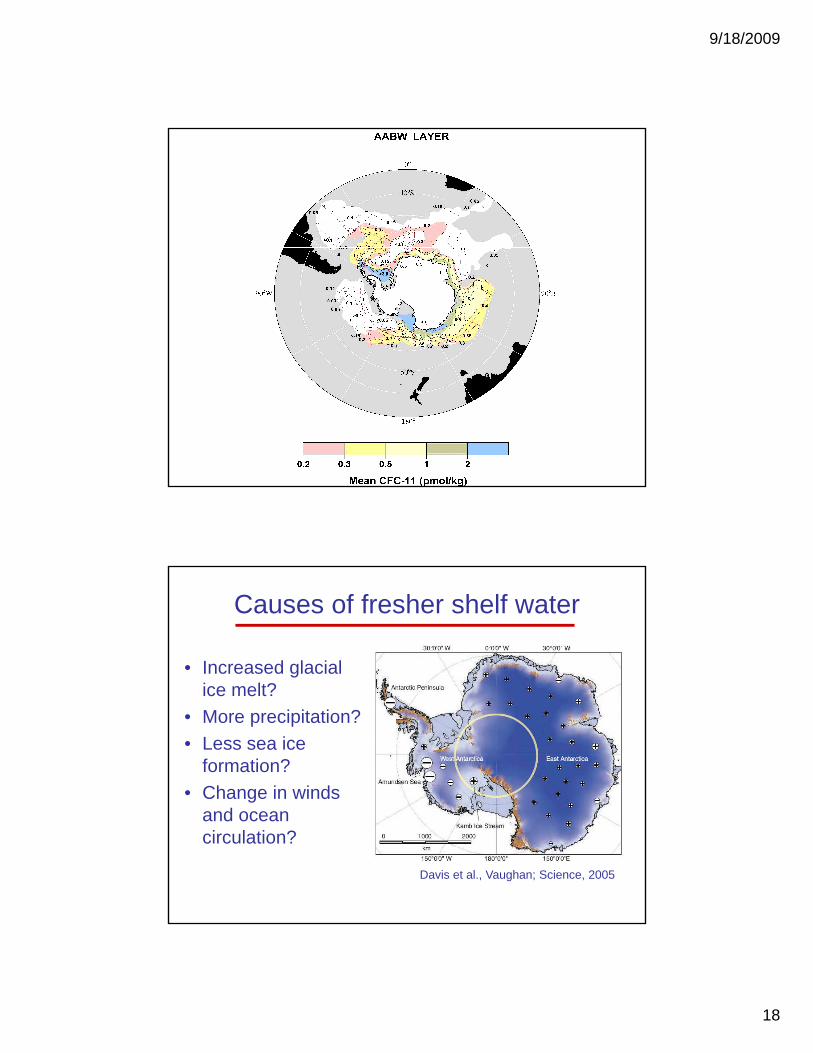
Causes of fresher shelf water
• Increased glacial ice melt?ice melt?
• More precipitation?• Less sea ice
formation?• Change in winds
and ocean and ocean circulation?
Davis et al., Vaughan; Science, 2005

9/18/2009
19
The instability of the higher latitudes gives rise to deep water
formation
2. North Pole off coast of Greenland
NADW and AABW form
2. North Pole off coast of Greenland• North Atlantic Deep Water (NADW)
~ 3°C, 34.9 ppt~ very dense but not as dense as AABW
NADW and AABW form at surface, sink and then spread out in horizontal direction at the bottom of the ocean
9/18/2009
20
9/18/2009
21
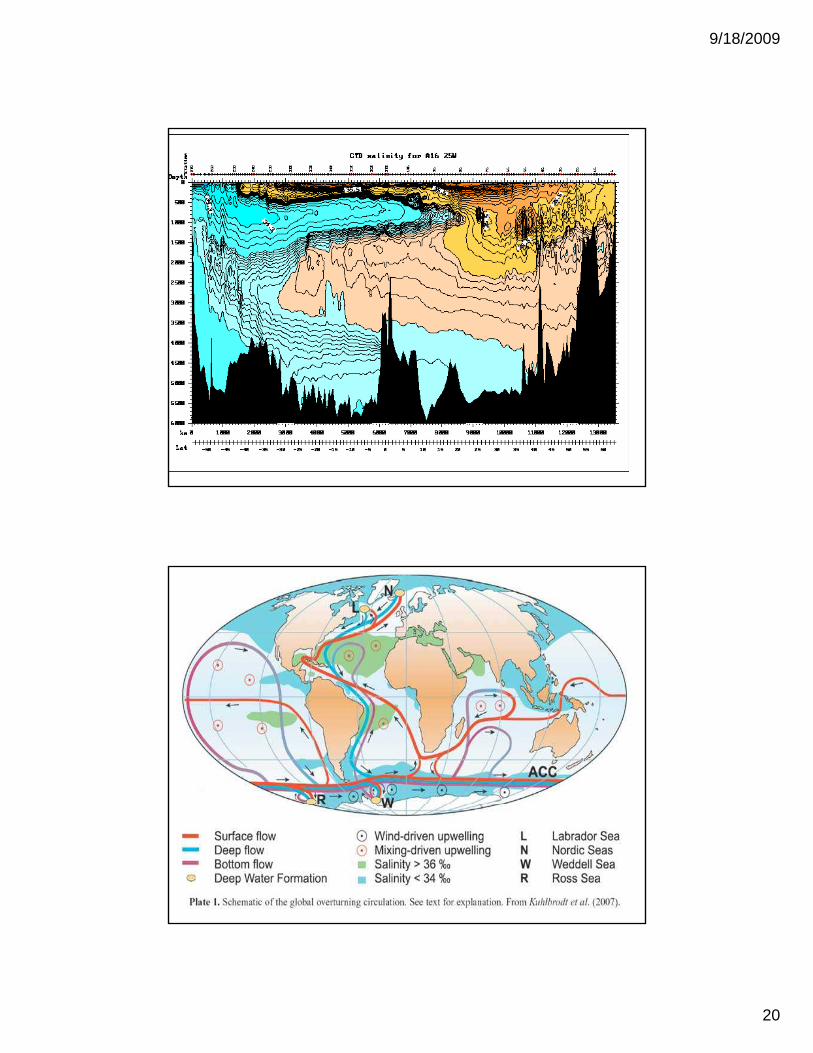
Lets say the “heat pump” can be turned ON or OFF ….what will happen?
But what is the Importance of the
Thermohaline circulation?
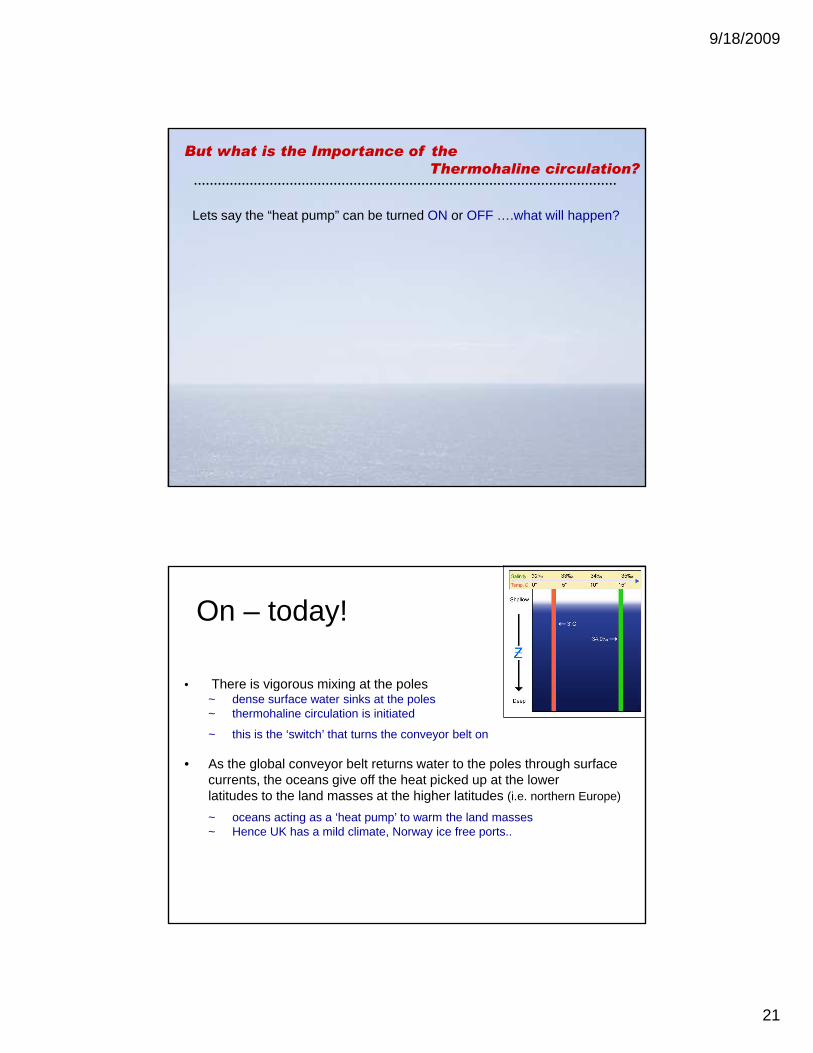
• There is vigorous mixing at the poles
On – today!
• There is vigorous mixing at the poles~ dense surface water sinks at the poles~ thermohaline circulation is initiated
~ this is the ‘switch’ that turns the conveyor belt on
• As the global conveyor belt returns water to the poles through surface currents, the oceans give off the heat picked up at the lower latitudes to the land masses at the higher latitudes (i.e. northern Europe)
~ oceans acting as a ‘heat pump’ to warm the land masses~ Hence UK has a mild climate, Norway ice free ports..

9/18/2009
22

9/18/2009
23
• There is no vigorous mixing at the poles – water column becomes stable
BUT WHAT IF WE TURN IT OFF?
• There is no vigorous mixing at the poles – water column becomes stable
~ there is no dense water sinking at the poles (surface waters warmed, polar ice caps melt)
~ thermohaline circulation slows down~ the global conveyor belt ‘switch’ is turned off
• There is no heat pump to warm the land masses
~ much colder in northern Europe~ much colder in northern Europe
How could the THC slow down?
• Increased rainfall, melting of the cryosphere are all possible • Increased rainfall, melting of the cryosphere are all possible consequences of higher temperatures, and could reduce North Atlantic surface salinity sufficiently to slow down the formation of deep water. If this happens, the THC may shut down. Once stopped, the heat conveyor may take time to recover, and the consequences would be a cooling of northwest Europe.

9/18/2009
24
Effect on Europe if the THC slows down
HADCM3 simulation where large amounts of fresh wate r was added to the North Atlantic at year 2050.
London 1683 ‘little ice age’

9/18/2009
25
What do we think happened to cause the ‘Younger Dryas’?
• As earth warmed during warming 2000 year warming period ~ the surface waters also warmed
The Importance of the Global Conveyer Belt (cont’d)
~ the surface waters also warmed~ polar ice caps melted (surface waters less salty)~ northern Atlantic surface water less dense~ no vigorous mixing, interruption in thermohaline circulation~ global conveyor belt turned off~ no heat transfer to northern Europe~ ice sheets, no forests grow
Another example of when the global conveyor belt is turned off:Another example of when the global conveyor belt is turned off:
• We also have records of a prolonged period of cold in northernEurope from 1650-1850~ known as the “Little Ice Age”~ could have been caused by an interruption or slow-down in
thermohaline circulation, conveyor belt slowed down (sluggish)
9/18/2009
26
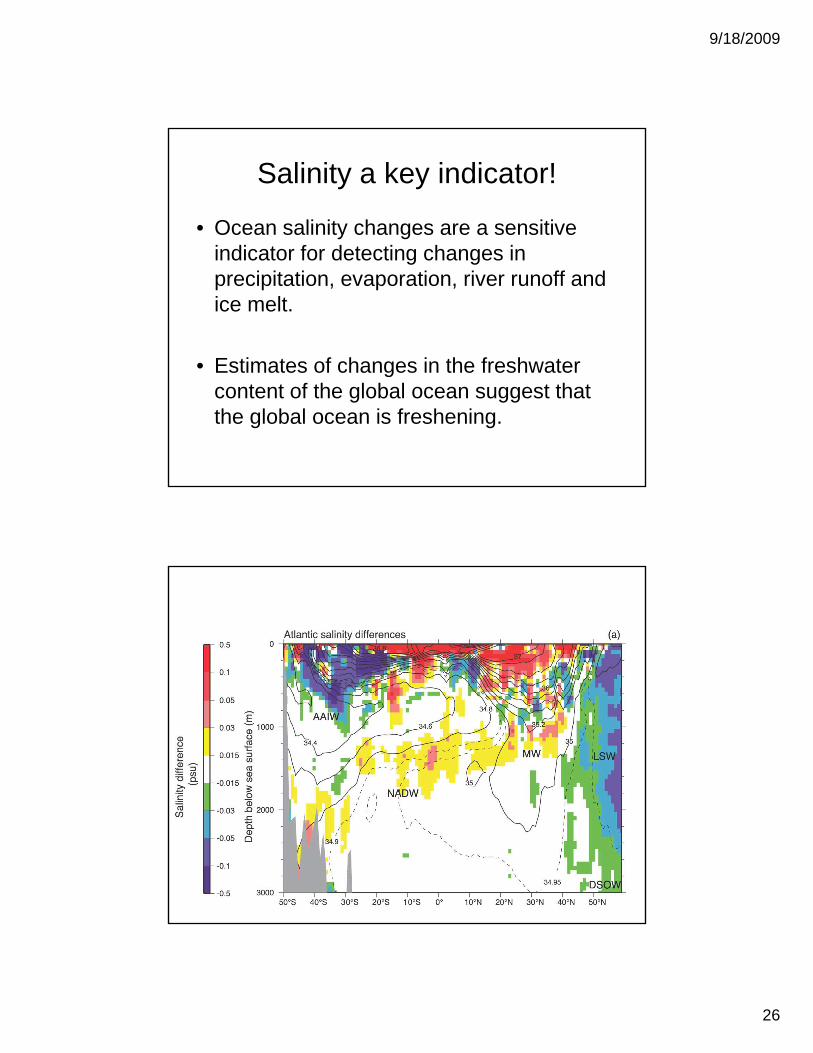
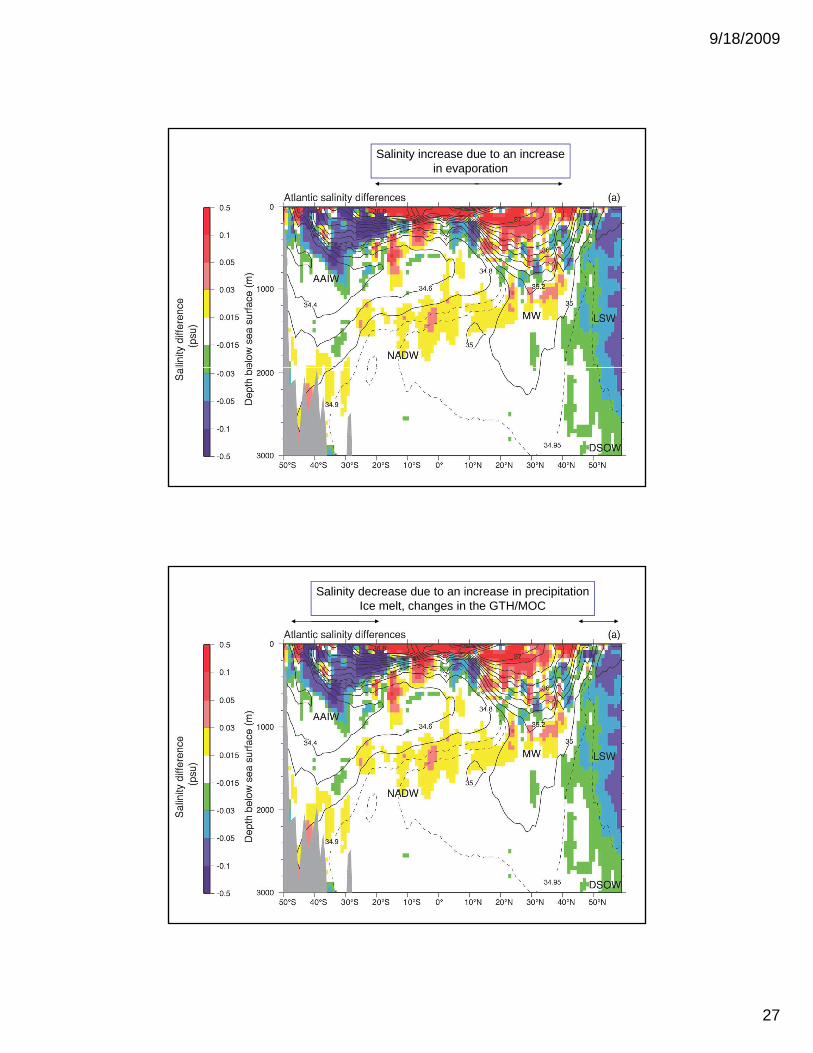
Salinity a key indicator!
• Ocean salinity changes are a sensitive indicator for detecting changes in indicator for detecting changes in precipitation, evaporation, river runoff and ice melt.
• Estimates of changes in the freshwater • Estimates of changes in the freshwater content of the global ocean suggest that the global ocean is freshening.
9/18/2009
27
Salinity increase due to an increasein evaporation
Salinity decrease due to an increase in precipitationIce melt, changes in the GTH/MOC

9/18/2009
28
Is there evidence for salinity change?
• Yes – in the Southern Ocean – formation site of the AABWsite of the AABW

9/18/2009
29
Freshening of AABW
0
0.1
115E, 61S to 63.3S
1995
2005
-0.3
-0.2
-0.1
TH
ET
A
28.27
28.30 28.35
34.655 34.66 34.665 34.67 34.675 34.68 34.685 34.69 34.695
-0.5
-0.4
SALINITY
28.30
0.017 psu
Rintoul 2006
9/18/2009
30
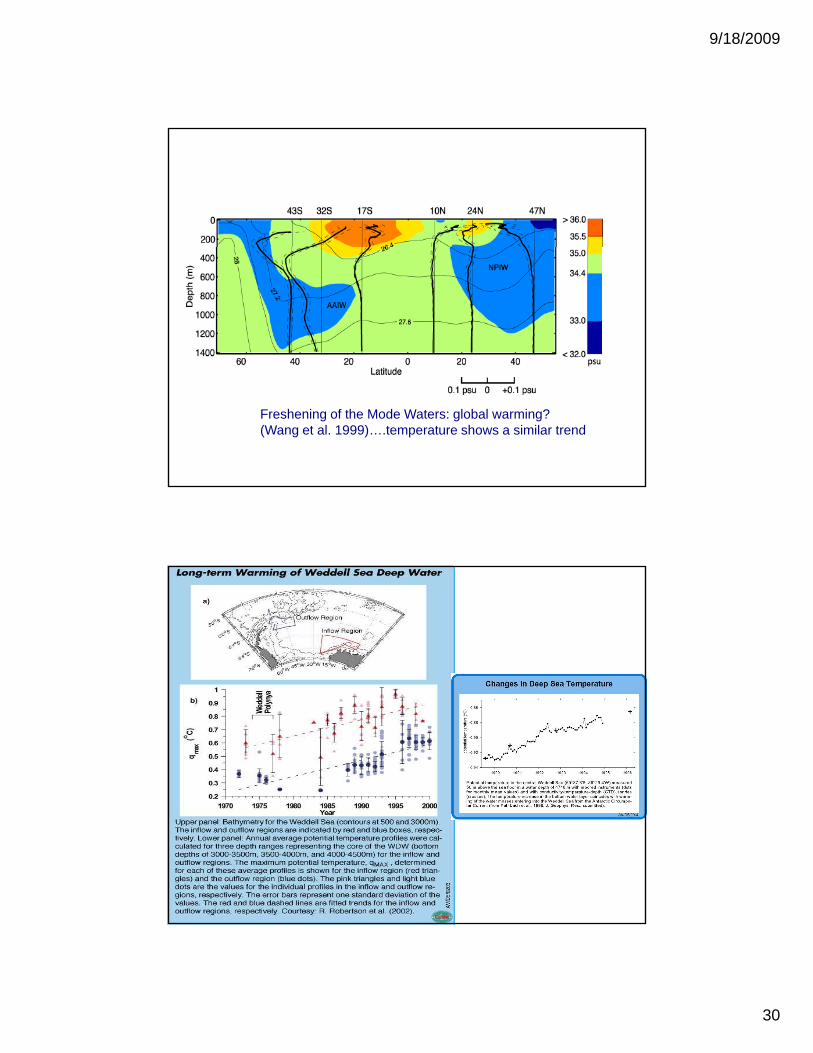
Freshening of the Mode Waters: global warming?(Wang et al. 1999)….temperature shows a similar trend

9/18/2009
31
• Warming in the Southern Ocean has been attributed to a southward shift and attributed to a southward shift and increased intensity of the Southern Hemisphere westerlies, which would shift the ACC slightly southward and intensify the subtropical gyres (e.g., Cai, 2006).

9/18/2009
32
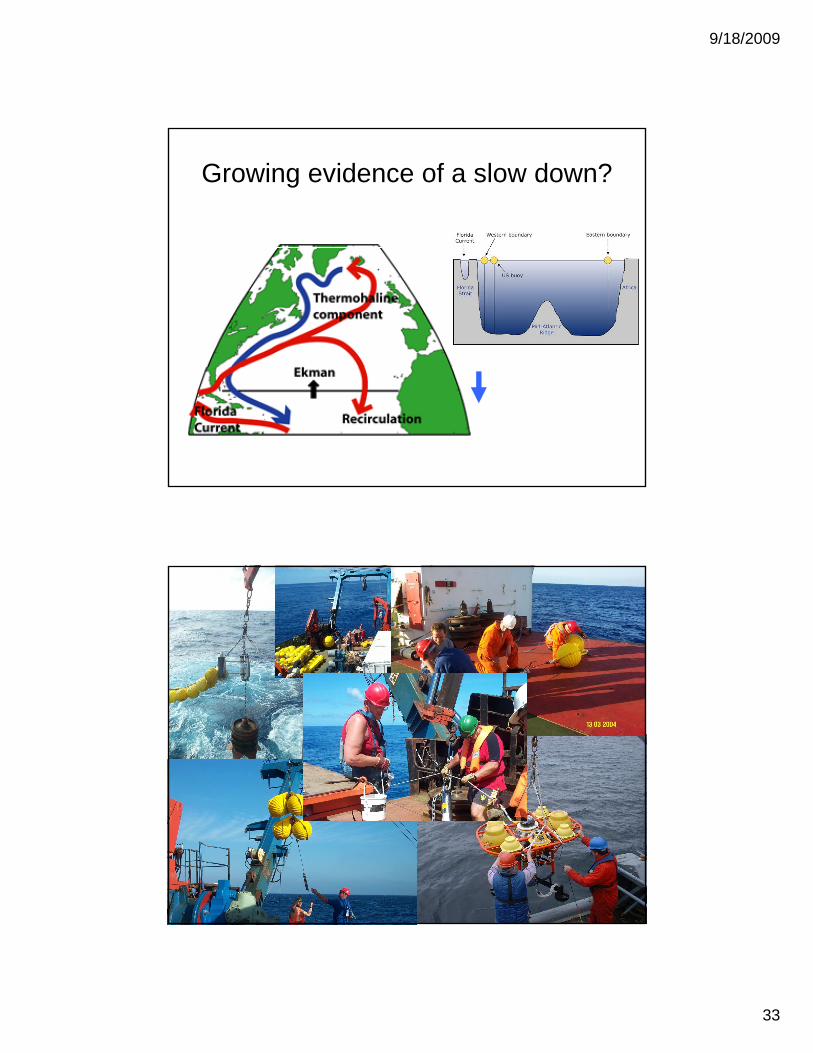
Growing evidence of a slow down?
Growing evidence of a slow down?
9/18/2009
33
Growing evidence of a slow down?
9/18/2009
34
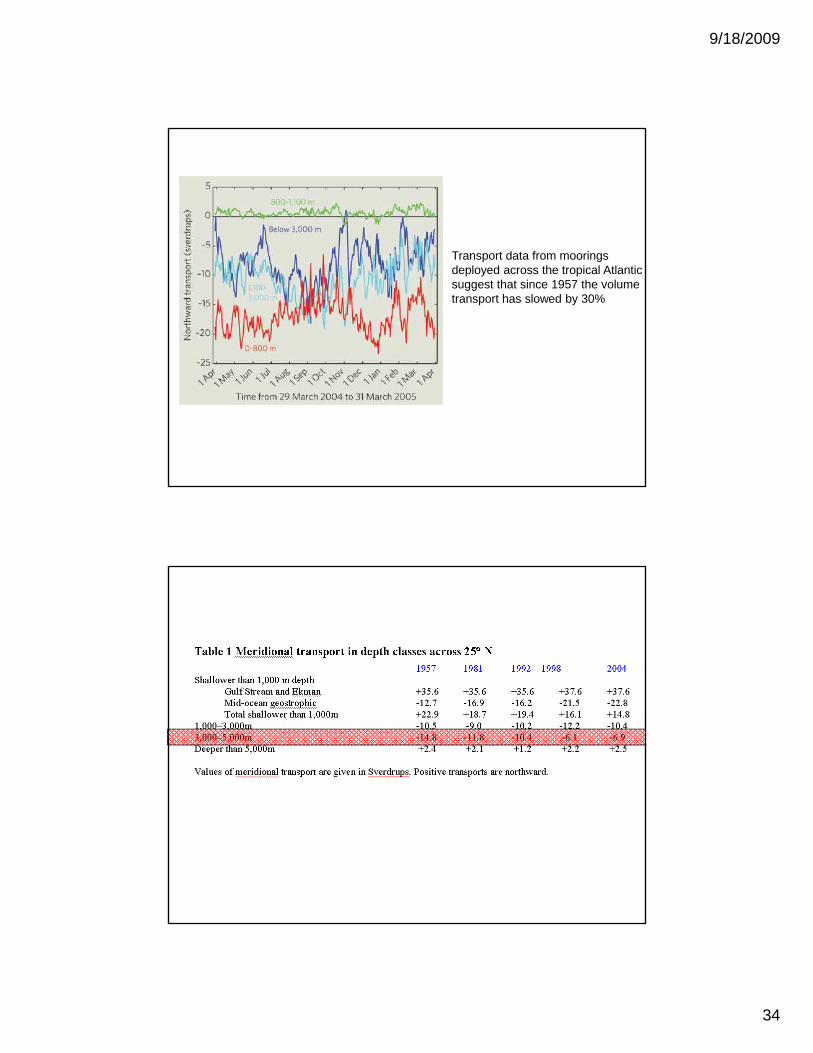
Transport data from mooringsdeployed across the tropical Atlanticsuggest that since 1957 the volume transport has slowed by 30%
9/18/2009
35
• Climate models show that the Earth’s climate system responds to changes in the MOC and suggest that this overturning might gradually decrease in transport in the 21st century as a consequence of anthropogenic warming and additional freshening in the North Atlantic.
• However, observations of changes in the MOC strength and • However, observations of changes in the MOC strength and variability are fragmentary.
• Observed changes in MOC transport, water properties and water mass formation are inconclusive. This is partially due to decadal variability and partially due to inadequate long-term observations.
• From repeated hydrographic sections in the subtropics, Bryden et al. (2005) concluded that the MOC transport at 25°N had decreased by 30% between 1957 and 2004, but the presence of significant 30% between 1957 and 2004, but the presence of significant unsampled variability in time and the lack of supporting direct current measurements may reduce confidence in this estimate.
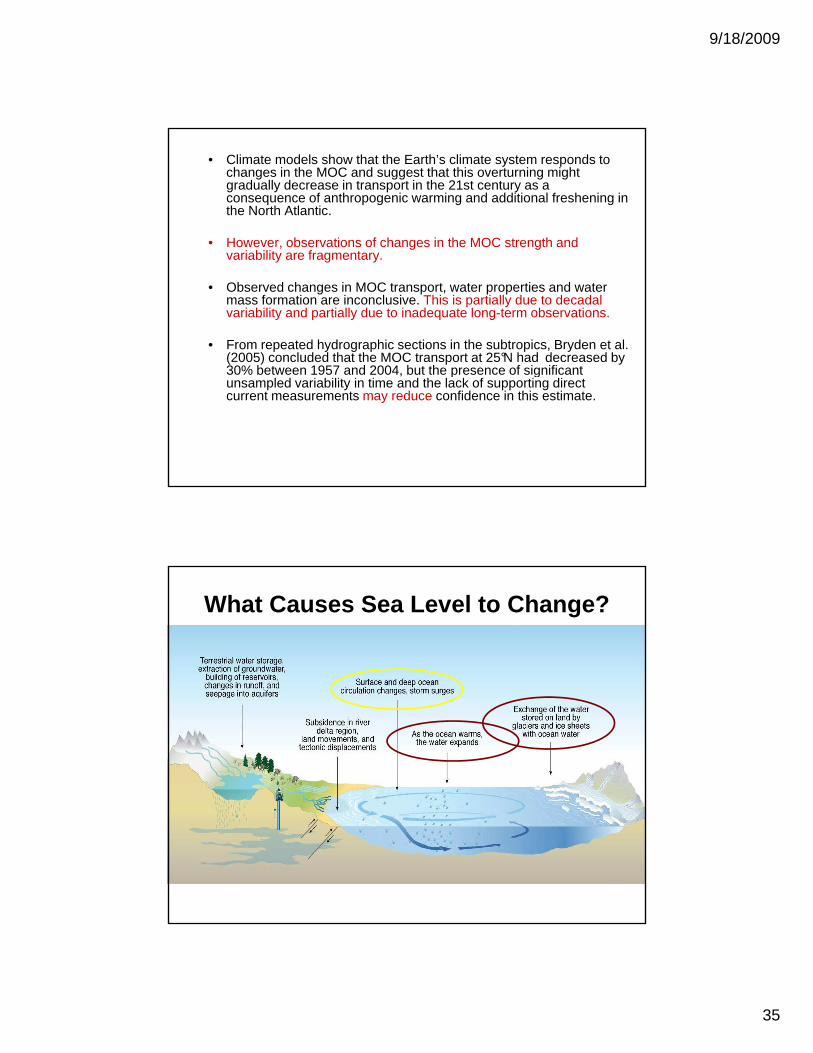
What Causes Sea Level to Change?

9/18/2009
36
The Bathtub Sea Level ModelPrecipitation over OceansRunoff from Continents
+
-
Evaporation from Oceans

9/18/2009
37
Global mean surface temperatures have increasedGlobal mean surface temperatures have increasedGlobal mean surface temperatures have increasedGlobal mean surface temperatures have increased
9/18/2009
38
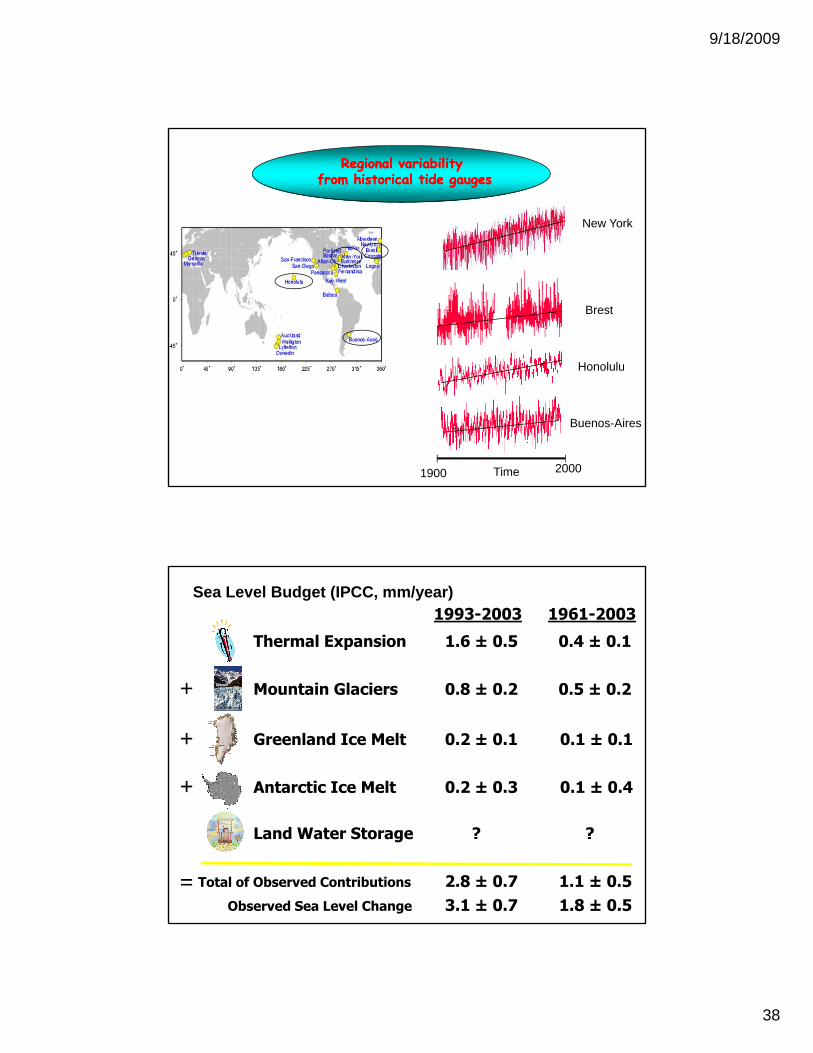
Regional variability Regional variability from historical tide gaugesfrom historical tide gauges
New York
Brest
Honolulu
Buenos-Aires
1900 2000
Honolulu
Time
Sea Level Budget (IPCC, mm/year)
Thermal Expansion
Mountain Glaciers+
1.6 ± 0.5
0.8 ± 0.2
1993-2003 1961-2003
0.4 ± 0.1
0.5 ± 0.2Mountain Glaciers
Greenland Ice Melt
Antarctic Ice Melt
+
+
+
0.8 ± 0.2
0.2 ± 0.1
0.2 ± 0.3
0.5 ± 0.2
0.1 ± 0.1
0.1 ± 0.4
Land Water Storage
Total of Observed Contributions=Observed Sea Level Change
?
2.8 ± 0.7
?
1.1 ± 0.5
3.1 ± 0.7 1.8 ± 0.5

9/18/2009
39
What does the IPCC say?• The oceans are warming. Over the period 1961 to 200 3, global
ocean temperature has risen by 0.10°C from the surf ace to a depth of 700 m. depth of 700 m.
• Global ocean heat content (0–3,000 m) has increased at a rate of 0.21 ± 0.04 W m –2 globally.
• Global ocean heat content observations show conside rable interannual and inter-decadal variability.
GRAVITY
Measurements of Sea Level Change
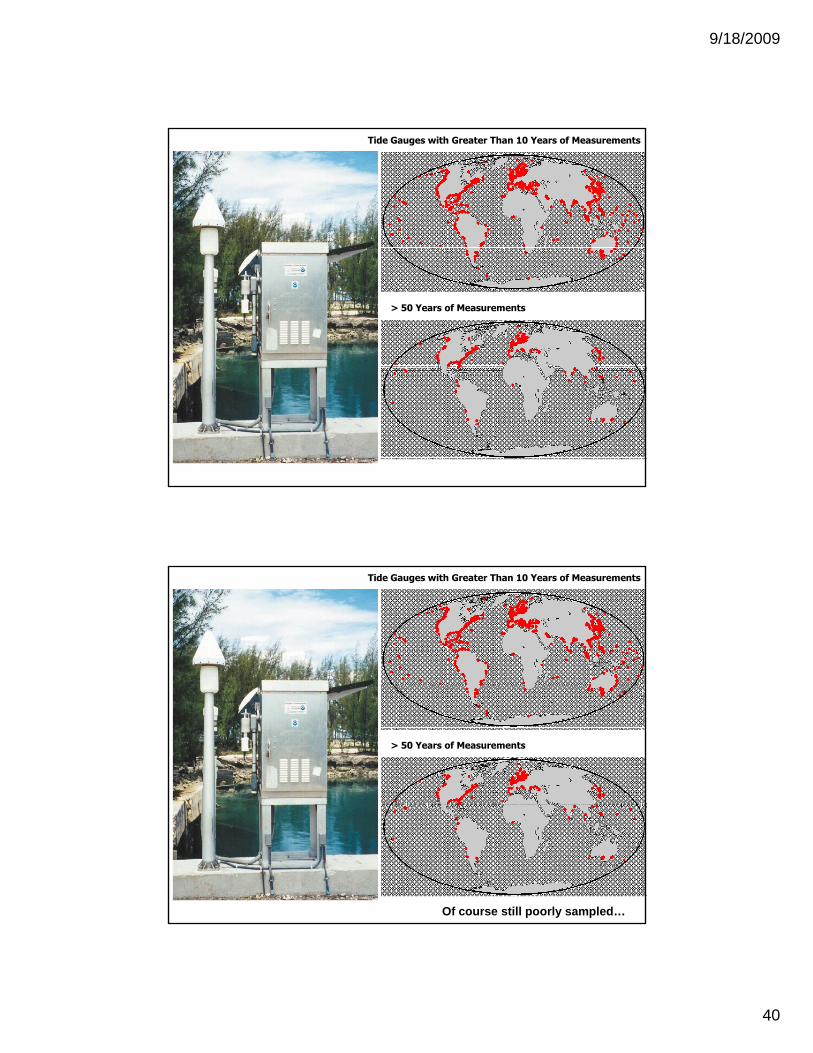
9/18/2009
40
Tide Gauges with Greater Than 10 Years of Measurements
> 50 Years of Measurements
Tide Gauges with Greater Than 10 Years of Measurements
> 50 Years of Measurements
Of course still poorly sampled…
9/18/2009
41
100
150Tide Gauge Observations3.2 mm/year
0
50
∆∆ ∆∆MS
L (m
m)
0.8 mm/year
2.0 mm/year
-100
-50
1880 1900 1920 1940 1960 1980 2000Year
Average Rate ~ 1.8 mm/year
[Church and White, 2006]
TOPEX/Poseidon1992-2005
Jason-12001 - ?
Satellite Altimeters
OSTM/Jason-22008

9/18/2009
42
Geographical distribution of sea level trends (1993 -2005)
Global Mean Sea Level from Satellite Altimetry
Average Rate = 3.5 mm/year(1993-2006)
1997-19981997-1998El Nino
[Mitchum and Nerem, 2007]

9/18/2009
43
10
15
20
Thermal Expansion: Contribution to Sea Level
Rate = 0.4 mm/year (1955-2004)
Rate = 1.2 - 1.6 mm/year (1993-2004)
-5
0
5
10
∆∆ ∆∆MS
L (m
m)
-15
-10
1960 1970 1980 1990 2000Year[Levitus et al., 2005; Antonov et al., 2005]
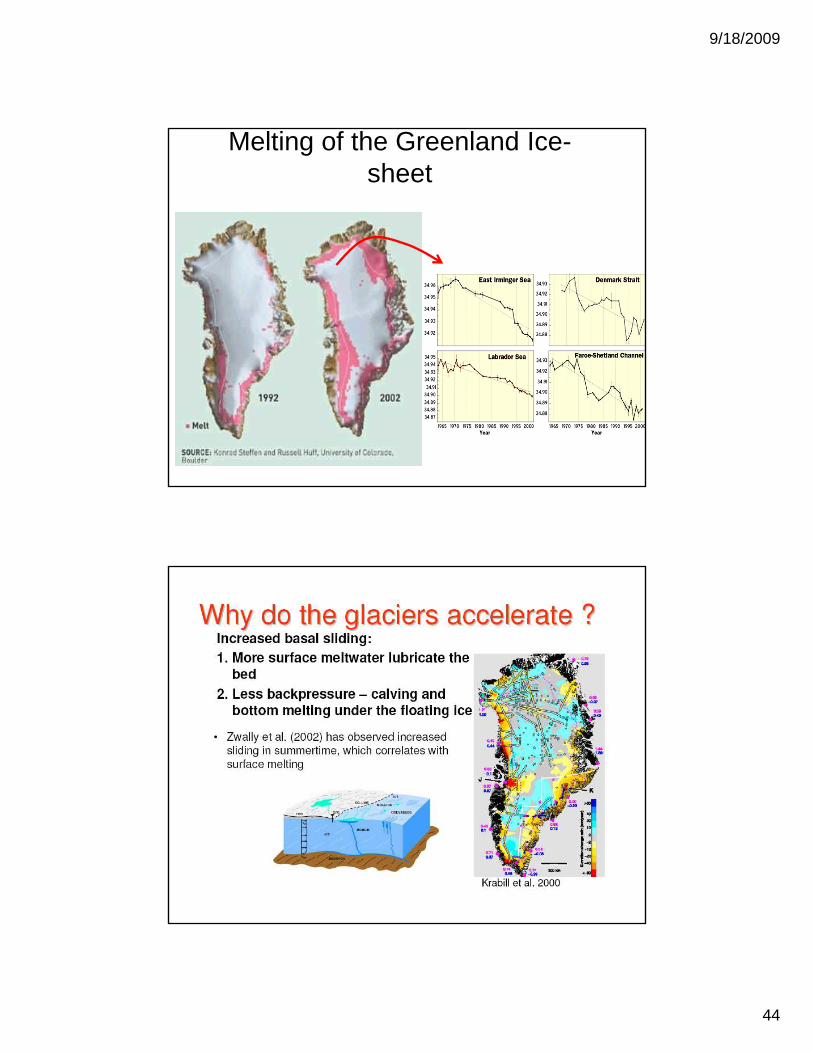
Greenland Melt Extent
9/18/2009
44
Melting of the Greenland Ice-sheet
9/18/2009
45
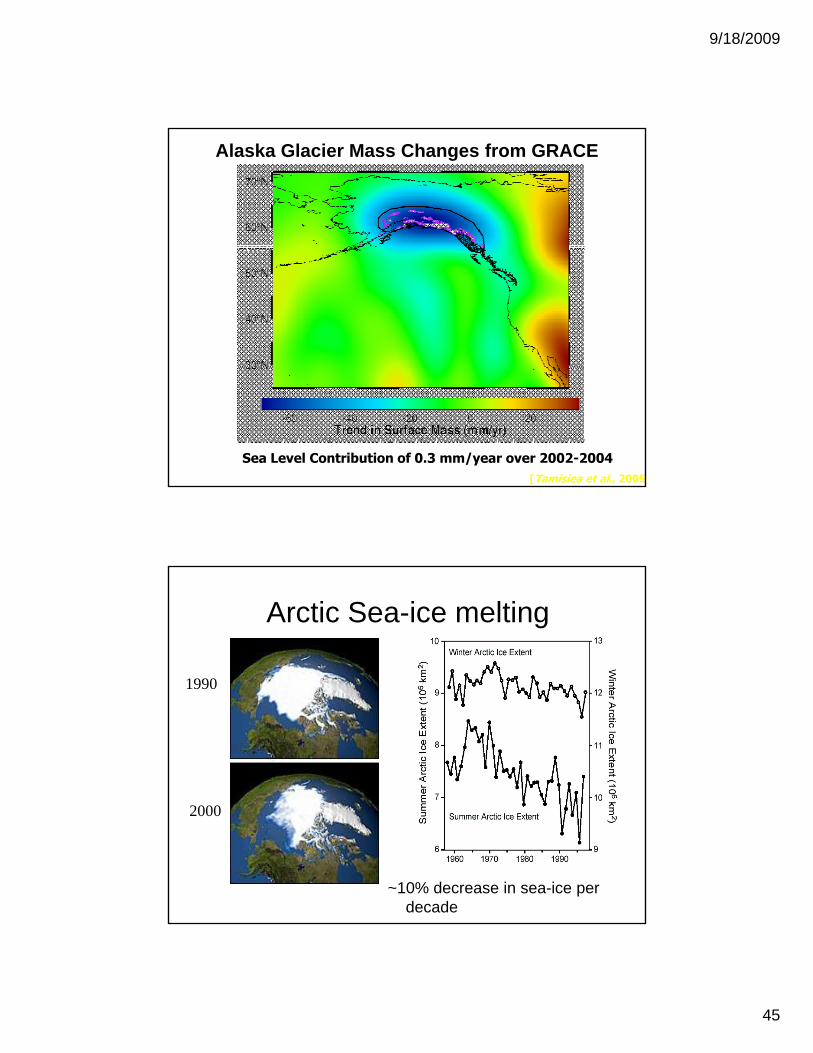
Alaska Glacier Mass Changes from GRACE
[Tamisiea et al., 2005]
Sea Level Contribution of 0.3 mm/year over 2002-2004
Arctic Sea-ice melting
19901990
20002000
~10% decrease in sea-ice per decade

9/18/2009
46
Antarctic Ice Mass Flux from InSARSLR 0.4 to 0.6 mm/yr
-37±20 km3/yr
-2
+5 km3/yr
-2 km3/yr-2 km3/yr
-4 km3/yr
-114 km3/yr
-38 km3/yr
+48 km3/yr
-2 km3/yr
-3 km3/yr
-4 km3/yr
-49±20 km3/yr
-114 km3/yr
+33 km3/yr
-22 km3/yr
+5 km3/yr
-56 km3/yr
+21 km3/yr
-33 km3/yr
[Rignot, 2005]

9/18/2009
47
Is Sea Level Rise Accelerating?
• Short answer: probably• The satellite sea level record is too • The satellite sea level record is too
short (~14 years) to rule out that the recent rise is due to natural decadal variability.
• This is only likely to be resolved by having a longer satellite data record (~30 years).record (~30 years).
• The decline in satellite programs in recent years has put this in jeopardy.
NEAR FUTURE PERSPECTIVES NEAR FUTURE PERSPECTIVES
ALTIMETRYALTIMETRYfor measuringfor measuringsea levelsea level
� Long sea level time seriesLong sea level time series
ARGO
GRACE
� Thermal expansion + salinityThermal expansion + salinity
� Land waters (climate + human activities)Land waters (climate + human activities)�� Ice sheets mass balanceIce sheets mass balanceGRACE
Swath altimetry
�� Ocean mass change + thermal expansionOcean mass change + thermal expansion
� Surface Waters monitoringSurface Waters monitoring
9/18/2009
48
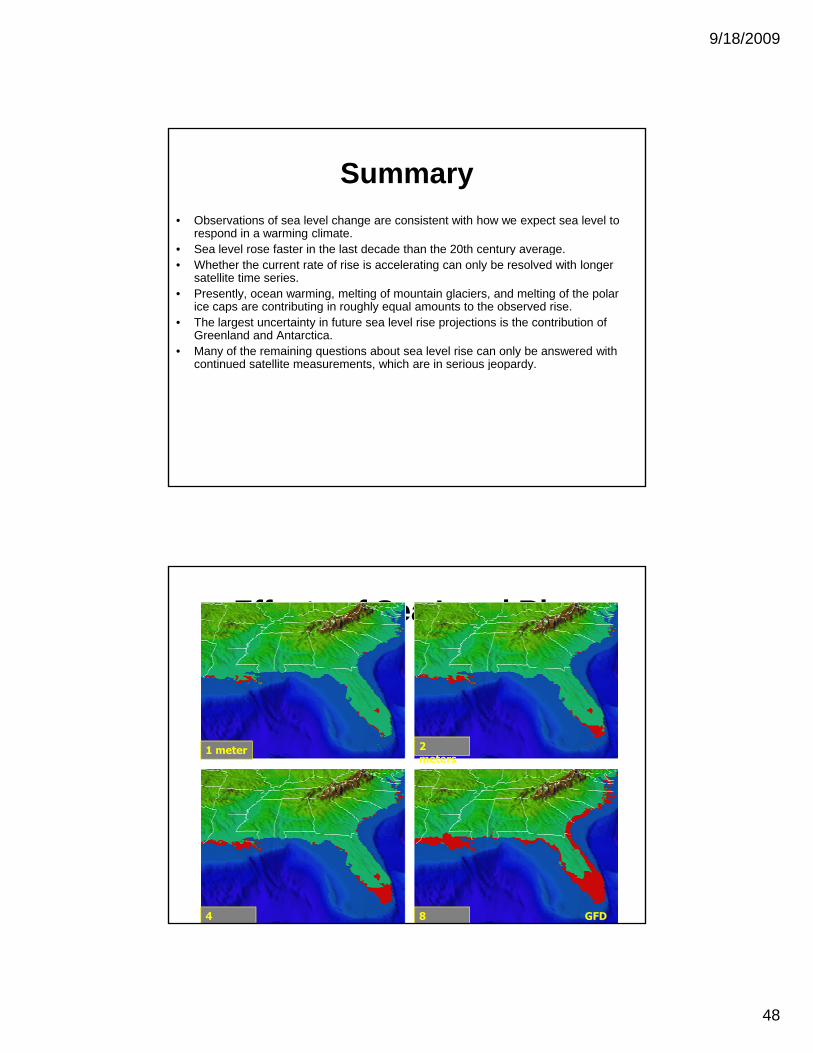
Summary• Observations of sea level change are consistent with how we expect sea level to
respond in a warming climate.• Sea level rose faster in the last decade than the 20th century average.• Sea level rose faster in the last decade than the 20th century average.• Whether the current rate of rise is accelerating can only be resolved with longer
satellite time series.• Presently, ocean warming, melting of mountain glaciers, and melting of the polar
ice caps are contributing in roughly equal amounts to the observed rise.• The largest uncertainty in future sea level rise projections is the contribution of
Greenland and Antarctica.• Many of the remaining questions about sea level rise can only be answered with
continued satellite measurements, which are in serious jeopardy. continued satellite measurements, which are in serious jeopardy.
Effects of Sea Level Rise
1 meter 2 meters
4 meters
8 meters
GFDL
9/18/2009
49
9/18/2009
50
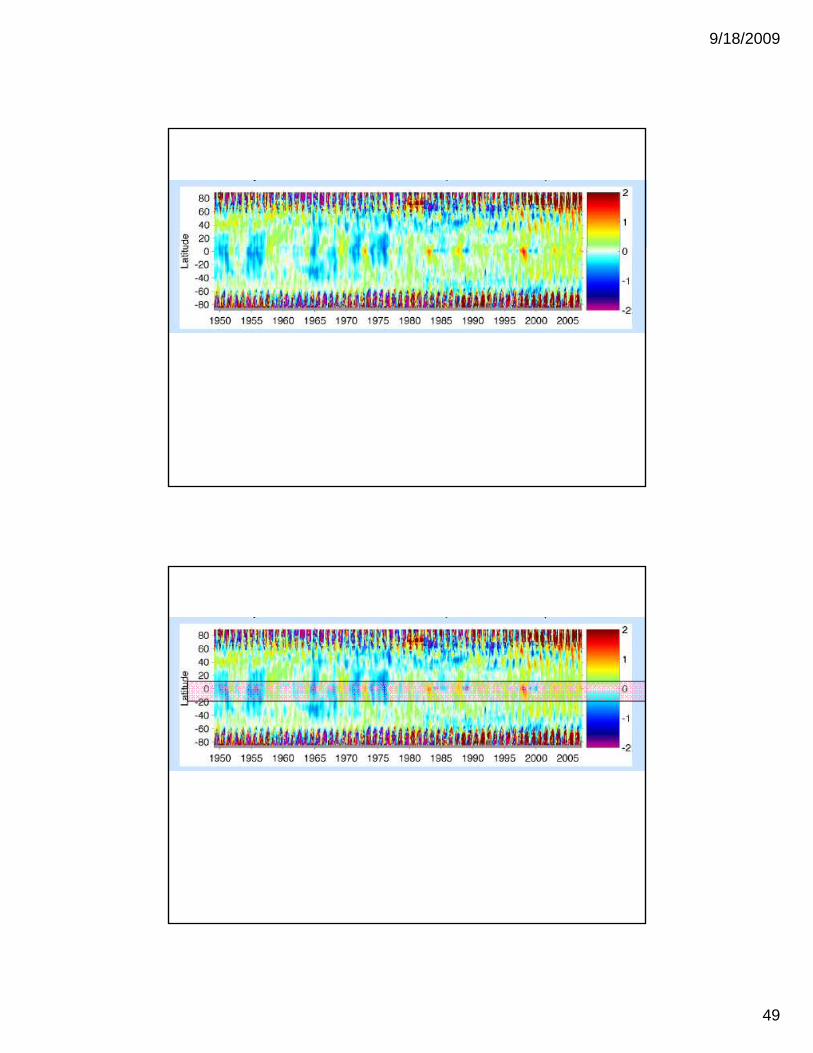
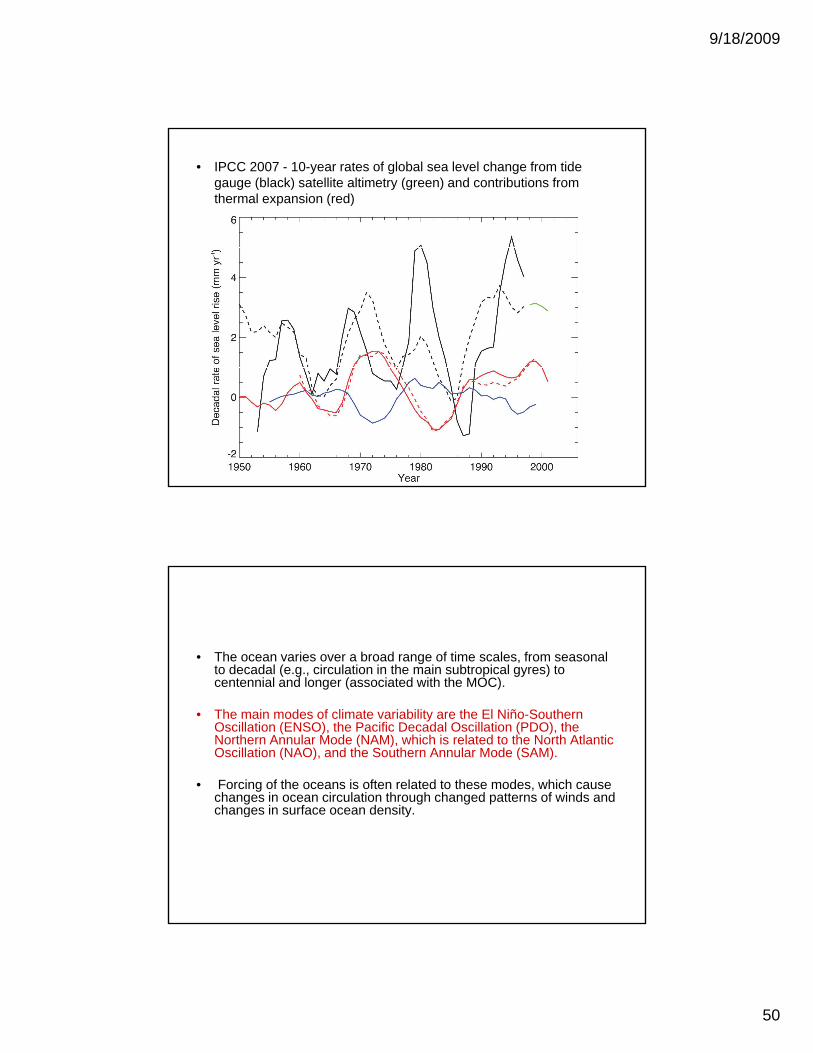
• IPCC 2007 - 10-year rates of global sea level change from tide gauge (black) satellite altimetry (green) and contributions from thermal expansion (red)
• The ocean varies over a broad range of time scales, from seasonal to decadal (e.g., circulation in the main subtropical gyres) to centennial and longer (associated with the MOC). centennial and longer (associated with the MOC).
• The main modes of climate variability are the El Niño-Southern Oscillation (ENSO), the Pacific Decadal Oscillation (PDO), the Northern Annular Mode (NAM), which is related to the North Atlantic Oscillation (NAO), and the Southern Annular Mode (SAM).
• Forcing of the oceans is often related to these modes, which cause changes in ocean circulation through changed patterns of winds and changes in surface ocean density.changes in surface ocean density.
9/18/2009
51
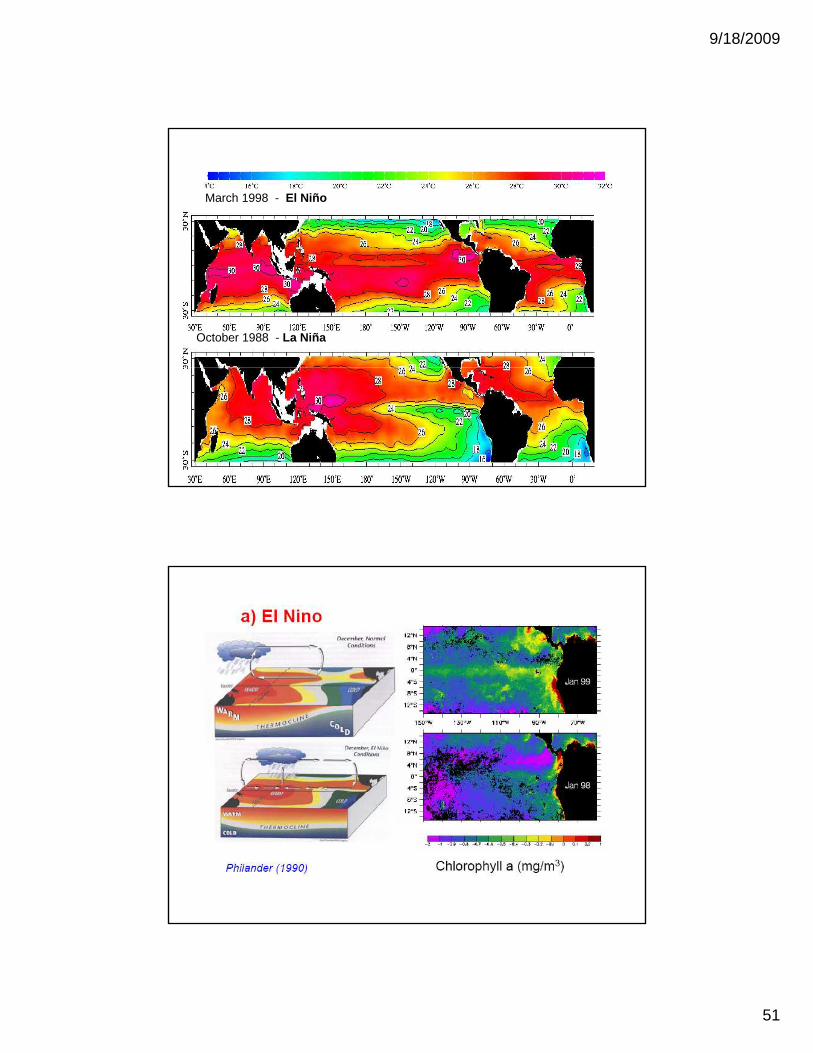
March 1998 - El Niño
October 1988 - La Niña

9/18/2009
52
Changing Southern Hemisphere climate: the Southern Annular Mode
Sen Gupta & England 2006
9/18/2009
53
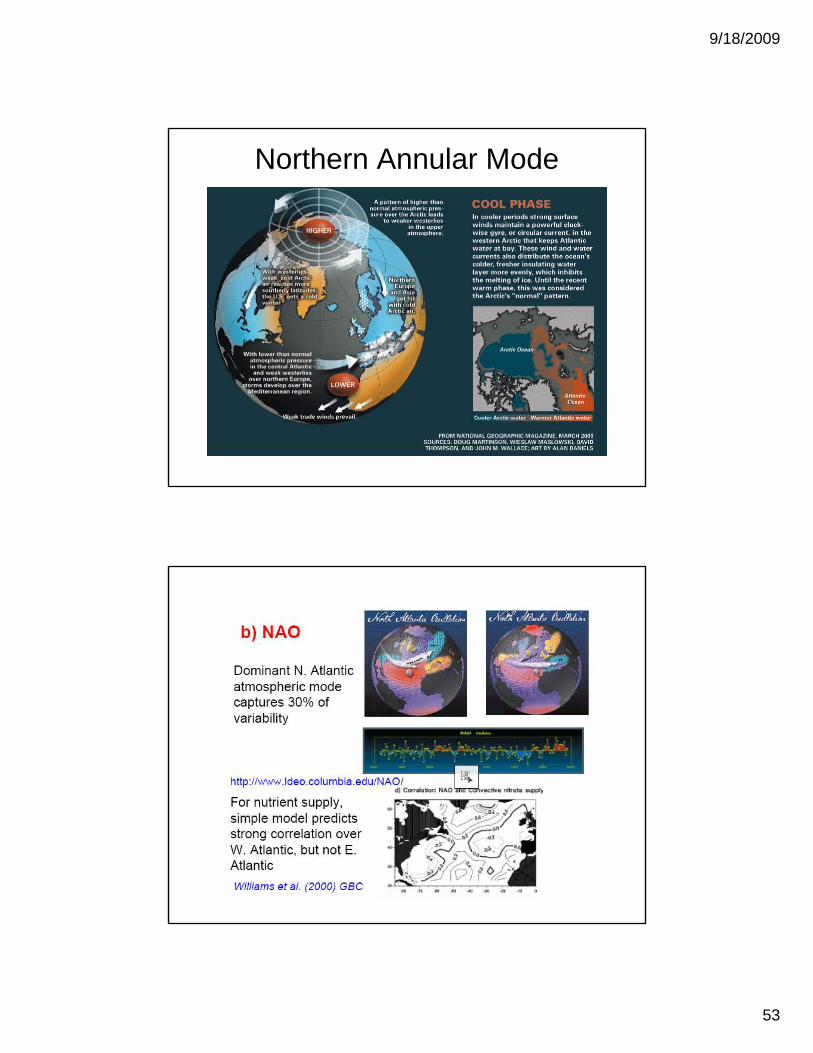
Northern Annular Mode

9/18/2009
54
Oceans and CO 2
• Passive ocean CO2 uptake• Reduction in surface ocean pH ➾ ‘ocean • Reduction in surface ocean pH ➾ ‘ocean
acidification’• Passive uptake cannot keep up with
increased anthropogenic CO2 ➾ active uptake (‘CO2 sequestration’) ➾ ocean acidificationuptake (‘CO2 sequestration’) ➾ ocean acidification

9/18/2009
55
“Anthropogenic C0 2 Invasion”
• Impacts of “invading CO2” on ocean chemistry and biologychemistry and biology
• Original methodological challenges related to measuring the anthropogenic part of DIC
• Models of future DIC concentrations are key:– 0.3-0.5 by 2030– 0.3-0.5 by 2030– 0.8-1.4 by 2300(Caldeira & Wickett, 2005)
Impacts on Ocean Biology
• Corals (ocean acidification induces a decrease in C++; cumulative impacts: >T, decrease in C++; cumulative impacts: >T, >pH)
• Reduced growth, calcification and survival of many other shallow benthic species
• Affects fish physiology• Invertebrates’ physiology also affected • Invertebrates’ physiology also affected
(also cumulative impacts: >T, <dissolved O2)

9/18/2009
56
Impacts of Ocean AcidificationImpacts of Ocean AcidificationImpacts of Ocean AcidificationImpacts of Ocean Acidification
• Generally, ocean acidification affects ocean biology and how the ocean functions as a systemhow the ocean functions as a system
• Passive uptake of CO2 will gradually invade the deep ocean
Tropical (above) and subtropical pteropods; stony cold water corals (right)
CO2 Sequestration in the Deep?
• Naturally, most deep organisms tend to avoid natural pH variations (e.g. vent plumes)natural pH variations (e.g. vent plumes)
• Liquid CO2 lake scenario on the deep ocean floor: many factors affecting stability
• Judicious choices should be made (delivery schemes, injection rates, droplet size, bottom bathymetry, water column injection, etc.)
• Iron fertilization as a mitigation strategy? Side • Iron fertilization as a mitigation strategy? Side effects include <dissolved 02, >atmospheric N2O, <nutrients downstream from a fertilization side)

9/18/2009
57
Are We in Trouble?
“Geo-engineering schemes are not well understood.well understood.
Planet-sized geo-engineering means planet-sized risks.“
Caldeira, K.
What Can We Do?• IOCIOCIOCIOC----SCOR Ocean Acidification Symposium SeriesSCOR Ocean Acidification Symposium SeriesSCOR Ocean Acidification Symposium SeriesSCOR Ocean Acidification Symposium Series
• Policy side: Royal Society Policy Report Policy side: Royal Society Policy Report Policy side: Royal Society Policy Report Policy side: Royal Society Policy Report • Policy side: Royal Society Policy Report Policy side: Royal Society Policy Report Policy side: Royal Society Policy Report Policy side: Royal Society Policy Report RecommendationsRecommendationsRecommendationsRecommendations– There is a clear risk of significant adverse effects of ocean
acidification. This risk should be taken into account by policy-makers and other relevant national and international bodies.
– Any targets set for CO2 emission reductions should take account of the impact on ocean chemistry and acidification as well as climate change.
– Ocean acidification and its impacts on the oceans needs to be taken into account by the Intergovernmental Panel on Climate Change and kept under review by international scientific bodies.

9/18/2009
58
Royal Society Policy Report Recommendations (cont.)• The increased fragility and sensitivity of marine ecosystems due to ocean The increased fragility and sensitivity of marine ecosystems due to ocean The increased fragility and sensitivity of marine ecosystems due to ocean The increased fragility and sensitivity of marine ecosystems due to ocean
acidification, climate change, deteriorating water quality, coastal acidification, climate change, deteriorating water quality, coastal acidification, climate change, deteriorating water quality, coastal acidification, climate change, deteriorating water quality, coastal deforestation, fisheries and pollution needs to be taken into consideration deforestation, fisheries and pollution needs to be taken into consideration deforestation, fisheries and pollution needs to be taken into consideration deforestation, fisheries and pollution needs to be taken into consideration during the development of any policies that relate to their conservation, during the development of any policies that relate to their conservation, during the development of any policies that relate to their conservation, during the development of any policies that relate to their conservation, deforestation, fisheries and pollution needs to be taken into consideration deforestation, fisheries and pollution needs to be taken into consideration deforestation, fisheries and pollution needs to be taken into consideration deforestation, fisheries and pollution needs to be taken into consideration during the development of any policies that relate to their conservation, during the development of any policies that relate to their conservation, during the development of any policies that relate to their conservation, during the development of any policies that relate to their conservation, sustainable use and exploitation, or effects on the communities that depend sustainable use and exploitation, or effects on the communities that depend sustainable use and exploitation, or effects on the communities that depend sustainable use and exploitation, or effects on the communities that depend on them.on them.on them.on them.
• Tackling ocean acidification cannot be done by any country alone. A major Tackling ocean acidification cannot be done by any country alone. A major Tackling ocean acidification cannot be done by any country alone. A major Tackling ocean acidification cannot be done by any country alone. A major internationallyinternationallyinternationallyinternationally----coordinated research effort (including monitoring) into ocean coordinated research effort (including monitoring) into ocean coordinated research effort (including monitoring) into ocean coordinated research effort (including monitoring) into ocean chemical changes should be launched, with additional investments.chemical changes should be launched, with additional investments.chemical changes should be launched, with additional investments.chemical changes should be launched, with additional investments.
• International research collaboration should be enhanced, from laboratory, International research collaboration should be enhanced, from laboratory, International research collaboration should be enhanced, from laboratory, International research collaboration should be enhanced, from laboratory, mesocosm and field studies to global monitoring.mesocosm and field studies to global monitoring.mesocosm and field studies to global monitoring.mesocosm and field studies to global monitoring.mesocosm and field studies to global monitoring.mesocosm and field studies to global monitoring.mesocosm and field studies to global monitoring.mesocosm and field studies to global monitoring.
• Action needs to be taken now to reduce global emissions of CO2 to the Action needs to be taken now to reduce global emissions of CO2 to the Action needs to be taken now to reduce global emissions of CO2 to the Action needs to be taken now to reduce global emissions of CO2 to the atmosphere to avoid the risk of large and irreversible damage to the oceans. atmosphere to avoid the risk of large and irreversible damage to the oceans. atmosphere to avoid the risk of large and irreversible damage to the oceans. atmosphere to avoid the risk of large and irreversible damage to the oceans. We recommend that all possible approaches be considered to prevent CO2 We recommend that all possible approaches be considered to prevent CO2 We recommend that all possible approaches be considered to prevent CO2 We recommend that all possible approaches be considered to prevent CO2 reaching the atmosphere. No option that can make a significant contribution reaching the atmosphere. No option that can make a significant contribution reaching the atmosphere. No option that can make a significant contribution reaching the atmosphere. No option that can make a significant contribution should be dismissed. should be dismissed. should be dismissed. should be dismissed.