climate change and the weather halldór björnsson
TRANSCRIPT
Climate change and the weather
Halldór Björnsson

Weather vs climate
Edward Lorenz (20th century): “Climate is what you expect and weather is
what you get”
Myles Allen (21st century): “Climate is what you change, and weather is
what gets you”

This weather is brought to you by ....
During almost any notable weather event (except maybe extra cold snaps) a meteorologist will be asked: Is this global warming?
Possible exception will be when next big El Nino strikes...
Is this rain/wind/heat/cold/cloud pattern/bird migration....due to El Nino?
Do such questions make sense?
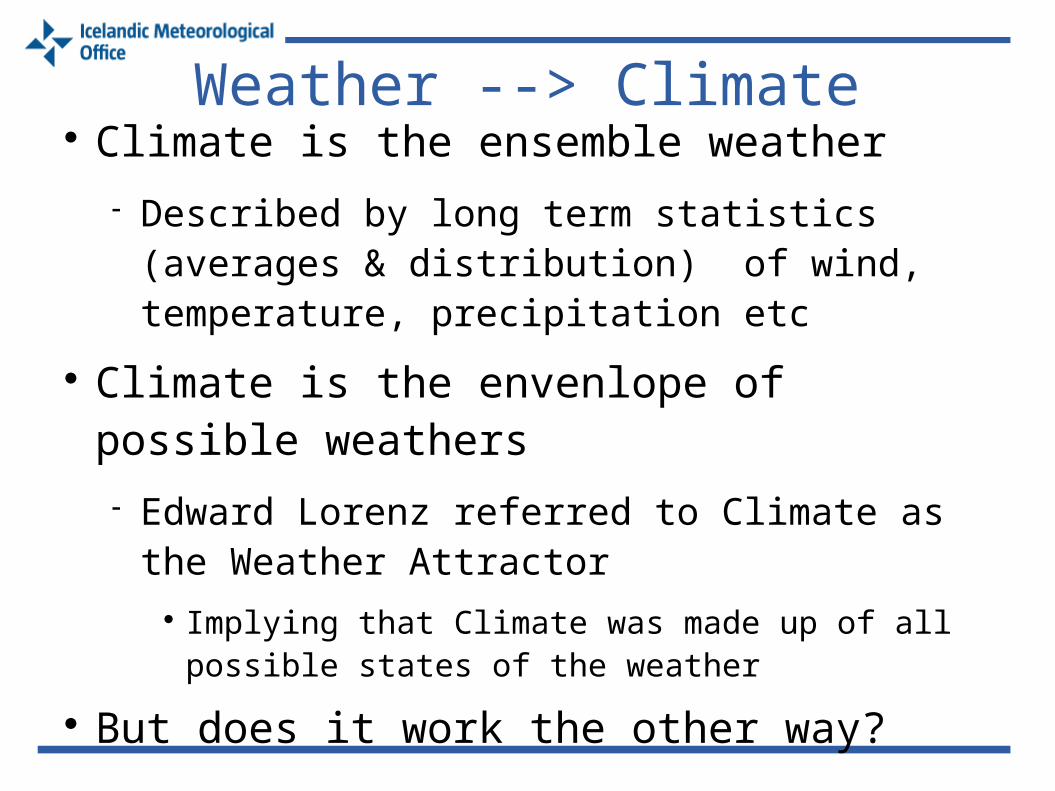
Weather --> Climate Climate is the ensemble weather
Described by long term statistics (averages & distribution) of wind, temperature, precipitation etc
Climate is the envenlope of possible weathers Edward Lorenz referred to Climate as the
Weather Attractor Implying that Climate was made up of all possible
states of the weather
But does it work the other way?

Climate --> Weather
Climate can also be though of as the set of conditions that determine what weather is possible Conditions such as ocean, ocean currents,
ice, chemical composition, snow cover, vegitation, orography, etc
From this viewpoint it is easy to see climate change impacting weather. --> The climate system
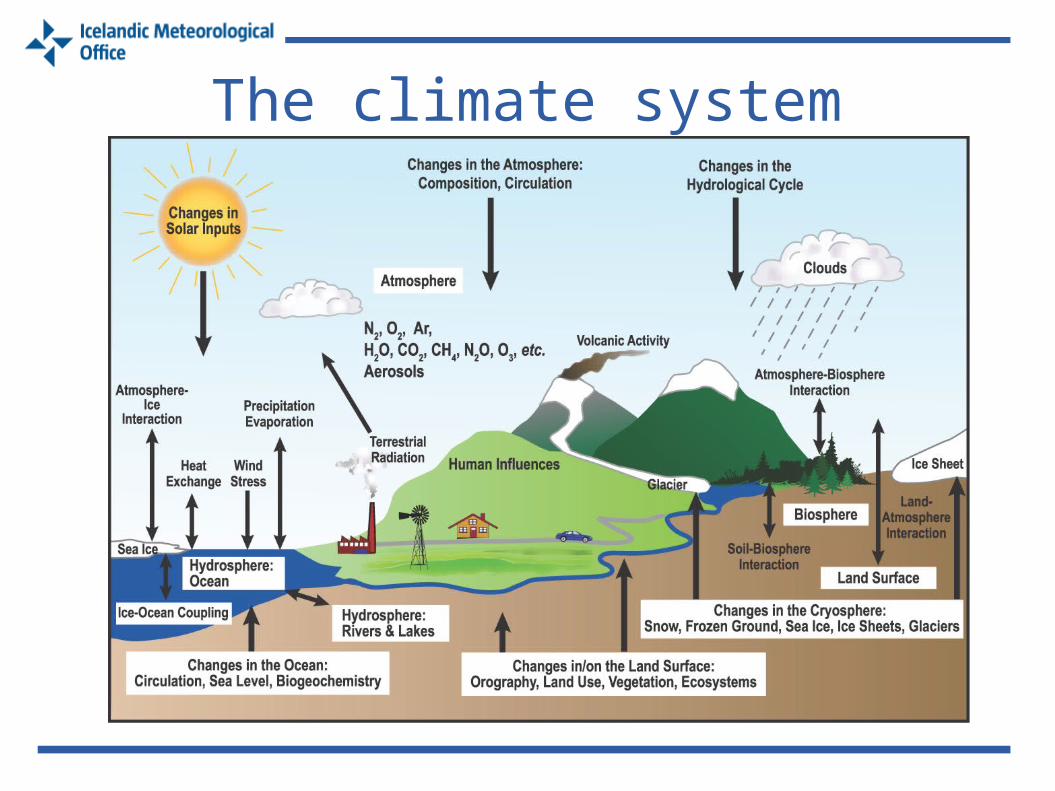
The climate system

Controls on the climate system
Greenhouse effectRadiative forcing

The greenhouse effect
Its been known for a long time that the atmosphere keeps the surface of the earth warmer than direct solar heating implies.
This is primarily due to a few different gasses present in the atmosphere.... .....some in only in very small quantities

Fourier (1827)
In a rather incomprehensible article Fourier writes: ... c’est ainsi que la température est
augmentée par l’interposition de l’atmosphère, parce que la chaleur trouve moins d’obstacle pour pénétrer l’air, étant a l’etat de lumière, quelle n’en trouve pour repasse dans l’air lorsque’elle est convertie en chaleur obscure.
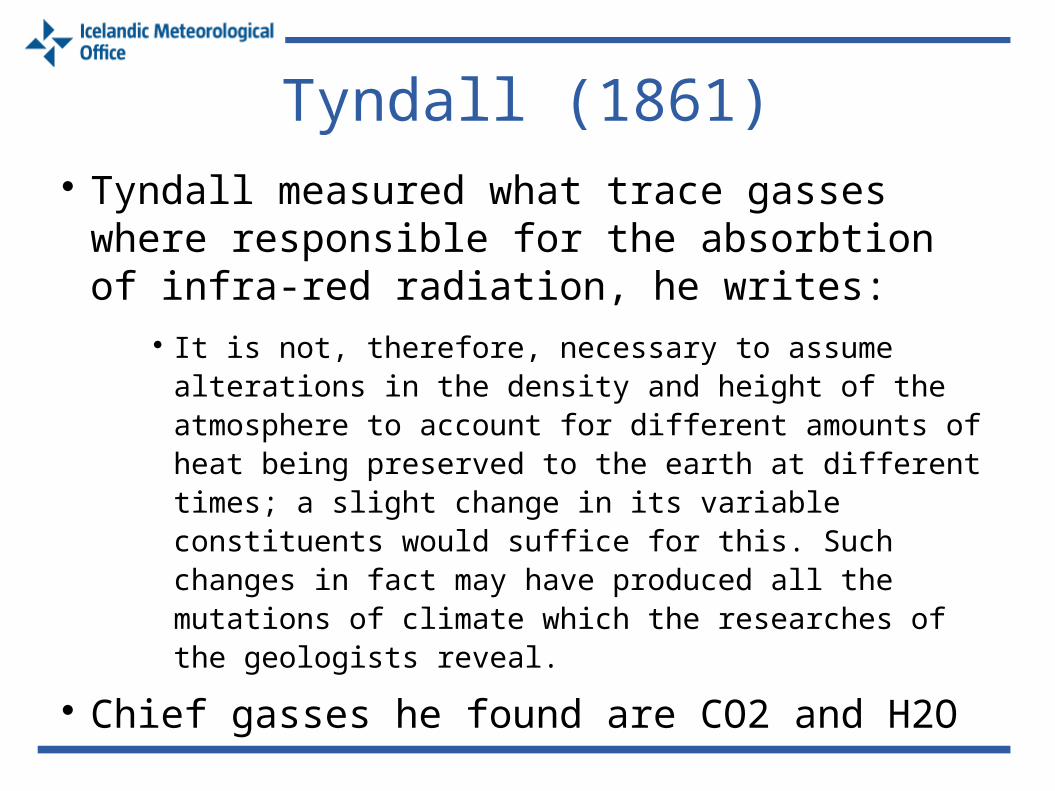
Tyndall (1861) Tyndall measured what trace gasses
where responsible for the absorbtion of infra-red radiation, he writes:
It is not, therefore, necessary to assume alterations in the density and height of the atmosphere to account for different amounts of heat being preserved to the earth at different times; a slight change in its variable constituents would suffice for this. Such changes in fact may have produced all the mutations of climate which the researches of the geologists reveal.
Chief gasses he found are CO2 and H2O

The effect can be measured
CO2
O3
H2O
H2O
Weather satellites measure heat radiation Those measurements clearly show the
greenhouse effect
At noon on this day the US weather satellite NIMBUS 4 went over the Iceland

Greenhouse gasses are on the rise.. CO2 concentration
have gone up by 100ppm (36%) in the last 250 years Half of the
increase in the last 50 years
Beyond doubt that this is due to human activity
Other greenhouse gasses also increasing
IPCC & the 4th assessment
To ensure that the community of nations had reliable information on the issue the UN founded the Intergovernmental Panel on Climate Change (IPCC) in 1988.
The panel publishes assessments on the state of knowledge in the field. The 4th assessment was published in 2007
In the 70's the increasing greenhouse gasses led to worries of impending global warming
1973 was the warmest year since 1938
A list of 10 warmest years includes only 1 year prior to 1998, and all the years since 2001 are on it.
Update: 2008 took spot number 10. No year prior to 1998 left on the top 10 list.
1981 was warmer, then came another record in 1983, and that record lasted until 1988, then came 1990, 1995, and 1998 was unprecedented ..... until matched by 2005!

Radiative forcing since pre-industrial
Changes in CO2have largest impact
Some changes havea cooling effect
Influence of solar variability is small
A definite increase
=>Global warming
Fig AR4 WGI TS.5
Changes in radiative forcing

Warming of 0.7°C during last 100 years
Sea level rise
Decreasing snow cover in N-Hemisphere

Anthropogenic?
Only when human induced increases in greenhouse gasses and aerosols are included in climate models can they simulate temperature changes during the last century

IPCC 2007 recap Warming in last 100 year slightly exceeds
0.7°C Warming intensified towards northern high
latitudes Diminished snow cover, earlier spring thaw Widespread glacier retreat Reduced sea ice cover, especially during
summer Sea level rise
1.8 cm/decade since 1961 & 3.1 cm from 1993 to 2003
Ecosystems: poleward and upwards shift in ranges for various plants & animals Earlier spring events (egg laying, leaf
unfolding etc.)

IPCC 2007 recap cont. Precipitation signal is complex:
More precipitation in wet tropics and higher latitudes.
Less precipitation in many areas that are already dry.
More intense rain events, - even in areas where droughts are more common.
Frequency of floods and droughts has increased.
Higher incidence of heat related fatalities Oceanic acidification.

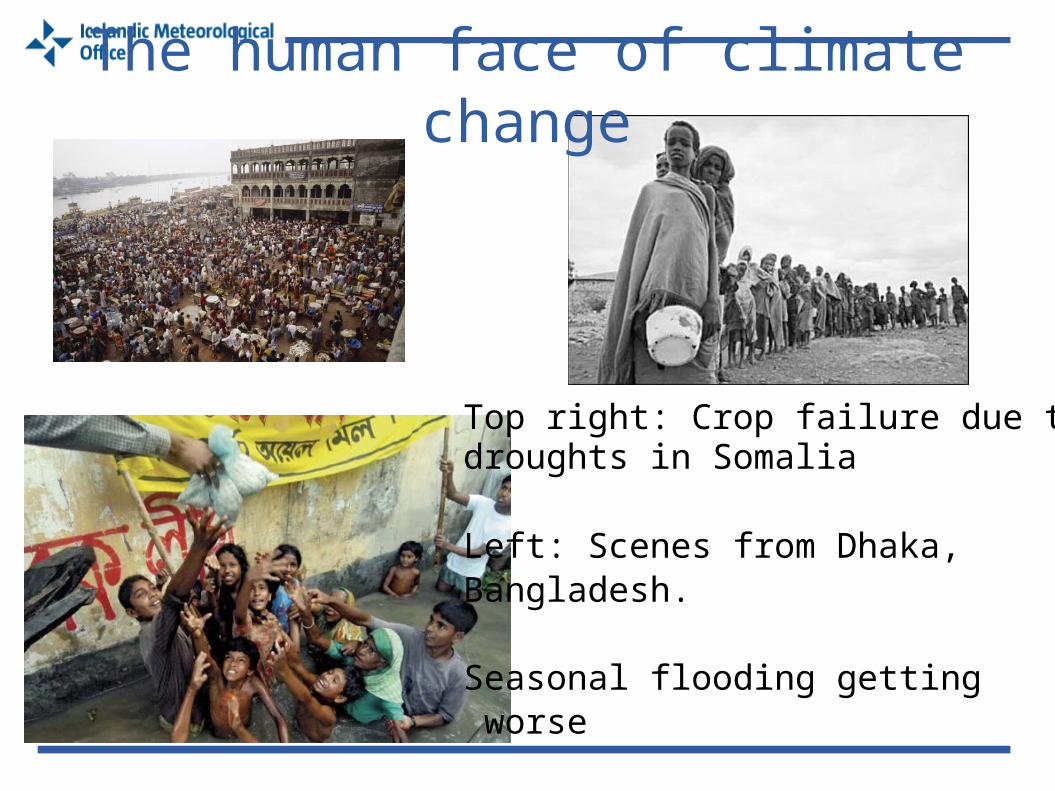
Top right: Crop failure due to droughts in Somalia
Left: Scenes from Dhaka, Bangladesh.
Seasonal flooding getting worse
The human face of climate change

Quo vadis?Two degrees since pre-industrial

21st Century warming
2 decades hence End of days
Scenario
B1
A1B
A2
Greater warming over continents than oceanic areas
Enhanced polar warming
(IPCC 2007)


Sea level rise
The exclusion of rapid changes in ice flow is controversial
If changes scale with temperature increase then 10 – 20 cm can be added to the sea level numbers
Higher values (1m ?) may be justified (Rahmstorf 2007)

And the weather?

Changes in mean & extreme
Weather (temperature, precip, wind etc)
Inci
dence
Distribution shifted to higher values
Distribution shifted and distorted
The distribution of a weather related parameter may be shifted
e.g. uniform warming
The distribution may be shifted and distorted
More changes in extremes
More often strange weather...

When can you say strange weather is due to global
warming? Short answer:
Never!!!!
Is that correct? Probably not....
It is unlikely that you can say with certainty, but certain kinds of weather may fit-the-bill...
... made more likely by global change
Often the question really is: is our fault?

The summer of 2003 in Europe
The heatwave had complex causes Persistent clear skies, dry soils etc.
Model simulations show that anthropogenic greenhouse effect doubled the risk of such a hot summer in Europe
(Switzerland 1864 - 2003)

Hurricane Katrina The costliest hurricane in history.
But note: Bhola killed ~ ½ million in Bangladesh
Was it due to global warming? Warm waters make stronger hurricanes
The loop current was unusually warm Both Rita and Katrina intensified on passing over
the loop current Was the loop current exceptionally warm? Probably not.
Climate change will probably lead to stronger hurricanes.

Contrast with El Nino During El Nino certain
temperature and precipitation anomalies are well established
Can you pinpoint individual storms on El Nino? In California a forcaster
may say: “Its El Nino season, and
then we get these kinds of storms”
Tem. MAM. Red:Hot
Precip. MAM. Red: Dry
Source: KNMI

Summary
Climate is both the statistics of the weather and the system that sets bounds on what weather is “normal”
Climate change is a change in weather statistics (mean & extremes)
Individual events are not likely to be pinpointed as being due to climate change
However, certain types of weather become more common with climate change

Everything radiates Everything warmer than 0K radiate
energy Example: Solar radiation, we see part of it.
Solar energy heats the surface
If this was all then the globewould be a lot colder at least 33°C colder

Greenhouse effect The surface warms and radiates heat Clouds and atmospheric gasses absorb
the radiation, warm and radiate... into space .. ..and towards the
surface As a consequence the
lower part of the atmosphere and the surface warm
This is known as the greenhouse effect
Radiative forcing