climate change and variability: observed trends for...
TRANSCRIPT

Climate Change and Variability:Climate Change and Variability:
Observed trends for Australia, Observed trends for Australia,
NSW and the NSW and the NamoiNamoi
Perry Wiles
NSW Climate Services Centre
Climate Change and Agriculture Climate Change and Agriculture
21 & 22 March 200721 & 22 March 2007

Outline
� Climate variability in Australia and NSW
� Observed temperature trends
� Observed rainfall trends

“…of droughts and flooding rains”
Australian climate variability

Driest inhabited continent

High annual rainfall variability
Variability of Annual rainfall
0
2
4
6
8
10
12
14
16
18
20
Australia S. Africa Germany France NZ India UK Canada China USA Russia
Country
Co
eff
icie
nt
(%)

Seasonal rainfall zones

Global atmospheric circulation
Source: The Greenhouse Effect and Climate Change, Bureau of Meteorology
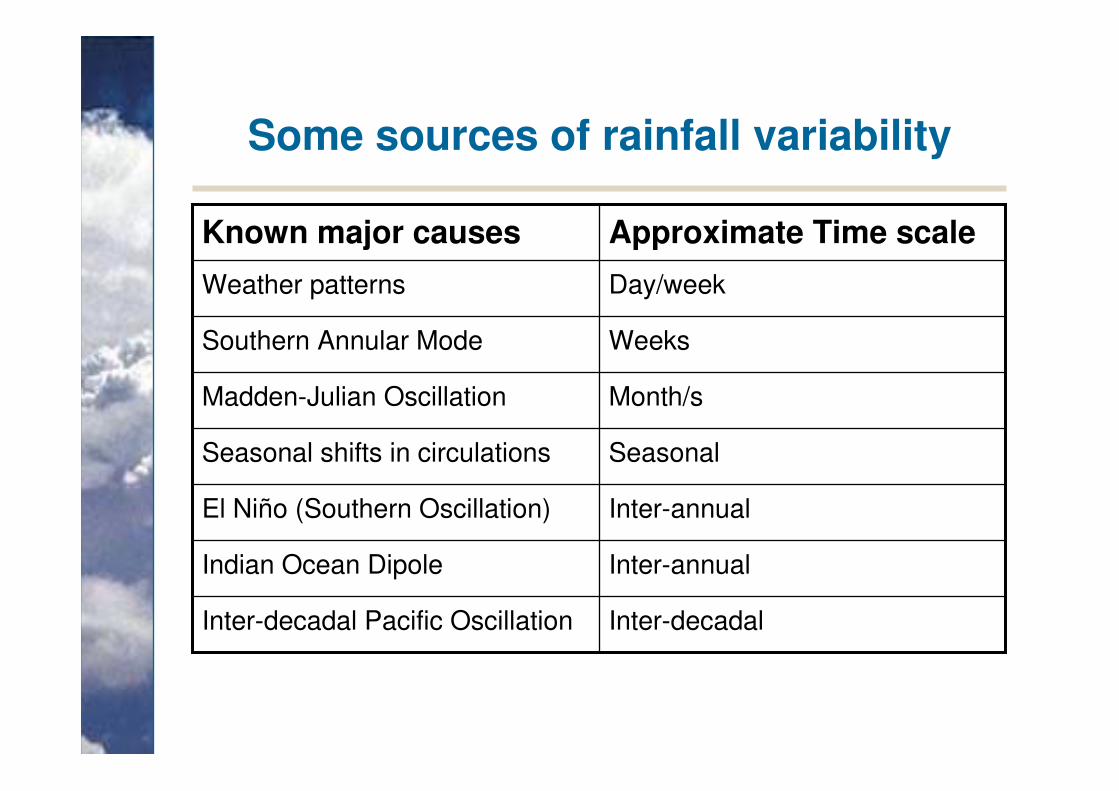
Some sources of rainfall variability
Inter-decadalInter-decadal Pacific Oscillation
Inter-annualIndian Ocean Dipole
Inter-annualEl Niño (Southern Oscillation)
SeasonalSeasonal shifts in circulations
Month/sMadden-Julian Oscillation
WeeksSouthern Annular Mode
Day/weekWeather patterns
Approximate Time scaleKnown major causes

Observed climate change trends
� Detection
o Finding a trend “signal” in the variability “noise”
� Attribution
o What is causing any trend?

Observed Temperature Trends

Australian Temperature Trends
1910-2006 trends - Max T: 0.06°C/decade, Min T 0.12°C/decade

Australian Maximum Temperature Trends

Seasonal Maximum Temperature Trends
Winter
Spring
Autumn
Summer

MDB Maximum Temperature Timeseries
�1961-90 average 24.45°C

Local area maximum temperature trend
Annual Mean Maximum Temperature 1941 - 2006
(Rainfall Districts 53, 54, & 55)
22.5
23
23.5
24
24.5
25
25.5
26
26.5
1940 1950 1960 1970 1980 1990 2000
Year
Tem
pera
ture
(d
eg
C)

Australian Minimum Temperature Trends

Seasonal Minimum Temperature Trends
Summer
Winter
Spring
Autumn

MDB Minimum Temperature Timeseries
�1961-90 Average 24.45°C�1961-90 average 10.88°C

Local area minimum temperature trend
Annual Mean Minimum Temperature 1941 - 2006
(Rainfall Districts 53, 54 & 55)
8
8.5
9
9.5
10
10.5
11
11.5
12
1940 1950 1960 1970 1980 1990 2000
Year
Te
mp
era
ture
(d
eg
C)

Australian Temperature Extremes

Australian Temperature Extremes

Trends in growing season length

Observed Rainfall Trends

Australian rainfall trends since 1950

Australian rainfall trends since 1900

NSW annual rainfall time-series
New South Wales Annual Rainfall
0
100
200
300
400
500
600
700
800
900
1000
1900 1910 1920 1930 1940 1950 1960 1970 1980 1990 2000
Year
Rain
fall (
mm
)
Dry Period: 1900 - 1946
Average Rainfall: 477.7mm
*Dry conditions commenced 1890
Standard Deviation: 90.4
Wet Period: 1947 - 2000
Average Rainfall: 573.9mm
20.1% increase
Standard Deviation: 127.0
New
Dry
2001/06
439.5mm
23.4%
decline

NSW seasonal rainfall trends
75
95
115
135
155
175
195
215
2351900
1905
1910
1915
1920
1925
1930
1935
1940
1945
1950
1955
1960
1965
1970
1975
1980
1985
1990
1995
2000
2005
Rain
fall (
mm
)
10 per.
Mov. Avg.
(Winter)
10 per.
Mov. Avg.
(Spring)
10 per.
Mov. Avg.
(Summer)
10 per.
Mov. Avg.
(Autumn)

Pre-1900 rainfall decline
Pre - 1900 rainfall decline
11 year moving average of annual rainfall
0
500
1000
1500
2000
2500
1857
1863
1869
1875
1881
1887
1893
1899
1905
1911
1917
1923
1929
1935
1941
1947
1953
1959
1965
1971
1977
1983
1989
1995
Rain
fall (
mm
)
Armidale
Grafton
Boggabri
Sydney
Goulburn

Shift in rainfall pattern in 1940’s
� Recognised for many years
� Not fully understood
� Project currently underway in NSW Climate Services Centre to seek to better understand what changed meteorologically and therefore get clues as to why

Change in annual average rainfall between the two periods 1900-1946 & 1947-2000 (%)
Clinton Rakich, NSW Climate Services Centre, Bureau of Meteorology
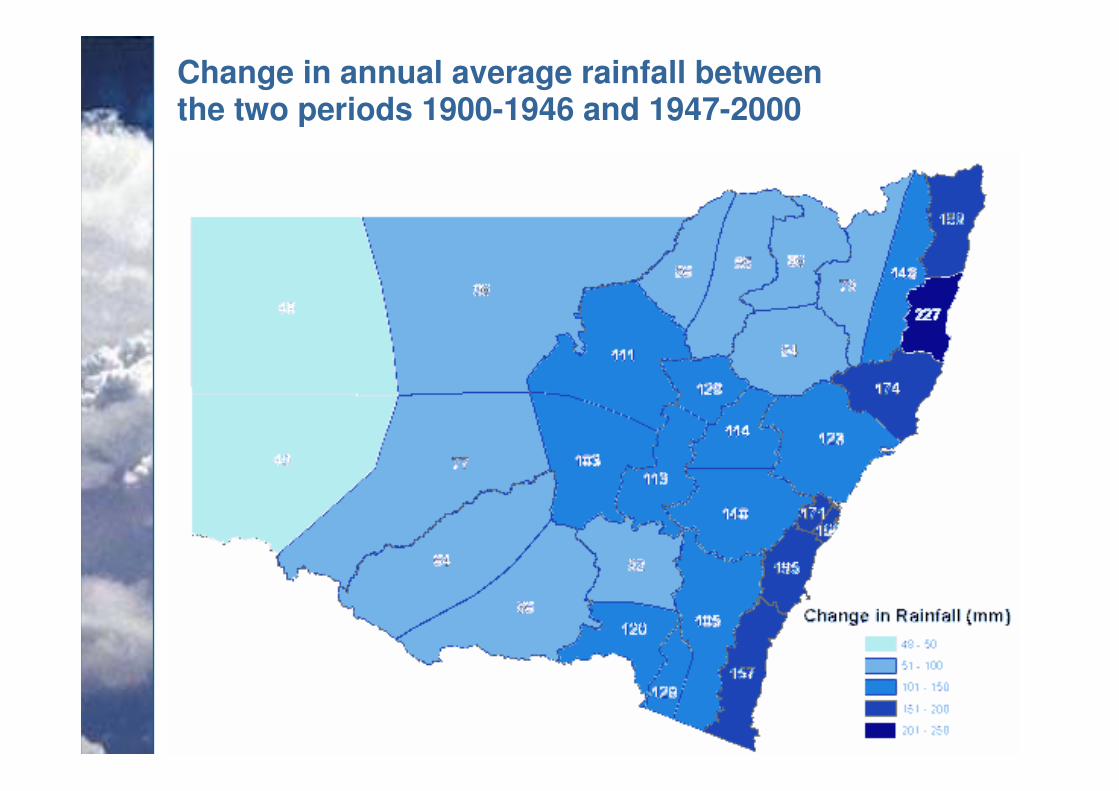
Change in annual average rainfall between the two periods 1900-1946 and 1947-2000

Change in annual average rainfall betweenthe two periods 1900-1946 and 1947-2000

Local Rainfall Trends
Annual Rainfall Timeseries for District 55
0
200
400
600
800
1000
1200
1400
18
90
19
00
19
10
19
20
19
30
19
40
19
50
19
60
19
70
19
80
19
90
20
00
Year
An
nu
al R
ain
fall

Local Area Seasonal Rainfall Trends
Seasonal Rainfall Timeseries for District 55
0
50
100
150
200
250
300
350
4001890/1
891
1900/1
901
1910/1
911
1920/1
921
1930/1
931
1940/1
941
1950/1
951
1960/1
961
1970/1
971
1980/1
981
1990/1
991
2000/2
001
Year
Ra
infa
ll (
mm
)
11 per. Mov.
Avg.
(Summer)
11 per. Mov.
Avg.
(Autumn)
11 per. Mov.
Avg. (Spring)
11 per. Mov.
Avg. (Winter)

Trends in extreme events
Average NSW Stations (25)
Number of heavy rainfall days
0
5
10
15
20
25
30
35
40
1870
1876
1882
1888
1894
1900
1906
1912
1918
1924
1930
1936
1942
1948
1954
1960
1966
1972
1978
1984
1990
1996
2002
Year
Nu
mb
er
of
da
ys
/ y
ea
rNumber of days with more than 10 mm's of rainfall / year20 mm's of rainfall / year30 mm's of rainfall / year11 per. Mov. Avg. (20 mm's of rainfall / year)

South-coastal Australian April-July Pressure (hPa)
y = 0.0411x + 936.82
R2 = 0.1497
1012
1013
1014
1015
1016
1017
1018
1019
1020
1021
1022
1023
1950 1955 1960 1965 1970 1975 1980 1985 1990 1995 2000 2005
Year
Pre
ss
ure
(h
Pa
)
••Southern Australia has been experiencing increasing Southern Australia has been experiencing increasing summer/autumn pressures since 1950, delaying the summer/autumn pressures since 1950, delaying the winter rainfall season. winter rainfall season.
Observed changes in pressure/weather systems

Observed changes in pressure/weather systems
�� This is believed to be the driver for both the SW WA and This is believed to be the driver for both the SW WA and
SE (Vic and SE (Vic and SthSth NSW) autumn/winter rainfall declines NSW) autumn/winter rainfall declines
(although research is ongoing to understand the (although research is ongoing to understand the
underlying mechanisms)underlying mechanisms)
�� Latest modeling studies suggest that this is being driven Latest modeling studies suggest that this is being driven
by a combination of by a combination of
•• ozone depletionozone depletion
•• greenhouse induced climate change greenhouse induced climate change
•• natural variabilitynatural variability
(B. (B. TimballTimball, J. M. , J. M. ArblasterArblaster, S. Power, 2005), S. Power, 2005)

The recent dry period : 2001-2006

The recent dry period : 2001-2006

Thank you!

Recipe for rain
� Moisture source
� Moisture transport
� Lifting mechanism
o e.g. fronts, troughs, surface lows, convection, mountains
� Atmospheric instability
o e.g. mid level troughs, cut off lows, cold pools
� Condensation nuclei
Rain is a complex phenomenon requiring several
“ingredients” (most of which are interrelated) and each of
which could, in principle, be impacted by global warming

Some sources of rainfall variability
Inter-decadalInter-decadal Pacific Oscillation
Inter-annualIndian Ocean Dipole
Inter-annualEl Niño (Southern Oscillation)
SeasonalSeasonal shifts in circulations
Month/sMadden-Julian Oscillation
WeeksSouthern Annular Mode
Day/weekWeather patterns
Approximate Time scaleKnown major causes
Each of these sources of variability may also be impacted by global warming

Rainfall projections under climate change
� Why rain is difficult
� Latest IPCC 4AR projections
� Plans for new Australian regional projections

Inter-decadal Pacific Oscillation
See recent BMRC Research Report: Power et al. (2005)

Indian Ocean Dipole
Images courtesy of A.Suryachandra Rao of the Institute for Global Change Research, Yokohama City, Japan

New Australian & Regional Projections
� New joint CSIRO/BoM regional projections due to
be released at Greenhouse 2007, 2-5 October 2007
o based on IPCC 4AR models and scenarios
o will include probabilistic projections for rainfall and
temperature
� Statistically downscaled localised regional
projections are also being prepared by the Bureau
of Meteorology Research Centre as part of the IOCI
and SEACI projects (including the MDB)

Current CSIRO Australian Rainfall
Projections

Emerging Consensus on Projected Global Rainfall Changes
Rainfall change for 2090-2099 relative to 1980-1999.