climate change, food security aquaculture
TRANSCRIPT

“
CLIMATE CHANGE, FOOD SECURITY & AQUACULTURE: Policy implications for ensuring the continued green growth & sustainable development of a much needed food sector
Albert G.J.Tacon1, Marc Metian2 & Sena S. De Silva3
1Instituto de Investigaciones Oceanologicas, Universidad Autonoma de Baja California, Km 107 carretera Tijuana/Ensenada, 22860 Ensenada BC, Mexico
2University of Hawaii, Hawaii, HI 96744 USA 3Network of Aquaculture Centres in Asia‐Pacific, Bangkok, Thailand

Climate change
Food security
Aquaculture & Fisheries
• Food security & food supply impacts • Aquatic ecosystem impacts • Fisheries & aquaculture impacts
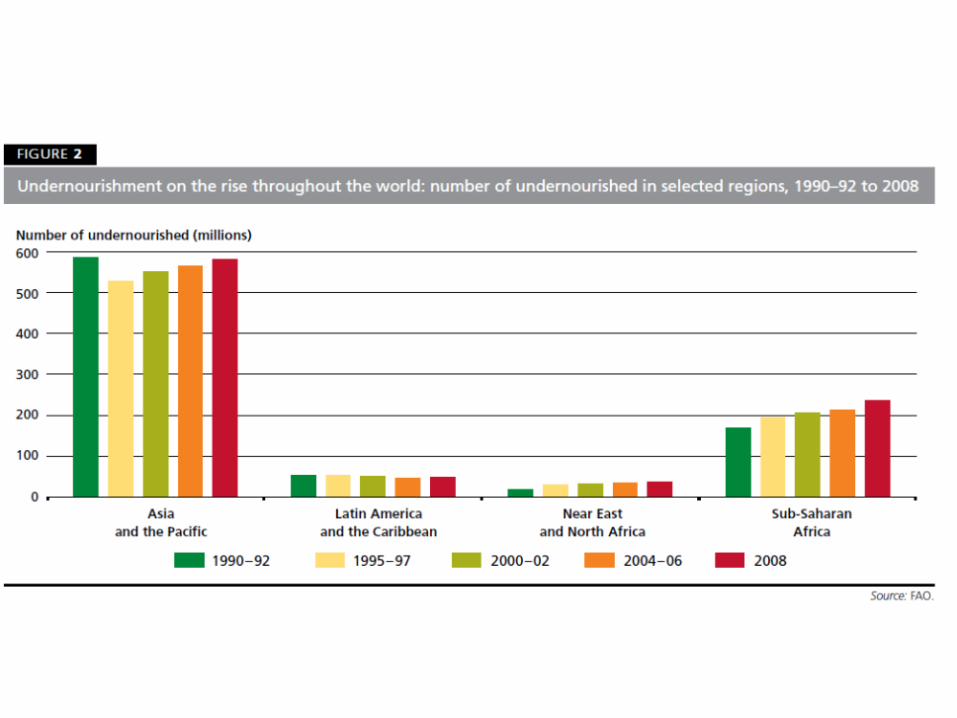
• Hunger & malnutrition • Poverty, food insecurity & food supply • Role of fish in global food supply
• Global aquaculture production trends • Dependency on fishmeal & fish oil • NGO concerns & Code of Conduct
Climate change, food security, and aquaculture continuum - major discussion points of this presentation
Impact direction
Climate change
“
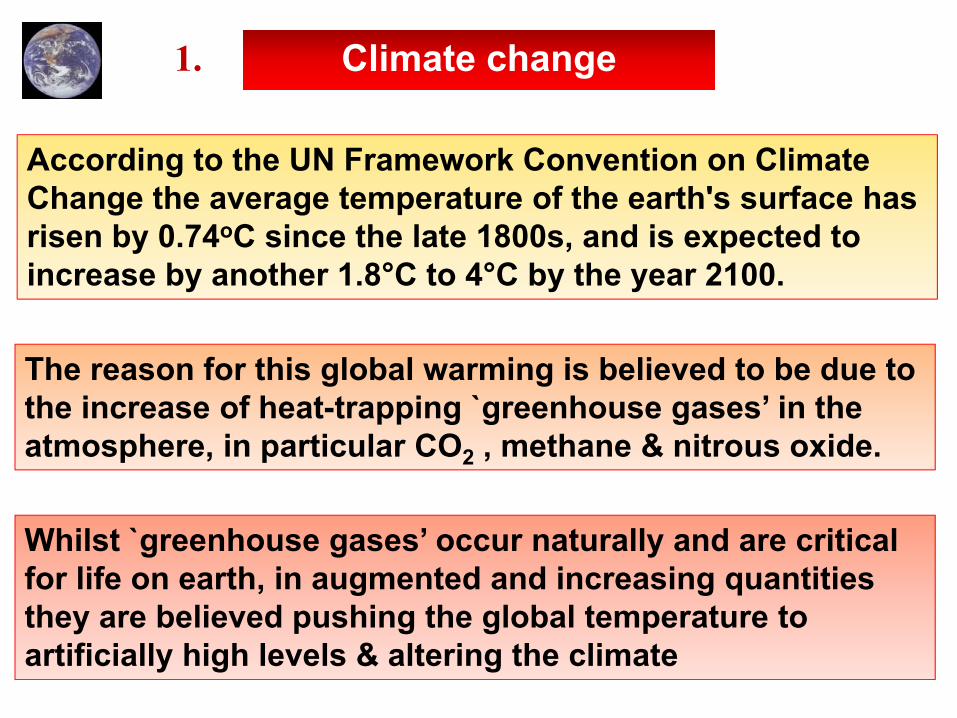
According to the UN Framework Convention on Climate Change the average temperature of the earth's surface has risen by 0.74oC since the late 1800s, and is expected to increase by another 1.8°C to 4°C by the year 2100.
The reason for this global warming is believed to be due to the increase of heat-trapping `greenhouse gases’ in the atmosphere, in particular CO2 , methane & nitrous oxide.
Whilst `greenhouse gases’ occur naturally and are critical for life on earth, in augmented and increasing quantities they are believed pushing the global temperature to artificially high levels & altering the climate
1.

Climate change
“
The main causes of global warming are believed to be due to industrialization and the burning of fossil fuels (coal, oil and gas) to meet increasing energy demands, and the spread of intensive agriculture to meet increasing food demand, which is often accompanied by deforestation.
Moreover, the process of global warming shows no signs of abating and is expected to bring about long term changes in weather conditions - (FAO, 2008).
For the purposes of the present paper, it is suffice to summarize here those potential impacts of climate change on food security and global food supply, as follows:

Climate Change Impacts: on Agriculture & food security (FAO, 2008)
security, fisheries and aquaculture impacts
“
Agriculture is important for food security in two ways, by producing the food people eat, & by providing the primary source of livelihood for 36% of the worlds workforce. In heavily populated countries of Asia & Pacific, this share ranges from 40-50%, and in sub-Saharan Africa, 2/3rds of the working population still make their living from agriculture It follows therefore, that if agricultural production in the low-income developing countries of Asia & Africa is adversely affected by climate change, the livelihoods of large numbers of the rural poor will be put at risk & consequently their vulnerability to food insecurity increased.

Climate Change Impacts: on Food, fibre and forest products
(http://unfccc.int)
“ Crop yield is projected to increase in temperate regions for a local mean temperature rise of 1-3 °C, and then decrease beyond that in some regions; In tropical areas, crop yield is projected to decrease, even with relatively modest rises of 1-2 °C in local temperature, increasing the risk of hunger; Increases in the frequency of droughts and floods are projected to affect local crop production negatively, especially in subsistence sectors at low latitudes;

Ocean Currents ENSO Sea level rise Rainfall Rivers flows Lake levels Thermal structure Storm severity Storm frequency Acidification
Production Ecology
Fishing & Aquaculture operations
Communities livehoods
Wider society & Economy
Species composition Production & yield Distribution Diseases Coral Bleaching Calcification
Safety & efficiency Infrastructure
Loss/damage to assets Risk to health & life Displacement & conflict
Adaptation & Mitigation costs Market impacts Water allocation
CLIMATE CHANGE
Effect on : Impact on :
Diagrammatic representation of climate change effects on fisheries & aquaculture (adapted from Allison, 2009)

“

“
Nutrition & Food Supply is the cornerstone that determines the health and well-
being of all people, both rich and poor.
It allows people to grow, develop, work, play, resist infection and aspire to realization of their fullest potential
as individuals and societies.
In marked contrast, malnutrition makes people all more vulnerable to disease and premature death. Without adequate food, people cannot lead healthy, active lives - they are not employable - they cannot care for their children, and their children cannot learn to read and write.
Food security 2.

“
The Right to Food cuts across the entire spectrum of Human Rights – its fulfilment is essential to the fight against poverty, and to ensure a world free from hunger. Sadly, hunger and malnutrition remain among the most devastating problems facing the world’s poor and needy, and continue to dominate the health and well-being of the world’s poorest nations;
Food security

MALNUTRITION is still the number one
killer & cause of suffering on earth;
causing more deaths than HIV/AIDS,
warfare, genocide, terrorism, or any other
ailment

Malnutrition remains a continuing travesty of the recognized fundamental human right
to adequate food and nutrition, and freedom from hunger,
particularly in a world that has both the resources and knowledge
to end this catastrophe

“

“

“

“
“

7
It is estimated that about one-fifth of the world’s population is currently living in extreme economic poverty; defined as living on less than US$ 1/d - 4 billion earn less than $ 4/day - 23 under 5 years of age children die every minute - 6 million under 5 children die from hunger every year - 842 million under nourished people - 170 million under weight children - 30 million intrauterine growth retardation - As many as 2 billion affected by iron deficiency aneamia, mainly women & children - More than 800 million people suffering from iodine deficiency disorders & brain damage & growth retardation - More than 250 million children with vitamin A deficiency
Malnutrition is still the number one killer & cause of suffering on earth

“
Food fish, whether captured or cultured plays an important role in human nutrition & global food supply, particularly within the diet & food security of the poor & needy as a source of much needed essential dietary nutrients
Role of fish in global food supply
NUTRITIONAL VALUE OF FISH &
SEAFOOD Proteins, Amino acids, Omega-3
fatty acids, Energy, Ca, P, Mg, Fe, Zn, I, F, Cr, Se, vitamin A, D, E, B etc

0.0
2.0
4.0
6.0
8.0
10.0
12.0
Kg/
capi
ta
Per capita food fish supply from capture fisheries and aquaculture 1995 to 2008 (FAO, 2010)
10.6 kg (95)
Capture
4.3 kg (95)
Aquaculture
7.8 kg (08)
9.3 kg (08)

Per capita fish supply by region and economic country grouping in 2003 (values as Kg per capita supply: FAO, 2008)

Contribution of fish to animal protein consumption in 2003 (values expressed as % total supply: FAO, 2008)

38.8
28.8
28.2
26
14.3
12
12.7
16.4
18.9
24.1
0 5 10 15 20 25 30 35 40 45
Africa
Europe
South America
Oceania
Asia
North America
LIFDCs
Developing countries
World
Developed countries
Contribution of marine pelagic fish to total fish consumption in 2003 (values as percent total fish consumption; FAO, 2008)

50 - 85% total food fish supply 25 - 50% total food fish supply
Contribution of pelagic fish to total food fish supply
(calculated from FAO, 2008b)

“
Contribution of fish (including pelagic fish to total daily per capita calorie and animal protein intake by major geographical region &
country grouping in 2003 (Source: Tacon & Metian, 2009)

“
Food fish currently represents the major source of animal protein (contributing more than 25% of the total animal protein supply) for about 1.25 thousand million people within 39 countries worldwide, including 19 Sub-Saharan countries
Role of fish in global food security
Despite importance of food fish in Africa, the Sub-Saharan region is the only region of the world where per capita consumption of food fish has fallen (FAO, 2009)

0
2
4
6
8
10
12
Food
/cap
ita/y
ear (
Kg)
Pelagic fish Total food fish Freshwater fish Demersal fish Marine fish, other
Food fish supply in the Sub-Saharan African region by major fish group
(taken from the FAO Balance Sheets; FAO, 2008)
6.9 (2003)
10.17 (1981)
5.9 (1961)

Moreover, with the world population expected to grow by another 2.5 billion between 2005 & 2050 (a number equal to the total population in 1950), there are growing doubts as to the long term sustainability of many existing agriculture & aquaculture food production systems to meet the increasing global demand for food

“

AQUACULTURE: role in global food supply & sustainability implications
3.

Of the different agricultural food production systems, aquaculture is widely viewed as an important weapon in the
global fight against malnutrition & poverty, particularly within developing countries where over 93% of global
production is currently realised; the aquaculture sector providing in most instances an affordable & much needed
food source rich in essential nutrients.

AQUACULTURE - AGRICULTURE
340 SPECIES - 2008
212
15 42
67
3

0
10
20
30
40
50
60
70
80
90
100
1950 1960 1970 1980 1990 2000
90.8 mmt 2.7% APR
68.3 mmt 8.4% APR
Capture fisheries
Aquaculture
GLOBAL CAPTURE FISHERIES & AQUACULTURE PRODUCTION 1950 – 2008 (Million tonnes; Source: FAOSTAT, 2010)
1989
Is this growth sustainable?
2008
2008

Global trend in weighted
mean trophic level of total landings from capture fisheries
& aquaculture

313,833
0.5% 5.0 mmt
7.3% 305,461 0.4%
13.1 mmt 19.2%
33.8 mmt 49.5%
15.8 mmt 23.1%
AMPHIBIA, REPTILIA CRUSTACEANS AQUATIC INVERTS MOLLUSCS FINFISH AQUATIC PLANTS
Total global aquaculture production – 2008 over 340 plant & animal species
68.3 million tonnes (valued at US $ 106 billion)
(FAO – FISHSTAT, 2010)

Total global aquaculture production – 2008 over 91% of production in Asia
Asia: 62.44 million tonnes APR 9.38% since 1950 (344,390 mt) Americas: 2.43 million tonnes APR 6.45% since 1950 (64,623 mt) Europe: 2.34 million tonnes APR 4.63% since 1950 (169,101 mt) Africa: 955,237 tonnes APR 10.87% since 1950 (2,393 mt) Oceania: 176,325 tonnes APR 6.75% since 1950 (4,000 mt)
91.36%
3.56% 3.43% 1.40%
0.26%
Asia Americas Europe Africa Oceania
(FAO – FISHSTAT, 2010)

Total global aquaculture production – 2008 by culture environment
Marine: 32.51 mmt APR 5.56% since 1995 (16.09 mmt) Freshwater: 31.55 mmt APR 6.73% since 1995 (13.53 mmt) Brackishwater: 4.28 mmt APR 8.02% since 1995 (1.57 mmt)
47.57% 46.17%
6.27%
Marine Freshwater Brackishwater

Top aquaculture country producers – 2008 (Values in metric tonnes; FAO – FISHSTAT, 2010)
China 42,669,744 (62.4%)
Indonesia 3,854,844 (5.6%) India 3,478,692 (5.1%) Viet Nam 2,497,400 (3.6%) Philippines 2,407,698 (3.5%) Korea Rep. 1,394,818 (2.0%) Thailand 1,374,024 (2.0%) Japan 1,187,774 (1.7%) Bangladesh 1,005,542 (1.5%) Chile 870,845 (1.3%)
Norway 843,730 Egypt 693,815 Myanmar 674,812 Korea DPR 508,000 USA 500,114 Malaysia 354,379 Taiwan 330,861 Brazil 290,186 Spain 249,074 France 237,868
Top 11-20 countries
Top 10 countries

In marked contrast with capture fisheries where the bulk of the fish species harvested are marine carnivorous fish
species positioned high in the aquatic food chain, the mainstay of farmed fish production are freshwater
omnivorous and herbivorous fish species positioned low in the aquatic food, including carps, tilapia and catfishes.
AQAUACULTURE: role in global food supply & sustainability implications

Moreover whereas marine capture fisheries have been feeding the world on high trophic level carnivorous fish
species since mankind has been fishing the oceans, aquaculture production within developing countries has
focused, by and large, on the production of lower trophic level species – but this is changing
AQAUACULTURE: role in global food supply & sustainability implications

OECD countries
Developing countries
China
Developing countries without China
10 Millions Tonnes
Aquatic plants
Molluscs
2 ≤ Trophic level < 3
3 ≤ Trophic level < 4
4 ≤ Trophic level < 5
0 5
0
10,000,000
20,000,000
30,000,000
40,000,000
50,000,000
60,000,000
70,000,000
1950
19
52
1954
19
56
1958
19
60
1962
19
64
1966
19
68
1970
19
72
1974
19
76
1978
19
80
1982
19
84
1986
19
88
1990
19
92
1994
19
96
1998
20
00
2002
20
04
2006
20
08
Developing countries
China
Developing countries without China
OECD countries
Tonnes

Like capture fisheries, aquaculture focus within OECD or economically developed countries has been essentially on the culture of high value-, high trophic level-carnivorous
fish species. The long term sustainability of these production systems is questionable unless the industry can reduce its dependence upon capture fisheries for sourcing
raw materials for feed formulation and seed inputs
AQAUACULTURE: role in global food supply & sustainability implications

CRUSTACEANS
5.0 mmt (FAO – FISHSTAT, 2010)
Fed aquaculture species production – 2008 (commercial feeds, farm made feeds, fresh feeds)
Total fish & crustaceans: 38.8 million tonnes Fed species: 31.5 million tonnes
FINFISH 33.8 mmt

Top fed aquaculture & livestock producers – 2008 (FAO – FISHSTAT/FAOSTAT, 2010)
Values in million tonnes - Mt
Grass carp 3,775,267 mt Common carp 2,987,433 mt Nile tilapia 2,334,432 mt Catla 2,281,838 mt Whiteleg shrimp 2,259,183 mt Crucian carp 1,957,337 mt Atlantic salmon 1,456,721 mt Pangasius catfish 1.38 Mt∑58% Total fed sp production – 31.5 Mt
APR 10.59% since 1980
Top eight fed livestock species Top eight fed aquaculture species
Pig 103.2 Mt Chicken 79.4 Cattle 62.4 Sheep 8.3 Turkey 6.1 Goat 4.9 Duck 3.8 Buffalo 3.4 ∑ 97% Total meat production - 280 Mt
APR 2.59% since 1980

Total global production of fed fish & crustacean species FAO - FISHSTAT (2010)
Is this growth Sustainable? APR 10.5% per
year since 1980
0
5,000,000
10,000,000
15,000,000
20,000,000
25,000,000
30,000,000
35,000,000
40,000,000
45,000,000
1950
19
52
1954
19
56
1958
19
60
1962
19
64
1966
19
68
1970
19
72
1974
19
76
1978
19
80
1982
19
84
1986
19
88
1990
19
92
1994
19
96
1998
20
00
2002
20
04
2006
20
08
Freshwater fish - fed species Freshwater fish - non fed species Marine crustaceans - fed species Diadromous fish - fed species Marine fish - fed species Freshwater crustaceans - fed species

Estimated global production of commercial aquaculture feeds by major species grouping in 2007: 27.1 million tonnes
Carp 8.2 mmt 29.5%
Shrimp 4.8 mmt 18.0%
Tilapia 3.5 mmt 13.0%
Marine fish 2.5 mmt - 9.5%
Catfish 2.4 mmt 9.1%
Salmon 2.0 mmt 7.6%
FW crustaceans 1.3 mmt
4.9%
Trout 902 tmt 3.4%
Milkfish 547 tmt 2.0%
Eel 416 tmt - 1.6%
Miscellaneous FW fish 359 tmt - 1.3%
Total global animal feed production: 700 mmt in 2008; Aquafeed ca. 4%

CEREALS INCLUDING
BY-PRODUCT MEALS & OILS
AQUATIC ANIMAL
PROTEIN MEALS &
LIPIDS LAND
ANIMAL PROTEIN MEALS &
FATS
MICROBIAL FEED
INGREDIENTS
OILSEED MEALS, PULSES
& OILS
MAJOR DIETARY NUTRIENT SOURCES USED IN AQUAFEEDS
40 essential nutrients

Millions tonnes
Disposition of the fisheries catch and aquaculture production (Values given in million tonnes: FISHSTAT, 2010)
62.64
52.55
20.4
27.1
0
10
20
30
40
50
60
70
1970 1974 1978 1982 1986 1990 1994 1998 2002 2006
Aquaculture Capture - food Capture: non-food use Capture - reduction
Non food landings from capture fisheries
Aquaculture production (excl. Plants)
Food fish landings from capture fisheries
2008

325
203
135
96
21 20 18 5
0
50
100
150
200
250
300
350 964
811
568
385
264 253 208 196 175
130
27 0
200
400
600
800
1000
1200
1060 1014
893
388 385 284
229 196 175 148
32
0
200
400
600
800
1000
1200
AQUACULTURE ‐ FISH MEAL USE – 2007 3 843 000 tonnes or 68.4% global total
AQUACULTURE ‐ FISH OIL USE – 2007 823 000 tonnes or 81.3% global total
AQUACULTURE – TOTAL FM + FO USE ‐ 2007 4 666 000 tonnes or 70.3% global total


CEREAL
BY-PRODUCT MEALS & OILS
AQUATIC ANIMAL
PROTEIN MEALS &
LIPIDS LAND
ANIMAL PROTEIN MEALS &
FATS MICROBIAL
FEED INGREDIENTS
OILSEED MEALS, PULSES
& OILS
We need to be able to use ALL of the above listed feed ingredient sources: and in particular those feed-grade
ingredient sources that can be sustainably produced and keep pace with the growth of the aquaculture sector
40 essential nutrients

0
50,000,000
100,000,000
150,000,000
200,000,000
250,000,000
300,000,000 19
61
1963
19
65
1967
19
69
1971
19
73
1975
19
77
1979
19
81
1983
19
85
1987
19
89
1991
19
93
1995
19
97
1999
20
01
2003
20
05
2007
Meat, Total +
Global production of terrestrial meat products (expressed in tonnes; FAO, 2009)
APR 2.95% since 1961

Global production of major plant oilcrops (Values given in million tonnes: FAOSTAT, 2009)
Total oilseed production in 2008 was 427.1 million tonnes
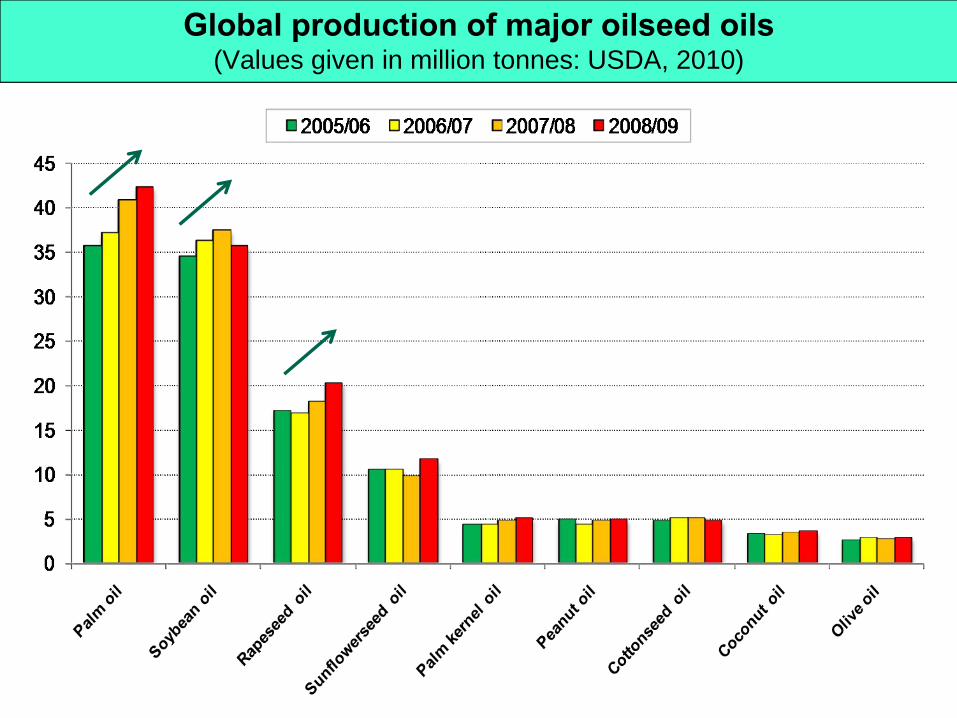
Global production of major oilseed oils (Values given in million tonnes: USDA, 2010)

0
500,000,000
1,000,000,000
1,500,000,000
2,000,000,000
2,500,000,000 Oilcrops + Cereals + Meat + Vegetable oils + Pulses +
Global production of agricultural crops and meat (expressed in tonnes; FAO, 2009)
GM crops & non-GM
crops: 10 year track record
within US
AT-RESA-16
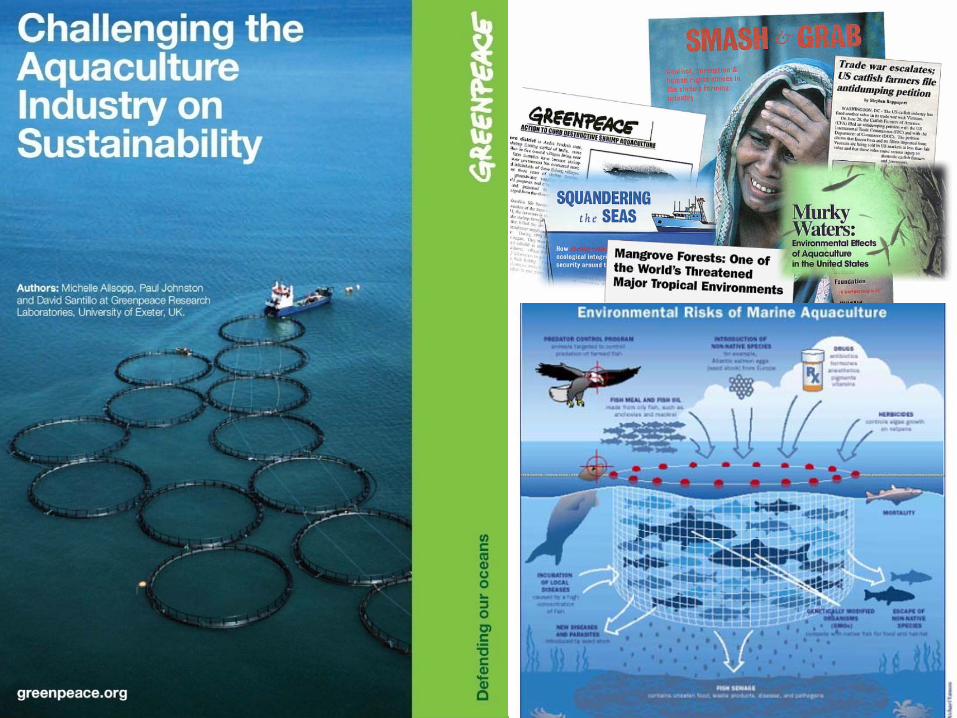
As with all agricultural terrestrial food production systems, the aquaculture sector has not been without its problems & critics. Major problems and issues raised have been mainly related with the unregulated development of more intensive commercial scale production systems, and in particular with farming systems for high value crustacean species and higher trophic level (TL) carnivorous finfish species
MAJOR NGO CONCERNS


SPECIFIC ISSUES RAISED (16) HAVE INCLUDED: 1. Mangrove destruction and habitat loss; 2. Pollution & degradation of the aquatic and benthic environment; 3. Escapes and genetic interactions with wild fish populations; 4. Parasite and disease transfer to wild fish populations; 5. Use of non-native species and genetically modified organisms; 6. Use of toxic/bio-accumulative chemicals and antibiotics; 7. Use of low value/trash fish, fish meal and fish oil as feed inputs; 8. Interactions with marine mammals, turtles and birds; 9. Use of wild caught seed and associated by-catch; 10. Displacement of coastal fishing and farming communities; 11. Disruption of seafood prices, local food supplies & food security; 12. Livelihood impacts and reduced access to community resources; 13. Salinization of potable water and ground water; 14. Social exclusion, social unrest and conflicts; 15. Conflicts with tourism, recreational fish, and commercial fishing; 16. Environmental contaminants and food safety concerns;

However, it must also be stated that the majority of the above listed issues and concerns are usually species, farm and country specific, and can be mitigated or their impacts greatly minimized by strict adherence to the principles and guidelines within the FAO Code for Responsible Fisheries (CCRF), and in particular article 9 of the CCRF dealing with aquaculture development (FAO, 1995, 1997, 2001). The solution is better governance, not just by policymakers to ensure this adherence, but by operators, too.
MAJOR NGO CONCERNS

ANIMAL FEED PET FOOD BIOFUEL FOOD
The dilema: ingredient selection & use criteria: economic, nutritional, environment, safety and/or food security


Probability of dying (per 1,000) for children under 5 years of age (WHO, 2006)

Centre for African Studies in Sustainable Aquaculture & Fisheries Management
<CASA >< International Cooperation Platform
for improving food security and poverty alleviation in Africa through the development of sustainable and responsible
aquaculture and fisheries management practices
Major aquaculture platform activities
Malnutrition & food security impacts Poverty alleviation & income generation impacts
Farming systems & sustainable development Research & technology development
Training, education & outreach
Increased food production through fisheries &
aquaculture Project idea

Mahalo