climate change global temperatures: past, present, and future
Post on 21-Dec-2015
218 views
TRANSCRIPT

CLIMATE CHANGE
Global Temperatures:
Past, Present, and Future

Mean Temperature
• Mean Temperature of the Earth’s surface is 15 degrees Celsius
• Locations with the same mean annual temperature can have very different climates, however.– Eg. Beijing and San Francisco, both have a mean
annual T of 50 degrees F and 15 inches of rain per year, but climates are very different:
– Beijung has large T range, most rain falls in Summer; San Francisoc, very small temperature range and most rain falls in Winter
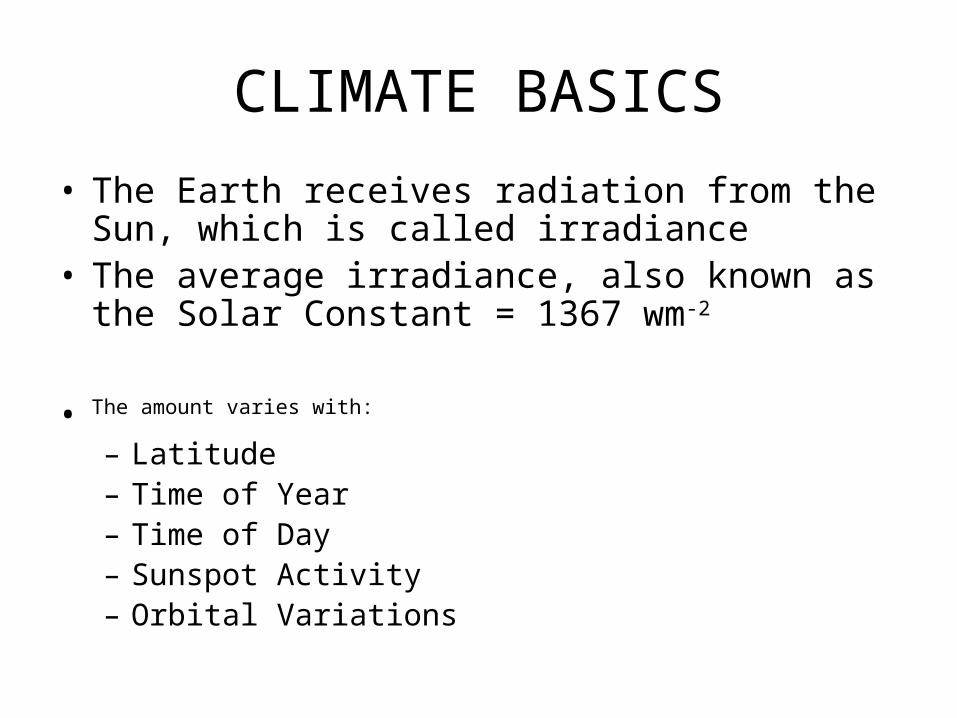
CLIMATE BASICS
• The Earth receives radiation from the Sun, which is called irradiance
• The average irradiance, also known as the Solar Constant = 1367 wm-2
• The amount varies with:
– Latitude– Time of Year– Time of Day– Sunspot Activity– Orbital Variations

CLIMATE CHANGE
• Earth History has seen numerous Ice ages and Warm periods

CO2 Concentration and Global Temperatures for last 160,000 years
From: air bubbles in ice cores

Last 130,000 years
Oxygen isotopes from ice coresin Greenland (Camp Century)and Antarctica (Byrd)can be used to determinesea surface temperatures for the last 160,000 years.
A decrease of 1ppm in O18 equals a 1.50C reduction in Temp.
Warming starts18-15 ka
Cooling starts60ka

Climate Monitors
Levels of naturally occurringmethane andcarbon dioxide bothincrease with increasing temperatures
Notice the high values at about120ka

Evidence for Past Climates
Notice in c the period of sudden coolingabout 10ka that lasted about 700 years
About 1000 AD, climate was warm andDry: the Medieval Warm Period
About 1300 to 1800 AD a cooling trendresulted in the Little Ice Age

CLIMATE CHANGE• CONTROLLED BY:
– Long-term:
• Plate Tectonics: 107-108 yr– Placement and sizes of continents– Convection rates (generate more volcanic activity)
• Solar output increased 30% in last 3 billion years
Medium-term:
– Orbital Changes: 104-105 yr
-- Volcanic Eruptions: long-term increase releases more CO2 and increases temps
– Short-term:
– Increases in explosive volcanic eruptions increase particulates in atmosphere resulting in cooling 100.5-101 yr
– Changes in Solar output of 0.1 to 0.2% 22-yr cycle– Fossil Fuel emissions: 101 to 102 yr
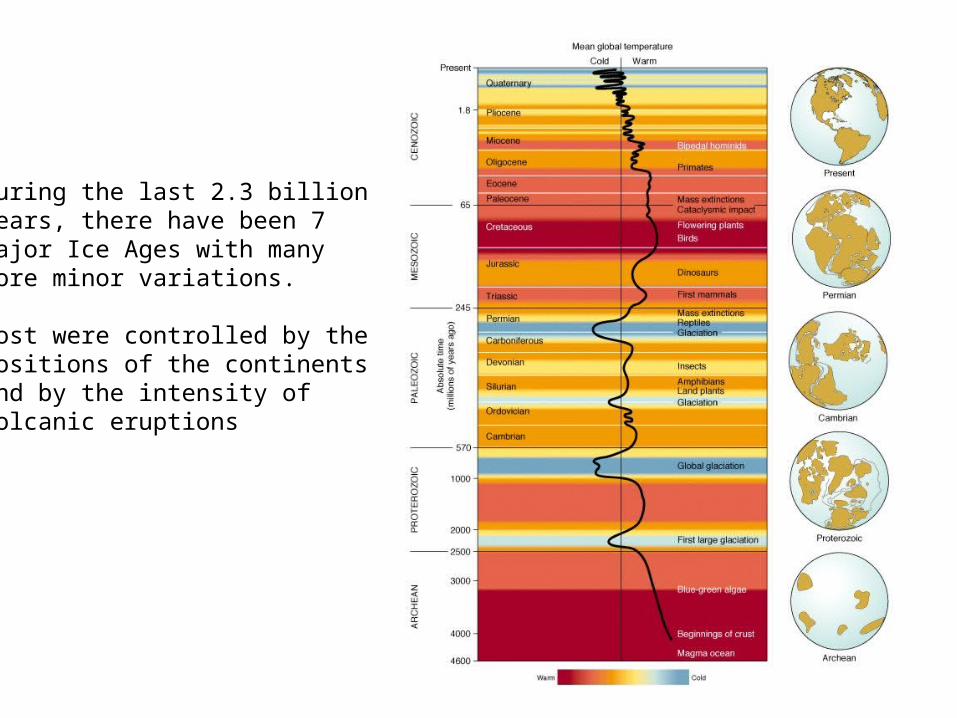
During the last 2.3 billionyears, there have been 7 major Ice Ages with manymore minor variations.
Most were controlled by the positions of the continentsand by the intensity of volcanic eruptions

Plate Tectonics affects the positions and sizes of continents
TODAY
300 m.y. ago
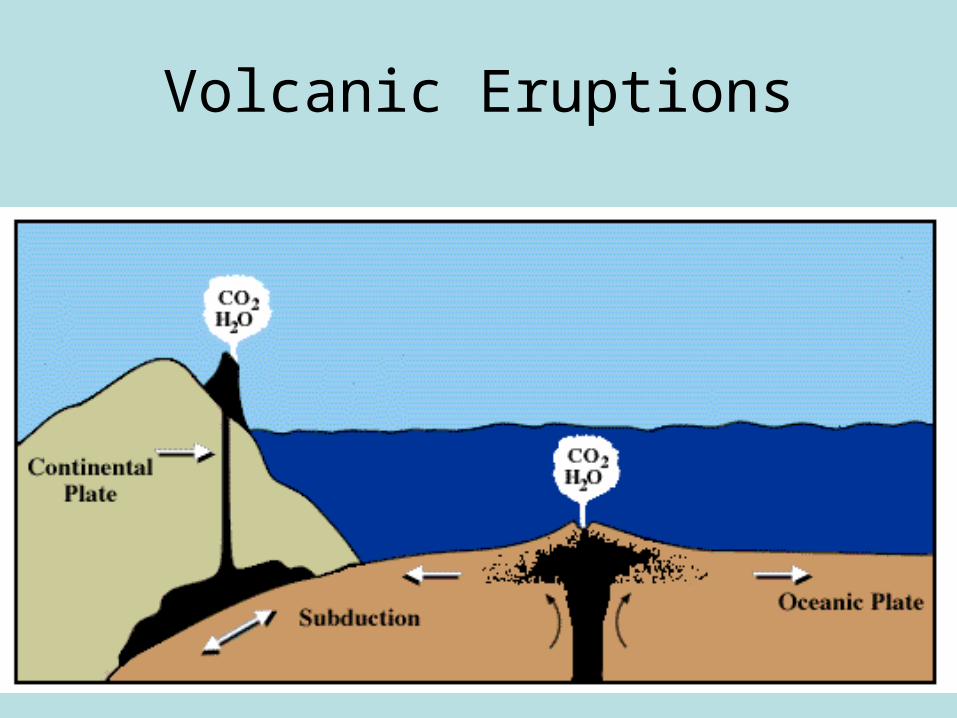
Volcanic Eruptions

AXIAL TILT
At present, we are near maximum tilt, which makes polar regions have more contrast.Not especially likely to promote cooling.

Eccentricity
We are near minimum eccentricity, so seasonal contrasts are minimized. Minimum seasonal contrasts promote cooling.
Periodicity of 100,000 years

Precession
• Changes in precession occur on a time scale of ~23,000 years.
Presently, earth is near maximum tilt of 23.50 (range is 21.5-24.5)So maximizes seasonal contrastsPreceesion effect: presently earth is closest to sun in January, farthest in July

Milankovitch Cycles
Combined result is a difference of +/- 60 C

The combined Milankovitch curves form an asymmetric curve. Notice how temperature increases are gradual, but cooling can be very rapid.

Triggering Mechanisms and Feedback
• Massive, explosive volcanic eruptions: can introduce huge amounts of ash into the atmosphere. This blocks out some of the sun, increases cloudiness as water vapor nucleates around the particles, and increases precipitation and possible snowfall.
• Albedo: snow and ice on ground reflect sunlight much more than vegetation or bare rock. This cools the earth’s surface and favors more ice and snow accumulation.

CO2 Budget

Temperature Change in Last 150 years

CO2 in Atmosphere for last 50 Years
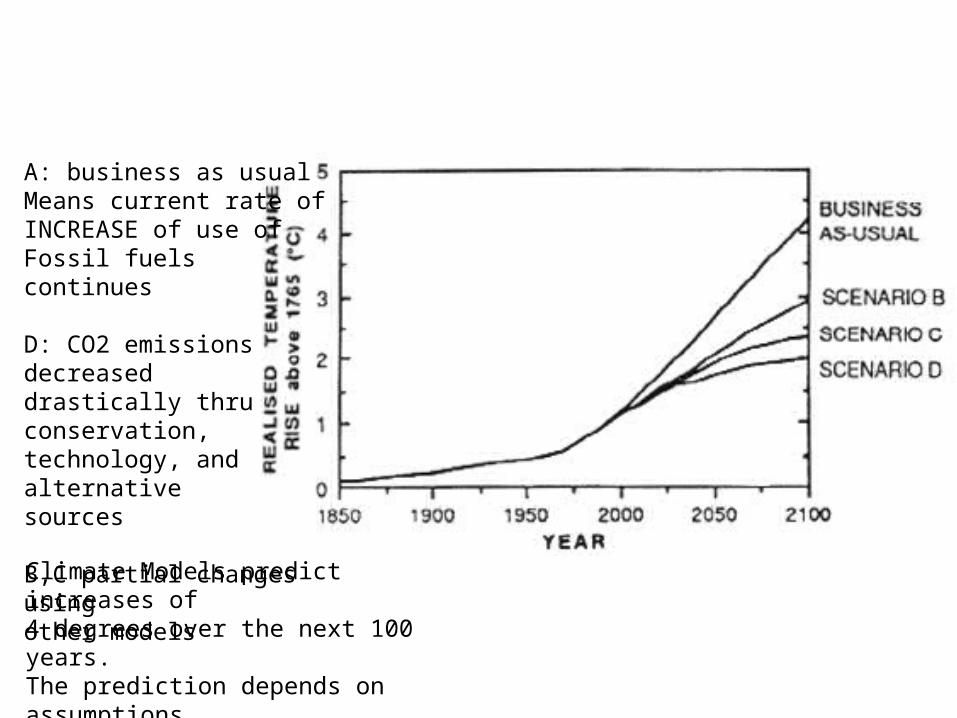
Climate Models predict increases of 4 degrees over the next 100 years. The prediction depends on assumptions about the fossil fuel consumption rate.
A: business as usualMeans current rate ofINCREASE of use ofFossil fuels continues
D: CO2 emissions decreaseddrastically thru conservation, technology, and alternativesources
B,C partial changes usingother models
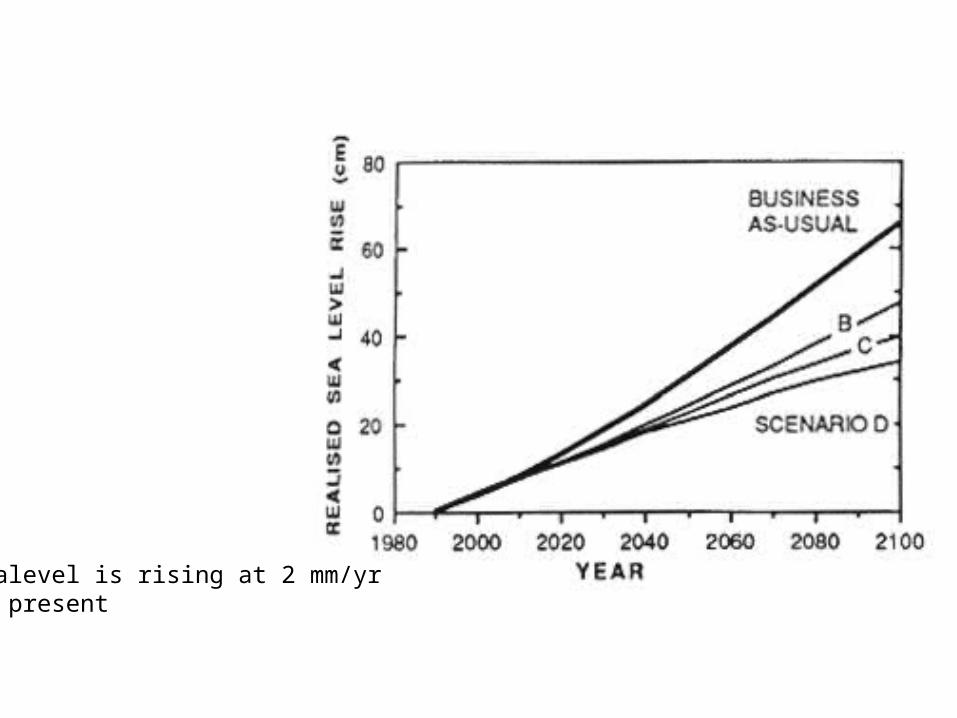
Sealevel is rising at 2 mm/yrat present


CONSEQUENCES OF GLOBAL WARMING
• CO2 has increased 50 ppm in the last 40 years to reach 365 ppm.
• If CO2 doubles in the atmosphere, much of the earth will become hotter, with larger increases with increasing Latitude.
• Some climate models say increased evaporation will result in drier climates, while others say increased T will result in increased precipitation.
•
