climate change impacts on australia and the benefits of...
TRANSCRIPT
Climate Change Impacts on Australia and
the Benefits of Early Action to Reduce
Global Greenhouse Gas Emissions
Preston, B.L. and Jones, R.N. February, 2006
A consultancy report for the Australian Business Roundtable on Climate Change

2
Climate Change Impacts on Australia

3
Climate Change Impacts on Australia
Enquiries should be addressed to:
Roger Jones
CSIRO Marine and Atmospheric Research
PMB No 1, Aspendale, Victoria, 3195
Telephone (03) 9239 4555
Fax (03) 9239 4444
E-mail [email protected]
Important Notice
© Copyright Commonwealth Scientific and Industrial Research Organisation
(‘CSIRO’) Australia 2005
All rights are reserved and no part of this publication covered by copyright may be reproduced or copied
in any form or by any means except with the written permission of CSIRO.
The results and analyses contained in this Report are based on a number of technical, circumstantial or
otherwise specified assumptions and parameters. The user must make its own assessment of the
suitability for its use of the information or material contained in or generated from the Report. To the
extent permitted by law, CSIRO excludes all liability to any party for expenses, losses, damages and
costs arising directly or indirectly from using this Report.
Use of this Report
The use of this Report is subject to the terms on which it was prepared by CSIRO. In particular, the
Report may only be used for the following purposes.
The information in this Report may be used by the entity for which it was prepared (“the Client”), or by the
Client’s contractors and agents, for the Client’s internal business operations (but not licensing to third
parties).
Extracts of the Report distributed for these purposes must clearly note that the extract is part of a larger
Report prepared by CSIRO for the Client.
The Report must not be used as a means of endorsement without the prior written consent of CSIRO.
The name, trade mark or logo of CSIRO must not be used without the prior written consent of CSIRO.
4
Climate Change Impacts on Australia
CONTENTS
EXECUTIVE SUMMARY...............................................................................................................5
1. THE CHANGING GLOBAL CLIMATE................................................................................6
2. THE EMERGING CONSENSUS ON GREENHOUSE GAS STABILISATION ..................8
3. ACHIEVING STABILISATION OF GREENHOUSE GASES............................................11
4. EMISSIONS REDUCTIONS AND CLIMATE STABILISATION .......................................16
5. CLIMATE CHANGE AND AUSTRALIAN IMPACTS........................................................19
5.1 Natural Ecosystems.............................................................................................. 21
5.2 Cropping, Forestry, and Livestock...................................................................... 23
5.3 Water Resources................................................................................................... 25
5.4 Public Health ......................................................................................................... 26
5.5 Settlements and Infrastructure............................................................................ 28
5.6 Extreme Weather Events...................................................................................... 29
5.7 Large-Scale Singularities ..................................................................................... 30
6. BENEFITS OF GREENHOUSE GAS MITIGATION FOR AUSTRALIA...........................32
6.1 Constrained Global Warming .............................................................................. 32
6.2 Avoided Impacts ................................................................................................... 34
APPENDIX I - REFERENCES.....................................................................................................36

5
Climate Change Impacts on Australia
EXECUTIVE SUMMARY
Australia is one of the many global regions experiencing significant climate change as a result
of global emissions of greenhouse gases (GHGs) from human activities. The average surface
air temperature of Australia increased by 0.7°C over the past century – warming that has been
accompanied by marked declines in regional precipitation, particularly along the east and west
coasts of the continent. These seemingly small changes have already had widespread
consequences for Australia. Unfortunately, even if all GHG emissions ceased today, the Earth
would still be committed to an additional warming of 0.2–1.0°C by the end of the century.
Yet the momentum of the world’s fossil fuel economy precludes the elimination of GHG
emissions over the near-term, and thus future global warming is likely to be well above 1°C.
Analysis of future emissions trajectories indicates that, left unchecked, human GHG emissions
will increase several fold over the 21st century. As a consequence, Australia’s annual average
temperatures are projected to increase 0.4–2.0°C above 1990 levels by the year 2030, and 1–
6°C by 2070. Average precipitation in southwest and southeast Australia is projected to
decline further in future decades, while regions such as the northwest may experience increases
in precipitation. Meanwhile, Australia’s coastlines will experience erosion and inundation
from an estimated 8–88 cm increase in global sea level.
Such changes in climate will have diverse implications for Australia’s environment, economy,
and public health. The biodiversity, ecosystems, and natural habitats of Australia are world
renowned, yet potentially the most fragile of the systems that will be exposed to climate
change. For example, the Great Barrier Reef, a UNCESCO World Heritage area, has
experienced unprecedented rates of bleaching over the past two decades, and additional
warming of only 1°C is anticipated to cause considerable losses or contractions of species
associated with coral communities.
Australian crop agriculture and forestry may experience transient benefits from longer growing
seasons a warmer climate and increasing atmospheric CO2 concentrations, yet such benefits are
unlikely to be sustained under the more extreme projections of global warming. Furthermore,
changes in precipitation and subsequent water management are critical factors affecting the
future productivity of the Australian landscape. The declines in precipitation projected over
much of Australia will exacerbate existing challenges to water availability and quality for
agriculture as well as for commercial and residential uses.
Future changes in climate extremes, such as tropical cyclones, heat waves, and extreme
precipitation events, would degrade Australian infrastructure and public health; e.g. through
increased energy demands, maintenance costs for transportation infrastructure, and coastal
flooding. Global large-scale singularities, such as a slowing or collapse of the ocean’s
thermohaline circulation or the collapse of the ice sheets of West Antarctica or Greenland,
would also have important long-term implications for Australia’s climate and coastline.
Avoiding, or at the very least reducing, the adverse effects of climate change is a global
challenge, yet one that will generate direct benefits for species and habitat conservation, saved
lives, and reduced economic and infrastructure costs. For example, limiting future increases in
atmospheric CO2 to 550 ppmv, though not a panacea for global warming, would reduce 21st
century global warming to an estimated 1.5–2.9°C, effectively avoiding the more extreme

6
Climate Change Impacts on Australia
climate changes. Lower stabilisation levels, such as 450 ppmv CO2, would reduce future
warming even further, to approximately 1.2–2.3°C. For Australia, such constraints on global
warming would give natural ecosystems and their associated species greater time to adapt to
changing environmental conditions, reduce the likelihood of major adverse consequences for
agriculture and forestry, help ensure Australia’s public health infrastructure can keep pace with
emerging health challenges, and reduce the chance of large-scale singularities. Nevertheless,
even with a return to 350 ppmv as the stabilisation level, the Earth will not be able to avoid its
current commitment to additional future warming. Therefore, prudence dictates that GHG
mitigation activities be pursued in conjunction with adaptive responses to address the residual
risks posed by this commitment.
There is broad, and growing, international support for GHG mitigation. The 1992 United
Nation’s Framework Convention on Climate Change, supported by 166 nations, calls for the
“stabilization of greenhouse gas concentrations in the atmosphere at a level that would prevent
dangerous anthropogenic interference with the climate system.” A number of national
governments and climate scientists have suggested atmospheric CO2 concentrations between
375 and 550 ppmv and/or temperature increases of 0.9–2.9°C above 1990 levels as global
thresholds for “dangerous” climate change.
Although a specific long-term stabilisation target has not been adopted by the UNFCCC,
several national governments, including the United Kingdom and Sweden, have committed to
GHG emissions reductions of 60% by the year 2050, a general benchmark estimate of the effort
needed by developed, Annex I countries to place the world on a path to achieving a global
stabilisation level of no more than 550 ppmv. Similar targets have been explored or
recommended by institutions in the United States, the European Union, and recently in
Australia, by New South Wales’ Greenhouse Advisory Panel. This technical report outlines the
likely impacts on Australia of climate change, and the benefits of global emissions reductions.
1. THE CHANGING GLOBAL CLIMATE
Over the 20th century, average air temperatures at the Earth’s surface increased by
approximately 0.6°C (IPCC, 2001; Figure 1).1 The 1990s were the warmest decade since the
beginning of instrumental records, and various proxy studies have indicated that temperatures
in the northern hemisphere at the end of the 20th century were warmer than at any point in the
past 1–2 thousand years.2 These temperature increases have also influenced the global
hydrological cycle. Precipitation in the northern hemisphere increased 5–10% over the 20th
century, with most of this increase manifesting as extreme rainfall events.1 These global
changes have been mirrored in Australia, where average temperatures have increased by about
0.7°C since 1910.3 Precipitation in Western Australia and along Australia’s east coast has
declined steadily since the mid-20th century, while precipitation has increased in the northwest.
3
Australia has also experienced an increase in extreme rainfall events, particularly during
winter.
These observed changes in global and regional climates have been attributed in part to human
emissions of greenhouse gases (GHGs) since the industrial revolution. Atmospheric
concentrations of carbon dioxide have increased by over 30% (from 280 to 380 parts per
million), while concentrations of nitrous oxide and methane have increased by 17% and 151%,
respectively.1 These changes in the composition of the atmosphere alter the radiative balance
7
Climate Change Impacts on Australia
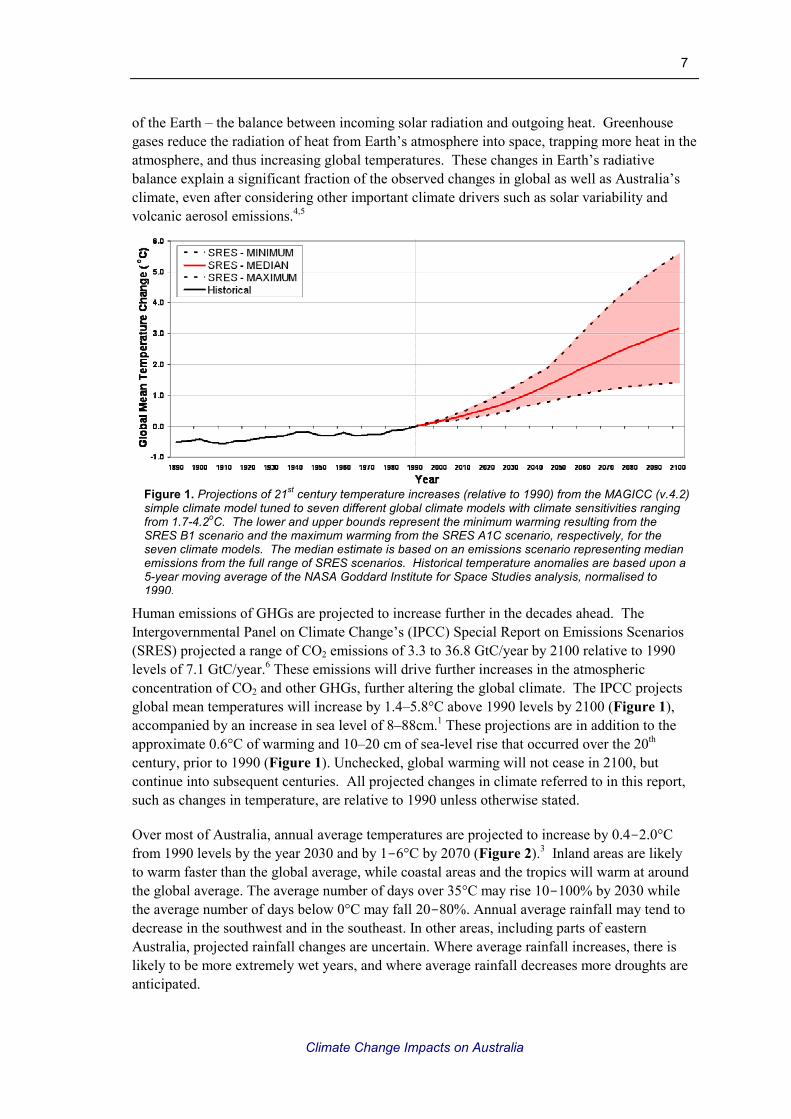
Figure 1. Projections of 21st century temperature increases (relative to 1990) from the MAGICC (v.4.2)
simple climate model tuned to seven different global climate models with climate sensitivities ranging from 1.7-4.2
oC. The lower and upper bounds represent the minimum warming resulting from the
SRES B1 scenario and the maximum warming from the SRES A1C scenario, respectively, for the seven climate models. The median estimate is based on an emissions scenario representing median emissions from the full range of SRES scenarios. Historical temperature anomalies are based upon a 5-year moving average of the NASA Goddard Institute for Space Studies analysis, normalised to 1990.
of the Earth – the balance between incoming solar radiation and outgoing heat. Greenhouse
gases reduce the radiation of heat from Earth’s atmosphere into space, trapping more heat in the
atmosphere, and thus increasing global temperatures. These changes in Earth’s radiative
balance explain a significant fraction of the observed changes in global as well as Australia’s
climate, even after considering other important climate drivers such as solar variability and
volcanic aerosol emissions.4,5
Human emissions of GHGs are projected to increase further in the decades ahead. The
Intergovernmental Panel on Climate Change’s (IPCC) Special Report on Emissions Scenarios
(SRES) projected a range of CO2 emissions of 3.3 to 36.8 GtC/year by 2100 relative to 1990
levels of 7.1 GtC/year.6 These emissions will drive further increases in the atmospheric
concentration of CO2 and other GHGs, further altering the global climate. The IPCC projects
global mean temperatures will increase by 1.4–5.8°C above 1990 levels by 2100 (Figure 1),
accompanied by an increase in sea level of 8–88cm.1 These projections are in addition to the
approximate 0.6°C of warming and 10–20 cm of sea-level rise that occurred over the 20th
century, prior to 1990 (Figure 1). Unchecked, global warming will not cease in 2100, but
continue into subsequent centuries. All projected changes in climate referred to in this report,
such as changes in temperature, are relative to 1990 unless otherwise stated.
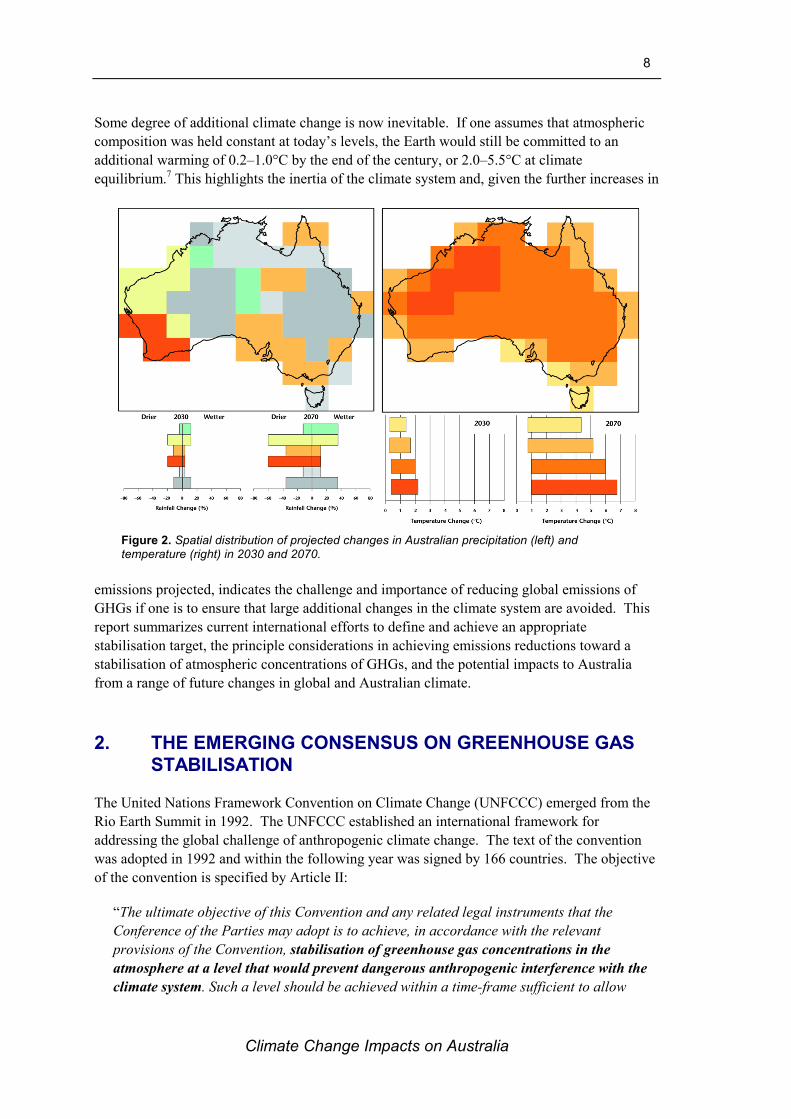
Over most of Australia, annual average temperatures are projected to increase by 0.4-2.0°C
from 1990 levels by the year 2030 and by 1-6°C by 2070 (Figure 2).3 Inland areas are likely
to warm faster than the global average, while coastal areas and the tropics will warm at around
the global average. The average number of days over 35°C may rise 10-100% by 2030 while
the average number of days below 0°C may fall 20-80%. Annual average rainfall may tend to
decrease in the southwest and in the southeast. In other areas, including parts of eastern
Australia, projected rainfall changes are uncertain. Where average rainfall increases, there is
likely to be more extremely wet years, and where average rainfall decreases more droughts are
anticipated.
8
Climate Change Impacts on Australia
Figure 2. Spatial distribution of projected changes in Australian precipitation (left) and temperature (right) in 2030 and 2070.
Some degree of additional climate change is now inevitable. If one assumes that atmospheric
composition was held constant at today’s levels, the Earth would still be committed to an
additional warming of 0.2–1.0°C by the end of the century, or 2.0–5.5°C at climate
equilibrium.7 This highlights the inertia of the climate system and, given the further increases in
emissions projected, indicates the challenge and importance of reducing global emissions of
GHGs if one is to ensure that large additional changes in the climate system are avoided. This
report summarizes current international efforts to define and achieve an appropriate
stabilisation target, the principle considerations in achieving emissions reductions toward a
stabilisation of atmospheric concentrations of GHGs, and the potential impacts to Australia
from a range of future changes in global and Australian climate.
2. THE EMERGING CONSENSUS ON GREENHOUSE GAS
STABILISATION
The United Nations Framework Convention on Climate Change (UNFCCC) emerged from the
Rio Earth Summit in 1992. The UNFCCC established an international framework for
addressing the global challenge of anthropogenic climate change. The text of the convention
was adopted in 1992 and within the following year was signed by 166 countries. The objective
of the convention is specified by Article II:
“The ultimate objective of this Convention and any related legal instruments that the
Conference of the Parties may adopt is to achieve, in accordance with the relevant
provisions of the Convention, stabilisation of greenhouse gas concentrations in the
atmosphere at a level that would prevent dangerous anthropogenic interference with the
climate system. Such a level should be achieved within a time-frame sufficient to allow

9
Climate Change Impacts on Australia
Figure 3. Chain of processes leading from human activities (Stage I) to climate impacts (Stage V).
ecosystems to adapt naturally to climate change, ensure that food production is not
threatened and to enable economic development to proceed in a sustainable manner.” 8
Article II expresses
“dangerous anthropogenic
interference (DAI)” in terms
of impacts, particularly to
ecosystems, food production,
and economies. However,
Article II does not define the
precise nature and magnitude
of impacts to these systems
that one should consider
dangerous. Furthermore,
climate impacts are the
outcome of a chain of
processes (Figure 3), which
begin with human activities
(Stage I).9 Transportation,
power generation, industry,
and land use contribute to GHG emissions (Stage II), which build up in the atmosphere (Stage
III). Changes in the atmospheric composition alter global patterns of temperature,
precipitation, and sea level (Stage IV), which result in climate impacts to human and natural
systems (Stage V).
Prevention or amelioration of climate impacts can be accomplished through two different
processes: adaptation and mitigation. Through adaptation, one reduces the magnitude of the
consequences associated with a particular magnitude of climate change. Adaptation measures
are generally implemented at the local level and reduce risk from the bottom-up. Meanwhile,
mitigation reduces emissions of GHGs from human activities, thereby reducing the magnitude
of climate change to which human and natural systems are exposed. Unlike adaptation,
mitigation is largely top-down in at least two senses. First, the effects of mitigation are largely
felt at the global level in terms of the avoided changes in global climate. Second, the political
organization of mitigation efforts to date has largely been top-down in focus, involving
international, national, and state-level governance.
As specified in Article II, the UNCCC focuses risk management efforts on mitigation to
“stabilise greenhouse gases in the atmosphere” (Stage III). Determining the appropriate level
of stabilisation necessitates working backwards from impacts to climatic changes and then to
stabilisation, using so-called inverse, or diagnostic, approaches. Unfortunately, this is not a
straightforward task, primarily due to uncertainty in climate sensitivity (the change in global
mean temperature from a doubling of the preindustrial concentration of atmospheric CO2) and
uncertainties in the response of natural and humans systems to those climate changes.
Various attempts at this type of assessment have been made in order to define the global mean
temperature change and/or stabilisation level consistent with Article II’s concept of DAI (Table
1). Most of these attempts have applied the precautionary principle (e.g. UNFCCC calls for
“precautionary measures”), where lack of scientific certainty should not be used to prevent or
10
Climate Change Impacts on Australia
delay action.8 These attempts have yielded stabilisation targets ranging from 375–550 ppmv,
with temperature targets ranging from 0.9–2.9°C above 1990 levels.
Thresholds for DAI establish long-term targets which can be used to guide mitigation efforts.
Yet ultimately, because the concentration of CO2 in the atmosphere is the result of human
activities that emit GHGs, determining the effort required to achieve a particular stabilisation or
climate target necessitates working backwards from those targets to establish sustainable levels
of emissions required to meet those targets. Once again, such inverse modelling gives rise to
another set of uncertainties. Estimating future global emissions and the potential for emissions
reduction is hampered by uncertainties in future economic growth (globally and regionally) as
well as the rate of technological innovation and change. Despite these challenges, there are a
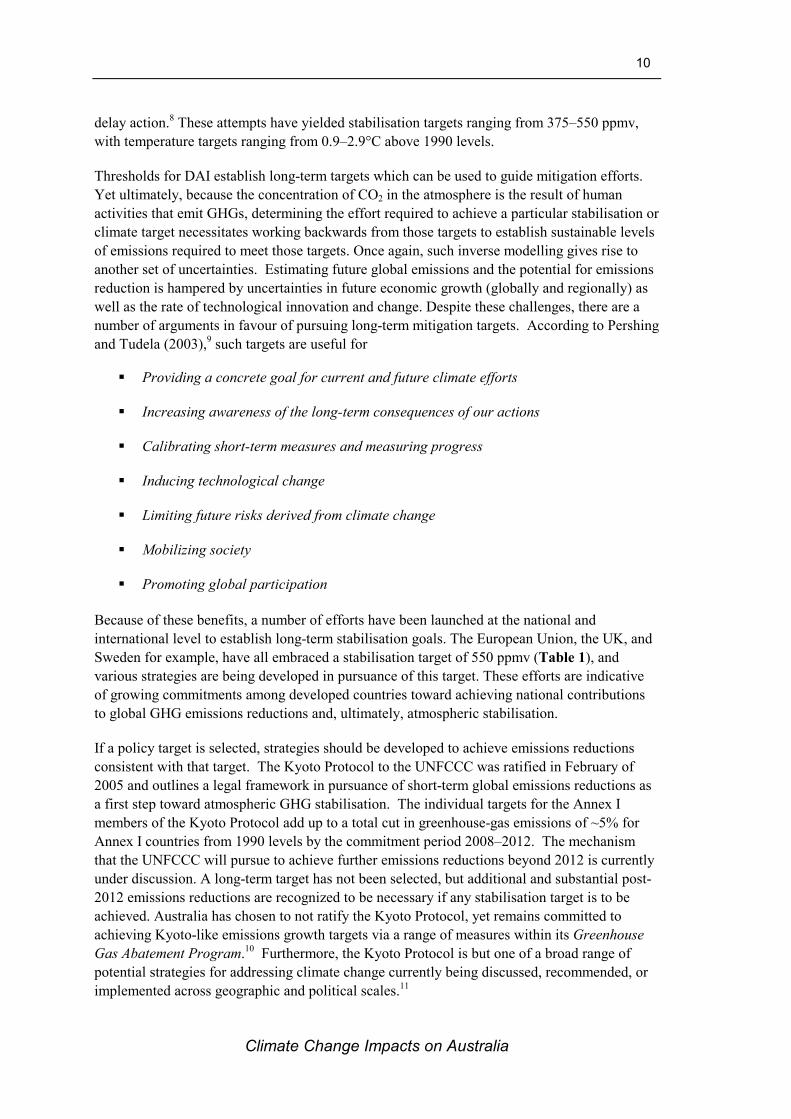
number of arguments in favour of pursuing long-term mitigation targets. According to Pershing
and Tudela (2003),9 such targets are useful for
� Providing a concrete goal for current and future climate efforts
� Increasing awareness of the long-term consequences of our actions
� Calibrating short-term measures and measuring progress
� Inducing technological change
� Limiting future risks derived from climate change
� Mobilizing society
� Promoting global participation
Because of these benefits, a number of efforts have been launched at the national and
international level to establish long-term stabilisation goals. The European Union, the UK, and
Sweden for example, have all embraced a stabilisation target of 550 ppmv (Table 1), and
various strategies are being developed in pursuance of this target. These efforts are indicative
of growing commitments among developed countries toward achieving national contributions
to global GHG emissions reductions and, ultimately, atmospheric stabilisation.
If a policy target is selected, strategies should be developed to achieve emissions reductions
consistent with that target. The Kyoto Protocol to the UNFCCC was ratified in February of
2005 and outlines a legal framework in pursuance of short-term global emissions reductions as
a first step toward atmospheric GHG stabilisation. The individual targets for the Annex I
members of the Kyoto Protocol add up to a total cut in greenhouse-gas emissions of ~5% for
Annex I countries from 1990 levels by the commitment period 2008–2012. The mechanism
that the UNFCCC will pursue to achieve further emissions reductions beyond 2012 is currently
under discussion. A long-term target has not been selected, but additional and substantial post-
2012 emissions reductions are recognized to be necessary if any stabilisation target is to be
achieved. Australia has chosen to not ratify the Kyoto Protocol, yet remains committed to
achieving Kyoto-like emissions growth targets via a range of measures within its Greenhouse
Gas Abatement Program.10 Furthermore, the Kyoto Protocol is but one of a broad range of
potential strategies for addressing climate change currently being discussed, recommended, or
implemented across geographic and political scales.11

11
Climate Change Impacts on Australia
3. ACHIEVING STABILISATION OF GREENHOUSE GASES
The principle behind GHG stabilisation is conceptually quite simple: to maintain a stable level
of CO2 in the atmosphere, emissions of CO2 from natural and human sources must equal
removals. The natural sources and sinks for CO2 have varied widely during past glacial and
interglacial cycles but have remained below 300 ppmv for at least 420,000 years.26 With the
industrial revolution, humans began transferring carbon that was effectively locked away in the
Earth’s crust to the atmosphere, upsetting the balance of the carbon cycle. The natural sinks for
carbon (primarily terrestrial vegetation and oceans) currently sequester ~40% of emissions
from fossil fuel sources.27 The remaining 60% remains in the atmosphere. As a result,
atmospheric CO2 concentrations have increased from 280 ppmv at the start of the industrial
revolution to their current concentration of over 370 ppmv.28 The current rate of atmospheric
CO2 accumulation (~1.8 ppmv/year) is approximately 2–3 times that of the early 1960s.
Table 1. Proposed temperature and/or CO2 concentration thresholds for “dangerous anthropogenic interference”.
Source Global Mean Temperature Change (oC)a
Atmospheric CO2
Stabilisation Level (ppmv)
Non-CO2 Gases?b
Azar and Rodhe (1997)12 1.4 375
Climate Options for the Long-
Term (2002)13
1.5 450
Climate Taskforce (2005)
14 1.4 400 ●
Environmental Systems Analysis
Group (2005)15
0.9
European Climate Forum
(2004)16
1.9 c
European Union (1996)17 1.4 550
Hansen et al. (2005)18 1.0 475
Klimatkommittén (2000)19 550 ●
Mastrandrea and Schneider
(2004)20
2.9d
O’Neill and Oppenheimer
(2002)21
2.0 450
Rijsberman and Swart (1990) 22 1.4
Royal Commission on
Environmental Pollution (2003)23
550
Wissenschaftlicher Beirat der
Bundesregierung (1995)24
1.3
Wissenschaftlicher Beirat der
Bundesregierung (2003)25
1.4
Average 1.5 475 aRelative to 1990, assuming 0.6
oC of warming occurred between the industrial revolution and 1990
bStabilisation targets include non-CO2 gases on a CO2-equivalent basis c“Critical limits” estimated as 1.4-2.5
oC; midpoint of this range used here
dMedian estimate of the threshold for “dangerous anthropogenic interference”

12
Climate Change Impacts on Australia
Figure 4. Twenty-first century carbon dioxide emissions for the SRES scenarios.
Achieving stabilisation means reducing global emissions of CO2 to a level that prevents any net
accumulation of CO2 in the atmosphere. This means either returning the carbon cycle to its
natural (interglacial) state or identifying additional pathways for removing and sequestering
atmospheric carbon (e.g., terrestrial or geologic sequestration).
To understand the challenge associated with stabilising atmospheric CO2, it helps to examine
projections of future global GHG emissions. The IPCC Special Report on Emissions Scenarios
(SRES) presented a series of emissions scenarios based upon different assumptions about
future economic, technological, and social changes without specific policies to reduce GHG
emissions.29 Emissions in 2050 and 2100 for the six “illustrative” SRES scenarios are listed in
Table 2, while a time series for these scenarios appears in Figure 4. All of these scenarios
suggest that emissions will be at least 2–4 times 1990 levels by 2050, and may be as high as 5
times 1990 levels by 2100. Thus, substantial increases in GHG emissions over the 21st century
are anticipated by most emission scenarios. Only two scenarios (A1T and B1) show emissions
declining below 1990 levels by the end of the century.
In addition, the distribution of emissions over time can have a significant influence on the
climate. For example, the SRES A1T scenario has higher emissions than the B2 scenario in
2050, yet beyond 2050 A1T emissions decline significantly, while B2 emissions continue to
grow. As a result, by 2100, annual B2 emissions are approximately three-fold higher than those
of B2. Yet, the projected range of temperature change in 2100 for the A1T scenario remains
higher than that of B2. This is a function of two factors. First, due to high near-term
emissions, the cumulative emissions of A1T are only marginally lower than those of B2 (Table
2), despite a large reduction in emissions post 2050. In other words, the benefits of emission
reductions in the second-half of the 20th century are offset by large emissions during the first
half. Second, A1Ts high near-term emissions also put significant global warming in the
pipeline, resulting in a more rapid rate of warming.
Regardless of the assumptions about future “business-as-usual” trajectories for GHG emissions,
it is clear that achieving no net growth in atmospheric concentrations requires reversing the
current trend of increasing GHG emissions – ultimately reducing emissions to levels well
below those of 1990. It is possible to estimate the allowable emissions that enable the eventual
stabilisation of GHGs. For example,
the Wigley, Richels, Edmonds
(WRE) stabilisation scenarios
represent theoretical emissions
pathways that result in a range of
stabilisation levels from 350 to
1,000 ppmv (Table 2; Figure 5).30
These various scenarios assume
CO2 continues to accumulate in the
atmosphere until between 2090 (for
a 450 ppmv target) and 2375 (for a
1,000 ppmv target). The emissions
pathways that result in these
stabilisation levels vary
significantly. For a 450 ppmv
target, emissions continue to
increase to a peak of ~11 GtC/year

13
Climate Change Impacts on Australia
in 2015, after which emissions decline progressively until they are a fraction of 1990 emissions.
For higher stabilisation levels, emissions peak at a later date and a higher magnitude before
subsequently declining.
The various WRE scenarios generally constrain future changes in global mean temperature to
varying degrees (Table 2; Figure 5). A 450 ppmv stabilisation target lowers warming by 2100
to 1.2–2.3°C, relative to the 1.4–5.8°C projected from the SRES scenarios with no mitigation
(Table 1). The 1,000 ppmv target lowers warming to 2.0–3.5°C by 2100. Notice that
uncertainties among the various stages in the climate change cycle (Figure 3) means that the
temperatures associated with a particular stabilisation cannot be known with exactness.
Instead, the assumption of stabilisation only constrains the uncertainty in future temperature
change to a smaller range, and there is considerable overlap in temperature ranges among
different stabilisation levels (Table 2). In addition, these temperature ranges suggest there is a
built-in commitment to additional warming on the order of ~1°C that exists largely independent
of mitigation efforts.7
It is also important to note that warming continues beyond 2100 for all of the stabilisation
scenarios (Table 2), and thus stabilisation of the climate (i.e., temperatures) lags considerably
behind stabilisation of atmospheric GHG concentrations. This is due to two reasons: a) several
of the scenarios don’t achieve stabilisation until post-2100 (Table 2), and b) it takes centuries
for the climate system to reach equilibrium with atmospheric GHG levels. Thus, the ultimate
Table 2. Projected emissions and global mean temperature changes associated with the IPCCs SRES scenarios and the WRE stabilisation scenarios. 1990 emissions are presented as a reference point.
31
Emissions Scenarios
CO2 Emissions (Gt C yr-1 )
Cumulative CO2
Emissions (Gt C)
Year of Stabilis-ation
Global ∆∆∆∆T
(2100)
Global ∆∆∆∆T
(2300)
1990 7.1
SRES
2050 2100 2001-2100
A1B A1T A1FI A2 B1 B2
16.4 12.3 23.9 17.4 11.3 11.0
13.5 4.3 28.2 29.1 4.2 13.3
1,415 985 2,105 1,780 900 1,080
2.1 – 3.8 2.7 – 3.3 3.2 – 5.8 2.8 – 4.7 1.4 – 2.6 1.9 – 2.5
WRE
2050 2100 2001-2100
450 550 650 750 1,000
3.0 – 6.9 6.4 – 12.6 8.1 – 15.3 8.9 – 16.4 9.5 – 17.2
1.0 – 3.7 2.7 – 7.7 4.8 – 11.7 6.6 – 14.6 9.1 – 18.4
365 – 735 590 – 1,135 735 – 1,370 820 – 1,500 905 – 1,620
2090 2150 2200 2250 2375
1.2 – 2.3 1.5 – 2.9 1.7 – 3.2 1.8 – 3.3 2.0 – 3.5
1.5 – 2.9 1.8 – 3.8 2.2 – 4.6 2.6 – 5.2 3.1 – 6.3

14
Climate Change Impacts on Australia
Figure 5. Temporal evolution of atmospheric concentrations associated with the WRE stabilisation scenarios (top) and the associated emissions pathways based upon two carbon cycle models (BERN-CC and ISAM).
magnitude of temperature change associated
with a given stabilisation level may be 25–
50% higher than 2100 levels.
The WRE scenarios represent just one set of
potential pathways leading to GHG
stabilisation. In reality, there are effectively
an infinite number of pathways that lead to
GHG stabilisation. In essence, achieving a
particular stabilisation target is equivalent to
placing a cap on net emissions between the
present and the time of stabilisation. Such a
cap effectively creates a GHG “budget”,
representing the net allowable emissions.
Although the budget for a particular
stabilisation level is fixed (subject to the
availability of sources for sequestration), the
emissions can be allocated over a diverse
array of pathways. Yet some pathways may
be more or less politically, economically, and
technologically feasible than others.
Delaying action to reduce emissions, for
example, allows emissions to continue to
grow at a relatively rapid rate over the near
term, but requires more abrupt and
potentially costly actions at a later date to
achieve a given stabilisation target.
Furthermore, delayed emissions reductions
or temporary overshoots of a stabilisation
target tend to result in more rapid warming.32
Therefore, if the goal of achieving a
particular stabilisation target is to avoid
specific magnitudes and/or rates of warming, sea-level rise, and downstream impacts, early
action to reduce near-term emissions may be a more robust strategy than delay.
Another important consideration in GHG stabilisation is the role of non-CO2 gases (e.g.,
methane, nitrous oxide). The WRE stabilisation scenarios focus primarily on CO2 and
generally assume that non-CO2 gases continue to grow along business-as-usual trajectories.33
Although the radiative forcing of these gases is low relative to CO2, different assumptions
about future trends in these gases can have a significant influence on the range of temperature
changes associated with a particular stabilisation scenario.33,34 Thus, it may be more relevant to
consider CO2-equivalent (CO2e) stabilisation levels, which reflect the radiative effects of all
GHGs normalized to the radiative forcing of CO2. This is particularly relevant if one is
attempting to limit future climate change to a particular magnitude of global warming. For
example, according to Hansen and Sato (2004), limiting future warming to 1°C requires a CO2
stabilisation level of 520 ppmv if effort is focused on reducing CO2 and non-CO2 gases in
unison, but 440 ppmv if the non-CO2 gases are neglected.34 Focus on the non-CO2 gases also
enables greater flexibility in addressing CO2 emissions. Non-CO2 gases can likely be reduced at
15
Climate Change Impacts on Australia
0
20
40
60
80
100
400 600 800 1000
CO2 at stabilisation (ppm)
Probability of meeting target
Prob <6
Prob <5.5
Prob <5
Prob <4.5
Prob <4
Prob <3.5
Prob <3
Prob <2.5
Prob <2
Prob <1.5
Target (oC)
Figure 6. Probabilities (expressed as a percent) of remaining below a range of targets for global mean temperature change (at the time of stabilisation) given different atmospheric CO2 stabilisation levels and assuming a climate sensitivity range of 1.5-4.5°C.
a lower cost, at least initially, than CO2. Thus, the greater the contribution of non-CO2 gas
emissions reductions to achieving a particular CO2 target, the lesser the burden on CO2.35
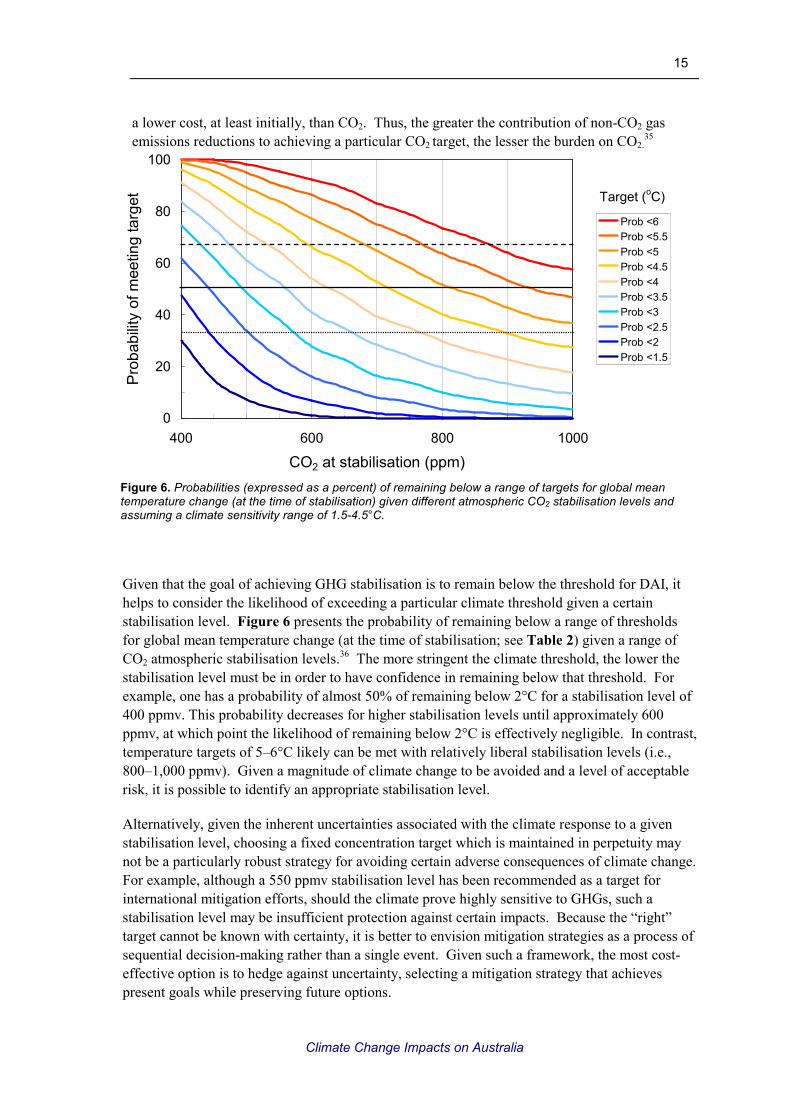
Given that the goal of achieving GHG stabilisation is to remain below the threshold for DAI, it
helps to consider the likelihood of exceeding a particular climate threshold given a certain
stabilisation level. Figure 6 presents the probability of remaining below a range of thresholds
for global mean temperature change (at the time of stabilisation; see Table 2) given a range of
CO2 atmospheric stabilisation levels.36 The more stringent the climate threshold, the lower the
stabilisation level must be in order to have confidence in remaining below that threshold. For
example, one has a probability of almost 50% of remaining below 2°C for a stabilisation level of
400 ppmv. This probability decreases for higher stabilisation levels until approximately 600
ppmv, at which point the likelihood of remaining below 2°C is effectively negligible. In contrast,
temperature targets of 5–6°C likely can be met with relatively liberal stabilisation levels (i.e.,
800–1,000 ppmv). Given a magnitude of climate change to be avoided and a level of acceptable
risk, it is possible to identify an appropriate stabilisation level.
Alternatively, given the inherent uncertainties associated with the climate response to a given
stabilisation level, choosing a fixed concentration target which is maintained in perpetuity may
not be a particularly robust strategy for avoiding certain adverse consequences of climate change.
For example, although a 550 ppmv stabilisation level has been recommended as a target for
international mitigation efforts, should the climate prove highly sensitive to GHGs, such a
stabilisation level may be insufficient protection against certain impacts. Because the “right”
target cannot be known with certainty, it is better to envision mitigation strategies as a process of
sequential decision-making rather than a single event. Given such a framework, the most cost-
effective option is to hedge against uncertainty, selecting a mitigation strategy that achieves
present goals while preserving future options.

16
Climate Change Impacts on Australia
Figure 7. RCEP pathways for 550 stabilisation. Global emissions initially exceed the WRE550 scenario before rapidly declining post-2025. World emissions are divided among Annex I nations which reduce emissions immediately and non-Annex I countries which do not undertake reductions until post-2025.
A number of institution have expressed this hedging strategy as the “guard rails”, “tolerable
windows”, or “safe-landings” approaches.37,38,39
The common element of these strategies is that
some determination is made of the acceptable damages or losses from climate (i.e., a magnitude
or rate of warming) as well as society’s willingness to pay to mitigate GHG emissions (i.e., a rate
of mitigation). The area between these two curves represents the range of allowable emissions.
The fact that a specific prior emissions path is not specified allows flexibility in setting interim
targets and burden-sharing, provided the window for acceptable emissions is not exceeded.
However, work by the WBGU (1997) demonstrates that delays in achieving emissions reductions
constrain subsequent decision-making.40 The closer one gets to the “guard rails” or to the
boundaries of the “tolerable window,” the more allowable emissions become prescribed.
Therefore, early action to reduce emissions provides greater flexibility at subsequent stages and
also enables adjustments to the windows as more information is gained regarding the sensitivity
of the climate system or the risk of unacceptable climate impacts.
4. EMISSIONS REDUCTIONS AND CLIMATE
STABILISATION
As is clear from Section 3, achieving GHG stabilisation at a level consistent with the CO2
concentration and temperature thresholds identified in Table 1 for DAI necessitates major
reductions in global GHG emissions...
Greenhouse gas emissions are
a useful benchmark for
measuring Australia’s efforts
in addressing the climate
change challenge. While a
number of institutions have
advocated global GHG
stabilisation levels (Table 1),
no one country can achieve
such a target through
individual action. However,
Australia can take measures to
achieve reductions in national
emissions, and in so doing,
contribute to other
international efforts to curb
GHG emissions and,
subsequently, GHG stabilisation. Although neither the international scientific nor policy
communities have come to an agreement regarding what an appropriate GHG stabilisation level
should be, significant emissions reductions over the next several decades would also preserve
future options in the choice of a stabilisation level. Should the climate prove insensitive to
anthropogenic GHG emissions, future commitments to mitigation can be made less stringent.
Yet, more conservative thresholds would remain feasible should the more pessimistic
projections of climate change and its impacts prevail.

17
Climate Change Impacts on Australia
Figure 8. Analysis of U.S. emissions pathway given a 550 ppmv stabilisation level. U.S. emissions peak in 2012, after which they decline to 64% below 2000 levels by 2050.
Although the pursuit of emissions reductions of 60% or more cannot be translated directly into
a specific stabilisation target, this emissions target does have its origins in the analysis of
different stabilisation pathways, particularly the 550 ppmv stabilisation target which, as
evidenced by Table 1, is roughly the upper limit for atmospheric GHG concentrations that
avoid DAI. For example, the United Kingdom’s Royal Commission on Environmental Pollution
(RCEP) recommended that by 2050, Annex I emissions reductions would have to be 60%
below 1990 levels in order to be on track to achieve a global 550 ppmv stabilisation target.23
The RCEP scenario is actually more stringent post-2100 than the WRE550 scenario, under the
argument that emissions are rapidly rising above those assumed in the WRE550 scenario
(Figure 7). This general approach has been accepted by the UK’s Department of Energy, which
is moving forward with implementation.41
Sweden’s updated climate change strategy has a near-term goal of meeting its Kyoto Protocol
target of 2% below 1990 levels by 2008–2012, and maintaining emissions at 1990 levels over
the interim period. In addition, it sets a longer term goal of reducing emissions 50% by 2050
(with per capita emissions below 4.5 tonnes/year), with further reductions beyond this point.19
Although the United States has opted out of the pursuit of a specific emissions target, an
analysis conducted in conjunction with the U.S. Department of Energy indicated that U.S.
emissions would have to be reduced by 64% below 2001 levels by 2050 if the U.S. were to
meet its contribution to a 550 ppmv stabilisation target (Figure 8).42 Emissions reduction
targets similar to those described above have been recently adopted elsewhere. The European
Union’s Environment Council
recommended emissions
reductions by developed
countries of 15–30% by 2020
and 60–80% by 2050,43
although these are non-
binding targets and have yet
to be incorporated into
official EU GHG reduction
strategies. In Australia, the
New South Wales
Greenhouse Gas Office has
followed the lead of the UK,
with its Greenhouse Advisory
Panel also recommending
60% reductions in emissions
by 2050.44
Despite the precedence for the use of 550 ppmv as benchmark for estimating GHG emission
reductions necessary to avoid DAI, it is clear from the range of proposed thresholds in Table 1
that even this threshold is considered too high by some experts. Carbon dioxide and CO2e
concentration thresholds well below 550 ppmv frequently have been recommended.
Furthermore, the average temperature threshold in Table 1 is 1.5°C. Table 2 indicates that a
550 ppmv stabilisation level is almost certain to exceed this threshold by 2100, and even a 450
ppmv stabilisation level would exceed this threshold by 2300 (see also Figure 6). An analysis
for the International Climate Change Policy Project by the Dutch National Institute of Public
Health and the Environment evaluated a range of different strategies for achieving a global CO2

18
Climate Change Impacts on Australia
vs. 1990 vs. Baseline
World
Oceania
-100
-90
-80
-70
-60
-50
-40
-30
-20
-10
0
Percent Reduction
World
Oceania
-100
-90
-80
-70
-60
-50
-40
-30
-20
-10
0
Percent Reduction
Brazilian Proposal
Multi-Stage
Convergence
Preference Scores
Jacoby Rule
Figure 9. Estimated emissions reductions (relative to 1990 or future baseline emissions in the absence of mitigation) necessary by 2050 to achieve a global stabilisation level of 450 ppmv CO2. Bars represent average estimates based upon five different strategies for emissions reductions including different timing and burden sharing schemes. Estimates for Oceania are presented relative to emissions reductions for the world as a whole.
stabilisation target of 450 ppmv, found that global emissions would have to be reduced by 30–
35% below 1990 levels by 2050, while Oceania’s emissions would have to be reduced by 75–
80% (Figure 9). Therefore, the goal of Annex I emissions reductions of 60% by 2050 may be
considered a minimum estimate of the effort needed to achieve stabilisation to avoid DAI.
Further reductions in emissions would be necessary beyond 2050, as reflected in the RCEP
strategy.23 In addition, to the extent that reductions greater than 60% by the mid-21
st century are
feasible, this would create the opportunity for stabilisation at levels below 550 ppmv.
What is also apparent from Figure 9 is the disparity in emission reductions associated with
developed countries such as Australia and those of the world at large. This reflects the
complex issue of burden-sharing between the developing and developed worth with respect to
emissions reductions. Historically, the developed world, particularly the United States and
Europe, have been responsible for the majority of GHG emissions.45 These regions also have
relatively high rates of per capita energy consumption associated with mature market
economies. The developing world has less historical responsibility for emissions, lower rates
of energy consumption, and generally less mature economies. Thus, it is generally assumed
that the developed world will take the lead in achieving GHG emissions reductions, with
significant developing country participation unlikely to occur prior to 2010. For example, both
RCEP and Sweden’s emissions reduction estimates are dependent on the assumption that non-
Annex I countries delay emissions reductions from anywhere from 0–65 years, depending upon
Annex I reductions, the rates of non-Annex I emissions growth, and natural offsets and carbon
sequestration (Table 3).46 This system for burden sharing is based upon the “contraction and
convergence” approach, which bases emissions reduction targets upon achieving an equitable
global distribution of per-capita emissions.46
19
Climate Change Impacts on Australia
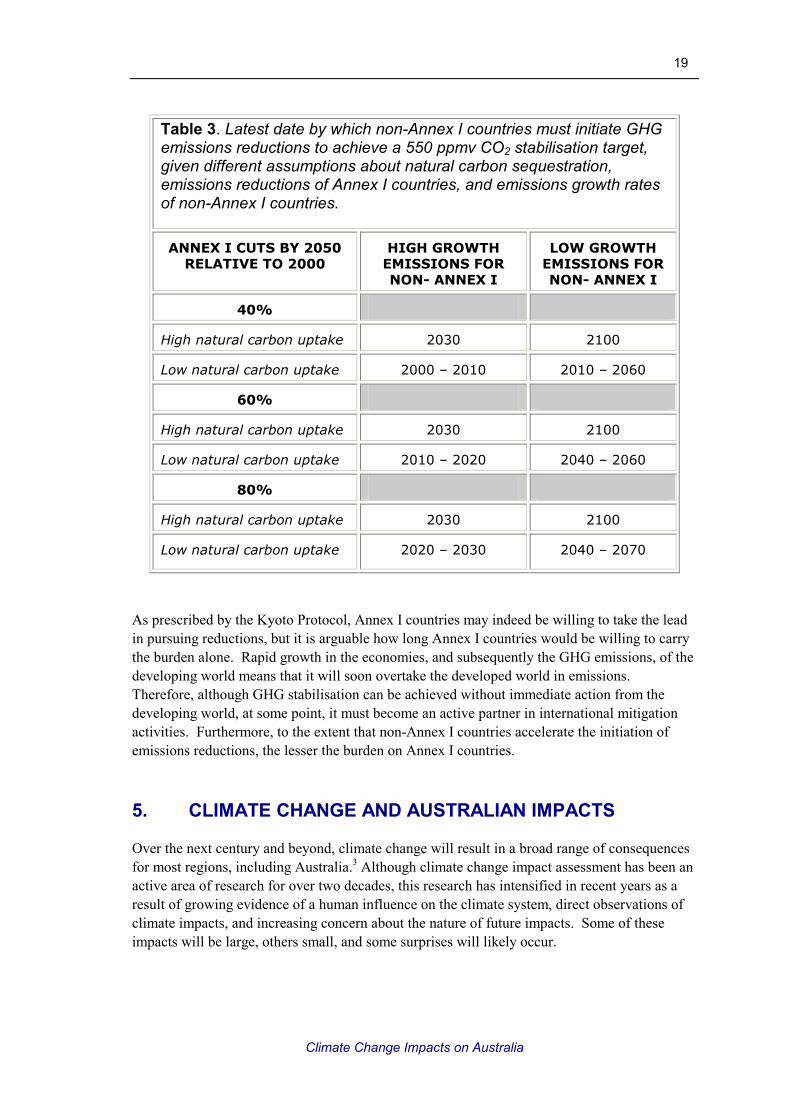
As prescribed by the Kyoto Protocol, Annex I countries may indeed be willing to take the lead
in pursuing reductions, but it is arguable how long Annex I countries would be willing to carry
the burden alone. Rapid growth in the economies, and subsequently the GHG emissions, of the
developing world means that it will soon overtake the developed world in emissions.
Therefore, although GHG stabilisation can be achieved without immediate action from the
developing world, at some point, it must become an active partner in international mitigation
activities. Furthermore, to the extent that non-Annex I countries accelerate the initiation of
emissions reductions, the lesser the burden on Annex I countries.
5. CLIMATE CHANGE AND AUSTRALIAN IMPACTS
Over the next century and beyond, climate change will result in a broad range of consequences
for most regions, including Australia.3 Although climate change impact assessment has been an
active area of research for over two decades, this research has intensified in recent years as a
result of growing evidence of a human influence on the climate system, direct observations of
climate impacts, and increasing concern about the nature of future impacts. Some of these
impacts will be large, others small, and some surprises will likely occur.
Table 3. Latest date by which non-Annex I countries must initiate GHG emissions reductions to achieve a 550 ppmv CO2 stabilisation target, given different assumptions about natural carbon sequestration, emissions reductions of Annex I countries, and emissions growth rates of non-Annex I countries.
ANNEX I CUTS BY 2050 RELATIVE TO 2000
HIGH GROWTH EMISSIONS FOR NON- ANNEX I
LOW GROWTH EMISSIONS FOR NON- ANNEX I
40%
High natural carbon uptake 2030 2100
Low natural carbon uptake 2000 – 2010 2010 – 2060
60%
High natural carbon uptake 2030 2100
Low natural carbon uptake 2010 – 2020 2040 – 2060
80%
High natural carbon uptake 2030 2100
Low natural carbon uptake 2020 – 2030 2040 – 2070
20
Climate Change Impacts on Australia
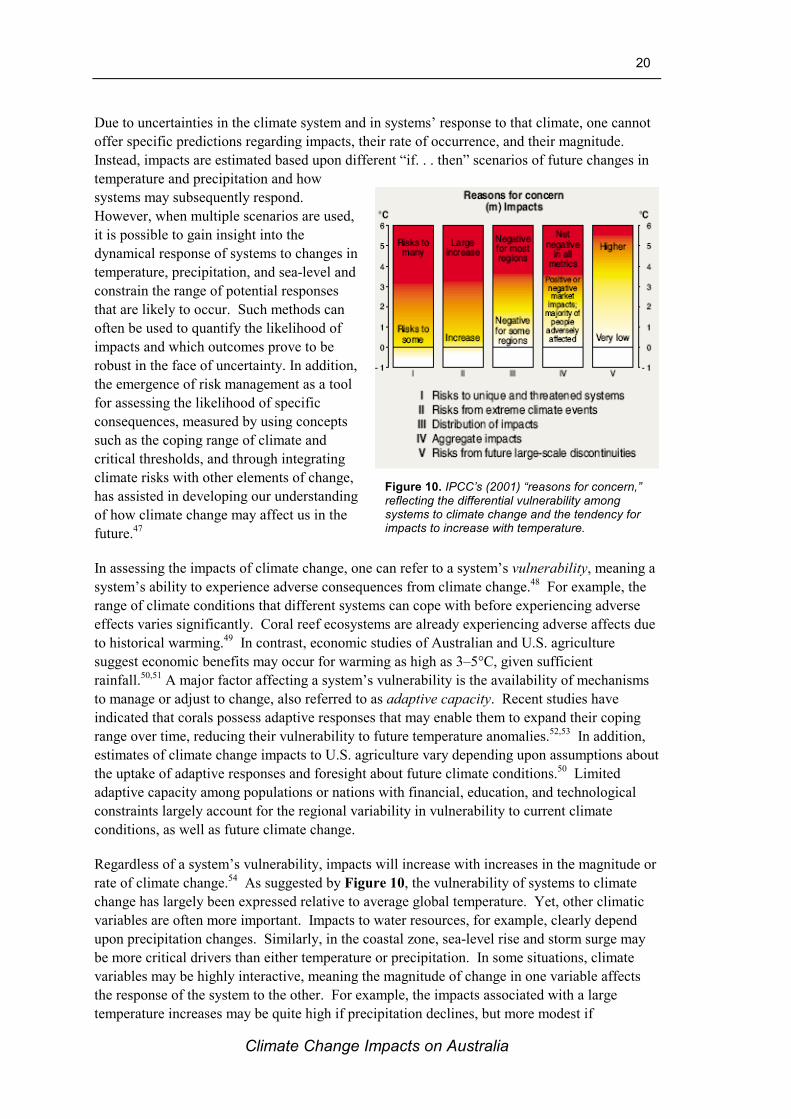
Figure 10. IPCC’s (2001) “reasons for concern,” reflecting the differential vulnerability among systems to climate change and the tendency for impacts to increase with temperature.
Due to uncertainties in the climate system and in systems’ response to that climate, one cannot
offer specific predictions regarding impacts, their rate of occurrence, and their magnitude.
Instead, impacts are estimated based upon different “if. . . then” scenarios of future changes in
temperature and precipitation and how
systems may subsequently respond.
However, when multiple scenarios are used,
it is possible to gain insight into the
dynamical response of systems to changes in
temperature, precipitation, and sea-level and
constrain the range of potential responses
that are likely to occur. Such methods can
often be used to quantify the likelihood of
impacts and which outcomes prove to be
robust in the face of uncertainty. In addition,
the emergence of risk management as a tool
for assessing the likelihood of specific
consequences, measured by using concepts
such as the coping range of climate and
critical thresholds, and through integrating
climate risks with other elements of change,
has assisted in developing our understanding
of how climate change may affect us in the
future.47
In assessing the impacts of climate change, one can refer to a system’s vulnerability, meaning a
system’s ability to experience adverse consequences from climate change.48 For example, the
range of climate conditions that different systems can cope with before experiencing adverse
effects varies significantly. Coral reef ecosystems are already experiencing adverse affects due
to historical warming.49 In contrast, economic studies of Australian and U.S. agriculture
suggest economic benefits may occur for warming as high as 3–5°C, given sufficient
rainfall.50,51 A major factor affecting a system’s vulnerability is the availability of mechanisms
to manage or adjust to change, also referred to as adaptive capacity. Recent studies have
indicated that corals possess adaptive responses that may enable them to expand their coping
range over time, reducing their vulnerability to future temperature anomalies.52,53 In addition,
estimates of climate change impacts to U.S. agriculture vary depending upon assumptions about
the uptake of adaptive responses and foresight about future climate conditions.50 Limited
adaptive capacity among populations or nations with financial, education, and technological
constraints largely account for the regional variability in vulnerability to current climate
conditions, as well as future climate change.
Regardless of a system’s vulnerability, impacts will increase with increases in the magnitude or
rate of climate change.54 As suggested by Figure 10, the vulnerability of systems to climate
change has largely been expressed relative to average global temperature. Yet, other climatic
variables are often more important. Impacts to water resources, for example, clearly depend
upon precipitation changes. Similarly, in the coastal zone, sea-level rise and storm surge may
be more critical drivers than either temperature or precipitation. In some situations, climate
variables may be highly interactive, meaning the magnitude of change in one variable affects
the response of the system to the other. For example, the impacts associated with a large
temperature increases may be quite high if precipitation declines, but more modest if
21
Climate Change Impacts on Australia
Figure 11. Illustration of the vulnerability of Australia’s ecosystems to changes in temperature and
precipitation.
precipitation keeps pace with temperature. Thus in communicating the risks of climate change,
it is important to acknowledge these complex interactions.
This section summarizes a range of climate change impacts, divided into five core sectors:
natural ecosystems; crop agriculture, forestry, and livestock; water resources; public health; and
human settlements and infrastructure. The general factors that affect the vulnerability of these
sectors are discussed. This is followed by a summary of results from impact assessments
specific to Australia, presented as a gradient over a range of 21st century temperature changes
from ~1°C up to ~5+°C (roughly the upper estimate for projected 21st century global mean
temperature change). These impacts are integrated into a series of simple figures illustrating
the relative vulnerability of these systems to the combined effects of changes in temperature
and precipitation conditions. In addition, two cross-cutting issues relevant to understanding
climate change are discussed further: the potential for climate extremes and large-scale
singularities. The impacts associated with different magnitudes of temperature change can be
compared with estimated temperature change in the absence of mitigation or with different
mitigation targets and/or GHG stabilisation levels (Section 3), to gain greater insight regarding
the benefits of GHG mitigation and stabilisation for avoiding impacts (Section 6).
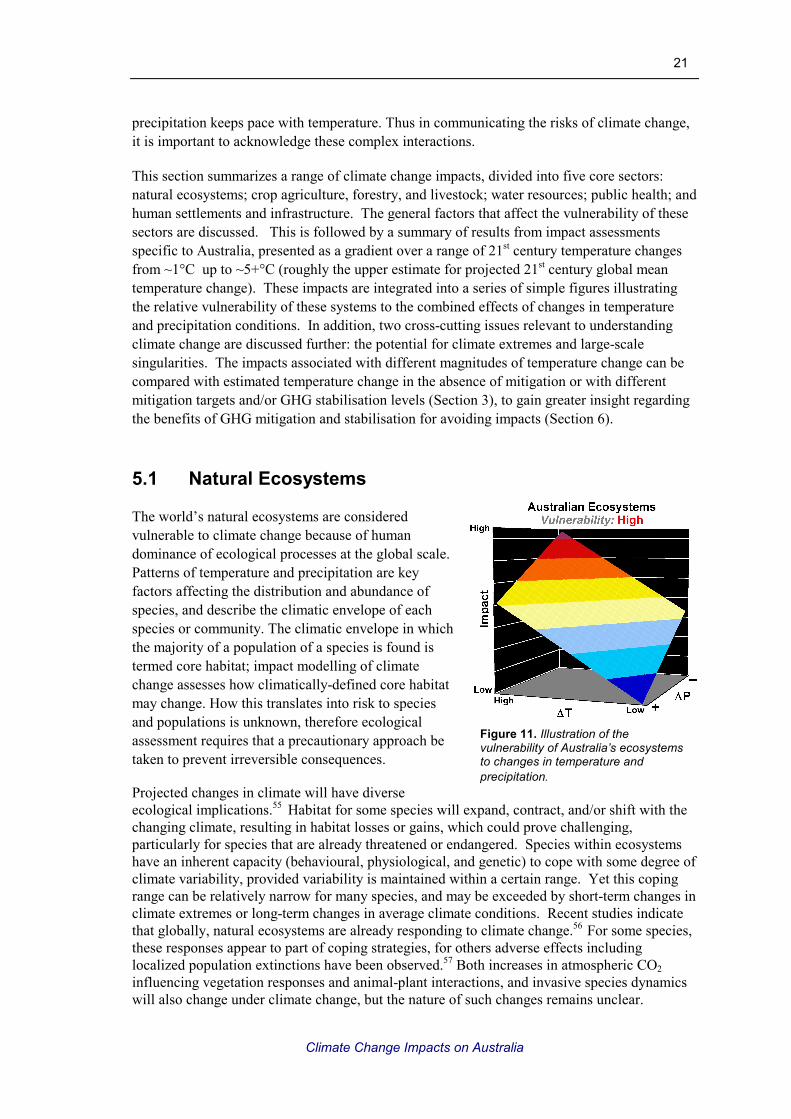
5.1 Natural Ecosystems
The world’s natural ecosystems are considered
vulnerable to climate change because of human
dominance of ecological processes at the global scale.
Patterns of temperature and precipitation are key
factors affecting the distribution and abundance of
species, and describe the climatic envelope of each
species or community. The climatic envelope in which
the majority of a population of a species is found is
termed core habitat; impact modelling of climate
change assesses how climatically-defined core habitat
may change. How this translates into risk to species
and populations is unknown, therefore ecological
assessment requires that a precautionary approach be
taken to prevent irreversible consequences.
Projected changes in climate will have diverse
ecological implications.55 Habitat for some species will expand, contract, and/or shift with the
changing climate, resulting in habitat losses or gains, which could prove challenging,
particularly for species that are already threatened or endangered. Species within ecosystems
have an inherent capacity (behavioural, physiological, and genetic) to cope with some degree of
climate variability, provided variability is maintained within a certain range. Yet this coping
range can be relatively narrow for many species, and may be exceeded by short-term changes in
climate extremes or long-term changes in average climate conditions. Recent studies indicate
that globally, natural ecosystems are already responding to climate change.56 For some species,
these responses appear to part of coping strategies, for others adverse effects including
localized population extinctions have been observed.57 Both increases in atmospheric CO2
influencing vegetation responses and animal-plant interactions, and invasive species dynamics
will also change under climate change, but the nature of such changes remains unclear.

22
Climate Change Impacts on Australia
A number of Australia’s ecosystems are vulnerable to changes in temperature and precipitation
(Figure 11),3 and thus significant adverse consequences from climate change are projected,
even for relatively small shifts in climate conditions. The Great Barrier Reef, a UNESCO
World Heritage area, is particularly vulnerable to climate change, given the narrow coping
range and limited adaptive capacity of corals. Historically unprecedented rates of bleaching
have occurred over the past two decades and considerable losses or contractions of species
associated with coral communities are projected for a further warming of only 1°C (Table 4).
Similarly, high altitude montane ecosystems are sensitive to climate change-induced reductions
in winter snow cover, and the highland rainforests of northern Australia are projected to
decrease by 50% for just a 1°C increase in temperature. Given higher magnitudes of warming,
adverse effects for certain groups of species are expected to become progressively worse.
Table 4. Projected Impacts to Australian Ecosystems
∆∆∆∆T (°C) Projected Impact
10–40% shrinkage of snow-covered area in the Australian Alps58
18–60% decline in 60-day snow cover in the Australian Alps58
Bleaching and damage to the Great Barrier Reef equivalent to 1998 and 2002 in up to 50% of years59,60
60% of the Great Barrier Reef is regularly bleached61
Habitat is lost for 14% of Victoria's marine invertebrates62
50% decrease in habitat for vertebrates in northern Australia tropics63 ,64
<5% loss of core habitat for Victorian and montane tropical vertebrate species65
28% of Dryandra species’ core habitat is significantly reduced in SW Australia66
4% of Acacia species’ core habitat is significantly reduced in SW Australia66
63% decrease in Golden Bowerbird habitat in N Australia67
Habitat for 3 frog and 15 threatened/endangered mammals in W Australia is lost or restricted66
<1
50% decrease in montane tropical rainforest area in N Australia68
Up to 58–81% of the Great Barrier Reef is bleached every year61
Hard coral reef communities are widely replaced by algal communities69
90% decrease in core habitat for vertebrates in northern Australia tropics63,64
5–10% loss of core habitat for Victorian and montane tropical vertebrate species65
88% of butterfly species’ core habitat decreases70
66% of core habitat for Dryandra species is significantly reduced in SW Australia66
1–2
100% of Acacia species are eliminated in SW Australia66
97% of the Great Barrier Reef is bleached every year61
10–40% loss of core habitat for Victoria and montane tropical vertebrate species65
92% of butterfly species’ core habitat decreases70
98% decrease in Bowerbird habitat in N Australia67
2–3
80% loss of freshwater wetlands in Kakadu (30 cm sea level rise)71
Catastrophic mortality of coral species annually61
95% decrease in distribution of Great Barrier Reef species61
65% loss of Great Barrier Reef species in the Cairns region59
20–85% shrinkage of total snow-covered area in the Australian Alps58
38–96% decline in 60-day snow cover in the Australian Alps58
3–4
30–70% loss of core habitat for Victoria and montane tropical vertebrate species65
4–5 60–90% loss of core habitat for Victoria and montane tropical vertebrate species65
>5 90–100% of core habitat lost for most Australian vertebrates63,64

23
Climate Change Impacts on Australia
Figure 12. Illustration of the vulnerability of Australia’s agriculture to changes in temperature and precipitation.
Annual damage to the Great Barrier Reef increases to the point of catastrophic failure, snow
cover and duration decreases substantially, and species are lost from vertebrate and invertebrate
communities in northern and southeast Australia.
5.2 Cropping, Forestry, and
Livestock
The cropping, forestry, and livestock sectors are
influenced by changes in climatic conditions and
also by increases in atmospheric CO2. The
productivity of crop agriculture and forestry is
dependent upon temperatures, the length of the
growing season, available soil moisture, atmospheric
CO2 and climate extremes such as droughts and
storms. Livestock are sensitive to temperature, water
availability and access to food. Intensive
management of these sectors can reduce their
vulnerability to climate relative to extensive
production ecosystems, but failure can be much
more expensive if critical thresholds are exceeded in
such systems. Over time, people have expanded the coping range of agriculture and livestock
by breeding strains more tolerate of a wider range of climate conditions. In addition,
agricultural practices such as irrigation and pest control further expand the resilience of these
sectors to climate conditions. Nevertheless, climate extremes are still capable of inflicting
substantial damages on agriculture, forestry, and livestock. For example, prolonged droughts
reduce agricultural productivity, while wildfires in arid can affect valuable forest land.
Climate change will probably posed mixed consequences for Australian agriculture, forestry,
and livestock, depending upon interactions between temperature, precipitation and the response
of vegetation to the “CO2 fertilization” effect (Figure 12). Given sufficient increases in
precipitation, wheat yields are projected to increase for warming of up to at least 3–4°C (Table
5). Under less favourable precipitation scenarios, however, such increases in productivity may
not be realized, and, large reductions in precipitation and increases in drought could severely
impact agriculture. In addition, despite domestic increases in wheat productivity, exports are
projected to decline. Agricultural pests, such as the Queensland fruit fly and the light brown
apple moth are also projected to increase, which will affect net changes in economic welfare.
For the vast bulk of Australia’s plantation forests the interaction between temperature and
water availability is the key issue, with productivity being predominantly water limited, and
“growing season” often being more influenced by water availability. For up to 1°C – increased
precipitation results in increased yield, while decreased precipitation results in decreased yields
(Table 4). Impacts to the timber industry also vary with the type of timber and geographic
location. For example, warming of just 1°C has been projected to exceed the core habitat of
25% of Eucalyptus species. However, knowledge of productive growth of a forest species
beyond its core climatic envelope can provide valuable information on how species may
acclimatise to changes.72 For higher magnitudes of warming, forestry in N Australia suffers
24
Climate Change Impacts on Australia
lowered productivity, while in the cooler, less water limited areas of S Australia forest
productivity increases.75
Average changes will be far less important in this context than more extreme events, which can
have catastrophic impact on the economic viability of long-rotation crops. Large areas of
Australian plantations are “on the edge” in terms of drought risk. Fire frequency and severity is
a major risk for plantations. A number of key plantation pests are favoured by warm summer
conditions or tree drought stress.
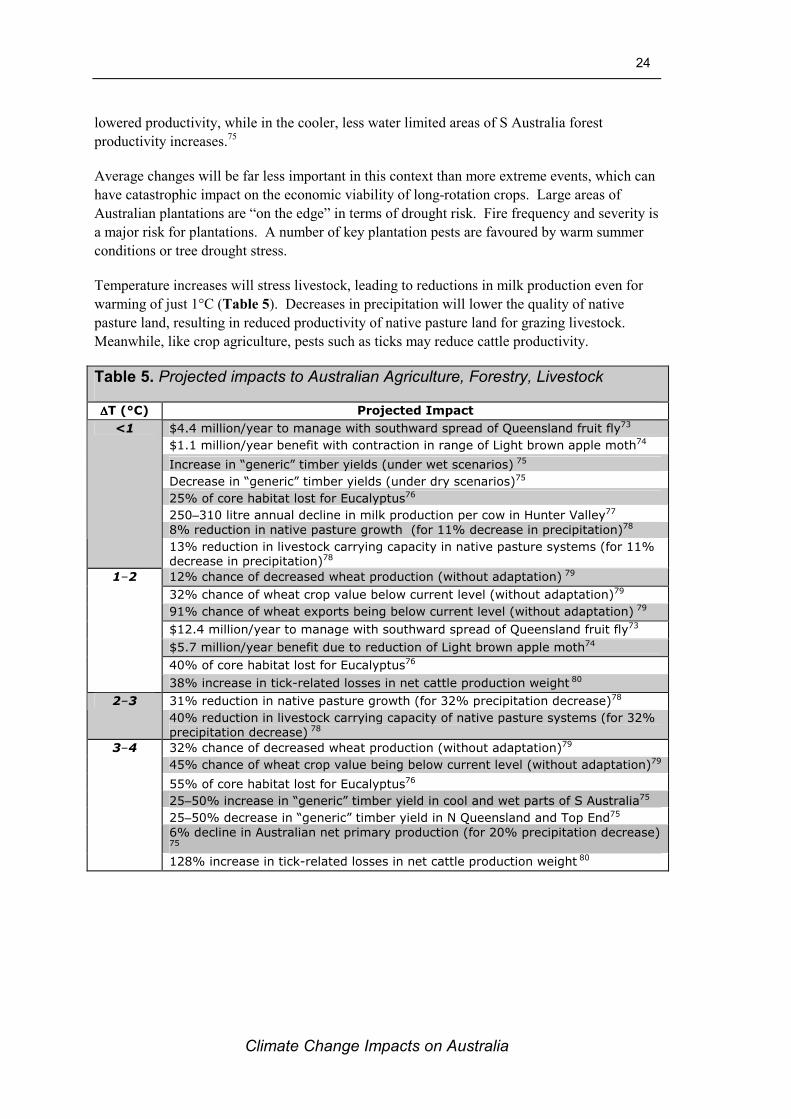
Temperature increases will stress livestock, leading to reductions in milk production even for
warming of just 1°C (Table 5). Decreases in precipitation will lower the quality of native
pasture land, resulting in reduced productivity of native pasture land for grazing livestock.
Meanwhile, like crop agriculture, pests such as ticks may reduce cattle productivity.
Table 5. Projected impacts to Australian Agriculture, Forestry, Livestock
∆∆∆∆T (°C) Projected Impact
$4.4 million/year to manage with southward spread of Queensland fruit fly73
$1.1 million/year benefit with contraction in range of Light brown apple moth74
Increase in “generic” timber yields (under wet scenarios) 75
Decrease in “generic” timber yields (under dry scenarios)75
25% of core habitat lost for Eucalyptus76
250–310 litre annual decline in milk production per cow in Hunter Valley77
8% reduction in native pasture growth (for 11% decrease in precipitation)78
<1
13% reduction in livestock carrying capacity in native pasture systems (for 11% decrease in precipitation)78
12% chance of decreased wheat production (without adaptation) 79
32% chance of wheat crop value below current level (without adaptation)79
91% chance of wheat exports being below current level (without adaptation) 79
$12.4 million/year to manage with southward spread of Queensland fruit fly73
$5.7 million/year benefit due to reduction of Light brown apple moth74
40% of core habitat lost for Eucalyptus76
1–2
38% increase in tick-related losses in net cattle production weight 80
31% reduction in native pasture growth (for 32% precipitation decrease)78 2–3
40% reduction in livestock carrying capacity of native pasture systems (for 32% precipitation decrease) 78
32% chance of decreased wheat production (without adaptation)79
45% chance of wheat crop value being below current level (without adaptation)79
55% of core habitat lost for Eucalyptus76
25–50% increase in “generic” timber yield in cool and wet parts of S Australia75
25–50% decrease in “generic” timber yield in N Queensland and Top End75
6% decline in Australian net primary production (for 20% precipitation decrease) 75
3–4
128% increase in tick-related losses in net cattle production weight 80
25
Climate Change Impacts on Australia
Figure 14. Graphic illustration of the vulnerability of Australia’s water resources to changes in temperature and precipitation.
Figure 13. Long-term annual average streamflows for major surface water sources for the Perth water supply system.
5.3 Water Resources
Water resources are increasingly a core issue for both the developed and, particularly the
developing world due limited resources and a growing global population. Furthermore, water
resources supply a broad range of goods and services, including drinking water, waste
management, hydroelectric generation, irrigation, recreation and tourism opportunities, and
habitat for wildlife. Both past and present challenges to water management have demonstrated
the powerful influence of climate variability and change. A particular challenge for water
resources management are extreme events, such as prolonged droughts which reduce water
availability, or periodic extreme rainfall events, which result in extensive run-off and increase
the risk of flooding.
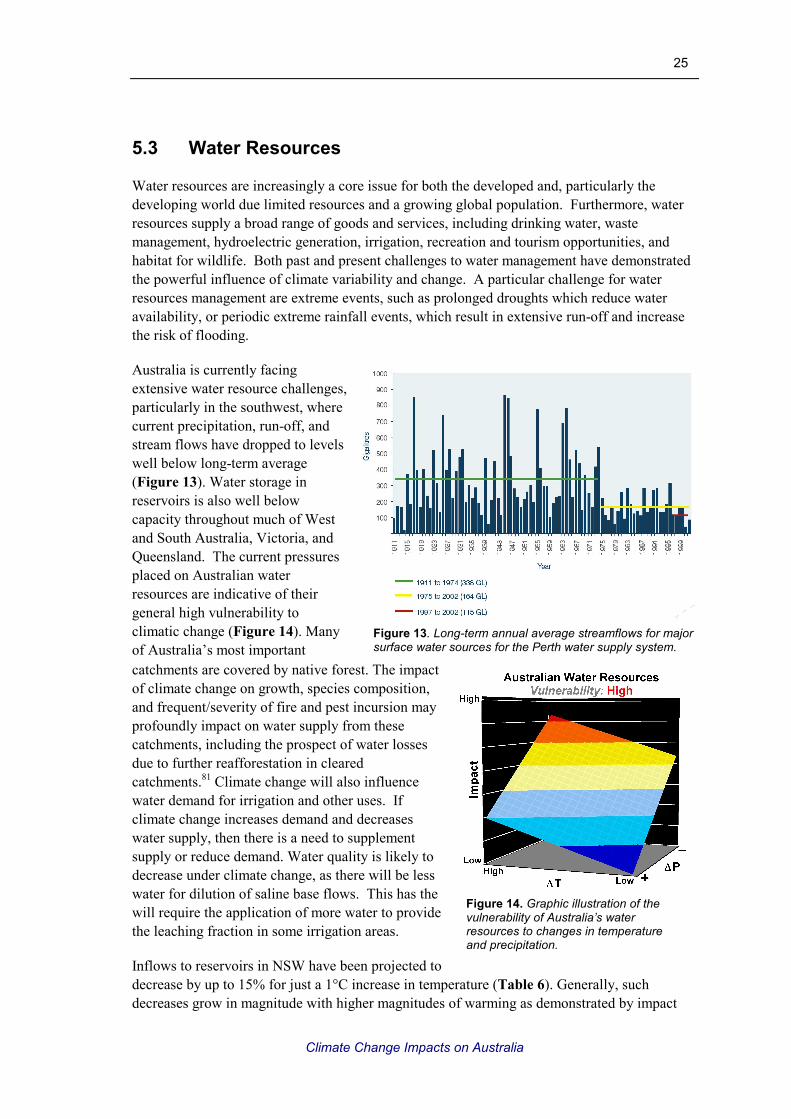
Australia is currently facing
extensive water resource challenges,
particularly in the southwest, where
current precipitation, run-off, and
stream flows have dropped to levels
well below long-term average
(Figure 13). Water storage in
reservoirs is also well below
capacity throughout much of West
and South Australia, Victoria, and
Queensland. The current pressures
placed on Australian water
resources are indicative of their
general high vulnerability to
climatic change (Figure 14). Many
of Australia’s most important
catchments are covered by native forest. The impact
of climate change on growth, species composition,
and frequent/severity of fire and pest incursion may
profoundly impact on water supply from these
catchments, including the prospect of water losses
due to further reafforestation in cleared
catchments.81 Climate change will also influence
water demand for irrigation and other uses. If
climate change increases demand and decreases
water supply, then there is a need to supplement
supply or reduce demand. Water quality is likely to
decrease under climate change, as there will be less
water for dilution of saline base flows. This has the
will require the application of more water to provide
the leaching fraction in some irrigation areas.
Inflows to reservoirs in NSW have been projected to
decrease by up to 15% for just a 1°C increase in temperature (Table 6). Generally, such
decreases grow in magnitude with higher magnitudes of warming as demonstrated by impact

26
Climate Change Impacts on Australia
Figure 15. Illustration of the vulnerability of Australia’s public health
to changes in temperature and
precipitation.
assessments for a range of reservoirs across NSW, Victoria, and South Australia (Table 11). In
addition, these decreases have important ecological implications as well, by affecting wetlands
important for bird breeding as well as other wildlife. These projected impacts are highly
dependent upon changes in rainfall regimes. However, CSIRO projections generally indicate
rainfall, particularly in winter, will decrease substantially in Victoria, S Australia, and W
Australia over the 21st century. Changes are more uncertain for other regions.
Table 6. Projected impacts to Australian Water Resources
∆∆∆∆T (°C) Projected Impact
0–15% likely decrease in flow to Burrendong Dam and Macquarie Marshes in Macquarie River Basin (NSW)82,83
<1
3–11% decrease in Melbourne’s water supply84
12–25% decrease in flow in the Murray Darling Basin85 1–2
7–35% decrease in Melbourne’s water supply84
2–3 5–35% likely decrease in flow to Burrendong Dam and Macquarie Marshes in Macquarie River Basin (NSW)82,83
50% chance threshold for bird breeding exceeded in Macquarie Marshes82,83
3–4
16–48% decrease in flow in the Murray Darling Basin85
5.4 Public Health
Assessing the implications of climate change for
public health remains quite challenging due to the
existence of complex interactions among climate, the
environment, and socioeconomic factors. The direct
effects of climate change include the potential for
increases in temperature to increase heat-related, and
reduce cold-related, illness and death.54 The former
largely occurs in extreme heat events, such as that
associated with the 2003 mass casualty event in
Europe.86 Increases in winter temperatures may reduce
illness and mortality, but it is unclear the extent to
which seasonal patterns of infectious disease are in
fact temperature dependent, and thus how much higher
temperatures may alleviate cold-weather illness and
mortality.87 Other extreme weather events such as severe storms, wind, and flooding also
contribute to injury and mortality on an annual basis.
In addition to the direct health effects of climate, there are a range of indirect consequences.
Higher temperatures have been linked with higher levels of tropospheric ozone, particularly in
urban areas, which can induce respiratory and cardiovascular illness and death.54 The risk of
vector borne disease is influenced by climate, due to the effects of temperature and
precipitation on disease vectors in the environment (e.g., mosquitoes, ticks).54 Temperature and
precipitation extremes have also been associated with increases in food and water-borne
illness.54
27
Climate Change Impacts on Australia
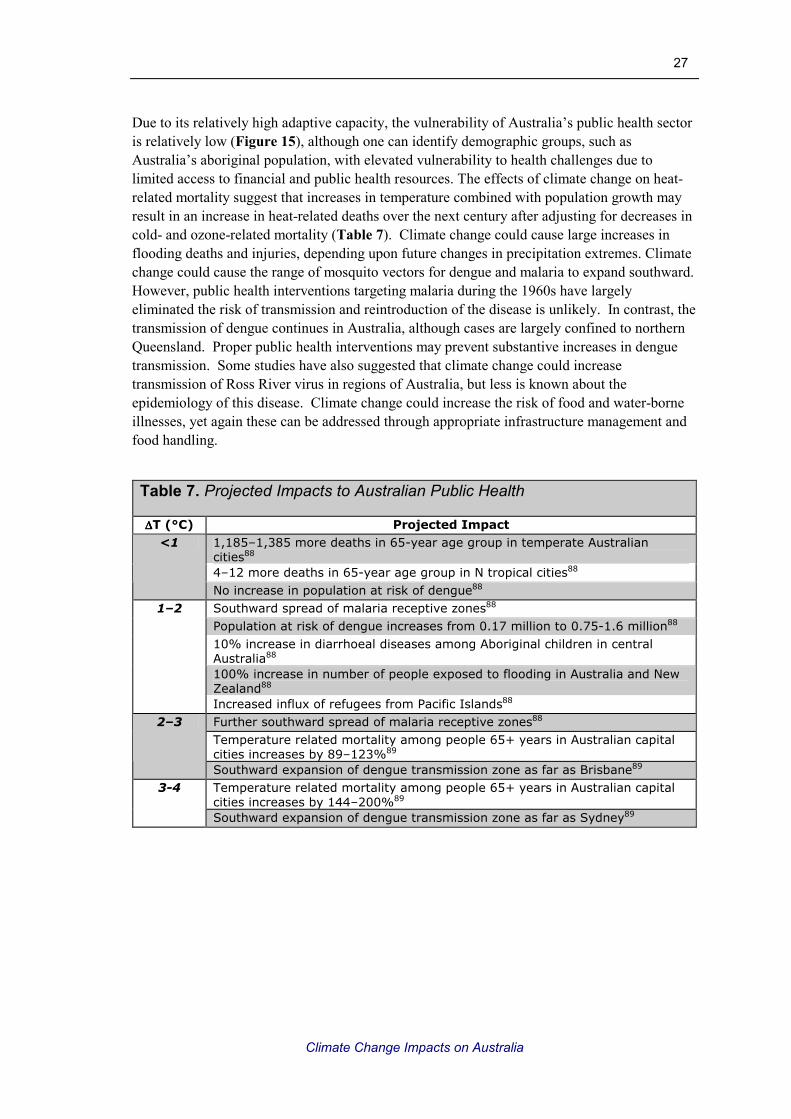
Due to its relatively high adaptive capacity, the vulnerability of Australia’s public health sector
is relatively low (Figure 15), although one can identify demographic groups, such as
Australia’s aboriginal population, with elevated vulnerability to health challenges due to
limited access to financial and public health resources. The effects of climate change on heat-
related mortality suggest that increases in temperature combined with population growth may
result in an increase in heat-related deaths over the next century after adjusting for decreases in
cold- and ozone-related mortality (Table 7). Climate change could cause large increases in
flooding deaths and injuries, depending upon future changes in precipitation extremes. Climate
change could cause the range of mosquito vectors for dengue and malaria to expand southward.
However, public health interventions targeting malaria during the 1960s have largely
eliminated the risk of transmission and reintroduction of the disease is unlikely. In contrast, the
transmission of dengue continues in Australia, although cases are largely confined to northern
Queensland. Proper public health interventions may prevent substantive increases in dengue
transmission. Some studies have also suggested that climate change could increase
transmission of Ross River virus in regions of Australia, but less is known about the
epidemiology of this disease. Climate change could increase the risk of food and water-borne
illnesses, yet again these can be addressed through appropriate infrastructure management and
food handling.
Table 7. Projected Impacts to Australian Public Health
∆∆∆∆T (°C) Projected Impact
1,185–1,385 more deaths in 65-year age group in temperate Australian cities88
4–12 more deaths in 65-year age group in N tropical cities88
<1
No increase in population at risk of dengue88
Southward spread of malaria receptive zones88
Population at risk of dengue increases from 0.17 million to 0.75-1.6 million88
10% increase in diarrhoeal diseases among Aboriginal children in central Australia88
100% increase in number of people exposed to flooding in Australia and New Zealand88
1–2
Increased influx of refugees from Pacific Islands88
Further southward spread of malaria receptive zones88
Temperature related mortality among people 65+ years in Australian capital cities increases by 89–123%89
2–3
Southward expansion of dengue transmission zone as far as Brisbane89
Temperature related mortality among people 65+ years in Australian capital cities increases by 144–200%89
3-4
Southward expansion of dengue transmission zone as far as Sydney89

28
Climate Change Impacts on Australia
Figure 16. Illustration of the vulnerability of Australia’s public health to changes in temperature and
precipitation.
5.5 Settlements and
Infrastructure
Many aspects of human settlements where people
live, work, and play are exposed to the climate,
prompting concern about the potential impacts of
climate change. Those aspects of human settlements
that have received the most focus include energy, the
built environment of the coastal zone, transportation,
and recreation/tourism. Human settlements,
particularly those in developed countries, tend to have
a fairly broad coping capacity and are generally
resilient to daily and seasonal variability in the
climate system. Thus, a particular concern for
settlements is the potential for changes in the
frequency of climate extremes (see below) – more frequent heat waves, more frequent or
intense storm events, more frequent floods. All of these would pose significant challenges to
human settlements that would ultimately necessitate adaptive responses, although their
implications for communities have in many cases not yet been quantified.
Australia’s settlements are moderately vulnerable to climate change (Figure 16), largely due to
the potential impacts posed by extremes of temperature and precipitation. Australia’s energy
sector may be one of the first components of Australian settlements to respond to climate
changes. Impact assessments indicate that just a 1°C increase in average temperatures would
be sufficient to increase peak demand in Adelaide and Brisbane, and reduce transmission
efficiency (Table 8). Yet, these increases may be offset by initial decreases in electricity
demand in Melbourne and Sydney and reduced demand for natural gas in Melbourne. For
higher levels of warming, electricity demand in Brisbane, Melbourne, and Adelaide increases,
while demand in Sydney remains at slightly lower levels than present. Temperature increases
of 2-3oC are projected to increase maintenance costs for transportation infrastructure.
Australia’s coastal zone is of particular concern, due to its thousands of kilometres of coastline
and the concentration of much of Australia’s population, commerce, and industry in the coastal
zone. Climate modelling has suggested that storm winds, including those associated with
tropical cyclones, may become more intense with a warming of 1–2°C (Table 8). This
combined with sea-level rise would result in higher storm surge during storm events and a
greater area flooded. In addition, higher wind speeds would increase storm damages as they
tend to increase with the square of wind speed.90 Sea-level rise and storm events also contribute
to coastal inundation and beach erosion, which may affect popular tourism and recreation areas.
At higher levels of warming, coastal impacts become more severe with higher storm winds and
sea levels.

29
Climate Change Impacts on Australia
5.6 Extreme Weather Events
A key cross-cutting issue that emerges from examining climate change impacts across multiple
sectors is the significant influence of extreme weather events on the consequences of climate
change. For example, in the preceding discussion of sectoral impacts, the potential for
extremes were identified as an important factor affecting the occurrence of impacts. Extreme
events tend to inflict large environmental and economic costs, which is exacerbated by the fact
that they can be difficult to adequately manage through adaptive processes. Globally, the World
Meteorological Organization has claimed that extreme events are on the rise as a result of
anthropogenic perturbation of the climate system,97 and climate models indicate the potential
for increases in extremes of temperature, precipitation, droughts, storms, and floods.54
Table 8. Projected impacts to Australian Settlements
∆∆∆∆T (°C) Projected Impact
3% decreases in thermal efficiency of electricity transmission infrastructure91
Decrease in demand for natural gas for heating in Melbourne92
Peak electricity demand in Melbourne and Sydney decreases up to 1%93
<1
Peak electricity demand in Adelaide and Brisbane increases 2–5%93
100 year storm surge height around Cairns increases 22%; area flooded doubles94
Peak electricity demand in Melbourne and Sydney decreases 1%93
1–2
Peak electricity demand in Adelaide and Brisbane increases 4–10%93
17% increase in road maintenance costs over most of Australia95
Decreases in road maintenance costs in S Australia95
Peak electricity demand in Adelaide, Brisbane and Melbourne increases 3–15%93
2–3
Peak electricity demand in Sydney decreases 1%93
Oceania experiences net loss of GDP96
Peak electricity demand in Adelaide, Brisbane and Melbourne increases 5–20%93
3–4
Peak electricity demand in Sydney decreases 1%93
Peak electricity demand in Adelaide, Brisbane and Melbourne increases 9–25%93
4–5
Peak electricity demand in Sydney decreases 0.5%93
Peak electricity demand in Sydney decreases 0%93 >5
Peak electricity demand in Adelaide, Brisbane and Melbourne increases 10–25%93
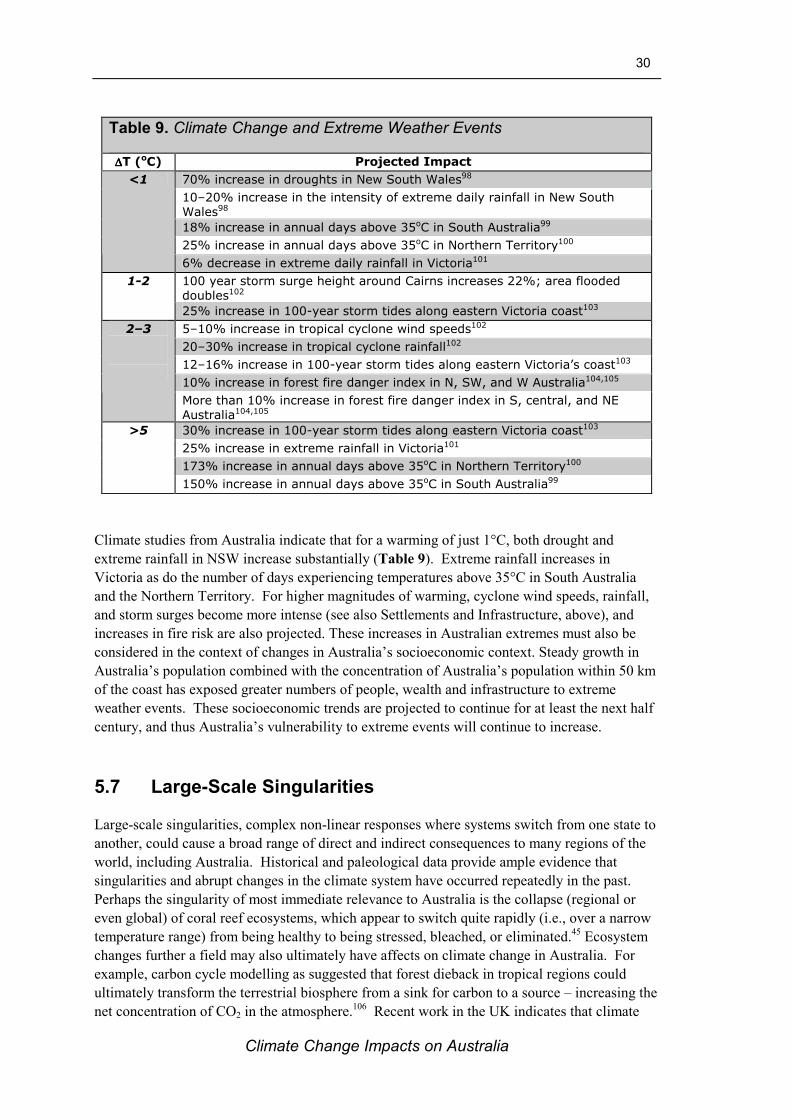
30
Climate Change Impacts on Australia
Climate studies from Australia indicate that for a warming of just 1°C, both drought and
extreme rainfall in NSW increase substantially (Table 9). Extreme rainfall increases in
Victoria as do the number of days experiencing temperatures above 35°C in South Australia
and the Northern Territory. For higher magnitudes of warming, cyclone wind speeds, rainfall,
and storm surges become more intense (see also Settlements and Infrastructure, above), and
increases in fire risk are also projected. These increases in Australian extremes must also be
considered in the context of changes in Australia’s socioeconomic context. Steady growth in
Australia’s population combined with the concentration of Australia’s population within 50 km
of the coast has exposed greater numbers of people, wealth and infrastructure to extreme
weather events. These socioeconomic trends are projected to continue for at least the next half
century, and thus Australia’s vulnerability to extreme events will continue to increase.
5.7 Large-Scale Singularities
Large-scale singularities, complex non-linear responses where systems switch from one state to
another, could cause a broad range of direct and indirect consequences to many regions of the
world, including Australia. Historical and paleological data provide ample evidence that
singularities and abrupt changes in the climate system have occurred repeatedly in the past.
Perhaps the singularity of most immediate relevance to Australia is the collapse (regional or
even global) of coral reef ecosystems, which appear to switch quite rapidly (i.e., over a narrow
temperature range) from being healthy to being stressed, bleached, or eliminated.45 Ecosystem
changes further a field may also ultimately have affects on climate change in Australia. For
example, carbon cycle modelling as suggested that forest dieback in tropical regions could
ultimately transform the terrestrial biosphere from a sink for carbon to a source – increasing the
net concentration of CO2 in the atmosphere.106 Recent work in the UK indicates that climate
Table 9. Climate Change and Extreme Weather Events
∆∆∆∆T (oC) Projected Impact
70% increase in droughts in New South Wales98
10–20% increase in the intensity of extreme daily rainfall in New South Wales98
18% increase in annual days above 35oC in South Australia99
25% increase in annual days above 35oC in Northern Territory100
<1
6% decrease in extreme daily rainfall in Victoria101
100 year storm surge height around Cairns increases 22%; area flooded doubles102
1-2
25% increase in 100-year storm tides along eastern Victoria coast103
5–10% increase in tropical cyclone wind speeds102
20–30% increase in tropical cyclone rainfall102
12–16% increase in 100-year storm tides along eastern Victoria’s coast103
10% increase in forest fire danger index in N, SW, and W Australia104,105
2–3
More than 10% increase in forest fire danger index in S, central, and NE Australia104,105
30% increase in 100-year storm tides along eastern Victoria coast103
25% increase in extreme rainfall in Victoria101
173% increase in annual days above 35oC in Northern Territory100
>5
150% increase in annual days above 35oC in South Australia99
31
Climate Change Impacts on Australia
change is causing carbon to be released from soils at a rate equivalent to almost 10% of UK
annual industrial CO2 emissions – potentially offsetting reductions in anthropogenic
emissions.107
For a number of years, scientists have expressed concern about the potential for climate change
to destabilize the large ice sheets of Greenland and West Antarctica.108 Global warming as well
as the melting of glaciers and ice sheets (which increases the flux of freshwater to the oceans),
could destabilize the global ocean thermohaline circulation (THC). Such destabilisation could
slow its circulation, potentially to the point of complete collapse, causing regional climate
shifts with significant environmental and economic consequences.109,110
Melting of glaciers and
ice sheets also contributes to sea-level rise. Vast quantities of ice are locked away in the ice
sheets of West Antarctica and Greenland, collectively equivalent to approximately 12 meters of
sea-level rise. Destabilisation or collapse of these ice sheets would lead to centuries of
irreversible sea-level rise and coastal inundation around the world.
Paleological data indicate that abrupt climate shifts have occurred in the past as a result of
catastrophic release of GHGs, primarily methane, from methane hydrates in the ocean’s
sediments. There has been some investigation of the causes of this release,111 and speculation
regarding the potential for anthropogenic climate change to once again destabilize this
reservoir, resulting in a large-scale release of methane.
Although such singularities are potential consequences of a changing climate, the probability of
specific events and the time scales over which they would occur (or even whether they would
occur at all) is quite uncertain. Yet, the consequences of such events, should they occur, would
be large and global. As such, much of the interest in defining DAI under the UNFCCC’s
Article II has emphasized the importance of mitigating GHG emissions to ensure such
singularities are avoided. However, the climate thresholds for some of these singularities may
be quite low. Hansen (2005) recently suggested that the threshold for an irreversible loss of the
Greenland ice sheet may be as low as 1°C (Table 1, Table 10). For 1–2°C, climate models
indicate the THC begins to show signs of moderate weakening. For 2–3°C, the THC weakens
further, and collapse of the Greenland or West Antarctic ice sheets become even more likely.
For 3–4°C, coral reefs suffer catastrophic failure and the terrestrial biosphere becomes a net
CO2 source. By 4–5°C, the THC may be pushed to the point of collapse.
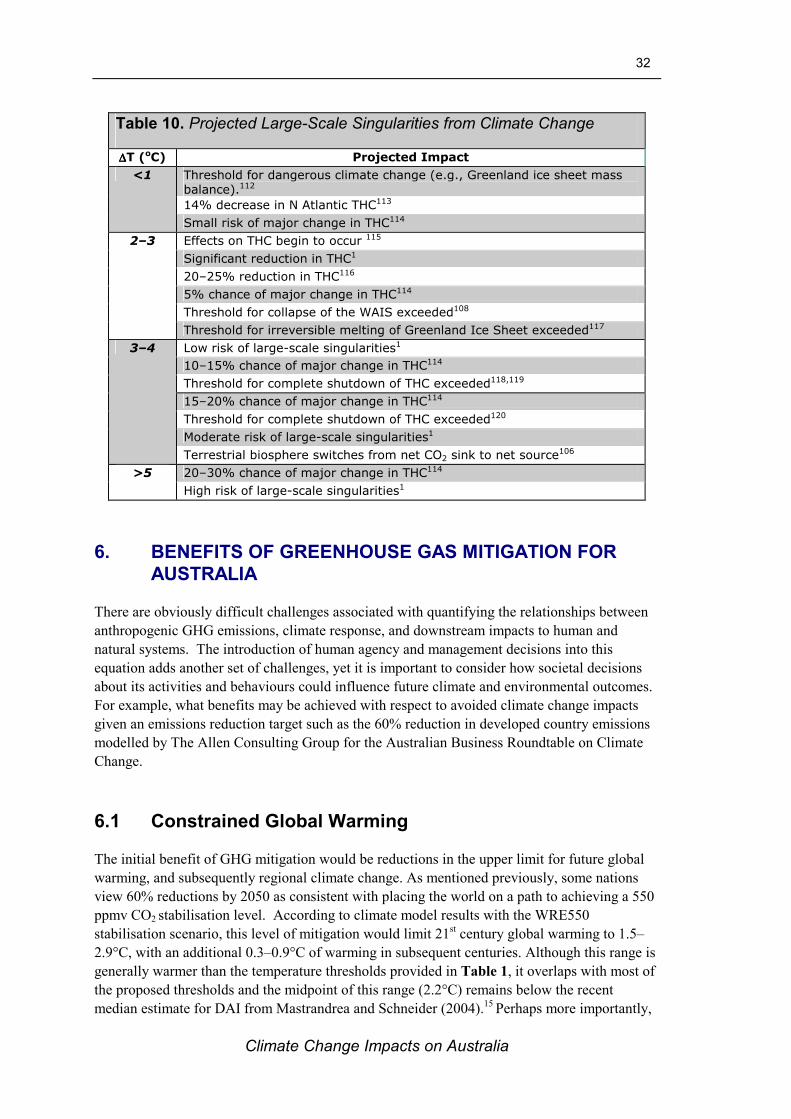
32
Climate Change Impacts on Australia
Table 10. Projected Large-Scale Singularities from Climate Change
∆∆∆∆T (oC) Projected Impact
Threshold for dangerous climate change (e.g., Greenland ice sheet mass balance).112
14% decrease in N Atlantic THC113
<1
Small risk of major change in THC114
Effects on THC begin to occur 115
Significant reduction in THC1
20–25% reduction in THC116
5% chance of major change in THC114
Threshold for collapse of the WAIS exceeded108
2–3
Threshold for irreversible melting of Greenland Ice Sheet exceeded117
Low risk of large-scale singularities1
10–15% chance of major change in THC114
Threshold for complete shutdown of THC exceeded118,119
15–20% chance of major change in THC114
Threshold for complete shutdown of THC exceeded120
Moderate risk of large-scale singularities1
3–4
Terrestrial biosphere switches from net CO2 sink to net source106
20–30% chance of major change in THC114 >5
High risk of large-scale singularities1
6. BENEFITS OF GREENHOUSE GAS MITIGATION FOR
AUSTRALIA
There are obviously difficult challenges associated with quantifying the relationships between
anthropogenic GHG emissions, climate response, and downstream impacts to human and
natural systems. The introduction of human agency and management decisions into this
equation adds another set of challenges, yet it is important to consider how societal decisions
about its activities and behaviours could influence future climate and environmental outcomes.
For example, what benefits may be achieved with respect to avoided climate change impacts
given an emissions reduction target such as the 60% reduction in developed country emissions
modelled by The Allen Consulting Group for the Australian Business Roundtable on Climate
Change.
6.1 Constrained Global Warming
The initial benefit of GHG mitigation would be reductions in the upper limit for future global
warming, and subsequently regional climate change. As mentioned previously, some nations
view 60% reductions by 2050 as consistent with placing the world on a path to achieving a 550
ppmv CO2 stabilisation level. According to climate model results with the WRE550
stabilisation scenario, this level of mitigation would limit 21st century global warming to 1.5–
2.9°C, with an additional 0.3–0.9°C of warming in subsequent centuries. Although this range is
generally warmer than the temperature thresholds provided in Table 1, it overlaps with most of
the proposed thresholds and the midpoint of this range (2.2°C) remains below the recent
median estimate for DAI from Mastrandrea and Schneider (2004).15 Perhaps more importantly,
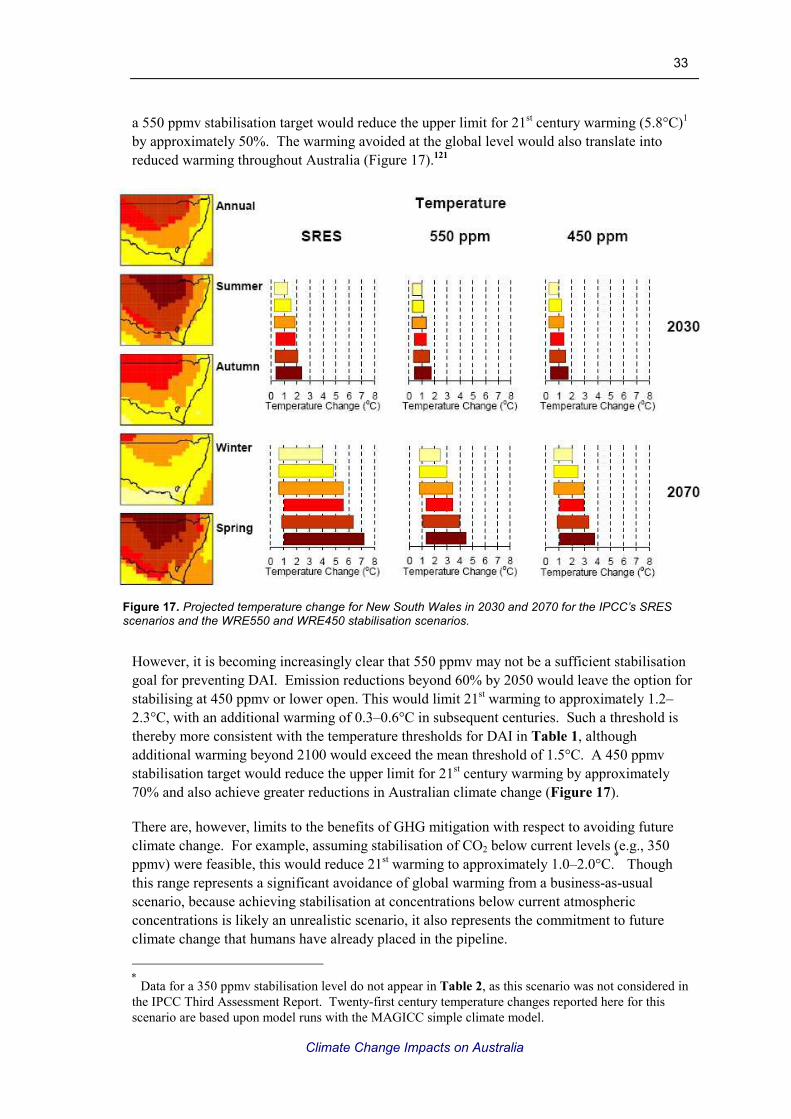
33
Climate Change Impacts on Australia
Figure 17. Projected temperature change for New South Wales in 2030 and 2070 for the IPCC’s SRES scenarios and the WRE550 and WRE450 stabilisation scenarios.
a 550 ppmv stabilisation target would reduce the upper limit for 21st century warming (5.8°C)
1
by approximately 50%. The warming avoided at the global level would also translate into
reduced warming throughout Australia (Figure 17).121
However, it is becoming increasingly clear that 550 ppmv may not be a sufficient stabilisation
goal for preventing DAI. Emission reductions beyond 60% by 2050 would leave the option for
stabilising at 450 ppmv or lower open. This would limit 21st warming to approximately 1.2–
2.3°C, with an additional warming of 0.3–0.6°C in subsequent centuries. Such a threshold is
thereby more consistent with the temperature thresholds for DAI in Table 1, although
additional warming beyond 2100 would exceed the mean threshold of 1.5°C. A 450 ppmv
stabilisation target would reduce the upper limit for 21st century warming by approximately
70% and also achieve greater reductions in Australian climate change (Figure 17).
There are, however, limits to the benefits of GHG mitigation with respect to avoiding future
climate change. For example, assuming stabilisation of CO2 below current levels (e.g., 350
ppmv) were feasible, this would reduce 21st warming to approximately 1.0–2.0°C.
∗
Though
this range represents a significant avoidance of global warming from a business-as-usual
scenario, because achieving stabilisation at concentrations below current atmospheric
concentrations is likely an unrealistic scenario, it also represents the commitment to future
climate change that humans have already placed in the pipeline.
∗
Data for a 350 ppmv stabilisation level do not appear in Table 2, as this scenario was not considered in
the IPCC Third Assessment Report. Twenty-first century temperature changes reported here for this
scenario are based upon model runs with the MAGICC simple climate model.
34
Climate Change Impacts on Australia
6.2 Avoided Impacts
The avoidance of global warming achieved via GHG mitigation would have downstream
benefits with respect to avoided climate change impacts. Due to the commitment to climate
change, it is no longer possible to prevent all the adverse impacts of global climate change.
Nevertheless, developed country emissions reductions of 60% or more by 2050 would enhance
the likelihood of avoiding some of the more catastrophic consequences, while ensuring that
unavoidable impacts are less severe. Undoubtedly, as both climate change and scientific
research advances, knowledge regarding the consequences of climate change will grow,
enabling more refined estimates of impacts and the effort required to protect valued
environmental systems. Yet, generally, insight regarding the benefits of different GHG
stabilisation levels can be gained by comparing the range of temperatures associated with a
given stabilisation level (e.g., Table 2) with the range of impacts associated with different
magnitudes of global warming described previously. Because mitigation generally reduces the
upper limit for future temperature change, the primary benefit of mitigation is the minimization
or elimination of climate change impacts associated with high magnitudes of warming.
However, even systems that are adversely affected at low levels of warming would still benefit
from mitigation.
For example, given that warming of just 1°C may exceed the threshold of coping capacity for
the Great Barrier Reef and other coral ecosystems, it may be too late to avoid substantial
impacts to these systems, even with aggressive, early mitigation action. However, mitigation
may prevent the complete loss of coral reef ecosystems. Mitigation would reduce not just the
magnitude, but also the rate of future climate change, which may give natural ecosystems such
as coral reefs greater time to adapt. As a result, coral communities may avoid the loss of at
least the more heat-tolerant species, thereby maintaining the function, goods, and services of
reef ecosystems.
Early and aggressive mitigation may also help ensure that the impacts to agriculture, forestry,
and livestock would be relatively moderate. Emission reductions of 60% or more by 2050
would prevent some of the worst-case scenarios for temperature and, particularly, precipitation
changes in Australia. Although highly vulnerable systems such as the forests of northern
Australia would still be adversely affected, crop agriculture and other forestry activities may be
more likely to experience the benefits of climate change, rather than the damages. Water
availability and quality for agricultural, as well as commercial and residential uses would
remain a challenge, yet mitigation could assist in avoiding some of the more extreme impacts to
Australia’s water resources.
Much of the public health impacts of climate change could be prevented via GHG mitigation by
reducing the number of high temperature days and subsequent heat-related illness and death.
Moderating changes in climate would also reduce the likelihood of significant changes in the
distribution and abundance of disease vectors. Mitigation would also reduce future sea-level
rise, coastal inundation, and erosion as well as other threats to built infrastructure within
communities.

35
Climate Change Impacts on Australia
Analyse
risk
Manage risk
(adapt)
Residual
risk
Coping range → Adaptive capacity
Mitigative capacity ←
Manage risk
(mitigate)
Analyse
risk
Manage risk
(adapt)
Residual
risk
Coping range → Adaptive capacity
Mitigative capacity ←
Manage risk
(mitigate)
Analyse
risk
Manage risk
(adapt)
Residual
risk
Coping range → Adaptive capacity
Mitigative capacity ←
Manage risk
(mitigate)
Figure 18. Schematic representing the complementary relationship between mitigation and adaptation. Adaptive capacity expands the coping range of affected systems reducing their vulnerability, while mitigation reduces the magnitude of climate change to which systems are exposed. Thus, mitigation and adaptation approach risk from opposite directions, but collectively minimize the likelihood of a particular consequence.
Due to the commitment to climate change, even with early action to reduce GHG emissions,
there is likely to be an increased risk of extreme weather events, such as potentially more
intense cyclones, and extremes of temperature and precipitation. Yet the frequency and
intensity of such events would be dampened. In addition, the risk of large-scale singularities
would be significantly reduced. Major reductions in the THC would likely be avoided, and
warming would be limited to below the threshold for at least some estimates of ice sheet
collapse, thereby avoiding additional meters of sea-level rise over the next several centuries.
The benefits of top-down mitigation efforts for reducing impacts can be leveraged by bottom-
up adaptation efforts.122 For example, investment in public health systems and infrastructure
can achieve additional reductions in climate change-related injury and mortality. Local-to-
regional planning and management of water resources can assist in ensuring adequate
conservation and supply for various uses. Planning of future development in the coastal zone
in anticipation of sea-level rise can reduce the costs of climate change by enabling gradual
retreat from advancing shorelines rather than inundation of valuable, occupied land. Successful
implementation of such adaptive responses necessitates, however, extensive public education
about climate change and its consequences and the provisioning of sufficient resources and
investments to facilitate their implementation.
The issue of adaptation has largely been absent from the UNFCCC and the Kyoto Protocol,123
yet adaptation can make an important contribution to avoiding “dangerous” climate change if
not at the global level, then at least at the local level. The most robust method for managing the
risks of climate change is to pursue GHG stabilisation mitigation and adaptation as
complementary strategies (Figure 18).36 Adaptation can expand the range of climate
variability with which a system can cope, while mitigation reduces the upper limit of climate
change to which a system will be exposed. This combination of bottom-up and top-down risk
management ensures that the risk of adverse consequences is minimized.
36
Climate Change Impacts on Australia
APPENDIX I - REFERENCES
1 IPCC (2001) Climate Change 2001: The Scientific Basis. Contribution of Working Group I to the Third
Assessment Report of the Intergovernmental Panel on Climate Change, J.T. Houghton, Ding, Y., Griggs,
D.J., Noguer, M., van der Linden, P.J., Dai, X., Maskell, K., and Johnson, C.A. (eds.), Cambridge
University Press, Cambridge, UK and New York, NY, USA, 881 pp. 2 Mann, M.E. and Jones, P.D. (2003) Global surface temperatures over the past two millennia.
Geophysical Research Letters 30, doi:10.1029/2003GL017814. 3 Pittock, B. (ed.) (2003) Climate Change: An Australian Guide to the Science and Potential Impacts.
Australian Greenhouse Office, Canberra, ACT, Australia. 4 Meehl, G.A., Washington, W.M., Ammann, C.M., Arblaster, J.M., Wigley, T.M.L., and Tebaldi, C.
(2004) Combinations of natural and anthropogenic forcings in 21st century climate. Journal of Climate 17,
3721-3727. 5 Karoly, D.J., and Braganza, K. (2005) Attribution of recent temperature changes in the Australia region.
Journal of Climate 18, 457-464. 6 IPCC (2000) Special Report on Emissions Scenarios, Special Report for Working Group III of the
Intergovernmental Panel on Climate Change, N. Nakicenovic, and Swart, R. (eds.), Cambridge
University Press, Cambridge, United Kingdom and New York, NY, USA, 570 pp. 7 Wigley, T.M.L. (2005) The climate change commitment. Science 18, 1766-1769. 8 UNFCCC (1992) United Nations Framework Convention on Climate Change, United Nations, New
York, NY, 33 pp. 9 Pershing, J., and Tudela, F. (2003) A long-term target: Framing the climate effort. In Beyond Kyoto:
Advancing the International Effort Against Climate Change. Pew Centre on Global Climate Change,
Arlington, VA, USA, pp. 13–14. 10 For more information see http://www.greenhouse.gov.au/ggap/index.html
11 Bodansky, D., Chou, S., and Jorge-Tresolini, C. (2004) International Climate Efforts Beyond 2012: A
Survey of Approaches. Pew Center on Global Climate Change, Arlington, VA, USA. 12 Azar, C., and Rodhe, H. (1997) Targets for stabilization of atmospheric CO2. Science 276, 1818-1819.
13 COOL (2002) Climate Options for the Long Term-Synthesis Report. W. Tuinstra, M. Berk, M.
Hisschemöller, L. Hordijk, B. Metz, and A.P.J. Mol (eds.). Dutch National Research Programme on
Global Air Pollution and Climate Change, Wageningen/Amsterdam/Bilthoven, Netherlands, 118 pp. 14 ICCT (2004) Meeting the Climate Challenge: Recommendations of the International Climate Change
Task Force. The Institute for Public Policy Research, The Centre for American Progress, The Australia
Institute, London, UK, Washington, USA, Canberra, AU, 26 pp. 15 Leemans, R., and van Vliet, A. (2005) Extreme Weather: Does Nature Keep Up? Observed Responses
of Species and Ecosystems to Changes in Climate and Extreme Weather Events: Many More Reasons for
Concern. Environmental Systems Analysis Group, Wagenigen University, The Netherlands and WWF
International. 16 European Climate Forum (2004) What is dangerous climate change? Initial Results of a Symposium on
Key Vulnerable Regions and Article 2 of the UNFCCC, European Climate Forum and Potsdam Institute
for Climate Impact Research, 27-30 October 2004, Beijing, China. 17 European Union (1996) European Union Proposal for a Draft Protocol to the United Nations
Framework Convention on Climate Change. Geneva, Switzerland. 18 Hansen, J.H. (2005) A slippery slope: How much warming constitute dangerous anthropogenic
interference? Climatic Change 68, 269–279. 19 Klimatkommittén (2003) Proposed Swedish Climate Strategy. SOU: 2000 23 2.1.
20 Mastrandrea, M.D. and Schneider, S.H. (2004) Probabilistic integrated assessment of “dangerous”
climate change. Science 304, 571-575. 21 O’Neill, B.C. and Oppenheimer, M. (2002) Dangerous climate impacts and the Kyoto Protocol. Science
296, 1971-1972 22 Rijsberman, F.J. and Swart, R.J. (eds.) (1990) Targets and Indicators of Climate Change. Stockholm
Environment Institute, Stockholm, Sweden. 23 Royal Commission on Environmental Pollution (RCEP) (2000) Energy – The Changing Climate.
London, UK, 292 pp. 24 Wissenschaftlicher Beirat der Bundesregierung (WBGU) (2003) Scenario for the Derivation of

37
Climate Change Impacts on Australia
Global CO2 Reduction Targets and Implementation Strategies. Berlin, Germany, 40 pp. 25 Wissenschaftlicher Beirat der Bundesregierung (WBGU) (2003) Assessment of Knowledge on Impacts
of Climate Change – Contribution to the Specification of Art. 2 of the UNFCCC. Berlin, Germany, 104
pp. 26 Petit, J.R., Jouzel, J., Raynaud, D., Barkov, N.I., Barnola, J.-M., Basile, I., Bender, M., Chappellaz, J.,
Davisk, M., Delaygue, G., Delmotte, M., Kotlyakov, V.M., Legrand, M., Lipenkov, V.Y., Lorius, C., Pe´
pin, L., Ritz, C., Saltzmank, E., and Stievenard, M. (1999) Climate and atmospheric history of the past
420,000 years from the Vostok ice core, Antarctica. Nature 399, 429-436. 27 Schlesinger, W.H. (1997) Biogeochemistry: An Analysis of Global Change. Academic Press, San
Diego, CA, USA, 588 pp. 28 Carbon Dioxide Information Analysis Center. Historical Carbon Dioxide Record from the Vostock Ice
Core. http://cdiac.esd.ornl.gov/trends/co2/vostok.htm, Accessed 12 April, 2005. 29 IPCC (2000) Special Report on Emissions Scenarios, Special Report for Working Group III of the
Intergovernmental Panel on Climate Change. Nakicenovic, N. and Swart, R. (eds.), Cambridge
University Press, Cambridge, United Kingdom and New York, NY, USA, 570 pp. 30 Wigley, T.M.L., Richels, R., and Edmonds, J.A. (1996) Economic and environmental choices in the
stabilization of atmospheric CO2 concentrations. Nature 379, 240-243. 31 IPCC (2001) Climate Change 2001. Synthesis Report. Contributions of Working Groups I, II and III to
the Third Assessment Report of the Intergovernmental Panel on Climate Change. World Meteorological
Organisation and United Nations Environment Programme, Cambridge University Press, Cambridge, UK,
397 pp. 32 O’Neill, B.C., and Oppenheimer, M. (2004) Climate change impacts are sensitive to the stabilisation
path. Proceedings of the National Academy of Sciences, USA 101,16411–16416. 33 Hansen, J., Sato, M., Ruedy, R., Lacis, A., and Olnas, V. (2000) Global warming in the 21
st century: An
alternative scenario. Proceedings of the National Academies of Science USA 97, 9875-9880. 34 Hansen, J., and Sato, M. (2004) Greenhouse gas growth rates. Proceedings of the National Academies
of Science USA 46, 16109-16114. 35 Reilly, J.M., Jacoby, H.D., and Prinn, R.G. (2003) Multi-Gas Contributors to Global Climate Change:
Climate Impacts and Mitigation Costs of Non-CO2 Gases. Pew Centre on Global Climate Change,
Arlington, VA, USA, 48 pp. 36 Jones, R.N. (2004) Incorporating agency into climate change risk assessments. Climatic Change 67, 13-
26. 37 Wissenschaftlicher Beirat der Bundesregierung (WBGU) (1995) Scenario for the Derivation of Global
CO2- Reduction Targets and Implementation Strategies. Statement on the Occasion of the First
Conference of the Parties to the Framework Convention on Climate Change in Berlin. WBGU,
Bremerhaven, Germany. 38 Swart, R., Berk, M., Janssen, Kreileman, E., and Leemans, R. (1998) The safe landing approach: Risks
and trade-offs in climate change. In Global change scenarios of the 21st century - Results from the
IMAGE 2.1. Model. J. Alcamo, R. Leemans, and E. Kreileman (eds.), Pergamon/Elsevier Science,
Oxford, pp. 193-218. 39 Bruckner, T., Petschel-Held, G., Toth, F.L., Fussel, H.-M., Helm, C., Leimbach, M., and Schellnhuber,
H.-J. (1999) Climate change decision-support and the tolerable windows approach. Environmental
Modeling and Assessment 4. 217–234. 40 Wissenschaftlicher Beirat der Bundesregierung (WBGU) (1997) Targets for Climate Protection, 1997.
A Study for the Third Conference of the Parties to the Framework Convention on Climate Change in
Kyoto. WBGU, Bremerhaven, Germany. 41 Department of Trade and Industry (DTI) (2002) Our Energy Future – Creating a Low Carbon Economy.
London, UK, 42 Kuuskra, V., DiPietro, P, Klara, S., and Forbes, S.: (2004) Future U.S. Greenhouse gas emissions
reductions scenarios consistent with atmospheric stabilization of concentrations. 7th International
Conference on Greenhouse Gas Control Technologies, 5-9 September, Vancouver, Canada. 43European Council (2005) Provisional minutes of the European Council, Brussels, Belgium, March 10.
44New South Wales Greenhouse Advisory Panel (2004) Submission from the Greenhouse Advisory Panel
on the Energy Directions Green Paper, New South Wales, Australia. 45 Baumert, K., Pershing, J., Herzog, T., Markoff, M. (2004) Climate Data: Insights and Observations.
Pew Centre on Global Climate Change, Arlington, VA, USA.

38
Climate Change Impacts on Australia
46 UK Department of Environment and Rural Affairs (2003) The Scientific Case for Setting a Long-Term
Emissions Reduction Target. Supporting document for the Department of Transportation and
Infrastructure’s Energy White Paper. 47 Jones, R.N. (2001) An environmental risk assessment/management framework for climate change
impact assessments. Natural Hazards 23, 197-230. 48 Smit, B., Burton, I., Klein, R.J.T., and Street, R. (1999) The science of adaptation: A framework for
assessment. Mitigation and Adaptation Strategies for Global Change 4, 199-213. 49 Wilkinson, C. (ed.) (2000) Status of Coral Reefs of the World: 2000. Global Coral Reef Monitoring
Network and Australian Institute of Marine Science, Townsville, Queensland, Australia, 363 pp. 50 National Assessment Synthesis Team (2000) Climate Change Impacts on the United States: The
Potential Consequences of Climate Variability and Change. U.S. Global Change Research Program,
Washington, DC, USA. 51 Howden, M., and Jones, R. (2001) Costs and benefits of CO2 increase and climate change on the
Australian wheat industry. Australian Greenhouse Office, Canberra. 52 Buddemeier, R.W., and Fautin, D.G. (1993) Coral bleaching as an adaptive mechanism: A testable
hypothesis. BioScience 43, 320–326. 53 Baker, A.C., Starger, C.J., McClanahan, T.R., and Glynn, P.W. (2004) Coral reefs: Corals’ adaptive
response to climate change. Nature 430, 741. 54 IPCC (2001) Climate Change 2001: Impacts, Adaptation and Vulnerability. McCarthy, J., Canziani,
O., Leary, N., Dokken, D and White, K. (eds). Contribution of Working Group II to the Third Assessment
Report of the Intergovernmental Panel on Climate Change, World Meteorological Organisation and
United Nations Environment Programme. Cambridge University Press, 1032 pp. 55 IPCC (2002) Climate Change and Biodiversity, H. Gitay, Suárez, A., Watson, RT., and Dokken, D.J.
(eds.), Technical Paper V, Intergovernmental Panel on Climate Change, Geneva, Switzerland, 86 pp. 56 Parmesan, C., and Yohe, G. (2003) A globally coherent fingerprint of climate change impacts across
natural systems. Nature 421, 37–42. 57 Parmesan, C., and Galbraith, H. (2004) Observed Impacts of Global Climate Change in the United
States. Pew Center on Global Climate Change, Arlington, VA, USA, 56 pp. 58 Hennessy, K.J., Whetton, P.H., Bathols, J., Hutchinson, M. and Sharples, J. (2003) The Impact of
Climate Change on Snow Conditions in Australia. CSIRO Atmospheric Research. Consultancy report for
the Victorian Dept of Sustainability and Environment, NSW National Parks and Wildlife Service,
Australian Greenhouse Office and the Australian Ski Areas Association, 47 pp. 59 Crimp, S., Balston, J., Ash, A., Anderson-Berry, L, Done, T., Griner, R., Hilbert, D., Howden, M.,
Jones, R., Stokes, C, Stoeckl, N., Sutherst, N., and Whetton, P. (2004) Climate Change in the Cairns and
Great Barrier Reef Region: Scope and Focus for an Integrated Assessment. Australian Greenhouse Office,
100pp. 60 Berkelmans, R., De’ath, G., Kininmonth, S. and Skirving, W.J. (2004) A comparison of the 1998 and
2002 coral bleaching events on the Great Barrier Reef: spatial correlation, patterns, and predictions. Coral
Reefs 23, 74-83 61 Jones, R.N. (2004) Managing Climate Change Risks, in Agrawala, S. and Corfee-Morlot, J. (eds.), The
Benefits of Climate Change Policies: Analytical and Framework Issues, OECD, Paris, 249–298. 62 O'Hara, T. D. (2002) Endemism, rarity and vulnerability of marine species along a temperate coastline.
Invertebrate Systems, 16, 671-684. 63Williams, S.E. and Hilbert, D.W. (2004) Climate change threats to the biological Diversity of tropical
rainforests in Australia. In WF Laurance, C Peres (eds) Emerging Threats to Tropical Forests, in press. 64Williams, S.E., Bolitho, E.E., Fox, S. (2003) Climate change in Australian tropical rainforests: an
impending environmental catastrophe Proceedings Of The Royal Society Of London Series B-Biological
Sciences 270, 1887-1892. 65 Brereton, R., Bennett, S. and Mansergh, I. (1995) Enhanced greenhouse climate change and its potential
effect on selected fauna of south-eastern Australia: a trend analysis. Biological Conservation, 72, 39-354. 66 Pouliquen-Young, O., and Newman, P. (2000) The Implications of Climate Change for Land-based
Nature Conservation Strategies. Final Report 96/1306. Australian Greenhouse Office, Environment
Australia, Canberra and Institute for Sustainability and Technology Policy, Murdoch University, Perth. 67 Hilbert, D.W., Bradford, M., Parker, T., and Westcott, D.A. (2004) Golden bowerbird (Prionodura
newtonia) habitat in past, present and future climates: predicted extinction of a vertebrate in tropical
highlands due to global warming. Biological Conservation, 116, 367
39
Climate Change Impacts on Australia
68 Hilbert, D.W., Ostendorf, B., and Hopkins, M. (2001) Sensitivity of tropical forests to climate change
in the humid tropics of North Queensland. Austral Ecology 26, 590-603. 69 Wooldridge, S., Done, T., Berkelmans, R., Jones, R. and Marshall, P. (2005) Precursors for resilience
in coral communities in a warming climate: A belief network approach. Marine Ecology Progress Series
295, 157-169 70 Beaumont, L.J., and Hughes, L. (2002) Potential changes in the distributions of latitudinally restricted
Australian butterfly species in response to climate change. Global Change Biology 8(10), 954-971. 71 Hare, W., (2003) Assessment of Knowledge on Impacts of Climate Change – Contribution to the
Specification of Art. 2 of the UNFCCC, WGBU, Berlin, http://www.wbgu.de/wbgu_sn2003_ex01.pdf 72 Booth, T.H., Nix, H.A., Hutchinson, M.F., and Jovanovic, T. (1988) Niche analysis and tree species
introduction. Forest Ecology and Management 23, 47-59. 73 Sutherst, R.W., Collyer, B.S. and Yonow, T. (2000) The vulnerability of Australian horticulture to the
Queensland fruit fly, Bactrocera (Dacus) tryoni, under climate change. Australian Journal of Agricultural
Research 51, 467–480. 74 Sutherst, R.W. (2000) Pests and Pest Management: Impact of climate change, Report No 00/16 Rural
Industries Research and Development Corporation, Canberra, 34 pp. 75 Kirschbaum, M.U.F. (1999) The effect of climate change on forest growth in Australia. In: Impacts of
Global Change on Australian Temperate Forests. S.M. Howden and J.T. Gorman (eds), Working Paper
Series, 99/08, pp. 62-68 (CSIRO Wildlife and Ecology, Canberra). 76 Hughes, L., Cawsey, E.M., Westoby, M. (1996) Geographic and climatic range sizes of Australian
eucalyptus and a test of Rapoport's rule. Global Ecology and Biogeography Letters 5, 128-142. 77 Jones, R.N., and Hennessy, K.J. (2000) Climate Change Impacts in the Hunter Valley – A Risk
Assessment of Heat Stress Affecting Dairy Cattle. CSIRO Atmospheric Research report for the NSW
government, 26 pp. 78 Crimp S.J., Flood, N.R., Carter, J.O., Conroy, J.P., and McKeon, G.M. (2002) Evaluation of the
Potential Impacts of Climate Change on Native Pasture Production – Implications for Livestock
Carrying Capacity. Australian Greenhouse Office, Canberra. 54 pp. 79 Howden, S.M., and Jones, R.N. (2001) Costs and benefits of CO2 increase and climate change on the
Australian wheat industry, Australian Greenhouse Office, Canberra, Australia. 80White, N.A., Sutherst, R.W., Hall, N., and Wish-Wilson, P. (2003) The vulnerability of the Australian
beef industry to impacts of the cattle tick (Boophilus microplus) under climate change. Climatic Change
61, 157-190. 81 Herron, N., Davis, R., and Jones, R.N. (2002) The effects of large-scale afforestation and climate
change on water allocation in the Macquarie River Catchment, NSW, Australia. Journal of Environmental
Management 65, 369-381. 82 Hassall and Associates (1998) Climate Change Scenarios and Managing the Scarce Water Resources
of the Macquarie River Basin, Canberra, Australia, 114 pp. 83 Jones, R.N., and Page, C.M. (2001) Assessing the risk of climate change on the water resources of the
Macquarie River Catchment, in F. Ghaseemi, P. Whetton, R. Little, and M. Littleboy (eds.), Integrating
Models for Natural Resources Management across Disciplines, Issues and Scales (Part 2), Modsim 2001
International Congress on Modelling and Simulation, Modelling and Simulation Society of Australia and
New Zealand, Canberra, 673-678. 84 Howe, C., Jones, R.N., Maheepala, S., and Rhodes, B. (2005) Implications of Climate Change for
Melbourne’s Water Resources. Melbourne Water, Melbourne, 26 pp.. 85 Arnell, N.W. (1999) Climate change and global water resources. Global Environmental Change 9, S31-
S46. 86 Schär, C., Vidale, P.L., Lüthi, D., Frei, C., Häberli, C., Liniger, M.A., and Appenzeller, C. (2004) The
role of increasing temperature variability in European heatwaves. Nature doi:10.1038/nature02300. 87 Dixon, P.G., Brommer, D.M., Hedquist, B.C., Kalkstein, A.J., Goodrich, G.B., Walter, J.C., Dickerson
IV, C.C., Penny, S.J., and Cerveny, R.S. (2005) Heat mortality vs. cold mortality: A study of conflicting
databases in the Unites States. Bulletin of the American Meterological Society 7, 937-943. 88 McMichael, A. J., et al. (2003) Human Health and Climate Change in Oceania: A Risk Assessment.
Commonwealth Department of Health and Ageing, 128 pp. 89 Woodruff, D., Hales, S., Butler, C., and McMichael, A. (2005) Climate Change Health Impacts in
Australia: Effects of Dramatic CO2 Emissions Reductions. Australian Conservation Foundation and the
Australian Medical Association, Australia.

40
Climate Change Impacts on Australia
90 Coleman, T. (2002) The impact of climate change on insurance against catastrophes. Proceedings of
Living with Climate Change Conference. Canberra, 19 December. 91 Thomas, M.H. (2002) Energy and energy intensive industry. Proceedings, Living with Climate Change
Conference, Canberra, 19 December 2002. National Academies Forum, Canberra. 92 Suppiah, R., Whetton, P. H., and Hennessy, K. J. (2001) Projected Changes in Temperature and
Heating Degree-days for Melbourne, 2003-2007: A Report for GasNet. CSIRO Atmospheric Research,
Aspendale, VIC, 19 pp. 93 Howden, S.M., and Crimp, S. (2001) Effect of climate and climate change on electricity demand in
Australia. In: Integrating Models for Natural Resources Management Across Disciplines, Issues and
Scales. Proceedings of the International Congress on Modelling and Simulation, December 2001,
Canberra. Ghassemi, F., P. Whetton, R. Little and M. Littleboy, (eds.), Modelling and Simulation Society
of Australia and New Zealand, Canberra, pp. 655-660. 94 McInnes, K.L., Walsh, K.J.E., Hubbert, G.D., and Beer, T. (2003) Impact of sea-level rise and storm
surges on a coastal community. Natural Hazards 30, 187-207. 95 Austroads (2004) Impact of Climate Change on Road Infrastructure. Austroads report AP-R243, 121
pp. http://www.btre.gov.au/docs/joint_reports/climate_change.pdf 96Mendehlsohn, R., and Williams, L. (2004) Comparing forecasts of the global impacts of climate change.
Mitigation and Adaptation Strategies for Global Change 9, 315–333. 97 World Meteorological Organisation (2003) Press release, Geneva, Switzerland, 2 July.
98 Hennessy, K., McInnes, K., Abbs, D., Jones, R., Bathols, J., Suppiah, R., Ricketts, J., Rafter, T., Collins
D. and Jones, D. (2004) Climate Change in New South Wales, Part 2: Projected Changes in Climate
Extremes. Consultancy report for the New South Wales Greenhouse Office by the Climate Impact Group
of CSIRO Atmospheric Research and the National Climate Centre of the Australian Government Bureau
of Meteorology, 79 pp. 99 McInnes, K.L., Suppiah, R., Whetton, P.H., Hennessey, K.J., and Jones, R.N. (2002) Climate Change
in South Australia. Consultancy report undertaken for the South Australian Government by the Climate
Impact Group, CSIRO Atmospheric Research, Aspendale, VIC. 100 Hennessey, K., Page, C., McInnes, K., Walsh, K., Pittock, B., Bathols, J., and Suppiah, R. (2004)
Climate Change in the Northern Territory. Consultancy report undertaken for the Northern Territory
Department of Infrastructure, Planning and Environment by the Climate Impact Group, CSIRO
Atmospheric Research, Aspendale, VIC. 101 Suppiah, R., Whetton, P.H., and Watterson, G. (2004) Climate Change in Victoria. A consultancy
report undertaken for the Victorian Department of Sustainability and Environment by the Climate Impacts
Group, CSIRO Atmospheric Research. 102 McInnes, K.L., Walsh, K.J.E., Hubbert, G.D., and Beer, T. (2003) Impact of sea-level rise and storm
surges on a coastal community. Natural Hazards 30, 187-207. 103 McInnes, K.L., Macadam, I., Hubbert, G.D., Abbs, D.J., and Bathols, J. (2005) Climate Change in
Eastern Victoria, Stage 2 Report: The Effect of Climate Change on Storm Surges. A consultancy report
undertaken for the Gippsland Coastal Board by the Climate Impacts Group, CSIRO Atmospheric
Research. 104Williams, A.A., Karoly, D.J., and Tapper, N. (2001) The sensitivity of Australian fire danger to climate
change. Climatic Change 49, 171-191. 105 Cary, G.J. (2002) Importance of changing climate for fire regimes in Australia. In: R.A. Bradstock,
J.E. Williams and A.M. Gill (eds), Flammable Australia: The Fire Regimes and Biodiversity of
A Continent, Cambridge University Press, Cambridge UK, pp. 26–46. 106 Jones, C.D., Cox, P.M., Essery, R.L.H., Roberts, D.L., and Woodage, M.J. (2003) Strong carbon cycle
feedbacks CO2 and sulphate aerosols. Geophysical Research Letters 30, doi:10.1029/2003GL01686. 107 Bellamy, P.H., Loveland, P.J., Bradley, R.I., Lark, R.M., and Kirk, G.J.D. (2005) Carbon losses from
all soils across England and Wales 1978−2003. Nature 437, 245-248. 108 Oppenheimer, M. (1998) Global warming and the stability the West Antarctic Ice Sheet. Nature 393,
325-332. 109 Schmittner, A. (2005) Decline of the marine ecosystem caused by a reduction in the Atlantic
overturning circulation. Nature 434, 628-633. 110 Rahmstorf, S., and Zickfeld, K. (2005) Thermohaline circulation: A question of risk assessment.
Climatic Change 68, 241–247. 111 Katz, M.E., Cramer, B.S., Mountain, G.S., Katz, S., and Miller, K.G. (2001) Uncorking the bottle:
what triggered the Paleocene/Eocene methane release? Paleoceanography 16, 549–562.
41
Climate Change Impacts on Australia
112 Hansen, J. (2005) A slippery slope: How much global warming constitutes “dangerous anthropogenic
interference”. Climatic Change 68, 269-279. 113 Hu, A., Meehl, G.A., Washington, W.M., and Dai, A. (2004) Response of the Atlantic thermohaline
circulation to increased Atmospheric CO2 in a coupled model. Journal of Climate, 17, 4267-4279 114 Rahmstorf, S., and Zickfeld, K. (2005) Thermohaline circulation changes: A question of risk
assessment. Climatic Change, 68, 241-257. 115 Stocker, T.F., and Schmittner, A. (1997). Influence of CO2 emission rates on the stability of the
thermohaline circulation. Nature 388, 862-865. 116 Kamenkovich, I.V., Sokolov, A.V., and Stone, P.H. (2003) Factors affecting the response of
thermohaline circulation to increasing CO2: a study with a model of intermediate complexity. Climate
Dynamics, 21, 119-130. 117 Gregory, J.M., Huybrechts, P., Raper, S.C.B. (2004) Threatened loss of the Greenland ice-sheet.
Nature 6983, 616. 118 Manabe, S., and Stoufer, R.J. (1993). Century-scale effects of increased atmospheric CO2 on the
ocean-atmosphere system. Nature 364, 215-218. 119 Stocker, T.F., and Schmittner, A. (1997) Influence of CO2 emission rates on the stability of the
thermohaline circulation. Nature 388, 862-865. 120 Rahmstorf, S. (2000) The thermohaline ocean circulation: A system with dangerous thresholds?
Climatic Change, 46, 247-256. 121 Hennessy, K., Page, C. McInnes, K., Jones, R., Bathols, Collins, D., and Jones, D. (2004) Climate
Change in New South Wales, Part I: Projected Changes in Climate Extremes. Consultancy report for the
New South Wales Greenhouse Office by the Climate Impact Group of CSIRO Atmospheric Research and
the National Climate Centre of the Australian Government Bureau of Meteorology. 122 Easterling, W.E. III, Hurd, B.H., Smith, J.B. (2004) Coping with Climate Change: The Role of
Adaptation in the United States. Pew Centre on Global Climate Change, Arlington, VA, USA. 123 Pielke, Jr., RA. (2004) What is climate change? Issues in Science and Technology, Summer, 1-4.