climate change, sustainable
TRANSCRIPT

CHAPTER
Climate Change, Sustainable Development and Energy
05
A road-map towards sustainable development, free from hunger and poverty; along with an uninterrupted, affordable supply of sustainable energy (every Indian connected to the grid) - these are the broad objectives that India has chosen to pursue. India’s commitment to environment and climate change, made at the highest political level, shows the global way in supporting sustainable development goals while retaining reliance on cleaner energy, including cleaner, greener coal. India has strengthened its response to the threat of climate change in accordance with the principles of common but differentiated responsibilities and in the light of national circumstances with the “Paris Pledge” to reduce the emission intensity of GDP by 33-35 per cent over 2005 levels by 2030. International support would greatly facilitate the pathway towards low carbon and climate-resilient development. India also looks forward to international cooperation on the development, deployment and commercialization of sustainable and climate-friendly technologies in renewables as well as conventional sources.
IntroductIon
5.1 Mahatma Gandhi once said, “A time is coming when those, who are in the mad rush today of multiplying their wants, vainly thinking that they add to the real substance, real knowledge of the world, will retrace their steps and say: ‘what have we done?’” It is only appropriate that on 2nd October, 2016, the birth anniversary of this apostle of peace and life in harmony with nature, India ratified the Paris Agreement on climate change. As on date, Paris Agreement has been ratified by 153 Parties. In the pre-2020 period, India’s goal is to achieve the voluntary pledge of reducing the emissions intensity of GDP by 20- 25 per cent over 2005 levels by 2020, which, it is on course to achieve. The emissions intensity of India’s GDP has
been reduced by 12 per cent between 2005 and 2010, according to India’s first Biennial Update Report communicated to UNFCCC. This has been possible on account of a number of policy measures undertaken to address climate change and sustainable development concerns. As a responsible country, it has delivered on its commitments and is well on track to achieve its ambitious climate goals and actions by 2020.
5.2 For the post-2020 period, India’s Nationally Determined Contribution (NDC) has outlined the actions India intends to undertake. India’s NDC targets to lower the emissions intensity of GDP by 33-35 per cent by 2030 from 2005 levels, to increase the share of non-fossil based power generation capacity to 40 per cent of installed electric power capacity (cumulative) by 2030, and

119Climate Change, Sustainable Development and Energy
to create an additional carbon sink of 2.5-3 Gt CO2e through additional forest and tree cover by 2030.
5.3 At the multilateral level, the international community is engaged in writing the “Paris rule book” which includes guidelines and modalities for the implementation of the Paris Agreement for the transparency framework for action and support, features and accounting of NDCs etc. At the national level, the roadmap for implementation of India’s NDC is being prepared, by constituting an Implementation Committee and six Sub-Committees. The Committees are working to elaborate their respective NDC goals and identify specific policies and actions aimed at achieving them.Simultaneously, the global community has committed to the Sustainable Development Goals (SDGs) in September 2015, as detailed in the UN Resolution, “Transforming our World: the 2030 Agenda for Sustainable Development.” The 17 SDGs have 169 related targets to be achieved by 2030 and are expected to help organise and streamline development action for achievement of greater human well-being. Affordable, reliable and modern energy services is crucial to achieving all of the sustainable development goals especially SDG 1: Eradicating poverty in all its forms everywhere. Hence, Goal No. 7 “Ensure access to affordable, reliable, sustainable and modern energy for all” – is central to every major challenge we face. Cleaner energy forms are imperative for delivering a sustainable development agenda.
5.4 On November 30 2015, with India’s initiative, the International Solar Alliance (ISA) was jointly launched by the Hon’ble Prime Minister of India, Shri. Narendra Modi, and the then French President Mr. Francois Hollande in Paris at the 21st Conference of Parties to the UNFCCC (COP21). The ISA
is conceived as a unique international body with an exclusive focus on solar energy with all its prospective member countries, which lie completely or partially between the Tropic of Cancer and Tropic of Capricorn, well-endowed with the resource, striving to bring them together for coordinated research, low cost financing and rapid deployment. Joint efforts under the Alliance include innovative policies, projects, programs, capacity building measures and financial instruments to mobilize US$1 trillion of investment by 2030. The foundation stone of the ISA Headquarters was laid at Gwal Pahari, Guragaon in Haryana. India has already committed the required support of operationalization of ISA.
5.5 The Paris Agreement prescribes a multilateral framework for taking action on climate change in the post-2020 period.It recognizes that developed countries are responsible for the cumulative historic stock of greenhouse gases (GHGs) in the atmosphere and therefore must take the lead in climate actions and also provide financial, technological and capacity building support to developing countries with respect to both mitigation and adaptation. The imperative would be to ensure that UNFCCC and Paris Agreement continue to take cognizance of the fact that developing countries have unique vulnerabilities, special circumstances, and development priorities like eradication of poverty, food security, energy access etc. There would also be enormous climate finance requirements, as reflected in India’s NDC which clearly underscores that provision of adequate means of implementation to developing countries is needed for effective implementation of NDCs.
5.6 One major recent development has been the US announcement on June 1, 2017 about its intention to withdraw from the Paris Agreement. The target the USA had

120 Economic Survey 2016-17 Volume 2
Table 1. India’s GHG profile over time
Sector 1994 2000 2005 2010
Emission Share (per cent)
Emission Share (per cent)
Emission Share (per cent)
Emission Share (per cent)
Energy 7,43,820 62 10,27,016 67 12,10,384 69 15,10,121 71
Industrial processes & product use
1,02,710 7 88,608 6 1,24,017 7 1,71,503 8
Agriculture 3,44,485 29 3,55,600 23 3,60,313 21 3,90,165 18
LULUCF 14,292 - -2,22,567 - -2,78,721 - -2,52,532 -
Waste 23,333 2 52,552 4 62,638 4 65,052 3
Total (Without LULUCF)
12,14,248 15,23,777 17,57,352 21,36,841
TOTAL (Net emission)
12,28,540 13,01,209 14,78,632 18,84,309
Values in Gg CO2e; 1 Gg= 109g =1000 t (t = tonne)Source: India’s First Biennial Update Report
chosen under the Paris Agreement is a cut in emissions by 26-28 per cent by 2025 compared to the 2005 level. The announcement is considered as a part of the unfolding of its own domestic energy polices in the last few years. However, till the formal withdrawal is complete, which would take another three years, the US continues to be a member of the Paris Agreement. As on date, 153 Parties have ratified covering around 85 per cent of emissions. USA covers around 18 per cent of emissions and therefore, its withdrawal does not affect the 55 per cent threshold number of the Paris Agreement. As far as India is concerned, it has reaffirmed its commitment to the environment and climate change at the highest political level. India has positioned itself as a sustainability leader, extensively supporting cleaner energy. We need to have a rational approach that balances environment, climate, economic development and energy security needs. We need to concentrate on cleaner forms of energy including cleaner coal, renewables and natural gas to fuel inclusive economic development.
IndIa’s GHG EmIssIon ProfIlE
5.7 According to India’s Biennial Update Report (BUR), India emitted 21,36,841.2 Gg (Giga gram) CO2 equivalent (2.1 billion tonnes of CO2eq) in the year 2010 from energy, industrial processes and product use (IPPU), agriculture and waste sectors (excluding land use, land use change and forestry (LULUCF) (Table 1). In 2010, the year for which comparable figures are available, India’s emissions are lower than GHG emissions of China (11.2 billion tonnes CO2eq), USA (6.7 billion tonnes CO2eq), European Union (4.8 billion tonnes CO2eq) and Brazil (2.9 billion tonnes CO2eq).
currEnt EnErGy mIx
5.8 Within the energy mix of the country, coal accounts for nearly 55 per cent of the total primary energy supply, followed by oil at 30 per cent, and natural gas at 9 per cent. Only 2 per cent of total primary energy is supplied by renewable energy sources. Within the power sector, thermal power (particularly coal) dominates the share

121Climate Change, Sustainable Development and Energy
Figure 1. Installed power capacity (in MW)
Source: Central Electricity Authority (CEA), as on 31 March, 2017.
of total installed power capacity in India (Figure 1). Coal based thermal power accounts for around 59 per cent of the total installed capacity of 327 GW, while 18 per cent of the installed capacity is coming from renewable energy sources (RES). Out of the total RES installed capacity of 57 GW, around 56 per cent is wind based power.
5.9 With this, an overall growth in generation of electricity in the country from 1173.5 BU during 2014-15 to 1173.6 BU during the year 2015-16 and 1242 BU during 2016-17 has been recorded. The performance of category wise generation during the year 2016-17 is given in Table 2.
Table 2. Performance of category wise generation of electricity 2016-17
Thermal Increased by 5.3 per centHydro Reduced by 0.8 per centNuclear Increased by 1.3 per centRenewables Increased by 24.5 per centSource: Central Electricity Authority
futurE ElEctrIcIty transItIon scEnarIos
5.10 As stated earlier, India has set itself ambitious targets in the area of renewable energy. Moving ahead in this direction, India is implementing the largest renewable energy expansion programme in the world. It envisages an increase in the overall renewable energy capacity to 175 GW by 2022. This includes 100 GW of solar, 60 GW of wind, 10 GW of biomass, and 5 GW of small hydro power capacity.
5.11 Projections made by CEA (2016) indicates that the capacity addition in coal based power plants is expected to be around 50 GW between 2017 and 2022. Further, according to these projections, no more addition in the installed capacity of coal based power generation would be required in the period 2022 to 2027. As a result, the share of renewables in total installed capacity in this scenario is likely to increase to around 43 per cent in 2027 (Figure 2).

122 Economic Survey 2016-17 Volume 2
IndIa’s EnErGy sEcurIty
5.12 India is at a stage of development that requires it to grow at a fast rate and lift the large number of their citizens from below the poverty line. Energy deprivation levels for a sizeable portion of population remain at high levels. The SDG 7 is to ensure access to affordable, reliable, sustainable and modern energy for all. The importance given to secure energy access is also due to the fact that access to energy is intertwined with the various other economic and social developmental objectives such as poverty alleviation, health, industrialisation, education, provision of communication infrastructure, and climate change mitigation among others.
5.13 India is one of the fast growing economies of the world. Associated with the rapid increase in incomes is rapid increase in the demand for energy. However, the per capita energy consumption in India continues to be only around one-third of the global average and one-eleventh that in the United States (Figure 3) (OECD/IEA, 2015).
5.14 Further, associated with the energy deprivation, there is also a lack of access to better forms of energy. An analysis of the type of fuel used for cooking by households in India would show that a majority of households still rely on firewood as fuel for cooking. According to the 2011 Census data, around 49 per cent of households still use firewood for cooking while only 29 per cent use LPG or PNG for cooking purposes (Figure 4). Comparing across states we can see that the majority of states have a dominance of fire-wood in their cooking fuel usage (Figure 5) while the percentage of LPG/PNG users is below 30 per cent. Similar is the case with access to electricity (Figure 6).
5.15 This shows that there is an urgent need to further increase the access of the poor to more efficient energy resources. To improve the health of women and children in rural areas who are most affected by indoor air pollution due to use of bio-mass as cooking fuel, initiatives have been taken like Pradhan Mantri UJJWALA Yojana
Figure 2. Electricity Mix Projections: Coal and Renewables in Installed Capacity
Source: Historical installed capacities from CEA Monthly Reports for March, for years from 2013 to 2017 and projections for installed capacity for coal and renewables from CEA (2016).
192163 MW
248513 MW
57260 MW
275000 MW
0%
10%
20%
30%
40%
50%
60%
70%
2012 2013 2014 2015 2016 2017 2018 2019 2020 2021 2022 2023 2024 2025 2026 2027
share
in in
stalle
d ca
pacit
y
Coal Renewable energy
Projections

123Climate Change, Sustainable Development and Energy
Figure 3. Energy use per capita in select countries
Figure 4. Type of Fuel Used for Cooking
Source: World Bank
Source: Census 2011
0
1000
2000
3000
4000
5000
6000
7000
8000
United States European Union United Kingdom China World India
kg o
f oi
l equ
ival
ent
Fire-wood49%
Crop residue9%Cowdung cake
8%
Coal,Lignite,Charcoal1%
Kerosene3%
LPG/PNG29%
Any other1%

124 Economic Survey 2016-17 Volume 2
Source: Census 2011
Figure 5. Percentage of households using firewood for cooking
Source: Census 2011
Figure 6. Percentage of households using electricity for lighting

125Climate Change, Sustainable Development and Energy
aimed at distribution of about 50 million LPG cylinders by 2018-19. The Government has now planned to extend the scheme to provide 80 million LPG connections by 2020. Government is also coming out with other initiatives namely “Ujjawala Plus” which will address the cooking needs of deprived people who are not covered under the Socio-Economic Caste Census (SECC) 2011. Pratyaksh Hastantrit Labh (PAHAL) scheme was introduced for direct transfer of LPG subsidies to the consumers’ bank accounts. The Deen Dayal Upadhyaya Gram Jyoti Yojana (DDUGJY) was launched as its principal vehicle to achieve the goal of electricity for all by 2022, by first achieving 100 per cent village electrification by 2018.
5.16 Ensuring adequate and affordable energy access for all of India’s people and doing so in a sustainable manner is a very high priority for the Government of India. Hon’ble Prime Minister has regarded energy sustainability as a sacred duty, and has also stated that sustainable, stable and reasonably priced energy is essential for the fruits of economic development to reach the bottom of the pyramid. He has envisioned energy access, energy efficiency, energy sustainability and energy security as the four pillars of our energy future.
socIal cost analysIs of coal basEd PowEr vErsus rEnEwablEs basEd PowEr
5.17 In recent years there has been a considerable push towards renewables as a sustainable source of power generation all around the world. The choice between alternative sources of energy has to be based on a thorough analysis of the impacts each has on the economy. A clear quantification of the social costs of the alternatives give us a rational way to identify the merits and demerits of each alternative on a holistic basis. In this
section of the Survey, an attempt has been made to identify the aggregate social costs of coal based electricity generation versus that of renewable based power generation (specifically, wind and solar).
5.18 The estimates used in the exercise are based on the scenarios of power generation in TERI (2017). The report has presented two scenarios for the future electricity mix. A ‘High Renewables Scenario’ gives a higher priority to renewable energy in which the renewable energy capacity increases to 175 GW in 2022 and further to 275 GW in 2026. On the other hand, the ‘Low Renewables Scenario’ is based on a lower trajectory of renewables in view of the challenges and uncertainty of solar prices inclusive of storage costs achieving grid parity. Further two demand scenarios have been considered. The estimates of coal based power generation in the projection is based on the demand projections as well as the projections for the installed capacities for various sources of electricity. Broadly, in order to estimate the social cost of coal or renewables based power, the private costs of generation, the opportunity cost of land, social cost of carbon, health costs as well as the costs of stranded assets have been considered.
(i) Private costs of generation
5.19 The cost of electricity generation is driven by many factors such as equipment costs like turbine costs for wind energy, panel costs for Solar Photo Voltaic (SPV), land costs, construction costs, evacuation costs, capacity utilization factor, cost of capital. The cost of power generation from renewable sources have been falling rapidly over the recent years. Globally, the price of SPV panels has fallen considerably resulting in the levelised cost of electricity from SPV halving between 2010 and 2014 (IRENA 2014). The cost of wind power generation has also declined, though at a slower rate.

126 Economic Survey 2016-17 Volume 2
5.20 A similar trend is observed in India as well. Figure 7 shows the trend of recent solar tariff in bids since 2010. It can be seen that solar power tariffs have been falling in the last two years in India. The tariff has reached a historical low of $2.4 per KWh in May 2017. The costs of SPV panel are expected to decline further in the coming years.
(ii) Social cost of carbon
5.21 Social cost of carbon refers to the economic cost or loss in the discounted value of economic welfare induced by an additional unit of carbon dioxide emissions (Nordhaus, 2017). The generation of power from coal based thermal power plants is based on the combustion of coal as fuel and thus generate emissions that contribute to increasing the concentration of greenhouse gases in the atmosphere. Nordhaus (2017) finds that the global social cost of carbon at 2010 prices for the year 2015 was US$ 31.2 per tCO2. By the year 2030, this is estimated to rise to
US$ 51.6 per tCO2. Social cost of carbon for India is estimated at US$ 2.9/ton.
(iii) Health Costs
5.22 The health impact of coal combustion is manifested in the form of negative impact on the respiratory system, cardiovascular diseases, neurological effects, etc. This is in addition to the health impacts on the coal miners who are at a higher risk of chronic bronchitis and other lung diseases. The annual number of deaths linked to coal based power plants pollution is estimated to be around 115000 and the total monetary cost is around US$ 4.6 billion1.
(iv) Costs of Intermittency
5.23 Wind and solar power are non-dispatchable. This means that energy can be generated only when there is wind blowing or there is appropriate sunshine. Electricity system has to adjust to the demand patterns of electricity. Therefore, there is an integration cost which is not included in the estimates of
Figure 7. Trend of Solar Tariff Bids in India
1 https://www.scientificamerican.com/article/coal-fired-power-in-india-may-cause-more-than-100000-premature-deaths-annually/
2
4
6
8
10
12
14
16
Dec
-10
Feb-
11
Apr
-11
Jun-
11
Aug
-11
Oct
-11
Dec
-11
Feb-
12
Apr
-12
Jun-
12
Aug
-12
Oct
-12
Dec
-12
Feb-
13
Apr
-13
Jun-
13
Aug
-13
Oct
-13
Dec
-13
Feb-
14
Apr
-14
Jun-
14
Aug
-14
Oct
-14
Dec
-14
Feb-
15
Apr
-15
Jun-
15
Aug
-15
Oct
-15
Dec
-15
Feb-
16
Apr
-16
Jun-
16
Aug
-16
Oct
-16
Dec
-16
Feb-
17
Apr
-17
`/K
Wh
Highest bid Lowest Weighted Avg. Price
Source: Survey calculations

127Climate Change, Sustainable Development and Energy
the levelised cost of electricity. This would require that other conventional sources of energy like coal based power plants have to fill in the gap during times when renewables are not supplying power. One solution to the intermittency problem is storage. The future costs of renewable energy generation depend crucially on the path taken by storage technologies and their cost effectiveness.
(v) Opportunity Cost of Land
5.24 One of the barriers to the widespread adoption of solar and wind technologies that is cited is the land area requirements for setting them up. The land requirement for a coal power plant is usually 2023 m2/MW. Compared to this the requirement of land for a solar power is around 10 times that of coal. Advances in the efficiency of solar technologies would lead to decline in the land requirements for solar in the future years (Mitavachan and Srinivasan, 2012). The cost of the diversion of land to renewable energy generation is not only the private cost of land incurred by the investor but also the opportunity cost of such land. This would depend on the alternative uses for which a particular patch of land can be utilized.
(vi) Stranded Assets
5.25 A shift to renewables is likely to render a part of the assets in conventional energy generation plants idle or result in them being used at a much lower level than their maximum technically feasible level given their capacities. The investments in these plants being sunk, it is no longer possible to recover any returns from them although their useful life is still not over. In our estimates, these stranded assets are estimated as the lost revenues due to the suboptimal utilisation of coal based power generation assets as a result of shift to renewables. The stranding of assets can have implications for the banking system depending on their exposure to the sector. In
a situation where the banking system is already facing a stressed assets problem, stranding of assets could have considerable impacts. The NPA ratio pertaining to electricity generation was around 5.9 per cent from total advances (outstanding) of $473815 crores. The total advances to coal sector was $5732 crores with a NPA ratio of 19.8 per cent.
(vii) Cost of Government Incentives
5.26 The role of government in incentivising investments in renewable energy in India has been considerable. The low tariffs witnessed recently have been partly a result of government subsidies/tax holidays and other incentives. Budget estimates for the year 2017-18 indicate an allocation of $420 crores towards subsidies for solar and wind power (Figure 8). After increasing from $106 crores to $450 crores in 2015-16, subsidies to solar power has declined to $10 crores and $15 crores in 2016-17 and 2017-18 (B.E). On the other hand, wind power has been receiving a considerable portion of the total subsidies to renewables in the recent years.
Results
5.27 Our estimates of social costs of coal and renewables show that in 2017 the social cost of renewables was around 3 times that of coal at $11 per KWh (Figure 9). The social cost of RE generation as well as the gap between RE and coal reduces as we progress towards the year 2030. This is because private costs of generation as well as the stranded assets in coal which account for around 30 per cent of the total social cost of renewables currently, falls to around 2.4 per cent of the total social costs of RE in the year 2030. Overall, cost of stranded assets account for a large portion of discounted social costs for renewables between 2017 and 2030 (Figure 10). This indicates that while investments in renewable energy is crucial for India to meet its climate change goals,

128 Economic Survey 2016-17 Volume 2
Source: Survey calculations
Figure 9. Social costs of Coal vs. Renewable Power Sources
Figure 8. Subsidies to Solar and Wind Power
such investments be made at a calibrated pace looking into the total cost accrued to the society. Given that the first goal for India is to provide 100 per cent energy access to its population and bridge the 'development deficit gap', all cleaner energy sources need to be tapped.
IndIa’s actIons on sustaInablE dEvEloPmEnt and clImatE cHanGE
5.28 A large number of focused initiatives have been taken in various sectors of the economy to ensure a pathway of lower emission and climate resilient development.
Source: Detailed Demand for Grants, Union Budget Documents
0
100
200
300
400
500
600
700
800
900
Actual 2011-12 Actual 2012-13 Actual 2013-14 Actual 2014-15 Actual 2015-16 Revi. 2016-17 B.E.017-18
` Cr
ores
Solar Wind
0.00
2.00
4.00
6.00
8.00
10.00
12.00
2017 2018 2019 2020 2021 2022 2023 2024 2025 2026 2027 2028 2029 2030
`/KWh
Renewables Coal

129Climate Change, Sustainable Development and Energy
Source: Survey calculations
Figure 10. Social Cost per KWh of Renewables and Coal (2017-2030)
As stated earlier, India is on course to achieve its pre-2020 voluntary commitment. This has been possible with the commencement of various actions for implementation in the National Action Plan on Climate Change and taking it to the next level at the sub national level with State Action Plans on Climate Change.
Sustainable Development Goals
5.29 While the 17 SDGs and 169 related targets have been globally adopted, each nation has the flexibility to develop indicators suitable to it. At the Central Government level, NITI Aayog has been assigned the role of overseeing the implementation of SDGs, while the Ministry of Statistics & Programme Implementation (MoSPI) is evolving the related national indicators. NITI Aayog has carried out a detailed mapping of the 17 Goals on Nodal Central Ministries, Centrally Sponsored Schemes (CSSs) including ‘core of the core’, ‘core’, and ‘optional’ schemes;
on the government initiatives and also of each of the 169 targets on concerned Central Ministries. Several States/UTs have also carried out a similar mapping of the SDGs and related targets on their respective Departments and programmes for faster implementation of SDGs.
5.30 Much of our national development agenda is mirrored in the SDGs and therefore many of the government programmes and initiatives are already aligned with SDGs. Further, an impetus has been accorded to programmes related to ending poverty and creating infrastructure through higher budgetary allocations. Various goals and targets are highly interconnected, therefore, a push accorded to any specific goal or target also facilitates achievement of other goals and targets as well.
5.31 As a signatory to the 2030 Agenda for Sustainable Development, India is committed to participate in the international review of
0.0
0.5
1.0
1.5
2.0
2.5
3.0
3.5
4.0
Renewables Coal
`/K
Wh
Private costs (including storage) Opportunity cost of land Cost of Stranded Assets Health Cost Social Cost of Carbon Subsidy cost

130 Economic Survey 2016-17 Volume 2
progress of SDGs on a regular basis. The central platform for international follow-up and review of the 2030 Agenda is the High-Level Political Forum (HLPF), which has started meeting annually since 2016 under the auspices of the UN Economic and Social Council (ECOSOC). In the HLPF, UN member countries are expected to present their Voluntary National Review (VNR) on implementation of SDGs. The VNRs thus serve as a basis for international review of progress of SDGs. India presented its Voluntary National Review among 44 countries in the annual review by the HLPF held in July 2017.
5.32 India’s Green Initiatives
1. National Action Plan on Climate Change (NAPCC): The Government of India has been taking several steps in its action against climate change. The NAPCC, launched in June 2008, which includes eight national missions: Jawaharlal Nehru National Solar Mission, National Mission for Enhanced Energy Efficiency, National Water Mission, National Mission for a Green India, National Mission on Sustainable Habitat, National Mission for Sustainable Agriculture, National Mission for Sustaining the Himalayan Ecosystem and National Mission on Strategic Knowledge for Climate Change. Each mission is anchored under a Ministry, which is responsible for its implementation and lays down the budget provisions and actionable priorities for it.
2. National Green Corridor Programme: To address the fluctuations/variability in the renewable power supply, Government in 2013 announced a National Green Corridor Programme (NGCP). The Power Grid Corporation of India is developing the inter-state transmission corridor and the state transmission utilities are responsible for setting up and
strengthening the intra-state transmission infrastructure. Intra State transmission schemes under Green Energy Corridors (GEC) are to be funded as 20 per cent equity of the State Govt., 40 per cent grant from National Clean Energy and Environment Fund (NCEEF) and 40 per cent soft loan, whereas, the inter State transmission schemes are to be funded as 30 per cent equity by Power Grid Corporation of India Ltd. (PGCIL) and 70 per cent as soft loan. The PGCIL has estimated that the cost to develop the corridor comes to $380 billion. The inter-state transmission projects of the green corridor are likely to be completed by 2018.
3. R&D for Clean Coal Technologies: In 2016, R&D Project for “Development of Advanced Ultra Supercritical (Adv. USC) Technology for Thermal Power Plants” on a Mission Mode, at an estimated cost of $1554 crore has been approved by the Cabinet Committee on Economic Affairs.
4. National Green Highways Mission: The Ministry of Road Transport and Highways (MoRTH), has promulgated Green Highways (Plantations, Transplantations, Beautification and Maintenance) Policy – 2015 to develop green corridors along National Highways for sustainable environment and inclusive growth. Under the aegis of the Policy, development of green corridors is proposed along developed and upcoming National Highways in the width available in existing Right of Way (ROW) in the form of median and avenue plantations. National Green Highways Mission (NGHM) under National Highways Authority of India (NHAI) has been entrusted with the task of planning, implementation and monitoring roadside

131Climate Change, Sustainable Development and Energy
plantations along one lakh km network of National Highways.
5. Faster Adoption and Manufacturing of Hybrid & Electric Vehicles (FAME India): Under FAME-India Scheme, under the National Electric Mobility Mission Plan for 2020, Department of Heavy Industry has extended demand incentives of $127.8 Crore for purchase of 1,11,897 Electric/Hybrid vehicles since inception of the Scheme on 1st April, 2015 till February, 2017. To promote eco-friendly vehicles, the Government has been offering incentives on electric and hybrid vehicles of up to $29,000 for bikes and $1.4 lakh for cars under the scheme in pilot mode till February 2017.
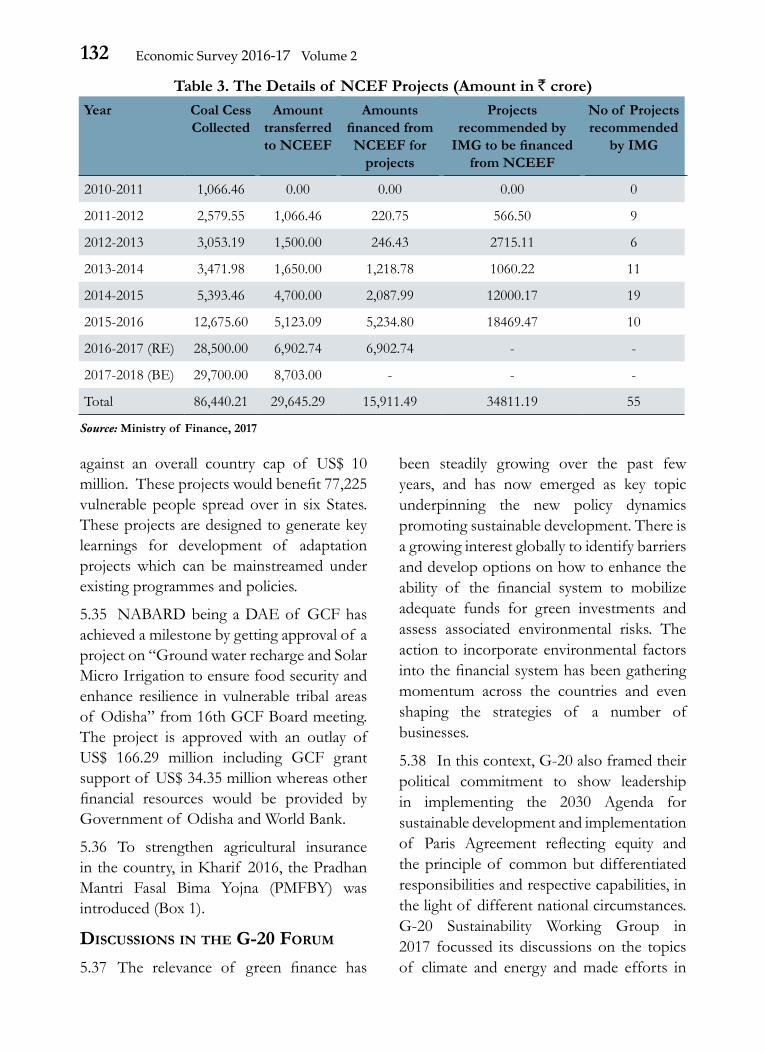
6. National Clean Energy and Environment Fund: Through Finance Bill 2010-11 a corpus called National Clean Energy Fund (NCEF) was created out of cess on coal produced/imported (“polluter pays” principle) for the purposes of financing and promoting clean energy initiatives, funding research in the area of clean energy or for any other purpose relating thereto. Subsequently, the scope of the Fund has been expanded to include clean environment initiatives also. The coal cess which was collected at $50 per tonne of coal since June 22, 2010 was increased several times subsequently. The coal cess was increased to $400 per tonne in the Union budget 2016-17, and the same has been renamed as “Clean Environment Cess”. Accordingly, the name of NCEF has been changed to National Clean Energy and Environment Fund (NCEEF). However, the Goods and Services Tax (Compensation to States) Act, 2017 which has been notified on 12.04.17, provides that coal cess, along with some other cess on pan masala, tobacco, aerated water etc. would
constitute GST Compensation Fund and the same would be utilized to compensate the States for five years for potential losses on account of GST implementation. After five years any amount left would be shared on 50 per cent basis between Centre and States. Table 3 explains the details of NCEEF projects.
IndIa’s adaPtatIon actIons
5.33 Adaptation to climate change is an absolute imperative for the nation. Keeping this in view, the Government of India accords great emphasis on adaptation. National Adaptation Fund was created as a central scheme with a corpus of $350 crores for the year 2015-16 and 2016-17. The overall aim of the Fund is to support concrete adaptation activities which are not covered under on-going activities through the schemes of National and State Governments that reduce the adverse impact of climate change facing community, sector and states. Till date, a total of $212.3 crores has been sanctioned for 21 approved projects. with a total project cost of $432.7 crore covering the vulnerable sectors of Water, Agriculture and Animal Husbandry, Forestry, Ecosystems and Biodiversity etc.
5.34 In this context, efforts are also being made by NABARD to develop climate resilient rural infrastructure to ensure its sustainability under changing climatic conditions. Some of the recently taken important steps by NABARD are related to accessing national and international funding mechanism to fulfil the need of climate finance. NABARD has been accredited as National Implementation Entity (NIE) for Adaptation Fund (AF) and Direct Access Entity (DAE) for Green Climate Fund (GCF) under UNFCCC. Under Adaptation Fund, 6 projects submitted by NABARD have been approved by Adaptation Fund Board (AFB) with an outlay of US $ 9.8 million
132 Economic Survey 2016-17 Volume 2
against an overall country cap of US$ 10 million. These projects would benefit 77,225 vulnerable people spread over in six States. These projects are designed to generate key learnings for development of adaptation projects which can be mainstreamed under existing programmes and policies.
5.35 NABARD being a DAE of GCF has achieved a milestone by getting approval of a project on “Ground water recharge and Solar Micro Irrigation to ensure food security and enhance resilience in vulnerable tribal areas of Odisha” from 16th GCF Board meeting. The project is approved with an outlay of US$ 166.29 million including GCF grant support of US$ 34.35 million whereas other financial resources would be provided by Government of Odisha and World Bank.
5.36 To strengthen agricultural insurance in the country, in Kharif 2016, the Pradhan Mantri Fasal Bima Yojna (PMFBY) was introduced (Box 1).
dIscussIons In tHE G-20 forum
5.37 The relevance of green finance has
been steadily growing over the past few years, and has now emerged as key topic underpinning the new policy dynamics promoting sustainable development. There is a growing interest globally to identify barriers and develop options on how to enhance the ability of the financial system to mobilize adequate funds for green investments and assess associated environmental risks. The action to incorporate environmental factors into the financial system has been gathering momentum across the countries and even shaping the strategies of a number of businesses.
5.38 In this context, G-20 also framed their political commitment to show leadership in implementing the 2030 Agenda for sustainable development and implementation of Paris Agreement reflecting equity and the principle of common but differentiated responsibilities and respective capabilities, in the light of different national circumstances. G-20 Sustainability Working Group in 2017 focussed its discussions on the topics of climate and energy and made efforts in
Table 3. The Details of NCEF Projects (Amount in $ crore)Year Coal Cess
CollectedAmount
transferred to NCEEF
Amounts financed from NCEEF for
projects
Projects recommended by
IMG to be financed from NCEEF
No of Projects recommended
by IMG
2010-2011 1,066.46 0.00 0.00 0.00 0
2011-2012 2,579.55 1,066.46 220.75 566.50 9
2012-2013 3,053.19 1,500.00 246.43 2715.11 6
2013-2014 3,471.98 1,650.00 1,218.78 1060.22 11
2014-2015 5,393.46 4,700.00 2,087.99 12000.17 19
2015-2016 12,675.60 5,123.09 5,234.80 18469.47 10
2016-2017 (RE) 28,500.00 6,902.74 6,902.74 - -
2017-2018 (BE) 29,700.00 8,703.00 - - -
Total 86,440.21 29,645.29 15,911.49 34811.19 55
Source: Ministry of Finance, 2017

133Climate Change, Sustainable Development and Energy
Box 1. Climate InsuranceIndia is one of the world’s most vulnerable countries to climate change, with its economic sectors highly exposed to the changing climate. Estimates indicate that currently, India incurs losses of about US$ 9-10 bn2, annually, due to extreme weather events. Of these, nearly 80 per cent of losses remain uninsured. From 2014-15, natural catastrophe (NatCat) losses for Indian insurance companies were estimated at US$ 11bn3. The low insurance penetration in India is also visible from the data from recent calamities. For example, the total losses due to floods in Kashmir in 2014, caused by unprecedented rains, were declared officially to be in excess of $100,000 crore (approx. US$ 15 bn), insurance companies were required to pay around $4000 crore (approximately US$ 610 mn) according to a High Court directive, due to the low insurance coverage. In another instance, while total losses from 2014 Cyclone Hudhud reached US$ 11 bn, only US$ 650 mn was insured.4
Life insurance has mainly dominated the insurance market in India, while general insurance is slowly picking up the pace. The non-life insurance market has more than tripled in a ten-year period, growing from US$ 3.4 bn in 2004 to US$ 13.5 bn in 2015. Moreover, since 2007, the market has become increasingly competitive as the public sector’s share has reduced from 64.4 per cent to 52.4 per cent in 20155. While General Insurance Corporation of India (GIC) with 52 per cent covers large portion of traditional risks within Indian insurance market, there has only been some recent development of domestic expertise on targeted climate risks. India’s insurance penetration rate of 3.3 per cent, 2.6 per cent of GDP for life insurance and 0.7 per cent of GDP for non-life insurance, is far below the global average of 6.2 per cent.6
In India, climate-related insurance is limited to the agriculture sector, primarily in the form of crop insurance. Eleven states in India submitted memoranda reporting crop loss due to natural calamities like drought, hailstorm, cold wave etc and was approved to the tune of US$ 2.3 bn during 2015-16 (NDRF, 2016). Yet, in the agriculture sector, it is estimated that only 19 per cent of farmers make use of crop insurance.
In the agricultural insurance segment, there are few players with the most prominent being the public owned Agriculture Insurance Company of India Ltd. (AIC) followed by NABARD. While AIC is taking several innovative steps and launching products for niche segments – such as Rubber Plantation Insurance, Bio-Fuel Plants Insurance, Mango Weather Insurance, Potato Contract Farming Insurance, Rabi Weather Insurance, etc. – it is unable to effectively cover the entire agriculture sector. The company’s net incurred claims ratio of 99.7 per cent in 2015-16 as against 108.5 per cent in 2014-157, clearly shows that there is a need for expansion and more players in the segment. The Insurance Regulatory and Development Authority (IRDA) estimates that approximately US$ 7.5 bn is needed to increase insurance penetration to 6 per cent, of which US$ 3.7 bn will need to be foreign investment.8
To strengthen agricultural insurance in the country, in Kharif 2016, the Pradhan Mantri Fasal BimaYojna (PMFBY) was introduced. Under PMFBY, farmers have insured their crops during kharif 2016 and 32.6 mn farmers have been covered under PMFBY and Weather Based Crop Insurance Schemes (WBCIS) as on November 2016. As per Budgetary Estimates (BE), Government of India has allocated US$ 846 mn under for PMFBY during 2016-17. The scheme is being implemented by AIC and some private insurance companies.
Innovative products supported by risk models and reinsurance pools can provide huge opportunities to the insurance industry in India. One such model is that of Catastrophe Risk Pools (CRP) that aim to put the focus on proactive financial planning to deal with adverse impacts of natural disasters, instead of relying on fund-raising efforts after disasters, resulting in reduced economic losses as well as lowering the impact of disasters on the national budget. Financial instruments used in creating these could include contingency funds, contingent loans, grants, besides other risk transfer solutions.
2 https://earthsecuritygroup.com/wp-content/uploads/2016/06/ESG.IndiaInsurance.pdf3 ‘Nat CAT events cost insurers US$2 bn in 2 years’, Asia Insurance Review, 8 January 20164 https://earthsecuritygroup.com/wp-content/uploads/2016/06/ESG.IndiaInsurance.pdf5 ‘India Market General Insurance Update’, Towers Watson, September 20156 ‘Swiss Re Sigma No.4 / 2015-World Insurance Report’, Swiss Re, 20147 https://www.giz.de/en/mediacenter/36562.html8 India: Insurers need US$9 bn to reach global average penetration’, Asia Insurance Review, 16 December 2015

134 Economic Survey 2016-17 Volume 2
preparing G-20 Action Plan on Climate and Energy for growth whilst not duplicating other processes. The elements of the G-20 Action Plan on Climate include: move forward to implementing NDCs in line with the Paris Agreement, strive to communicate long-term GHG development strategies, enhancing climate resilience and adaptation efforts, aligning finance flows consistent with the goals of the Paris Agreement and national sustainable development priorities and economic growth. At the 2016 Hangzhou Summit, G-20 Heads of State recognized the need to scale up green finance. G-20 Green Finance Study Group (GFSG) has been functioning with the objective to “identify institutional and market barriers to green finance, and based on country experiences, develop options on how to enhance the ability of the financial system to mobilize private capital for green investment. Considerable momentum has been generated internationally particularly since the adoption of Paris Agreement in December 2015 in terms of policy signals and framework for green finance. During 2017, the GFSG has focussed on two themes; first, the environmental risk analysis (ERA) in the financial industry and second the use of Publicly Available Environmental Data (PAED) for financial risk analysis and inform decision-making. GFSG knowledge partners have identified a number of options for encouraging voluntary adoption of ERA that the countries could consider including ensuring the consistency of policy signals to the extent possible, raise awareness of the importance of ERA for financial institutions that have significant environmental exposure, encourage better quality and more effective use of environmental data, encourage public institutions to assess environmental risk and their financial implications in different country settings. PAED are important sources of information for ERA and broader
financial analysis. GFSG knowledge partners has identified options for improving, on a voluntary basis, the availability, the accessibility and relevance of PAED and supported the development of a catalogue of PAED with a focus on its use for financial analysis.
5.39 G-20 also recognizes that a number of other areas of inquiry are emerging and require further research. Examples of these areas include, among others: integration of green investment opportunities framework; more integrated national approaches to green finance; development of local currency green bond markets in emerging market economies; the role of public finance and development banks in supporting green investment, and the application of financial technology (‘FinTech’) in green finance.
tHE fInancIal sEctor and GrEEn InItIatIvEs
5.40 A number of initiatives have been taken in the Indian financial sector also, which among others include:
1. Reserve Bank of India (RBI) has been conscious of the role of banks in providing finance for sustainable development. As early as in December 2007, banks in India were sensitized to the various international initiatives including the Equator principles and were asked to keep abreast of the developments in the field of sustainable development and corporate social responsibility and dovetail/modify their lending strategies/plans in the light of such developments.
2. A core of the financial policy in India is the Priority Sector Lending (PSL) requirement for banks to allocate 40 per cent of lending to key socially important sectors such as agriculture and small and medium-sized enterprises. In 2015, RBI included lending to social infrastructure

135Climate Change, Sustainable Development and Energy
and small renewable energy projects within the targets, thereby, giving a further fillip to green financing. In the renewable energy segment, as per the notification of the RBI in May 2016, bank loans of up to $15 crore for solar-based power generators, biomass-based power generators, wind mills, micro-hydel plants, etc. will be considered part of PSL.
3. The RBI has also recently introduced market for trading priority sector lending obligations, incentivizing lower cost delivery.
4. New Development Bank (NDB) is the first Multi-lateral Development Bank established by developing countries and emerging economies – Brazil, Russia, India, China and South Africa (BRICS) – in accordance with the agreement on New Development Bank signed on 15th July, 2014 in Fortaleza, Brazil. NDB’s objectives are in line with the BRICS countries’ own development goals, with an increased focus on sustainable development and hence NDCs. In 2016, the NDB has approved seven projects, of which two are in India, for a total of over US$ 1.5 billion, in the areas of renewable and green energy, and transportation. The two loans approved for India amount to US$ 600 mn. The renewable energy generation project in India will lead to generation of about 500 MW Renewable Energy thereby preventing generation of 815,000 tonne CO2 per annum. US$ 250 million sovereign guaranteed loans will be given to Canara Bank in three tranches under this project.
5. The External Commercial Borrowing (ECB) norms have been further liberalized so that green projects can tap this window for raising finance across the borders. Extant guidelines permit use
of ECB proceeds to retire outstanding Rupee loans provided minimum average maturity of ECB is 10 years or ECB is denominated in Rupees. ECB can also be raised to refinance existing ECB provided all-in-cost is lower than that of existing one and residual maturity is not reduced.
6. The Securities and Exchange Board of India (SEBI) has, in May 2017, put in place the framework for issuance of green bonds and the listing requirements for such bonds, which will help in raising funds from capital markets for green projects.
7. Large corporates integrating sustainability in their core businesses are included in the Bombay Stock Exchange’s green indices, the GREENEX and CARBONEX. GREENEX was introduced in 2012 and comprises of 25 of India’s biggest companies. The S&P BSE CARBONEX seeks to track the performance of the companies in the S&P BSE 100, based on their commitment to mitigating risks arising from climate change in the long run.
8. Companies Act 2013 directs companies having a certain level of profits, to spend 2 per cent of their annual profit on Corporate Social Responsibility (CSR) activities. Estimates indicate that a fair share of the available CSR funding of about $220 billion (US$ 3.5 billion) annually will be invested in environment initiatives from this window.
outlook
5.41 To sum up, India has delivered on its commitments and is well on track to achieve its voluntary pledge of reducing the emissions intensity of its GDP by 20-25 per cent over 2005 levels by 2020. India has ratified the Paris Agreement and is committed to its NDC implementation as outlined

136 Economic Survey 2016-17 Volume 2
therein. India is constructively engaged at the multilateral level in writing the “Paris rule book” for the implementation of Paris Agreement. At the national level, roadmap for implementation of its NDCs is being prepared by the Committees constituted for the purpose. Multilateral climate regime will do well if financial resources are provided to assist developing countries to facilitate the pathway towards low GHG emissions and climate resilent development. In this regard, India underscores the importance of an increase in the volume, flow and access to finance alongside improved capacity and technology for developing countries.
rEfErEncEs
Burt et al. (2013) Burt, Erica; Orris, Peter and Buchanan, Susan, Scientific Evidence of Health Effects from Coal Use in Energy Generation, Health Care Research Collaborative, University of Illinois at Chicago School of Public Health
CEA (Central Electricity Authority) (2016), Draft National Electricity Plan, CEA, New Delhi
CPI (Climate Policy Initiative) (2015), Reaching India’s Renewable Energy Targets Cost Effectively, CPI-ISB Series
CSO (Central Statistics Office) (2017), Energy Statistics 2017, CSO, New Delhi
Epstein et al. (2011) Epstein PR, Buonocore JJ, Eckerle K, Hendryx M, Stout III BM, Heinberg R, etal. Full cost accounting for the life cycle of coal. Annals of the New York Academy of Sciences 2011; 1219(1):73-98.
IRENA (International Renewable Energy Agency) (2014), Renewable Power Generation
Costs in 2014, IRENA
IRENA (International Renewable Energy Agency) (2017a), Renewable Energy and Jobs: Annual Review 2017, IRENA, Abu Dhabi, UAE
IRENA (International Renewable Energy Agency) (2017b), Perspectives for Energy Transition: Investment Needs for a Low Carbon Energy System, IRENA, Abu Dhabi, UAE
IRENA (International Renewable Energy Agency) (2017c), Rethinking Energy, IRENA, Abu Dhabi, UAE
Mitavachan, H and Srinivasan, J. (2012), Is Land Really a Constraint for the Utilization of Solar Energy in India? Current Science, Vol. 103, No. 2
NITI Aayog (2015), A Report On Energy Efficiency and Energy Mix in The Indian Energy System (2030), Using India Energy Security Scenarios, 2047, NITI Aayog, New Delhi
Nordhaus, William D. (2017), Revisiting the social cost of carbon, Proceedings of the National Academy of Sciences, Volume 114, no. 7: 1518-1523
OECD/IEA (Organisation for Economic Co-operation and Development/International Energy Agency) (2015), World Energy Outlook Special Report, OECD/IEA
TERI (The Energy and Resources Institute) (2013) Equitable sharing of benefits arising from coal mining and power generation among resource rich states, TERI, New Delhi.
TERI (The Energy and Resources Institute) (2017) Transitions in Indian Electricity Sector 2017-2030, TERI, New Delhi