climate implications for agricultural production within the murray valley of nsw
DESCRIPTION
Climate implications for Agricultural Production within the Murray Valley of NSW. Michael Cashen – Climatologist, Agriculture [email protected] John Smith – District Agronomist, Barham [email protected]. So what’s the talk about?. The three P’s - PowerPoint PPT PresentationTRANSCRIPT

Climate implications for Agricultural Production within the Murray Valley
of NSW
Michael Cashen – Climatologist, [email protected]
John Smith – District Agronomist, [email protected]

So what’s the talk about?
The three P’s
Climate indicators Deniliquin and MDB
Relevant research quantifying uncertainty
Impacts on farming systems
Future implications for farm businesses and
Deniliquin
The three P’s of climate change
PeripheralPolicy Physical
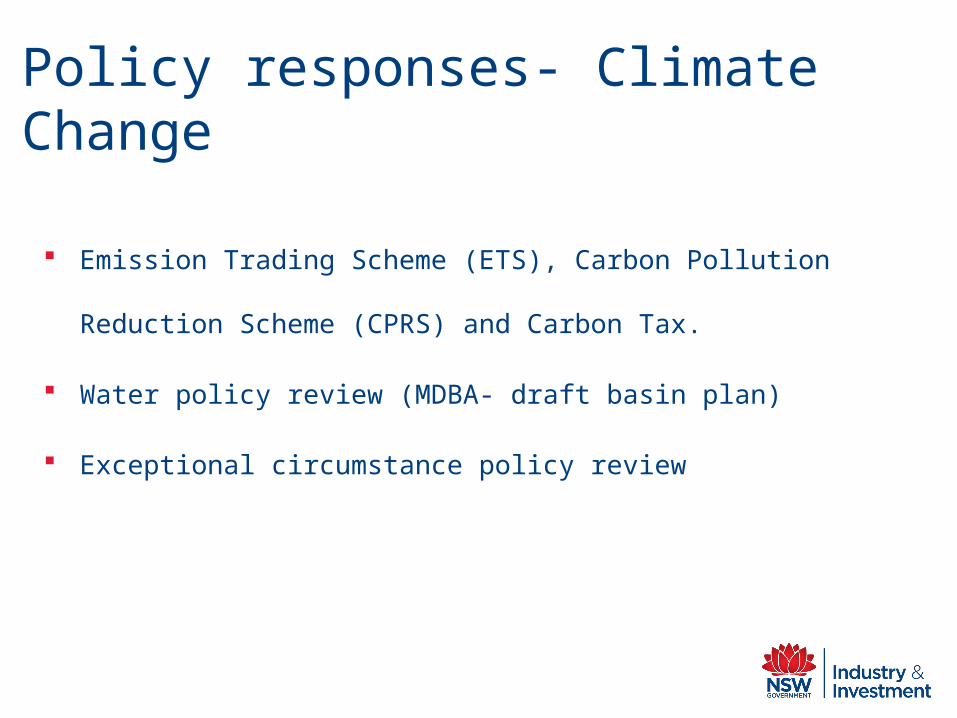
Policy responses- Climate Change
Emission Trading Scheme (ETS), Carbon Pollution Reduction
Scheme (CPRS) and Carbon Tax.
Water policy review (MDBA- draft basin plan)
Exceptional circumstance policy review

Peripheral responses-Climate Change
Niche marketing and preferential buying
Food miles Carbon footprint (life cycle analysis) Carbon neutral
Our focus today- Physical
(science and biophysical impacts on Ag)

So what’s the talk about?
The three P’s
Climate indicators Deniliquin and MDB
Relevant research quantifying uncertainty
Impacts on farming systems
Future implications for farm businesses and
Deniliquin

Rainfall in Deniliquin (1889-2009)
Data source: SILO Data Drill
Deniliquin yearly rainfall 1889-2009
0
100
200
300
400
500
600
700
800
900
1889
1896
1903
1910
1917
1924
1931
1938
1945
1952
1959
1966
1973
1980
1987
1994
2001
2008
Year
mm
/ye
ar
Total yearly rainfall
11 per. Mov. Avg. (Total yearly rainfall )
Iconic droughts 1900-1909, 1936-45 and 1997-2009

Seasonal analysis rainfall (1889-2009)
Deniliquin seasonal rainfall trends (1889-2009) 11 yr moving average
0
20
40
60
80
100
120
140
160
1889
1895
1901
1907
1913
1919
1925
1931
1937
1943
1949
1955
1961
1967
1973
1979
1985
1991
1997
2003
2009
Year
mm
/sea
son Autumn MAM (11yr moving average)
Spring SON (11 year moving average)
Summer DJF (11 year moving average)
Winter JJA (11 year moving average)
Data source: SILO Data Drill

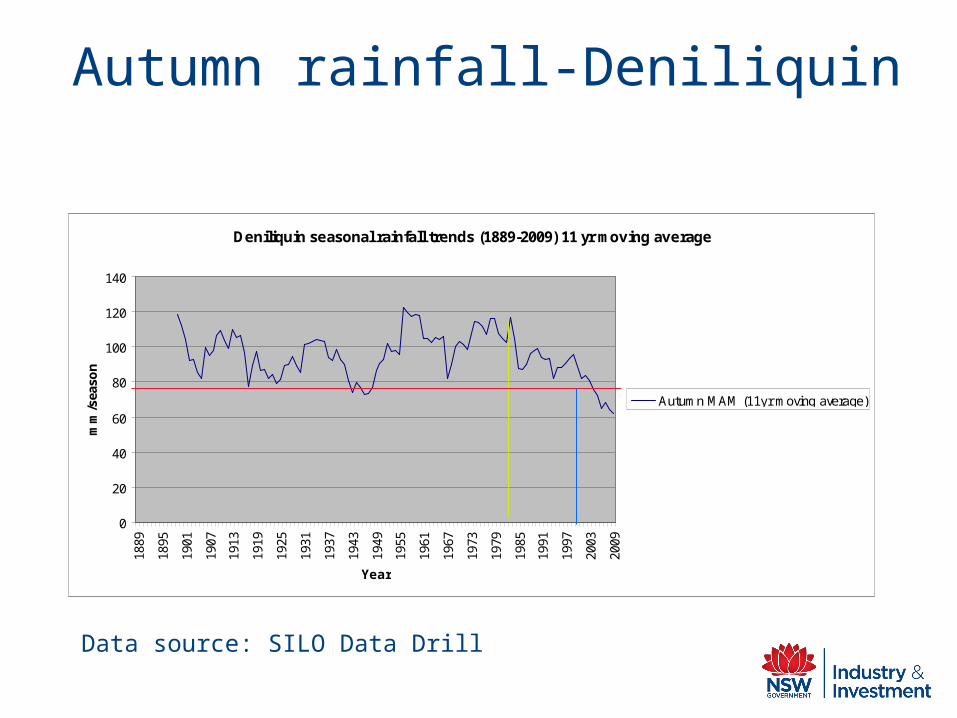
Autumn rainfall-Deniliquin
Deniliquin seasonal rainfall trends (1889-2009) 11 yr moving average
0
20
40
60
80
100
120
140
1889
1895
1901
1907
1913
1919
1925
1931
1937
1943
1949
1955
1961
1967
1973
1979
1985
1991
1997
2003
2009
Year
mm
/sea
son
Autumn MAM (11yr moving average)
Data source: SILO Data Drill
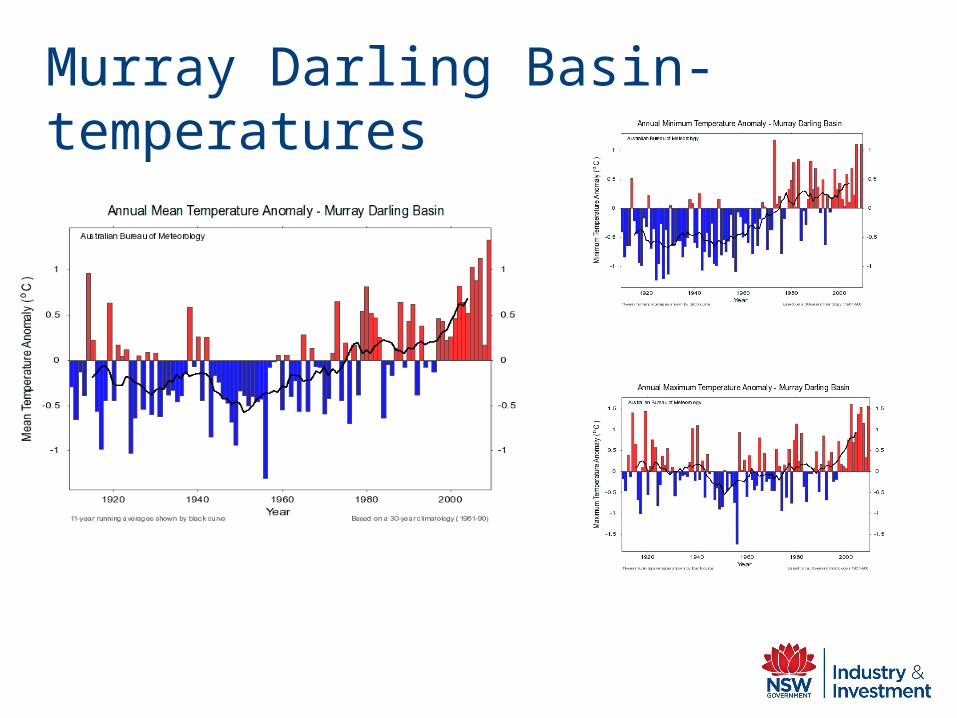
Murray Darling Basin- temperatures

Murray Darling Basin- annual rainfall
Iconic droughts 1900-1909, 1936-45 and 1997-2009

MDB- Winter and Spring rainfall
Murray Darling Basin -Cool Season Rainfall JJASON (1900-2009)
0
50
100
150
200
250
300
350
400
450
1900
1905
1910
1915
1920
1925
1930
1935
1940
1945
1950
1955
1960
1965
1970
1975
1980
1985
1990
1995
2000
2005
Year
mm
/JJA
SO
N p
erio
d
JJASON
5 per. Mov. Avg. (JJASON)
Data source: BoM
Drivers of winter/spring variability ENSO/IOD Ummenhofer et al 2010

4 Sites Seasonal
rainfall trends
Horsham seasonal rainfall trend (1889-2009)-data drill
0
20
40
60
80
100
120
140
160
180
200
1889
1894
1899
1904
1909
1914
1919
1924
1929
1934
1939
1944
1949
1954
1959
1964
1969
1974
1979
1984
1989
1994
1999
2004
2009
Year
mm
/sea
son Autumn MAM
Spring SON
Summer DJF
Winter JJA
Moree seasonal rainfall trend 1889-2009 (11yr moving average)- data drill
0
50
100
150
200
250
300
1889
1894
1899
1904
1909
1914
1919
1924
1929
1934
1939
1944
1949
1954
1959
1964
1969
1974
1979
1984
1989
1994
1999
2004
2009
Year
mm
/se
as
on Autumn MAM
Spring SON
Summer DJF
Winter JJA
MDB seasonal rainfall (1900-2009) 11 yr moving average
0
20
40
60
80
100
120
140
160
180
200
19
00
19
06
19
12
19
18
19
24
19
30
19
36
19
42
19
48
19
54
19
60
19
66
19
72
19
78
19
84
19
90
19
96
20
02
20
08
Year
mm
Autumn 11 yr moving average
Winter 11 yr moving average
Spring 11 yr moving average
Summer 11 year moving average
Autumn rainfall-Deniliquin
Deniliquin seasonal rainfall trends (1889-2009) 11 yr moving average
0
20
40
60
80
100
120
140
1889
1895
1901
1907
1913
1919
1925
1931
1937
1943
1949
1955
1961
1967
1973
1979
1985
1991
1997
2003
2009
Year
mm
/sea
son
Autumn MAM (11yr moving average)
Data source: SILO Data Drill
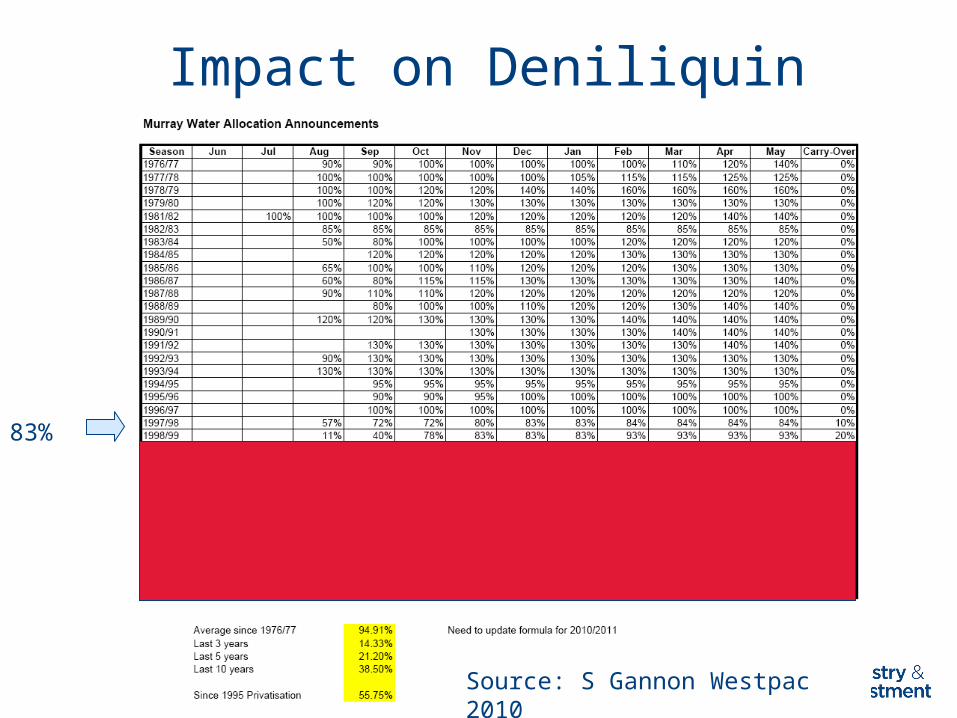
Impact on Deniliquin
Source: S Gannon Westpac 2010
83%

So what’s the talk about?
The three P’s
Climate indicators Deniliquin and MDB
Relevant research quantifying uncertainty
Impacts on farming systems
Future implications for farm businesses and
Deniliquin

The Subtropical Ridge

STR Changes and temperature

STR Impacts

Quantifying uncertainty
So what’s the talk about?
The three P’s
Climate indicators Deniliquin and MDB
Relevant research quantifying uncertainty
Impacts on farming systems
Future implications for farm businesses and
Deniliquin

Rainfall and Plant water use-Deniliquin
0.0
10.0
20.0
30.0
40.0
50.0
60.0
70.0
80.0
90.0
Jan Feb Mar Apr May June July Aug Sep Oct Nov Dec
month
mm
/mth
Mean 61-90 Mean 91-08 Etc estimate - Wheat
Reduced PAW
Reduced PAW in winter crop growing seasonStored soil moisture 61-90 = 69.2mmStored soil moisture 91-08 = 40.7mm (-28.5mm)

Reduced PAW in winter crop growing season
GCM predictions
Rainfall and Plant water use-Deniliquin
0.0
10.0
20.0
30.0
40.0
50.0
60.0
70.0
80.0
90.0
Jan Feb Mar Apr May June July Aug Sep Oct Nov Dec
month
mm
/mth
Mean 61-90 Mean 91-08 CC 2030 50p A1B scenario CC 2070 50p A1F1 scenario Etc estimate
Reduced PAW
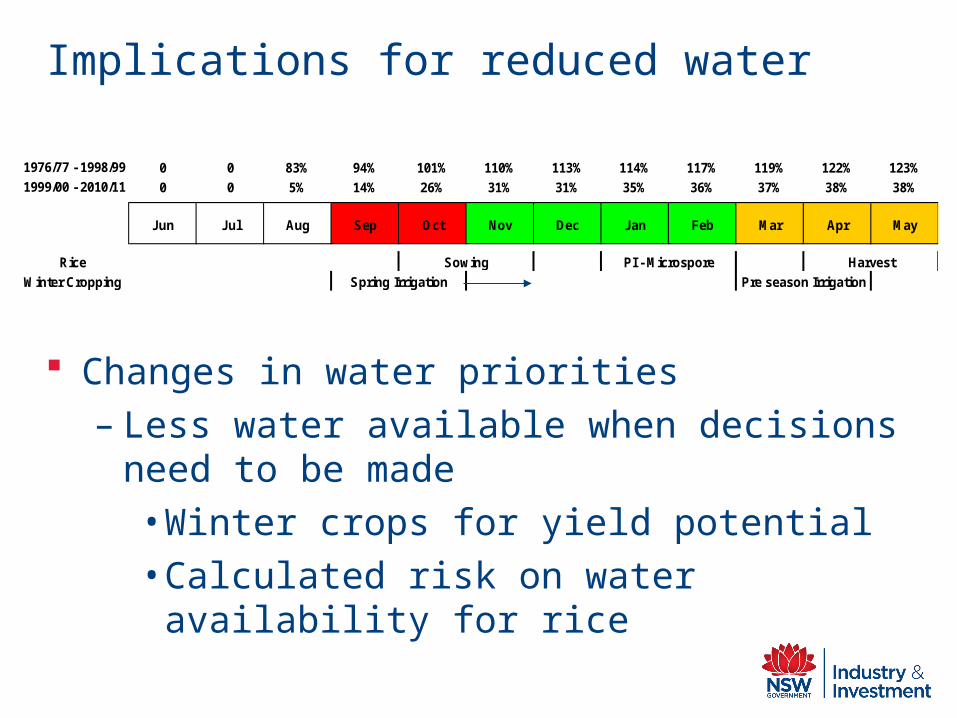
Implications for reduced water
0 0 83% 94% 101% 110% 113% 114% 117% 119% 122% 123%
0 0 5% 14% 26% 31% 31% 35% 36% 37% 38% 38%
Jun Jul Aug Sep Oct Nov Dec Jan Feb Mar Apr May
1976/77 - 1998/99
1999/00 - 2010/11
Rice
Winter Cropping
Sowing Harvest
Spring Irrigation Pre season Irrigation
PI - Microspore
Changes in water priorities– Less water available when decisions need to be
made• Winter crops for yield potential• Calculated risk on water availability for rice

Implications for industry – rice (Gaydon et al., 2010)
Declines in irrigation water supply -ve impact Potential increases in water demand (?) -
increased ET but quicker growth Low-temperature damage may be reduced (?)
Significant improvements in water productivity difficult under existing systems –
less water = less rice

Rice farming system changes
Adaptation– Drill sowing - Farm layouts– Aerobic rice - New Varieties– AWD - Irrigation methods
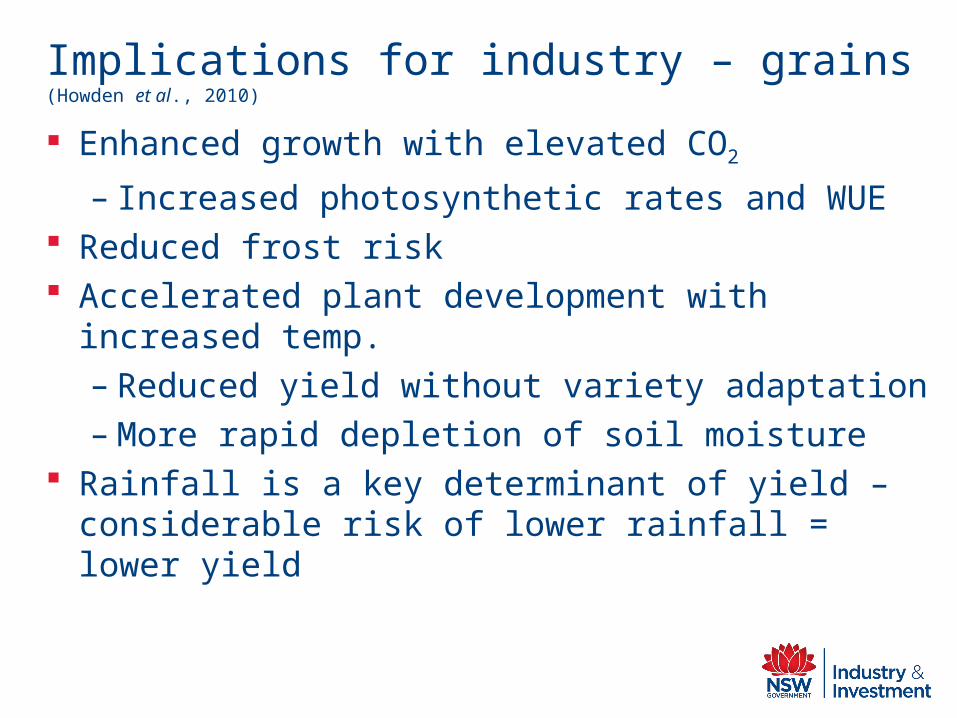
Implications for industry – grains (Howden et al., 2010)
Enhanced growth with elevated CO2
– Increased photosynthetic rates and WUE Reduced frost risk Accelerated plant development with increased
temp. – Reduced yield without variety adaptation– More rapid depletion of soil moisture
Rainfall is a key determinant of yield – considerable risk of lower rainfall = lower yield
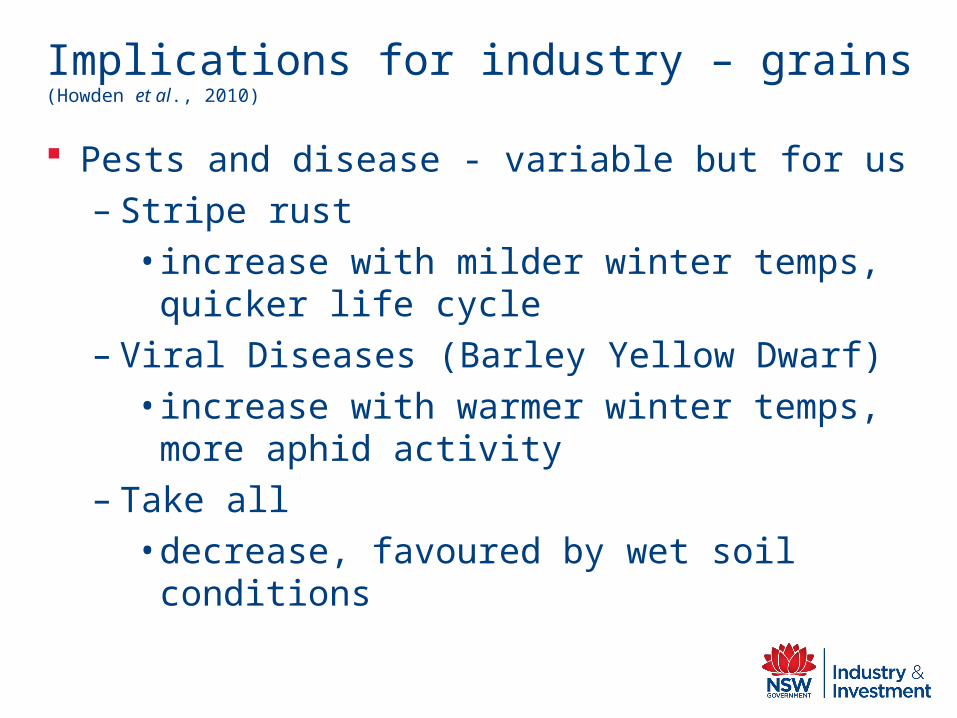
Implications for industry – grains (Howden et al., 2010)
Pests and disease - variable but for us– Stripe rust
• increase with milder winter temps, quicker life cycle
– Viral Diseases (Barley Yellow Dwarf) • increase with warmer winter temps, more
aphid activity– Take all
• decrease, favoured by wet soil conditions

Take home message- Temps are up- Autumn rainfall down- STR intensification driving autumn decline (temp)- GCM uncertainty around autumn (under estimate?)- Impacting on water availability
- Less water less production

So what’s the talk about?
The three P’s
Climate indicators Deniliquin and MDB
Relevant research quantifying uncertainty
Impacts on farming systems
Future implications for farm businesses and
Deniliquin

Future implications for farms
Scale (Diversification)
Return on water and land asset base (Review)
Equity level (Key to survival)
Flexible systems (annual –turn on or off)

References
Gaydon DS, Beecher HG, Reinke R, Crimp S and Howden SM (2010) ‘Rice’. In Adapting Agriculture to Climate Change. CSIRO Publishing Howden SM, Gifford RG and Meinke H (2010) ‘Grains’. In Adapting Agriculture to Climate Change. CSIRO Publishing
Timbal B (2010) ‘Understanding the anthropogenic nature of observed rainfall decline across south-eastern Australia. Centre for Australian
Weather and Climate Research, Technical Report No. 026
Ummenhofer CC, Alexander SG, Briggs PR, England MH, McIntosh PC, Meyers GA, Pook MJ, Raupach MR, Risbey JS (2010). Indian and Pacific Ocean Influences on Southeast Australian Drought and Soil Moisture. Journal of Climate. Published on line in (http://journals.ametsoc.org) DOI 10.1175/2010JCLI3475.1

Additional slides
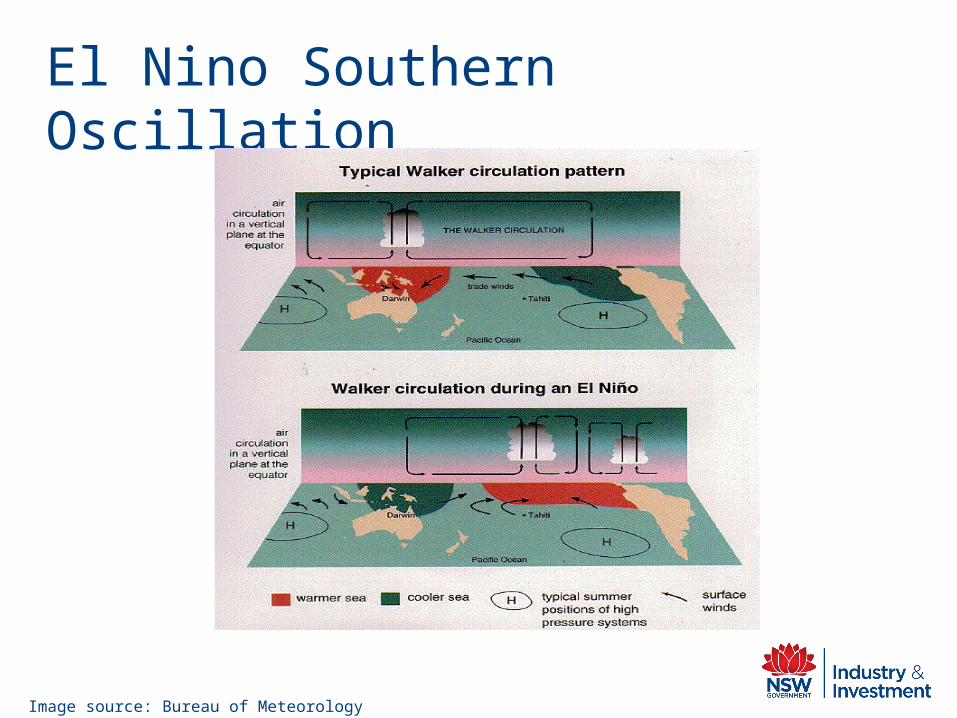
El Nino Southern Oscillation
Image source: Bureau of Meteorology
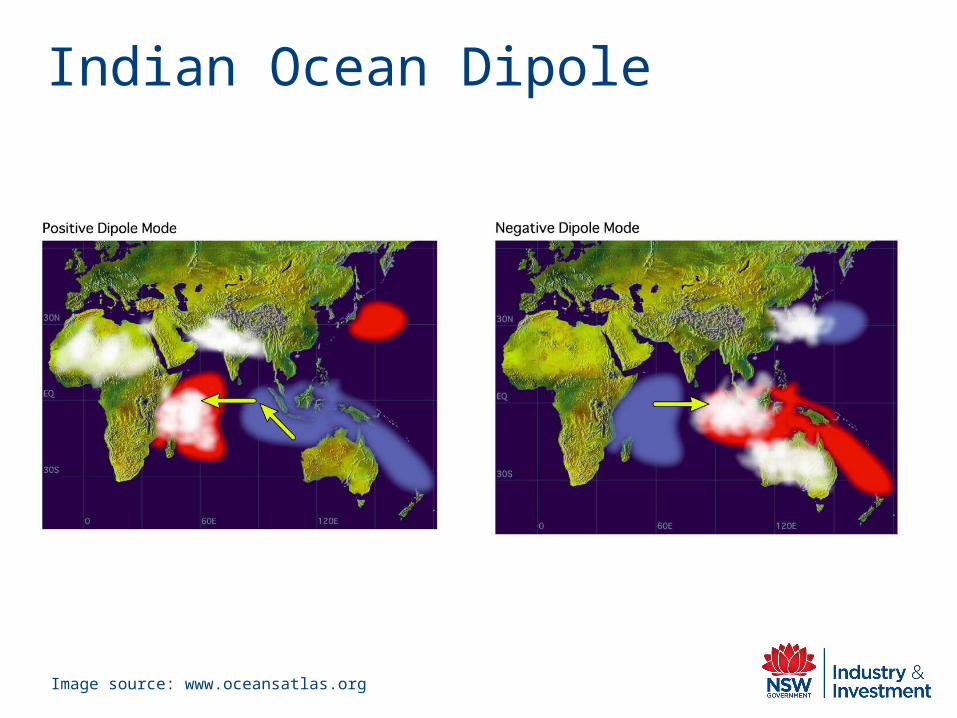
Indian Ocean Dipole
Image source: www.oceansatlas.org
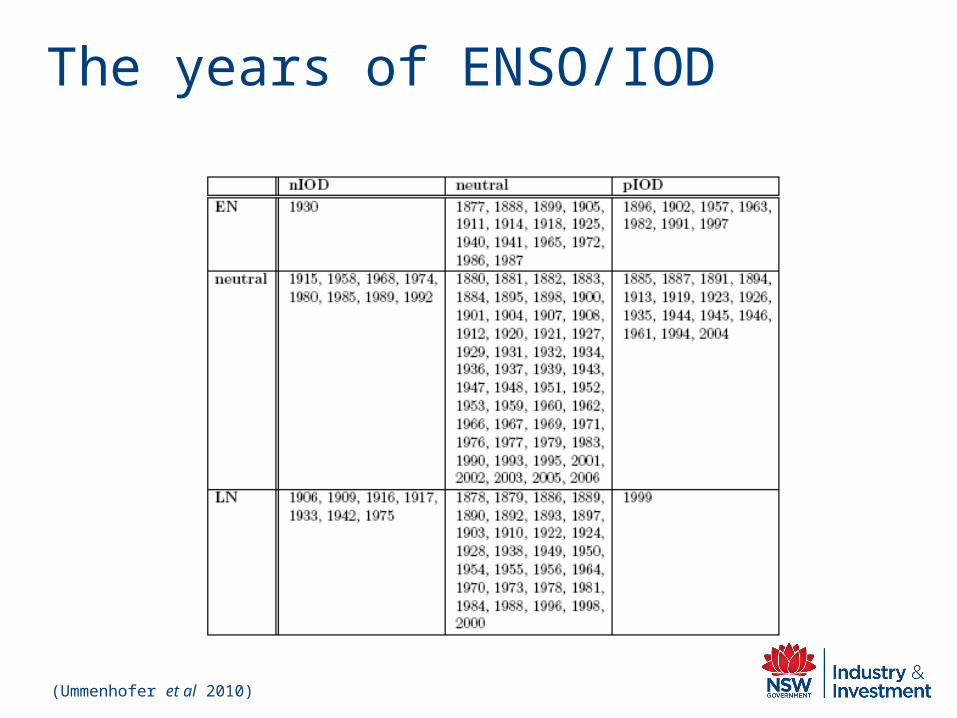
The years of ENSO/IOD
(Ummenhofer et al 2010)
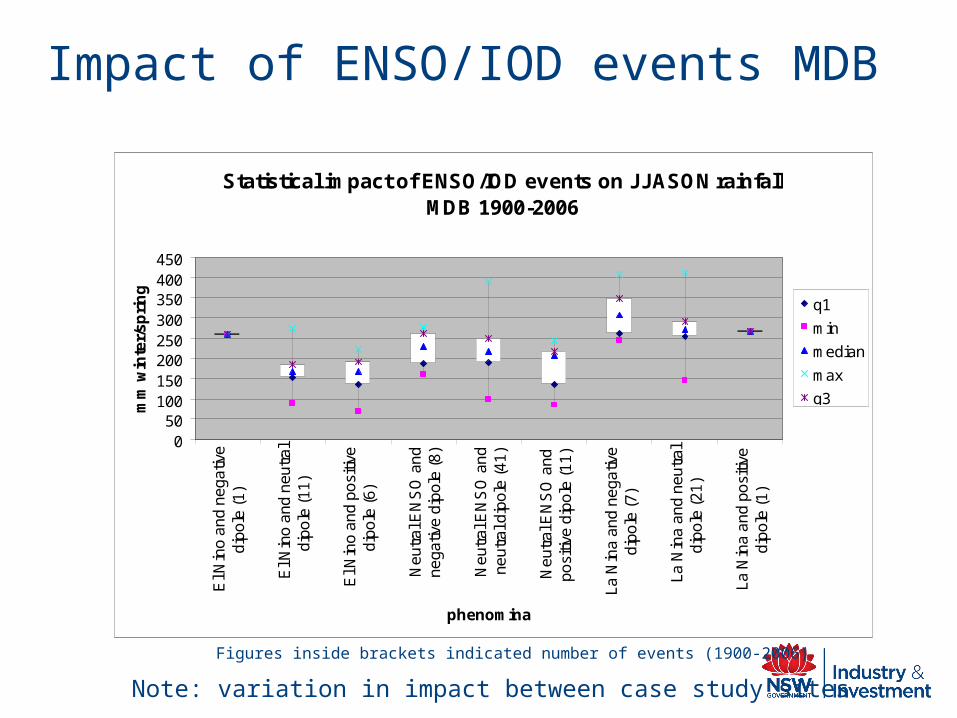
Impact of ENSO/IOD events MDB
Statistical impact of ENSO/IOD events on JJASON rainfall MDB 1900-2006
050
100150200250300350400450
El N
ino
an
d n
ega
tive
dip
ole
(1)
El N
ino
an
d n
eut
ral
dip
ole
(11
)
El N
ino
an
d p
osi
tive
dip
ole
(6)
Neu
tra
l EN
SO
an
dn
eg
ativ
e d
ipo
le (
8)
Neu
tra
l EN
SO
an
dn
eu
tral
dip
ole
(41
)
Neu
tra
l EN
SO
an
dp
osi
tive
dip
ole
(11
)
La
Nin
a a
nd
ne
ga
tive
dip
ole
(7)
La
Nin
a a
nd
ne
utr
ald
ipo
le (
21)
La
Nin
a a
nd
po
sitiv
ed
ipo
le (
1)
phenomina
mm
win
ter/
spri
ng
q1
min
median
max
q3
Figures inside brackets indicated number of events (1900-2006)
Note: variation in impact between case study sites

http://www.climatechangeinaustralia.gov.au/technical_report.php