climate protection through avoided deforestation programme...
TRANSCRIPT

Climate Protection through Avoided Deforestation Programme (CliPAD)
Technical Feasibility Assessment of the Nam Phui National Protected Area REDD+ Project in Lao PDRColin Moore, Gabriel Eickhoff, Jeremy Ferrand & Xaisavan Khiewvongphachan
November 2011Version 1.4

Published by:
Deutsche Gesellschaft für Internationale Zusammenarbeit (GIZ)
Climate Protection through Avoided Deforestation Programme (CliPAD)Department of ForestryThat Dam Campus, Chanthaboury DistrictPO Box 1295Vientiane, Lao PDR
T: +856 21 254082F: +856 21 254083
Website:www.giz.de
Authors:Colin Moore1, Gabriel Eickhoff2, Jeremy Ferrand1, Xaisavan Khiewvongphachan1
(1 - Wildlife Conservation Society, 2 - GIZ, CliPAD)
The analysis, results and recommendations in this publication represent the opinion of the author and are not necessarily representative of the position of the Deutsche
Gesellschaft für Zusammenarbeit (GIZ) GmbH.
Distributed by:CliPAD
Report completed in November 2011 (Version 1.4), Printed in 2011
Technical Feasibility Assessment of the Nam Phui National Protected Area REDD+ Project in Lao PDR 1
Table of Contents
Tables...............................................................................................................................................................................2
Figures .............................................................................................................................................................................3
1. Executive Summary ..............................................................................................................................................4
2. Background ............................................................................................................................................................6
2.1. REDD+ context .................................................................................................................................... 6
2.2. Nam Phui NPA REDD feasibility study ............................................................................................ 7
2.3. Nam Phui National Protected Area .................................................................................................... 8
3. Project Parameters.............................................................................................................................................. 11
3.1. Areas of analysis .............................................................................................................................. 11
3.2. Carbon stock data ........................................................................................................................... 18
3.3. Land cover classification ................................................................................................................ 20
3.4. Historical deforestation and degradation analysis ...................................................................... 25
3.5. Land Change Modeler transition sub-modeling ......................................................................... 37
4. REDD Analysis .................................................................................................................................................. 50
4.1. Baseline ............................................................................................................................................. 50
4.2. Project scenario ............................................................................................................................... 61
4.3. Credit potential ................................................................................................................................ 71
4.4. Financial assessment ....................................................................................................................... 75
5. ARR Analysis ..................................................................................................................................................... 81
5.1. Baseline ............................................................................................................................................. 81
5.2. Project scenarios .............................................................................................................................. 84
5.3. Credit potential ................................................................................................................................ 87
5.4. Financial assessment ....................................................................................................................... 90
5.5. Combined REDD and ARR analysis ........................................................................................... 93
6. Project Risks ........................................................................................................................................................ 97
6.1. Operational and technical risks ..................................................................................................... 97
6.2. Regulatory risks ............................................................................................................................... 98
6.3. Market risks ...................................................................................................................................... 99
7. Conclusions and Recommendations ............................................................................................................. 101
7.1. REDD ............................................................................................................................................. 101
7.2. ARR ................................................................................................................................................. 103
Annex 1 References .................................................................................................................................................. 106
Annex 2 Agricultural Extension Activity Costs ................................................................................................... 107
Annex 3 Combined REDD & ARR Work Plan ................................................................................................. 108
Annex 4 REDD & ARR Non-Permanence Analysis ......................................................................................... 109

2 Technical Feasibility Assessment of the Nam Phui National Protected Area REDD+ Project in Lao PDR
Tables Table 1. Comparison of the TGC reference region criteria with the selected project reference region ........................ 14
Table 2. Comparison of parameters used in this study to IPPC default values .................................................................. 19
Table 3. Summary statistics for carbon stocks by land cover type ........................................................................................ 20
Table 4. Accuracy assessment for the 2010 land cover map with two MDF classes ......................................................... 22
Table 5. Accuracy assessment for the 2010 land cover map with the combined MDF class ........................................... 22
Table 6. Breakdown of land cover types in the NP NPA ...................................................................................................... 23
Table 7. Breakdown of the forest cover types in the REDD project area ........................................................................... 23
Table 8. Details of the satellite imagery used for the forest cover mapping........................................................................ 25
Table 9. Accuracy assessment results for the forest cover maps ........................................................................................... 26
Table 10. Forest cover for the three regions of analysis ......................................................................................................... 26
Table 11. Deforestation rates for the three regions of analysis ............................................................................................. 31
Table 12. Increased forest cover rates for the three regions of analysis .............................................................................. 31
Table 13. Example assumptions made during the interpretation of the change analysis for paired images .................. 34
Table 14. Breakdown of land cover areas in the Phiang portion of the NP NPA as calculated from the change
analysis............................................................................................................................................................................................. 34
Table 15. Calculated rates of degradation and regeneration in the MDF class in the Phiang portion of the NPA ...... 35
Table 16. LCM predicted deforestation for the reference region .......................................................................................... 45
Table 17. LCM predicted deforestation for the project area .................................................................................................. 47
Table 18. Baseline GHG emissions over 15 years for the deforestation, degradation and regeneration components in
the Project Area. ............................................................................................................................................................................ 58
Table 19. Net emission reductions from reducing deforestation over 15 years in the Project Area. .............................. 69
Table 20. Net emission reductions from reducing deforestation, degradation and increasing regeneration over 15
years in the Project Area. ............................................................................................................................................................. 70
Table 21. Net carbon credit potential (VCUs) from reducing deforestation based upon a 50,000 minimum
verification volume ........................................................................................................................................................................ 73
Table 22. Net carbon credit potential (VCUs) from reducing deforestation, degradation and increasing regeneration
based upon a 50,000 minimum verification volume ................................................................................................................ 74
Table 23. Estimated project costs for the NP REDD project ............................................................................................... 77
Table 24. Annual and net cumulative cash flows over 15 years for the avoided deforestation component .................. 79
Table 25. Annual and net cumulative cash flows over 15 years for reducing deforestation, degradation and increasing
regeneration .................................................................................................................................................................................... 80
Table 26. Net and cumulative baseline removals for the ARR component over 15 years ................................................ 82
Table 27. Net annual and cumulative project removals for the ARR component ............................................................. 87
Table 28. Net carbon credit potential (VCUs) per year for the ARR component based upon a 50,000 tCO2e
minimum verification volume ..................................................................................................................................................... 89
Table 29. ARR carbon project development costs .................................................................................................................. 90
Table 30. Annual and net cumulative cash flows over 15 years for the ARR component ................................................ 92
Table 31. Net annual and cumulative cash flows for the combined REDD and ARR components over 15 years ..... 95
Technical Feasibility Assessment of the Nam Phui National Protected Area REDD+ Project in Lao PDR 3
Figures Figure 1. Location of the Nam Phui NPA ................................................................................................................................ 10
Figure 2. Project management zone and REDD project area including the boundaries of the 30 villages analyzed for
this study ......................................................................................................................................................................................... 12
Figure 3. Location of the project area, leakage belt and reference area................................................................................ 15
Figure 4. Land-use zoning in Sayabouri province .................................................................................................................... 16
Figure 5. Map of identified areas eligible for ARR activities .................................................................................................. 18
Figure 6. Examples the of use of Quickbird imagery to classify land cover types on the LandSat imagery .................. 21
Figure 7. 2010 land cover classification of the NP NPA ........................................................................................................ 24
Figure 8. Location of deforestation in the reference region during the three periods of analysis ................................... 27
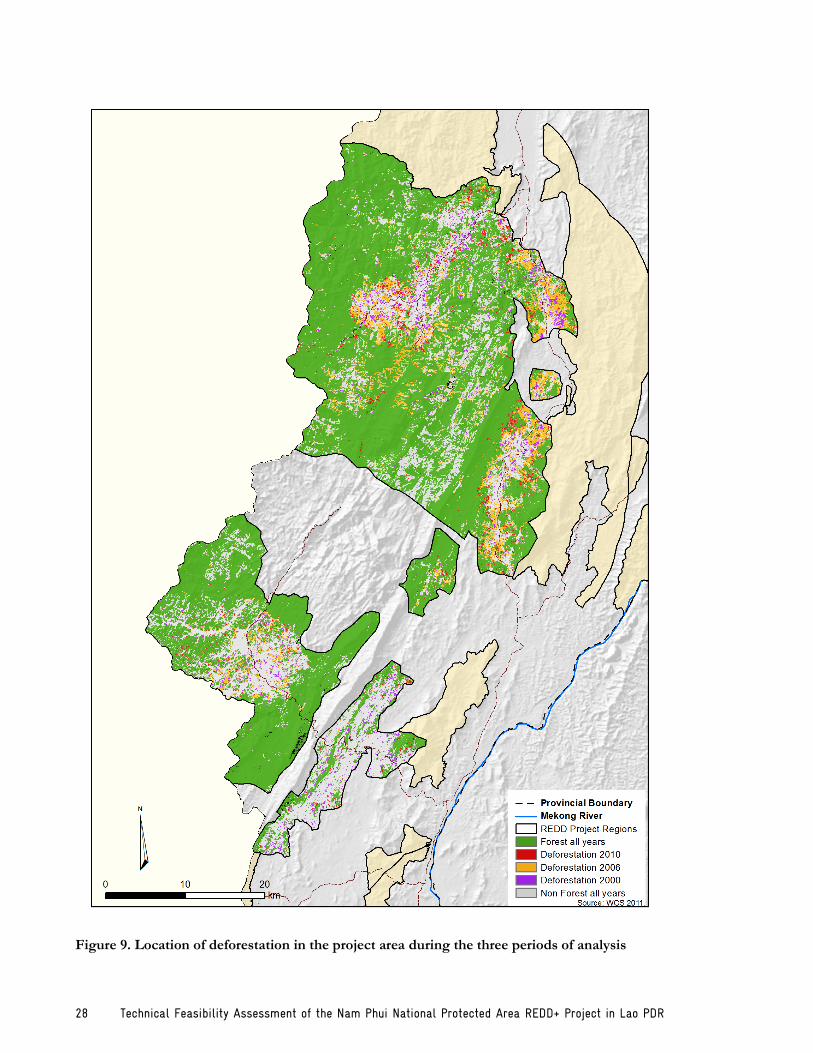
Figure 9. Location of deforestation in the project area during the three periods of analysis ........................................... 28
Figure 10. Cumulative deforestation and reforestation between 1997 and 2010 for the project area ............................. 29
Figure 11. Location of degradation and regeneration within the Phiang portion of the NP NPA for the three periods
of analysis........................................................................................................................................................................................ 36
Figure 12. LCM MLP Slope driver variable for the reference region (legend indicates slope %).................................... 39
Figure 13. LCM MLP Distance to Road variable for the reference region (legend indicates distance in meters) ........ 39
Figure 14. LCM MLP Distance to Non-Forest in 2000 variable for the reference region (legend indicates distance in
meters) ............................................................................................................................................................................................. 40
Figure 15. Composite transition potential driver map of the reference region ................................................................... 40
Figure 16. LCM MLP Slope driver variable for the project area (legend indicates slope %) ............................................ 41
Figure 17. LCM MLP Distance to Roads driver variable (legend indicates distance in meters) ...................................... 41
Figure 18. LCM MLP Distance to Non-Forest in 2000 driver variable (legend indicates distance in meters) .............. 42
Figure 19. Composite transition potential driver map of the project area ........................................................................... 42
Figure 20. Actual (left) and LCM predicted (right) forest cover for 2010 in the project area. ......................................... 43
Figure 21. Actual (left) and LCM predicted (right) forest cover in 2010 for the reference region .................................. 44
Figure 22. LCM predicted forest cover for 2015 (left), 2020 (middle) and 2025 (right) for the reference area ............ 46
Figure 23. LCM predicted forest cover for 2015 (left), 2020 (middle) and 2025 (right) for the project area ................ 48
Figure 24. Graph of historical and predicted forest cover change in the REDD+ project area and reference region 49
Figure 25. Baseline emissions over 15 years for the deforestation, degradation and regeneration components in the
Project Area .................................................................................................................................................................................... 59
Figure 26. Net cumulative emission reductions from reducing deforestation, degradation and increasing regeneration
over 15 years in the Project Area ................................................................................................................................................ 68
Figure 27. Net cumulative cash flows over 15 years for the avoided deforestation component ..................................... 78
Figure 28. Net cumulative cash flows over 15 years for reducing deforestation, degradation and increasing
regeneration .................................................................................................................................................................................... 78
Figure 29. Cumulative baseline removals for the ARR component over 15 years ............................................................. 82
Figure 30. Cumulative net project removals for the ARR component ................................................................................ 86
Figure 31. Net cumulative cash flows over 15 years for the NP ARR component............................................................ 91
Figure 32. Net cumulative cash flows for the combined REDD and ARR components over 15 years......................... 94
Figure 33. Comparison of net cumulative revenues in 2017 and 2025 for RED (avoided deforestation component
only), REDD (avoided deforestation, degradation and increasing regeneration), ARR and combined REDD and
ARR project scenarios. Numbers in red indicate negative cash flows. ................................................................................ 96
4 Technical Feasibility Assessment of the Nam Phui National Protected Area REDD+ Project in Lao PDR
1. Executive Summary
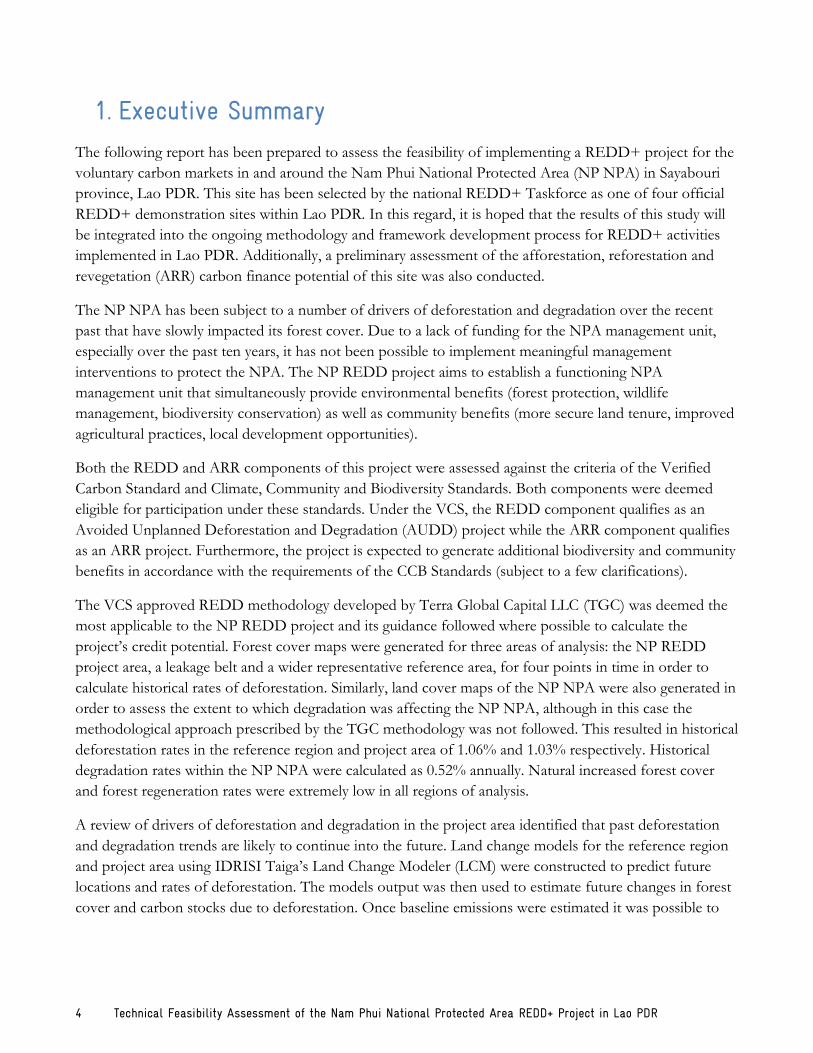
The following report has been prepared to assess the feasibility of implementing a REDD+ project for the
voluntary carbon markets in and around the Nam Phui National Protected Area (NP NPA) in Sayabouri
province, Lao PDR. This site has been selected by the national REDD+ Taskforce as one of four official
REDD+ demonstration sites within Lao PDR. In this regard, it is hoped that the results of this study will
be integrated into the ongoing methodology and framework development process for REDD+ activities
implemented in Lao PDR. Additionally, a preliminary assessment of the afforestation, reforestation and
revegetation (ARR) carbon finance potential of this site was also conducted.
The NP NPA has been subject to a number of drivers of deforestation and degradation over the recent
past that have slowly impacted its forest cover. Due to a lack of funding for the NPA management unit,
especially over the past ten years, it has not been possible to implement meaningful management
interventions to protect the NPA. The NP REDD project aims to establish a functioning NPA
management unit that simultaneously provide environmental benefits (forest protection, wildlife
management, biodiversity conservation) as well as community benefits (more secure land tenure, improved
agricultural practices, local development opportunities).
Both the REDD and ARR components of this project were assessed against the criteria of the Verified
Carbon Standard and Climate, Community and Biodiversity Standards. Both components were deemed
eligible for participation under these standards. Under the VCS, the REDD component qualifies as an
Avoided Unplanned Deforestation and Degradation (AUDD) project while the ARR component qualifies
as an ARR project. Furthermore, the project is expected to generate additional biodiversity and community
benefits in accordance with the requirements of the CCB Standards (subject to a few clarifications).
The VCS approved REDD methodology developed by Terra Global Capital LLC (TGC) was deemed the
most applicable to the NP REDD project and its guidance followed where possible to calculate the
project‟s credit potential. Forest cover maps were generated for three areas of analysis: the NP REDD
project area, a leakage belt and a wider representative reference area, for four points in time in order to
calculate historical rates of deforestation. Similarly, land cover maps of the NP NPA were also generated in
order to assess the extent to which degradation was affecting the NP NPA, although in this case the
methodological approach prescribed by the TGC methodology was not followed. This resulted in historical
deforestation rates in the reference region and project area of 1.06% and 1.03% respectively. Historical
degradation rates within the NP NPA were calculated as 0.52% annually. Natural increased forest cover
and forest regeneration rates were extremely low in all regions of analysis.
A review of drivers of deforestation and degradation in the project area identified that past deforestation
and degradation trends are likely to continue into the future. Land change models for the reference region
and project area using IDRISI Taiga‟s Land Change Modeler (LCM) were constructed to predict future
locations and rates of deforestation. The models output was then used to estimate future changes in forest
cover and carbon stocks due to deforestation. Once baseline emissions were estimated it was possible to
Technical Feasibility Assessment of the Nam Phui National Protected Area REDD+ Project in Lao PDR 5
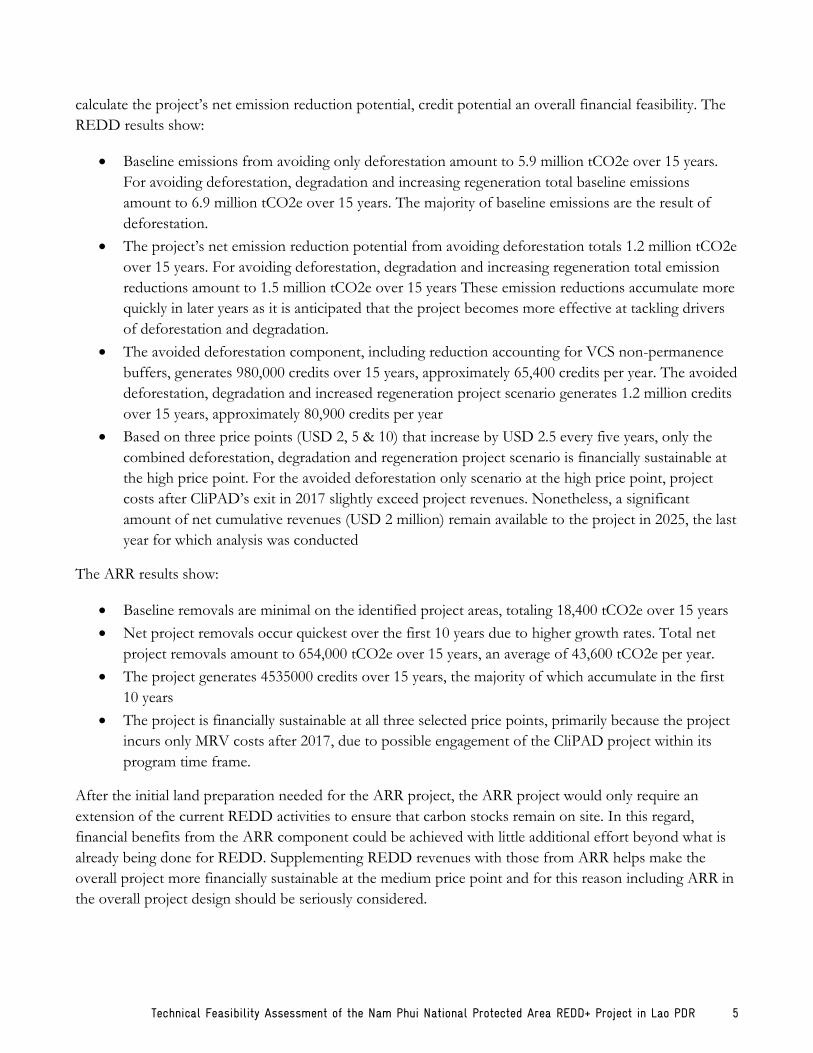
calculate the project‟s net emission reduction potential, credit potential an overall financial feasibility. The
REDD results show:
Baseline emissions from avoiding only deforestation amount to 5.9 million tCO2e over 15 years.
For avoiding deforestation, degradation and increasing regeneration total baseline emissions
amount to 6.9 million tCO2e over 15 years. The majority of baseline emissions are the result of
deforestation.
The project‟s net emission reduction potential from avoiding deforestation totals 1.2 million tCO2e
over 15 years. For avoiding deforestation, degradation and increasing regeneration total emission
reductions amount to 1.5 million tCO2e over 15 years These emission reductions accumulate more
quickly in later years as it is anticipated that the project becomes more effective at tackling drivers
of deforestation and degradation.
The avoided deforestation component, including reduction accounting for VCS non-permanence
buffers, generates 980,000 credits over 15 years, approximately 65,400 credits per year. The avoided
deforestation, degradation and increased regeneration project scenario generates 1.2 million credits
over 15 years, approximately 80,900 credits per year
Based on three price points (USD 2, 5 & 10) that increase by USD 2.5 every five years, only the
combined deforestation, degradation and regeneration project scenario is financially sustainable at
the high price point. For the avoided deforestation only scenario at the high price point, project
costs after CliPAD‟s exit in 2017 slightly exceed project revenues. Nonetheless, a significant
amount of net cumulative revenues (USD 2 million) remain available to the project in 2025, the last
year for which analysis was conducted
The ARR results show:
Baseline removals are minimal on the identified project areas, totaling 18,400 tCO2e over 15 years
Net project removals occur quickest over the first 10 years due to higher growth rates. Total net
project removals amount to 654,000 tCO2e over 15 years, an average of 43,600 tCO2e per year.
The project generates 4535000 credits over 15 years, the majority of which accumulate in the first
10 years
The project is financially sustainable at all three selected price points, primarily because the project
incurs only MRV costs after 2017, due to possible engagement of the CliPAD project within its
program time frame.
After the initial land preparation needed for the ARR project, the ARR project would only require an
extension of the current REDD activities to ensure that carbon stocks remain on site. In this regard,
financial benefits from the ARR component could be achieved with little additional effort beyond what is
already being done for REDD. Supplementing REDD revenues with those from ARR helps make the
overall project more financially sustainable at the medium price point and for this reason including ARR in
the overall project design should be seriously considered.

6 Technical Feasibility Assessment of the Nam Phui National Protected Area REDD+ Project in Lao PDR
Before moving ahead with project development, several key issues need to be resolved. Firstly, legal clarity
on the ownership of carbon rights at a national level is required. Secondly, government authorities need to
agree upon a mechanism for how REDD financing will be distributed between various project
stakeholders. Finally, the project needs to conduct open consultations via a Free Prior Informed Consent
(FPIC) approach with all stakeholders potentially involved with the project to inform them of the project
idea and gain their consent.
2. Background
2.1. REDD+ context
Over the past five years substantial progress has been made towards the development of an international
mechanism to reward developing countries for reducing emissions from deforestation and degradation;
including conservation, sustainable management of forests and enhancement of forest carbon stocks
(REDD+). Most recently at the 16th Conference of the Parties to the United Nations Framework
Convention on Climate Change (UNFCCC) in Cancun, Mexico, the international community adopted the
proposed text of the Long-term Cooperative Action (LCA) Working Group, which includes language on
the development of a REDD+ mechanism. This sends the strongest signal yet of a future international
agreement on REDD+.
During this same five year period, a proliferation of bi-lateral and multi-lateral support mechanisms have
emerged to assist developing countries prepare for REDD+. This is in recognition of the institutional, legal
and policy challenges a REDD+ mechanism will pose for participating countries. Examples include the
World Bank‟s Forest Carbon Partnership Facility (FCPF), the United Nations‟ UN-REDD mechanism,
and investments made by the Government of Norway to support REDD+ through its International
Climate and Forest Initiative. Concurrently, the voluntary carbon markets have been particularly active
with regards to project level REDD, catalyzed in large part by the development of REDD specific
guidelines and methodologies under the Verified Carbon Standard1 (VCS). 2010 saw the first VCS REDD
methodologies approved and in early 2011 the first issuance of verified VCS REDD credits.
Lao PDR has been identified at the international level as a priority country with regards to REDD+. Lao
PDR is one of thirty-seven countries selected to participate under the FCPF, and one of only eight to
benefit from the Global Environment Facility‟s (GEF) Forest Investment Programme (FIP). To manage
these many initiatives, the Government of Laos (GoL) established a national REDD+ Taskforce to
oversee all REDD+ related developments in country. One of its first tasks was to develop Lao PDR‟s
Readiness Preparation Proposal (R-PP) which was accepted (subject to revisions) by the FCPF in October,
2010. This committee is led by the Department of Forestry (DoF) within the Ministry of Agriculture and
Forestry, with representatives from several other agencies also represented. In January 2011 the REDD+
1 As of 1 March 2011 the Voluntary Carbon Standard changed its name to the Verified Carbon Standard.

Technical Feasibility Assessment of the Nam Phui National Protected Area REDD+ Project in Lao PDR 7
Task Force was restructured incorporating more sectors to ensure sufficient multi-sectoral exchange for
developing the REDD+ framework for Lao PDR in the future.
As a way to build national capacity on REDD+, the GoL has approved four projects as official REDD+
demonstration sites. These include the Nam Phui National Protected Area (NP NPA), Nam Et Phou
Louey (NEPL) NPA, Nam Kading (NK) NPA and the Dong Sithuane Production Forest Area (PFA).
2.2. Nam Phui NPA REDD feasibility study
In 2009, KfW Entwicklungsbank (KfW) commissioned a study to pre-screen and identify NPAs in Lao
PDR as possible REDD+ demonstration sites under the Financial Cooperation module of the Laotian-
German Climate Protection through Avoided Deforestation (CliPAD) program. The CliPAD program is
designed to meet five main objectives: i) preparation of a national REDD framework, ii) put in place
REDD relevant planning for sub-national REDD implementation, iii) design and test local-level REDD
strategies, iv) develop sustainable financing models for NPAs, and v) disseminate lessons learned from the
UNFCCC.
The results of the joint KfW/GTZ study identified two NPAs for further development: the NP NPA and
NEPL NPA. The NP NPA was selected because of its perceived high forest carbon stocks and existing
deforestation and degradation trends. Furthermore, it was felt that realistic potential existed to improve the
park‟s management as a method of addressing the existing and future threats to the NPA‟s forests. The
NEPL NPA was selected because of the Wildlife Conservation Society‟s (WCS) longstanding commitment
to this site and consequent strong relationships with government and communities. KfW and GTZ felt
that the NEPL NPA offered an opportunity to test REDD measures more quickly than in other NPAs in
Lao PDR.
In order to better understand the REDD+ carbon finance potential of the NP and NEPL NPAs, CliPAD
commissioned WCS to conduct in-depth feasibility assessments of these two sites, including assessments
of their technical, financial, political and operational feasibility. In particular, these studies were to assess
the feasibility of developing these sites according to the guidelines of the VCS and Climate, Community
and Biodiversity (CCB) Standards. Additionally, the studies were to provide a preliminary analysis of the
carbon finance potential of afforestation, reforestation and revegetation (ARR) activities in the NPAs. The
results of the feasibility study for the NP NPA are presented in the following report.
A complementary report entitled “Investigation of the Drivers of Deforestation and Forest Degradation in
the Nam Phui National Protected Area, Lao PDR” provides a detailed discussion of the deforestation and
degradation drivers affecting this NPA. This is based upon a literature review of existing relevant studies
into land use practices relating to deforestation and forest degradation in Lao PDR; an analysis of
qualitative data collected through a series of meetings with villages inside and bordering the NPA as well as
district and provincial government staff; and an analysis of key proxy variables, including MODIS recorded
fire locations and village population statistics. The results of this separate report are presented only in
8 Technical Feasibility Assessment of the Nam Phui National Protected Area REDD+ Project in Lao PDR
summary form in this feasibility report. Furthermore, the relative importance of fires as a driver of forest-
based emissions in the NP NPA is analyzed in a separate CliPAD report.
In addition to investigating the site specific feasibility of the NP NPA, this study also seeks to support the
national policy development for REDD+ within the framework of the UNFCCC, particularly relating to
the nesting of sub-national, market-based REDD+ activities in NPAs. In this regard, it is hoped that the
results of this study will be integrated into the ongoing methodology and framework development process
for REDD+ activities implemented in Lao PDR.
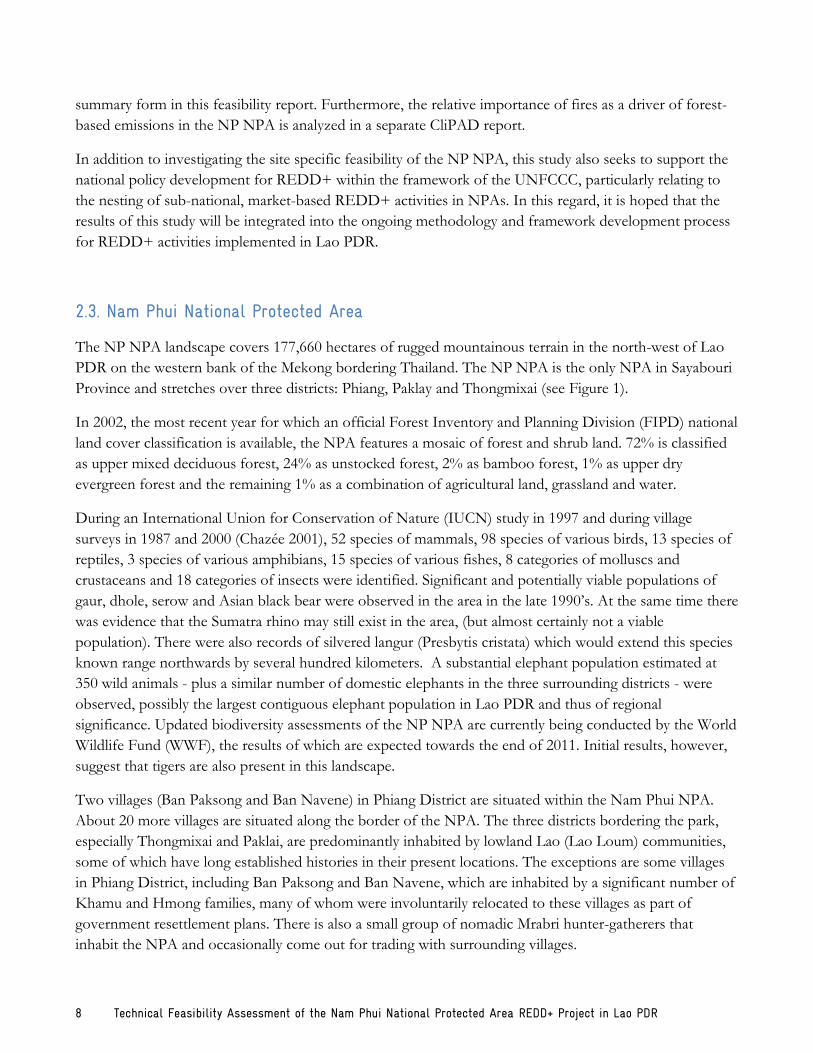
2.3. Nam Phui National Protected Area
The NP NPA landscape covers 177,660 hectares of rugged mountainous terrain in the north-west of Lao
PDR on the western bank of the Mekong bordering Thailand. The NP NPA is the only NPA in Sayabouri
Province and stretches over three districts: Phiang, Paklay and Thongmixai (see Figure 1).
In 2002, the most recent year for which an official Forest Inventory and Planning Division (FIPD) national
land cover classification is available, the NPA features a mosaic of forest and shrub land. 72% is classified
as upper mixed deciduous forest, 24% as unstocked forest, 2% as bamboo forest, 1% as upper dry
evergreen forest and the remaining 1% as a combination of agricultural land, grassland and water.
During an International Union for Conservation of Nature (IUCN) study in 1997 and during village
surveys in 1987 and 2000 (Chazée 2001), 52 species of mammals, 98 species of various birds, 13 species of
reptiles, 3 species of various amphibians, 15 species of various fishes, 8 categories of molluscs and
crustaceans and 18 categories of insects were identified. Significant and potentially viable populations of
gaur, dhole, serow and Asian black bear were observed in the area in the late 1990‟s. At the same time there
was evidence that the Sumatra rhino may still exist in the area, (but almost certainly not a viable
population). There were also records of silvered langur (Presbytis cristata) which would extend this species
known range northwards by several hundred kilometers. A substantial elephant population estimated at
350 wild animals - plus a similar number of domestic elephants in the three surrounding districts - were
observed, possibly the largest contiguous elephant population in Lao PDR and thus of regional
significance. Updated biodiversity assessments of the NP NPA are currently being conducted by the World
Wildlife Fund (WWF), the results of which are expected towards the end of 2011. Initial results, however,
suggest that tigers are also present in this landscape.
Two villages (Ban Paksong and Ban Navene) in Phiang District are situated within the Nam Phui NPA.
About 20 more villages are situated along the border of the NPA. The three districts bordering the park,
especially Thongmixai and Paklai, are predominantly inhabited by lowland Lao (Lao Loum) communities,
some of which have long established histories in their present locations. The exceptions are some villages
in Phiang District, including Ban Paksong and Ban Navene, which are inhabited by a significant number of
Khamu and Hmong families, many of whom were involuntarily relocated to these villages as part of
government resettlement plans. There is also a small group of nomadic Mrabri hunter-gatherers that
inhabit the NPA and occasionally come out for trading with surrounding villages.
Technical Feasibility Assessment of the Nam Phui National Protected Area REDD+ Project in Lao PDR 9
The NP NPA was created in 1993 by Prime Ministerial decree. During the same year a management team
was established with support from the Swedish Forestry Programme LSFP (Phase III) who provided
support to the NPA until 2000. During this time a simple management plan was produced, initial wildlife
surveys conducted, extension activities piloted in Ban Navene and checkpoints established at the northern
and southern entrances to the park. From 2000 until 2008 the park did not receive any external donor
support and management activities were reduced to negligible levels. Starting in 2008, the NP NPA
received limited financial support from the national Forestry Resource Development Fund. In 2010,
WWF also began to provide limited support to the NP NPA management staff to help build capacity and
improve levels of protection in the NPA.

10 Technical Feasibility Assessment of the Nam Phui National Protected Area REDD+ Project in Lao PDR
Figure 1. Location of the Nam Phui NPA
Technical Feasibility Assessment of the Nam Phui National Protected Area REDD+ Project in Lao PDR 11
3. Project Parameters
3.1. Areas of analysis
3.1.1. REDD project area
As per the criteria of the VCS, the forest within the REDD project area must have been forest for at least
the past ten years. The NP REDD project was initially conceived as the forest areas within the NP NPA
that met this criterion. It however became evident that large parts of the NP NPA were historically under
low threat of deforestation or degradation and this was unlikely to change in the near future. Initial analysis
confirmed that defining only the NP NPA as the project area would result in a low overall emission
reduction potential.
Since the CliPAD project has a mandate to work in and around NPAs it was decided to expand the project
area to include villages that have either overlapping borders or are adjacent to the NPA. Furthermore, for
the purposes of defining the REDD project area and carbon accounting area it was decided to exclude the
parts of the NPA that fell within Thongmixai district which were historically under low threat and unlikely
to be at risk in the near future. The cost to manage this low threat area as part of the NPA was however
considered when assessing the overall financial feasibility of the project (see section 4.4.2). In this regard,
the REDD project area, in which carbon accounting is conducted, sits within a larger project management
zone (PMZ) wherein the project partners will implement mitigation activities.
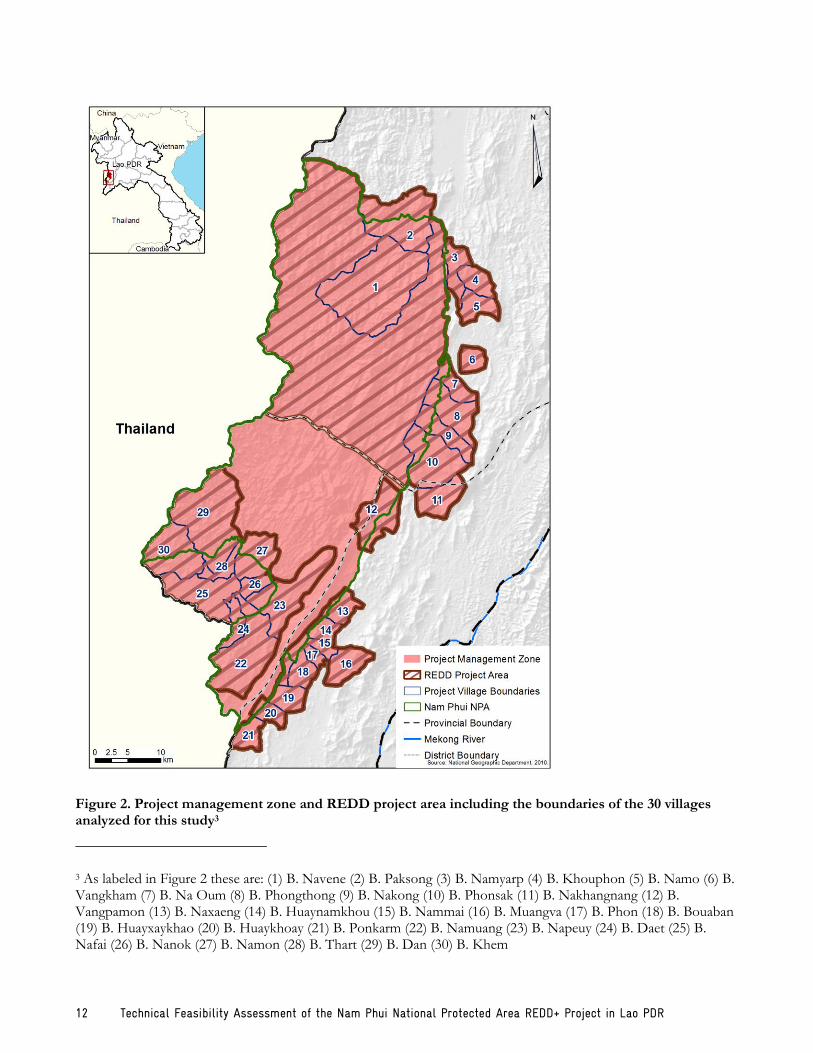
Figure 2 below presents the final REDD project area which comprises of 119,996 ha of forest in the
Phiang portion of the NPA as well as 29 villages with either overlapping or bordering boundaries with the
NPA2.
The term “project area” has two meanings throughout this report. The project area at project start consists
of only forest and is the area from which emission reductions are calculated (119,996 ha). However, the
project area during the historical reference period is both the forest and non-forest areas that sit within the
same area (184,136 ha). This is done in order to get a more accurate idea of the historical change dynamics
in the forest areas in the immediate vicinity of the future project area. In this regard, the term “project
area” is used interchangeably.
2 These 29 villages were selected due to existing data on their village boundaries from a consultancy report prepared under the Swedish Forestry Programme. This was the only existing data for these village boundaries. At a later stage the project may want to consider including additional villages. It will also be necessary to accurately define and digitize these boundaries.
12 Technical Feasibility Assessment of the Nam Phui National Protected Area REDD+ Project in Lao PDR
Figure 2. Project management zone and REDD project area including the boundaries of the 30 villages analyzed for this study3
3 As labeled in Figure 2 these are: (1) B. Navene (2) B. Paksong (3) B. Namyarp (4) B. Khouphon (5) B. Namo (6) B. Vangkham (7) B. Na Oum (8) B. Phongthong (9) B. Nakong (10) B. Phonsak (11) B. Nakhangnang (12) B. Vangpamon (13) B. Naxaeng (14) B. Huaynamkhou (15) B. Nammai (16) B. Muangva (17) B. Phon (18) B. Bouaban (19) B. Huayxaykhao (20) B. Huaykhoay (21) B. Ponkarm (22) B. Namuang (23) B. Napeuy (24) B. Daet (25) B. Nafai (26) B. Nanok (27) B. Namon (28) B. Thart (29) B. Dan (30) B. Khem
Technical Feasibility Assessment of the Nam Phui National Protected Area REDD+ Project in Lao PDR 13
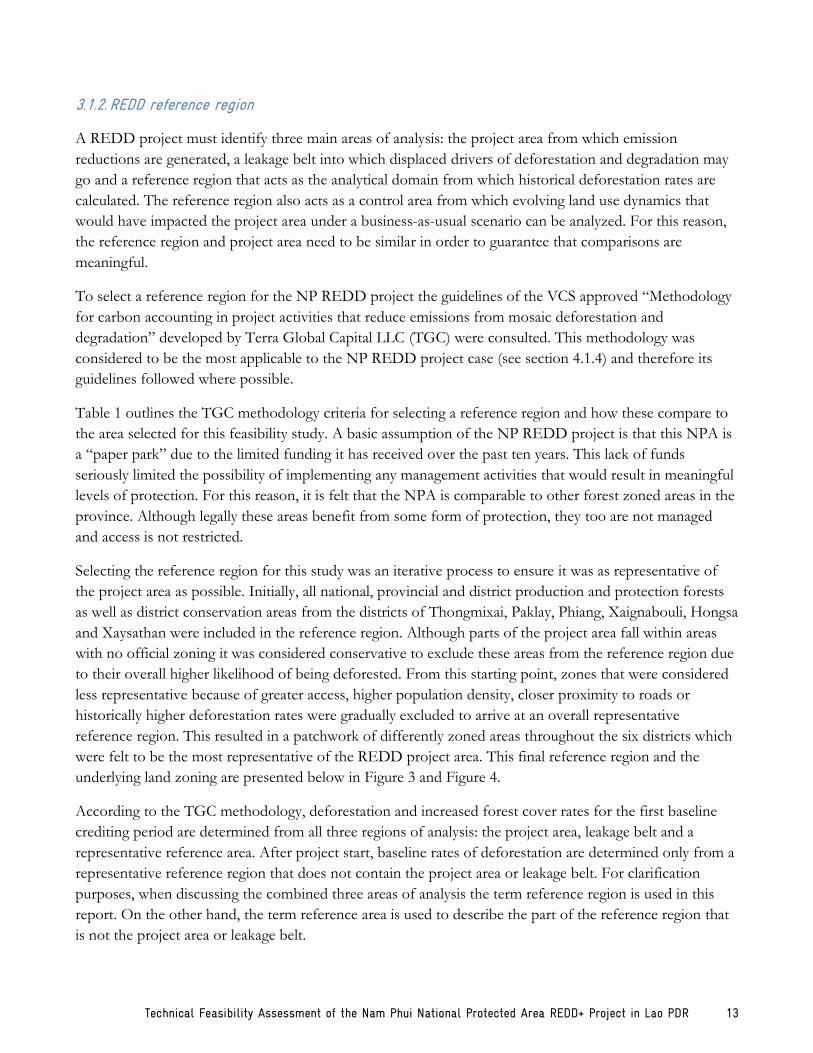
3.1.2. REDD reference region
A REDD project must identify three main areas of analysis: the project area from which emission
reductions are generated, a leakage belt into which displaced drivers of deforestation and degradation may
go and a reference region that acts as the analytical domain from which historical deforestation rates are
calculated. The reference region also acts as a control area from which evolving land use dynamics that
would have impacted the project area under a business-as-usual scenario can be analyzed. For this reason,
the reference region and project area need to be similar in order to guarantee that comparisons are
meaningful.
To select a reference region for the NP REDD project the guidelines of the VCS approved “Methodology
for carbon accounting in project activities that reduce emissions from mosaic deforestation and
degradation” developed by Terra Global Capital LLC (TGC) were consulted. This methodology was
considered to be the most applicable to the NP REDD project case (see section 4.1.4) and therefore its
guidelines followed where possible.
Table 1 outlines the TGC methodology criteria for selecting a reference region and how these compare to
the area selected for this feasibility study. A basic assumption of the NP REDD project is that this NPA is
a “paper park” due to the limited funding it has received over the past ten years. This lack of funds
seriously limited the possibility of implementing any management activities that would result in meaningful
levels of protection. For this reason, it is felt that the NPA is comparable to other forest zoned areas in the
province. Although legally these areas benefit from some form of protection, they too are not managed
and access is not restricted.
Selecting the reference region for this study was an iterative process to ensure it was as representative of
the project area as possible. Initially, all national, provincial and district production and protection forests
as well as district conservation areas from the districts of Thongmixai, Paklay, Phiang, Xaignabouli, Hongsa
and Xaysathan were included in the reference region. Although parts of the project area fall within areas
with no official zoning it was considered conservative to exclude these areas from the reference region due
to their overall higher likelihood of being deforested. From this starting point, zones that were considered
less representative because of greater access, higher population density, closer proximity to roads or
historically higher deforestation rates were gradually excluded to arrive at an overall representative
reference region. This resulted in a patchwork of differently zoned areas throughout the six districts which
were felt to be the most representative of the REDD project area. This final reference region and the
underlying land zoning are presented below in Figure 3 and Figure 4.
According to the TGC methodology, deforestation and increased forest cover rates for the first baseline
crediting period are determined from all three regions of analysis: the project area, leakage belt and a
representative reference area. After project start, baseline rates of deforestation are determined only from a
representative reference region that does not contain the project area or leakage belt. For clarification
purposes, when discussing the combined three areas of analysis the term reference region is used in this
report. On the other hand, the term reference area is used to describe the part of the reference region that
is not the project area or leakage belt.
14 Technical Feasibility Assessment of the Nam Phui National Protected Area REDD+ Project in Lao PDR
Table 1. Comparison of the TGC reference region criteria with the selected project reference region
TGC criteria Criteria met? NP NPA Reference area
Size of reference region is at least 2x larger than project area
Yes Reference region is over 4x larger
Boundaries of reference region coincide with natural, geopolitical or watershed boundaries
Yes District boundaries delineate the reference region
Reference region for historical analysis includes project area, leakage belt and reference region
Yes Includes all three areas
Areas where agents of deforestation have restricted access are removed
Yes No areas in the reference area have restricted access
Reference region contains at least 25% forest cover at project start
Yes Reference region contains 68% forest cover at project start
Drivers of deforestation are similar Yes Unzoned areas with potentially greater access were removed to be conservative
Initial discussions with provincial government suggest remaining areas are subject to similar agricultural, illegal logging and population growth pressures
Similar distribution of native forest types between project area and reference region
Yes Distribution of native forest types within 10% between project area and reference region
Similar average elevation between project area and reference region
Yes Average elevation less than 10% difference between the two areas (8.2%)
Similar average slope between project area and reference region
Yes Average slope within 10% for two areas (1.9%)
Similar extent of steep area4 between project area and reference region
Yes Relative areas with slope >20% within 10% for the two areas (2.9%)
Similar land tenure system between project area and reference region
Yes Land tenure is similar across the entire province
Similar policies and regulations affecting project area and reference region
Yes Both areas located in same province
Similar proportion of urbanized vs. agriculture-based population between project area and reference region
Yes Project area only includes agriculture-based communities therefore all urban areas (defined as district capitals) were removed from the reference region
4 The TGC methodology defines steep areas as areas with slope >10%. Steep areas are typically considered unattractive to farmers therefore limiting the risk they will be encroached. In Laos it is known that farmers will plant on very steep slopes, therefore steep areas were defined as areas with slope >20% for the purposes of this study

Technical Feasibility Assessment of the Nam Phui National Protected Area REDD+ Project in Lao PDR 15
3.1.3. REDD leakage belt
It was not within the scope of this feasibility study to conduct a detailed analysis of the mobility of
deforestation and degradation agents. Discussions with local experts confirmed that the majority of
villagers in the area travel either by foot or tok tok and are unlikely to travel further than 10 km to establish
new agricultural fields. Since these deforestation agents were considered the most likely to cause leakage,
the leakage belt was defined as a 10 km buffer around the project area. Any forests within this buffer were
considered at risk for leakage and assigned to the leakage belt.
Figure 3. Location of the project area, leakage belt and reference area

16 Technical Feasibility Assessment of the Nam Phui National Protected Area REDD+ Project in Lao PDR
Figure 4. Land-use zoning in Sayabouri province

Technical Feasibility Assessment of the Nam Phui National Protected Area REDD+ Project in Lao PDR 17
3.1.4. REDD regeneration areas
The VCS AFOLU requirements state that GHG removals from REDD activities can be affected in a
number of ways. For e.g. “where the forest is young or degraded, stopping its further degradation and
deforestation also allows for additional sequestration of carbon on the land as the forest re-grows (with or
without assisted regeneration)” (VCS 2011b).
Although emission reductions from the regeneration of degraded forests (low density forests passing to
higher density forests) fall under the wider REDD umbrella, the process to identify eligible regeneration
sites was different than for the REDD sites above. Forest dynamics in the NP NPA are not well
understood and it is uncertain to what extent existing low density mixed deciduous forests (MDF) are a
natural phenomenon or the product of recent degradation. It was therefore not possible to assume that all
low density MDF areas would automatically regenerate to high density MDF if the agents of degradation
were removed.
Instead, to account for carbon removals from regeneration the percentage of high density MDF within the
Phiang portion of the NPA that degraded to low density MDF over the previous ten years was calculated
(6.75%). This was done based upon the analysis conducted in section 3.4.2. This same percentage was
applied to the project area as a proxy to estimate how much of the project area‟s forests had been degraded
over the past ten years and therefore eligible for regeneration. This analysis identified 3,172 ha of low
density MDF within the project area that was considered eligible for regeneration.
3.1.5. ARR project area
ARR projects must clearly identify and delineate land parcels upon which activities will be implemented
that lead to the establishment of new forests. Project areas must therefore be accessible to project partners
both for implementing management activities and monitoring purposes. For this reason, it was decided to
focus the analysis within and around Ban Navene and Ban Paksong, the two villages that sit within the
NPA. These were also the only villages for which PLUP plans were available and therefore an analysis of
non-forest areas within differently zoned areas could be conducted.
According to VCS eligibility criteria, ARR projects can only be implemented on lands that have been non-
forest for the ten years preceding project start. Furthermore, the eligibility criteria exclude ARR activities
from native ecosystems (see section 5.2.2 below) thus excluding grasslands as potential ARR sites5. One of
the main deforestation drivers in the NP NPA is the expansion of agricultural areas. It therefore makes
little sense to limit the amount of agricultural area officially designated to villages for ARR purposes. This
could potentially limit communities‟ abilities to achieve food self-sufficiency while also greatly increasing
the risk of leakage due to the displacement of agricultural activities. Non-forest parcels within village
agricultural zoned areas were therefore not considered.
5 Discussions with local DAFO staff confirmed that grasslands currently used for livestock raising are natural grasslands. This was confirmed by viewing historical imagery of the NPA from 1975 that show these grasslands occupying the same spatial extent as today.
18 Technical Feasibility Assessment of the Nam Phui National Protected Area REDD+ Project in Lao PDR
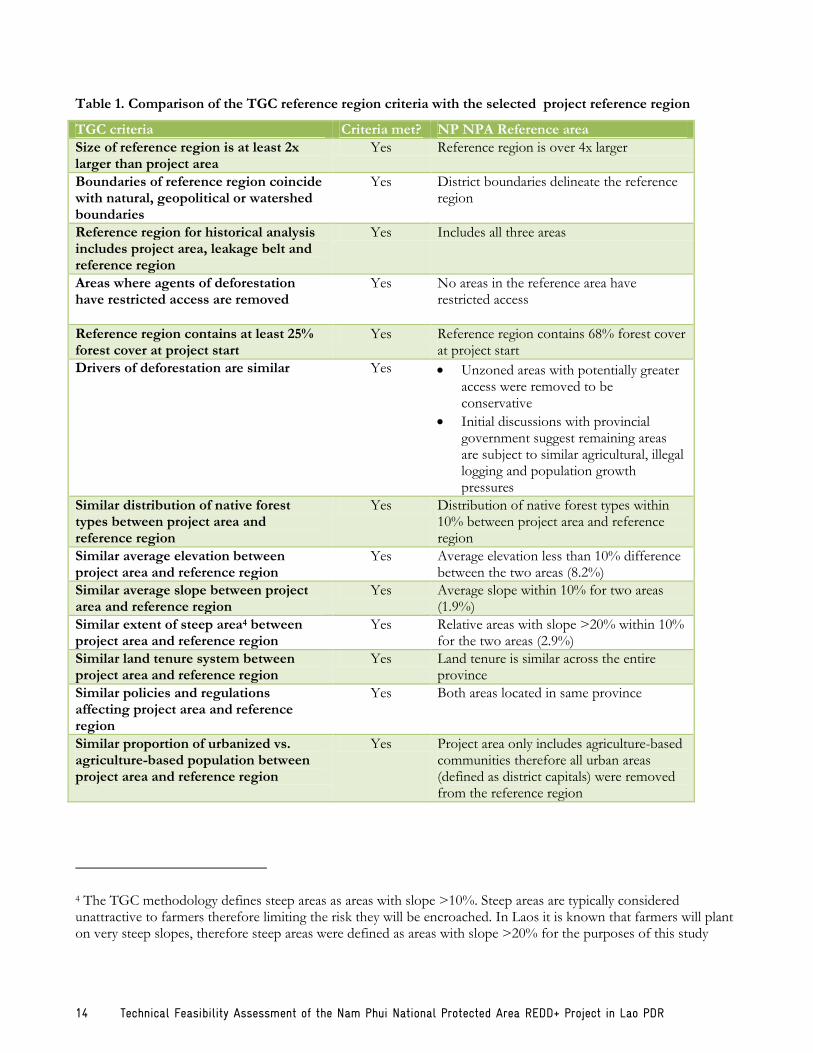
An analysis of all non-agricultural zoned areas within the two village boundaries as well as a 2km buffer
around the village and along 4km of the two roads leading out of Ban Navene identified approximately
6980 ha of non-forest area that would be eligible for ARR activities. It is upon these lands that the ARR
analysis was conducted.
Figure 5. Map of identified areas eligible for ARR activities
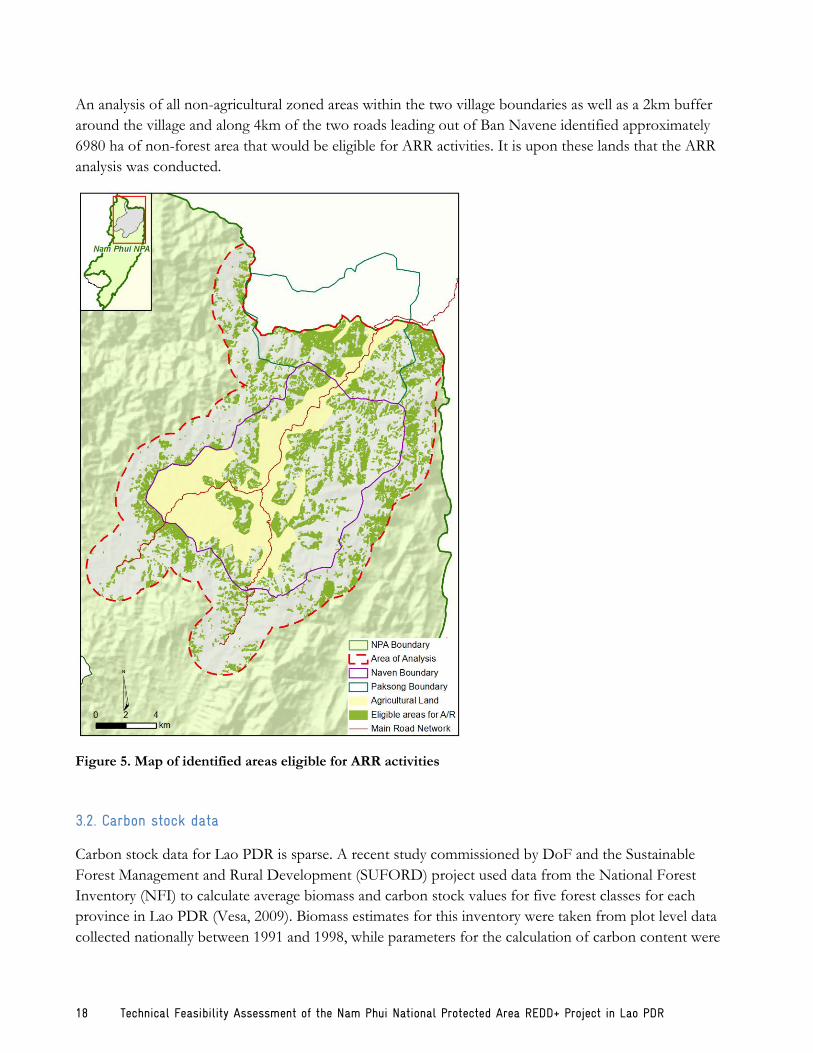
3.2. Carbon stock data
Carbon stock data for Lao PDR is sparse. A recent study commissioned by DoF and the Sustainable
Forest Management and Rural Development (SUFORD) project used data from the National Forest
Inventory (NFI) to calculate average biomass and carbon stock values for five forest classes for each
province in Lao PDR (Vesa, 2009). Biomass estimates for this inventory were taken from plot level data
collected nationally between 1991 and 1998, while parameters for the calculation of carbon content were
Technical Feasibility Assessment of the Nam Phui National Protected Area REDD+ Project in Lao PDR 19
taken from a single study in the Nam Leuk reservoir site (Sogreah, 1997). Although concerns may arise
about the accuracy of using a single study to derive biomass and carbon parameters, this is the only study
to investigate such variables that currently exists for Lao PDR. Sensitivity analyses in which the values are
substituted with default values from the IPCC‟s 2003 Good Practice Guidance for LULUCF show that the
Nam Leuk parameters produce a conservative estimate of carbon stocks, as shown below in Table 2.
Table 2. Comparison of parameters used in this study to IPPC default values
Parameter Sogreah 1997 IPCC
Biomass expansion factor 1.71 3.4
Root-to-shoot ratio 0.25 0.27
The above NFI data does not differentiate between carbon stocks in low or high density forests.
Inventories conducted by the SUFORD project on their production forest areas suggest that biomass
volumes for good forests (crown cover >70%) are twice as large as for degraded forests (crown cover 20 –
70%) (Dickinson, pers. comm.). The forest cover classification derived as part of this study for the NP
NPA in 1993 was used to estimate the amount of low and high density MDF that would have been present
at the time when the plot level data for Sayabouri province was collected (1992)6. This classification
resulted in approximately equal amounts of low and high density MDF (50% low, 50% high). Although it
is uncertain whether the forest composition in the NP NPA can be considered representative of the wider
province at this time, no other forest cover classifications that identifies low and high density MDF was
available. Knowing that each of the low and high density MDF contributed equally to the overall average
carbon stock value for MDF in Sayabouri province (101tC/ha) and that high density forests contain twice
as much biomass as low density forests, calculation of carbon stock values for these two different forest
classes was possible7.
In order to arrive at carbon stock estimates in the non-forest land classes (agricultural lands and unstocked
forest/degraded lands) a study by Kiyono et al. (2007) investigating chronosequential changes in carbon
stocks in regenerating fallows in northern Lao PDR was consulted. This study provides an equation to
estimate total biomass in a system based on the number of years since the last slash-and-burn event.
Agricultural lands are typically farmed on a three year cycle; therefore an average of two years was used to
estimate the biomass on these lands. For unstocked forest/degraded lands an average of six years was
assumed. For paddy fields and other types of non-forest land a carbon content of zero was assumed. Table
6 Only values for MDF were calculated as it was deemed that only this forest type was being affected by the agents of deforestation and degradation. Historical analysis showed very little change in the evergreen forest class.
7 Average C stock for MDF in Sayabouri province = 101tC/ha x = C content in low density MDF 2x = C content in high density MDF Low and high density MDF contribute each 50% to the average C stock value
0.5x + 0.5(2x) = 101tC/ha
1.5x = 101tC/ha
x = 67tC/ha = C content in low density MDF
20 Technical Feasibility Assessment of the Nam Phui National Protected Area REDD+ Project in Lao PDR
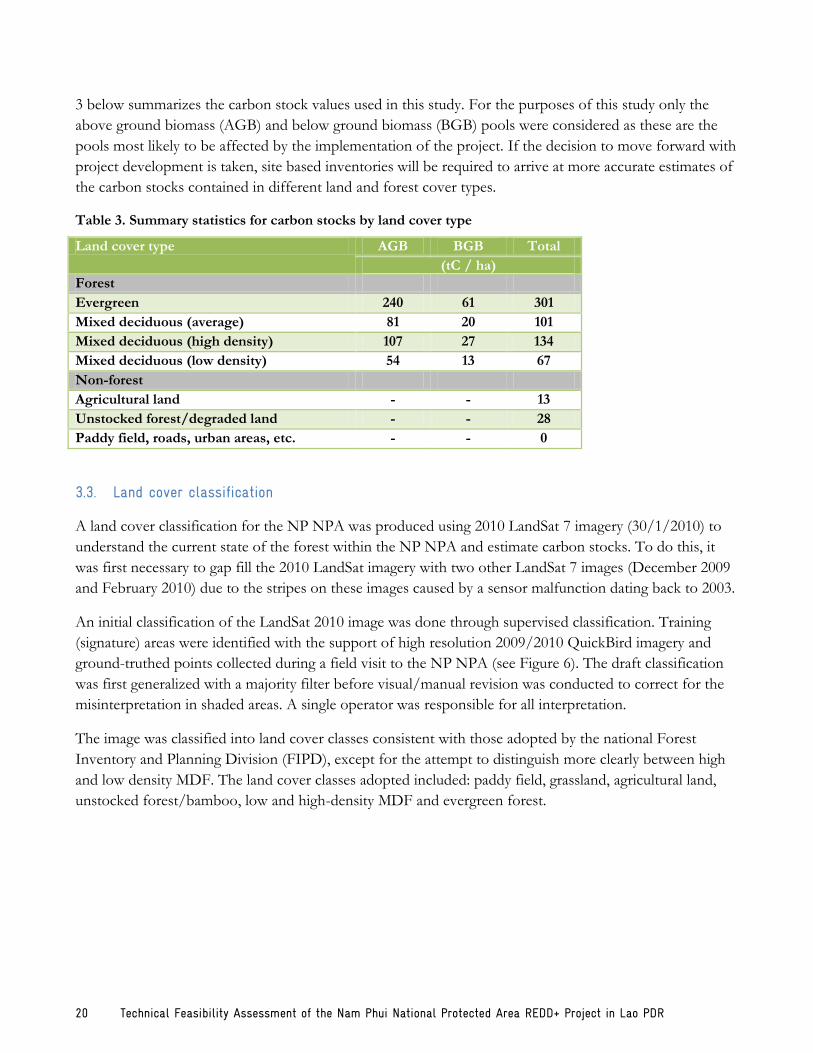
3 below summarizes the carbon stock values used in this study. For the purposes of this study only the
above ground biomass (AGB) and below ground biomass (BGB) pools were considered as these are the
pools most likely to be affected by the implementation of the project. If the decision to move forward with
project development is taken, site based inventories will be required to arrive at more accurate estimates of
the carbon stocks contained in different land and forest cover types.
Table 3. Summary statistics for carbon stocks by land cover type
Land cover type AGB BGB Total
(tC / ha)
Forest
Evergreen 240 61 301
Mixed deciduous (average) 81 20 101
Mixed deciduous (high density) 107 27 134
Mixed deciduous (low density) 54 13 67
Non-forest
Agricultural land - - 13
Unstocked forest/degraded land - - 28
Paddy field, roads, urban areas, etc. - - 0
3.3. Land cover classification
A land cover classification for the NP NPA was produced using 2010 LandSat 7 imagery (30/1/2010) to
understand the current state of the forest within the NP NPA and estimate carbon stocks. To do this, it
was first necessary to gap fill the 2010 LandSat imagery with two other LandSat 7 images (December 2009
and February 2010) due to the stripes on these images caused by a sensor malfunction dating back to 2003.
An initial classification of the LandSat 2010 image was done through supervised classification. Training
(signature) areas were identified with the support of high resolution 2009/2010 QuickBird imagery and
ground-truthed points collected during a field visit to the NP NPA (see Figure 6). The draft classification
was first generalized with a majority filter before visual/manual revision was conducted to correct for the
misinterpretation in shaded areas. A single operator was responsible for all interpretation.
The image was classified into land cover classes consistent with those adopted by the national Forest
Inventory and Planning Division (FIPD), except for the attempt to distinguish more clearly between high
and low density MDF. The land cover classes adopted included: paddy field, grassland, agricultural land,
unstocked forest/bamboo, low and high-density MDF and evergreen forest.

Technical Feasibility Assessment of the Nam Phui National Protected Area REDD+ Project in Lao PDR 21
Figure 6. Examples the of use of Quickbird imagery to classify land cover types on the LandSat imagery
The accuracy of the 2010 land cover classification was assessed by comparing a stratified random sample of
100 points with the high resolution 2009/2010 Quickbird imagery of the site. The results of this accuracy
assessment gave an overall accuracy of 64% and a Kappa statistic of 0.57. The reason for this low accuracy
was due to the difficulty distinguishing between the unstocked forest/bamboo class and the low and high
22 Technical Feasibility Assessment of the Nam Phui National Protected Area REDD+ Project in Lao PDR
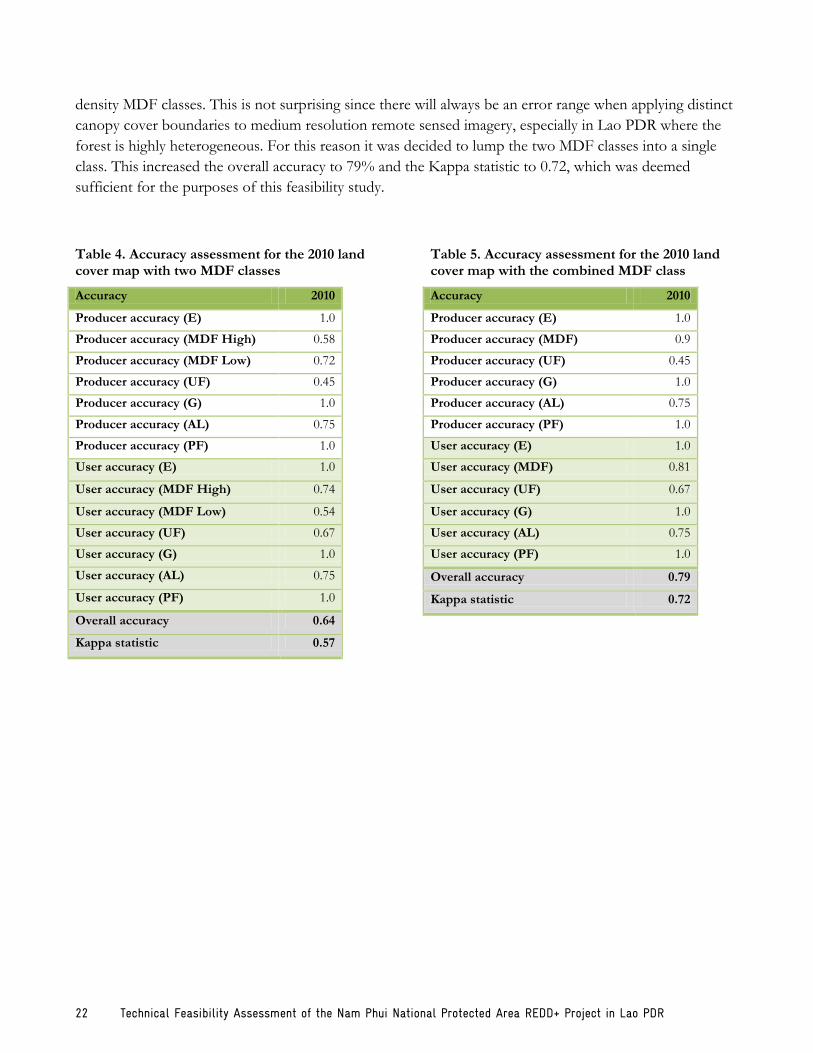
density MDF classes. This is not surprising since there will always be an error range when applying distinct
canopy cover boundaries to medium resolution remote sensed imagery, especially in Lao PDR where the
forest is highly heterogeneous. For this reason it was decided to lump the two MDF classes into a single
class. This increased the overall accuracy to 79% and the Kappa statistic to 0.72, which was deemed
sufficient for the purposes of this feasibility study.
Table 4. Accuracy assessment for the 2010 land cover map with two MDF classes
Accuracy 2010
Producer accuracy (E) 1.0
Producer accuracy (MDF High) 0.58
Producer accuracy (MDF Low) 0.72
Producer accuracy (UF) 0.45
Producer accuracy (G) 1.0
Producer accuracy (AL) 0.75
Producer accuracy (PF) 1.0
User accuracy (E) 1.0
User accuracy (MDF High) 0.74
User accuracy (MDF Low) 0.54
User accuracy (UF) 0.67
User accuracy (G) 1.0
User accuracy (AL) 0.75
User accuracy (PF) 1.0
Overall accuracy 0.64
Kappa statistic 0.57
Table 5. Accuracy assessment for the 2010 land cover map with the combined MDF class
Accuracy 2010
Producer accuracy (E) 1.0
Producer accuracy (MDF) 0.9
Producer accuracy (UF) 0.45
Producer accuracy (G) 1.0
Producer accuracy (AL) 0.75
Producer accuracy (PF) 1.0
User accuracy (E) 1.0
User accuracy (MDF) 0.81
User accuracy (UF) 0.67
User accuracy (G) 1.0
User accuracy (AL) 0.75
User accuracy (PF) 1.0
Overall accuracy 0.79
Kappa statistic 0.72
Technical Feasibility Assessment of the Nam Phui National Protected Area REDD+ Project in Lao PDR 23
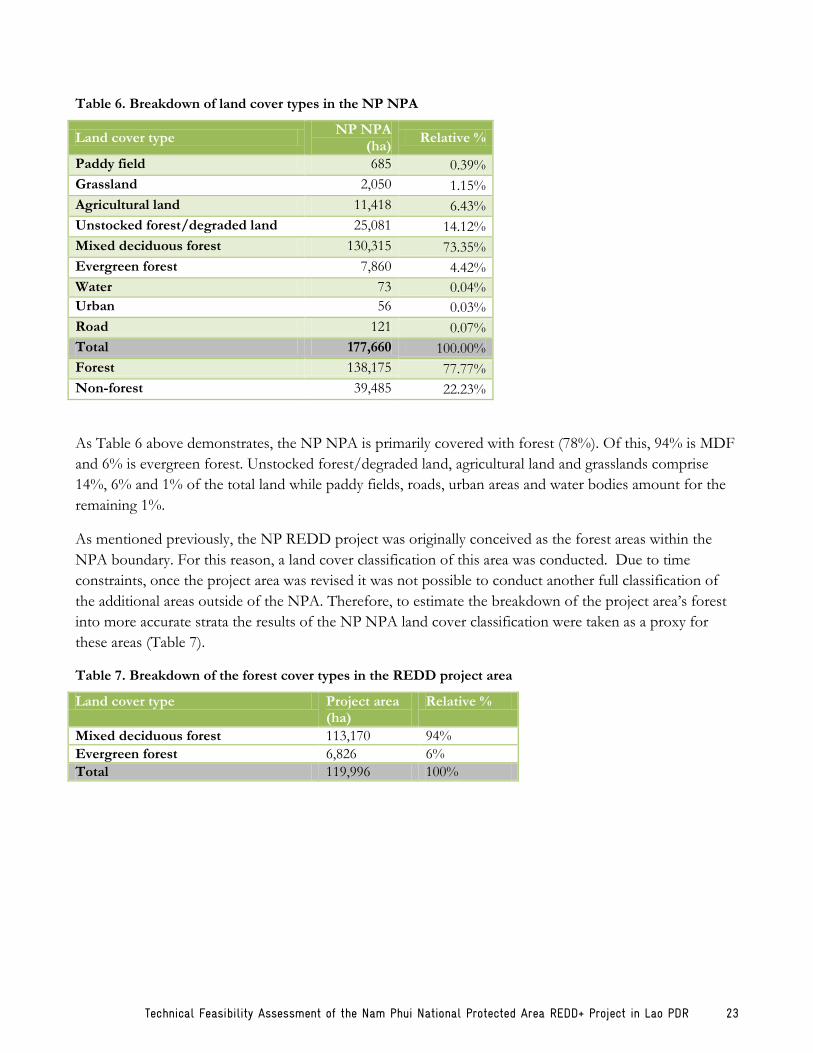
Table 6. Breakdown of land cover types in the NP NPA
Land cover type NP NPA
(ha) Relative %
Paddy field 685 0.39%
Grassland 2,050 1.15%
Agricultural land 11,418 6.43%
Unstocked forest/degraded land 25,081 14.12%
Mixed deciduous forest 130,315 73.35%
Evergreen forest 7,860 4.42%
Water 73 0.04%
Urban 56 0.03%
Road 121 0.07%
Total 177,660 100.00%
Forest 138,175 77.77%
Non-forest 39,485 22.23%
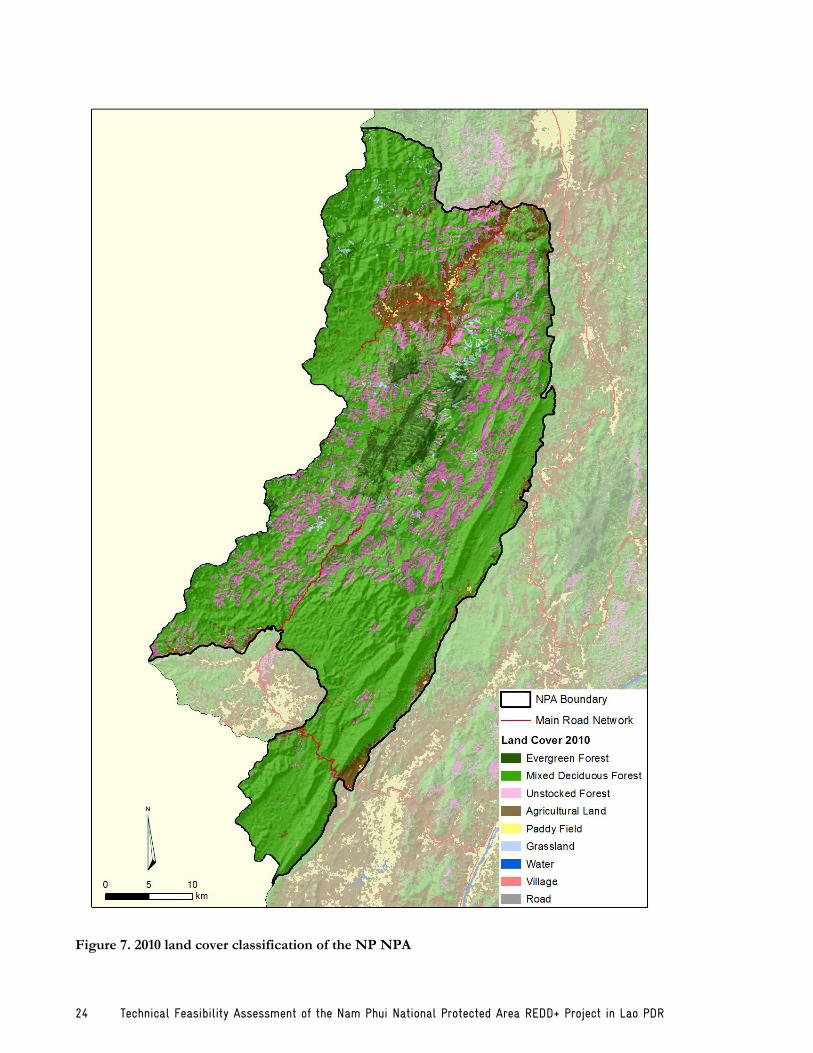
As Table 6 above demonstrates, the NP NPA is primarily covered with forest (78%). Of this, 94% is MDF
and 6% is evergreen forest. Unstocked forest/degraded land, agricultural land and grasslands comprise
14%, 6% and 1% of the total land while paddy fields, roads, urban areas and water bodies amount for the
remaining 1%.
As mentioned previously, the NP REDD project was originally conceived as the forest areas within the
NPA boundary. For this reason, a land cover classification of this area was conducted. Due to time
constraints, once the project area was revised it was not possible to conduct another full classification of
the additional areas outside of the NPA. Therefore, to estimate the breakdown of the project area‟s forest
into more accurate strata the results of the NP NPA land cover classification were taken as a proxy for
these areas (Table 7).
Table 7. Breakdown of the forest cover types in the REDD project area
Land cover type Project area (ha)
Relative %
Mixed deciduous forest 113,170 94%
Evergreen forest 6,826 6%
Total 119,996 100%
24 Technical Feasibility Assessment of the Nam Phui National Protected Area REDD+ Project in Lao PDR
Figure 7. 2010 land cover classification of the NP NPA
Technical Feasibility Assessment of the Nam Phui National Protected Area REDD+ Project in Lao PDR 25
3.4. Historical deforestation and degradation analysis
3.4.1. Deforestation and increased forest cover
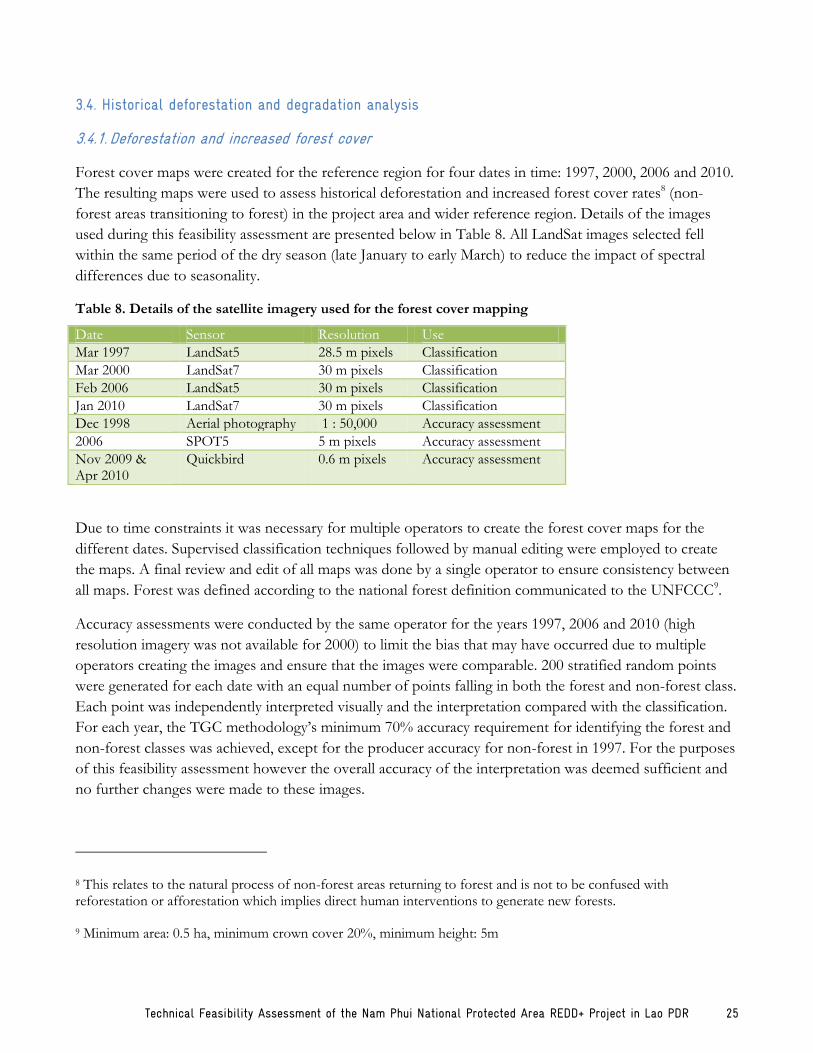
Forest cover maps were created for the reference region for four dates in time: 1997, 2000, 2006 and 2010.
The resulting maps were used to assess historical deforestation and increased forest cover rates8 (non-
forest areas transitioning to forest) in the project area and wider reference region. Details of the images
used during this feasibility assessment are presented below in Table 8. All LandSat images selected fell
within the same period of the dry season (late January to early March) to reduce the impact of spectral
differences due to seasonality.
Table 8. Details of the satellite imagery used for the forest cover mapping
Date Sensor Resolution Use
Mar 1997 LandSat5 28.5 m pixels Classification
Mar 2000 LandSat7 30 m pixels Classification
Feb 2006 LandSat5 30 m pixels Classification
Jan 2010 LandSat7 30 m pixels Classification
Dec 1998 Aerial photography 1 : 50,000 Accuracy assessment
2006 SPOT5 5 m pixels Accuracy assessment
Nov 2009 & Apr 2010
Quickbird 0.6 m pixels Accuracy assessment
Due to time constraints it was necessary for multiple operators to create the forest cover maps for the
different dates. Supervised classification techniques followed by manual editing were employed to create
the maps. A final review and edit of all maps was done by a single operator to ensure consistency between
all maps. Forest was defined according to the national forest definition communicated to the UNFCCC9.
Accuracy assessments were conducted by the same operator for the years 1997, 2006 and 2010 (high
resolution imagery was not available for 2000) to limit the bias that may have occurred due to multiple
operators creating the images and ensure that the images were comparable. 200 stratified random points
were generated for each date with an equal number of points falling in both the forest and non-forest class.
Each point was independently interpreted visually and the interpretation compared with the classification.
For each year, the TGC methodology‟s minimum 70% accuracy requirement for identifying the forest and
non-forest classes was achieved, except for the producer accuracy for non-forest in 1997. For the purposes
of this feasibility assessment however the overall accuracy of the interpretation was deemed sufficient and
no further changes were made to these images.
8 This relates to the natural process of non-forest areas returning to forest and is not to be confused with reforestation or afforestation which implies direct human interventions to generate new forests.
9 Minimum area: 0.5 ha, minimum crown cover 20%, minimum height: 5m

26 Technical Feasibility Assessment of the Nam Phui National Protected Area REDD+ Project in Lao PDR
Table 9. Accuracy assessment results for the forest cover maps
Accuracy 1997 2006 2010
Overall accuracy 0.80 0.82 0.88
Producer accuracy (F) 0.91 0.88 0.97
Producer accuracy (NF) 0.64 0.77 0.78
User accuracy (F) 0.79 0.78 0.81
User accuracy (NF) 0.83 0.87 0.96
Kappa statistic 0.57 0.64 0.75
By comparing the four forest cover classification years it was possible to calculate land cover change for
the three areas of analysis (project area, leakage belt and reference area) over three time periods. As can be
seen from Table 10, forest cover decreased in each of the three regions of analysis during each period,
clearly demonstrating that these forests are under threat. Forest loss was most acute in the leakage belt,
where forest cover decreased by 14% between 1997 and 2010. Over this same period, forest cover
decreased by 10% in both the reference area and project area.
Table 10. Forest cover for the three regions of analysis
Zone
Year
1997 2000 2006 2010
Area (ha)
% of total
Area (ha)
% of total
Area (ha)
% of total
Area (ha)
% of total
Project area
Forest 138,475 75% 135,124 73% 123,838 67% 120,543 65%
Non-forest 45,660 25% 49,011 27% 60,297 33% 63,593 35%
Leakage belt
Forest 64,270 84% 63,108 82% 58,649 76% 54,139 70%
Non-forest 12,624 16% 13,786 18% 18,245 24% 22,755 30%
Reference area
Forest 246,447 79% 236,697 76% 224,986 72% 215,288 69%
Non-forest 65,678 21% 75,428 24% 87,139 28% 96,837 31%
Reference region
Forest 449,192 78% 434,929 76% 407,473 71% 389,970 68%
Non-forest 123,963 22% 138,226 24% 165,682 29% 183,185 32%
As can be seen from Figure 8 and Figure 9 deforestation throughout the project area and reference region
exhibits a typically mosaic pattern. Deforestation occurs in many small patches primarily near established
settlements with no large tracts of land cleared during any one period. In the NP NPA, deforestation is
concentrated around the villages of Ban Navene and Ban Paksong. Outside of the NPA, deforestation is
most pronounced in the village areas to the east of the Phiang portion of the NPA. A limited amount of
increased forest cover also occurred in each of the three regions of analysis, implying that certain areas
have re-grown naturally. This is not unsurprising considering the nature of shifting agriculture practiced in
the region where agricultural fields can be left fallow for several years allowing tree species to re-grow.

Technical Feasibility Assessment of the Nam Phui National Protected Area REDD+ Project in Lao PDR 27
Figure 8. Location of deforestation in the reference region during the three periods of analysis
28 Technical Feasibility Assessment of the Nam Phui National Protected Area REDD+ Project in Lao PDR
Figure 9. Location of deforestation in the project area during the three periods of analysis

Technical Feasibility Assessment of the Nam Phui National Protected Area REDD+ Project in Lao PDR 29
Figure 10. Cumulative deforestation and reforestation between 1997 and 2010 for the project area
30 Technical Feasibility Assessment of the Nam Phui National Protected Area REDD+ Project in Lao PDR
Before calculating rates of deforestation and increased forest cover for each of the regions of analysis, it
was first necessary to decide how to treat areas that either temporarily regenerated or were temporarily
unstocked.
Temporary regeneration can occur in an area that was previously cleared for agriculture, left to regenerate
and then cleared again for agriculture. The length of time between these events will dictate whether the
eventual clearance is considered deforestation or whether this parcel of land will be classified as non-forest
during the period that it temporarily satisfies the forest definition. Similarly, a forest area may be degraded
to the extent that it does not meet the forest definition, however, it may quickly regenerate back to forest.
In this case, this area will be classified as temporarily unstocked rather than being considered as having
undergone deforestation and then shortly thereafter reforestation. Accurately representing these areas is
important as otherwise rates of deforestation and reforestation and corresponding changes in carbon
stocks will be overestimated.
This issue is particularly relevant to the Lao context due to both the rapid regeneration potential observed
in cleared forests and to the extensive use of shifting cultivation as a land use system employed in highland
areas. It is conceivable for an area of forest to be cleared, used for swidden agriculture, abandoned and
then allowed to regenerate in a very short space of time. In the context of further developing REDD+
projects within Lao PDR this definitional issue should be clarified at the central level in order to better
understand how these areas should be approached. For the purposes of this report, areas that reforested or
were deforested for only one time period were considered to be temporary and were therefore not included
in the overall calculations of increased forest cover or deforestation rates for the time period in question.
For example, if an area transitioned from forest in 1997 to non-forest in 2000 and then back to forest in
2006, the loss of forest in 2000 was not considered as deforestation but rather as being temporarily
unstocked. Similar reasoning was used to define temporary regeneration.
For the purposes of comparison, annual forest loss and gain was calculated as a percentage of the total land
cover at the start of the time period in question (Table 11 and Table 12). As the results show, annual
deforestation rates across the three regions of analysis were roughly similar, with the leakage belt
experiencing slightly higher rates of deforestation. Trends across the three periods of analysis were
however slightly different in all three regions. In the project area the deforestation rate was 0.91% for the
initial period, increased to 1.40% during the second period before decreasing to 0.70% for the final period.
Deforestation rates in the reference area showed the opposite trend to the project area. Here deforestation
rates started at 1.33%, decreased to 0.93% during the second period and then increased to 1.08% for the
final period. Deforestation rates in the leakage belt on the other hand increased for each of the three
periods of analysis. For the first period the deforestation rate was 0.60% before increasing to 1.22% and
1.94% over the second and third period.
Increased forest cover rates were very low in all of the three regions of analysis for all time periods.
Increased forest cover rates were highest during the first period but dropped off significantly to negligible
levels after this. For baseline calculation purposes, the average increased forest cover rate over the
historical period for the wider reference region was taken (0.16%).

Technical Feasibility Assessment of the Nam Phui National Protected Area REDD+ Project in Lao PDR 31
Table 11. Deforestation rates for the three regions of analysis
Year Location Forest cover (ha)
Forest loss (ha)
% Def. over period
Avg. annual loss (ha)
Avg. annual def. rate over period
Avg. historical def rate
1997 Project area 138,475
1.03%
2000 Project area 135,124 3,765 2.72% 1,255 0.91%
2006 Project area 123,838 11,372 8.42% 1,895 1.40%
2010 Project area 120,543 3,476 2.81% 869 0.70%
1997 Leakage belt 64,270
1.23%
2000 Leakage belt 63,108 1,155 1.80% 385 0.60%
2006 Leakage belt 58,649 4,607 7.30% 768 1.22%
2010 Leakage belt 54,139 4,549 7.76% 1,137 1.94%
1997 Reference area 246,447
1.02%
2000 Reference area 236,697 9,805 3.98% 3,268 1.33%
2006 Reference area 224,986 13,230 5.59% 2,205 0.93%
2010 Reference area 215,288 9,701 4.31% 2,425 1.08%
1997 Reference region 449,192
1.06%
2000 Reference region 434,929 14,726 3.28% 4,909 1.09%
2006 Reference region 407,473 29,209 6.72% 4,868 1.12%
2010 Reference region 389,970 17,725 4.35% 4,431 1.09%
Table 12. Increased forest cover rates for the three regions of analysis
Year Location Non-forest cover (ha)
Forest gain (ha)
% Ref. over period
Avg. annual gain (ha)
Avg. annual ref. rate over period
Avg. historical ref rate
1997 Project area 45,660
0.12%
2000 Project area 49,011 345 0.76% 115 0.25%
2006 Project area 60,297 179 0.37% 30 0.06%
2010 Project area 63,593 184 0.30% 46 0.08%
1997 Leakage belt 12,624
0.12%
2000 Leakage belt 13,786 75 0.59% 25 0.20%
2006 Leakage belt 18,245 78 0.57% 13 0.09%
2010 Leakage belt 22,755 51 0.28% 13 0.07%
1997 Reference area 65,678
0.20%
2000 Reference area 75,428 704 1.07% 235 0.36%
2006 Reference area 87,139 752 1.00% 125 0.17%
2010 Reference area 96,837 211 0.24% 53 0.06%
1997 Reference region 123,963
0.16%
2000 Reference region 138,226 1,123 0.91% 374 0.30%
2006 Reference region 165,682 1,010 0.73% 168 0.12%
2010 Reference region 183,185 446 0.27% 112 0.07%
32 Technical Feasibility Assessment of the Nam Phui National Protected Area REDD+ Project in Lao PDR
According to the TGC methodology, deforestation and increased forest cover rates for the first baseline
crediting period are determined from the wider reference region. Deforestation rates for this wider region
exhibits an overall steady rate for the three periods of analysis at 1.09%, 1.12% and 1.09%.
The TGC methodology requires that regression analysis be conducted on the historical results if these
show either an increasing or decreasing trend. In cases where the historical deforestation trend is stable, as
with this project, then the historical rate is simply projected into the future. In this case, the wider reference
region‟s baseline deforestation rate would equate to the average historical deforestation rate: 4,743 ha/yr.
To calculate the amount of deforestation expected to occur in the project area, the methodology requires
that the overall projected rate of deforestation in the reference region be multiplied by the ratio of the area
of forest inside the project area to the area of forest in the reference region. This provides the relative
amount of deforestation expected to occur in the project area. This is summarized in the formula below
(adapted from the TGC methodology). According to this approach, the baseline rate of deforestation for
the project area would be 1,459 ha/yr.
where:
= Baseline deforestation rate in the project area (ha/yr)
= Baseline deforestation rate in the reference region (ha/yr)
= Size of project area (forest only) (ha)
= Size of forest area in reference region at project start
= Time since project start
The baseline deforestation rate is further refined by multiplying the calculated project area deforestation
rate by a forest scarcity factor. The forest scarcity factor relates to the fact that deforestation rates will
decrease over time as less forest is available to deforest. In this regard, the initial 1,459 ha/yr rate would
decrease over time. While not a step conducted for this feasibility study, calculating the project‟s specific
forest scarcity factor will be an important step that will need to be undertaken during project development.
3.4.2. Degradation and regeneration
To assess historical degradation and regeneration rates the TGC methodology requires that accurate land
cover maps identifying various forest strata (minimum accuracy of 70%) be produced for multiple
historical dates. A comparison of these maps permits one to assess how much forest transitioned between
different strata and therefore rates of degradation and regeneration. Within the timeframe of this feasibility
study it was not possible to follow the TGC‟s approach for assessing degradation and regeneration. Pixel-
by-pixel manual editing of LandSat imagery is very time consuming and producing land cover maps of the
entire reference region for four dates would have required more time than available for this study.

Technical Feasibility Assessment of the Nam Phui National Protected Area REDD+ Project in Lao PDR 33
Within the context of this study it was only possible to produce a land cover map of the NP NPA for 2010
(see section 3.3). Nevertheless, even for this map it was not possible to achieve the 70% minimal accuracy
required by the TGC methodology when attempting to distinguish between the high and low density MDF
class (see Table 4). Instead, the MDF class was lumped into a single stratum in order to achieve a sufficient
level of accuracy (see Table 5). This suggests that satisfying the methodological accuracy requirement will
be extremely challenging and time consuming for this project. In fact, if the accuracy cannot be achieved
then the project will not be able to account for emission reductions from degradation and regeneration.
Nevertheless, a historical change analysis of the NP NPA was done for the years 1993-2000, 2000-2006
and 2006-2010 to arrive at an indicative estimate of historical rates of degradation and regeneration.
Although the change analysis was done for the entire NPA only the results for the Phiang portion of the
NPA was used. This part of the NPA is part of the REDD project area and also the most representative of
the wider project area. The results of this analysis were therefore taken as a proxy for the actual REDD
project area. Although the techniques used to assess degradation do not correspond with the TGC
methodological approach, the below analysis provides an initial estimate of the extent to which the project
area might be affected by degradation.
To do this, the same LandSat images for 2000, 2006 and 2010 were used as above. Additionally, a LandSat
5 image from December 1993 was selected. The starting point for the change analysis was the 2010 land
cover classification that tried to distinguish between low and high density MDF. Although this image
achieved a relatively low overall accuracy (64%) it was the only available source of data that distinguishes
between the different forest strata.
Two different techniques were used to identify the changes between image pairs. The first was to conduct
an unsupervised classification on a pair of stacked images (the seven bands in each image are stacked into
the same image). In this way, areas that change in spectral signature can be identified. The second
technique was to use the normalized burn ratio (NBR) index, which like the normalized difference
vegetation index (NDVI), can be used to identify the degree of vegetative cover in a location. NBR was
chosen instead of NDVI as it is less affected by topography and shade. Losses and gains in vegetation were
identified by assessing the difference in NBR for two dates.
Changes between the 2006 and 2010 image were identified using the techniques mentioned above and
these areas in the 2006 image assessed with NBR. For example, the change analysis might indicate that
there had been a loss of vegetation in an area between 2006 and 2010. If the 2010 classification identified
this area as unstocked forest and the NBR showed a high level of vegetation for 2006 it was reasonable to
assume that in 2006 this area was good forest. The 2006 classification was then updated to include these
changes, resulting in a new forest cover classification for this year. The same techniques were then used to
compare the 2000/2006 and 1993/2000 images, resulting in land cover classifications for each year.
Provided below in Table 13 are examples of how these changes were interpreted to arrive at a new
classification for each year.

34 Technical Feasibility Assessment of the Nam Phui National Protected Area REDD+ Project in Lao PDR
Table 13. Example assumptions made during the interpretation of the change analysis for paired images
Year n+1 land cover Trend Year n NBR Year n land cover
Unstocked forest Gain Low Non forest
Unstocked forest Loss High Good forest
Good forest Gain Good Degraded forest
Attempts were made to be as systematic as possible when interpreting the change to limit the introduction
of bias into the new classifications. However, it should be noted that any errors in interpretation from the
first change analysis (2006/2010) will be carried through to subsequent image pairs and would affect the
overall accuracy. Nonetheless, within the time constraints of this study it was felt that this approach
provided the best first estimate of how degradation has impacted the NPA historically.
Once new land cover classifications were generated for each year it was possible to calculate the amount of
area in each land cover class and overall rates of degradation in the Phiang portion of the NP NPA.
Table 14. Breakdown of land cover areas in the Phiang portion of the NP NPA as calculated from the change analysis
Land cover Area (ha)
1993 2000 2006 2010
Paddy field 209 442 482 556
Grassland 1,613 1,610 1,598 1,590
Agricultural land 3,392 5,887 7,019 8,472
Unstocked/bamboo 14,024 13,931 15,643 15,289
Low density MDF 28,745 29,619 30,524 31,575
High density MDF 41,082 37,538 33,744 31,502
Evergreen forest 7,055 7,077 7,064 7,052
Water 10 23 23 22
Urban 10 14 45 56
Road - - - 26
Total 96,141 96,141 96,141 96,141
Non-forest 19,259 21,907 24,809 26,012
Forest 76,882 74,234 71,332 70,129
The results in Table 14 show some clear trends over time. The evergreen forest class experienced virtually
no change over the historical period suggesting this forest type has not historically been an area at risk. The
high density MDF class decreased by 23% over the 1993 – 2010 period, from 41,082 ha to 31,502 ha. This
is likely due to both deforestation and degradation. The low density MDF class increased 10% from 28,745
ha to 31,575 ha, a likely indicator that the high density MDF class is undergoing a process of degradation.
Concurrently, agricultural land and paddy fields increased by 150% and 167% respectively during this same
period, as the total overall forest area decreased.
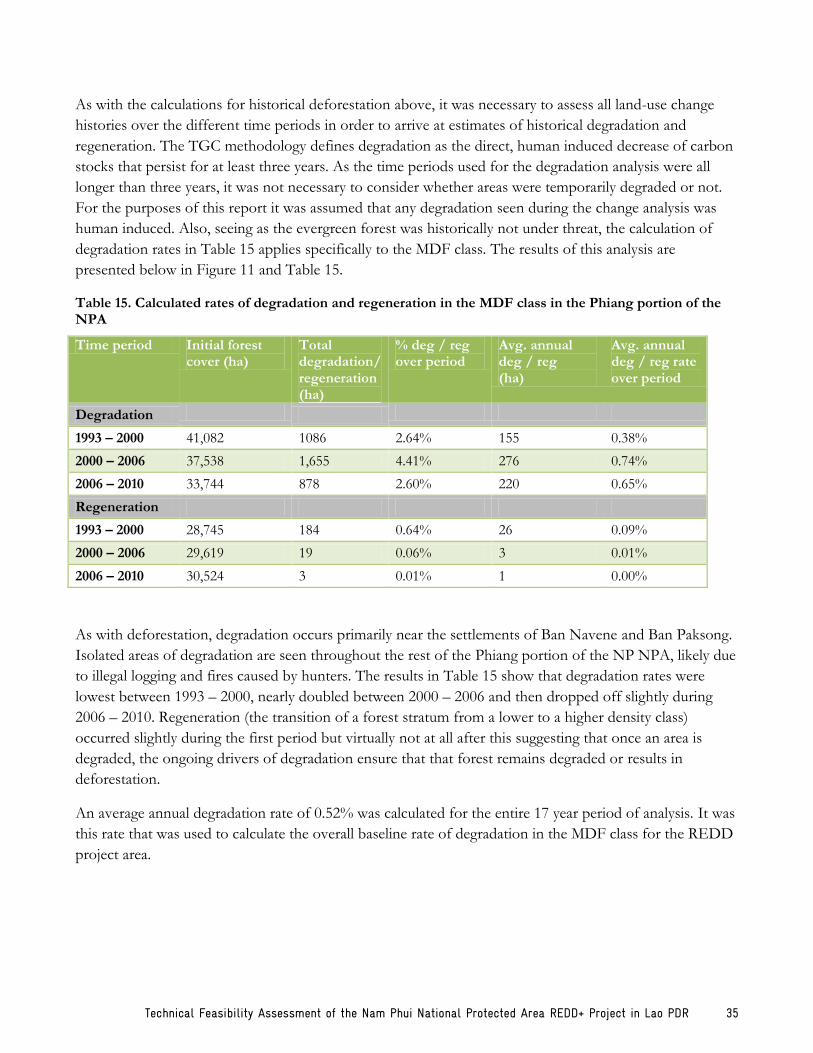
Technical Feasibility Assessment of the Nam Phui National Protected Area REDD+ Project in Lao PDR 35
As with the calculations for historical deforestation above, it was necessary to assess all land-use change
histories over the different time periods in order to arrive at estimates of historical degradation and
regeneration. The TGC methodology defines degradation as the direct, human induced decrease of carbon
stocks that persist for at least three years. As the time periods used for the degradation analysis were all
longer than three years, it was not necessary to consider whether areas were temporarily degraded or not.
For the purposes of this report it was assumed that any degradation seen during the change analysis was
human induced. Also, seeing as the evergreen forest was historically not under threat, the calculation of
degradation rates in Table 15 applies specifically to the MDF class. The results of this analysis are
presented below in Figure 11 and Table 15.
Table 15. Calculated rates of degradation and regeneration in the MDF class in the Phiang portion of the NPA
Time period Initial forest cover (ha)
Total degradation/ regeneration (ha)
% deg / reg over period
Avg. annual deg / reg (ha)
Avg. annual deg / reg rate over period
Degradation
1993 – 2000 41,082 1086 2.64% 155 0.38%
2000 – 2006 37,538 1,655 4.41% 276 0.74%
2006 – 2010 33,744 878 2.60% 220 0.65%
Regeneration
1993 – 2000 28,745 184 0.64% 26 0.09%
2000 – 2006 29,619 19 0.06% 3 0.01%
2006 – 2010 30,524 3 0.01% 1 0.00%
As with deforestation, degradation occurs primarily near the settlements of Ban Navene and Ban Paksong.
Isolated areas of degradation are seen throughout the rest of the Phiang portion of the NP NPA, likely due
to illegal logging and fires caused by hunters. The results in Table 15 show that degradation rates were
lowest between 1993 – 2000, nearly doubled between 2000 – 2006 and then dropped off slightly during
2006 – 2010. Regeneration (the transition of a forest stratum from a lower to a higher density class)
occurred slightly during the first period but virtually not at all after this suggesting that once an area is
degraded, the ongoing drivers of degradation ensure that that forest remains degraded or results in
deforestation.
An average annual degradation rate of 0.52% was calculated for the entire 17 year period of analysis. It was
this rate that was used to calculate the overall baseline rate of degradation in the MDF class for the REDD
project area.

36 Technical Feasibility Assessment of the Nam Phui National Protected Area REDD+ Project in Lao PDR
Figure 11. Location of degradation and regeneration within the Phiang portion of the NP NPA for the three periods of analysis
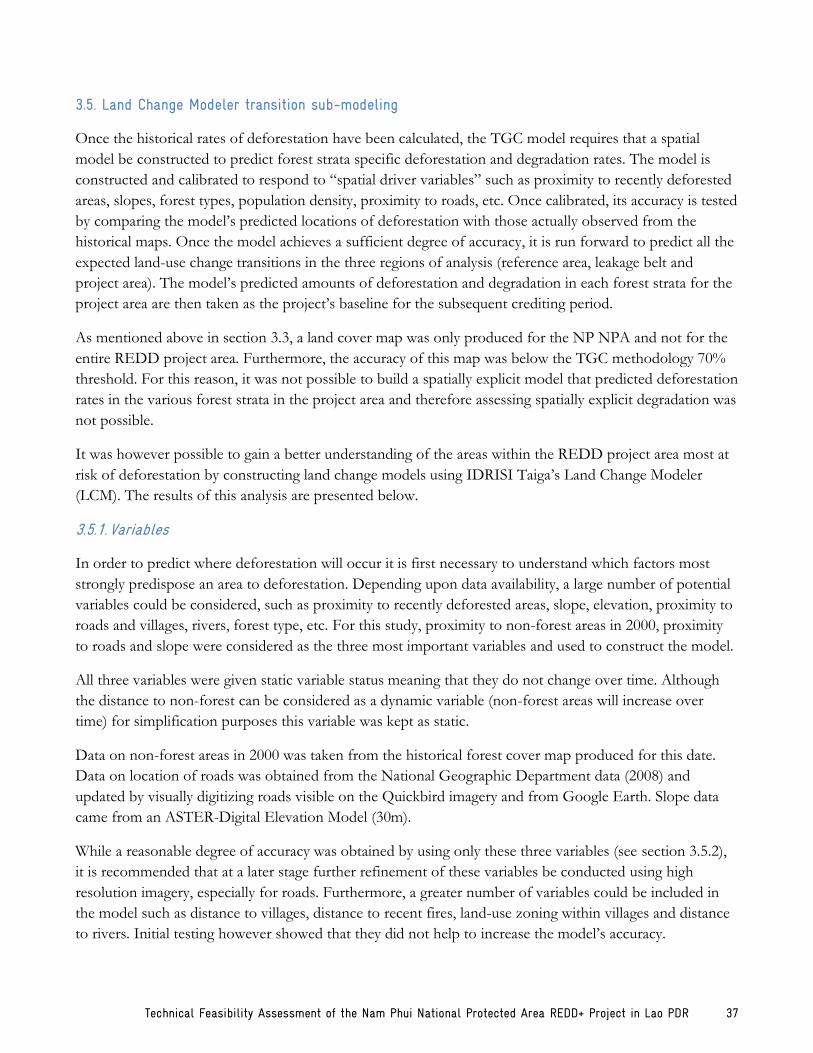
Technical Feasibility Assessment of the Nam Phui National Protected Area REDD+ Project in Lao PDR 37
3.5. Land Change Modeler transition sub-modeling
Once the historical rates of deforestation have been calculated, the TGC model requires that a spatial
model be constructed to predict forest strata specific deforestation and degradation rates. The model is
constructed and calibrated to respond to “spatial driver variables” such as proximity to recently deforested
areas, slopes, forest types, population density, proximity to roads, etc. Once calibrated, its accuracy is tested
by comparing the model‟s predicted locations of deforestation with those actually observed from the
historical maps. Once the model achieves a sufficient degree of accuracy, it is run forward to predict all the
expected land-use change transitions in the three regions of analysis (reference area, leakage belt and
project area). The model‟s predicted amounts of deforestation and degradation in each forest strata for the
project area are then taken as the project‟s baseline for the subsequent crediting period.
As mentioned above in section 3.3, a land cover map was only produced for the NP NPA and not for the
entire REDD project area. Furthermore, the accuracy of this map was below the TGC methodology 70%
threshold. For this reason, it was not possible to build a spatially explicit model that predicted deforestation
rates in the various forest strata in the project area and therefore assessing spatially explicit degradation was
not possible.
It was however possible to gain a better understanding of the areas within the REDD project area most at
risk of deforestation by constructing land change models using IDRISI Taiga‟s Land Change Modeler
(LCM). The results of this analysis are presented below.
3.5.1. Variables
In order to predict where deforestation will occur it is first necessary to understand which factors most
strongly predispose an area to deforestation. Depending upon data availability, a large number of potential
variables could be considered, such as proximity to recently deforested areas, slope, elevation, proximity to
roads and villages, rivers, forest type, etc. For this study, proximity to non-forest areas in 2000, proximity
to roads and slope were considered as the three most important variables and used to construct the model.
All three variables were given static variable status meaning that they do not change over time. Although
the distance to non-forest can be considered as a dynamic variable (non-forest areas will increase over
time) for simplification purposes this variable was kept as static.
Data on non-forest areas in 2000 was taken from the historical forest cover map produced for this date.
Data on location of roads was obtained from the National Geographic Department data (2008) and
updated by visually digitizing roads visible on the Quickbird imagery and from Google Earth. Slope data
came from an ASTER-Digital Elevation Model (30m).
While a reasonable degree of accuracy was obtained by using only these three variables (see section 3.5.2),
it is recommended that at a later stage further refinement of these variables be conducted using high
resolution imagery, especially for roads. Furthermore, a greater number of variables could be included in
the model such as distance to villages, distance to recent fires, land-use zoning within villages and distance
to rivers. Initial testing however showed that they did not help to increase the model‟s accuracy.

38 Technical Feasibility Assessment of the Nam Phui National Protected Area REDD+ Project in Lao PDR
3.5.2. Transition sub-modelling
Once the individual driver layers are produced it is possible to combine these in LCM into one composite
transition sub-model map (Figure 15 and Figure 19). These maps illustrate the likelihood of any one pixel
in the three areas of analysis to be deforested. The transition sub-model can be derived by using either
logistic regression or a Multi-Layer Perceptron (MLP) neural network. The LCM software strongly
recommends using MLP due to its ability to better predict locations of deforestation and therefore was
used.
The transition sub-model was created using the variables described above across the 2000 – 2006 period.
While the model could have been created over the 1997 – 2000 period, the 2000 – 2006 period was
considered more representative of the current deforestation trends. Furthermore, using this period allowed
for a subsequent time period against which the model could be validated (2006 – 2010).
Two models were generated, one for the reference region and one for the project area. Both models
reached an acceptable level of accuracy: 76% and 81% respectively for the reference region and project
area.
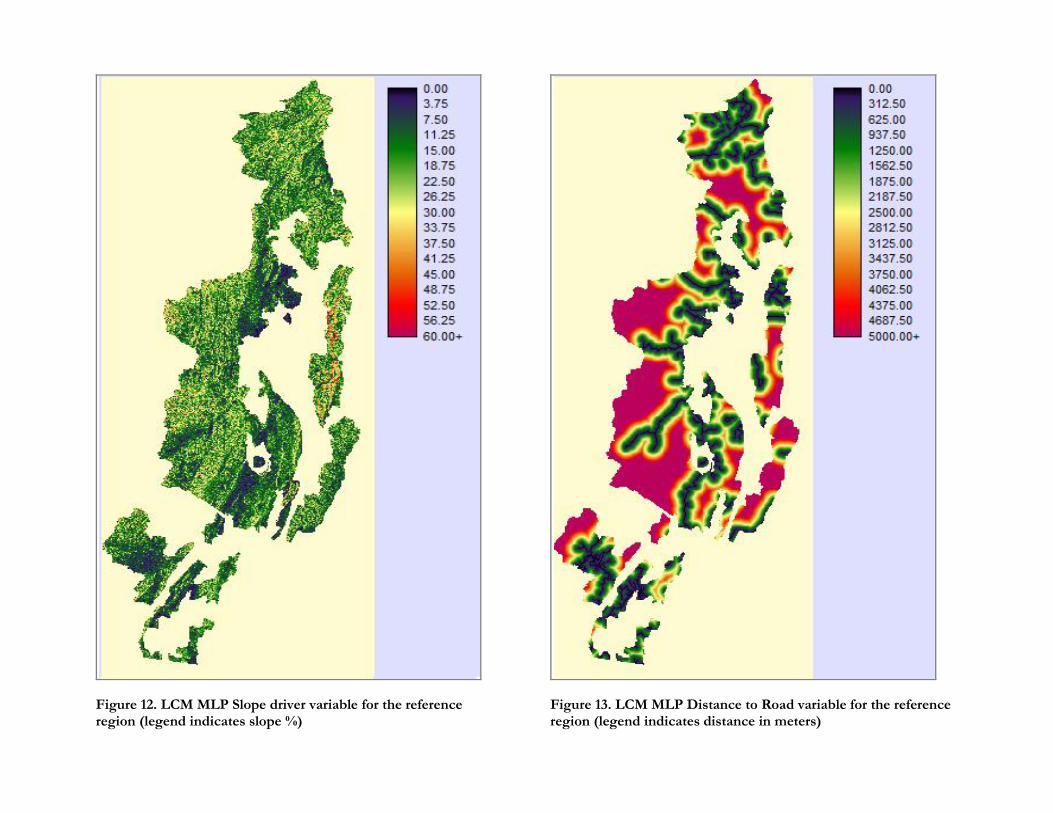
Figure 12. LCM MLP Slope driver variable for the reference region (legend indicates slope %)
Figure 13. LCM MLP Distance to Road variable for the reference region (legend indicates distance in meters)
Figure 14. LCM MLP Distance to Non-Forest in 2000 variable for the reference region (legend indicates distance in meters)
Figure 15. Composite transition potential driver map of the reference region

Figure 16. LCM MLP Slope driver variable for the project area (legend indicates slope %)
Figure 17. LCM MLP Distance to Roads driver variable (legend indicates distance in meters)
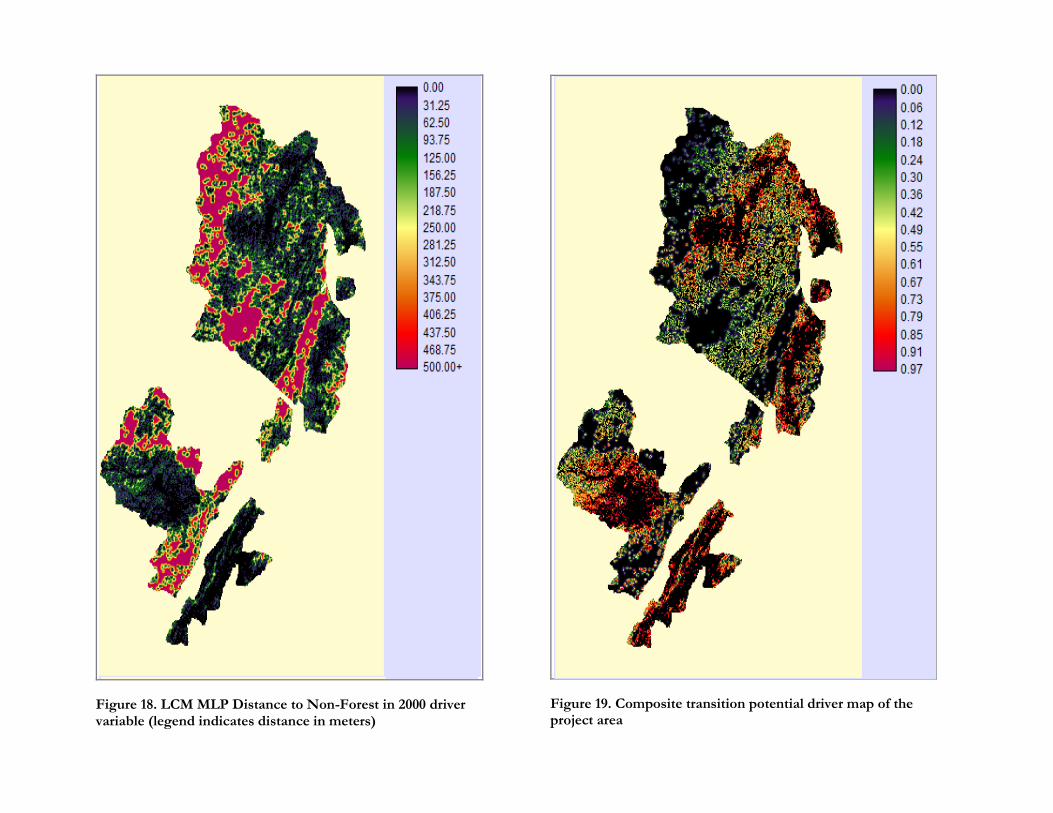
Figure 18. LCM MLP Distance to Non-Forest in 2000 driver variable (legend indicates distance in meters)
Figure 19. Composite transition potential driver map of the project area

Technical Feasibility Assessment of the Nam Phui National Protected Area REDD+ Project in Lao PDR 43
3.5.3. Validation results
The two models were calibrated over the 2000 – 2006 period and validated against the 2010 reference year.
This was done by running the model from 2006 – 2010 and comparing the results with the actual forest
cover map from 2010. The comparison was done by cross tabulating each predicted pixel with each pixel
from the actual land cover map. From this a kappa statistic was computed to assess the accuracy of the
prediction. The reference region and project area models achieved kappa statistics of 0.96 and 0.98,
meaning the models were 96% and 98% better at predicting deforestation than by chance alone.
The model had a tendency to overestimate deforestation in flat areas, close to roads. This is unsurprising
considering the driver variables used to construct the model. This overestimation is possibly due to these
forest areas actually being zoned as either protection or conservation areas within village land-use plans and
therefore under less threat than the model predicts. A better understanding of land-use zoning in these
village areas could therefore be included as driver at a future date once this information becomes available.
It should be noted that LCM models are useful for predicting deforestation in the immediate years after the
reference year (in this case 2010). Beyond approximately 10 years the model will be less accurate as during
this time several additional factors will come into play that will likely affect the baseline scenario. It will
therefore be necessary to revalidate the model with the VCS during the project monitoring period.
Figure 20. Actual (left) and LCM predicted (right) forest cover for 2010 in the project area.

44 Technical Feasibility Assessment of the Nam Phui National Protected Area REDD+ Project in Lao PDR
Figure 21. Actual (left) and LCM predicted (right) forest cover in 2010 for the reference region

Technical Feasibility Assessment of the Nam Phui National Protected Area REDD+ Project in Lao PDR 45
3.5.4. Baseline deforestation
For both the reference region and project area, deforestation was simulated for the years 2015, 2020 and
2025. It was decided to model the results up until 2025 as this would cover the initial seven year period
during which the CliPAD project will support the NP REDD project, as well as an eight year period after
financial and technical support is withdrawn. Furthermore, in both cases, the model was adjusted to ensure
that the deforestation rate in the first year matched the predicted deforestation rate according to the TGC
methodology. The losses per each five year period were assumed to be constant and applied evenly to each
year within the period.
For the reference region, the model predicted an average annual deforestation rate of 1.19% which is
slightly higher than the historical annual deforestation rate of 1.06%. However, this corresponds to an
average annual loss of 4,360 ha/yr, which is lower than the 4,743 ha/yr predicted under the TGC
approach.
Consistent with the historical locations of deforestation, the model predicted that future deforestation
would continue to occur in a patchwork mosaic fashion, close to settlements and with no large single tracts
of land being lost.
Table 16. LCM predicted deforestation for the reference region
Year Forest cover (ha) Area deforested (ha) Deforestation rate (% of initial forest area)
2010 389,969
2011 385,340 4,629 1.19%
2012 380,711 4,629 1.19%
2013 376,082 4,629 1.19%
2014 371,453 4,629 1.19%
2015 366,824 4,629 1.19%
2016 362,472 4,352 1.19%
2017 358,120 4,352 1.19%
2018 353,768 4,352 1.19%
2019 349,416 4,352 1.19%
2020 345,064 4,352 1.19%
2021 340,964 4,099 1.19%
2022 336,865 4,099 1.19%
2023 332,766 4,099 1.19%
2024 328,666 4,099 1.19%
2025 324,567 4,099 1.19%
Total 65,402
Avg. 4,360 1.19%

Figure 22. LCM predicted forest cover for 2015 (left), 2020 (middle) and 2025 (right) for the reference area

Technical Feasibility Assessment of Nam Phui National Protected Area REDD+ Project in Lao PDR 47
For the project area, the model predicted an average annual deforestation rate of 1.18% which is again
slightly higher than the historical annual deforestation rate of 1.03%. This corresponds to an average
annual loss of 1,342 ha/yr, which is lower than the 1,459 ha/yr predicted under the TGC approach. As
with the reference region, this is more conservative and possibly reflects the decrease that would have
occurred if the forest scarcity principle had been taken into account. For this reason, the model‟s output
was taken as the data for the baseline deforestation rates. These rates are presented in Table 17.
Once again, the model‟s predictions are consistent with the deforestation trends observed historically in the
project area. Deforestation occurs in a mosaic pattern and is concentrated around the villages of Ban
Navene, Ban Paksong and the villages to the east of the Phiang portion of the NPA.
Table 17. LCM predicted deforestation for the project area
Year Forest cover (ha) Area deforested (ha) Deforestation rate (% of initial forest area)
2010 120,531
2011 119,105 1,426 1.18%
2012 117,678 1,426 1.18%
2013 116,252 1,426 1.18%
2014 114,825 1,426 1.18%
2015 113,399 1,426 1.18%
2016 112,059 1,340 1.18%
2017 110,719 1,340 1.18%
2018 109,380 1,340 1.18%
2019 108,040 1,340 1.18%
2020 106,700 1,340 1.18%
2021 105,440 1,261 1.18%
2022 104,179 1,261 1.18%
2023 102,918 1,261 1.18%
2024 101,658 1,261 1.18%
2025 100,397 1,261 1.18%
Total 20,134
Avg. 1,342 1.18%

Figure 23. LCM predicted forest cover for 2015 (left), 2020 (middle) and 2025 (right) for the project area
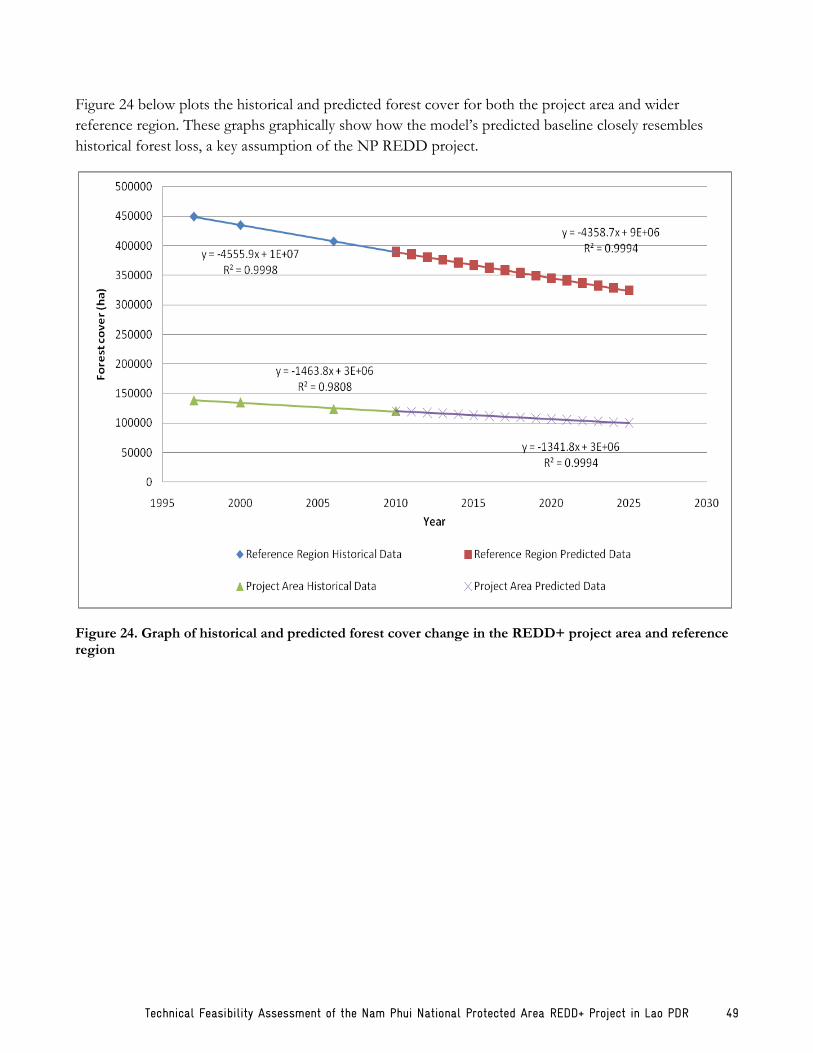
Technical Feasibility Assessment of the Nam Phui National Protected Area REDD+ Project in Lao PDR 49
Figure 24 below plots the historical and predicted forest cover for both the project area and wider
reference region. These graphs graphically show how the model‟s predicted baseline closely resembles
historical forest loss, a key assumption of the NP REDD project.
Figure 24. Graph of historical and predicted forest cover change in the REDD+ project area and reference region

50 Technical Feasibility Assessment of the Nam Phui National Protected Area REDD+ Project in Lao PDR
4. REDD Analysis
The following section analyzes the credit and carbon finance potential of the NP REDD project. This
includes the development of a baseline scenario and calculation of its associated emissions, the
construction of a project scenario and calculation of its emission reduction potential, and an assessment of
the overall credit and revenue generating potential of the project activities.
4.1. Baseline
4.1.1. Description of deforestation and degradation drivers
The success of any REDD project lies in its ability to effectively prevent forest loss and degradation. To do
so, it is first necessary to understand the main drivers of deforestation and forest degradation within the
local context so that appropriate activities and incentives can be targeted in such a way to reduce the
decline of forest carbon stocks. Furthermore, an understanding of these agents and drivers helps construct
future land-use change scenarios against which the emission reduction potential of various REDD
activities can be calculated.
Presented below are the main deforestation and degradation drivers currently affecting the NP NPA and
the surrounding villages.
Transition to commercial agriculture – The past five years have seen a noticeable increase in the
amount of area dedicated to cash-crops; mostly corn and Job‟s tears (Coix lacryma-jobi), but also a limited
amount of rubber, sesame and okra. Government policy promoting this crop as well as the market demand
for these crops and the consequent increase in household income were the main reasons given for this
transition.
The transition to commercial agriculture has had noticeable effects on land-use. These crops require
greater amounts of land than upland rice, the primary crop they have replaced, obtained primarily by
requesting permission from DAFOs to expand into village forest areas. In some cases, due to the limited
capacity of local DAFOs to enforce land expansion, this has also occurred illegally outside of village
allocated boundaries.
Cash crops, in particular maize, are more nutrient demanding on the soil than upland rice and all villages
reported a decrease in yields and increase in soil erosion since their introduction. This loss of fertility has
been compounded by farmers choosing to plant cash-crops on an annual basis, therefore negating fields a
fallow period and the opportunity to regain fertility. Further exacerbating this problem is the recent trend
for farmers to purchase tractors through installment payments. Tractor use further degrades soils and
reduces yields, requiring farmers to either increase their input costs or clear increasing amounts of land to
meet their installment payments. Therefore, in many cases, the introduction of tractors has had the
unintended effect of increasing land pressure, increasing input costs and decreasing yields, all of which
ultimately lead to greater poverty in the long term.

Technical Feasibility Assessment of the Nam Phui National Protected Area REDD+ Project in Lao PDR 51
The promotion of cash-crops has been identified as the economic development priority for all of
Thongmixai district as well as the village of Ban Paksong (for Ban Navene livestock rearing is the primary
priority followed by cash crops). Although local government staff expect to achieve this through an
increase in soil fertility and therefore yields, past experiences promoting alternative farming techniques
have been implemented with little success. Considering the ongoing lack of financial resources at
government level it is likely that implementation of this strategy will simply lead to increased amounts of
area under cash crop cultivation rather than the adoption of alternative farming practices.
Land-use planning - All the villages visited had some form of land-use planning conducted between 1996
and 1998 as part the GoL‟s Land-Use Planning and Land Allocation (LUP-LA) program. This program
aimed to concentrate village activities to specific areas thus eradicating the practice of shifting cultivation.
It was recognized, however, both by government staff and villagers that these LUP-LA plans had serious
limitations due to a lack of available financial and human resources during their design and
implementation. Inequitable land allocations, poor management plans, unclear zone-use demarcation and
inexistent monitoring and enforcement were common results. This often led to farmers expanding beyond
their allocated areas and into the forest to satisfy their agricultural needs. For example, a 2010 survey
conducted by the NPA management unit and Phiang DAFO in Ban Navene found that 170 of 543
households had expanded beyond the established village boundary.
All of the villages visited, except Ban Dan, received updated land-use plans during 2010 as part of the
Participatory Land-use Planning (PLUP)10 process initiated by the NLMA and the Lao-German Land
Management and Registration Project (LMRP). While the total area allocated to villagers may not have
changed under PLUP it was recognized that the available area was distributed more equitably, boundaries
were more clearly demarcated, clearer land-use plans established and village level teams created to monitor
and enforce these plans. Additionally, it is expected that district level oversight of these plans will be more
active than under the previous LUP-LA due to better data storage and record keeping.
Significantly, the PLUP process also allows for the issuance of individual and communal land titles.
Current legislation allows for two types of land titling in rural villages: individual land titles or collective
titles. Individual titles can be granted where ownership of a parcel of land, defined as having been
developed for at least three consecutive years, can be proven. This is most likely to apply, for example, to
paddy areas or orchards that are cultivated on an annual basis. This gives farmers ownership of a piece of
land and therefore the right to sell it or use it as collateral for loans.
Community titles on the other hand can be granted on forest lands zoned as village sacred land, village use
forests and communal grazing lands, communal agricultural land but not village protection forests, village
10 In early 2010, GoL adopted the manual entitled “Participatory Agriculture and Forest Land Use Planning at Village and Village Cluster Levels”. This manual was created as an update to the previous LUPLA manual that was deemed to contain insufficient guidance on how to implement land use planning at the village cluster level. As such, this new manual represents an improvement on how land use planning is conducted at the village and village cluster level.

52 Technical Feasibility Assessment of the Nam Phui National Protected Area REDD+ Project in Lao PDR
conservation forests and unexploited forest land that remain under the ownership of the state. Most
importantly for a REDD project this means that the entire village swidden areas can be given a communal
title. While a communal title does not give the community the right to sell the land, it does give them
greater ownership and control over these areas. It is hoped therefore that farmers will adopt more
sustainable approaches to crop production and increase the value of this land. Few experiences to date
exist with regards to land titling following PLUP, therefore, while there is much optimism on the impacts
this will have it is yet to be seen how this will be implemented on the ground.
Population growth - Over the period 2005 - 2010 population grew in the districts of Paklay, Phiang and
Thongmixai at an annual rate of 1.38%, 2.89% and 0.55% respectively. Population growth in Phiang was
noticeably higher than in the other districts, suggesting that pressure on the NPA from this district will
become increasingly acute. The main reason for this growth is natural growth although village
consolidations and government relocations may also have played a part.
Despite the positive impression both government staff and villagers have of the impacts of PLUP,
concerns exist relating to whether current land allocations would be sufficient considering population
growth, even though this is factored into PLUP plans. In this regard, it is difficult to assess how long
current land allocations will satisfy village needs and at what point population growth might overwhelm
land availability. In particular, since paddy lands are limited, more and more families will be obliged to
practice upland agriculture, an important driver of deforestation.
Fire – Forest fires are a factor affecting the quality of the forest in the NPA due to the increased frequency
with which fires affect the NPA. Fires were reported to always be surface fires rather than crown fires and
in this regard can be considered more of a driver of degradation than deforestation, however the long-term
degradation of mature forests whose saplings have high fire-driven mortality rates and are quickly out-
competed by bamboo can lead to the eventual re-classification of forest from high to low density mixed
deciduous forest, until density drops to below the UNFCCC definition of forest cover. The main ways fire
affect the NPA are the following:
Fires are used to prepare agricultural lands for the new planting season. This happens during the
late months of the dry season (March – May). Windy conditions or poor fire management often
cause fires to spread beyond the field boundaries into surrounding fields or forest.
Hunters use fire to force animal movement in certain directions and for improving visibility in the
forest. There is little incentive for hunters to practice fire management techniques and therefore
these also often burn out of control.
Campfires started by hunters or villagers can often cause forest fires if left unattended or not
properly extinguished before moving on.
At the village level, fire management techniques such as group burnings and the opening of fire breaks are
employed to limit the spread of fire from agricultural land preparation. Many villagers have been trained in
fire management techniques by DAFO and villagers are called upon to help suppress forest fires when they
do overrun field boundaries. In cases where fires damage someone else‟s land, compensation is based upon
the type of land (communal vs. district) and type of crop burned. Nonetheless, due to limited DAFO
Technical Feasibility Assessment of the Nam Phui National Protected Area REDD+ Project in Lao PDR 53
budgets trainings are sporadic, enforcement of fire management techniques is low and villagers have few
tools to fight fires that do spread, meaning that this driver remains an important factor affecting the NPA‟s
forests.
Illegal logging - Both villagers and government staff stated that illegal logging occurs in the NPA, but
only on a limited scale. Illegal logging appears to be primarily financed by “outside businessmen” and
assisted by villagers. In other cases villagers may cut more than their allowed DAFO quota and sell their
excess. Limited road access from villages however suggests that larger scale illegal logging is not possible
via access from village areas. Besides villagers and “businessmen”, the Phiang DAFO also suggested that
the military in Ban Navene is also logging illegally, both to satisfy their own construction needs and for on-
sale.
Local sources familiar with the area suggest that illegal logging is occurring at a greater scale than suggested
during the village and government meeting. It is suspected that both villagers and government staff are
complicit in this illegal activity. In particular, it is thought that the areas to the west and north of Ban
Navene and in the forests to the south and south-east of Thongmixai are particularly affected. Close
inspection of high resolution (0.6 m) Quickbird imagery to the south-east of Thongmixai confirms the
presence of what appear to be logging roads and decks11.
Road construction - Upon establishment of the military in Ban Navene in 1989, a road between Ban
Paksong, Ban Navene and Thongmixai district was constructed for the purpose of national security. This
road however was not maintained and is currently in a state of disrepair in the middle section of the park.
Plans to upgrade this road exist within district five year development plans although details on when this
will actually happen, which requires central level approval and budget, were unavailable at the district or
provincial level. Anecdotal evidence from a joint WCS/GTZ field trip to the NP NPA however suggests
that construction on this road has been completed and it is possible to pass directly through the park from
Thongmixai to Ban Navene.
It is unclear what impact the opening of this road will have. A check point exists at Ban Paksong and
another is under construction in Thongmixai district. The intention is for these check points to control
access to the park and screen for any illegal extraction (wildlife or timber) that may occur. However, based
on the evidence provided above regarding illegal logging, it is uncertain how effective these check points
will be, especially if all relevant stakeholders (villagers, government staff and military) are complicit in this
activity. Furthermore, due to the conflicting information received regarding road construction it is difficult
to ascertain at what point and to what extent this road may be a future driver of deforestation.
Summary - Based upon the above discussion of drivers, some initial conclusions can be made. It appears
that the transition to commercial agriculture is the strongest driver affecting deforestation. What‟s more, it
is very likely that the combination of falling yields, increasing population, transition to mechanized
agriculture and promotion of this activity as a development priority will continue, if not increase, the
11 Visual evidence of this logging is provided in the companion drivers report to this feasibility report

54 Technical Feasibility Assessment of the Nam Phui National Protected Area REDD+ Project in Lao PDR
pressure on the surrounding forests. While it is recognized that improved land-use planning through PLUP
may have a beneficial impact on land management, villagers are still uncertain as to whether these land
allocations will be sufficient to meet their future needs. In this regard, the extent to which these plans are
enforced will likely dictate their effectiveness. The other three drivers discussed above (fire, illegal logging
and road construction) are primarily responsible for forest degradation rather than deforestation. Fires are
a constant threat and without improved fire management techniques, training and tools this driver will
continue to affect the NPA‟s forests. It was not possible to gather accurate information on illegal logging
and road construction in order to arrive at conclusions on the overall impacts of these drivers.
Nonetheless, it is apparent that in the absence of proper management both of these drivers will affect the
quality of the NPA‟s forests.
4.1.2. Identification of baseline scenario
An understanding of the above agents and drivers of deforestation and how they are expected to impact
the project area in the future is necessary in order to construct the project‟s baseline scenario. Based upon
the village and government staff meetings, it was determined that the most likely baseline scenario would
be a continuation of the historical land-use trends that affect the project area, particularly those that have
impacted the NPA and surrounding villages over the past five to seven years. This is based upon the
assumption that new land-use practices are unlikely to be introduced in the region in the near future and
that the NP NPA management staff and the respective DAFOs will remain underfunded and therefore
unable to adequately address the existing drivers of deforestation and degradation.
The NP NPA management staff currently estimates it requires an annual budget of 1.9 billion kip
(approximately USD 237,500) to properly manage the NPA. This is deemed a realistic value as it
approximates the same amount of financing per hectare that the NEPL NPA and NK NPA currently
receive, the two most actively managed NPAs in Lao PDR (Johnson, pers. comm..). These two NPAs
however benefit from WCS‟s technical and financial support, illustrating the point that external donor
support is necessary to ensure adequate levels of management.
During the past two years, the NP NPA has benefited from three new initiatives whose impact on the NP
NPA should be considered in the context of establishing the baseline. The first is the financial assistance
received from the Forestry Resource Development Fund. This is a GoL administered fund, established in
2006 and replenished through royalties paid on timber sales from production forests. The fund provides
financial support for all of the Department of Forestry‟s activities, including approximately USD 375,000
for NPAs. The NP NPA received the equivalent of USD 45,000 in 2008/09 and USD 31,250 in 2009/10.
This increase, however, only amounts to 19% and 13% of the estimated required budget and is unlikely to
have made a notable difference in addressing drivers of deforestation and degradation. There are no
indications that this funding will increase in the future and therefore it is not expected to significantly affect
the project‟s baseline.
The second is assistance provided by WWF for improved management and wildlife surveying in the NP
NPA. Phase 1 of WWF‟s support ran for one year during 2010 and consisted of capacity building for the
NP NPA staff, assistance elaborating NPA regulations, construction of one patrolling sub-station and

Technical Feasibility Assessment of the Nam Phui National Protected Area REDD+ Project in Lao PDR 55
wildlife surveying. The total budget for this phase was USD 35,000. WWF is currently negotiating a MoU
with the Sayabouri PAFO for a second phase totaling about USD 100,000 that would continue its work on
patrolling and wildlife surveys for a further two years. Although funding has not yet been secured, Phase 2
anticipates allocating approximately USD 24,000 for the construction of two more patrolling sub-stations
and ranger salaries, while the rest would go towards elephant and other biodiversity surveying. Due to the
limited budget and uncertainty over WWF‟s ability to secure financing for Phase 2, it was considered that
these activities would have a negligible impact upon the baseline and were therefore neglected for the
purposes of this report.
The third initiative is the Lao-German Land Management and Registration Project (LMRP) implemented
collaboratively by GTZ and the NLMA. This project started in 2010 and aimed to implement PLUP in
villages in five southern districts of Sayabouri province that met a pre-established set of criteria. In all cases
villages had to be classified as poor according to national standards and be approved by the district
government to participate in the project. Villages with land-use plans older than 2005 were eligible for the
full PLUP process12 while villages with land-use plans elaborated since 2005 passed directly to stage seven
of the PLUP process.
The LMRP project was only able to partially complete PLUP (up to stage 5) in a total of 14 villages during
2010. It should be noted, that two of these villages were specifically added at the request of the CliPAD
program (see section 4.2.2 below on additionality). As of the end of December 2010, LMRP had
completely pulled out of Sayabouri province.
As discussed above in section 4.1.1, there is uncertainty as to the extent to which PLUP will affect drivers
of deforestation in village areas. It could be argued that any future reductions in deforestation in the
villages that already underwent PLUP are attributable to the LMRP project and therefore must be
considered as part of the baseline. On the other hand, due to LMRP pulling out it can also be argued that
PLUP was not completed (only until stage 5) in these villages and therefore is unlikely to represent a
material difference to previous land-use plans that existed under LUP-LA. This issue only pertains to the 3
villages that underwent PLUP in Thongmixai district, as all other villages that underwent PLUP (besides
Ban Navene and Ban Paksong) are too far away from the NPA to have an effect on its deforestation rates.
Since PLUP was not fully completed in these villages it was felt that it is unlikely that historical trends will
be materially affected. For this reason, the historical trends in deforestation and degradation in these areas
are still considered to be the most accurate indicators of future trends.
Although a less rigorous investigation of the drivers of deforestation was conducted for the villages to the
east of the NPA that are included as part of the project area, it was made clear by district DAFOs and the
12 The PLUP process involves nine stages as follows: i) Preparation for participatory land use planning; ii) Socio-economic, land and forest data collection; iii) Delineation of village and village cluster boundaries; iv) Village and village cluster forest and agriculture land use zoning; v) Village and village cluster land management plans; vi) Land data record keeping and digital mapping; vii) Land registration and titling in rural villages; viii) Village and village cluster networks and networking; ix) Monitoring and evaluation
56 Technical Feasibility Assessment of the Nam Phui National Protected Area REDD+ Project in Lao PDR
NP NPA staff that these areas are subject the same drivers of deforestation and degradation as the NPA.
Furthermore, no initiatives are known to be active in this area that would invalidate the assumption that
past trends are representative of future trends. For this reason, the same baseline assumption for these
areas could be made as for the project areas within the NPA.
4.1.3. Ex-ante modeling of baseline emissions
An excel model was constructed to estimate the amount of emissions created in the baseline scenario. The
model was constructed to include the three components from which emission reductions would be
considered: avoiding deforestation, avoiding forest degradation and increasing regeneration of degraded
forest areas. Different approaches were required to calculate the baseline emissions for each of these
components.
As discussed in section 3.4.1 and 3.4.2, it was possible to achieve the minimum accuracy required by the
TGC methodology for the forest cover maps but not the land cover maps. Therefore, according to the
TGC methodology the project would only be able to account for emission reductions from preventing
deforestation. For this reason, throughout this report we present the results of the deforestation analysis
separately to those for deforestation, degradation and regeneration combined together. Where the
combined results are presented, it is to provide an indicative estimate of how many additional emission
reductions the project might be able to claim by including the degradation and regeneration components.
Deforestation
To estimate the amount of baseline emissions from avoiding deforestation it was necessary to consider
both the baseline rates of deforestation and increased forest cover rates. The rates of deforestation as
predicted by the LCM model for the next 15 years were used to establish the baseline. Increased forest
cover rates for the project areas were calculated as 0.16%, meaning 0.16% of any area deforested can be
expected to return to forest. This equates to approximately 2 ha per year. For the purposes of carbon stock
calculations it was assumed that these 2 hectares returned to forest in the same year as they were initially
deforested.
The results of the change analysis explained in section 3.4.2 highlighted that almost all deforestation in the
NPA occurred in the MDF class and almost no change occurred in the evergreen forest class. For the
purposes of estimating carbon stock losses from deforestation it was therefore assumed that all
deforestation occurred in the MDF class. The carbon stock value from Table 3 was taken for the MDF
class (101tC). Although it is known that this forest class is undergoing a process of degradation, no
discounts over time for the MDF class were applied. During actual project development, inventories will
need to be performed to obtain accurate carbon stock values in each forest class over time.
There are multiple non-forest classes into which the MDF class might be converted. It was therefore
necessary to calculate a weighted average for the non-forest class. Carbon stocks for each of the three non-
forest classes were taken from Table 3 and the relative area of each class obtained from the results of the
2010 forest cover classification. This resulted in an average carbon stock value of 20.7 tC/ha. Combining
this with the MDF carbon stock value above means that deforestation in the NPA results in a net change
Technical Feasibility Assessment of the Nam Phui National Protected Area REDD+ Project in Lao PDR 57
of 81.3tC/ha. By combining this emission factor with the expected rate of net forest cover loss it was
possible to calculate the baseline emissions due to deforestation.
Degradation
The average annual historical degradation rate of the high density MDF class in the Phiang portion of the
NP NPA was calculated as 0.52%, while it was also ascertained that none of the low density MDF
regenerates (see Table 15). Applying this degradation rate to the total assumed amount of high density
MDF in the project area results in an annual degradation rate of 280 ha/yr.
The carbon stock difference between high and low density MDF is 67tC/ha. Again, by combining the
overall degradation rate with the degradation emission factor it was possible to arrive at an estimate of
baseline emissions for forest degradation in the NPA.
Regeneration
The TGC methodology allows a project to account for atmospheric CO2 removals through the
regeneration of degraded forests in two ways: (i) the regeneration of forests where the drivers of
degradation and deforestation have been removed, and (ii) the regeneration of forests where specific
assisted natural regeneration (ANR) activities such as liberation thinning, enrichment planting and
fertilization will be performed. The approach to account for these two activities is slightly different. While
the first scenario simply requires satellite monitoring of these areas to ascertain that a forest area has passed
from a lower to a higher forest class, the second scenario requires more detailed accounting in line with
current afforestation and reforestation (A/R) methodologies. This is primarily to account for possible
emissions created due to the implementation of ANR activities.
Nonetheless, after consultation with CliPAD it was decided for the purposes of this report, to assess the
removal potential of all forest areas known to have been degraded in the project area over the past 10 years
without ANR intervention. The underlying assumption here is that by limiting the impact of the drivers of
degradation all of these degraded, low density MDF areas will return to a high density state. This is an
important assumption that will need to be verified before moving ahead with project development.
The change analysis from section 3.4.2 identified that regeneration of degraded forest areas does not occur
in the NPA, most likely due to the ongoing presence of the drivers of degradation, such as fire. It was
therefore assumed that no removals of GHGs occur in the baseline of the regeneration component.
Results
Due to the nature of the baseline calculations, emissions from degradation demonstrate a linear trajectory.
Baseline emissions due to deforestation are close to linear however decrease slightly over each five year
period in line with the predicted deforestation rates predicted under the LCM model. Baseline emissions
are primarily due to deforestation, accounting for 85% of total emissions in each year (approx. 394,000
tCO2e). Degradation accounts for the remaining 15% (approx. 68,700 tCO2e). Since no regeneration is
expected to occur on the low density MDF no baseline removals were assumed. The results of the baseline
calculations are presented below in Figure 25 and Table 18.

Table 18. Baseline GHG emissions over 15 years for the deforestation, degradation and regeneration components in the Project Area.
Year
Deforestation Degradation Regeneration Combined
Net forest change
(ha)
C stock change (tCO2e)
Cumulative emissions (tCO2e)
Net loss high MDF to low MDF (ha)
C stock change (tCO2e)
Cumulative emissions (tCO2e)
Net change
(ha)
C stock change (tCO2e)
Cumulative removals (tCO2e)
Sum of C stock change
(tCO2e)
Cumulative baseline
emissions (tCO2e)
2010 - 0 0 - - - - - -
2011 1,424 418,471 418,471 280 68,733 68,733 - - - 487,204 487,204
2012 1,424 418,471 836,942 280 68,733 137,467 - - - 487,204 974,409
2013 1,424 418,471 1,255,413 280 68,733 206,200 - - - 487,204 1,461,613
2014 1,424 418,471 1,673,884 280 68,733 274,933 - - - 487,204 1,948,817
2015 1,424 418,471 2,092,355 280 68,733 343,666 - - - 487,204 2,436,022
2016 1,338 393,234 2,485,589 280 68,733 412,400 - - - 461,967 2,897,989
2017 1,338 393,234 2,878,822 280 68,733 481,133 - - - 461,967 3,359,955
2018 1,338 393,234 3,272,056 280 68,733 549,866 - - - 461,967 3,821,922
2019 1,338 393,234 3,665,290 280 68,733 618,600 - - - 461,967 4,283,889
2020 1,338 393,234 4,058,523 280 68,733 687,333 - - - 461,967 4,745,856
2021 1,259 370,050 4,428,574 280 68,733 756,066 - - - 438,784 5,184,640
2022 1,259 370,050 4,798,624 280 68,733 824,799 - - - 438,784 5,623,424
2023 1,259 370,050 5,168,675 280 68,733 893,533 - - - 438,784 6,062,208
2024 1,259 370,050 5,538,725 280 68,733 962,266 - - - 438,784 6,500,991
2025 1,259 370,050 5,908,776 280 68,733 1,030,999 - - - 438,784 6,939,775

Figure 25. Baseline emissions over 15 years for the deforestation, degradation and regeneration components in the Project Area

60 Technical Feasibility Assessment of the Nam Phui National Protected Area REDD+ Project in Lao PDR
4.1.4. Methodology review
Any project under the VCS must make use of an approved methodology for the accounting and
monitoring of its emission reductions. Projects that do not meet the applicability conditions of an existing
methodology can choose to either request a deviation from an existing methodology or develop an entirely
new methodology specific to its own project case. This second option comes at greater cost and requires
more time as the developed methodology needs to go through the VCS‟s double approval process. A
review of existing methodologies therefore provides important insights into the possible additional timing
and cost a project will incur before being accepted by the VCS.
At present, five REDD methodologies have been approved by the VCS. One of these is for the avoided
conversion of peat swamp forests and is not applicable to the NP NPA project. The remaining four
methodologies however could all potentially be used to account for the avoided deforestation components
of the NP REDD project. These are:
1. Baseline and Monitoring Methodology for Project Activities that Reduce Emissions from
Deforestation on Degrading Land, developed by Terra Global Capital, LLC;
2. REDD Methodology Modules, developed by the Avoided Deforestation (AD) Partners; and
3. Methodology for Avoided Mosaic Deforestation of Tropical Forests, developed by Wildlife Works
Carbon.
4. Methodology for Unplanned Deforestation, developed by the Amazonas Sustainable Foundation
and BioCarbon Fund
Of the above four methodologies, only the methodology developed by TGC accounts for emission
reductions from avoided degradation as well as forest regeneration. Due to the relative importance of
claiming emission reductions from both avoided degradation and regeneration, the TGC methodology was
deemed the most applicable to the NP REDD project.
Several features of the TGC methodology, however, should be noted that could affect either the NP
REDD project‟s overall applicability or its ability to generate emission reductions.
The identification of land cover and forest classes must be achieved with a minimum accuracy
of 70%. If forest classes cannot be identified with a minimum accuracy of 70% then only
emission reductions from avoided deforestation can be claimed. If land cover classes cannot be
identified with a minimal accuracy of 70% then the project is not eligible. Furthermore, the
amount of emission reductions the project can claim decreases depending upon the number of
images used for the historical analysis and the accuracy to which these images are interpreted.
For example, projects that achieve 70% accuracy will have their emission reductions discounted
by a factor of 0.7. This issue is especially pertinent for the NP REDD project where a
mountainous terrain and heterogeneous forest types confound the accurate interpretation of
forest cover. It will therefore be necessary for the project to spend a considerable amount of
time refining the accuracy of historical images in order to avoid incurring heavy discounts.
Furthermore, projects that use four or fewer images for their historical analysis incur further

Technical Feasibility Assessment of the Nam Phui National Protected Area REDD+ Project in Lao PDR 61
discounts. For this study, discounts were taken according to the TGC methodology
requirements for both the number of images used and the accuracy achieved when interpreting
these images.
The TGC methodology requires that the baseline calculations account for the fact that
deforestation rates will decrease as forest becomes scarcer. This is known as the forest scarcity
principle. Understanding how this scarcity principle may affect the forests in the NP REDD
project area was beyond the scope of this study, however, this will need to be considered if the
decision to move ahead with project development is taken. Depending on the determined
scarcity of the forest, this may reduce the amount of emission reductions the project can claim.
An initial assessment of a potential reference area was conducted for this feasibility study. This
will however need to be refined during project development in order to confirm that the
identified area fully conforms to the methodology requirements. For example, a full provincial
assessment of deforestation drivers was not possible in the context of this study but will need
to be performed if the project decides to move forward. Furthermore, parts of the identified
reference area are currently undergoing the PLUP process as part of the Rural Development in
Mountainous Areas of Northern Lao PDR (RDMA) project. This means that any successes this
project has in reducing deforestation could be considered as part of the project‟s new baseline
when this is re-evaluated at a future date. This may also reduce the project‟s overall emission
reduction potential
The TGC methodology requires that biomass carbon emission reductions be discounted based
on the uncertainty of the biomass inventory. Where the combined error in any particular
stratum is smaller than 0.15, no deduction is applied. If the combined error is greater than 0.15,
a discounting factor for the emission factor for the stratum transition must be applied in
corresponding to the uncertainty of the biomass inventory based on the half-width of the 95%
confidence interval around the mean carbon stock density of the strata. For the purposes of
this report, it is assumed that combined error is smaller than 0.15 and thus no deduction is
applied at this time
4.2. Project scenario
4.2.1. Recommended activities
In order to reduce the decline of forest carbon stocks appropriate activities and incentives must be
implemented that effectively address the drivers of deforestation and degradation that affect the NPA.
Based upon the above identified drivers and discussions with the CliPAD project, the following project
activities are recommended:
1. Conduct PLUP in all villages within 10 km of the NPA boundary. This includes completing
PLUP in villages where it was commenced by LMRP. Prior poor land-use planning was identified
as one of the primary reasons for villagers expanding beyond their village boundaries. Conducting
PLUP in these villages will ensure that land is distributed more equitably, zone demarcation is clear,
land titles granted and that proper monitoring of land-use plans is conducted. This will help make
certain that land is used more rationally and with a view towards sustainable production. Ongoing
62 Technical Feasibility Assessment of the Nam Phui National Protected Area REDD+ Project in Lao PDR
support should be given to both villagers and the relevant government bodies responsible for
monitoring and enforcing the implementation of PLUP plans. Although 10km has been suggested
here, consistent with the reasons for selecting a 10km leakage belt, a more thorough understanding
of the distances villagers are willing to travel to access the project areas should be conducted. This
will inform the geographical extent to which PLUP will need to be implemented.
2. Conduct agricultural extension activities. The transition to cash-crop production is greatly
reducing soil fertility across the region. In order to counter this trend and ensure that current land
allocations are sufficient to meet future agricultural needs, it is necessary to improve and
sustainably maintain crop yields. A variety of techniques and approaches can be adopted, as listed
below. This list is not exhaustive and other approaches may also prove effective.
No-till agriculture. This ensures that crop residues remain on the fields therefore preventing
soil erosion and improving the organic content of the soil. This should be promoted only in
lowland, paddy areas as in upland areas this practice could lead to an increase in presence of
invasive grasses
Biochar. Crop and other organic residues can be combusted anaerobically to produce
biochar. Biochar is a stable material that when ploughed back into soils increases fertility,
improves soil structure and helps to retain moisture. This activity also has the potential to
store large amounts of carbon and therefore offers the possibility of generating additional
emission reductions.
Crop diversification. The over-reliance on only a few crops (e.g. Job‟s tears and corn) means
farmers are both exhausting their soils and at risk of market demand fluctuations.
Diversifying crop production can be an effective way of mitigating these market risks while
giving soils a chance to regenerate. Promoting higher value, less land intensive crops would
help reduce land area requirements and therefore the pressure to expand. Improving access
to markets for these products will also need to be promoted.
Crop rotation. Promoting a sequence of crop cycles that returns nutrients to the soil will help
improve soil productivity. For example, growing legumes immediately after a crop
harvesting (both paddy and upland) will help return much needed nitrogen to the soil.
Limit soil erosion. To limit topsoil erosion in upland areas a variety of techniques including
terracing, planting grass or bamboo strips and installing fences should be considered. These
will limit the impact of rain erosion and therefore the loss of soil and soil nutrients.
Mulching can also be considered to prevent erosion and retaining moisture in the soil.
Promote agro-forestry. Planting mixed agricultural systems with high value tree species such as
fruit trees, vanilla or cocoa are all possible methods to improve productivity per hectare of
land.
3. Improve management of the NP NPA. Establishing an effective and empowered NP NPA
management unit is a crucial component of this REDD project. This is necessary to enforce NPA
regulations, conduct outreach activities and monitor activities occurring within the NPA boundary.
Activities to consider are:
Technical Feasibility Assessment of the Nam Phui National Protected Area REDD+ Project in Lao PDR 63
Improve the capacity of NPA staff. This involves training on NPA regulations, management
systems, general administration, outreach approaches and methods, patrolling and carbon
project development.
Establish check points. These currently exist at Ban Paksong, Thongmixai and at the NP NPA
headquarters. Additional check points could be added in Ban Navene, Paklay and along any
other roads that provide access to the park.
Patrolling. Patrol posts throughout the NPA should be constructed and manned with staff
with the legal right to make arrests. Frequent patrolling covering the full extent of the NPA
to check for illegal activities (logging, hunting, etc.) should be conducted.
Enforcement. Any illegal activities ascertained by the check points or patrols should be taken
through legal proceedings to serve as a deterrent for future illegal activities.
Community outreach. The NP NPA staff should be active in making the NPA rules and
regulations known to all villages surrounding the NPA. Directed messaging relating to the
benefits of sustainable resource use in the NPA should be promoted, as well as the
alternative agricultural and livelihood activities mentioned above.
4. Improve fire management. Fire is an important driver causing degradation in the NPA. Fires
caused by hunters can be addressed by increasing patrols within the park, thus creating a deterrent.
At the village level, improved fire management techniques and tools should be provided to avoid
the spread of fires from agricultural lands to the forest. This should be done in close consultation
with local DAFOs.
5. Establish conservation agreements. Through a co-management approach it is envisioned that
the NPA will enter into contractual agreements with villages that agree upon levels of
compensation in return for villagers acting as custodians of the forests in their wider administrative
area of responsibility. Baseline rates of deforestation can be calculated per village area and
compensation calculated as reductions below this level. The intent is that these agreements and
compensation will motivate villagers to enforce their village PLUP plans, engage in fire suppression
and limit access of illegal loggers and hunters into their forest areas.
6. Establish village development funds. Creating village development funds that are replenished
with payments from the conservation agreements will help to motivate the entire community to
engage in forest protection. Clear, democratic and transparent rules will need to be established on
how the fund is replenished, how funds are spent and who has the decision making power over its
management. For example, rather than make payments to individual farmers it is advisable to create
a collective system whereby projects that benefit the entire village are funded from carbon finance,
such as the construction of schools and hospitals. The design of these funds should be done in
close consultation with villagers.
4.2.2. Eligibility and additionality
Presented below is an assessment of the project idea against the eligibility criteria of the VCS and CCB
Standards, followed by an assessment of the project‟s additionality.

64 Technical Feasibility Assessment of the Nam Phui National Protected Area REDD+ Project in Lao PDR
VCS - The NP REDD project would be considered as an avoided unplanned deforestation and
degradation (AUDD) project under the VCS. The NP REDD project area is subject to human pressure
due to socio-economic pressures that drive local populations to exploit the forest resource. Although
villagers are legally sanctioned to conduct such activities within their village use areas, local institutions do
not have the capacity to control encroachment beyond these zones. It is for this reason that the
deforestation and forest degradation is considered as unplanned.
Only areas that have been forest for the past ten years and are forest at project start are eligible for
crediting as REDD projects under the VCS. While the project boundary can be larger, and include many
other land types other than forest, only those areas that qualify as “forest” will be eligible for crediting and
will need to be clearly identified.
To determine what is forest, the VCS requires that REDD projects use internationally accepted definitions.
This could be based, for example, on host-country thresholds communicated to the UNFCCC or FAO
definitions. The definition used is important because it determines at what point a “forest” passes to “non-
forest” and therefore when deforestation occurs. It will also define the extent to which a forest is degrading
before it becomes “non-forest”. Lao PDR‟s UNFCCC host-country definition of forest is defined as areas
of trees that meet the following threshold values:
Minimum area: 0.5 ha
Minimum crown cover: 20%
Minimum height: 5m
Based on the historical analysis conducted above it was possible to identify 119,996 ha of forest that
existed in the project area since 2000 and therefore eligible for REDD crediting. For baseline calculation
purposes a 2010 forest cover value of 120,531 was used as this was the amount predicted by the LCM
model for 2010. This value is very close to the actual value of 119,996 ha and therefore no changes were
made to the LCM model.
CCB Standards - Many voluntary market buyers are interested in forest carbon projects because of the
ancillary environmental and social co-benefits they provide. In light of this, the CCB Standards were
developed to systematically assess and rate the co-benefits of forest carbon projects in a manner that can
be audited by an independent third- party. Certifying a project under this standard, in addition to a carbon
accounting standard such as the VCS, can increase the marketability of a project and in some cases allow
credits to be sold at a premium.
The CCB Standards assess projects under four components: general attributes, climate, community and
biodiversity. Projects that meet all of the required criteria are certified under the standard as Approved
projects. Gold level certification is awarded to projects that meet all the standard criteria plus at least one
of the additional Gold level criteria.
For the most part the NP NPA project satisfies the criteria of the CCB Standards. Besides providing
climate change benefits, the project expects to generate additional biodiversity and community benefits.
Technical Feasibility Assessment of the Nam Phui National Protected Area REDD+ Project in Lao PDR 65
There are however a few minor areas of concern as outlined below that the project should be sure to
address in the elaboration of the final project design.
A formal consultation needs to be conducted with all appropriate authorities, including the
established formal and/or traditional authorities customarily required by the communities in order
to satisfy the requirement that all stakeholders are voluntarily participating in the project based
upon the principle of free, prior and informed consent (FPIC). This is one of the first crucial steps
that must be conducted if the decision to move ahead with project development is taken.
A review of land-use plans in Ban Navene in 2010 identified that 170 of 543 households had
expanded beyond the village land-use area. The implementation of PLUP in Ban Navene will
require that these families abandon these fields and return within the village use zone. The CCB
Standards require that a project “demonstrate that the project does not require the involuntary
relocation of people or of the activities important for the livelihoods and culture of the
communities. If any relocation of habitation or activities is undertaken within the terms of an
agreement, the project proponents must demonstrate that the agreement was made with the free,
prior, and informed consent of those concerned and includes provisions for just and fair
compensation”. It will therefore be necessary for the project to demonstrate that the
implementation of the PLUP plans is not negatively affecting the livelihoods of those families that
are required to relocate their farming activities.
Clear ownership rights over carbon have not been established for the project. Although it is
expected that the rights to any carbon generated within the NPA boundary will accrue to the NPA
itself, this has not been clarified legally. It is unclear, for example, whether the communities living
in the NPA or the district, provincial or national government have any claims to the carbon. Clear
rights to carbon ownership will need to be established before the project can receive CCB
certification.
CCB certification requires that any negative offsite biodiversity impacts that the project is likely to
cause be identified and mitigated. Increased patrolling and law enforcement by the NPA
management staff may cause hunting to be displaced to other forest areas in the vicinity of the
NPA. It will therefore be necessary for the project to develop methods to address this possible
source of offsite biodiversity impact.
Additionality – This is the concept that emission reductions caused by the project are additional to any
that would have occurred in the absence of the project. In this regard, a project must demonstrate that its
activities go beyond what would have happened in a business-as-usual scenario. As identified above in
section 4.1.2 the baseline scenario for this project is a continuation of historical trends, including a limited
budget for NPA management activities.
It is clear that for the majority of the NPA the presence of the CliPAD project is highly additional. The
investments CliPAD will make for improved park management, land-use planning, agricultural extension
activities, fire management and improved livelihoods are specifically for the intent of generating carbon
finance and substantially greater than anything that would have occurred in the baseline scenario.

66 Technical Feasibility Assessment of the Nam Phui National Protected Area REDD+ Project in Lao PDR
Furthermore, this is a conservation project that will not generate any economical or financial benefits other
than from the sale of VCS credits, clearly indicating its financial additionality.
Concerns however may be raised that some of the project‟s emission reductions are actually the result of
LMRP‟s prior PLUP activities and therefore not additional. Whilst it is true that LMRP conducted PLUP
(until stage 5) in five villages of relevance to the NP NPA, two of these villages (Ban Navene and Ban
Paksong) were not on LMRP‟s initial list of priority villages. CliPAD specifically requested that these
villages be included and prioritized in LMRP‟s workplan and therefore represent additional villages that
underwent PLUP. In the absence of CliPAD these two villages would not have undergone PLUP and
therefore any emission reductions caused by the project are attributable to the existence of CliPAD.
In Thongmixai district the issue is slightly more complex as the three villages that underwent PLUP
featured on LMRP‟s initial list of priority villages. However, PLUP was only completed until stage 5 and, as
mentioned above in section 4.1.2, it is felt that this is insufficient to change historical patterns of land use.
CliPAD however intends to complete PLUP in these villages and therefore any future emission reductions
caused by PLUP can be attributed to the project.
4.2.3. Expected emission reductions
To arrive at an estimation of the emission reduction potential of the NP REDD project it is necessary to
consider three factors: (i) the efficacy with which project activities will address the agents of deforestation
and degradation; (ii) the associated emissions that may result from leakage; and (iii) discounts applied due
to the accuracy of interpreting historical images.
It is unrealistic to assume that the REDD project activities will successfully address all the agents of
deforestation and degradation from the first year of operation. More realistic is an increasing effectiveness
over time as the capacity of NPA management staff improves and the agricultural and fire management
techniques are adopted by an increasing number of farmers. For this reason, it was assumed that the
REDD project will be 5% effective at reducing baseline emissions during the first three years, 20% during
the fourth and fifth years, 40% during the sixth to eighth years, and 50% from year nine onwards.
Furthermore, there is a risk that the implementation of REDD activities will lead to a displacement of the
drivers of deforestation and degradation outside the project area. The displacement of these drivers and the
emissions they cause are a direct consequence of the project and need to be accounted for. The main
leakage risks in the context of the NP REDD project are the following:
Displacement of agricultural activities. The tighter control on the expansion of agricultural
activities due to PLUP may cause some farmers to seek agricultural land outside of the project area.
Although this is a clear case of leakage, this risk is unlikely to occur at a large scale. The main area
experiencing deforestation in the NP NPA is around the village of Ban Navene. In order for the
villagers to clear lands outside of the project area they would have to travel at least 20 km, beyond
the village of Ban Paksong to areas that are currently not cultivated. This is very long distance for a
farmer to travel to establish new fields and for this reason is unlikely to occur.
Technical Feasibility Assessment of the Nam Phui National Protected Area REDD+ Project in Lao PDR 67
Displacement of illegal logging. Tighter controls on access to the NPA will make it harder for
illegal logging to occur. Those that practice this type of logging may instead choose to target some
of the surrounding PFAs or other forested areas in the province. Due to the illegal nature of this
activity it is extremely difficult to monitor and quantify how much leakage may occur. In this case a
standard discount may need to be applied to the project‟s emission reduction potential to quantify
this risk.
Displacement of hunting activities. As with the illegal logging above, stricter patrolling and
enforcement may cause hunters to displace their activities outside the NPA. This would lead to an
increase in the use of fire outside of the NPA for hunting purposes. This risk, however, is also
unlikely to cause large amounts of leakage. There are few areas outside of the NPA with the same
faunal biodiversity. Implementing the REDD project activities is therefore likely to stop much of
this activity rather than it be displaced.
It does not appear that leakage will adversely affect this project to a large extent. For the purposes of this
study a relatively low leakage factor of 15% was assumed for both the REDD and regeneration
components. Nonetheless, the project partners should be cognizant of these risks and design approaches
to minimize their impact.
The TGC requires that a project‟s emission reduction potential be discounted based upon the accuracy
achieved when conducting the historical land and forest cover change analysis. For this study, a minimum
forest cover accuracy of 80% was achieved; therefore emission reductions relating to avoiding
deforestation were discounted by 80% multiplied by 0.9 for having used only four images during the
historical period. This resulted in an overall discount of 0.72. As mentioned before, the approach taken to
assess degradation for this study does not follow the requirements of the TGC methodology (see section
3.4.2). This was in part due to the fact that the 70% minimum accuracy threshold could not be achieved.
Despite this, the indicative emission reduction potential from degradation and regeneration has also been
included in these results. To be conservative, these emission reductions have been discounted by the
TGC‟s maximum allowable discount of 70%,multiplied by 0.9, for a total discount of 0.63. When moving
towards project development it is recommended to both improve the accuracy of the interpretation as well
as include an additional image in the historical analysis to avoid these discounts therefore maximizing the
emission reduction potential of the project.
Figure 26 and Table 19below present the overall emission reduction potential of the NP REDD project
taking into account the assumed efficacy of the project activities, leakage risks and classification accuracy
discounts discussed above. The results show that net annual emission reductions increase over time as the
project becomes more successful at addressing the drivers of deforestation and degradation. Emission
reductions from avoiding deforestation average approximately 28,000 tCO2e for the first 5 years, 106,000
tCO2e per year for the next 5 years and 113,000 tCO2e for the final 5 years. Over the 15 year period of
analysis, total emission reductions amount to 1.24 million tCO2e, an average of 82,400 tCO2e per year.
The emission reduction potential from avoiding degradation and increasing regeneration is far lower than
for avoiding deforestation. Total cumulative emission reductions from degradation and regeneration over
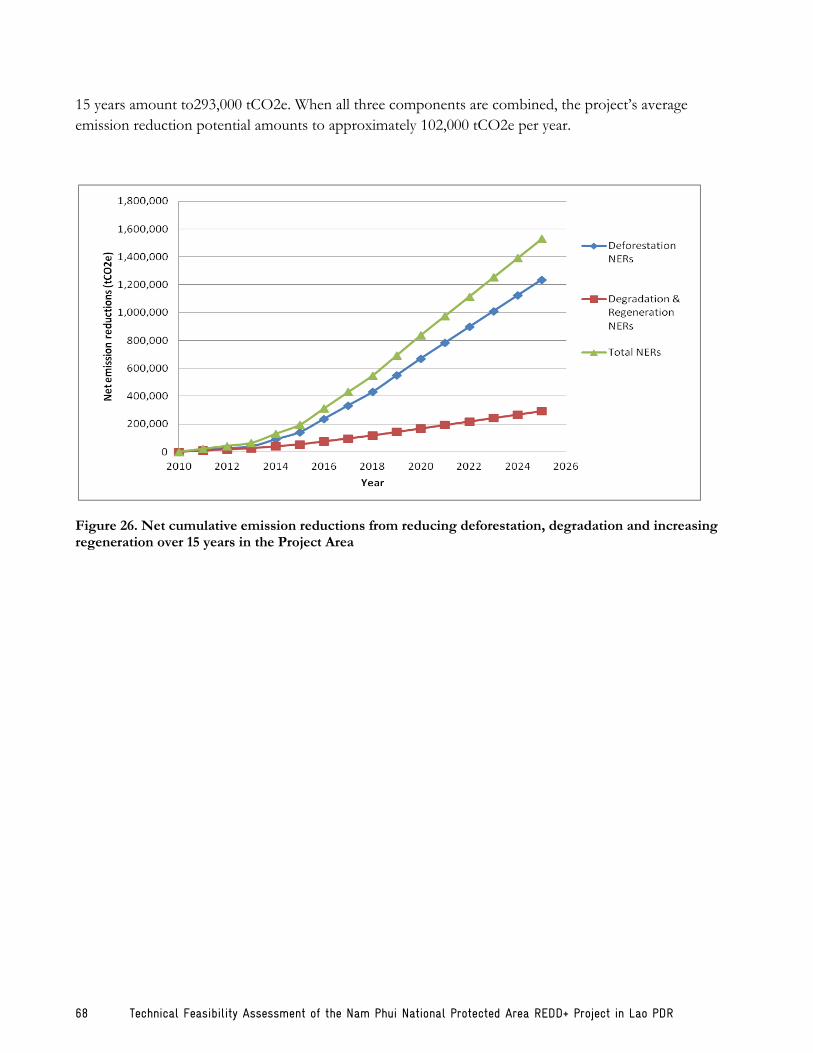
68 Technical Feasibility Assessment of the Nam Phui National Protected Area REDD+ Project in Lao PDR
15 years amount to293,000 tCO2e. When all three components are combined, the project‟s average
emission reduction potential amounts to approximately 102,000 tCO2e per year.
Figure 26. Net cumulative emission reductions from reducing deforestation, degradation and increasing regeneration over 15 years in the Project Area
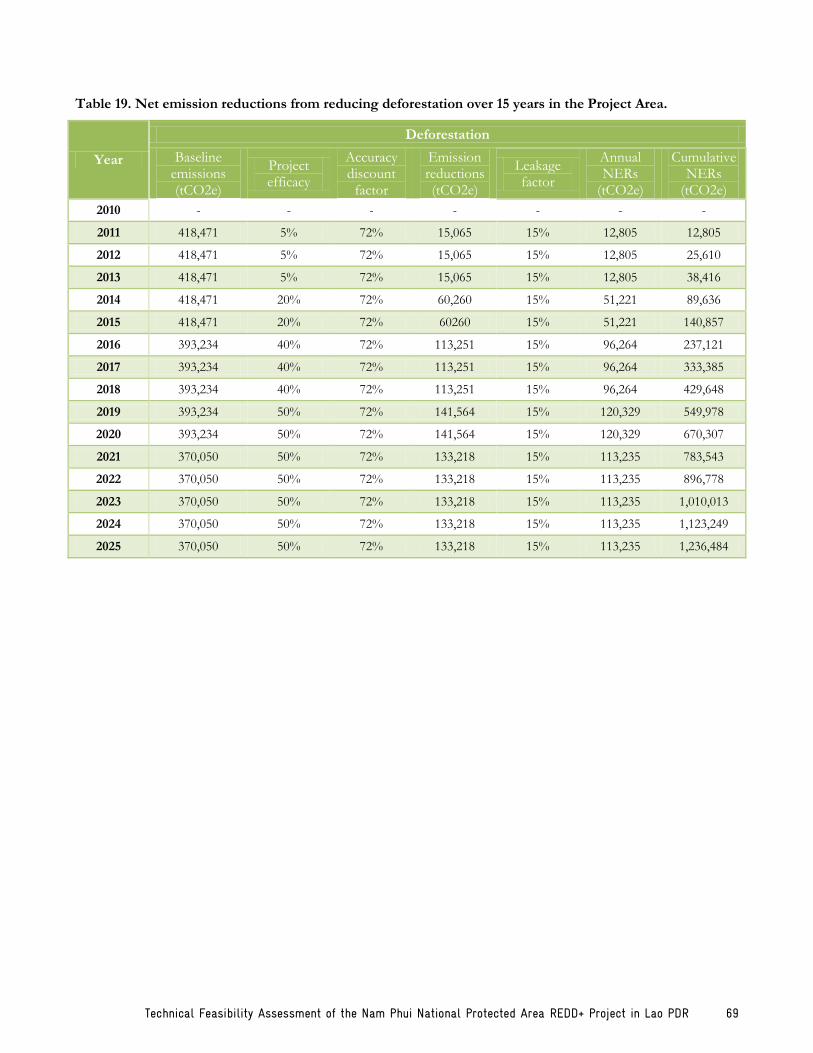
Technical Feasibility Assessment of the Nam Phui National Protected Area REDD+ Project in Lao PDR 69
Table 19. Net emission reductions from reducing deforestation over 15 years in the Project Area.
Year
Deforestation
Baseline emissions (tCO2e)
Project efficacy
Accuracy discount
factor
Emission reductions (tCO2e)
Leakage factor
Annual NERs
(tCO2e)
Cumulative NERs
(tCO2e)
2010 - - - - - - -
2011 418,471 5% 72% 15,065 15% 12,805 12,805
2012 418,471 5% 72% 15,065 15% 12,805 25,610
2013 418,471 5% 72% 15,065 15% 12,805 38,416
2014 418,471 20% 72% 60,260 15% 51,221 89,636
2015 418,471 20% 72% 60260 15% 51,221 140,857
2016 393,234 40% 72% 113,251 15% 96,264 237,121
2017 393,234 40% 72% 113,251 15% 96,264 333,385
2018 393,234 40% 72% 113,251 15% 96,264 429,648
2019 393,234 50% 72% 141,564 15% 120,329 549,978
2020 393,234 50% 72% 141,564 15% 120,329 670,307
2021 370,050 50% 72% 133,218 15% 113,235 783,543
2022 370,050 50% 72% 133,218 15% 113,235 896,778
2023 370,050 50% 72% 133,218 15% 113,235 1,010,013
2024 370,050 50% 72% 133,218 15% 113,235 1,123,249
2025 370,050 50% 72% 133,218 15% 113,235 1,236,484
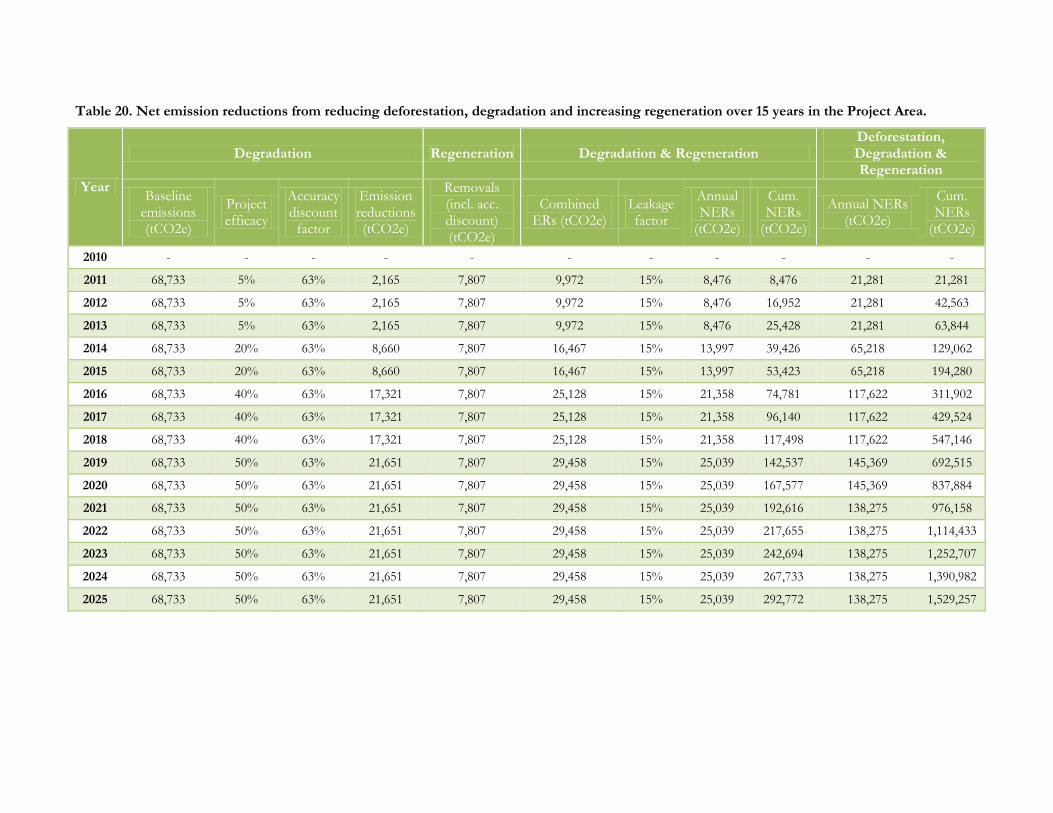
Table 20. Net emission reductions from reducing deforestation, degradation and increasing regeneration over 15 years in the Project Area.
Year
Degradation Regeneration Degradation & Regeneration Deforestation, Degradation & Regeneration
Baseline emissions (tCO2e)
Project efficacy
Accuracy discount
factor
Emission reductions (tCO2e)
Removals (incl. acc. discount) (tCO2e)
Combined ERs (tCO2e)
Leakage factor
Annual NERs
(tCO2e)
Cum. NERs
(tCO2e)
Annual NERs (tCO2e)
Cum. NERs
(tCO2e)
2010 - - - - - - - - - - -
2011 68,733 5% 63% 2,165 7,807 9,972 15% 8,476 8,476 21,281 21,281
2012 68,733 5% 63% 2,165 7,807 9,972 15% 8,476 16,952 21,281 42,563
2013 68,733 5% 63% 2,165 7,807 9,972 15% 8,476 25,428 21,281 63,844
2014 68,733 20% 63% 8,660 7,807 16,467 15% 13,997 39,426 65,218 129,062
2015 68,733 20% 63% 8,660 7,807 16,467 15% 13,997 53,423 65,218 194,280
2016 68,733 40% 63% 17,321 7,807 25,128 15% 21,358 74,781 117,622 311,902
2017 68,733 40% 63% 17,321 7,807 25,128 15% 21,358 96,140 117,622 429,524
2018 68,733 40% 63% 17,321 7,807 25,128 15% 21,358 117,498 117,622 547,146
2019 68,733 50% 63% 21,651 7,807 29,458 15% 25,039 142,537 145,369 692,515
2020 68,733 50% 63% 21,651 7,807 29,458 15% 25,039 167,577 145,369 837,884
2021 68,733 50% 63% 21,651 7,807 29,458 15% 25,039 192,616 138,275 976,158
2022 68,733 50% 63% 21,651 7,807 29,458 15% 25,039 217,655 138,275 1,114,433
2023 68,733 50% 63% 21,651 7,807 29,458 15% 25,039 242,694 138,275 1,252,707
2024 68,733 50% 63% 21,651 7,807 29,458 15% 25,039 267,733 138,275 1,390,982
2025 68,733 50% 63% 21,651 7,807 29,458 15% 25,039 292,772 138,275 1,529,257

Technical Feasibility Assessment of the Nam Phui National Protected Area REDD+ Project in Lao PDR 71
4.3. Credit potential
A project‟s carbon credit generating potential is a function of its achievable net emission reductions minus
discounts for the non-permanence buffer. Provided below is an analysis of the project‟s non-permanence
risks and its overall credit generating potential.
4.3.1. Non-permanence risks
Forestry projects carry a risk of unforeseen losses of carbon stocks that may negate past reductions in
emissions. This is referred to as the risk of non-permanence. Provided below is a qualitative assessment of
the main non-permanence risks for the NP REDD project and how far these may represent real risks
under the current project design. The project needs to show a clear response to as many of these risks as
possible in order to ensure and maximize the generation of carbon credits, as well as to increase buyer and
investor confidence in the project. The main non-permanence risks in the context of the NP REDD
project are:
Agricultural encroachment. Farmers may choose to expand the area under agriculture if prices
for cash crops increase drastically or if current agricultural land allocations are not sufficient to
satisfy village needs. These risks will need to be mitigated by strong enforcement of the PLUP
plans and respect for the delineation of village agricultural boundaries.
Low management capacity of NP NPA management staff. The NP NPA management staff
has limited capacity and experience to run a carbon project. There is a risk in the long term that
without adequate training or support this entity will not be able to mobilize or manage all of the
project participants. Furthermore, if carbon benefits are not properly distributed then farmers may
choose to convert their project lands for other, more profitable purposes. Ensuring that the NP
NPA staff is properly staffed and supported is key to the long-term success of the project.
Low implementation capacity of Phiang, Thongmixai and Paklay DAFOs. Current
capacities within these departments are low and without out expert support are unlikely to
implement agricultural extension activities adequately. This is particularly an issue once the CliPAD
program support for the project ends. Without ongoing agricultural extension support it is possible
that farmers will readopt more degrading agricultural practices.
Construction of road. The impact that the finalization of the road construction through the NPA
will have on deforestation and degradation is unknown. There is a risk however that a lack of
control of this road will lead to greater access to the NPA for drivers of deforestation and a
reversal of the project‟s emission reduction benefits. Strict access control is therefore imperative at
both ends of the road.
Lack of long term financial planning. If a long term financial plan for the project is not
elaborated then there is a risk that the project will not have sufficient resources to continue to
protect the project area and ensure that a process of encroachment does not recommence. This can
be mitigated by developing a long-term plan whereby carbon and other sources of finance are
available to fund the project‟s activities in the long run.

72 Technical Feasibility Assessment of the Nam Phui National Protected Area REDD+ Project in Lao PDR
In order to arrive at an approximate quantification of the NP REDD proejct‟s non-permanence risk, the
VCS‟s buffer approach was applied (see Annex 3 for a more complete assessment). This resulted in an
overall risk score of 20.5. Accordingly, a non-permanence buffer discount of 20.5% was applied.
4.3.2. Net credit potential
The NP REDD project‟s overall credit potential is presented below in Table 21. These are not presented in
a linear per year fashion, but rather reflect the fact that verification episodes will not occur every year. Each
verification event incurs a cost and therefore it does not make sense to verify emission reductions unless a
minimum volume has been achieved. For the purposes of this modeling exercise a minimum threshold of
50,000 tCO2e was selected and 2012 was assumed to be the first year for a verification event. According to
VCS guidance, granted the non-permanence risk rating of the project does not increase, 15% of the total
credits in the risk buffer will be released for trading to the project partners once every five years. For
modeling purposes it was assumed that the non-permanence risk rating would not increase and buffer
credits made available.
The project‟s carbon credit potential from avoiding deforestation follows the same trend as its overall
emission reduction potential. The annual credit potential is low during the first 5 years and significantly
higher during the subsequent 10 years. Due to the low initial credit generation potential the project does
not achieve the minimum 50,000 tCO2e verification threshold until 2014, however, after this the project‟s
emission reduction potential is high enough that credits are generated on an annual basis. The project‟s
overall credit potential from avoiding deforestation totals 980,000 VCUs over 15 years, an average of
65,400 VCUs per year.
As observed above, the degradation and regeneration components provide limited additional emission
reduction potential. In this regard, the results for all three combined components are not significantly
different to the results for only avoiding deforestation. The additional credits allow the project to achieve
the 50,000 tCO2e threshold one year earlier (2013) and increases the total credit potential to 1.2 million
VCUs, an average of 80,900 VCUs per year.
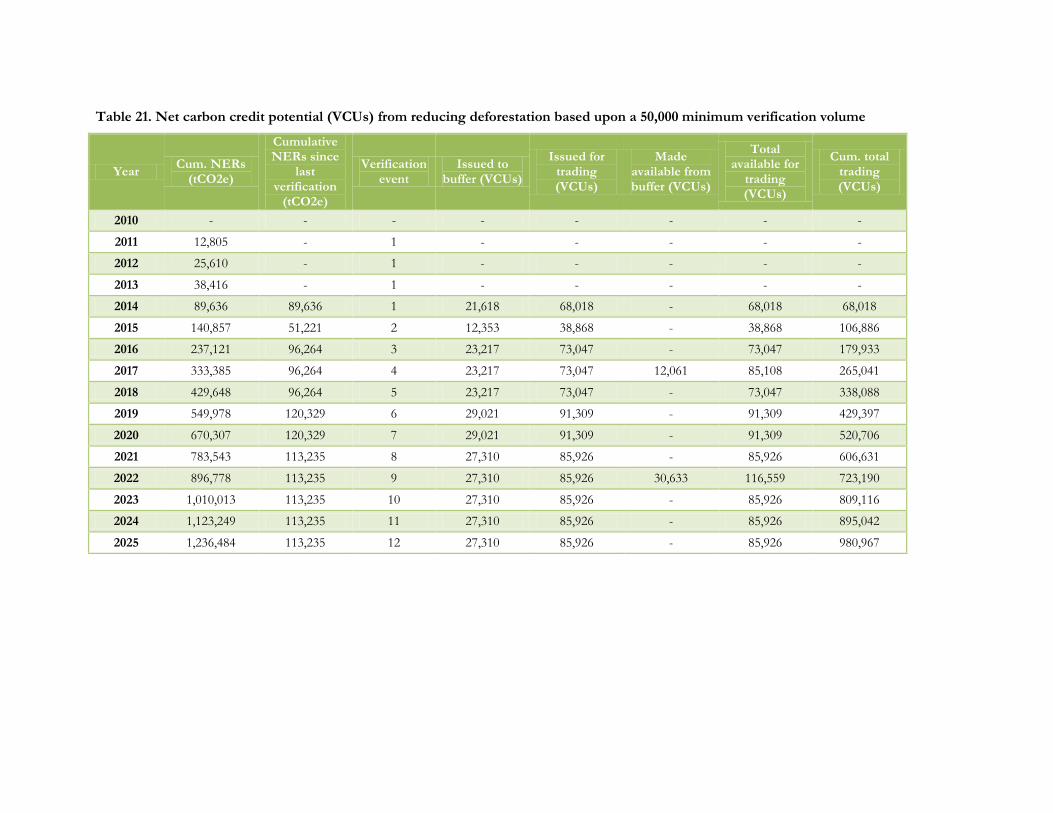
Table 21. Net carbon credit potential (VCUs) from reducing deforestation based upon a 50,000 minimum verification volume
Year Cum. NERs
(tCO2e)
Cumulative NERs since
last verification
(tCO2e)
Verification event
Issued to buffer (VCUs)
Issued for trading (VCUs)
Made available from buffer (VCUs)
Total available for
trading (VCUs)
Cum. total trading (VCUs)
2010 - - - - - - - -
2011 12,805 - 1 - - - - -
2012 25,610 - 1 - - - - -
2013 38,416 - 1 - - - - -
2014 89,636 89,636 1 21,618 68,018 - 68,018 68,018
2015 140,857 51,221 2 12,353 38,868 - 38,868 106,886
2016 237,121 96,264 3 23,217 73,047 - 73,047 179,933
2017 333,385 96,264 4 23,217 73,047 12,061 85,108 265,041
2018 429,648 96,264 5 23,217 73,047 - 73,047 338,088
2019 549,978 120,329 6 29,021 91,309 - 91,309 429,397
2020 670,307 120,329 7 29,021 91,309 - 91,309 520,706
2021 783,543 113,235 8 27,310 85,926 - 85,926 606,631
2022 896,778 113,235 9 27,310 85,926 30,633 116,559 723,190
2023 1,010,013 113,235 10 27,310 85,926 - 85,926 809,116
2024 1,123,249 113,235 11 27,310 85,926 - 85,926 895,042
2025 1,236,484 113,235 12 27,310 85,926 - 85,926 980,967

Table 22. Net carbon credit potential (VCUs) from reducing deforestation, degradation and increasing regeneration based upon a 50,000 minimum verification volume
Year Cum. NERs
(tCO2e)
Cumulative NERs since
last verification
(tCO2e)
Verification event
Issued to buffer (VCUs)
Issued for trading (VCUs)
Made available from buffer (VCUs)
Annual available for
trading (VCUs)
Cum. total trading (VCUs)
2010 - - - - - - - -
2011 21,281 - 1 - - - - -
2012 42,563 - 1 - - - - -
2013 63,844 63,844 1 15,398 48,446 - 48,446 48,446
2014 129,062 65,218 2 15,729 49,489 - 49,489 97,935
2015 194,280 65,218 3 15,729 49,489 - 49,489 147,424
2016 311,902 117,622 4 28,368 89,254 - 89,254 236,679
2017 429,524 117,622 5 28,368 89,254 15,539 104,793 341,472
2018 547,146 117,622 6 28,368 89,254 - 89,254 430,726
2019 692,515 145,369 7 35,059 110,309 - 110,309 541,035
2020 837,884 145,369 8 35,059 110,309 - 110,309 651,345
2021 976,158 138,275 9 33,349 104,926 - 104,926 756,271
2022 1,114,433 138,275 10 33,349 104,926 37,985 142,911 899,182
2023 1,252,707 138,275 11 33,349 104,926 - 104,926 1,004,108
2024 1,390,982 138,275 12 33,349 104,926 - 104,926 1,109,034
2025 1,529,257 138,275 13 33,349 104,926 - 104,926 1,213,960

Technical Feasibility Assessment of the Nam Phui National Protected Area REDD+ Project in Lao PDR 75
4.4. Financial assessment
The overall financial feasibility of a project depends upon the total carbon finance it can generate in
comparison to the overall costs for undertaking carbon project development and implementing REDD
activities. An assessment of these revenues and costs is provided below.
4.4.1. Carbon credit pricing
Prices for carbon credits vary according to the dynamics of the carbon markets, as well as the attractiveness
of a project to buyers. It is not possible to exactly forecast the prices a project may command from the
market, therefore scenario calculations were used as a basis for assessing the project‟s potential financial
flows. Three price scenarios were considered. For each scenario it was assumed that prices would increase
over time as a future REDD mechanism comes into place, thus increasing the demand for these types of
credits.
Low price – prices begin at USD 2.0 per tCO2e for the first five years and increase by USD 2.5 for
during each subsequent five year period. The initial price of USD 2.0 corresponds to a low price
forestry projects currently achieve on the voluntary markets
Medium price – prices begin at USD 5.0 per tCO2e for the first five years and increase by USD 7.5
for each subsequent five year period. The initial price of USD 5.0 corresponds to the average price
a forestry project may currently achieve on the voluntary markets and will provide a more accurate
prediction of the project‟s revenues based upon current market conditions
High price – prices begin at USD 10.0 per tCO2e for the first five years and also increase by USD
2.5 for each subsequent five year period. These prices correspond to what a highly charismatic
project on the voluntary markets might achieve where the ancillary social and biodiversity co-
benefits of the project are highly valued by a buyer.
4.4.2. Project costs
Three main cost categories exist for carbon offset projects: costs associated with carbon project
development, costs associated with mitigation activities and costs associated with monitoring activities.
Some of these costs will accrue only once, during the initial planning and project development stage, while
other costs accrue on a regular basis throughout the lifetime of the project. It should be noted that the NP
REDD project will be financially supported by the CliPAD program until the end of 2017. In this regard,
the project will not need to fund the initial project development costs, such as investing in infrastructure,
conducting initial capacity building trainings, purchasing materials or paying for the development of the
carbon project document (PD). Instead, to achieve financial sustainability the project will only need to
cover its ongoing project costs after 2017. This also means that any revenues accumulated during the initial
project years can be used to cover project costs at a later date. It will however be important that the
assumed initial start-up costs required up to 2017 be reconciled with the final CliPAD budget to ensure
that sufficient funds are available.
The ongoing operating costs for the NP REDD project are described below and summarized in Table 23.

76 Technical Feasibility Assessment of the Nam Phui National Protected Area REDD+ Project in Lao PDR
Management of the NP NPA. These are the basic costs required to have an effective
management unit in place. This includes costs for administration, salaries, enforcement, patrolling,
community outreach and biological monitoring. To arrive at an estimate of these costs, the NEPL
NPA was taken as an example. The NEPL NPA is the most actively managed NPA in Lao PDR
and considered a model for the region. Per hectare costs to manage this NPA were calculated and
applied to the full extent of the NP NPA, and not just the portion of the NPA that falls within the
REDD project area, as ultimately REDD revenues should cover all the costs to manage the NPA.
Sustainable agricultural extension activities. These are the ongoing costs required to maintain a
presence in the villages in and around the NPA to ensure that farmers continue to practice
sustainable forms of agriculture. Estimates for these costs were provided by the National
Agricultural and Forestry Extension Service (NAFES) from their Laos Extension for Agriculture
Project (LEAP). LEAP is a capacity building project that uses existing government structures to
provide trainings and agricultural extension services at the community level. DAFO and PAFO
extension agents firstly identify farmer learning groups with whom they then conduct trainings to
improve agricultural production methods. The members of these groups are then expected to
become champions of these new methods. This was the most relevant agricultural extension
program known to exist in Lao PDR and therefore used as a reference. A breakdown of these costs
is provided in Annex 2.
Fire management. As with the sustainable agricultural extension activities above, an ongoing
presence by NPA staff, local DAFOs and other national staff to ensure that fire management
techniques are continually practiced in the villages in and around the NPA will be required. This
includes ongoing fire prevention activities, trainings, purchasing of materials and managing and
monitoring of fire incidents. Costs for specific fire extension services were not available; therefore
it was assumed that the costs for this activity would be approximately one third of those for the
agricultural extension activities above.
Village development fund payments. A key component of this project is the payments made to
villagers to protect the forest and adopt more sustainable livelihood practices. These payments are
contingent upon the extent to which villages protect the forests identified in their conservation
agreements. It was estimated that an average of USD 10,000 would be required annually by each of
the project villages to incentivize the desired change in behavior. This however is an initial estimate
and more accurate cost estimates will need to be generated during stakeholder meetings with the
involved communities if the project decides to move towards project development.
Carbon standard related costs. Initial costs to develop the PD and get the project approved by
the VCS and CCB Standard will be borne by CliPAD. However, after 2017 the project will need to
cover the costs for the ongoing monitoring, reporting and verification (MRV) of the project‟s
emission reductions. Furthermore, registry related costs incur each time credits are issued. In
contrast to the above mitigation related costs, these carbon standard related costs accrue only in the
years when a verification event takes place (minimum verification volume assumed to be 50,000
tCO2e for this report).
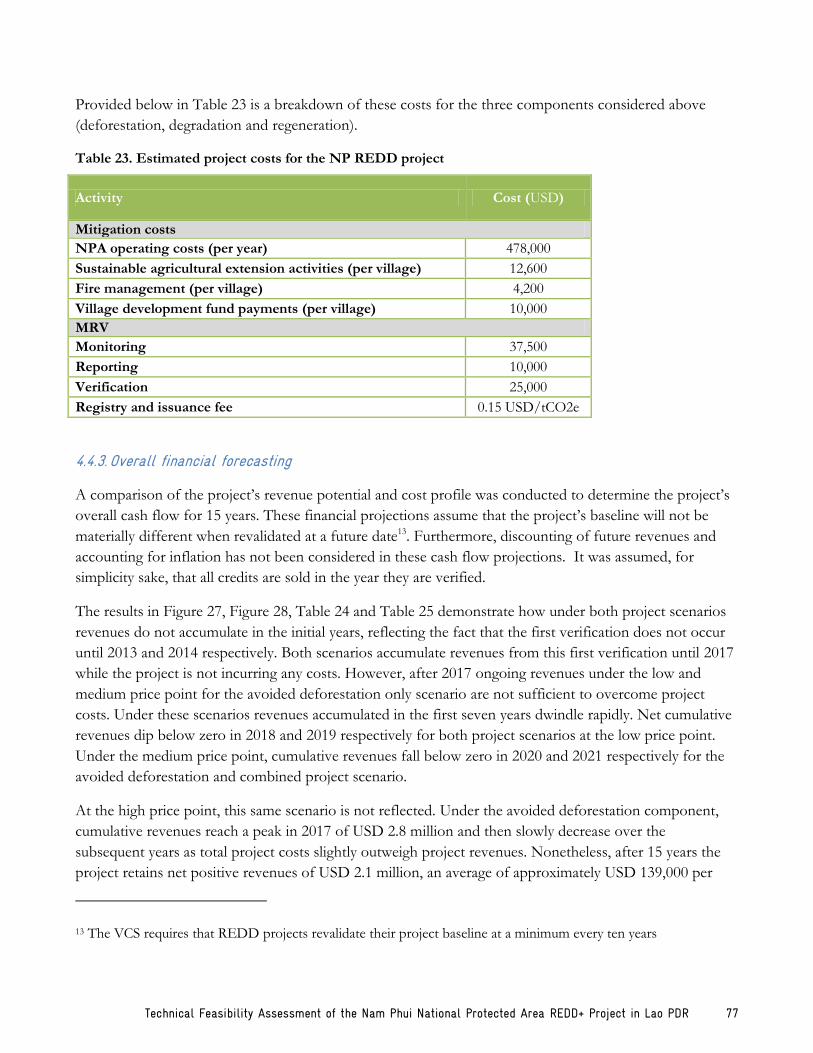
Technical Feasibility Assessment of the Nam Phui National Protected Area REDD+ Project in Lao PDR 77
Provided below in Table 23 is a breakdown of these costs for the three components considered above
(deforestation, degradation and regeneration).
Table 23. Estimated project costs for the NP REDD project
Activity Cost (USD)
Mitigation costs
NPA operating costs (per year) 478,000
Sustainable agricultural extension activities (per village) 12,600
Fire management (per village) 4,200
Village development fund payments (per village) 10,000
MRV
Monitoring 37,500
Reporting 10,000
Verification 25,000
Registry and issuance fee 0.15 USD/tCO2e
4.4.3. Overall financial forecasting
A comparison of the project‟s revenue potential and cost profile was conducted to determine the project‟s
overall cash flow for 15 years. These financial projections assume that the project‟s baseline will not be
materially different when revalidated at a future date13. Furthermore, discounting of future revenues and
accounting for inflation has not been considered in these cash flow projections. It was assumed, for
simplicity sake, that all credits are sold in the year they are verified.
The results in Figure 27, Figure 28, Table 24 and Table 25 demonstrate how under both project scenarios
revenues do not accumulate in the initial years, reflecting the fact that the first verification does not occur
until 2013 and 2014 respectively. Both scenarios accumulate revenues from this first verification until 2017
while the project is not incurring any costs. However, after 2017 ongoing revenues under the low and
medium price point for the avoided deforestation only scenario are not sufficient to overcome project
costs. Under these scenarios revenues accumulated in the first seven years dwindle rapidly. Net cumulative
revenues dip below zero in 2018 and 2019 respectively for both project scenarios at the low price point.
Under the medium price point, cumulative revenues fall below zero in 2020 and 2021 respectively for the
avoided deforestation and combined project scenario.
At the high price point, this same scenario is not reflected. Under the avoided deforestation component,
cumulative revenues reach a peak in 2017 of USD 2.8 million and then slowly decrease over the
subsequent years as total project costs slightly outweigh project revenues. Nonetheless, after 15 years the
project retains net positive revenues of USD 2.1 million, an average of approximately USD 139,000 per
13 The VCS requires that REDD projects revalidate their project baseline at a minimum every ten years

78 Technical Feasibility Assessment of the Nam Phui National Protected Area REDD+ Project in Lao PDR
year. For the combined project scenario, credit generation is sufficient that net cumulative revenues
continue to increase post 2017, accumulating USD 5.0 million after 15 years, an average of USD 337,000
per year.
Figure 27. Net cumulative cash flows over 15 years for the avoided deforestation component
Figure 28. Net cumulative cash flows over 15 years for reducing deforestation, degradation and increasing regeneration
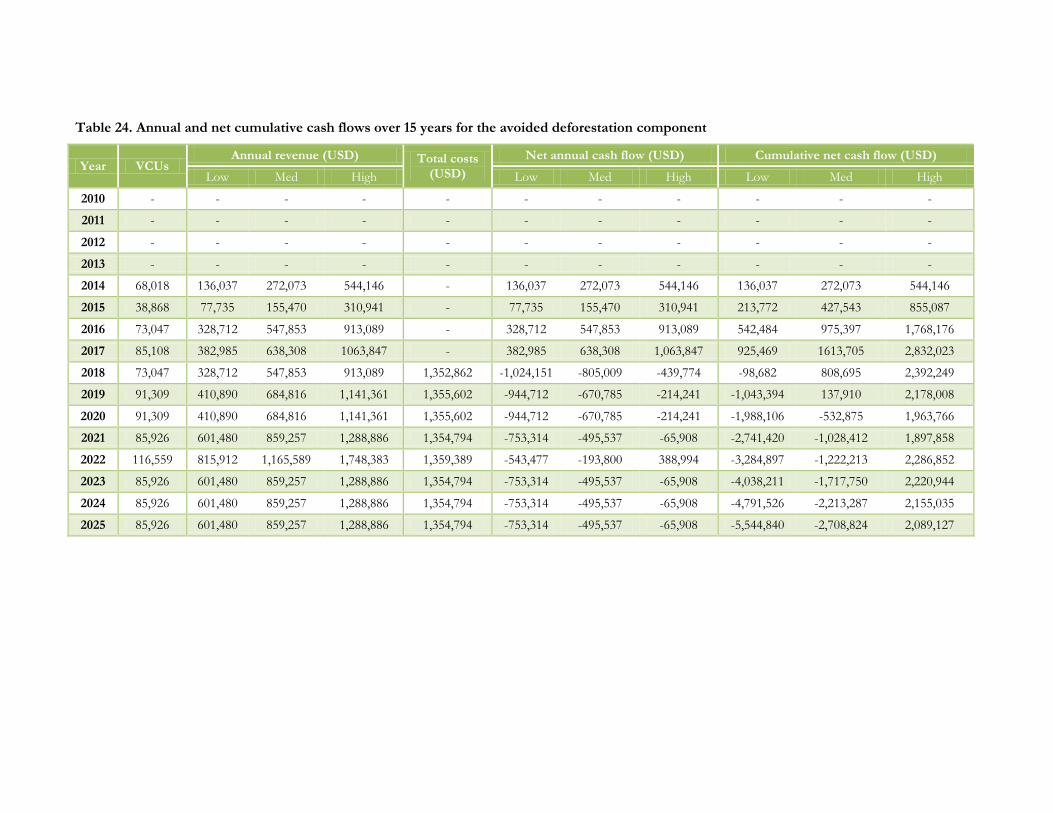
Table 24. Annual and net cumulative cash flows over 15 years for the avoided deforestation component
Year VCUs Annual revenue (USD) Total costs
(USD)
Net annual cash flow (USD) Cumulative net cash flow (USD)
Low Med High Low Med High Low Med High
2010 - - - - - - - - - - -
2011 - - - - - - - - - - -
2012 - - - - - - - - - - -
2013 - - - - - - - - - - -
2014 68,018 136,037 272,073 544,146 - 136,037 272,073 544,146 136,037 272,073 544,146
2015 38,868 77,735 155,470 310,941 - 77,735 155,470 310,941 213,772 427,543 855,087
2016 73,047 328,712 547,853 913,089 - 328,712 547,853 913,089 542,484 975,397 1,768,176
2017 85,108 382,985 638,308 1063,847 - 382,985 638,308 1,063,847 925,469 1613,705 2,832,023
2018 73,047 328,712 547,853 913,089 1,352,862 -1,024,151 -805,009 -439,774 -98,682 808,695 2,392,249
2019 91,309 410,890 684,816 1,141,361 1,355,602 -944,712 -670,785 -214,241 -1,043,394 137,910 2,178,008
2020 91,309 410,890 684,816 1,141,361 1,355,602 -944,712 -670,785 -214,241 -1,988,106 -532,875 1,963,766
2021 85,926 601,480 859,257 1,288,886 1,354,794 -753,314 -495,537 -65,908 -2,741,420 -1,028,412 1,897,858
2022 116,559 815,912 1,165,589 1,748,383 1,359,389 -543,477 -193,800 388,994 -3,284,897 -1,222,213 2,286,852
2023 85,926 601,480 859,257 1,288,886 1,354,794 -753,314 -495,537 -65,908 -4,038,211 -1,717,750 2,220,944
2024 85,926 601,480 859,257 1,288,886 1,354,794 -753,314 -495,537 -65,908 -4,791,526 -2,213,287 2,155,035
2025 85,926 601,480 859,257 1,288,886 1,354,794 -753,314 -495,537 -65,908 -5,544,840 -2,708,824 2,089,127
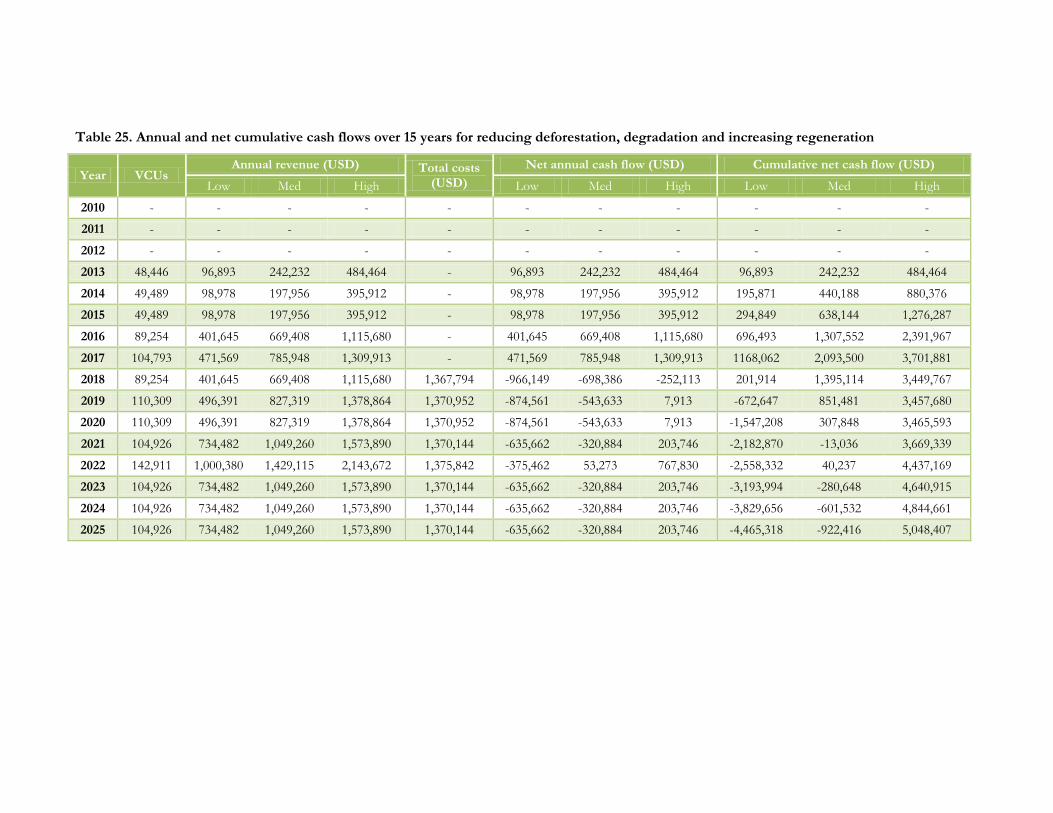
Table 25. Annual and net cumulative cash flows over 15 years for reducing deforestation, degradation and increasing regeneration
Year VCUs Annual revenue (USD) Total costs
(USD)
Net annual cash flow (USD) Cumulative net cash flow (USD)
Low Med High Low Med High Low Med High
2010 - - - - - - - - - - -
2011 - - - - - - - - - - -
2012 - - - - - - - - - - -
2013 48,446 96,893 242,232 484,464 - 96,893 242,232 484,464 96,893 242,232 484,464
2014 49,489 98,978 197,956 395,912 - 98,978 197,956 395,912 195,871 440,188 880,376
2015 49,489 98,978 197,956 395,912 - 98,978 197,956 395,912 294,849 638,144 1,276,287
2016 89,254 401,645 669,408 1,115,680 - 401,645 669,408 1,115,680 696,493 1,307,552 2,391,967
2017 104,793 471,569 785,948 1,309,913 - 471,569 785,948 1,309,913 1168,062 2,093,500 3,701,881
2018 89,254 401,645 669,408 1,115,680 1,367,794 -966,149 -698,386 -252,113 201,914 1,395,114 3,449,767
2019 110,309 496,391 827,319 1,378,864 1,370,952 -874,561 -543,633 7,913 -672,647 851,481 3,457,680
2020 110,309 496,391 827,319 1,378,864 1,370,952 -874,561 -543,633 7,913 -1,547,208 307,848 3,465,593
2021 104,926 734,482 1,049,260 1,573,890 1,370,144 -635,662 -320,884 203,746 -2,182,870 -13,036 3,669,339
2022 142,911 1,000,380 1,429,115 2,143,672 1,375,842 -375,462 53,273 767,830 -2,558,332 40,237 4,437,169
2023 104,926 734,482 1,049,260 1,573,890 1,370,144 -635,662 -320,884 203,746 -3,193,994 -280,648 4,640,915
2024 104,926 734,482 1,049,260 1,573,890 1,370,144 -635,662 -320,884 203,746 -3,829,656 -601,532 4,844,661
2025 104,926 734,482 1,049,260 1,573,890 1,370,144 -635,662 -320,884 203,746 -4,465,318 -922,416 5,048,407

Technical Feasibility Assessment of the Nam Phui National Protected Area REDD+ Project in Lao PDR 81
5. ARR Analysis
In addition to the REDD analysis above, an initial assessment of the carbon finance potential of ARR
activities to contribute to the management of the NP NPA was also conducted. This was not done to the
same level of detail as for REDD but rather conducted to provide an indicative assessment of the NP
NPA‟s ARR potential. As with the REDD analysis above, this includes the development of a baseline
scenario, the construction of project scenarios , an assessment of the overall credit and revenue generating
potential and a comparison to project implementation costs.
5.1. Baseline
5.1.1. Regional baseline scenario analysis
The village and government staff meetings allowed for a comprehensive understanding of the land use
dynamics in and around the NPA. These discussions were relevant both with regards to how the NPA‟s
forests are being used but also to understand the existing dynamics on converted land. Coupled with the
historical remote sensing analysis it was possible to identify two areas of non-forest upon which
reforestation activities could potentially be performed.
1. Agricultural lands. These are areas the lie both within and outside village boundary areas. This is
land that is under cultivation on a regular or rotational basis thus preventing any long term biomass
from accumulating. In some cases these lands may be left fallow for several years, however in the
long run they are likely to be reconverted for agricultural purposes. Significant biomass
accumulation is therefore not expected to occur on these lands.
2. Bamboo and unstocked/degraded areas. There is a large amount of shrublands or areas
dominated by bamboo within the NP NPA that do not meet the national forest definition. These
are areas classified as unstocked forest/bamboo in the land cover classification in Table 6. In both
cases these areas are subject to some form of ongoing degradation pressure such as agriculture,
logging or fire which for the most part prevents these lands from regenerating into forest. Only in
some cases do these areas return to forest, as the figures for increased forest cover show in Table
12. Some larger bamboo stands also exist within the forest. Bamboo is not considered a tree as per
Lao PDR‟s forest definition and therefore these areas cannot be considered forest. Nonetheless,
due to the size and density of these bamboo stands, these areas store significant amounts of
biomass and therefore carbon.
5.1.2. Identify baseline scenario
The same baseline assumptions for the ARR component are made as for the REDD component above.
This means that historical land use dynamics are expected to continue into the future and associated
historical changes in the existing non-forest areas can be projected into the future. Due to ongoing
degradation pressures the majority of these areas are not expected to accumulate biomass but remain in a
degraded or non-forest state. Nonetheless, the historical analysis identified a very small amount of area
within the NP NPA during each time period that converted from non-forest to forest and has been
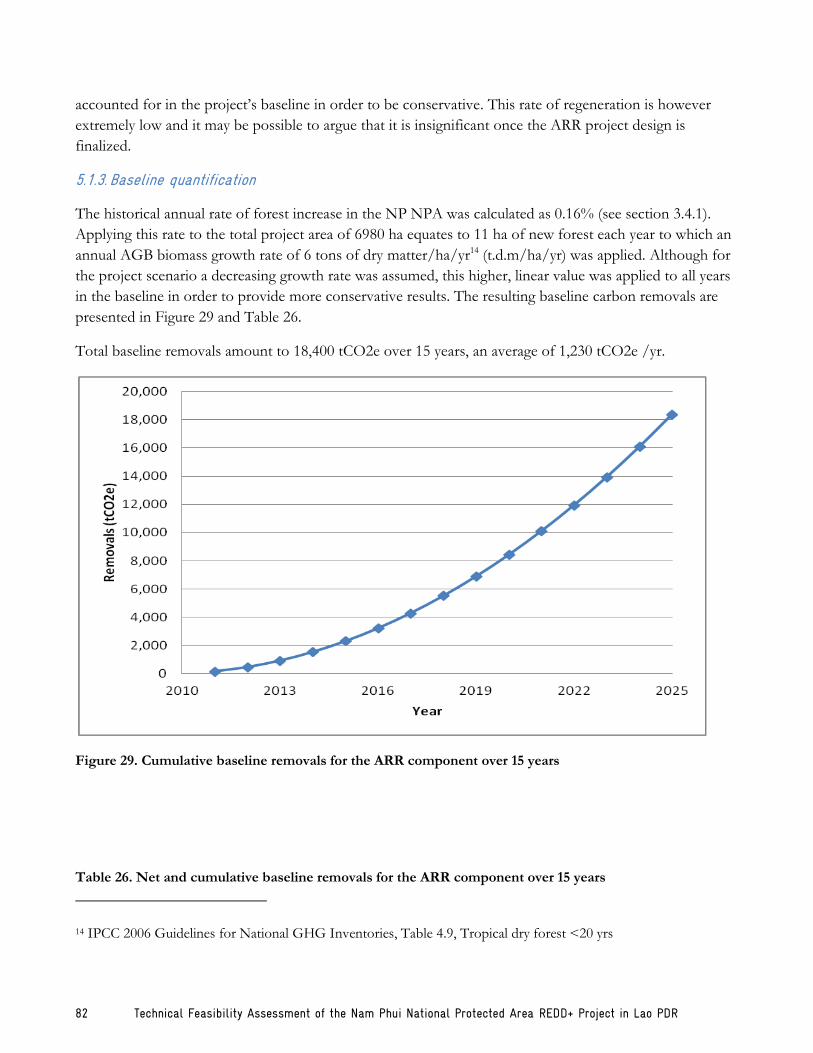
82 Technical Feasibility Assessment of the Nam Phui National Protected Area REDD+ Project in Lao PDR
accounted for in the project‟s baseline in order to be conservative. This rate of regeneration is however
extremely low and it may be possible to argue that it is insignificant once the ARR project design is
finalized.
5.1.3. Baseline quantification
The historical annual rate of forest increase in the NP NPA was calculated as 0.16% (see section 3.4.1).
Applying this rate to the total project area of 6980 ha equates to 11 ha of new forest each year to which an
annual AGB biomass growth rate of 6 tons of dry matter/ha/yr14 (t.d.m/ha/yr) was applied. Although for
the project scenario a decreasing growth rate was assumed, this higher, linear value was applied to all years
in the baseline in order to provide more conservative results. The resulting baseline carbon removals are
presented in Figure 29 and Table 26.
Total baseline removals amount to 18,400 tCO2e over 15 years, an average of 1,230 tCO2e /yr.
Figure 29. Cumulative baseline removals for the ARR component over 15 years
Table 26. Net and cumulative baseline removals for the ARR component over 15 years
14 IPCC 2006 Guidelines for National GHG Inventories, Table 4.9, Tropical dry forest <20 yrs

Technical Feasibility Assessment of the Nam Phui National Protected Area REDD+ Project in Lao PDR 83
Year Area
regenerated (ha)
Net annual baseline removals
(tC)
Cumulative baseline removals
(tC)
Cumulative baseline removals
(tCO2e)
2010 - - - -
2011 11 42 153 153
2012 11 84 307 460
2013 11 126 460 920
2014 11 168 613 1,533
2015 11 209 766 2,299
2016 11 251 920 3,219
2017 11 293 1,073 4,292
2018 11 335 1,226 5,518
2019 11 377 1,380 6,898
2020 11 419 1,533 8,430
2021 11 461 1,686 10,117
2022 11 503 1,839 11,956
2023 11 544 1,993 13,949
2024 11 586 2,146 16,094
2025 11 628 2,299 18,394
5.1.4. Methodology review
VCS program guidelines permit the use of any CDM methodology to account for a project‟s emission
reductions. As such, the project can choose from any of the currently approved CDM ARR methodologies
or suggest a new methodology. In order for an existing methodology to be applicable to the NP NPA
project case, it must contain the following elements:
Project activities can be implemented on agricultural lands. Methodologies prescribe the
eligibility of different land types for ARR activities. Due to the risk that these activities may be
displaced by the implementation of ARR activities it is necessary that the methodology contain
components to quantify this type of leakage and therefore allow ARR activities to occur on
agricultural lands. Although our analysis of eligible ARR areas excluded agricultural areas zoned
under PLUP, some of the areas identified as eligible may currently be agricultural lands.
Regeneration in the baseline. A small amount of natural regeneration occurs on the project
lands as agricultural lands are left as fallows. The methodology must allow for the quantification of
carbon removals in the baseline, above which the project removals can be calculated.
In light of the above requirements, it appears that the project can make use of two current CDM
methodologies: AR-AM004 “Reforestation or afforestation of land currently under agricultural use” or AR-
ACM0001 “Afforestation and reforestation of degraded land”. Both methodologies allow ARR activities to
be implemented on agricultural lands and include guidance on how to account for biomass increase in the
84 Technical Feasibility Assessment of the Nam Phui National Protected Area REDD+ Project in Lao PDR
baseline. Once a final project design for the ARR component of this project is available a final review of
these methodologies will need to be undertaken.
5.2. Project scenarios
5.2.1. Recommended activities
ARR projects must demonstrate that a greater amount of biomass is stored in the project scenario than
under the baseline. With regards to the ARR areas identified above this can be achieved in three ways.
1. Promote assisted natural regeneration. In many cases, removing or diminishing the drivers that
degrade these areas will be sufficient to allow forest to naturally regenerate. This technique is
possible in areas where sufficient seed stocks exist and few species that might inhibit tree growth
(e.g. elephant grass) are present. In some cases a small amount of land preparation may be needed,
such as weeding and liberation thinning, but otherwise an extension of the REDD activities to the
ARR lands (fire management and enforcement of PLUP plans) will permit these areas to
regenerate.
2. Enrichment planting. If it is determined that seed stocks are low or the land is too degraded to
regenerate on its own it may be necessary to aid regeneration by planting some native species. This
will increase the presence of trees, help improve seed stocks in the project area and facilitate the
process of secondary regeneration.
3. Clearing and replanting. A more drastic option in areas that are overrun by weeds or other
vegetation that prevents natural regeneration is to completely clear the land and replant it with
native species. Due to the strong regenerative capacity of forests in Lao PDR it is unlikely that this
option will need to be employed extensively on the project lands.
The above options have implications both with regards to cost of implementation and their associated
emissions. The first option is the cheapest and generates the fewest project emissions as only a limited
amount of biomass is cleared. The third option on the other hand would incur significant costs due to land
preparation, nursery establishment and outplanting. Clearing all of the existing vegetation would also incur
significant upfront carbon losses that the project would need to overcome.
For the calculations in this report it was assumed that project activities would follow the first option of
simply removing the drivers that are currently preventing these areas from returning to forest, rather than
clearing areas and establishing plantations. This is based upon the opinion of local forestry experts that
consider these areas capable of regenerating if the drivers of degradation are removed. Nonetheless, if the
decision is taken to move towards project development it will be necessary to conduct more accurate
surveys of these project lands to determine the extent to which they are degraded, their regenerative
potential and the amount of non-tree biomass that is expected to be lost or cleared. This will better inform
which of the above three project scenarios is most realistic.
Technical Feasibility Assessment of the Nam Phui National Protected Area REDD+ Project in Lao PDR 85
5.2.2. Eligibility and additionality
Presented below is an assessment of the project idea against the eligibility criteria of the VCS and CCB
Standards, followed by an assessment of the project‟s additionality.
VCS - The tree planting component of the NP NPA project falls under the VCS AFOLU category of ARR
by virtue of it being a sink project. The VCS requires that ARR projects demonstrate that no native
ecosystems have been cleared on the project lands within the 10 years prior to project start. It is for this
reason that the grassland areas identified within the project area were excluded from this analysis.
This historical analysis conducted for the REDD component allowed for the identification of areas that
have been classified as non-forest for at least ten years. As mentioned above in section 3.1.5, approximately
6980 ha of land in and around the boundaries of Ban Navene and Ban Paksong were identified that meet
the VCS‟s ARR eligibility criteria. This includes relatively small patches of area and it would need to be
determined at a later stage whether it is worth including these within the overall project areas. For the
purposes of this report these areas were included in order to provide an overall idea of the GHG removal
potential of ARR activities.
CCB Standards - As with the REDD analysis above, the ARR component satisfies the criteria of the CCB
Standards in relation to providing climate, biodiversity and community benefits. Nonetheless, the same
concerns raised above regarding the need for a formal consultation with all stakeholders, investigation into
the overall livelihood impact of the project, clarification on carbon rights and potential negative offsite
biodiversity impacts also apply to the ARR component. These will need to be investigated further before
complete compliance with all criteria can be established.
Additionality - The same reasoning as applied above for the REDD component can be used to
demonstrate additionality for the ARR component. Firstly, CliPAD‟s investments are clearly motivated by
the intent to generate carbon finance. Secondly, reforestation of these areas is for rehabilitation and
conservation purposes which will not generate any financial benefits, except for the sale of VCS credits,
clearly demonstrating its financial additionality. Finally, rehabilitation of degraded areas does not occur in
the area and therefore cannot be considered as common practice.
5.2.3. Expected GHG removals
An excel model was constructed to provide an indicative estimate of the GHG removal potential of the
ARR component of the NP NPA project. This involves a comparison of the expected removals in the
baseline compared to removals in the project scenario minus any emissions caused by leakage and initial
biomass clearing. Outlined below are the assumptions made when constructing the model:
Project start was assumed to be 2011 and calculations were made for 15 years into the future
50% of all existing biomass on site was assumed to be lost in the first year of the project. This
is based upon both the AR-ACM0001 and AR-AM0004 methodological assumption that all
existing non-tree vegetation disappears in the year of site preparation, either because of slash
and burn or future competition from planted trees. In the absence of data on the composition
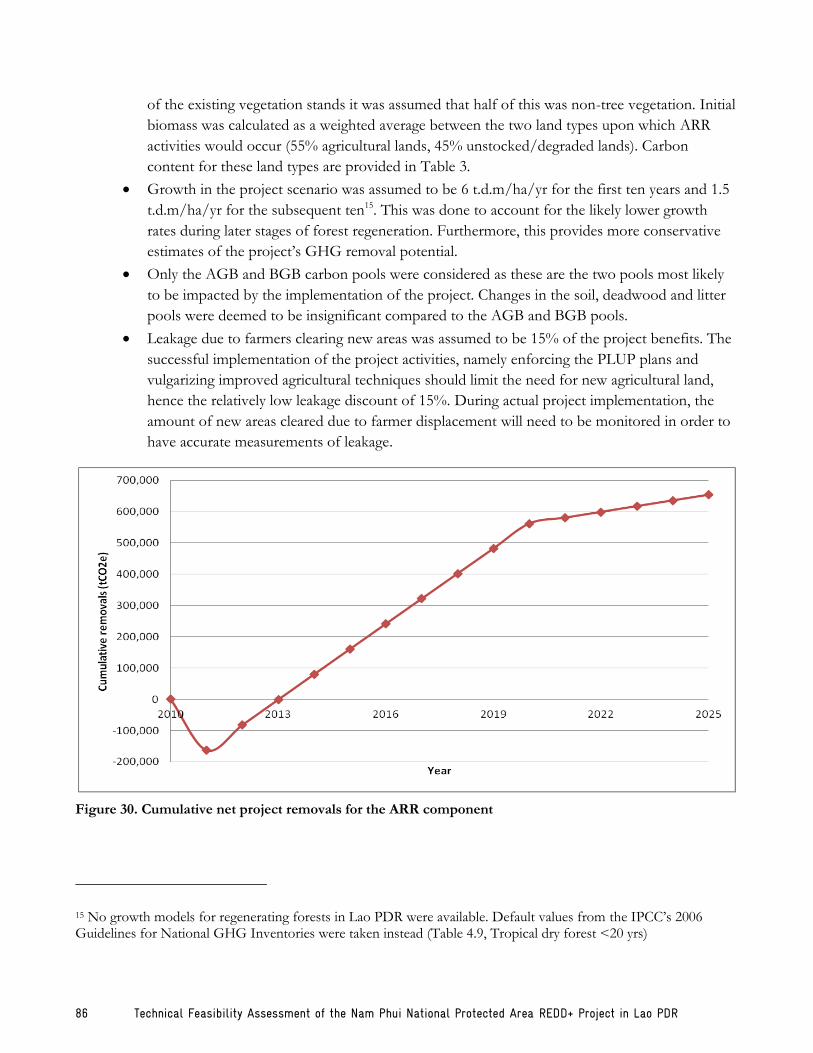
86 Technical Feasibility Assessment of the Nam Phui National Protected Area REDD+ Project in Lao PDR
of the existing vegetation stands it was assumed that half of this was non-tree vegetation. Initial
biomass was calculated as a weighted average between the two land types upon which ARR
activities would occur (55% agricultural lands, 45% unstocked/degraded lands). Carbon
content for these land types are provided in Table 3.
Growth in the project scenario was assumed to be 6 t.d.m/ha/yr for the first ten years and 1.5
t.d.m/ha/yr for the subsequent ten15. This was done to account for the likely lower growth
rates during later stages of forest regeneration. Furthermore, this provides more conservative
estimates of the project‟s GHG removal potential.
Only the AGB and BGB carbon pools were considered as these are the two pools most likely
to be impacted by the implementation of the project. Changes in the soil, deadwood and litter
pools were deemed to be insignificant compared to the AGB and BGB pools.
Leakage due to farmers clearing new areas was assumed to be 15% of the project benefits. The
successful implementation of the project activities, namely enforcing the PLUP plans and
vulgarizing improved agricultural techniques should limit the need for new agricultural land,
hence the relatively low leakage discount of 15%. During actual project implementation, the
amount of new areas cleared due to farmer displacement will need to be monitored in order to
have accurate measurements of leakage.
Figure 30. Cumulative net project removals for the ARR component
15 No growth models for regenerating forests in Lao PDR were available. Default values from the IPCC‟s 2006 Guidelines for National GHG Inventories were taken instead (Table 4.9, Tropical dry forest <20 yrs)

Technical Feasibility Assessment of the Nam Phui National Protected Area REDD+ Project in Lao PDR 87
Table 27. Net annual and cumulative project removals for the ARR component
Year
Net annual baseline
GHG removals (tCO2e)
Biomass loss
(tCO2e)
Project removals (tCO2e)
Leakage (tCO2e)
Annual net GHG
removals (tCO2e)
Cumulative net GHG removals (tCO2e)
2010 - - - - - -
2011 153 243,972 95,801 14,370 -162,695 -162,695
2012 307 0 95,801 14,370 81,124 -81,571
2013 460 0 95,801 14,370 80,971 -600
2014 613 0 95,801 14,370 80,817 80,217
2015 766 0 95,801 14,370 80,664 160,881
2016 920 0 95,801 14,370 80,511 241,392
2017 1,073 0 95,801 14,370 80,357 321,749
2018 1,226 0 95,801 14,370 80,204 401,953
2019 1,380 0 95,801 14,370 80,051 482,004
2020 1,533 0 95,801 14,370 79,898 561,902
2021 1,686 0 23,950 3,593 18,672 580,573
2022 1,839 0 23,950 3,593 18,518 599,092
2023 1,993 0 23,950 3,593 18,365 617,457
2024 2,146 0 23,950 3,593 18,212 635,668
2025 2,299 0 23,950 3593 18,058 653,727
As the results in Table 27 and Figure 30 show, the project incurs a loss in carbon stocks during the first
year which is not overcome until 2014. This loss relates to both the clearing and decay of outcompeted
existing non-tree vegetation. The project then steadily accumulates biomass until 2021 after which
removals occur more slowly. Total GHG removals over the 15 year lifetime of the project are estimated at
approximately 654,000 tCO2e, an average of approximately 43,600 tCO2e /yr.
5.3. Credit potential
Provided below is an analysis of the project‟s non-permanence risks and overall credit generating potential.
5.3.1. Non-permanence risks
The main non-permanence risks in the context of the NP ARR project are as following:
Incidence of fire. The risk of fire is a threat to the permanence of carbon stored in the trees.
These fires could spread from the surrounding forests or from fires used to clear fields. This risk is
especially pertinent during the earlier years of forest establishment when trees are more susceptible

88 Technical Feasibility Assessment of the Nam Phui National Protected Area REDD+ Project in Lao PDR
to fire damage. Active surveillance of the project areas will therefore be necessary. This is already
being done in the context of the REDD activities and should be extended to the ARR sites.
Agricultural encroachment. As above for REDD.
Poor management capacity of NP NPA management staff. As above for REDD.
In order to arrive at an approximate quantification of the NP NPA‟s non-permanence risk, the VCS‟s
buffer approach was applied (see Annex 4 for a more complete assessment). This resulted in an overall risk
score of 31. Accordingly, a non-permanence buffer discount of 31% was applied.
5.3.2. Credit generation potential
Presented below is the credit generating potential of the NP ARR project. These results include the same
minimum verification volume and buffer release assumptions as above for the REDD analysis.
Table 28 below shows that due to the fact that net positive GHG removals are not generated until 2014,
credits are also not generated until this date. It is only in 2014 that the minimum verification volume
requirement is satisfied. Verifications occur annually for the next six years until 2020 after which the slower
growth rates result in only two further verifications before the end of 2025. Approximately 453,500 credits
are generated over the 15 years, equating to a yearly average of 30,200 credits.

Table 28. Net carbon credit potential (VCUs) per year for the ARR component based upon a 50,000 tCO2e minimum verification volume
Year Cum. NERs
(tCO2e)
Cum. removals since last
verification (tCO2e)
Verification event
Issued to buffer
(VCUs)
Issued for trading (VCUs)
Made available
from buffer (VCUs)
Annual available
for trading (VCUs)
Cum. total trading (VCUs)
2010 - - - - - - - -
2011 -162,695 - 1 - - - - 0
2012 -81,571 - 1 - - - - 0
2013 -600 - 1 - - - - 0
2014 80,217 137,697 1 42,686 37,531 - 37,531 37,531
2015 160,881 95,034 2 29,461 51,203 - 51,203 88,734
2016 241,392 94,881 3 29,413 51,098 - 51,098 139,832
2017 321,749 94,728 4 29,366 50,992 19,639 70,631 210,463
2018 401,953 94,574 5 29,318 50,886 - 50,886 261,349
2019 482,004 94,421 6 29,271 50,780 - 50,780 312,129
2020 561,902 94,268 7 29,223 50,675 - 50,675 362,804
2021 580,573 - 8 0 0 - - 362,804
2022 599,092 - 8 0 0 - - 362,804
2023 617,457 66,332 8 20,563 34,992 32,949 67,941 430,745
2024 635,668 - 9 - - - - 430,745
2025 653,727 43,455 9 13,471 22,799 - 22,799 453,544

90 Technical Feasibility Assessment of the Nam Phui National Protected Area REDD+ Project in Lao PDR
5.4. Financial assessment
5.4.1. Carbon credit pricing
For the purposes of the financial assessment and calculating the project‟s revenue potential the same credit
sales prices were assumed for the ARR analysis as for the REDD analysis above.
5.4.2. Project costs
As with the REDD component above, the ARR component will incur mitigation activity costs and carbon
project development costs. Start-up cost estimates for forest regeneration activities are strongly dependent
on the extent of degradation. The SUFORD project uses cost estimates ranging from USD 20/ha, for
areas which simply require demarcation to allow natural regeneration to take place, to USD 250/ha for
areas which require nursery support and enrichment planting (Dickinson, pers. comm.). Costs after this
establishment period would be minimal and primarily borne by the REDD project activities.
However, as mentioned above, the CliPAD project will cover all initial implementation costs. It will
therefore only be necessary for the project to cover the ongoing carbon related MRV costs, as after 2017
the main activities to protect these ARR areas will be covered by the REDD component (patrolling, fire
management, enforcement of PLUP plans). For the purposes of the modeling it was therefore assumed
that only carbon MRV costs would incur after 2017. The MRV costs presented below in Table 29 are
slightly lower than those presented above in Table 23 for the REDD component. This is because of the
inherently more complex nature of a REDD project that contains three components that must undergo
MRV (deforestation, degradation and regeneration).
Table 29. ARR carbon project development costs
Activity Cost (USD)
MRV
Monitoring 25,000
Reporting 10,000
Verification 35,000
Registry and Issuance fee 0.15 USD/tCO2e
5.4.3. Overall financial forecasting
The cumulative cash flows for the three price scenarios over 15 years are presented below in Figure 31 and
Table 30. These cash flows have not been discounted nor has inflation been accounted for. Rather these
results represent the total amount that would be generated based upon the price points chosen in section
4.4.1. For simplicity it was assumed that the project would be able to sell all credits in the year they were
verified.
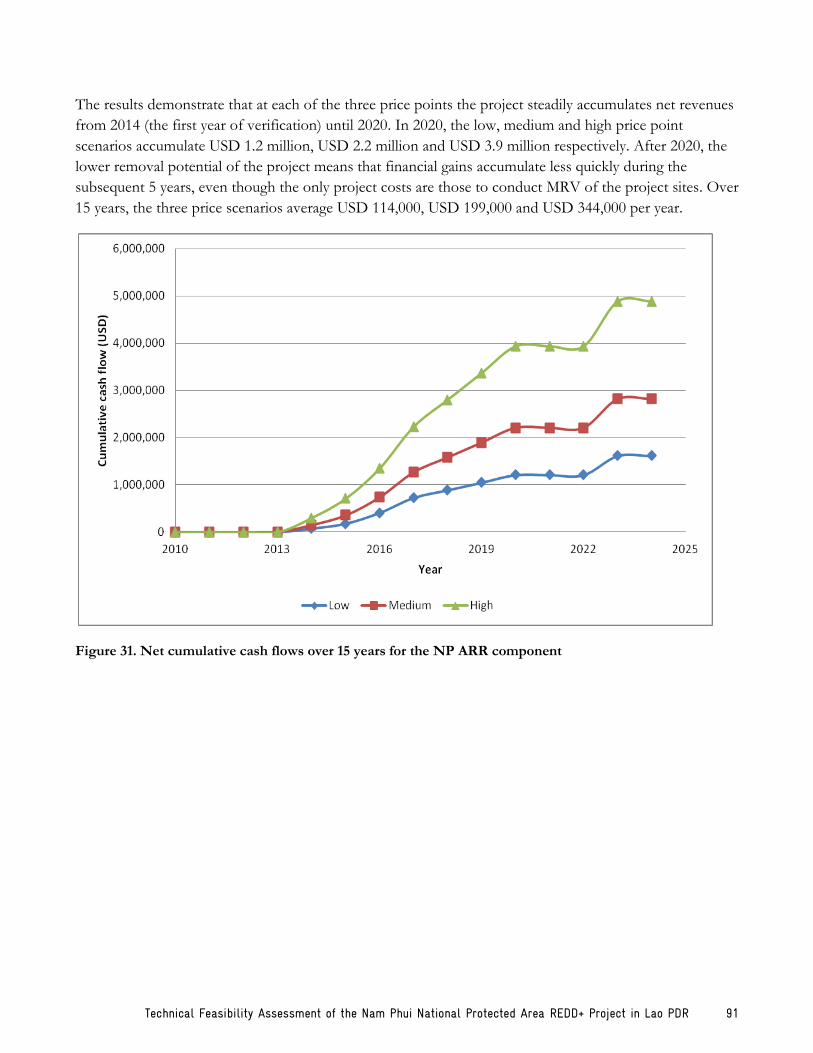
Technical Feasibility Assessment of the Nam Phui National Protected Area REDD+ Project in Lao PDR 91
The results demonstrate that at each of the three price points the project steadily accumulates net revenues
from 2014 (the first year of verification) until 2020. In 2020, the low, medium and high price point
scenarios accumulate USD 1.2 million, USD 2.2 million and USD 3.9 million respectively. After 2020, the
lower removal potential of the project means that financial gains accumulate less quickly during the
subsequent 5 years, even though the only project costs are those to conduct MRV of the project sites. Over
15 years, the three price scenarios average USD 114,000, USD 199,000 and USD 344,000 per year.
Figure 31. Net cumulative cash flows over 15 years for the NP ARR component
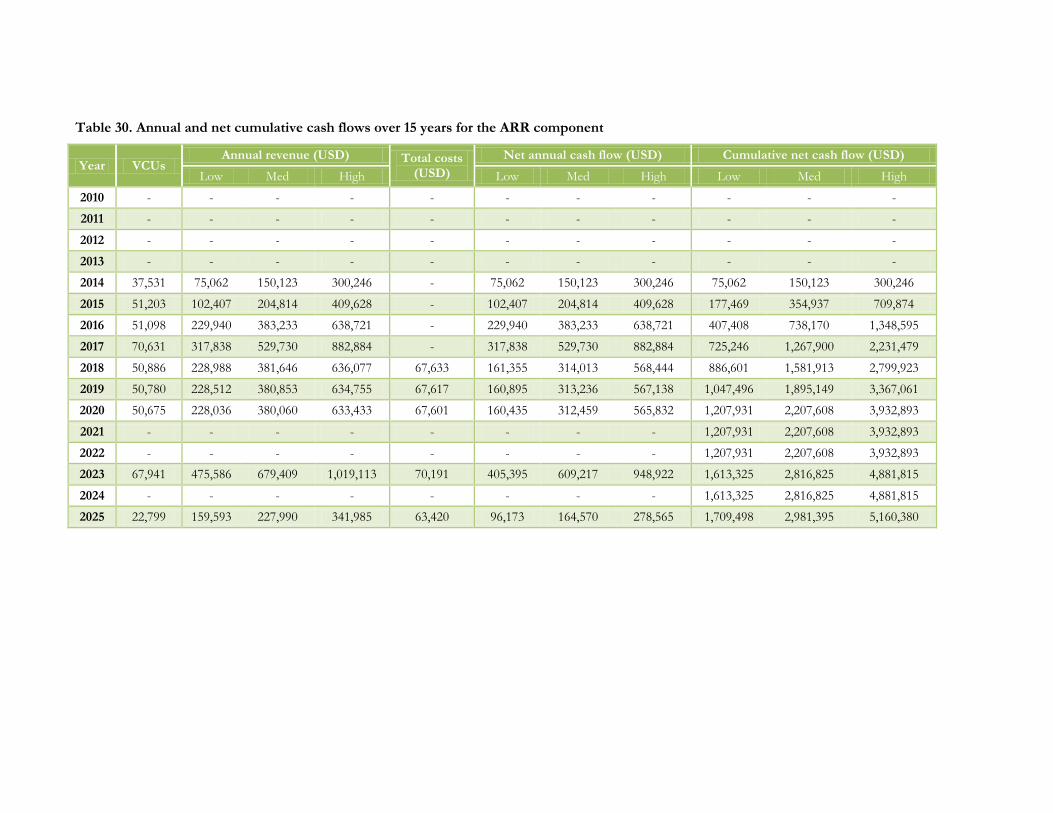
Table 30. Annual and net cumulative cash flows over 15 years for the ARR component
Year VCUs Annual revenue (USD) Total costs
(USD)
Net annual cash flow (USD) Cumulative net cash flow (USD)
Low Med High Low Med High Low Med High
2010 - - - - - - - - - - -
2011 - - - - - - - - - - -
2012 - - - - - - - - - - -
2013 - - - - - - - - - - -
2014 37,531 75,062 150,123 300,246 - 75,062 150,123 300,246 75,062 150,123 300,246
2015 51,203 102,407 204,814 409,628 - 102,407 204,814 409,628 177,469 354,937 709,874
2016 51,098 229,940 383,233 638,721 - 229,940 383,233 638,721 407,408 738,170 1,348,595
2017 70,631 317,838 529,730 882,884 - 317,838 529,730 882,884 725,246 1,267,900 2,231,479
2018 50,886 228,988 381,646 636,077 67,633 161,355 314,013 568,444 886,601 1,581,913 2,799,923
2019 50,780 228,512 380,853 634,755 67,617 160,895 313,236 567,138 1,047,496 1,895,149 3,367,061
2020 50,675 228,036 380,060 633,433 67,601 160,435 312,459 565,832 1,207,931 2,207,608 3,932,893
2021 - - - - - - - - 1,207,931 2,207,608 3,932,893
2022 - - - - - - - - 1,207,931 2,207,608 3,932,893
2023 67,941 475,586 679,409 1,019,113 70,191 405,395 609,217 948,922 1,613,325 2,816,825 4,881,815
2024 - - - - - - - - 1,613,325 2,816,825 4,881,815
2025 22,799 159,593 227,990 341,985 63,420 96,173 164,570 278,565 1,709,498 2,981,395 5,160,380

Technical Feasibility Assessment of the Nam Phui National Protected Area REDD+ Project in Lao PDR 93
5.5. Combined REDD and ARR analysis
The analysis above for the ARR and REDD components have been conducted separately due to the
different analytical approaches required to assess their feasibility. However, in essence, the REDD and
ARR components form part of the same project focused around the NP NPA. It is therefore instructive to
consider the overall financial feasibility of a comprehensive NP NPA project that includes all components.
This is especially pertinent since the assumption has been made under the ARR analysis that limited project
activities, beyond those already conducted as part of the REDD project, would be required to allow the
non-forest areas to regenerate. In this regard, the credits and financial flows generated by the ARR
activities would be benefits that would require little additional effort to create besides what is already
occurring under the REDD project. Any revenues generated could in turn be used to cover the overall
costs of managing the NP REDD project.
Provided below in Table 31 and Figure 32 are the combined net cumulative revenues of the REDD and
ARR components. The cumulative net revenues of the combined deforestation, degradation and
regeneration project scenario were added to those of the ARR component to understand the potential
financial flows from carbon credits from all forest carbon related activities associated with the NP NPA.
These results show that at the low price point, project costs remain higher than potential revenues and
once CliPAD‟s financial support stops in 2017, net cumulative cash flows become negative very quickly.
This further supports previous conclusions that at this lower price point this project is not feasible.
However, the positive cash flows at the medium price point associated with the ARR component are able
to supplement the REDD finance to a point where sufficient carbon financing would be available to
roughly cover project implementation costs. In contrast to the rapid decline observed under the REDD
only scenario, when combined with ARR finance net revenues are only slightly lower than costs meaning
that the project will still be in possession of USD 2 million in net revenues in 2025. This strongly suggests
that incorporating an ARR component to the overall project approach can have important financial
benefits for the project. Unsurprisingly, at the highest price point the REDD and ARR financial flows
complement each other, further enhancing the financial feasibility of both project scenarios.
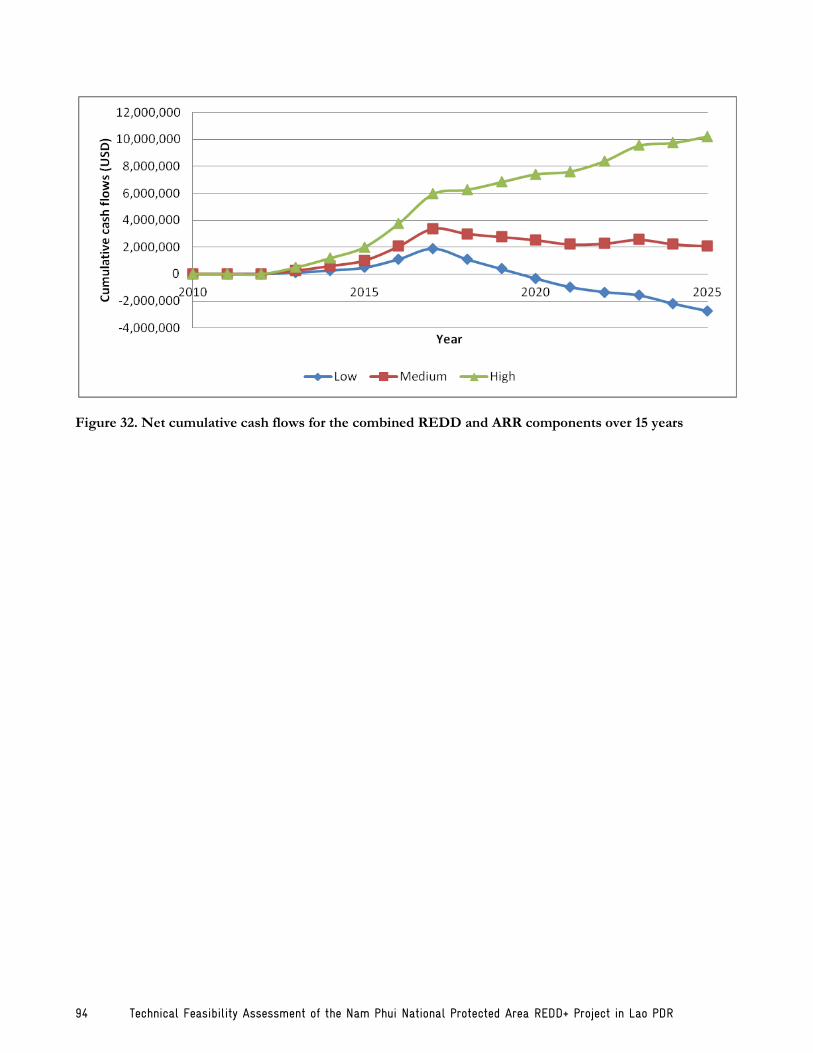
94 Technical Feasibility Assessment of the Nam Phui National Protected Area REDD+ Project in Lao PDR
Figure 32. Net cumulative cash flows for the combined REDD and ARR components over 15 years

Table 31. Net annual and cumulative cash flows for the combined REDD and ARR components over 15 years
Year REDD & Regeneration ARR Combined
Low Med High Low Med High Low Med High
2010 - - - - - - - - -
2011 - - - - - - - - -
2012 - - - - - - - - -
2013 112,818 282,046 564,092 - - - 112,818 282,046 564,092
2014 228,073 512,556 1,025,111 111,228 222,456 444,913 339,301 735,012 1,470,024
2015 343,328 743,065 1,486,130 222,809 445,618 891,236 566,137 1,188,683 2,377,366
2016 811,029 1,522,567 2,785,300 473,509 863,451 1,587,624 1,284,538 2,386,018 4,372,924
2017 1,344,790 2,412,168 4,267,969 791,402 1,393,273 2,470,661 2,136,192 3,805,442 6,738,630
2018 469,296 1,848,475 4,223,943 973,055 1,741,583 3,096,733 1,442,351 3,590,058 7,320,677
2019 -299,545 1,464,988 4,482,715 1,154,363 2,089,311 3,721,826 854,818 3,554,299 8,204,541
2020 -1,068,387 1,081,502 4,741,486 1,335,326 2,436,455 4,345,939 266,939 3,517,957 9,087,425
2021 -1,559,041 957,396 5,228,293 1,335,326 2,436,455 4,345,939 -223,715 3,393,850 9,574,232
2022 -1,803,871 1,186,773 6,248,018 1,335,326 2,436,455 4,345,939 -468,545 3,623,228 10,593,957
2023 -2,294,525 1,062,667 6,734,824 1,726,788 3,025,637 5,264,655 -567,738 4,088,304 11,999,480
2024 -2,785,180 938,561 7,221,631 1,726,788 3,025,637 5,264,655 -1,058,392 3,964,198 12,486,287
2025 -3,275,834 814,454 7,708,438 1,843,471 3,219,699 5,587,683 -1,432,364 4,034,153 13,296,121

Figure 33. Comparison of net cumulative revenues in 2017 and 2025 for RED (avoided deforestation component only), REDD (avoided deforestation, degradation and increasing regeneration), ARR and combined REDD and ARR project scenarios. Numbers in red indicate negative cash flows.

Technical Feasibility Assessment of the Nam Phui National Protected Area REDD+ Project in Lao PDR 97
6. Project Risks
Several risks can affect a project‟s ability to successfully generate carbon finance, both with regards to
implementation of the underlying activities and the ability to turn emission reductions into saleable carbon
credits. Before deciding to move ahead with project development it is important that the project consider
the relative impacts of these risks and adopt appropriate mitigation measures. These risks can be broadly
categorized as follows:
Operational and technical risks
Regulatory and policy risks
Market risks
6.1. Operational and technical risks
These are risks that would affect the implementation of project activities and therefore the ability to
generate emission reductions.
Local development goals override REDD project goals. Cash crop production has been
identified as the economic development priority for Thongmixai district and Ban Paksong.
Furthermore, plans are underway to upgrade the village of Ban Navene to “town” status which
could attract more people to this site. If local authorities do not coordinate their agricultural
development plans with the project or if migration into Ban Navene is not controlled there is a
significant risk that the pressure on the forests due to cash crop expansion and population growth
will be too great for the project to control. This is one of the most significant risks to the project‟s
success.
Lack of implementation support at district or provincial level. Support from the Xayabouli
PAFO and relevant DAFOs is crucial for the success of the project. These government agencies
will be in large part responsible for enforcing the PLUP plans, conducting fire management training
and supporting the NP NPA staff with its various management activities. A lack of operational
support to implement from these agencies will therefore have resulting impacts on the project‟s
ability to effectively reduce deforestation and degradation. The possible complicity of district and
provincial government staff with illegal logging activities in the NPA raises concerns as to the
extent that local government will be willing to contribute to the project‟s goals.
Limited impact of new agricultural techniques. Discussions with local government highlighted
the limited success past attempts to introduce new agricultural techniques have had in the province.
In part this was due to farmers‟ lack of interest to accept new techniques, although limited
government resources to properly vulgarize these techniques also played a part. It will be necessary
for the project to overcome farmer‟s skepticism of new techniques and quickly demonstrate their
financial benefits, otherwise the current trend towards increasing cash crop production will
continue and put the NPA‟s forests at further risk.
Limited experience with conservation agreements. Using conservation agreements with
REDD finance as a method to incentivize communities to protect their forest is a novel idea in Lao

98 Technical Feasibility Assessment of the Nam Phui National Protected Area REDD+ Project in Lao PDR
PDR. Examples of village level agreements exist from other sectors, such as WCS‟s experience
distributing ecotourism benefits to the village of Ban Son Koua in Houaphan province and private
sector agreements with communities for rubber production, and could be used as a basis for the
NP NPA project. There is however no prior experience with regards to REDD upon which to base
whether these agreements will be enough of an incentive to motivate communities to protect their
forests.
Population growth. Villages in and around the NPA are experiencing population growth which in
turn puts pressure on the forest as an increasing number of families require agricultural land. As
mentioned previously, although current PLUP plans account for population growth local villagers
are concerned that current allocations will not be sufficient. If this is the case, it will be very
difficult for the project to control the expansion of agricultural areas and related emissions caused
by forest clearance.
6.2. Regulatory risks
These are risks that impact the ability of a project to convert actual emission reductions into saleable
credits.
6.2.1. VCS and CCB Standards
Before the project can receive carbon credits for its verified emission reductions, it will need to pass
through the approval cycle of both the VCS and CCB Standards. Limited experience exists to date under
the VCS with regards to REDD projects. At present, only four REDD methodologies exist and only one
REDD project has been successfully issued with VCS credits. This lack of experience makes it difficult to
assess how strictly validators will interpret the general VCS guidelines and those specific to REDD
projects. While conservative estimates and best-practice methods have been adopted for this assessment,
and should be incorporated into a future PD, there remains a risk that the project may not be accepted by
the VCS Association.
More specifically, depending upon the final design of the project a new or revised methodology might need
to be developed. For example, depending upon the approach the project decides to account for emission
reductions from regeneration, the TGC methodology may need to be revised. REDD methodologies have
experienced notoriously long approval delays to date and there is a risk that a new methodology may not
be approved or at least cause significant delays.
6.2.2. National regulations
At present, Lao PDR is at an early stage with regards to establishing its national rules and regulations
related to REDD+. A new REDD+ Taskforce was recently established while the REDD+ Office, with
responsibility to coordinate and implement national level REDD+ activities, is yet to be established. This
however also means that an opportunity exists for the project to provide inputs to the development of
these rules and regulations to ensure that they are designed in a way supportive of the project‟s goals. In
particular, the way the following issues are treated within the national rules and regulations will affect the
project‟s ability to generate carbon finance.
Technical Feasibility Assessment of the Nam Phui National Protected Area REDD+ Project in Lao PDR 99
Carbon credit ownership. No regulations exist at present that clarify legal ownership of carbon
credits based on land tenure. Within the NPA a complex picture emerges where various
stakeholders could, in theory, be considered as the rightful owners. This includes local communities
(e.g. in Ban Paksong and Ban Navene), the NP NPA, DoF or MAF. This issue needs to be clarified
before agreements can be made on distribution mechanisms and before the project can enter into
any agreements for the sale of the project‟s credits.
Financial/credit revenue distribution mechanisms. Regulations prescribing how carbon
finance must be distributed between various local, regional or national stakeholders could have a
large impact on the overall feasibility of the project. Unfair or unclear regulations that divert
significant amounts of finance away from the actors on the ground (i.e. local communities or the
NP NPA) will ultimately decrease the ability of these actors to actually reduce emissions.
Taxation. The rate at which income from the sale of carbon credits sales will be taxed by the
national government will impact the amount of finance the project can generate. High tax rates will
reduce the amount of financial resources available to the project to reinvest into it project activities.
This is an issue that will need to be discussed and clarified with government staff responsible for
designing the national REDD+ framework.
Role of project activities within a national REDD+ scheme. While the NP NPA site is
recognized as an official REDD+ demonstration site by the REDD+ Taskforce, the way it is
integrated into a future national REDD+ scheme is of critical importance to the project‟s long-
term financial viability. The rules of a future national REDD+ scheme are yet to be defined,
meaning there is no clarity on how and to what extent the NP NPA might be able to access a
national REDD+ framework. The government of Lao PDR has expressed its interest to develop a
„nested framework‟ whereby project level activities would be nested within a national framework.
The design of such a scheme could have significant impacts on the emission reduction potential of
the project. For example, if the national nested approach calculates emission reductions differently
to the VCS this could result in potentially lower amounts of credits generated by the project.
Furthermore, whether projects will be allowed to access international markets directly or be
rewarded through national level payments will likely influence the amount of finance the project
can receive.
6.3. Market risks
As with any market, the laws of supply and demand in the carbon markets will determine the price and
overall market appetite for carbon credits from the project. This is an additional source of risk, beyond the
regulatory or policy risks mentioned above, and could impact the amount of carbon revenues indicated in
this assessment.
Price. Prices in the carbon markets have proven to be unstable historically. In the regulatory
markets, prices have fluctuated widely over the last few years, with a drop in EUA prices of over
70% between 2008 and 2009 and with an earlier drop from highs of around EUR 30 to below EUR
1 during the scheme‟s first phase (2005-2007). While these schemes, represent a range of different
technologies which does not include REDD, these fluctuations are indicative of some of the risks

100 Technical Feasibility Assessment of the Nam Phui National Protected Area REDD+ Project in Lao PDR
associated with entering the fledgling carbon markets. On the voluntary markets, average over-the-
counter (OTC) voluntary market prices steadily increased up to 2008 but dropped from USD 7.3 to
USD 6.5 from 2008 to 2009, principally in line with the poor overall economic climate. In 2010
average prices fell further to USD 6.0. On the other hand, average weighted prices for REDD
projects dropped from USD 6.3 to USD 2.9 between 2008 and 2009, before increasing again to
USD 5 in 2010.
Market demand. The market demand for specific project types can create particular challenges.
For example, current voluntary markets are limited in size and the market segment for forestry
credits is even smaller. However, the volume of the voluntary forestry market is directly linked to
consumer confidence in the quality and viability of credits being produced. This is exemplified by
the recent surge in REDD credits sold in the voluntary markets in 2010 following the approval of
the first REDD methodologies in 2010 which helped alleviate buyers‟ concerns related to this
project type. Encouragingly, REDD volumes transacted in 2010 jumped to 18 million tCO2
compared to 3 million tCO2 the year before.
Uncertainty with regards to the inclusion of REDD within compliance schemes, particularly the UNFCCC,
further influences demand for REDD credits in the voluntary markets. Buyers in the voluntary markets
have traditionally viewed the exclusion of REDD+ from compliance schemes as a sign that credits from
these project types were less desirable. This uncertainty has also limited the participation of pre-compliance
buyers in voluntary markets who would otherwise use this market as a testing ground in preparation for
future regulation. Clearer policy signals relating to REDD+ at the international level, such as the recent
Cancun Agreement, are therefore likely to have the trickledown effect of increasing demand for REDD+
credits on the voluntary markets.
Furthermore, the production of forestry credits have been bottlenecked by the development (or lack of)
adequate national regulations on REDD credit trading in several developing countries. Thus, the actual
market demand for the credits is difficult to judge by volume alone, with price elasticity of demand and
supply being hard to identify.
Carbon prices and demand volume for REDD credits in the voluntary markets may well increase or
stabilize in the medium-to-long term, however, based upon some of the regulatory and policy uncertainties
mentioned above there is a degree of uncertainty as to when and at what levels this will happen.
Technical Feasibility Assessment of the Nam Phui National Protected Area REDD+ Project in Lao PDR 101
7. Conclusions and Recommendations
7.1. REDD
The NP NPA and surrounding villages have been subject to a number of drivers of deforestation and
degradation over the recent past that have slowly impacted forest cover. Due to a lack of funding for the
NPA management unit, especially over the past ten years, it has not been possible to implement
meaningful management interventions to protect the NPA. Without an upscaling of the current levels of
protection, it is certain that both the forests and biodiversity contained within the NPA and surrounding
villages will suffer further.
The NP REDD project aims to establish a functioning NPA management unit that will simultaneously
provide environmental benefits (climate protection, wildlife management, biodiversity conservation) as well
as community benefits (more secure land tenure, improved agricultural practices, local development
opportunities). Based on the analysis in this report, the following conclusions and recommendations can be
made about the feasibility of implementing REDD activities in and around the NP NPA.
7.1.1. Financial feasibility
The financial modeling of the NP REDD project indicated that full financial sustainability can be achieved
only at the highest price point (USD 10) for the combined scenario that includes avoided deforestation,
avoided degradation and increased degradation. Here, additional funding beyond that needed for running
the NPA and MRV costs would be available, suggesting that additional management interventions to
further protect the NPA could be implemented. Although revenues will accumulate during the early years
for each of the project scenarios and price points (while CliPAD covers all project costs) the accumulated
and ongoing revenues under the low and medium price point are not sufficient to cover the NPAs
operating and carbon MRV costs after 2017. At both the low and medium price points, net cumulative
revenues rapidly fall below zero following CliPAD‟s exit. The avoided deforestation only scenario at the
high price point does not achieve full financial feasibility, in that costs post 2017 slightly exceed revenues.
However, due to the revenues accumulated prior to 2017 the project still retains positive net cumulative
revenues after 2025. In this regard, the pre-2017 accumulated revenues can act as a fund upon which the
project can draw on to cover any shortfalls in annual revenue. While this is not financially sustainable in the
long-run it will allow the project to persist for many years after CliPAD‟s exit.
Current prices in the voluntary markets hover around the USD 3 – 5 range for forest carbon projects. It is
likely, however, that prices both in the voluntary carbon market and in a future REDD compliance scheme
would be higher than this as greater demand is created through pre-compliance market players, such as
entities or bodies with future compliance obligations. It is therefore reasonable to assume that prices in the
USD 5 – USD 10 range are possible for the NP REDD project going forward. While this has been
modeled under all three scenarios, it is only the highest price point that achieves financial sustainability.
The project‟s financial feasibility is therefore closely linked to market dynamics and the sales prices the
project can achieve.

102 Technical Feasibility Assessment of the Nam Phui National Protected Area REDD+ Project in Lao PDR
7.1.2. Technical and operational feasibility
The NP REDD project‟s capacity to generate the financial revenues mentioned above is contingent upon
its ability to actually reduce the impact of the drivers of deforestation and degradation. The project‟s
greatest emission reduction potential comes from preventing deforestation, namely stopping the ongoing
agricultural expansion in the project area through better land-use planning and the communication and
training of improved agricultural techniques. Both of these methods hold promise as current land-use plans
are not enforced and little to no agricultural extension activities are promoted in the project area. It is
therefore felt that the identified REDD project activities hold reasonable potential to slow this expansion
and loss of forest areas.
Several possible agricultural extension activities are outlined in section 4.2.1. It is recommended that the
project select only a few of these activities to begin with, rather than attempt them all during the initial
years. This will give farmers time to properly adopt each new technique before being introduced to a new
technique. Furthermore, this will reduce the burden on the NPA management team and the number of
trainings it will have to conduct. To maximize the project‟s emission reduction potential it is recommended
that more thorough investigation be done into the agricultural practices of the area. This will allow the
project to select and promote the agricultural techniques that offer the greatest potential of slowing the
agricultural expansion and therefore creating emission reductions. Better understanding the agricultural
context in the region will also help to better design the conservation agreements and determine the likely
amounts required to promote a change in behavior. Currently, quite low project efficacies have been
assumed for the initial years of the project lifetime. If behavioral change can be achieved more quickly, this
will improve the overall emission reduction potential of the project.
Addressing emissions due to degradation, namely from fires and illegal logging, should be possible through
increased fire management trainings as well as patrolling and enforcement throughout the NPA. For
obvious reasons, illegal logging is a sensitive issue in the project region and several potential project
stakeholders appear to be involved with this activity. It will therefore be necessary to understand this driver
more deeply when moving towards project development to ensure this driver is properly and effectively
addressed. Nonetheless, the emission reduction potential from these activities remains low and greater
focus should be placed on reducing deforestation due to agricultural expansion.
The likely biggest threat to actually achieving emission reductions in the long run is population growth.
While there is little a REDD project can do to address natural population growth within villages, it is
possible for the REDD project to ensure that additional immigration is prevented, especially if the village
of Ban Navene is upgraded to town status. In this regard, it is recommended that the REDD project liaise
closely with local government to ensure that their development goals do not conflict with the REDD
project‟s goals. Furthermore, a careful review of the PLUP plans for each village should be conducted to
ensure that adequate amounts of agricultural land are assigned to each village.

Technical Feasibility Assessment of the Nam Phui National Protected Area REDD+ Project in Lao PDR 103
7.1.3. Recommended next steps
Provided below are several recommendations for immediate next steps if the decision to move towards full
project development is taken. These relate both to better understanding the project context as well as
clarifying issues that impact the overall feasibility of implementing a NP REDD project. A more detailed
workplan of the required next steps to achieve project registration is provided in Annex 2.
The emission reduction calculations in this report were subject to substantial discounts based upon
the interpretation accuracy of historical forest and land cover maps and the number of images
chosen for the historical analysis. Improving the accuracy of these interpretations as well as adding
an additional image to the historical time series should be a priority for the project. Avoiding these
discounts will greatly assist the project to increase its emission reduction potential and consequently
its overall financial feasibility.
A full and open stakeholder consultation should be held with the villages likely to be impacted by
the project based upon FPIC principles. This will ensure that communities are fully informed of
project goals and objectives as well as gauge their interest and willingness to participate in the
project. Without the engagement of these communities it will be difficult for the project to
effectively reduce baseline rates of deforestation and degradation and therefore the possibility of
generating carbon finance. These meetings will also help to understand possible negative impacts of
the project on local communities as well as how to best design the conservation agreements. Once
completed, the project should look to incorporate feedback from these stakeholder meetings into
the final project design.
Legal clarity on who has the rights to the accrued carbon benefits and how these rights can be
transferred to third parties should be pursued at the national level. This is important with regards
to understanding who can contract for the sale of credits as well as who will need to be
compensated for having implemented REDD activities.
Clarity on national regulations for the distribution of carbon finance should also be sought. The
manner and extent to which carbon finance revenues are distributed between different stakeholders
will determine how much those who address behaviors that reduce deforestation are compensated.
If this distribution mechanism is not properly designed then it is unlikely that REDD finance will
have the desired effect.
More investigation should be conducted into the forest dynamics of the NP NPA. This is needed
to understand the extent to which degraded areas (e.g. low density MDF) are able to regenerate as
well as identifying possible sites for regeneration. The results of this study will also help to
determine the approach the project should take with regards to accounting for emission reductions
from regeneration.
7.2. ARR
The above analysis identified a substantial amount of area in the vicinity of the villages of Ban Navene and
Ban Paksong that is eligible for ARR activities. These are areas that were historically deforested, mainly for
village agricultural purposes but that now sit outside of the PLUP allocated agricultural zone. These sites
104 Technical Feasibility Assessment of the Nam Phui National Protected Area REDD+ Project in Lao PDR
represent additional areas from which credits and carbon finance could be generated and therefore
contribute to the annual costs of running the NPA. Based on the analysis in this report, the following
conclusions and recommendations can be made about the feasibility of implementing ARR activities in the
NP NPA.
7.2.1. Financial feasibility
Due to the fact that ARR project incurs no costs until 2017 and only MRV costs after that, the ARR
component of the NP NPA project is financially sustainable at all three price points over the 15 years of
analysis. Revenues accumulate steadily between 2014 and 2020 before the lower growth rates during the
subsequent ten years of project lifetime set in. After this, revenues accumulate more slowly.
The ARR component of this project, after the initial land preparation and protection over the first few
years, benefits from the same project activities as the REDD component. It is for this reason that the ARR
component is considered to have only carbon MRV costs after 2017. This means that for relatively little
additional effort (MRV, tracking leakage) the NP NPA ARR project could supplement revenues generated
from REDD activities. While at the low price point the project remains unfeasible, including ARR greatly
improves the overall financial feasibility of the REDD component at the medium and high price points.
For this reason, it is strongly recommended that a project in and around the NP NPA consider generating
carbon finance from both REDD and ARR activities.
7.2.2. Technical and operational feasibility
The ARR analysis conducted for this study made certain assumptions about possible eligible ARR areas in
and around the villages of Ban Navene and Ban Paksong. It remains to be determined whether the full
extent of these areas are ideal ARR project sites. Furthermore, it remains to be seen how much area in the
other REDD project villages could also benefit from ARR activities. There is currently little understanding
of the degree of degradation on these sites and therefore what kind of project activities will be required on
each parcel of land. Nonetheless, due to the known regenerative capacity of forests in Lao PDR it is
expected that large amounts of land preparation, nursery establishment or outplanting will not be
necessary. This simplifies the likely types of activities required to promote growth in these areas to
liberation thinning and patrolling. This significantly reduces the amount of project risk and possibility of
project failure.
As mentioned previously, both with regards to possible non-permanence risks and eligibility of the ARR
project under the CCB Standards, it is necessary to understand to what extent local communities derive
their livelihoods from these identified ARR sites. The CCB Standards require that the implementation of a
forest carbon project does not lead to the displacement of local people from areas important for their
livelihoods. Not only does this cause hardship for local communities but in increases both the risk of
leakage and non-permanence. In this regard, better understanding the use of these lands will be crucial
before moving ahead with project development.
Technical Feasibility Assessment of the Nam Phui National Protected Area REDD+ Project in Lao PDR 105
7.2.3. Recommended next steps
Provided below are several further recommendations for immediate next steps in order to better
understand the possible context of implementing an ARR project in the NP NPA. The more detailed
workplan in Annex 2 contains additional guidance on the required next steps to achieve project
registration. As with REDD above, issues relating to carbon credit ownership, distribution mechanisms
and stakeholder engagement are all applicable to the ARR project as well.
The above recommended study into forest dynamics and agricultural practices in and around the
NP NPA should also focus on identifying possible ARR sites, determine what these lands are
currently being used for, assess the extent to which they are degraded and identify possible
management interventions to help them regenerate. This study should also focus on better
understanding the regenerative growth capacity of non-forest lands back into forest.
Stakeholder consultations should explore the possibility of conducting ARR activities so as to
assess villagers‟ willingness to dedicate lands to reforestation activities. Local input may also help
identify areas best suited for ARR activities and with high growth potential.
Based on the above studies and consultations with villagers, a clear project plan should be
elaborated. This should identify the project areas as well as the management interventions expected
to be undertaken as part of the ARR project.

106 Technical Feasibility Assessment of the Nam Phui National Protected Area REDD+ Project in Lao PDR
Annex 1 References
CCBA (2008) Climate, Community & Biodiversity Project Design Standards Second Edition. CCBA, Arlington, VA.
December, 2008. At: www.climate-standards.org
Chazée, L. (2001) The Mrabri in Laos - A world under the canopy. White Lotus Press, Bangkok, Thailand
GoL (2010) Manual: Participatory Agriculture and Forest Land Use Planning at Village and Village Cluster Level.
Vientiane, Lao PDR
IPCC (2003) Good Practice Guidance for Land Use, Land-Use Change and Forestry. Institute for Global
Environmental Strategies, Hayama, Japan.
IPCC (2006) 2006 IPCC Guidelines for National Greenhouse Gas Inventories. Institute for Global Environmental
Strategies, Hayama, Japan.
Kiyono, Y., Ochiai, Y., Chiba, Y., Asai, H., Saito, K., Shiraiwa, T., Horie, T., Songnoukhai, V., Navongxai,
V. & Inoue Y. (2007) Predicting chronosequential changes in carbon stocks of pachymorph bamboo communities in slash-
and-burn agricultural fallow, northern Lao People’s Democratic Republic. Journal of Forest Research, 12 (5): 371-383
Sogreah, I. (1997) Nam Leuk Hydropower Project: survey of the vegetation biomass density of the reservoir area. Lao
PDR, Vientiane.
VCS (2011a) AFOLU Non-Permanence Risk Tool. VCS, Washington D.C., 8 March 2011. Available at:
www.v-c-s.org
VCS (2011b) Agriculture, Forestry and Other Land Use (AFOLU) Requirements. VCS, Washington D.C., 8
March 2011. Available at: www.v-c-s.org
VCS (2011c) VCS Standard. VCS, Washington D.C., 8 March 2011. Available at: www.v-c-s.org
Vesa, L. (2009) Processing of NFI data for Lao PDR. SUFORD, Vientiane, Lao PDR.

Technical Feasibility Assessment of the Nam Phui National Protected Area REDD+ Project in Lao PDR 107
Annex 2 Agricultural Extension Activity Costs
Provided below are the assumptions made for the costs required to conduct ongoing agricultural trainings
in the project villages. These are provided on a per village basis and are based off of data provided by
NAFES from their LEAP project. These figures include support for district and provincial structures (e.g.
DAFO and PAFO) to implement the village level activities.
Item Amount Unit Cost
Demonstration activities
DSA
Transportation
Materials
Other
District 750,000 12 9,000,000
Province 4,500,000 12 54,000,000
Administration
Stationary
Maintenance of office equipment
Telephone
District 1,000,000 12 12,000,000
Province 1,100,000 12 13,200,000
Vehicles
Maintenance and repair
Insurance
Fuel and oil
District 3,600,000 1 3,600,000
Province 1,800,000 1 1,800,000
Accounting
District 400,000 12 4,800,000
Province 200,000 12 2,400,000
Total (kip) 100,800,000
Total (USD) 12,600

108 Technical Feasibility Assessment of the Nam Phui National Protected Area REDD+ Project in Lao PDR
Annex 3 Combined REDD & ARR Work Plan
Provided below is a proposed work plan for the roll-out of both the REDD and ARR activities. REDD
activities are most likely to be the priority for this project and therefore should be the focus of the first
year, followed by ARR activities in the second.
Year Key tasks
Q3 – 4 2011 Finalize decisions on project area and reference region location
Q2 – 4 2011
Begin FPIC process with stakeholders
- Explain project idea, roles and responsibilities, benefits and risks
- Gauge villager willingness to sign conservation agreements
Q2 – 4 2011 Clarify carbon ownership at district, provincial and national level
Q2 – 4 2011 Clarify distribution key requirement for all project stakeholders
Q3/4 2011
Finalize ARR project concept
- Identify distinct project parcels and extent of degradation
- Decide on project activities on each project parcel
- Conduct a more detailed costing exercise
Q3/4 2011 –
Q1/2 2012
Conduct study to better understand local forest dynamics
- Gain better understanding of transitions between low and high density MDF
(for degradation component) and regenerative capacity of forests (for ARR)
Q3 /4 2011 -
Q1/2 2012 Finalize PLUP in all target villages
Q4 2011 –
Q1/2 2012 Establish patrol stations and check points
Q1/2 2012
Begin data collection and draft PD
- Finalize reference area
- Develop or revise methodology
Q1/2 2012 Establish conservation agreements with target villages
Q1/2 2012 Begin capacity training for NP NPA management staff
Q1/2 2012 Conduct carbon inventory of different land and forest classes
Q1/2 2012 Begin carbon monitoring
Q2 2012 Begin agricultural extension and fire management activities in target villages
Q3/4 2012 Establish village development funds
Q3/4 2012 Submit PD to VCS
Q1/2 2013 Prepare project areas for ARR activities
2013 onwards
Scale up REDD activities
- NPA staff training - Fire management activities
- Agricultural extension activities
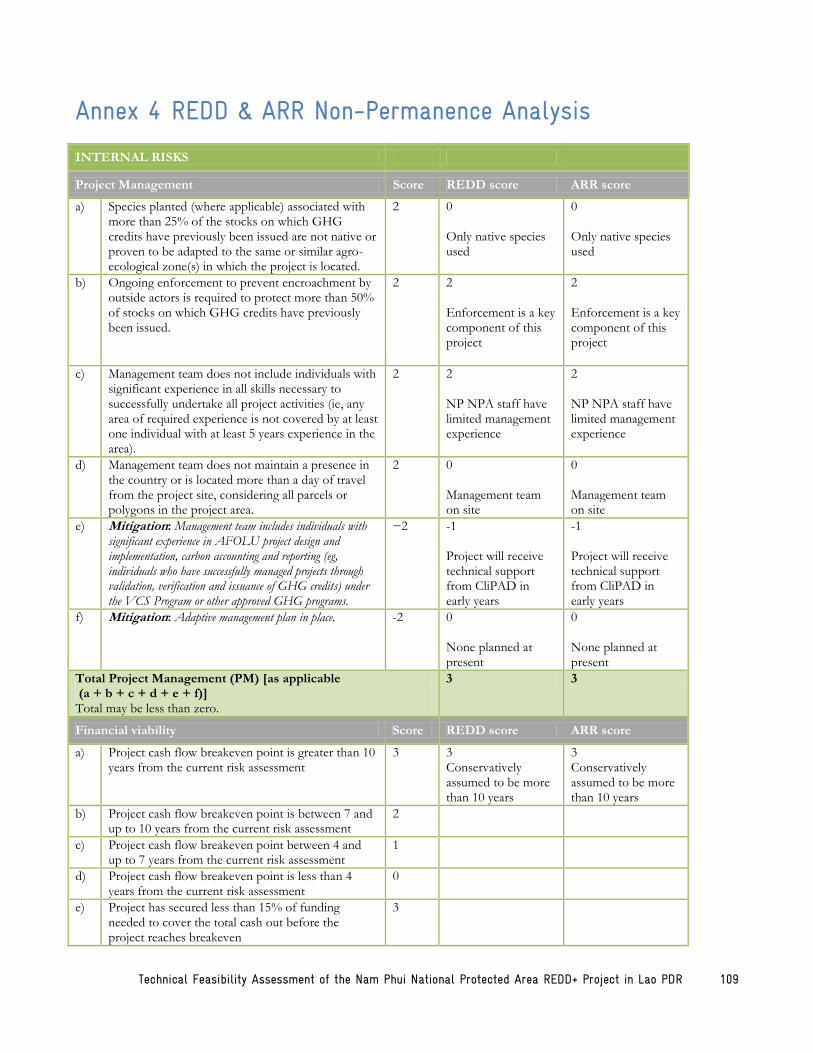
Technical Feasibility Assessment of the Nam Phui National Protected Area REDD+ Project in Lao PDR 109
Annex 4 REDD & ARR Non-Permanence Analysis
INTERNAL RISKS
Project Management Score REDD score ARR score
a) Species planted (where applicable) associated with more than 25% of the stocks on which GHG credits have previously been issued are not native or proven to be adapted to the same or similar agro-ecological zone(s) in which the project is located.
2 0 Only native species used
0 Only native species used
b) Ongoing enforcement to prevent encroachment by outside actors is required to protect more than 50% of stocks on which GHG credits have previously been issued.
2 2 Enforcement is a key component of this project
2 Enforcement is a key component of this project
c) Management team does not include individuals with significant experience in all skills necessary to successfully undertake all project activities (ie, any area of required experience is not covered by at least one individual with at least 5 years experience in the area).
2 2 NP NPA staff have limited management experience
2 NP NPA staff have limited management experience
d) Management team does not maintain a presence in the country or is located more than a day of travel from the project site, considering all parcels or polygons in the project area.
2 0 Management team on site
0 Management team on site
e) Mitigation: Management team includes individuals with significant experience in AFOLU project design and implementation, carbon accounting and reporting (eg, individuals who have successfully managed projects through validation, verification and issuance of GHG credits) under the VCS Program or other approved GHG programs.
−2 -1 Project will receive technical support from CliPAD in early years
-1 Project will receive technical support from CliPAD in early years
f) Mitigation: Adaptive management plan in place. -2 0 None planned at present
0 None planned at present
Total Project Management (PM) [as applicable (a + b + c + d + e + f)] Total may be less than zero.
3 3
Financial viability Score REDD score ARR score
a) Project cash flow breakeven point is greater than 10 years from the current risk assessment
3 3 Conservatively assumed to be more than 10 years
3 Conservatively assumed to be more than 10 years
b) Project cash flow breakeven point is between 7 and up to 10 years from the current risk assessment
2
c) Project cash flow breakeven point between 4 and up to 7 years from the current risk assessment
1
d) Project cash flow breakeven point is less than 4 years from the current risk assessment
0
e) Project has secured less than 15% of funding needed to cover the total cash out before the project reaches breakeven
3
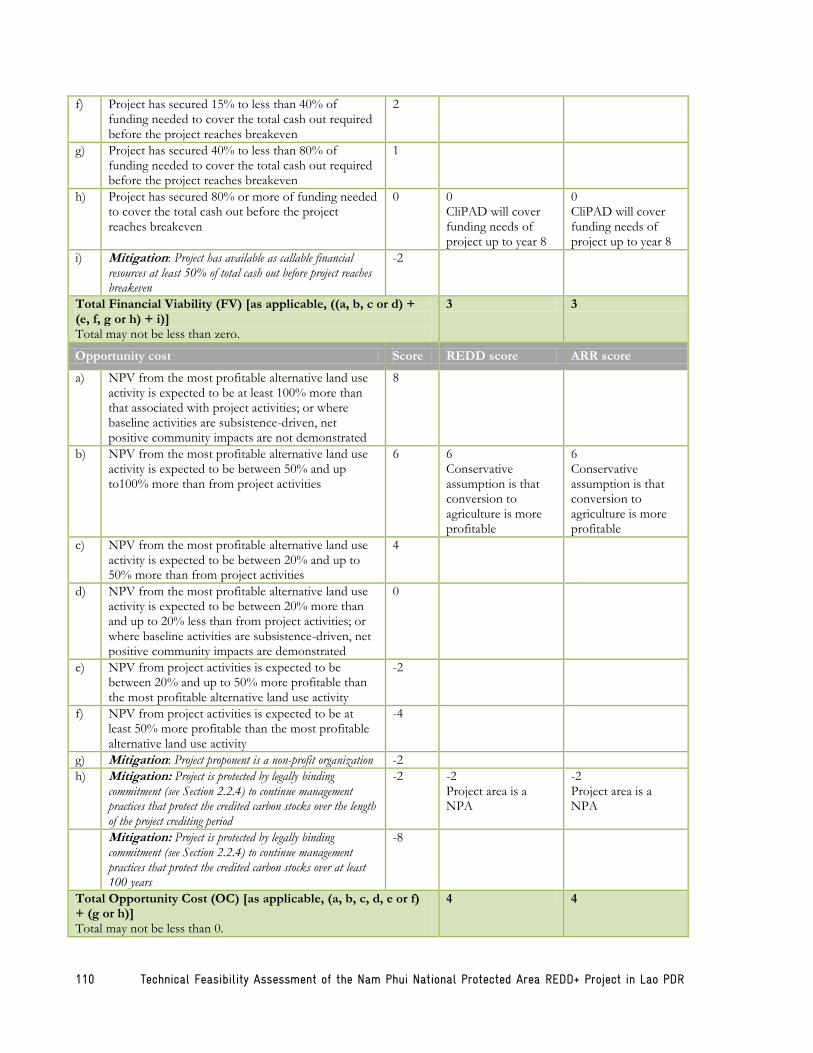
110 Technical Feasibility Assessment of the Nam Phui National Protected Area REDD+ Project in Lao PDR
f) Project has secured 15% to less than 40% of funding needed to cover the total cash out required before the project reaches breakeven
2
g) Project has secured 40% to less than 80% of funding needed to cover the total cash out required before the project reaches breakeven
1
h) Project has secured 80% or more of funding needed to cover the total cash out before the project reaches breakeven
0 0 CliPAD will cover funding needs of project up to year 8
0 CliPAD will cover funding needs of project up to year 8
i) Mitigation: Project has available as callable financial resources at least 50% of total cash out before project reaches breakeven
-2
Total Financial Viability (FV) [as applicable, ((a, b, c or d) + (e, f, g or h) + i)] Total may not be less than zero.
3 3
Opportunity cost Score REDD score ARR score
a) NPV from the most profitable alternative land use activity is expected to be at least 100% more than that associated with project activities; or where baseline activities are subsistence-driven, net positive community impacts are not demonstrated
8
b) NPV from the most profitable alternative land use activity is expected to be between 50% and up to100% more than from project activities
6 6 Conservative assumption is that conversion to agriculture is more profitable
6 Conservative assumption is that conversion to agriculture is more profitable
c) NPV from the most profitable alternative land use activity is expected to be between 20% and up to 50% more than from project activities
4
d) NPV from the most profitable alternative land use activity is expected to be between 20% more than and up to 20% less than from project activities; or where baseline activities are subsistence-driven, net positive community impacts are demonstrated
0
e) NPV from project activities is expected to be between 20% and up to 50% more profitable than the most profitable alternative land use activity
-2
f) NPV from project activities is expected to be at least 50% more profitable than the most profitable alternative land use activity
-4
g) Mitigation: Project proponent is a non-profit organization -2
h) Mitigation: Project is protected by legally binding commitment (see Section 2.2.4) to continue management practices that protect the credited carbon stocks over the length of the project crediting period
-2 -2 Project area is a NPA
-2 Project area is a NPA
Mitigation: Project is protected by legally binding commitment (see Section 2.2.4) to continue management practices that protect the credited carbon stocks over at least 100 years
-8
Total Opportunity Cost (OC) [as applicable, (a, b, c, d, e or f) + (g or h)] Total may not be less than 0.
4 4
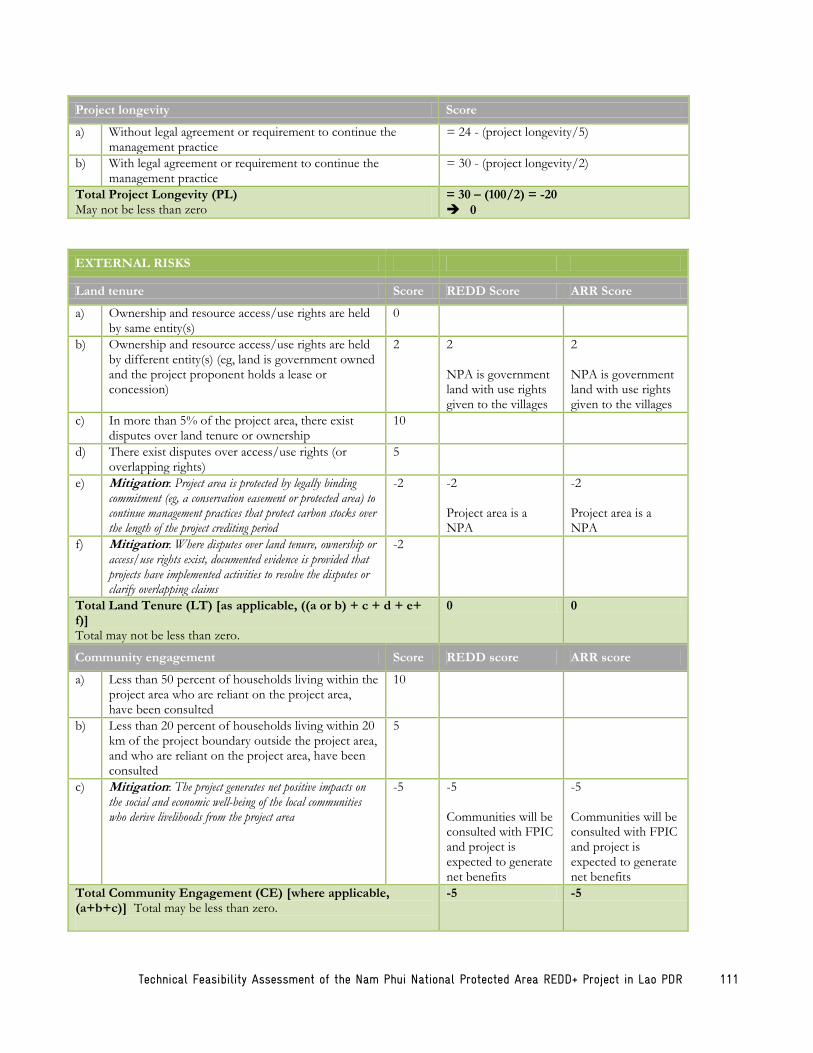
Technical Feasibility Assessment of the Nam Phui National Protected Area REDD+ Project in Lao PDR 111
Project longevity Score
a) Without legal agreement or requirement to continue the management practice
= 24 - (project longevity/5)
b) With legal agreement or requirement to continue the management practice
= 30 - (project longevity/2)
Total Project Longevity (PL) May not be less than zero
= 30 – (100/2) = -20
0
EXTERNAL RISKS
Land tenure Score REDD Score ARR Score
a) Ownership and resource access/use rights are held by same entity(s)
0
b) Ownership and resource access/use rights are held by different entity(s) (eg, land is government owned and the project proponent holds a lease or concession)
2 2 NPA is government land with use rights given to the villages
2 NPA is government land with use rights given to the villages
c) In more than 5% of the project area, there exist disputes over land tenure or ownership
10
d) There exist disputes over access/use rights (or overlapping rights)
5
e) Mitigation: Project area is protected by legally binding commitment (eg, a conservation easement or protected area) to continue management practices that protect carbon stocks over the length of the project crediting period
-2 -2 Project area is a NPA
-2 Project area is a NPA
f) Mitigation: Where disputes over land tenure, ownership or access/use rights exist, documented evidence is provided that projects have implemented activities to resolve the disputes or clarify overlapping claims
-2
Total Land Tenure (LT) [as applicable, ((a or b) + c + d + e+ f)] Total may not be less than zero.
0 0
Community engagement Score REDD score ARR score
a) Less than 50 percent of households living within the project area who are reliant on the project area, have been consulted
10
b) Less than 20 percent of households living within 20 km of the project boundary outside the project area, and who are reliant on the project area, have been consulted
5
c) Mitigation: The project generates net positive impacts on the social and economic well-being of the local communities who derive livelihoods from the project area
-5 -5 Communities will be consulted with FPIC and project is expected to generate net benefits
-5 Communities will be consulted with FPIC and project is expected to generate net benefits
Total Community Engagement (CE) [where applicable, (a+b+c)] Total may be less than zero.
-5 -5
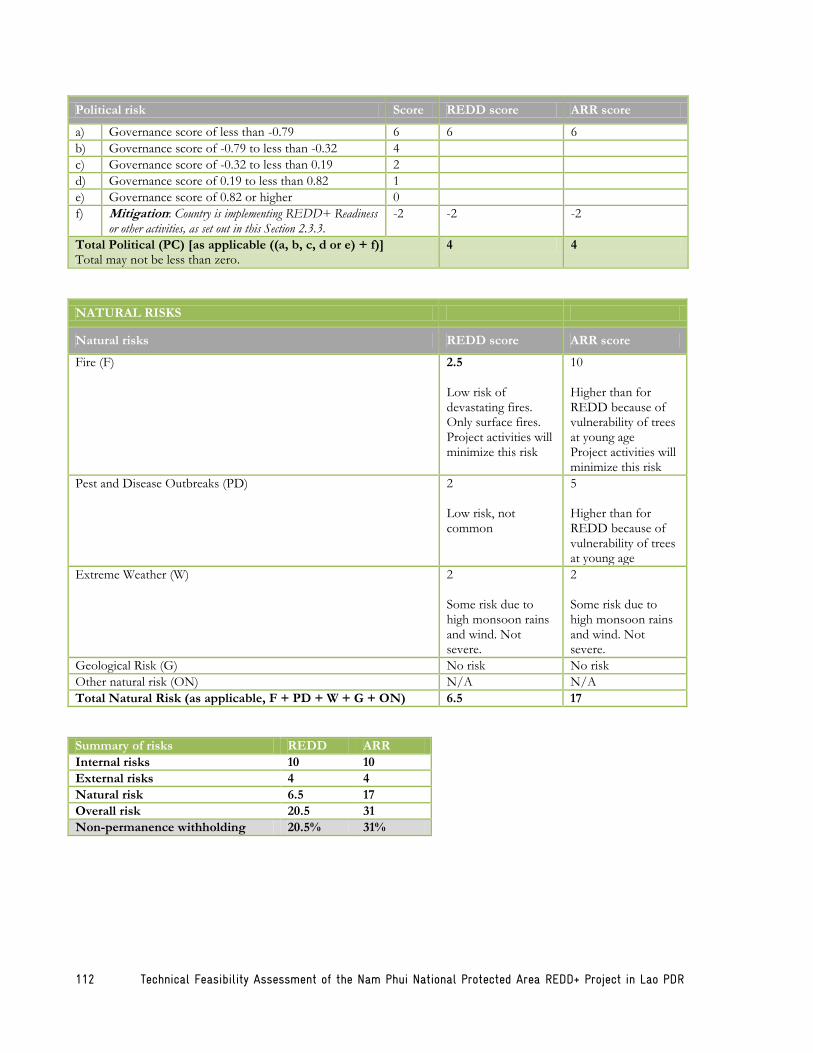
112 Technical Feasibility Assessment of the Nam Phui National Protected Area REDD+ Project in Lao PDR
Political risk Score REDD score ARR score
a) Governance score of less than -0.79 6 6 6
b) Governance score of -0.79 to less than -0.32 4
c) Governance score of -0.32 to less than 0.19 2
d) Governance score of 0.19 to less than 0.82 1
e) Governance score of 0.82 or higher 0
f) Mitigation: Country is implementing REDD+ Readiness or other activities, as set out in this Section 2.3.3.
-2 -2 -2
Total Political (PC) [as applicable ((a, b, c, d or e) + f)] Total may not be less than zero.
4 4
NATURAL RISKS
Natural risks REDD score ARR score
Fire (F) 2.5 Low risk of devastating fires. Only surface fires. Project activities will minimize this risk
10 Higher than for REDD because of vulnerability of trees at young age Project activities will minimize this risk
Pest and Disease Outbreaks (PD) 2 Low risk, not common
5 Higher than for REDD because of vulnerability of trees at young age
Extreme Weather (W) 2 Some risk due to high monsoon rains and wind. Not severe.
2 Some risk due to high monsoon rains and wind. Not severe.
Geological Risk (G) No risk No risk
Other natural risk (ON) N/A N/A
Total Natural Risk (as applicable, F + PD + W + G + ON) 6.5 17
Summary of risks REDD ARR
Internal risks 10 10
External risks 4 4
Natural risk 6.5 17
Overall risk 20.5 31
Non-permanence withholding 20.5% 31%


Deutsche Gesellschaft für Internationale Zusammenarbeit (GIZ) GmbH
Climate Protection through Avoided Deforestation Programme (CliPAD)Department of ForestryThat Dam Campus, Chanthaboury DistrictPO Box 1295Vientiane, Lao PDR
T: +856 21 254082F: +856 21 254083E: [email protected]: www.giz.de