climatic and agronomic conditions - australian natural...
TRANSCRIPT

Australian Crop ReportPrepared by the Australian Bureau of Agricultural
and Resource Economics and Sciences
June 2012No. 162

© Commonwealth of Australia 2012
Ownership of intellectual property rights
Unless otherwise noted, copyright (and any other intellectual property rights, if any) in this publication is owned by the Commonwealth of Australia (referred to as the Commonwealth).
Creative Commons licence
All material in this publication is licensed under a Creative Commons Attribution 3.0 Australia Licence, save for content supplied by third parties, logos and the Commonwealth Coat of Arms.
Creative Commons Attribution 3.0 Australia Licence is a standard form licence agreement that allows you to copy, distribute, transmit and adapt this publication provided you attribute the work. A summary of the licence terms is available from creativecommons.org/licenses/by/3.0/au/deed.en. The full licence terms are available from creativecommons.org/licenses/by/3.0/au/legalcode.
This publication (and any material sourced from it) should be attributed as: ABARES 2012, Australian crop report, Australian Bureau of Agricultural Resources Economics and Sciences, Canberra, February. CC BY 3.0.
Cataloguing dataABARES 2012, Australian crop report, Australian Bureau of Agricultural Resources Economics and Sciences, Canberra, June
ISSN: 1447-8358ABARES project: 42072
InternetAustralian crop report is available at: daff.gov.au/abares/publications.
Australian Bureau of Agricultural and Resource Economics and Sciences (ABARES)Postal address GPO Box 1563 Canberra ACT 2601Switchboard +61 2 6272 2010Facsimile +61 2 6272 2001Email [email protected] daff.gov.au/abares
Inquiries regarding the licence and any use of this document should be sent to: [email protected].
The Australian Government acting through the Department of Agriculture, Fisheries and Forestry has exercised due care and skill in the preparation and compilation of the information and data in this publication. Notwithstanding, the Department of Agriculture, Fisheries and Forestry, its employees and advisers disclaim all liability, including liability for negligence, for any loss, damage, injury, expense or cost incurred by any person as a result of accessing, using or relying upon any of the information or data in this publication to the maximum extent permitted by law.
The next issue of Australian crop report is scheduled to be released on 11 September 2012.
In the next issue:
2012–13 winter crop area and production forecasts updated
2012–13 summer crop area forecasts
Acknowledgements
This report was prepared by Benjamin Agbenyegah, Amelia Brown, Fiona Crawford, Beth Deards, James Fell, Lee Georgeson, Dean Mansfield, Matthew Miller and David Mobsby.

ContentsOverview................................................................................................................................................................. 2
Climatic and agronomic conditions...............................................................................................3
Winter crop production......................................................................................................................8
Summer crop production................................................................................................................10
Crop conditions and production forecasts, by state.........................................................................12
New South Wales................................................................................................................................ 12
Queensland............................................................................................................................................ 13
Victoria.................................................................................................................................................... 14
South Australia.....................................................................................................................................15
Western Australia...............................................................................................................................16
TablesTable 1 Rainfall in major cropping districts...........................................................................................8
Table 2 Winter crop area—Australia......................................................................................................10
Table 3 Winter crop production—Australia........................................................................................10
Table 4 Summer crop area and production—Australia..................................................................11
Table 5 Winter crop forecasts, 2012–13, New South Wales.........................................................13
Table 6 Summer crop estimates, 2011–12, New South Wales.....................................................13
Table 7 Winter crop forecasts, 2012–13, Queensland.....................................................................14
Table 8 Summer crop estimates, 2011–12, Queensland................................................................14
Table 9 Winter crop forecasts, 2012–13, Victoria.............................................................................15
Table 10 Winter crop forecasts, 2012–13, South Australia..........................................................16
Table 11 Winter crop forecasts, 2012–13, Western Australia.....................................................17
Table 12 Australian crop production......................................................................................................18
Table 13 State production—major crops..............................................................................................19
Table 14 State production—other crops...............................................................................................20
Table 15 Australian supply of wheat, oilseeds and pulses............................................................21
Table 16 Australian supply and disposal of coarse grains.............................................................22
Table 17 Grains and oilseeds prices........................................................................................................23
iii

MapsMap 1 Australian wheat growing regions................................................................................................1
Map 2 Australian rainfall districts...............................................................................................................1
Map 3 Australian rainfall percentiles, April 2012................................................................................3
Map 4 Australian rainfall percentiles, May 2012..................................................................................4
Map 5 June to August 2012 rainfall outlook...........................................................................................5
Map 6 Upper layer soil moisture, May 2012...........................................................................................6
Map 7 Lower layer soil moisture, May 2012..........................................................................................6
Map 8 Probability of exceeding long term simulated median shire wheat yield...................7
iv

Australian crop report June 2012 ABARES
Map 1 Australian wheat growing regions
Source: ABARES
Map 2 Australian rainfall districts
Note: Displayed for major cropping districts only. Refer to Table 1 for district names and observed district rainfall.
Source: Bureau of Meteorology
1

Australian crop report June 2012 ABARES
OverviewThe start of the 2012–13 winter cropping season has been characterised by average to dry conditions, which has led to generally dry upper layer soil moisture profiles.
In eastern Australia, the dry periods have been interspersed by timely rainfall. Additionally, heavy rainfall and flooding in early 2012 replenished soil moisture profiles in parts of New South Wales, Queensland and Victoria. The lower level soil moisture will provide good moisture reserves for crops over winter, if sufficient rainfall occurs for crops to establish root systems able to reach it.
In Western Australia, conditions for crop planting and establishment have generally been poor. Rainfall in April and May was below average but significant rainfall was received at the beginning of May and again in early June. Further timely rainfall will be required to facilitate completion of planting programs and crop growth.
The seasonal outlook issued by the Bureau of Meteorology on 23 May 2012 points to an increase in the probability of a dry winter across southern Australia; in contrast, a wetter than average season is likely to occur in Queensland and northern New South Wales. Temperatures are likely to exceed average across almost all major cropping areas.
The total area sown to winter crops in Australia is forecast to fall by 2 per cent in 2012–13 to around 22.2 million hectares. The forecast fall in area planted to winter crops reflects the combined effect of expected lower farmgate prices of cereals and the dry start to the season. The area sown to wheat is forecast to fall by 5 per cent to around 13.4 million hectares and the area sown to barley is forecast to fall by 4 per cent to around 3.9 million hectares. For canola, the area sown is forecast to rise by 23 per cent to around 2.1 million hectares, reflecting growers' response to relatively favourable canola prices compared with alternatives, especially wheat and barley.
Total winter crop production in 2012–13 is forecast to be 38.5 million tonnes, around 15 per cent lower than last year’s record production. For the major cereal crops, wheat production is forecast to fall by 18 per cent to around 24.1 million tonnes, barley production is forecast to fall by 15 per cent to around 7.3 million tonnes and canola production is forecast to rise by 4 per cent to around 2.9 million tonnes.
As at the first week of June, harvesting of summer crops was nearing completion and production is estimated to have increased by 19 per cent in 2011–12 to around 5.5 million tonnes. Grain sorghum production is estimated to have increased by 13 per cent to around 2.3 million tonnes, reflecting higher yields. Rice production is estimated to have increased by 32 per cent to around 955 000 tonnes, reflecting increased planted area. Cotton lint production is estimated to have increased by 20 per cent to around 1.1 million tonnes, reflecting higher yields from a larger area planted to irrigated cotton.
Flooding occurred in parts of New South Wales, Queensland and Victoria in early 2012. While some individual growers were affected, the overall effect on total summer crop production was small.
2
Australian crop report June 2012 ABARES
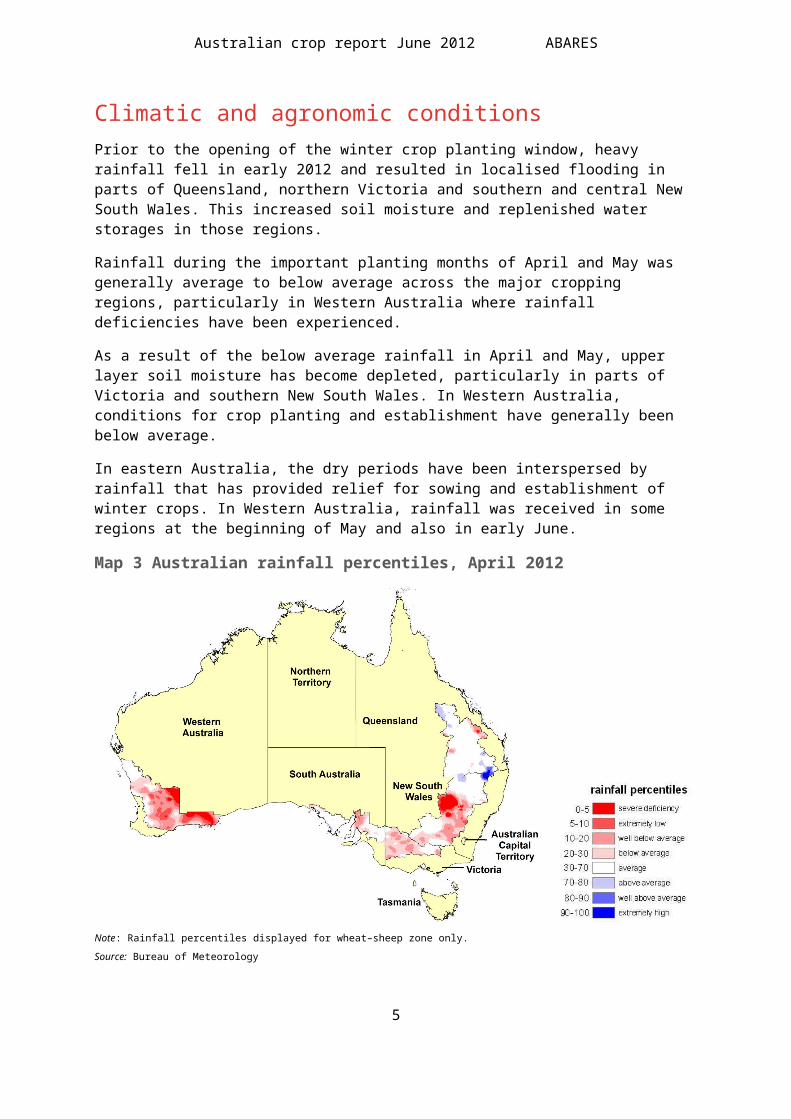
Climatic and agronomic conditionsPrior to the opening of the winter crop planting window, heavy rainfall fell in early 2012 and resulted in localised flooding in parts of Queensland, northern Victoria and southern and central New South Wales. This increased soil moisture and replenished water storages in those regions.
Rainfall during the important planting months of April and May was generally average to below average across the major cropping regions, particularly in Western Australia where rainfall deficiencies have been experienced.
As a result of the below average rainfall in April and May, upper layer soil moisture has become depleted, particularly in parts of Victoria and southern New South Wales. In Western Australia, conditions for crop planting and establishment have generally been below average.
In eastern Australia, the dry periods have been interspersed by rainfall that has provided relief for sowing and establishment of winter crops. In Western Australia, rainfall was received in some regions at the beginning of May and also in early June.
Map 3 Australian rainfall percentiles, April 2012
Note: Rainfall percentiles displayed for wheat–sheep zone only.
Source: Bureau of Meteorology
3

Australian crop report June 2012 ABARES
Map 4 Australian rainfall percentiles, May 2012
Note: Rainfall percentiles displayed for wheat–sheep zone only.
Source: Bureau of Meteorology
The Bureau of Meteorology seasonal rainfall outlook for June to August 2012 favours wetter than average conditions across Queensland and northern New South Wales cropping regions and generally average conditions for much of southern New South Wales (Map 5). The outlook indicates drier than normal conditions are more likely for South Australia, western Victoria and Western Australia.
4

Australian crop report June 2012 ABARES
Map 5 June to August 2012 rainfall outlook
Note: Outlook displayed for wheat–sheep zone only.
Source: Bureau of Meteorology
The temperature outlook for June to August 2012 indicates that warmer daytime and night time temperatures are likely across much of the grains belt, with the exception of Queensland where cooler daytime temperatures are favoured.
Maps 6 and 7 show the relative levels of modelled upper layer (~0.2 metres) soil moisture and lower layer (~0.2 to ~1.5 metres) soil moisture at the end of May 2012 for the wheat–sheep zone across Australia. The soil moisture estimates are relative to the long-term record.
Moisture estimates from the long-term record are ranked in percentiles. The darkest green areas (90th to 100th percentile) indicate where the estimated soil moisture level for May 2012 falls into the 10 wettest months, relative to estimated soil moisture levels for that month averaged over a 100-year period. The darkest brown (0 to 10th percentile) indicates where the estimated soil moisture levels for May 2012 fell into the 10 driest months, relative to estimated soil moisture levels for that month averaged over a 100-year period. These data are from a collaborative project between the Bureau of Meteorology, the Commonwealth Scientific and Industrial Research Organisation (CSIRO) and ABARES to develop estimates of soil moisture and other components of water balance at high resolution across Australia.
Upper layer soil moisture responds quickly to seasonal conditions and will often show a pattern that reflects the rainfall and temperature events of the same month. Lower layer soil moisture is a larger, deeper store that is slower to respond and tends to reflect the accumulated effects of events that have occurred over longer periods of time.
Relative upper layer soil moisture at the end of May 2012 (Map 6) was predominantly above average in cropping regions in Queensland and northern New South Wales, reflecting recent rainfall in these areas. Relative upper layer soil moisture for the remainder of the Australian cropping regions was generally below average. However, there were some areas in far south-west Western Australia and southern areas of South Australia where the relative upper soil moisture was above average.
5
Australian crop report June 2012 ABARES
Map 6 Upper layer soil moisture, May 2012
Note: Relative upper layer soil moisture displayed for wheat–sheep zone only.
Source: ABARES; CSIRO; Bureau of Meteorology (Australian Water Availability Project)
Relative soil moisture in the lower layer at the end of May 2012 (Map 7) was largely above average in the eastern states, reflecting the above average rainfall received in many areas between October 2011 and March 2012. Above average lower layer soil moisture will provide a deep store for crops in these areas, meaning producers will be less reliant on in-crop rainfall. Lower layer soil moisture deficiencies remain in most cropping regions in Western Australia, South Australia and south western Victoria. Producers in these areas are generally more reliant on in-crop rainfall due to the sandy nature of the soils.
Map 7 Lower layer soil moisture, May 2012
Note: Relative lower layer soil moisture displayed for wheat–sheep zone only.
Source: ABARES; CSIRO; Bureau of Meteorology (Australian Water Availability Project)
6

Australian crop report June 2012 ABARES
At the beginning of June 2012, the probability of exceeding median wheat yields (Map 8) was generally average or above in most cropping regions across Australia. Parts of western Victoria are showing reduced chances of exceeding median yield (between 10 and 40 per cent), largely due to below average rainfall in April and May and soil moisture deficiencies.
The yield predictions for wheat are produced by the shire scale wheat forecasting system of the Queensland Alliance for Agriculture and Food Innovation. This forecasting system combines starting soil moisture conditions with the seasonal outlook, including the most recent trend in the Southern Oscillation Index.
Map 8 Probability of exceeding long term simulated median shire wheat yield
Source: Queensland Alliance for Agriculture and Food Innovation
7

Australian crop report June 2012 ABARES
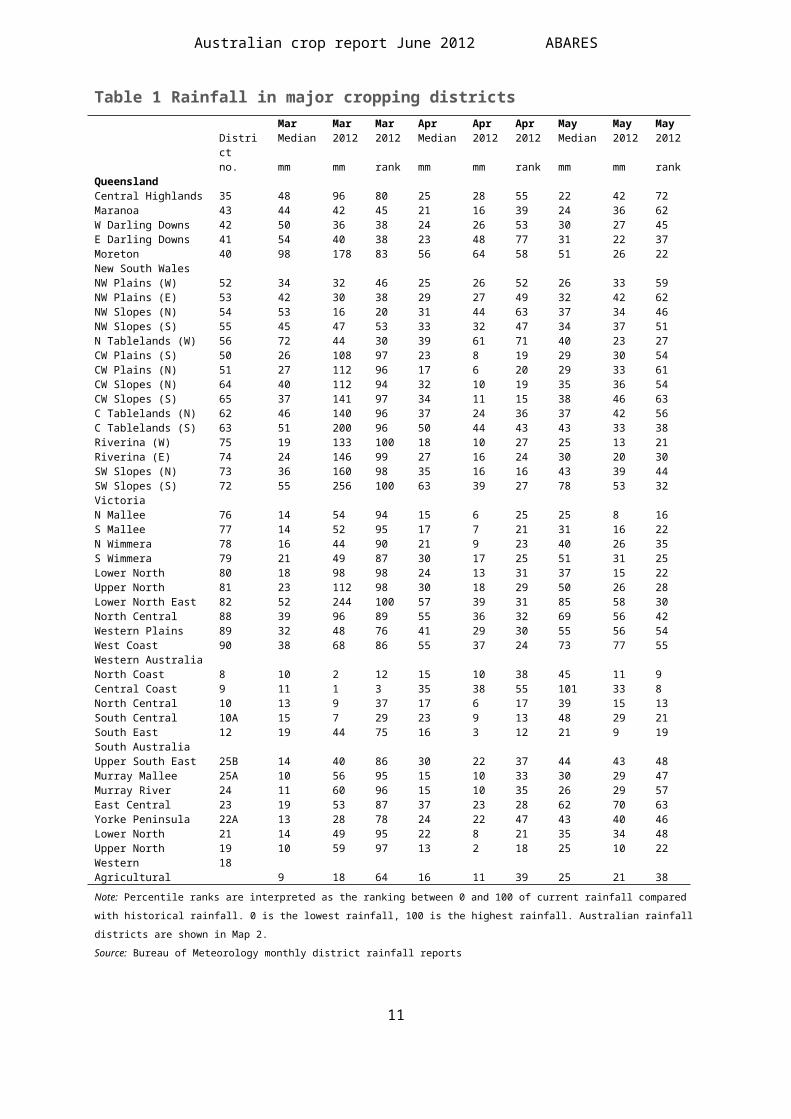
Table 1 Rainfall in major cropping districtsMar Mar Mar Apr Apr Apr May May May
District Median 2012 2012 Median 2012 2012 Median 2012 2012no. mm mm rank mm mm rank mm mm rank
QueenslandCentral Highlands 35 48 96 80 25 28 55 22 42 72Maranoa 43 44 42 45 21 16 39 24 36 62W Darling Downs 42 50 36 38 24 26 53 30 27 45E Darling Downs 41 54 40 38 23 48 77 31 22 37Moreton 40 98 178 83 56 64 58 51 26 22New South WalesNW Plains (W) 52 34 32 46 25 26 52 26 33 59NW Plains (E) 53 42 30 38 29 27 49 32 42 62NW Slopes (N) 54 53 16 20 31 44 63 37 34 46NW Slopes (S) 55 45 47 53 33 32 47 34 37 51N Tablelands (W) 56 72 44 30 39 61 71 40 23 27CW Plains (S) 50 26 108 97 23 8 19 29 30 54CW Plains (N) 51 27 112 96 17 6 20 29 33 61CW Slopes (N) 64 40 112 94 32 10 19 35 36 54CW Slopes (S) 65 37 141 97 34 11 15 38 46 63C Tablelands (N) 62 46 140 96 37 24 36 37 42 56C Tablelands (S) 63 51 200 96 50 44 43 43 33 38Riverina (W) 75 19 133 100 18 10 27 25 13 21Riverina (E) 74 24 146 99 27 16 24 30 20 30SW Slopes (N) 73 36 160 98 35 16 16 43 39 44SW Slopes (S) 72 55 256 100 63 39 27 78 53 32VictoriaN Mallee 76 14 54 94 15 6 25 25 8 16S Mallee 77 14 52 95 17 7 21 31 16 22N Wimmera 78 16 44 90 21 9 23 40 26 35S Wimmera 79 21 49 87 30 17 25 51 31 25Lower North 80 18 98 98 24 13 31 37 15 22Upper North 81 23 112 98 30 18 29 50 26 28Lower North East 82 52 244 100 57 39 31 85 58 30North Central 88 39 96 89 55 36 32 69 56 42Western Plains 89 32 48 76 41 29 30 55 56 54West Coast 90 38 68 86 55 37 24 73 77 55Western AustraliaNorth Coast 8 10 2 12 15 10 38 45 11 9Central Coast 9 11 1 3 35 38 55 101 33 8North Central 10 13 9 37 17 6 17 39 15 13South Central 10A 15 7 29 23 9 13 48 29 21South East 12 19 44 75 16 3 12 21 9 19South AustraliaUpper South East 25B 14 40 86 30 22 37 44 43 48Murray Mallee 25A 10 56 95 15 10 33 30 29 47Murray River 24 11 60 96 15 10 35 26 29 57East Central 23 19 53 87 37 23 28 62 70 63Yorke Peninsula 22A 13 28 78 24 22 47 43 40 46Lower North 21 14 49 95 22 8 21 35 34 48Upper North 19 10 59 97 13 2 18 25 10 22Western Agricultural 18 9 18 64 16 11 39 25 21 38
Note: Percentile ranks are interpreted as the ranking between 0 and 100 of current rainfall compared with historical rainfall. 0 is the lowest
rainfall, 100 is the highest rainfall. Australian rainfall districts are shown in Map 2.
Source: Bureau of Meteorology monthly district rainfall reports
Winter crop productionThe start of the 2012–13 winter cropping season has been characterised by average to dry conditions, which has led to dry upper layer soil moisture profiles in many areas.
In eastern Australia, the dry periods have been interspersed by timely rainfall. Heavy rainfall and flooding in early 2012 replenished lower layer soil moisture profiles in parts of Queensland, New South Wales and Victoria. The lower level soil moisture will provide good moisture reserves for crops over winter, if sufficient rainfall occurs for crops to establish root systems able to reach it.
8

Australian crop report June 2012 ABARES
In Western Australia, conditions for crop planting and establishment have generally been below average. Rainfall in April and May was below average but significant rainfall was received at the beginning of May and again in early June. However, timely rainfall will be needed to facilitate completion of planting programs and for crop growth.
Winter crop production will also be reliant on timely rainfall over winter and spring, particularly in Western Australia and some south eastern cropping areas where sandy soils have lower water holding capacity.
The total area planted to winter crops in Australia is forecast to fall by 2 per cent in 2012–13 to around 22.2 million hectares. This forecast fall reflects the combined effect of a dry start to the season and expected lower farmgate cereal prices, leading to an increase of the sheep flock in mixed cropping–livestock enterprises. Assuming timely rainfall over winter and spring and a fall from the high yields achieved last season, total winter crop production is forecast to fall by 15 per cent to around 38.5 million tonnes.
In eastern Australia, after two consecutive years of very high yielding crops, heavy summer rainfall and waterlogging in some areas, soil nutrient levels have been reduced, particularly across New South Wales and Queensland.
The area planted to wheat is forecast to fall by 5 per cent in 2012–13 to around 13.4 million hectares. Despite the expected fall, this forecast is still significantly above the five-year average to 2010–11. Total wheat production is forecast to decline by 18 per cent to around 24.1 million tonnes, reflecting the combined effect of a lower planted area and an assumed fall in yields.
The area planted to barley in 2012–13 is forecast to fall by 4 per cent to around 3.9 million hectares. Total barley production is forecast to fall by 15 per cent to around 7.3 million tonnes.
The area planted to canola is forecast to increase by 23 per cent in 2012–13 to around 2.1 million hectares. Most of this forecast increase is expected to be in New South Wales and Western Australia and reflects growers’ response to relatively favourable canola prices. Canola production is forecast to increase by 4 per cent to around 2.9 million tonnes, which reflects the forecast increase in planted area more than offsetting an assumed fall in yields.
9

Australian crop report June 2012 ABARES
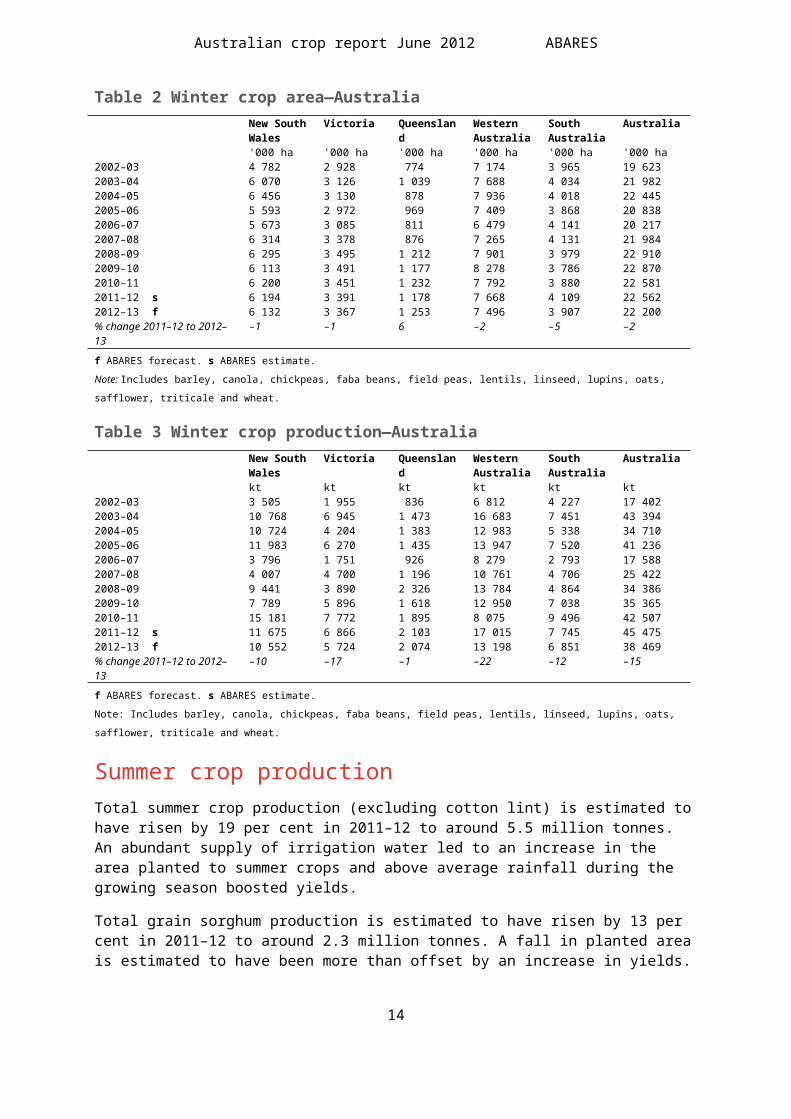
Table 2 Winter crop area—AustraliaNew South Wales
Victoria Queensland Western Australia
South Australia
Australia
'000 ha '000 ha '000 ha '000 ha '000 ha '000 ha2002–03 4 782 2 928 774 7 174 3 965 19 6232003–04 6 070 3 126 1 039 7 688 4 034 21 9822004–05 6 456 3 130 878 7 936 4 018 22 4452005–06 5 593 2 972 969 7 409 3 868 20 8382006–07 5 673 3 085 811 6 479 4 141 20 2172007–08 6 314 3 378 876 7 265 4 131 21 9842008–09 6 295 3 495 1 212 7 901 3 979 22 9102009–10 6 113 3 491 1 177 8 278 3 786 22 8702010–11 6 200 3 451 1 232 7 792 3 880 22 5812011–12 s 6 194 3 391 1 178 7 668 4 109 22 5622012–13 f 6 132 3 367 1 253 7 496 3 907 22 200% change 2011–12 to 2012–13 –1 –1 6 –2 –5 –2
f ABARES forecast. s ABARES estimate.
Note: Includes barley, canola, chickpeas, faba beans, field peas, lentils, linseed, lupins, oats, safflower, triticale and wheat.
Table 3 Winter crop production—AustraliaNew SouthWales
Victoria Queensland WesternAustralia
SouthAustralia
Australia
kt kt kt kt kt kt2002–03 3 505 1 955 836 6 812 4 227 17 4022003–04 10 768 6 945 1 473 16 683 7 451 43 3942004–05 10 724 4 204 1 383 12 983 5 338 34 7102005–06 11 983 6 270 1 435 13 947 7 520 41 2362006–07 3 796 1 751 926 8 279 2 793 17 5882007–08 4 007 4 700 1 196 10 761 4 706 25 4222008–09 9 441 3 890 2 326 13 784 4 864 34 3862009–10 7 789 5 896 1 618 12 950 7 038 35 3652010–11 15 181 7 772 1 895 8 075 9 496 42 5072011–12 s 11 675 6 866 2 103 17 015 7 745 45 4752012–13 f 10 552 5 724 2 074 13 198 6 851 38 469% change 2011–12 to 2012–13 –10 –17 –1 –22 –12 –15
f ABARES forecast. s ABARES estimate.
Note: Includes barley, canola, chickpeas, faba beans, field peas, lentils, linseed, lupins, oats, safflower, triticale and wheat.
Summer crop productionTotal summer crop production (excluding cotton lint) is estimated to have risen by 19 per cent in 2011–12 to around 5.5 million tonnes. An abundant supply of irrigation water led to an increase in the area planted to summer crops and above average rainfall during the growing season boosted yields.
Total grain sorghum production is estimated to have risen by 13 per cent in 2011–12 to around 2.3 million tonnes. A fall in planted area is estimated to have been more than offset by an increase in yields.
Australian cotton lint production is estimated to have increased by 20 per cent in 2011–12 from the flood affected harvest of last season, to around 1.1 million tonnes. This increase reflects an estimated 2 per cent rise in planted area and a higher proportion of irrigated cotton, which has higher yields than dryland cotton. Nevertheless, floods in northern New South Wales and the Mungindi, Dirranbandi and St George regions of Queensland in early 2012 adversely affected production.
Total rice production is estimated to have increased by 32 per cent in 2011–12 to around 955 000 tonnes. The estimated increase reflects a larger area planted to rice as a result of a good
10

Australian crop report June 2012 ABARES
supply of irrigation water. Yields are estimated to have been below average, reflecting a challenging season for growers after pest damage, a significant cold spell and flooding.
Flooding occurred in parts of New South Wales, Queensland and Victoria in early 2012. Although a number of individual growers were affected, the overall effect on total summer crop production was small.
Table 4 Summer crop area and production—AustraliaNew South Wales Queensland Australia'000 ha kt '000 ha kt '000 ha kt
2001–02 788 3 070 833 1 824 1 633 4 9332002–03 529 1 594 555 1 248 1 097 2 8682003–04 455 1 787 747 1 875 1 212 3 6792004–05 455 1 787 747 1 875 1 340 3 8892005–06 783 2 790 639 1 500 1 434 4 3342006–07 336 1 037 546 1 119 921 2 1862007–08 398 1 668 791 2 877 1 205 4 5832008–09 402 1 430 746 2 350 1 156 3 7942009–10 381 1 405 513 1 340 903 2 7582010–11 713 2 643 789 1 916 1 512 4 5862011–12 s 745 2 893 809 2 535 1 567 5 455% change 2010–11 to 2011–12 5 9 3 32 4 19
s ABARES estimate.
Note: State production includes grain sorghum, rice, cottonseed, maize, sunflower, peanuts and mung beans. Total for Australia also includes
small areas and volume in other states. Total for Australia includes grain sorghum, cottonseed, rice, maize, peanuts, mung beans and navy
beans. Summer crop production figures include northern wet season rice and northern dry season cottonseed and rice.
11
Australian crop report June 2012 ABARES
Crop conditions and production forecasts, by state New South Wales Despite a dry autumn, lower level soil moisture profiles throughout the winter cropping regions of New South Wales are above average as a result of widespread summer rainfall. Widespread late May rainfall was very timely and further rainfall in early June enabled further sowing of winter crops and is expected to greatly assist establishment of earlier sown crops.
The total area planted to winter crops in New South Wales is forecast to fall by 1 per cent in 2012–13 to around 6.1 million hectares. Assuming favourable seasonal conditions, total winter crop production is forecast at 10.6 million tonnes.
The area planted to wheat is forecast to decrease by around 5 per cent in 2012–13 to just over 3.8 million hectares. A recent decline in wheat prices means wheat is a less profitable alternative when compared with chickpeas and canola. Assuming average seasonal conditions, total wheat production is forecast to fall by 13 per cent to around 6.9 million tonnes.
The area planted to barley is forecast to decrease by around 5 per cent in 2012–13 to 840 000 hectares. Lower barley prices at the time of sowing are expected to result in growers favouring production alternatives. Assuming average seasonal conditions, barley production is forecast to fall by 12 per cent to around 1.5 million tonnes.
The area planted to canola is forecast to increase by 39 per cent in 2012–13 to a record 550 000 hectares. Timely sowing rainfall and high oilseeds prices have made canola production more attractive. Assuming average seasonal conditions, canola production is forecast to increase by 15 per cent to reach 825 000 tonnes.
Total summer crop production in New South Wales is estimated to have increased by around 9 per cent in 2011–12 to around 2.9 million tonnes, reflecting the combined effects of an increase in the area planted to cotton and rice, and favourable growing conditions.
Grain sorghum production is estimated to have decreased by 17 per cent in 2011–12 to around 680 000 tonnes, reflecting a 13 per cent fall in planted area. Seasonal conditions were generally favourable and yields are estimated to have been above average in most regions, particularly for early sown crops. The area planted to grain sorghum is estimated to have been around 185 000 hectares.
Rice production is estimated to have increased by 32 per cent in 2011–12 to around 950 000 tonnes, which reflects a 46 per cent increase in planted area. As a result of pest damage, a cold spell in January, and flooding in March, yields are estimated to be slightly below average.
Cotton lint production is estimated to have increased by around 17 per cent in 2011–12 to a record of around 664 000 tonnes, due mainly to a 3 per cent increase in planted area. Additionally, the proportion of the area planted devoted to irrigated cotton, which has a higher yield, increased by 21 percentage points to 80 per cent. Floods affected cotton crops in the Gwydir, Namoi, Mungindi and Walgett cotton regions in early 2012.
12

Australian crop report June 2012 ABARES
Table 5 Winter crop forecasts, 2012–13, New South Walesarea yield production area change from
2011–12production change from 2011–12
'000 ha t/ha kt % %
Wheat 3 820 1.80 6 876 –5 –13
Barley 840 1.78 1 495 –5 –12
Canola 550 1.50 825 39 15
Note: Yields are based on areas planted.
Table 6 Summer crop estimates, 2011–12, New South Walesarea yield production area change from
2010–11production change from 2010–11
'000 ha t/ha kt % %
Grain sorghum
185 3.68 680 –13 –17
Cotton lint 358 1.85 664 3 17
Cottonseed 358 2.62 939 3 17
Rice 108 8.80 950 46 32
Sunflower 20 1.25 25 11 –20
Note: Yields are based on areas planted.
QueenslandAverage to above average rainfall received throughout summer and autumn means that upper and lower soil moisture profiles across cropping regions in Queensland are generally at above average levels.
Autumn rainfall in central Queensland has been timely, providing a very positive outlook for the 2012–13 winter cropping season. Seasonal conditions in southern Queensland were dry until the end of May, slowing sowing activity and causing moisture stress in early sown crops. However, widespread late May rainfall has been beneficial and sowing intentions are expected to be fully realised.
The total area planted to winter crops in Queensland is forecast to increase by around 6 per cent in 2012–13 to around 1.3 million hectares. Assuming average seasonal conditions, total winter crop production is forecast to decrease by 1 per cent to around 2.1 million tonnes, mainly reflecting the effect of an assumed decline in yields from the highs of last season.
The area planted to wheat is forecast to decrease by 5 per cent in 2012–13 to around 950 000 hectares in response to lower wheat prices that have reduced profit margins compared with alternative winter crops. Assuming average seasonal conditions, wheat production is forecast to decrease by 9 per cent to around 1.6 million tonnes.
The area planted to barley is forecast to decrease by 6 per cent in 2012–13 to 85 000 hectares. Low feed grain prices mean that barley is less attractive to producers compared with chickpeas. Assuming average seasonal conditions, barley production is forecast to fall by 15 per cent to around 145 000 tonnes.
The area planted to chickpeas is forecast to increase by over 180 per cent in 2012–13 to a record 205 000 hectares. Current high prices have made chickpeas very attractive to producers and the release of new disease resistant varieties is expected to support a higher sown area.
13

Australian crop report June 2012 ABARES
Assuming average seasonal conditions, total chickpea production is forecast to increase by more than 120 per cent to around 308 000 tonnes.
Total summer crop production in Queensland is estimated to have increased by 32 per cent in 2011–12 to around 2.5 million tonnes, reflecting increases in grain sorghum and cottonseed production.
Cotton lint production is estimated to have risen by 26 per cent in 2011–12 to a record of around 415 000 tonnes, which reflects a higher average yield. In part, the higher average yield is due to an increase in the proportion of the planted area devoted to irrigated cotton. In early 2012, there was flooding in the St George, Dirranbandi and Mungindi cotton regions of Queensland. As most of the cotton crops in the regions were irrigated and protected by levees, flood losses were limited.
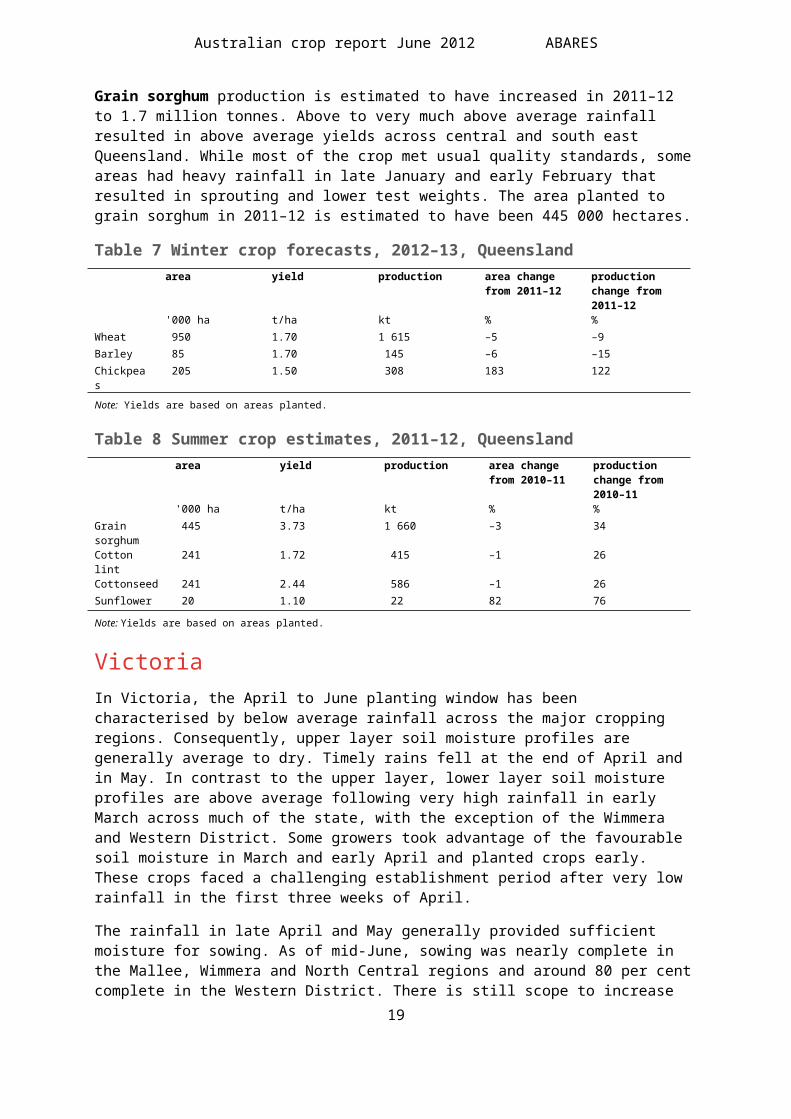
Grain sorghum production is estimated to have increased in 2011–12 to 1.7 million tonnes. Above to very much above average rainfall resulted in above average yields across central and south east Queensland. While most of the crop met usual quality standards, some areas had heavy rainfall in late January and early February that resulted in sprouting and lower test weights. The area planted to grain sorghum in 2011–12 is estimated to have been 445 000 hectares.
Table 7 Winter crop forecasts, 2012–13, Queenslandarea yield production area change from
2011–12production change from 2011–12
'000 ha t/ha kt % %
Wheat 950 1.70 1 615 –5 –9
Barley 85 1.70 145 –6 –15
Chickpeas 205 1.50 308 183 122
Note: Yields are based on areas planted.
Table 8 Summer crop estimates, 2011–12, Queenslandarea yield production area change from
2010–11production change from 2010–11
'000 ha t/ha kt % %
Grain sorghum
445 3.73 1 660 –3 34
Cotton lint 241 1.72 415 –1 26
Cottonseed 241 2.44 586 –1 26
Sunflower 20 1.10 22 82 76
Note: Yields are based on areas planted.
VictoriaIn Victoria, the April to June planting window has been characterised by below average rainfall across the major cropping regions. Consequently, upper layer soil moisture profiles are generally average to dry. Timely rains fell at the end of April and in May. In contrast to the upper layer, lower layer soil moisture profiles are above average following very high rainfall in early March across much of the state, with the exception of the Wimmera and Western District. Some growers took advantage of the favourable soil moisture in March and early April and planted crops early. These crops faced a challenging establishment period after very low rainfall in the first three weeks of April.
14
Australian crop report June 2012 ABARES
The rainfall in late April and May generally provided sufficient moisture for sowing. As of mid-June, sowing was nearly complete in the Mallee, Wimmera and North Central regions and around 80 per cent complete in the Western District. There is still scope to increase the planted area in the Western District where it is possible to plant some wheat, barley and canola varieties well into winter.
The three month rainfall outlook from the Bureau of Meteorology (June to August) suggests a 75 per cent chance of exceeding 50 mm of rainfall for the Mallee, Wimmera and North Central regions.
The area planted to winter crops in Victoria is forecast to fall by around 1 per cent in 2012–13 to around 3.4 million hectares. This reflects the dry start to the season, expected lower farmgate prices and an expected expansion of the sheep flock in mixed cropping–livestock enterprises. Assuming sufficient and timely rainfall over winter and spring to achieve average yields, winter crop production is forecast to fall by 17 per cent from the high production of last year, to around 5.7 million tonnes.
The area planted to wheat is forecast to fall by 4 per cent in 2012–13 to around 1.6 million hectares, largely reflecting the effect of expected lower farmgate wheat prices. Wheat production is forecast to fall by 21 per cent to around 2.9 million tonnes, which reflects the forecast fall in planted area and an assumed return to average yields.
The area planted to barley is forecast to rise by 2 per cent in 2012–13 to around 880 000 hectares. This forecast increase largely reflects expected lower prices and a dry start to the planting season. Assuming sufficient and timely rainfall over winter and spring to achieve average yields, barley production is forecast to fall by 11 per cent to around 1.7 million tonnes.
The area planted to canola is forecast to rise by 6 per cent in 2012–13 to around 370 000 hectares. While the gross margins from growing canola are generally favourable, the dry conditions in April constrained the area planted to canola. Assuming sufficient and timely rainfall over winter and spring to achieve average yields, canola production is forecast to fall by 7 per cent to around 495 000 tonnes.
Table 9 Winter crop forecasts, 2012–13, Victoriaarea yield production area change from
2011–12production change from 2011–12
'000 ha t/ha kt % %
Wheat 1 630 1.75 2 860 –4 –21
Barley 880 1.88 1 650 2 –11
Canola 370 1.34 495 6 –7
Note: Yields are based on areas planted.
South AustraliaAbove average rainfall during March replenished upper layer soil moisture levels in South Australian cropping regions. This was followed by below average rainfall in April leading to a decline in upper level soil moisture in the south-east of South Australia. Widespread rainfall in late May across South Australian cropping regions generally provided sufficient moisture for sowing and benefitted sown wheat and canola. Around 60 per cent of total wheat area was sown by early June, along with 40 per cent of total barley area, and 95 per cent of total canola area.
15

Australian crop report June 2012 ABARES
Snail numbers are high across most of the state following summer rain and colder weather at the beginning of 2012. Producers have undertaken extensive stubble burning and baiting in a bid to control the snails but numbers are still high in some regions. Mice activity is high in some regions but significantly lower than last season.
The total area planted to winter crops in South Australia is forecast to decline by 5 per cent in 2012–13 to around 3.9 million hectares, with the decline mainly occurring in lower rainfall areas. Assuming average yields, total winter crop production is forecast to fall by 12 per cent to 6.9 million tonnes, reflecting the lower forecast planted area and an assumed fall from the above average yields of last year.
The area planted to wheat is forecast to decline by 4 per cent in 2012–13 to 2.2 million hectares. This forecast decline reflects producers planting more canola this season in response to expected lower wheat prices. Assuming average yields, wheat production is forecast to fall by 8 per cent to 4.1 million tonnes.
The area planted to barley is forecast to decline by 17 per cent in 2012–13 to 960 000 hectares. Barley production is forecast to decline by 21 per cent to 1.7 million tonnes this season, reflecting the forecast fall in planted area and an assumed return to average yields from the above average yields of last year.
The area planted to canola is forecast to increase by 32 per cent in 2012–13 to 277 000 hectares, reflecting favourable canola prices. This forecast increase is lower than initial expectations because dry conditions in some areas discouraged producers from larger increases in the area planted to canola. Assuming average yields, production is forecast to increase by 6 per cent to 418 000 tonnes.
Table 10 Winter crop forecasts, 2012–13, South Australiaarea yield production area change from
2011–12production change from 2011–12
'000 ha t/ha kt % %
Wheat 2 160 1.89 4 082 –4 –8
Barley 960 1.80 1 728 –17 –21
Canola 277 1.51 418 32 6
Note: Yields are based on areas planted.
Western AustraliaFollowing very wet conditions in early summer, rainfall from March to May 2012 across the Western Australian grains belt was generally below average. Consequently, upper level soil moisture was deficient across much of the Western Australian grains belt in April and May.
Planting began in late April and given the dry conditions, crops were mostly dry sown. Rainfall in early May 2012 was beneficial to planting and alleviated stress in germinating canola in many regions. However, sufficient and timely rainfall will be needed to achieve average yields.
The Bureau of Meteorology estimates the chances of exceeding median rainfall from June to August 2012 in the Western Australian grains belt as between 20 and 40 per cent. Above average forecast temperatures may also contribute to moisture stress. The timing of the rainfall during the growing season will be critical to crop development.
16

Australian crop report June 2012 ABARES
The total area planted to winter crops in Western Australia is forecast to decline by 2 per cent in 2012–13 to 7.5 million hectares. The forecast fall reflects the dry seasonal conditions and expected lower grain prices. Assuming average yields, total winter crop production is forecast to fall by 22 per cent to 13.2 million tonnes.
The area sown to wheat is forecast to decline by 6 per cent in 2012–13 to 4.8 million hectares, reflecting expected lower prices. Some wheat producing areas suffered moisture stress in May and as a result yields could be below average in these areas. Wheat production is forecast to decline by 26 per cent to 8.7 million tonnes, reflecting falls in the planted area and yields from 2011–12.
The area planted to barley is forecast to rise by 5 per cent in 2012–13 to 1.1 million hectares. Barley production is forecast to decrease by 14 per cent to 2.3 million tonnes, reflecting a return to average yields from above average in 2011–12.
The area planted to canola is forecast to increase by 19 per cent to 926 000 hectares. This largely reflects favourable margins for canola leading to an increase in the area planted to canola. Dry conditions early in the season could lead to below average yields in some areas. Assuming yields around average over the state as a whole, canola production is forecast to increase by 2 per cent to 1.2 million tonnes.
The area sown to lupins is forecast to decline by 13 per cent in 2012–13 to 290 000 hectares, largely as a result of lower gross margins to lupins compared with production alternatives. Lupins production is forecast to decrease by 43 per cent to 389 000 tonnes, reflecting the forecast decline in planted area and a fall from last season's high yields.
Table 11 Winter crop forecasts, 2012–13, Western Australiaarea yield production area change from
2011–12production change from 2011–12
'000 ha t/ha kt % %
Wheat 4 785 1.81 8 660 –6 –26
Barley 1 102 2.05 2 260 5 –14
Canola 926 1.29 1 197 19 2
Lupins 290 1.34 389 –13 –43
Note: Yields are based on areas planted.
17

Australian
crop report June 2012
ABARES
18
Table 12 Australian crop productionarea planted yield production
Five-year average a
2010–11 2011–12 s 2012–13 f Five-year average a
2010–11 2011–12 s 2012–13 f Five-year average a
2010–11 2011–12 s 2012–13 f
'000 ha '000 ha '000 ha '000 ha t/ha t/ha t/ha t/ha kt kt kt ktWheat 13 538 13 645 14 058 13 353 1.68 2.04 2.10 1.81 22 846 27 891 29 515 24 124Barley 4 423 3 740 4 038 3 875 1.83 2.18 2.12 1.88 7 948 8 145 8 572 7 302Oats b 959 832 1 003 919 1.40 1.37 1.73 1.60 1 340 1 142 1 734 1 469Triticale 339 330 330 332 1.55 2.08 1.76 1.58 525 685 580 525Grain sorghum b 699 674 632 600 3.14 3.07 3.71 3.39 2 268 2 068 2 343 2 035Maize 60 61 77 73 5.55 5.75 5.48 5.76 336 351 422 421Canola 1 701 2 093 1 730 2 123 1.19 1.14 1.63 1.38 2 035 2 382 2 815 2 935Sunflower 36 29 40 42 1.32 1.51 1.17 1.18 47 44 47 50Cottonseed c 234 590 600 525 2.66 2.15 2.55 2.90 571 1 269 1 527 1 520Cotton lint 234 590 600 525 1.92 1.52 1.80 2.00 410 898 1 080 1 050Rice (rough) 25 75 109 110 8.97 9.68 8.75 9.01 233 726 955 991Lupins d 659 783 490 421 1.24 1.07 1.84 1.28 787 841 901 539Field peas d 283 292 244 280 1.14 1.49 1.25 1.08 320 434 304 302Chickpeas d 389 546 327 554 1.13 0.69 1.48 1.44 421 379 485 797Faba beans d 137 145 151 172 1.51 1.98 1.77 1.60 209 287 268 275Lentils d 136 159 173 155 1.31 1.93 1.67 1.21 187 306 288 188
a Based on data from ABS, Principal Agricultural Commodities, cat. no. 7111.0; ABS, Agricultural Commodities, Australia, cat. no. 7121.0; Pulse Australia. b Area harvested for grain. c Cotton area is estimated harvested
area. d Source: Pulse Australia. s ABARES estimate. f ABARES forecast.
Note: The crop year refers to crops planted during the 12 months to 31 March. Winter crops are generally both sown and harvested within the nominated 12 month period. Slight discrepancies may appear between Table
11 and Tables 12 and 13 as a result of the inclusion of the Australian Capital Territory and Northern Territory in the Australian totals. Area and production estimates are from the sources detailed in footnotes to Tables 12
and 13. Coverage is for all farms with an estimated value of agricultural operations of more than $5000.

Australian
crop report June 2012
ABARES
19
Table 13 State production—major cropsNew South Wales Victoria Queensland Western Australia South Australia Tasmaniaarea prod. area prod. area prod. area prod. area prod. area prod.'000 ha kt '000 ha kt '000 ha kt '000 ha kt '000 ha kt '000 ha kt
Winter cropsWheat 2012–13 f 3 820 6 876 1 630 2 860 950 1 615 4 785 8 660 2 160 4 082 8 312011–12 s 4 000 7 920 1 700 3 630 1 000 1 780 5 100 11 730 2 250 4 425 8 302010–11 a 3 823 10 700 1 821 4 493 937 1 605 4 698 4 999 2 357 6 060 9 34Five-year average to 2011–12 a 4 027 6 682 1 674 2 974 918 1 540 4 721 7 787 2 191 3 832 8 31Barley2012–13 f 840 1 495 880 1 650 85 145 1 102 2 260 960 1 728 8 242011–12 s 880 1 690 860 1 850 90 171 1 050 2 635 1 150 2 200 8 262010–11 a 886 2 249 806 1 954 105 158 1 124 1 589 808 2 158 10 37Five-year average to 2011–12 a 949 1 488 977 1 784 94 152 1 307 2 501 1 088 1 995 9 29Canola2012–13 f 550 825 370 495 0 0 926 1 197 277 418 0 02011–12 s 395 720 350 530 0 0 775 1 170 210 395 0 02010–11 a 487 822 323 477 2 3 1 058 711 222 369 1 1Five-year average to 2011–12 a 359 426 277 359 2 1 867 969 195 279 1 1Lupins2012–13 f 53 63 20 23 0 0 290 389 57 64 0 02011–12 s 68 105 23 34 0 0 334 679 65 82 0 02010–11 a 134 269 43 69 0 0 541 407 64 96 0 0Five-year average to 2011–12 a 86 105 37 37 0 0 473 570 62 74 0 0Oats bFive-year average to 2011–12 a 366 353 177 281 12 9 304 575 96 115 4 8
Summer cropsGrain sorghum2011–12 f 185 680 1 2 445 1 660 1 1 0 0 0 02010–11 a 213 823 1 1 459 1 243 1 1 0 0 0 02009–10 a 164 581 0 0 333 926 1 0 0 0 0 0Five-year average to 2010–11 a 209 796 1 1 488 1 471 1 1 0 0 0 0Cottonseed c2011–12 s 358 939 0 0 241 586 1 2 0 0 0 02010–11 348 805 0 0 242 464 0 0 0 0 0 02009–10 124 362 0 0 84 185 0 0 0 0 0 0Five-year average to 2010–11 142 372 0 0 92 199 0 0 0 0 0 0
a Based on data from ABS, Principal Agricultural Commodities, cat. no. 7111.0; ABS, Agricultural Commodities, Australia, cat. no. 7121.0. b Area harvested for grain; current season estimates, by state, are no longer
produced because of difficulties in obtaining consistent data at the state level. c Cottonseed area is estimated harvested area. Includes northern dry season crop. f ABARES forecast. s ABARES estimate.
Note: Zero area or production estimates may appear as a result of rounding to the nearest whole number, if production or area estimates are less than 500 tonnes or 500 hectares.
Australian
crop report June 2012
ABARES
20
Table 14 State production—other cropsNew South Wales
Victoria Queensland Western Australia
South Australia Other a
area prod. area prod. area prod. area prod. area prod. area prod.'000 ha kt '000 ha kt '000 ha kt '000 ha kt '000 ha kt '000 ha kt
Winter cropsChickpeas2012–13 f 266 400 49 54 205 308 10 8 25 27 0 02011–12 s 200 252 35 65 73 139 11 15 9 15 0 02010–11 b 335 201 25 48 168 112 9 4 10 16 0 0Five-year average to 2011–12 240 250 32 35 103 121 5 5 8 11 0 0Faba beans2012–13 f 49 120 56 71 0 0 3 3 64 81 0 02011–12 s 43 67 49 99 2 3 3 4 55 95 0 02010–11 b 40 84 45 82 3 5 3 3 55 113 0 0Five-year average to 2011–12 33 52 37 55 1 2 3 3 62 96 0 0Field peas2012–13 f 55 70 46 50 0 0 35 39 121 143 0 02011–12 s 41 62 38 60 0 0 55 32 110 150 0 02010–11 b 57 76 45 76 0 0 72 50 118 232 0 0Five-year average to 2011–12 44 39 54 59 0 0 64 57 121 164 0 0Lentils2012–13 f 1 1 70 84 0 0 0 0 84 103 0 02011–12 s 1 1 77 125 0 0 0 0 95 162 0 02010–11 b 1 1 75 132 0 0 0 0 83 174 0 0Five-year average to 2011–12 0 0 69 79 0 0 0 0 67 107 0 0
Summer cropsMaize2011–12 s 27 220 1 6 48 192 1 4 0 0 0 02010–11 s 24 202 1 6 35 139 1 4 0 0 0 02009–10 20 172 1 6 37 146 1 4 0 0 0 0Five-year average to 2010–11 20 162 1 5 39 166 1 3 0 0 0 0Sunflower2011–12 s 20 25 0 0 20 22 0 0 0 0 0 02010–11 s 18 31 0 0 11 13 0 0 0 0 0 02009–10 19 31 0 0 8 10 0 0 0 0 0 0Five-year average to 2010–11 22 30 0 0 12 16 0 0 0 0 0 0Rice c2011–12 s 108 950 0 4 0 0 1 1 0 0 0 02010–11 s 74 720 0 4 0 1 0 1 0 0 0 02009–10 18 195 0 0 0 2 0 0 0 0 0 0Five-year average to 2010–11 24 231 0 1 0 1 0 0 0 0 0 0
a Refers to Northern Territory for rice. For all other listed crops, refers to Tasmania. b Source: Pulse Australia. c Rough rice. Includes northern dry season and wet season crops. f ABARES forecast. s ABARES estimate.
Note: Zero area or production estimates may appear as a result of rounding to the nearest whole number, if production or area estimates are less than 500 tonnes or 500 hectares.

Australian crop report June 2012 ABARES
Table 15 Australian supply of wheat, oilseeds and pulses2007-08 2008-09 2009-10 2010–11 2011–12 s 2012-13 fkt kt kt kt kt kt
WheatProduction 13 569 21 420 21 834 27 891 29 515 24 124Domestic use 6 517 7 306 4 999 6 144 6 715 4 879– flour a 2 337 2 470 2 490 2 510 2 530 2 550– residual (incl. feed) b 3 503 4 142 1 826 2 931 3 500 3 200– seed 677 694 682 703 668 680Exports c 7 444 14 707 14 791 18 584 22 300 20 500Imports c 6 12 15 12 10 10Change in stocks –386 –581 2 060 3 175 527 –2 796CanolaProduction 1 214 1 844 1 920 2 382 2 815 2 935Apparent domestic use 622 660 708 744 795 813Exports 472 1 067 1 187 1 532 2 027 2 113Pulses – major cropsProduction lupins 662 708 823 841 901 539 field peas 268 238 356 434 304 302 chickpeas 313 443 487 379 485 797Apparent domestic use lupins 665 499 481 328 551 389 field peas 49 204 226 166 77 84 chickpeas 22 28 34 20 35 32Exports lupins 77 304 353 186 350 150 field peas 141 137 162 302 261 220 chickpeas 222 506 492 461 521 700
a ABARES estimate from 2008-09. b Calculated as a residual: production plus imports less exports less change in stocks less seed and flour
use. c Includes wheat flour and wheat grain. f ABARES forecast. s ABARES estimate.
Note: Production, use, trade and stocks data are on a marketing year basis: October–September for wheat; November–October for canola,
peas and lupins. Production may not equal the sum of apparent domestic use and exports in any one year because of reductions or increases
in stocks. The export data refer to marketing year export periods, so are not comparable with financial year export figures published
elsewhere. Some ABARES estimates have been revised based on additional industry information. ABARES is continuing to investigate data.
Sources: Australian Bureau of Statistics; Pulse Australia; ABARES.
21

Australian crop report June 2012 ABARES
Table 16 Australian supply and disposal of coarse grains2007–08 2008–09 2009–10 2010–11 2011–12 s 2012–13 fkt kt kt kt kt kt
BarleyProduction 7 160 7 997 7 865 8 145 8 572 7 302Apparent domestic use 3 106 4 105 3 165 2 778 2 926 2 634– seed 226 199 168 182 174 177– other 2 881 3 906 2 997 2 596 2 752 2 457Export 4 054 3 891 4 634 5 363 5 700 4 668– feed barley 2 303 2 254 2 668 3 601 3 822 3 054– malting barley 1 083 980 1 248 1 062 1 222 1 039– malt (grain equivalent) 668 658 785 702 744 751OatsProduction 1 502 1 160 1 162 1 142 1 734 1 469Apparent domestic use 1 321 998 954 1 021 1 544 1 294– seed 42 41 40 48 44 43– other 1 279 957 914 973 1 500 1 251Export 181 161 208 118 171 175Triticale Production 450 363 545 685 580 525Apparent domestic use 450 363 545 685 580 525– seed 16 17 17 17 17 16– other 434 345 529 669 563 509Grain sorghumProduction 3 790 2 692 1 508 2 068 2 343 2 035Apparent domestic use 2 833 1 694 1 167 1 400 1 353 1 293– seed 4 2 3 3 3 3– other 2 829 1 692 1 164 1 397 1 350 1 290Export a 110 957 998 341 970 990MaizeProduction 387 376 328 351 422 421Apparent domestic use 340 340 301 320 338 354– seed 1 1 1 1 1 1– other 339 339 300 319 336 353Export a 11 48 36 29 62 84Total coarse grainsProduction 13 289 12 587 11 408 12 391 13 651 11 753Apparent domestic use 8 050 7 500 6 132 6 205 6 741 6 100– seed 288 261 229 251 239 239– other 7 762 7 240 5 903 5 954 6 502 5 861Export 4 356 5 058 5 942 5 857 6 676 6 942
a Presentation of export volumes for grain sorghum and maize in this table has changed as of December 2011. Export volumes are now
shown in the year of actual export, which is typically one year after production. f ABARES forecast. s ABARES estimate.
Note: Production, use and export data are on a marketing year basis: market years are November–October for barley, oats and triticale;
March–February for grain sorghum and maize. The sum of domestic use and exports may differ from production as a result of changes in
grain stock levels.
Sources: Australian Bureau of Statistics; Pulse Australia; ABARES
22

Australian crop report June 2012 ABARES
Table 17 Grains and oilseeds prices2010 2010 2011 2011 2011 2011 2012Jul–Sep Oct-Dec Jan–Mar Apr–Jun Jul–Sep Oct-Dec Jan-Mar
A$/t A$/t A$/t A$/t A$/t A$/t A$/tWheatDomestic feed – del. Sydney 275 272 250 256 243 218 212International US no.2 hard red winter, fob Gulf a 293 309 346 332 309 292 282BarleyDomestic 2 row feed – del. Sydney 248 233 234 238 228 205 195Export b feed 195 268 252 260 267 274 241 malting 212 271 292 299 301 323 255International feed – fob Rouen a 249 270 286 265 267 254 260Grain sorghumDomestic feed – del. Sydney 243 259 266 260 252 221 202Export b 234 285 270 283 279 290 266International US del. Gulf a 198 239 282 293 284 289 286OatsDomestic feed – del. Sydney 210 172 189 200 202 190 196Export b 273 256 345 287 305 332 292International US CME oats nearby contract 217 257 261 238 230 218 207MaizeDomestic feed – del. Sydney 335 335 354 325 319 306 296International US no.2 yellow corn fob Gulf a 202 246 282 295 289 267 266OilseedsDomestic canola – del. Melbourne 489 523 586 559 540 514 492 sunflowers – del. Melbourne 550 550 550 550 550 520 520International soybeans – US cif Rotterdam a 500 530 563 525 529 484 493PulsesDomestic lupins – del. Kwinana 229 319 317 286 244 200 194 chickpeas – del. Melbourne 424 464 514 444 453 514 491 field peas – del. Melbourne 274 278 270 278 284 280 298Export b chickpeas 560 480 536 519 523 610 571 field peas 312 320 340 356 347 387 366
a Average of daily offer prices made in US$, converted to A$ using quarterly average of daily exchange rates. b Export unit values reflect the
average price received for grain exported over the quarter, not current market prices. These prices are the average unit value (free on board)
of Australian exports recorded by the Australian Bureau of Statistics. There can be a long lag time between when prices were negotiated by
exporters and the physical export of product.
Note: Prices used in these calculations exclude the GST.
23