climatology of precipitation and precipitation extremes in the united states
DESCRIPTION
Climatology of Precipitation and Precipitation Extremes in the United States. Greg Johnson Applied Climatologist USDA-NRCS National Water and Climate Center Portland, Oregon RFC Hydromet 01-1 14-21 November 2000. Characteristics of the Mean Precipitation Climate. - PowerPoint PPT PresentationTRANSCRIPT
Climatology of Precipitation and Climatology of Precipitation and Precipitation Extremes in the Precipitation Extremes in the
United StatesUnited States
Greg JohnsonGreg JohnsonApplied ClimatologistApplied Climatologist
USDA-NRCSUSDA-NRCS
National Water and Climate CenterNational Water and Climate Center
Portland, OregonPortland, OregonRFC Hydromet 01-1RFC Hydromet 01-1
14-21 November 200014-21 November 2000
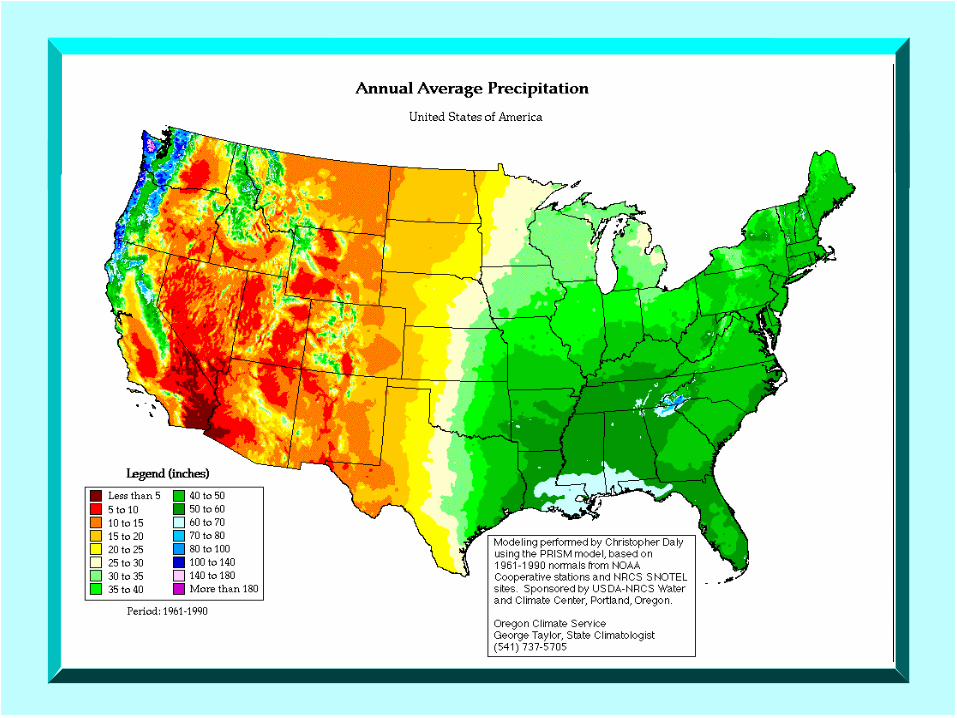
Characteristics of the Mean Characteristics of the Mean Precipitation ClimatePrecipitation Climate
The principal controlling factors are the The principal controlling factors are the availability of atmospheric moisture and availability of atmospheric moisture and lifting mechanisms lifting mechanisms
Moisture controlled by flow from or Moisture controlled by flow from or proximity to large water bodiesproximity to large water bodies
Propensity for lifting influenced by Propensity for lifting influenced by topography, convergence zones topography, convergence zones (seabreeze, etc.), preferred storm tracks (seabreeze, etc.), preferred storm tracks (jet dynamics)(jet dynamics)
Orographic Precipitation Orographic Precipitation Enhancement FactorsEnhancement Factors
Wind Direction (relative to Wind Direction (relative to topography)topography)
Wind SpeedWind Speed Atmos. Moisture (precipitable Atmos. Moisture (precipitable
water)water) Elevation RiseElevation Rise Slope AngleSlope Angle

Issues of ScaleIssues of Scale(Spatial and Temporal)(Spatial and Temporal)
Over long averaging times (say, Over long averaging times (say, the 30 year normal maps), only the the 30 year normal maps), only the most important and consistent most important and consistent meteorological factors are evidentmeteorological factors are evident
Progressively shorter time spans Progressively shorter time spans reveal ever-increasing nuances of reveal ever-increasing nuances of the atmospheric systemthe atmospheric system
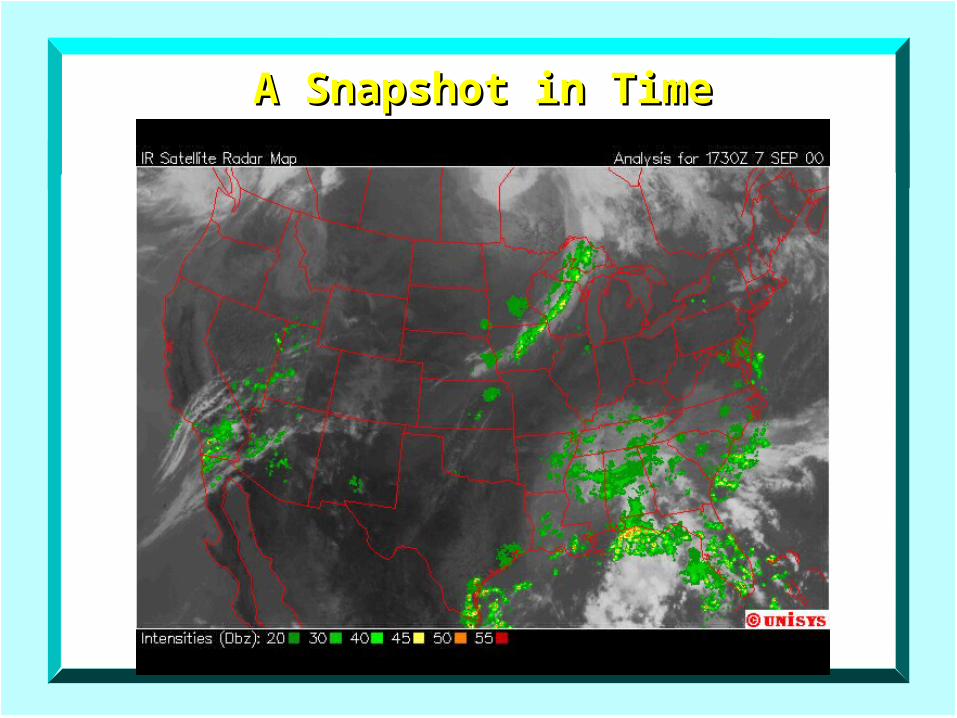
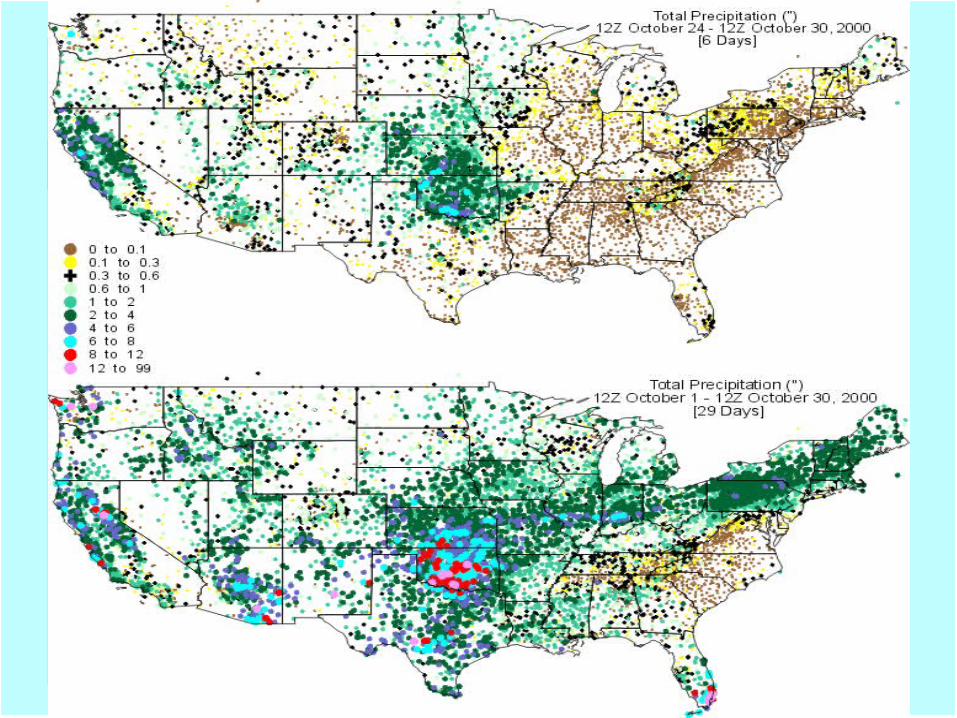
A Snapshot in TimeA Snapshot in Time
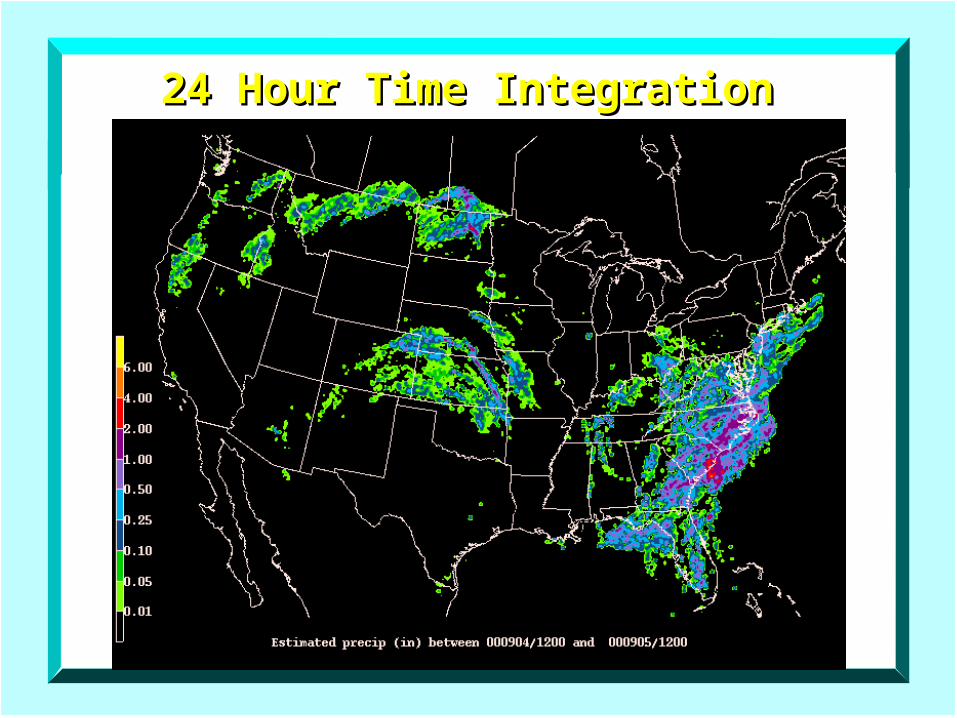
24 Hour Time Integration24 Hour Time Integration
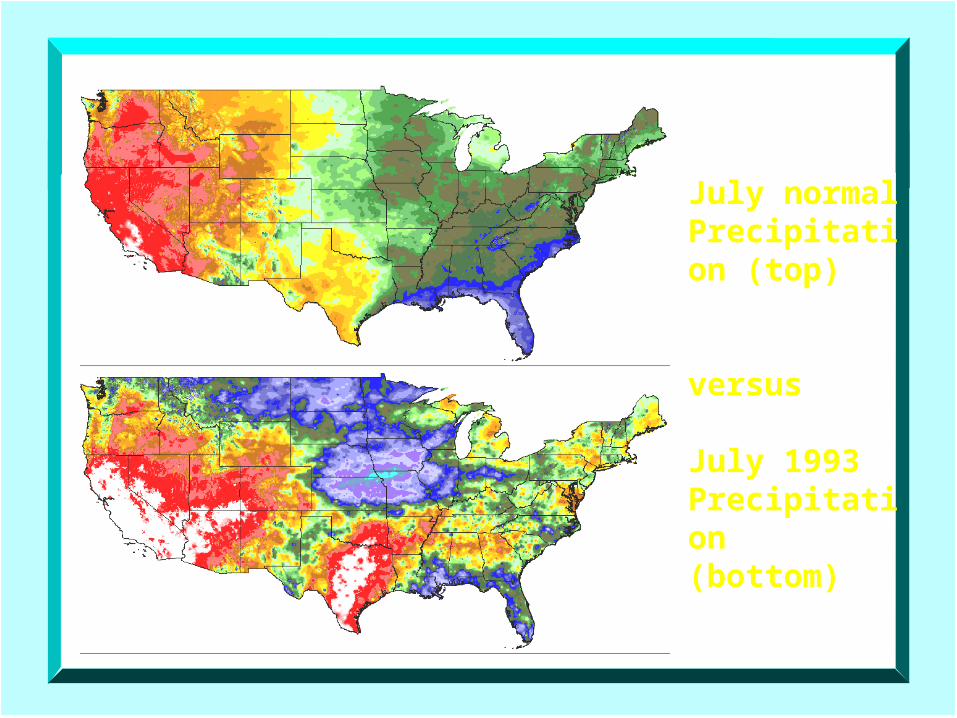
July normalPrecipitation (top)
versus
July 1993 Precipitation(bottom)
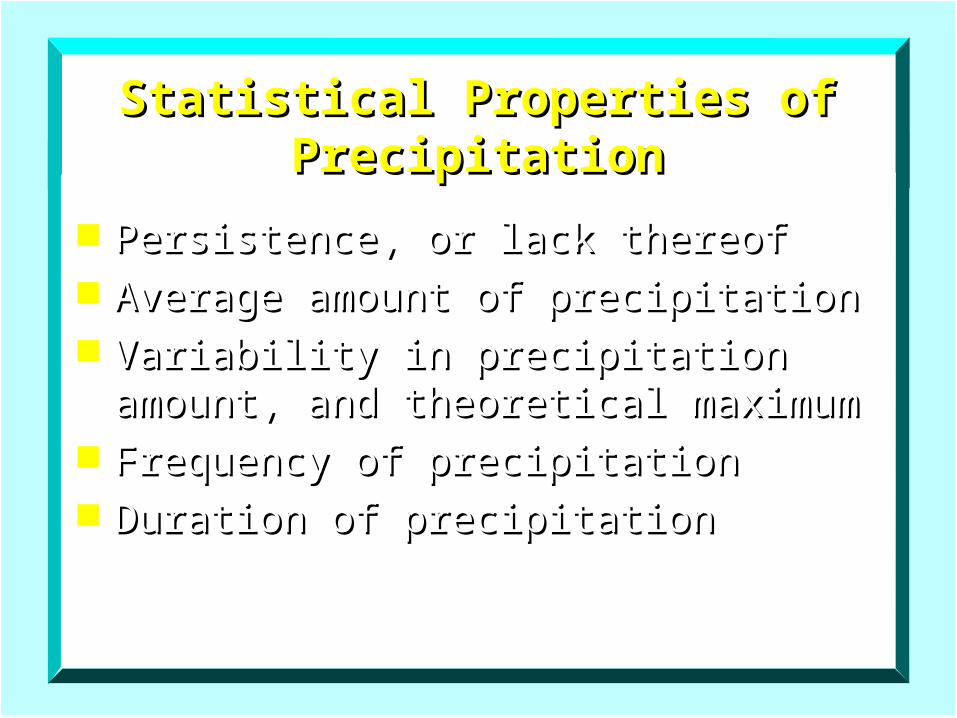
Statistical Properties of PrecipitationStatistical Properties of Precipitation
Persistence, or lack thereofPersistence, or lack thereof Average amount of precipitationAverage amount of precipitation Variability in precipitation amount, Variability in precipitation amount,
and theoretical maximumand theoretical maximum Frequency of precipitationFrequency of precipitation Duration of precipitationDuration of precipitation
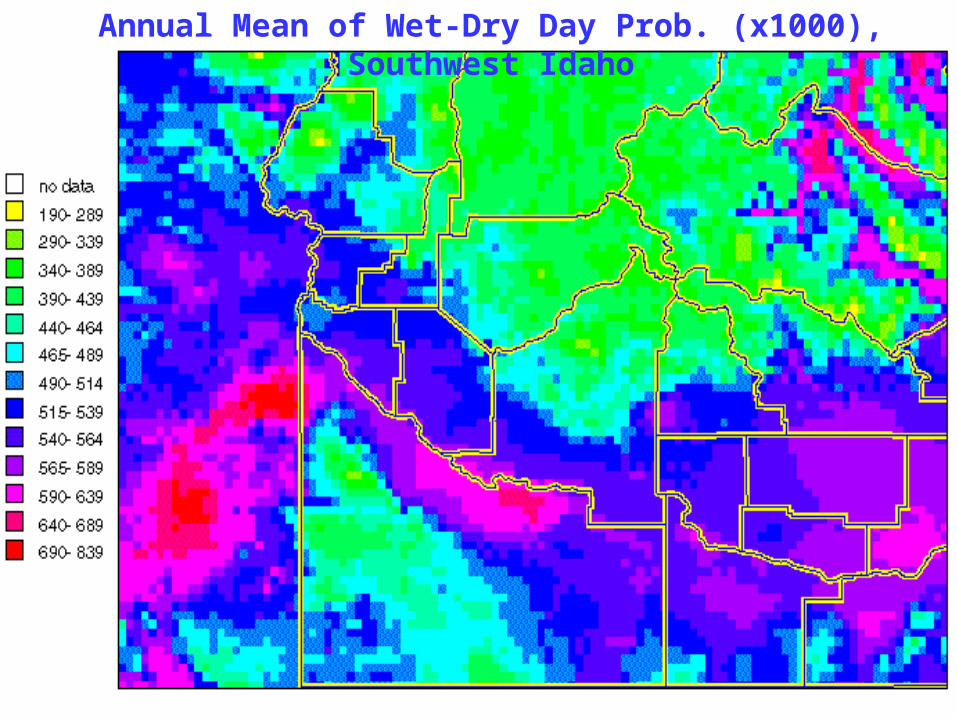
Annual Mean of Wet-Dry Day Prob. (x1000), Southwest Idaho
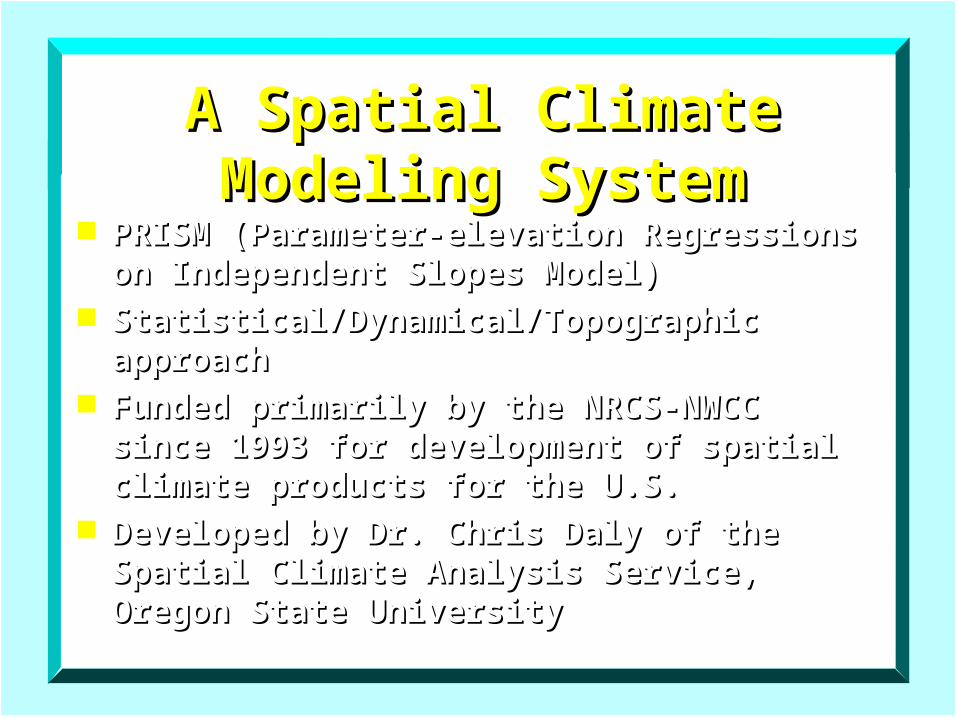
A Spatial Climate Modeling A Spatial Climate Modeling SystemSystem
PRISM (Parameter-elevation Regressions on PRISM (Parameter-elevation Regressions on Independent Slopes Model)Independent Slopes Model)
Statistical/Dynamical/Topographic approachStatistical/Dynamical/Topographic approach Funded primarily by the NRCS-NWCC since Funded primarily by the NRCS-NWCC since
1993 for development of spatial climate 1993 for development of spatial climate products for the U.S.products for the U.S.
Developed by Dr. Chris Daly of the Spatial Developed by Dr. Chris Daly of the Spatial Climate Analysis Service, Oregon State Climate Analysis Service, Oregon State UniversityUniversity

What is PRISM?What is PRISM?
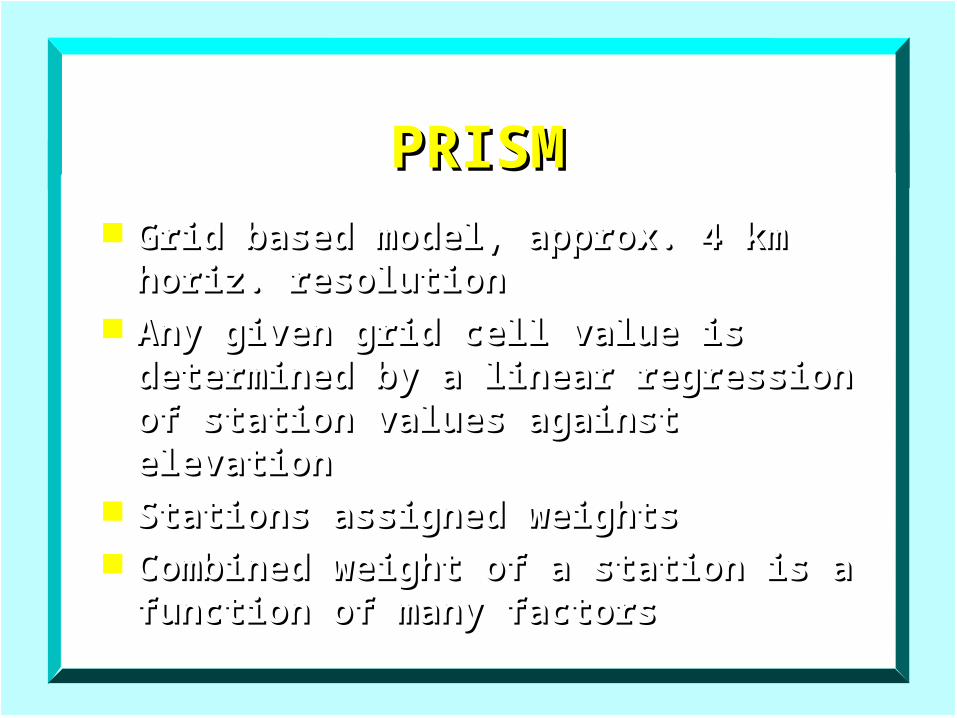
PRISMPRISM Grid based model, approx. 4 km horiz. Grid based model, approx. 4 km horiz.
resolutionresolution Any given grid cell value is determined Any given grid cell value is determined
by a linear regression of station values by a linear regression of station values against elevationagainst elevation
Stations assigned weightsStations assigned weights Combined weight of a station is a Combined weight of a station is a
function of many factorsfunction of many factors
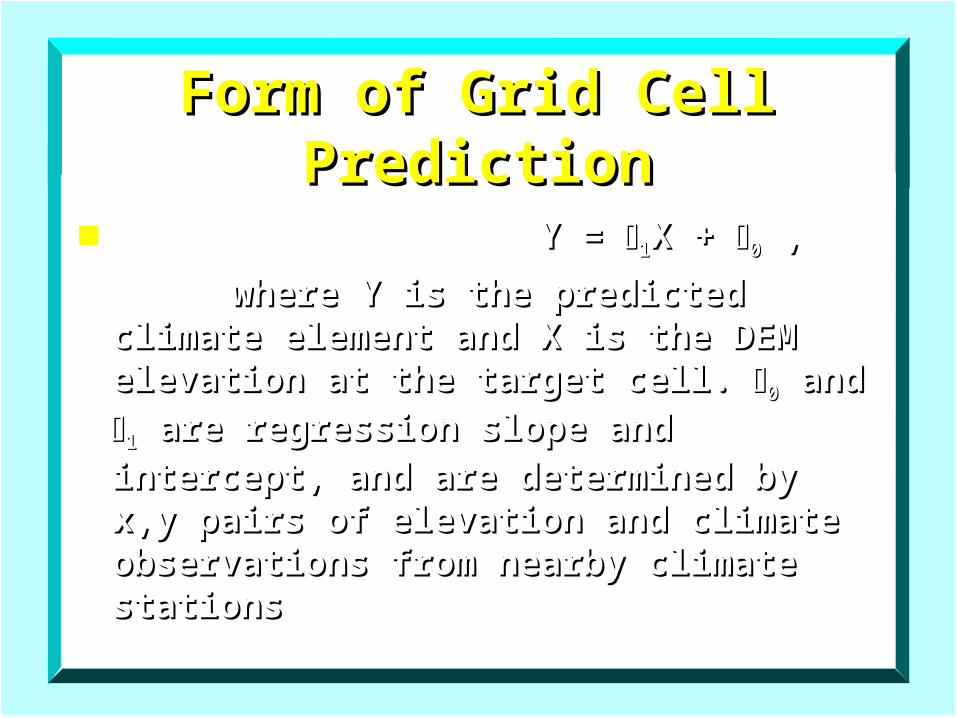
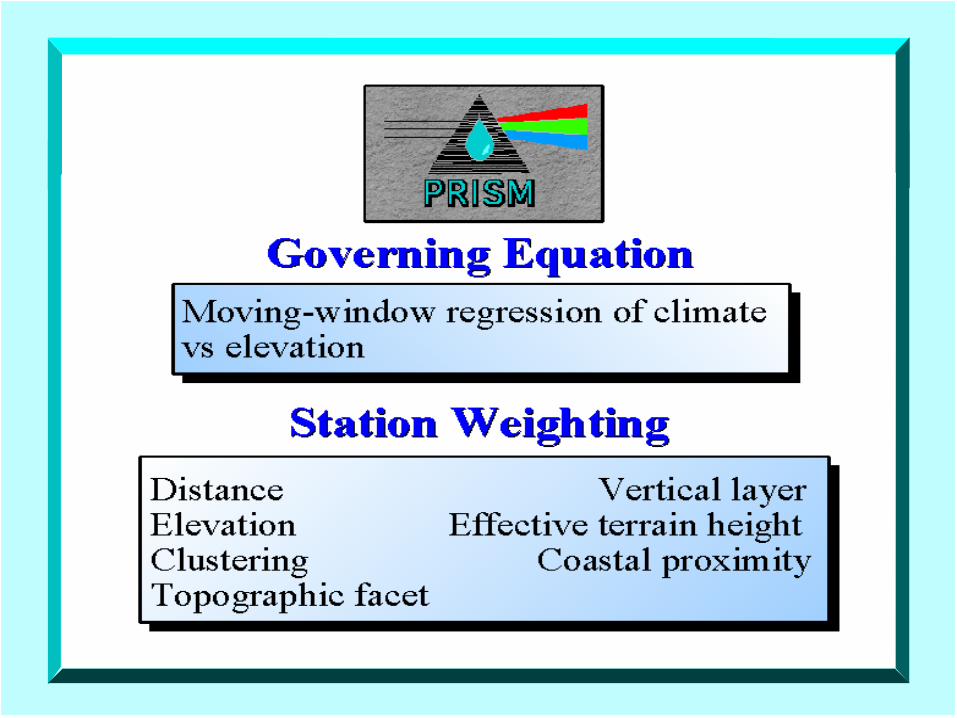
Form of Grid Cell PredictionForm of Grid Cell Prediction
Y = Y = 11X + X + 00 , ,
where Y is the predicted climate where Y is the predicted climate element and X is the DEM element and X is the DEM elevation at the target cell. elevation at the target cell. 00 and and 11 are regression slope and are regression slope and intercept, and are determined by intercept, and are determined by x,y pairs of elevation and climate x,y pairs of elevation and climate observations from nearby climate observations from nearby climate stations stations
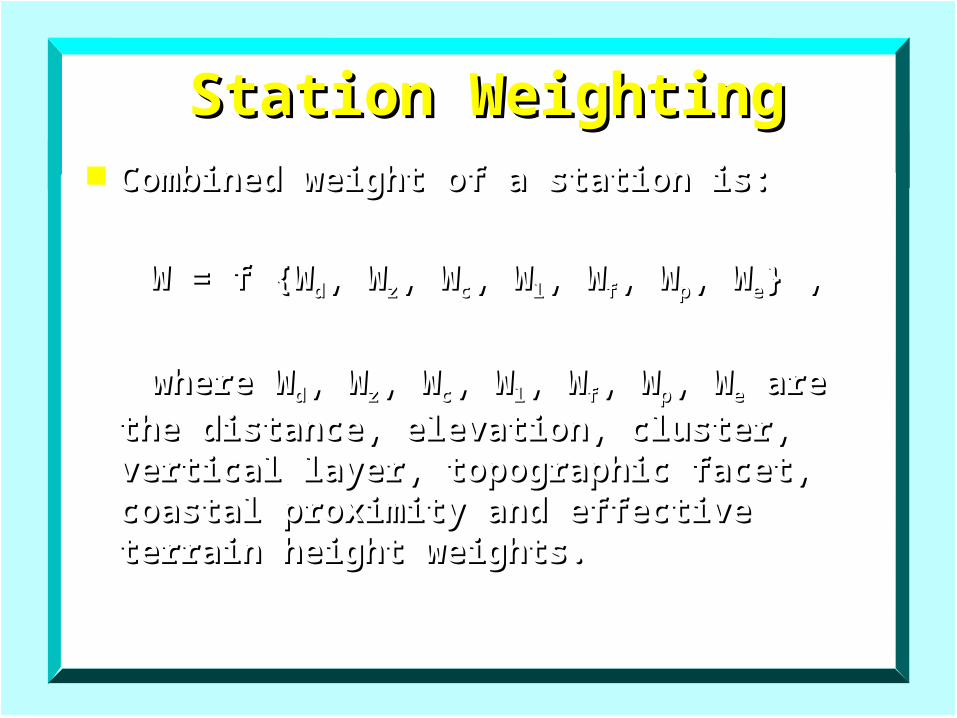
Station WeightingStation Weighting Combined weight of a station is:Combined weight of a station is:
W = f {WW = f {Wdd, W, Wzz, W, Wcc, W, Wll, W, Wff, W, Wpp, W, Wee} ,} ,
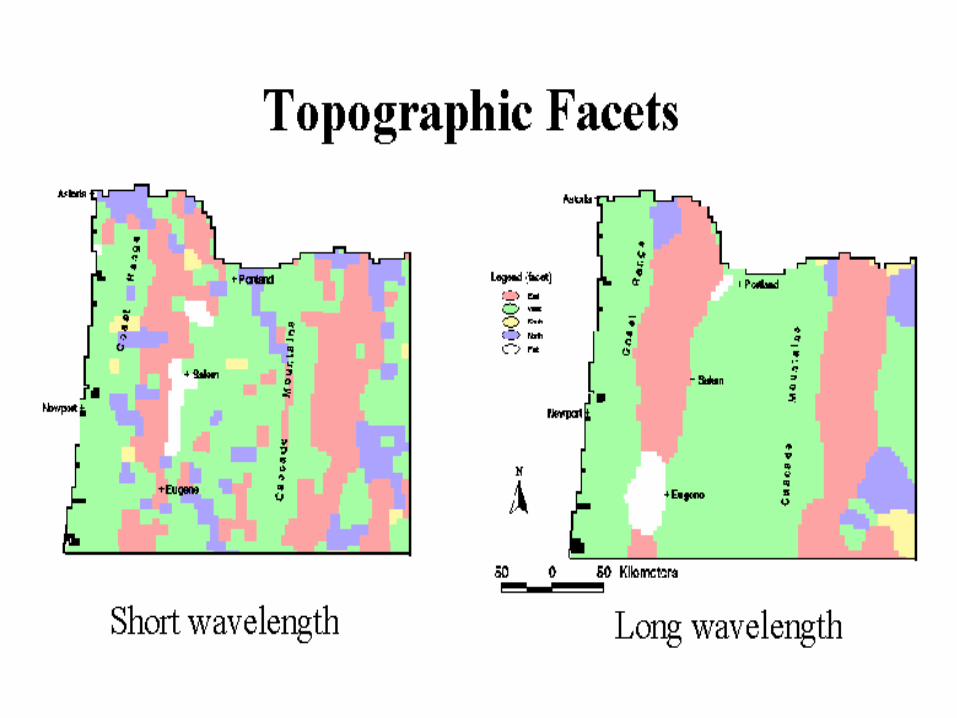
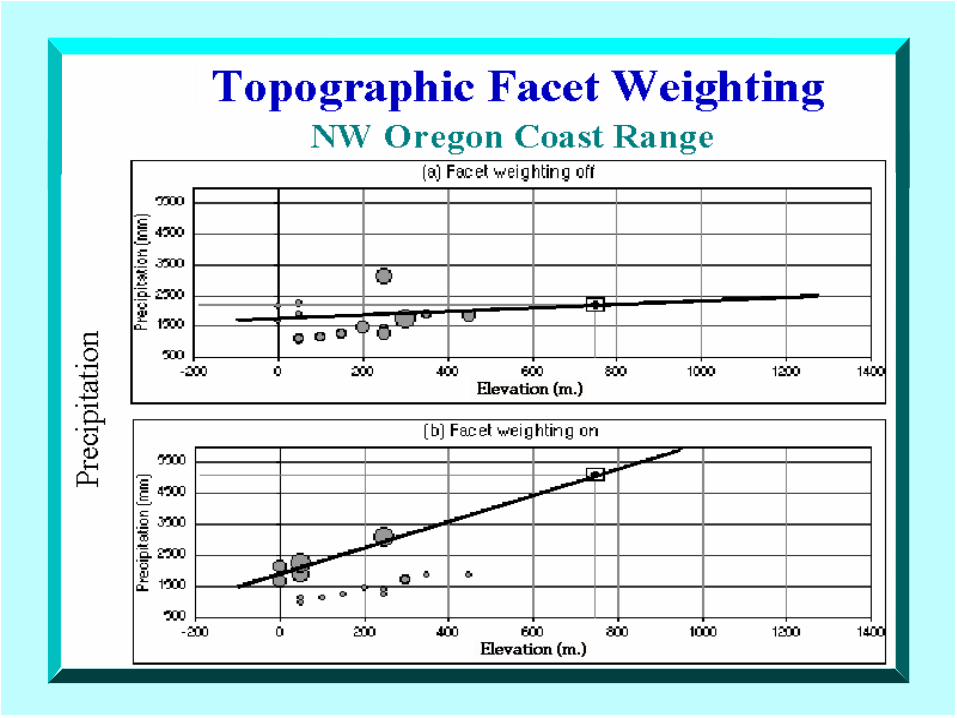
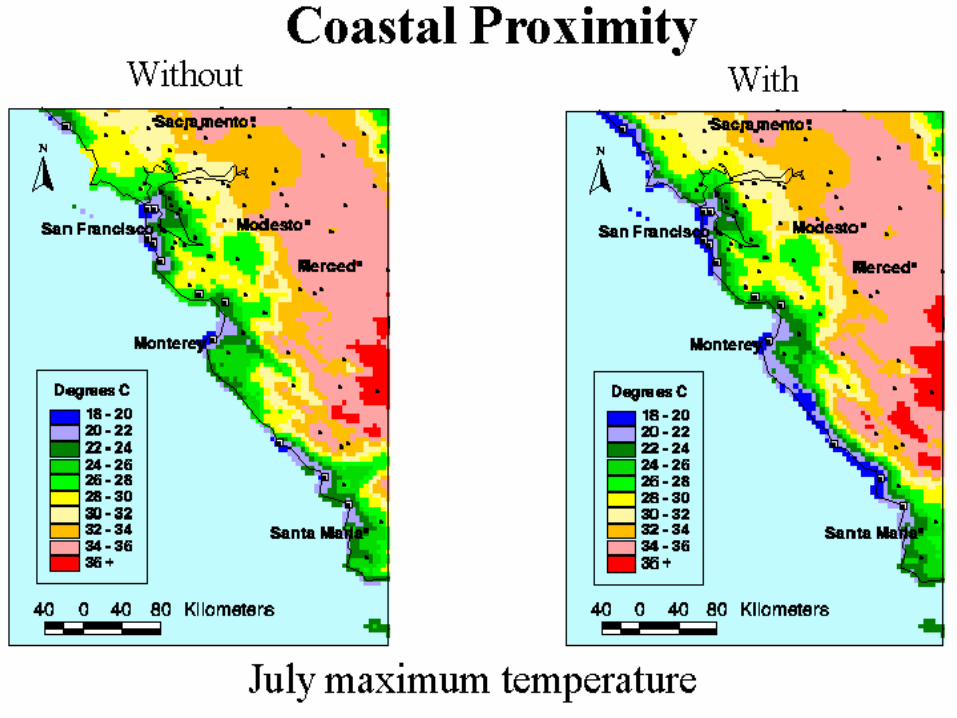
where Wwhere Wdd, W, Wzz, W, Wcc, W, Wll, W, Wff, W, Wpp, W, Wee are are the distance, elevation, cluster, the distance, elevation, cluster, vertical layer, topographic facet, vertical layer, topographic facet, coastal proximity and effective terrain coastal proximity and effective terrain height weights.height weights.
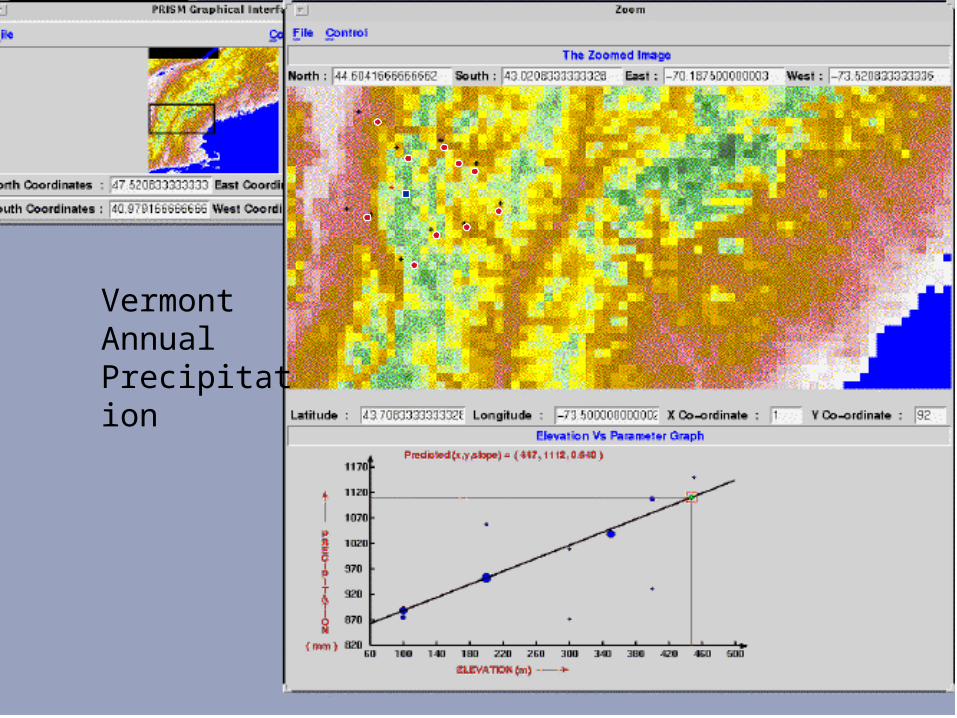
Vermont AnnualPrecipitation
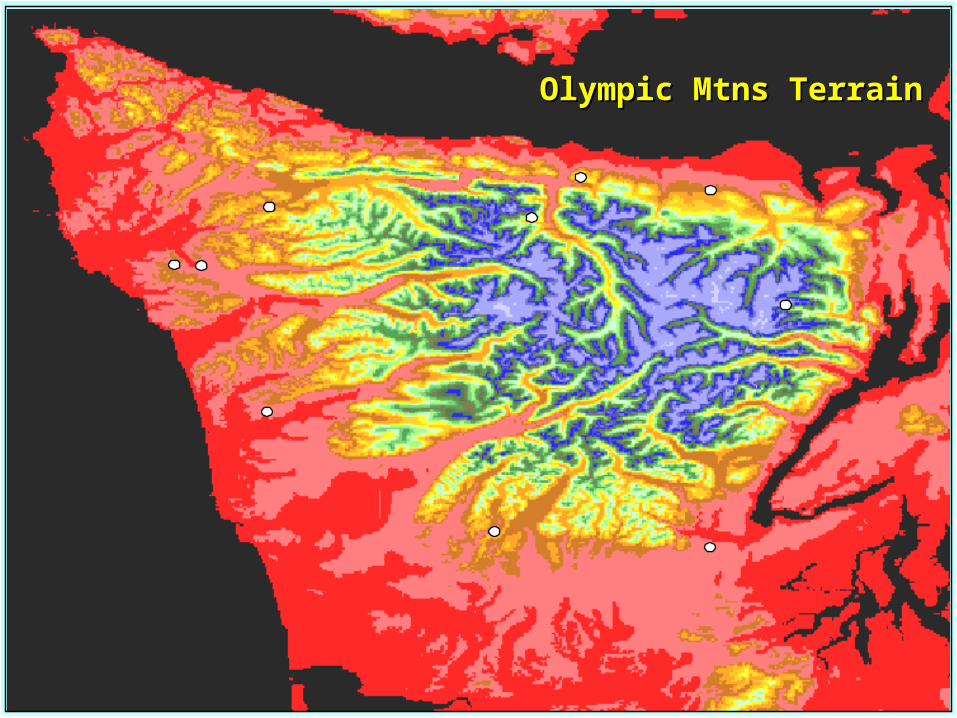
Olympic Mtns TerrainOlympic Mtns Terrain
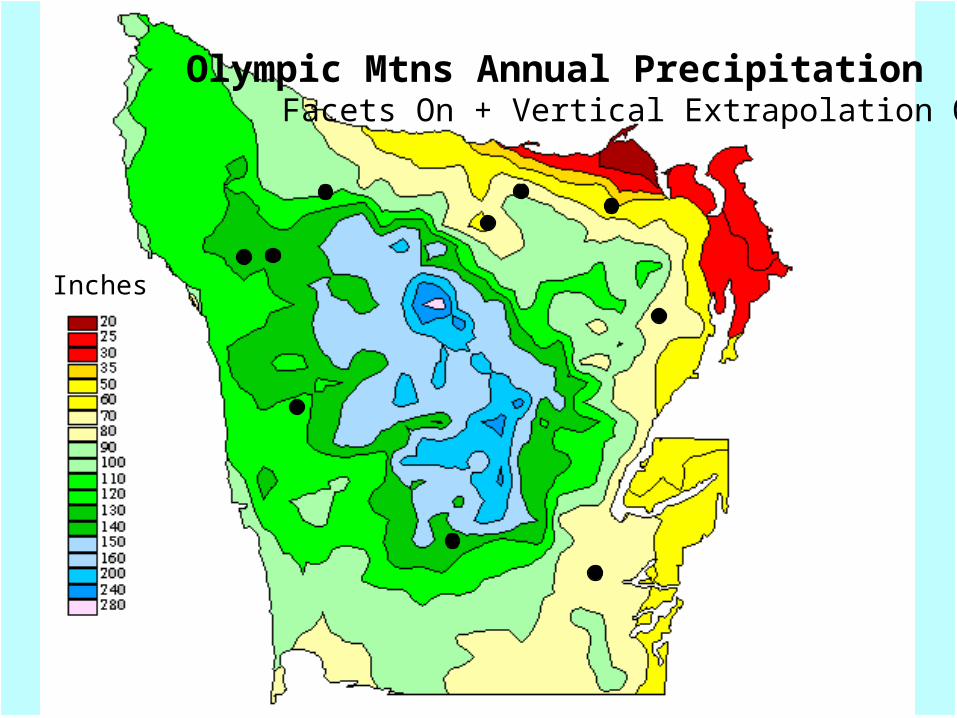
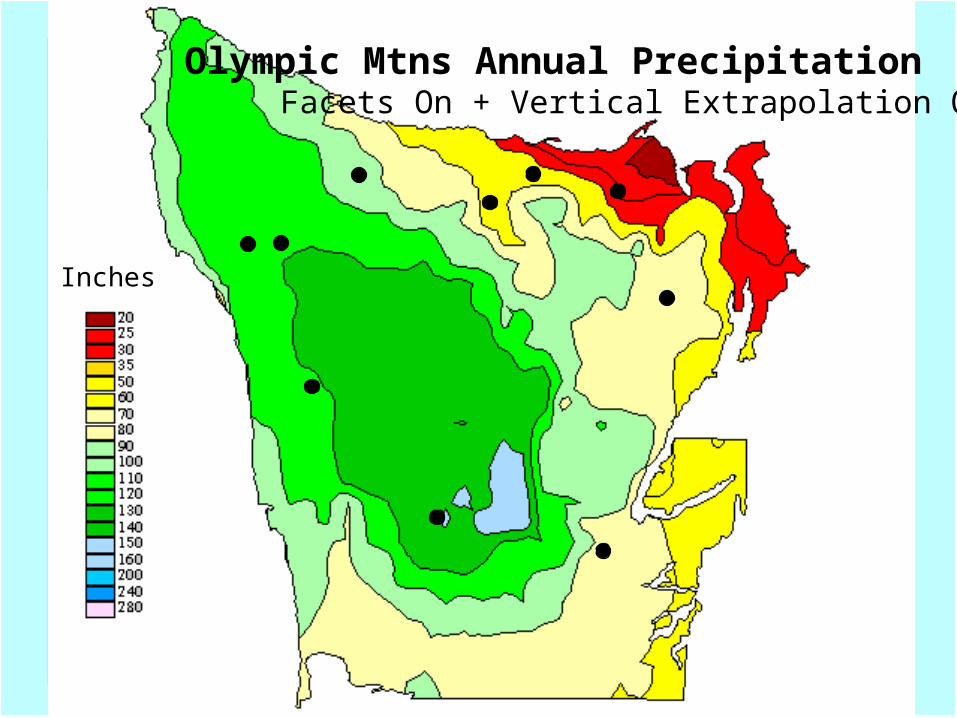
Olympic Mtns Annual Precipitation Facets On + Vertical Extrapolation On
Inches
Olympic Mtns Annual Precipitation Facets On + Vertical Extrapolation Off
Inches
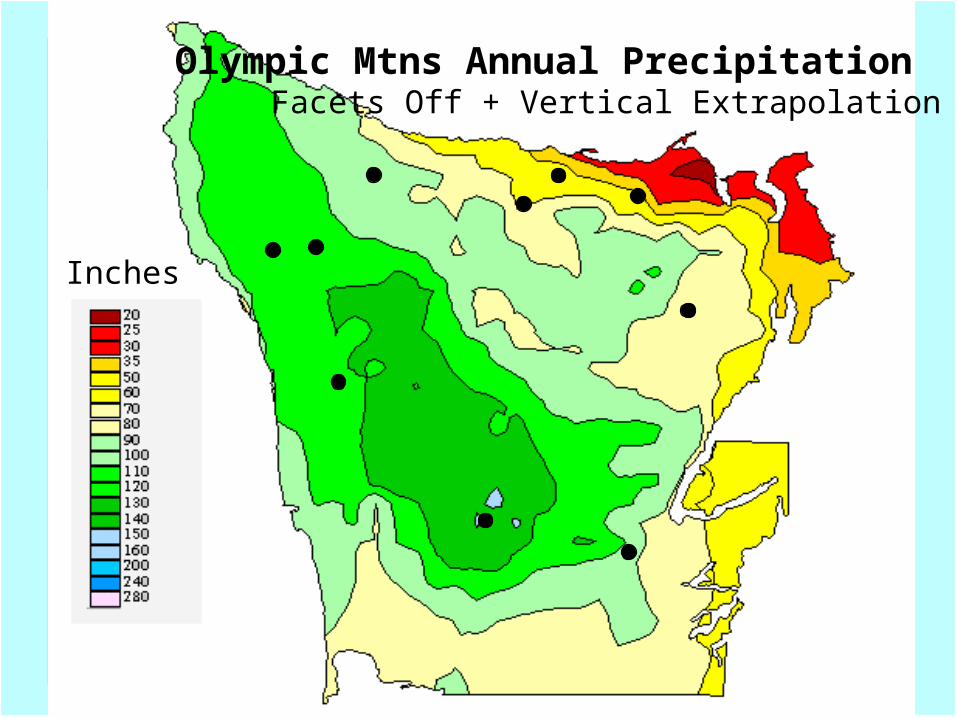
Olympic Mtns Annual Precipitation Facets Off + Vertical Extrapolation Off
Inches
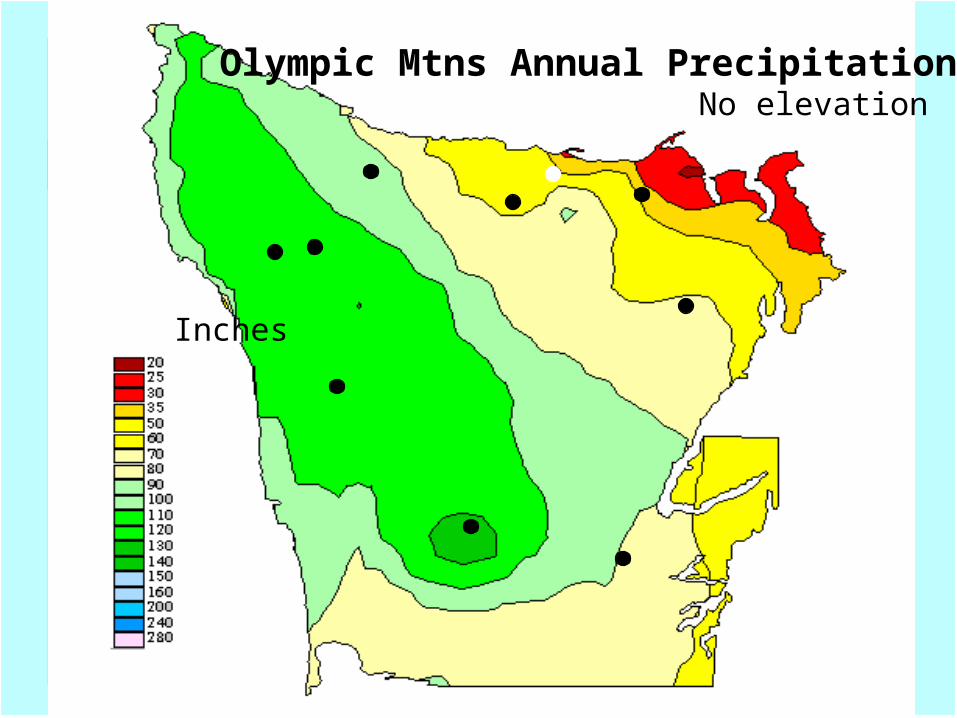
Olympic Mtns Annual Precipitation No elevation
Inches
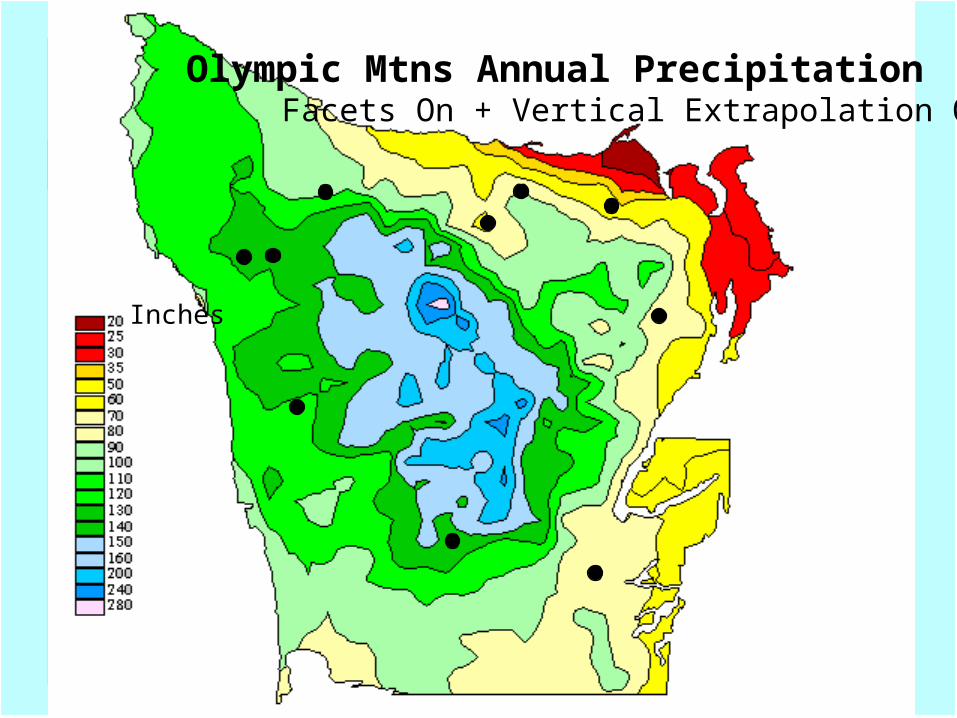
Olympic Mtns Annual Precipitation Facets On + Vertical Extrapolation On
Inches
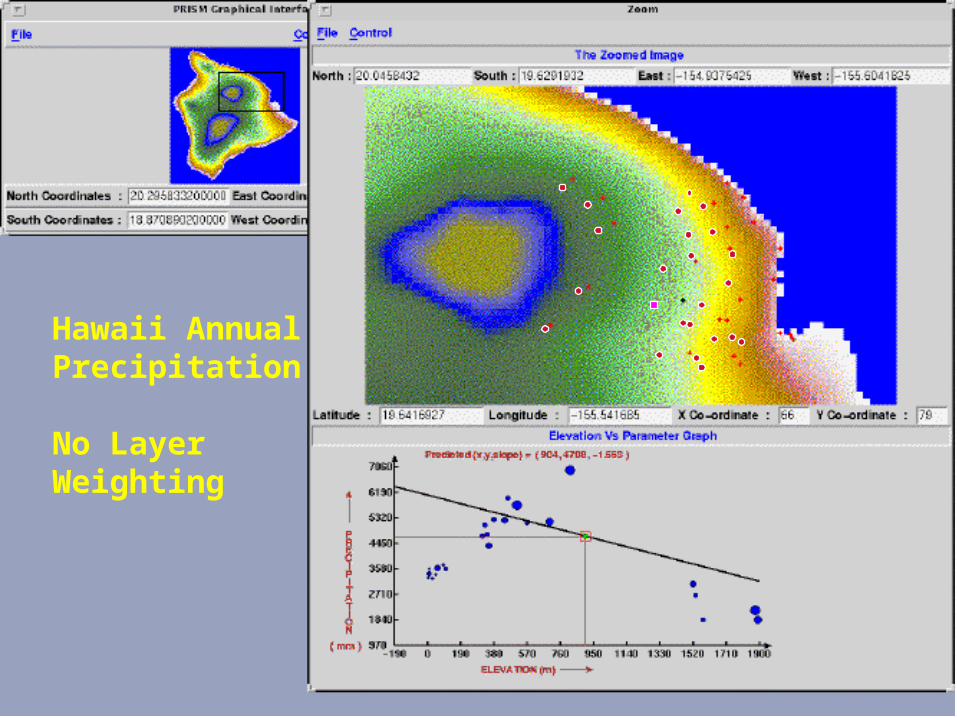
Hawaii AnnualPrecipitation No LayerWeighting
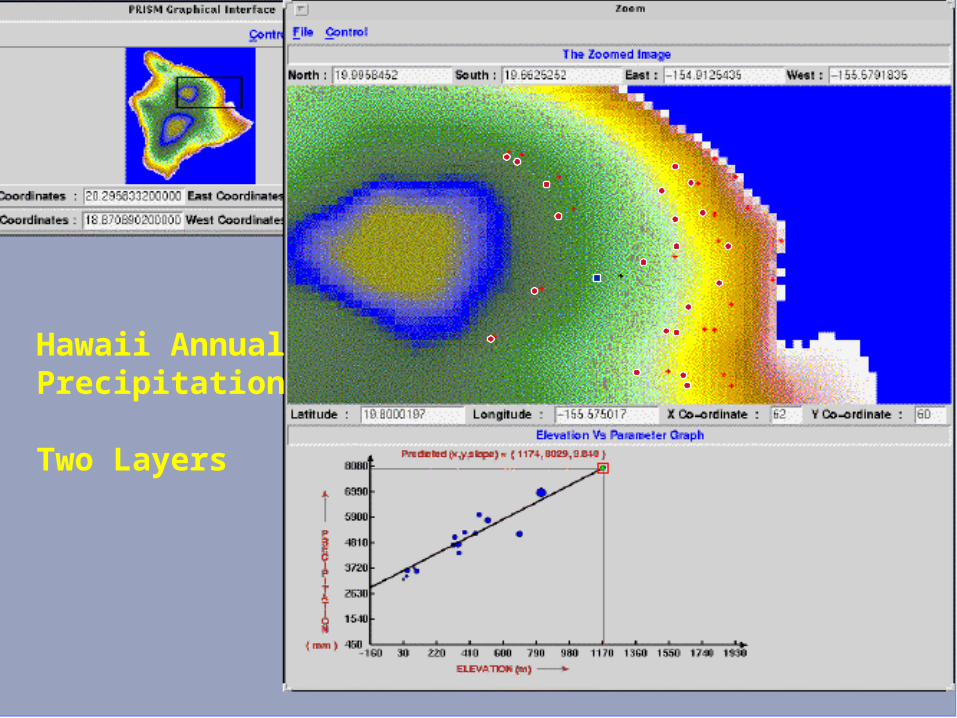
Hawaii AnnualPrecipitation
Two Layers
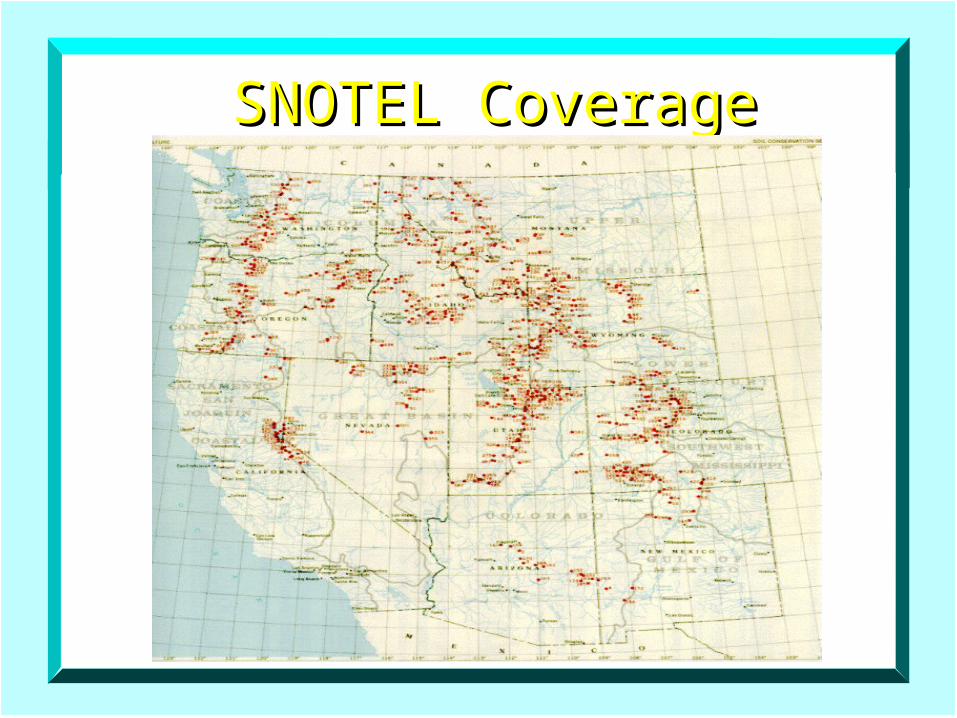
SNOTEL CoverageSNOTEL Coverage
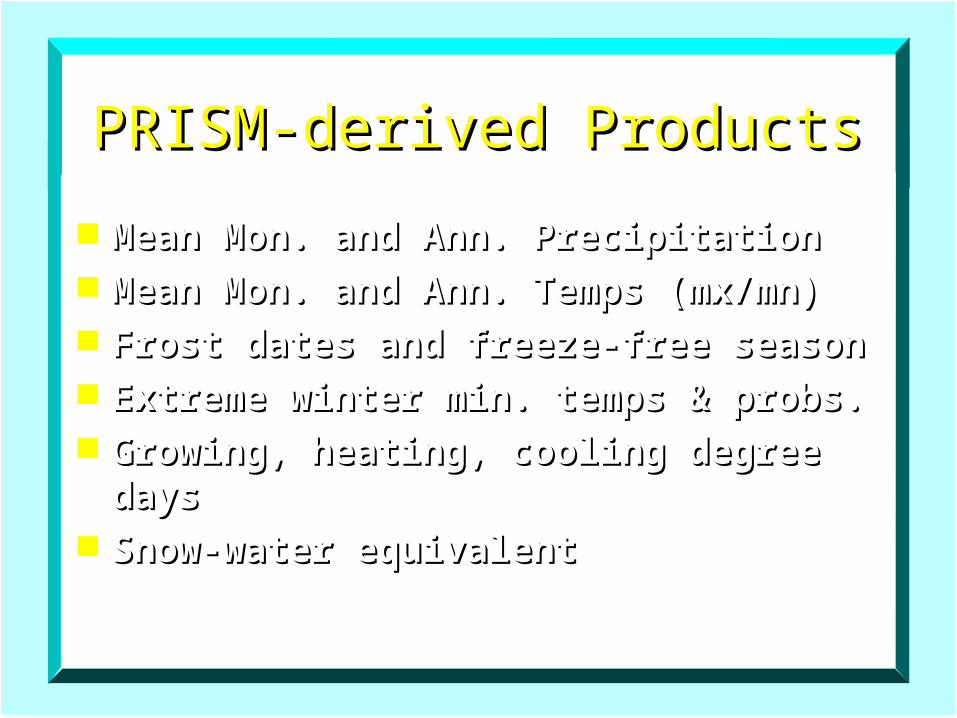
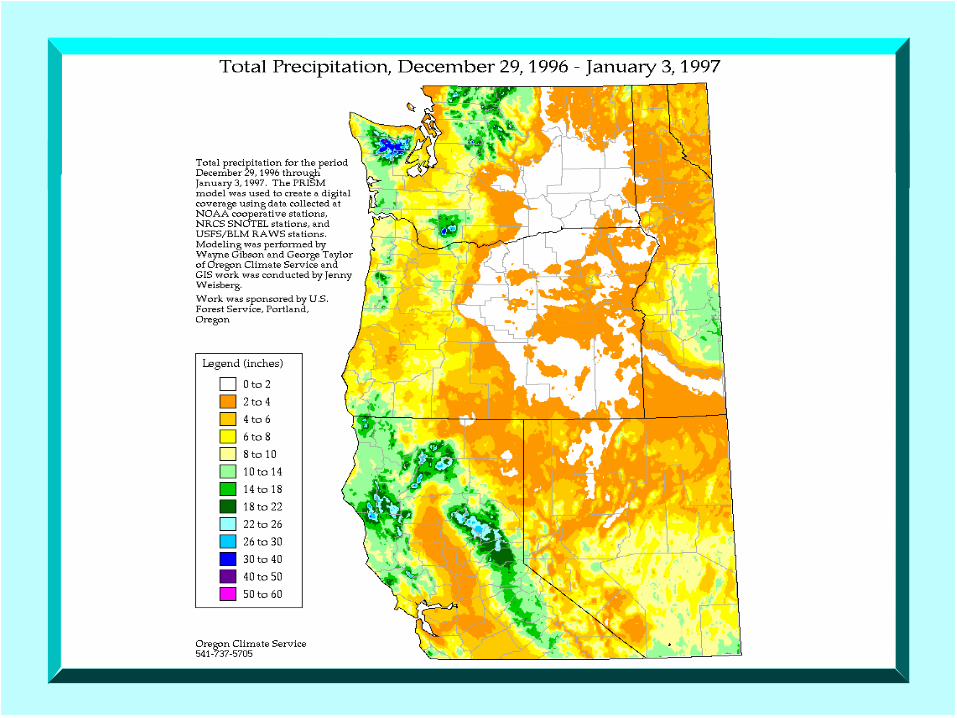
PRISM-derived ProductsPRISM-derived Products
Mean Mon. and Ann. PrecipitationMean Mon. and Ann. Precipitation Mean Mon. and Ann. Temps (mx/mn)Mean Mon. and Ann. Temps (mx/mn) Frost dates and freeze-free seasonFrost dates and freeze-free season Extreme winter min. temps & probs.Extreme winter min. temps & probs. Growing, heating, cooling degree Growing, heating, cooling degree
daysdays Snow-water equivalentSnow-water equivalent
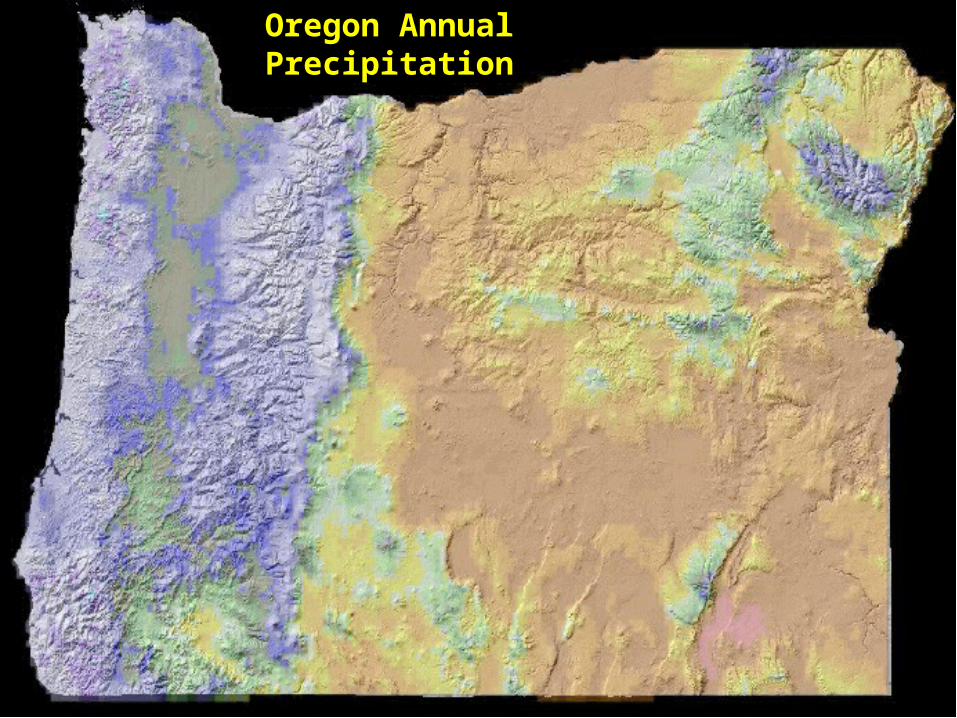
Oregon Annual Precipitation
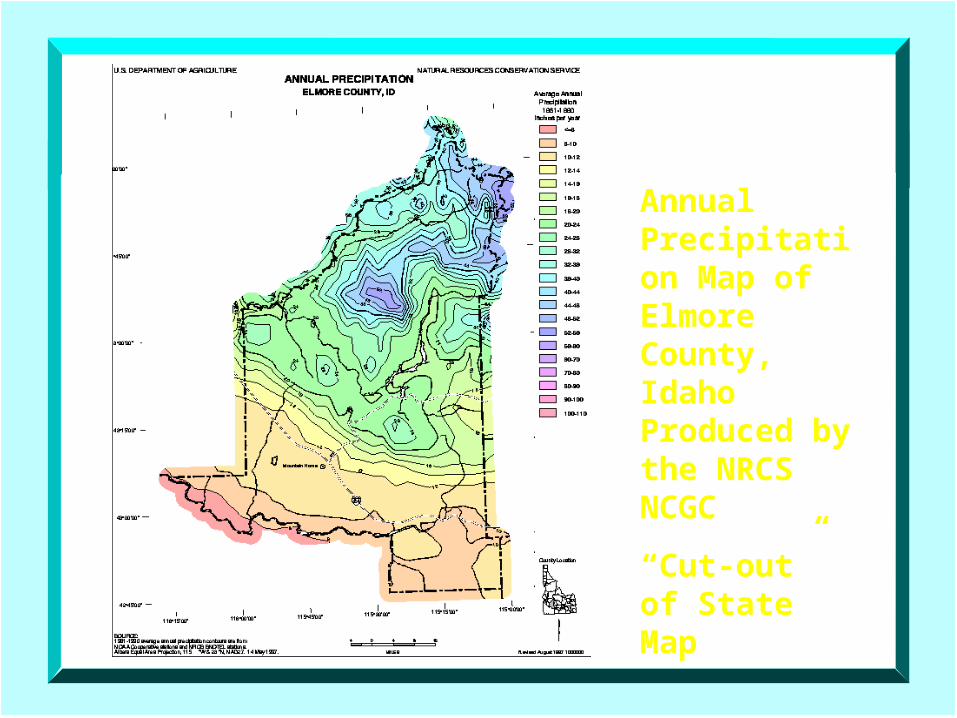
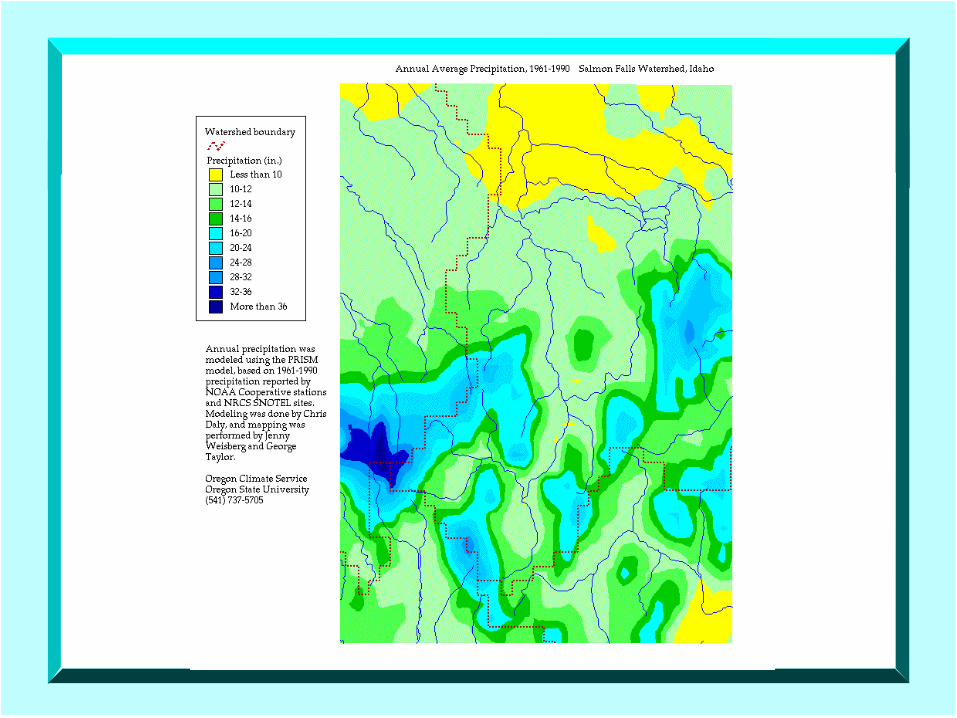
Annual Precipitation Map of Elmore County, Idaho Produced by the NRCS NCGC
“Cut-out” of State Map
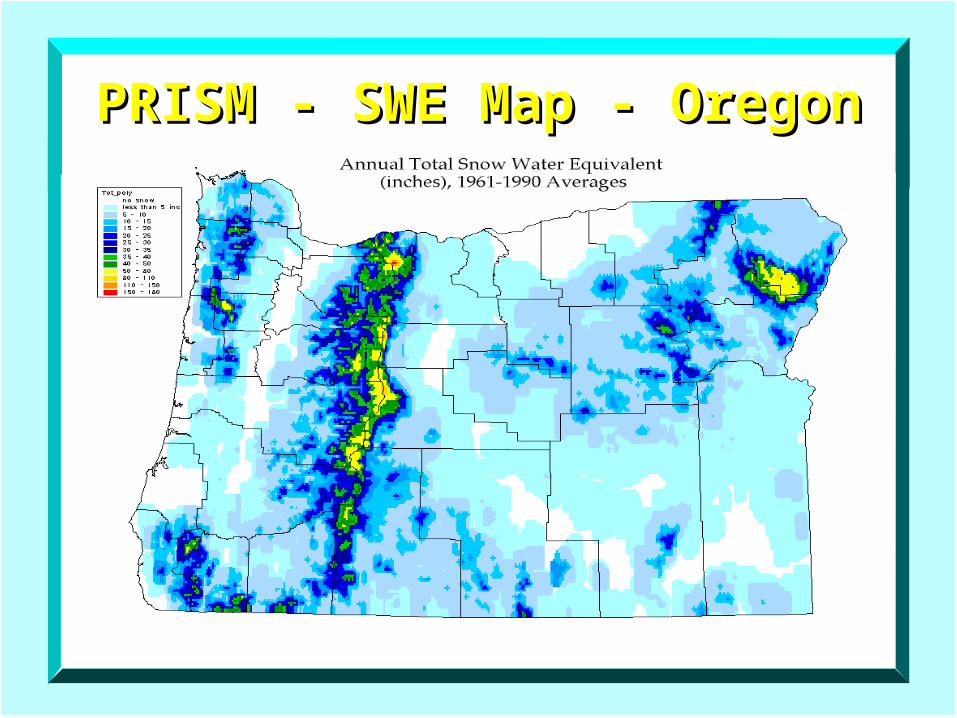
PRISM - SWE Map - OregonPRISM - SWE Map - Oregon
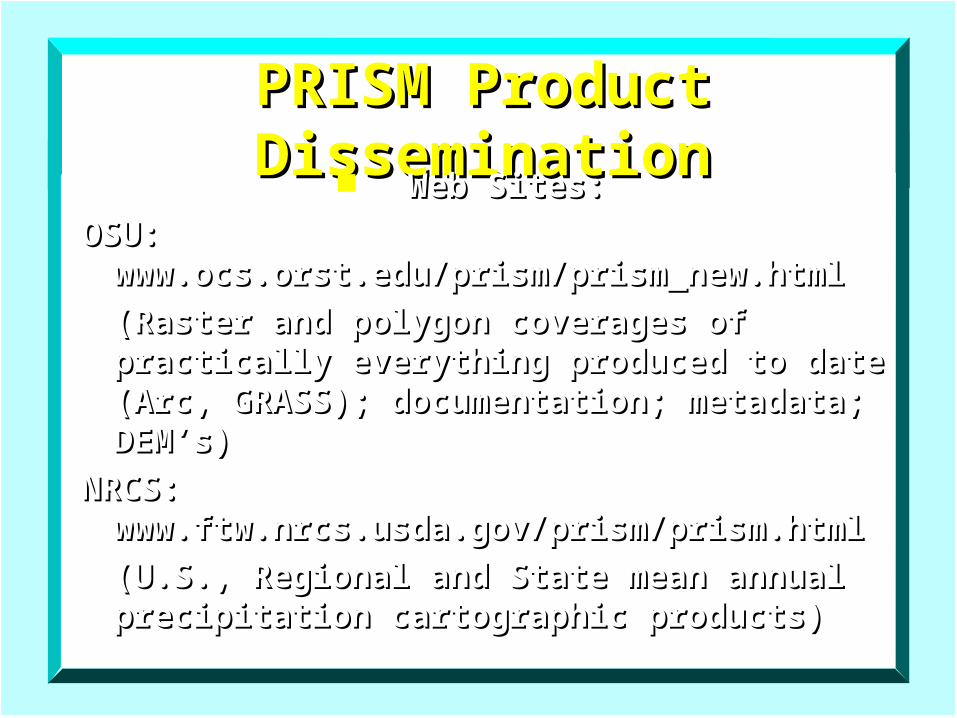
PRISM Product PRISM Product DisseminationDissemination Web Sites:Web Sites:
OSU: OSU: www.ocs.orst.edu/prism/prism_new.htmlwww.ocs.orst.edu/prism/prism_new.html
(Raster and polygon coverages of (Raster and polygon coverages of practically everything produced to date practically everything produced to date (Arc, GRASS); documentation; metadata; (Arc, GRASS); documentation; metadata; DEM’s)DEM’s)
NRCS: NRCS: www.ftw.nrcs.usda.gov/prism/prism.htmlwww.ftw.nrcs.usda.gov/prism/prism.html
(U.S., Regional and State mean annual (U.S., Regional and State mean annual precipitation cartographic products)precipitation cartographic products)
http://www.ftw.nrcs.usda.gov/prism/prism.html:http://www.ftw.nrcs.usda.gov/prism/prism.html:
Cartographic state mean annual precipitation mapsCartographic state mean annual precipitation maps Full repository of “official” NRCS PRISM layersFull repository of “official” NRCS PRISM layers
PRISM Product PRISM Product DisseminationDissemination
Compact Discs:Compact Discs:
All precipitation layers for all of the All precipitation layers for all of the U.S. 3 CD’s (East, Central, U.S. 3 CD’s (East, Central, West) of the lower 48 states. West) of the lower 48 states. Includes Arc Explorer viewing Includes Arc Explorer viewing software, and all documentation.software, and all documentation.
Available from the NRCS-NCGC:Available from the NRCS-NCGC:
800-672-5559800-672-5559
PRISM Product PRISM Product DisseminationDissemination
Hardcopy maps:Hardcopy maps:
Cartographic-quality, walls-size maps Cartographic-quality, walls-size maps of mean annual precipitation for of mean annual precipitation for each stateeach state
Available from the NRCS Climate Available from the NRCS Climate Data Liaison in each stateData Liaison in each state
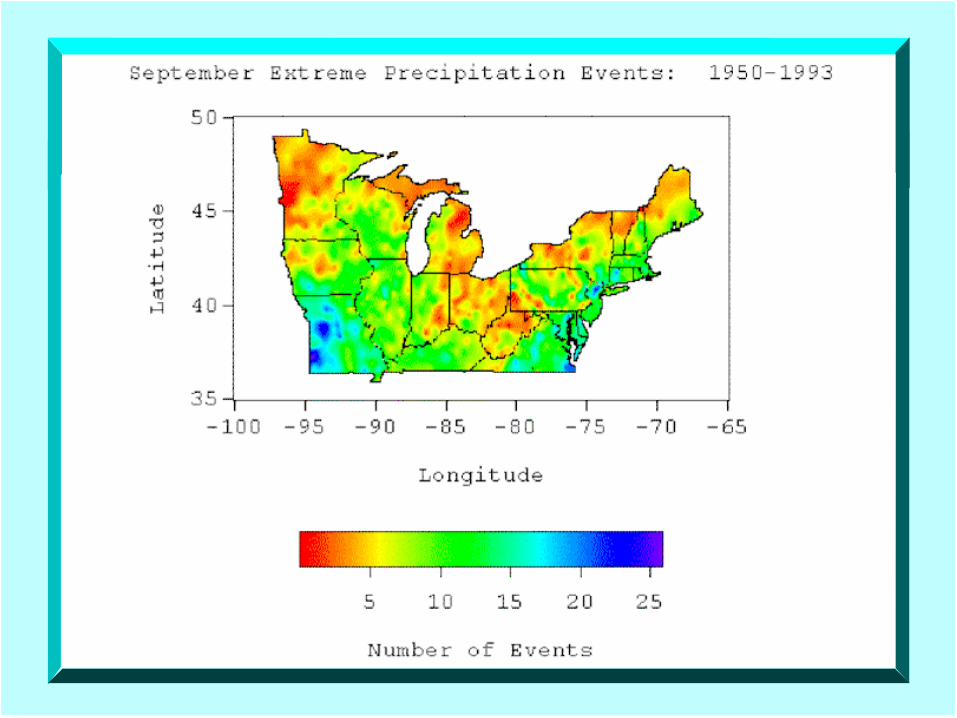
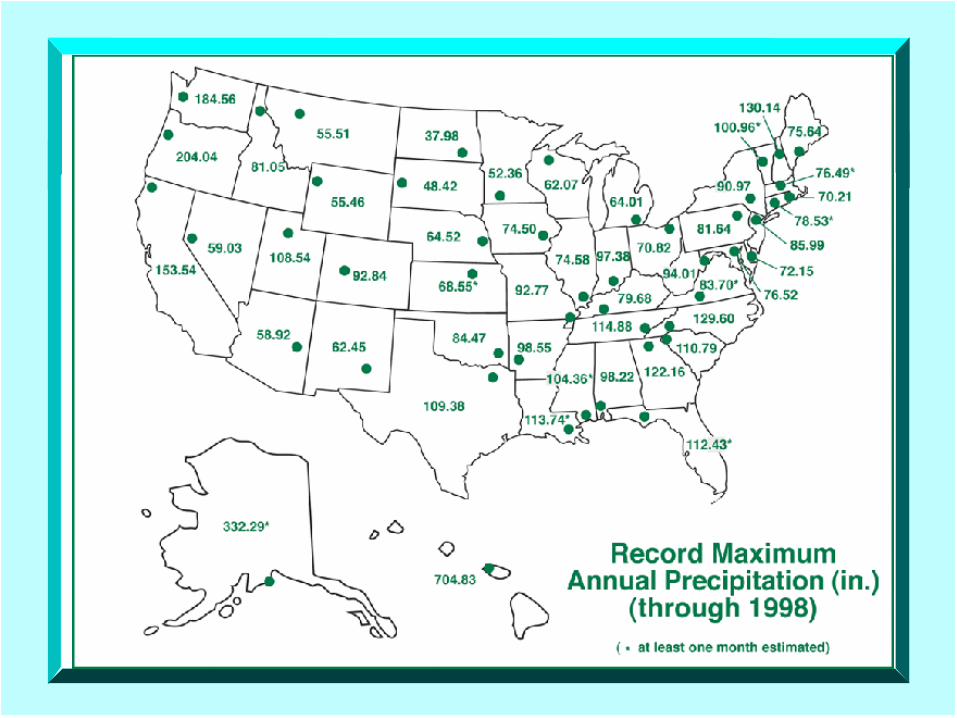
Extreme Precipitation Extreme Precipitation ClimatologyClimatology
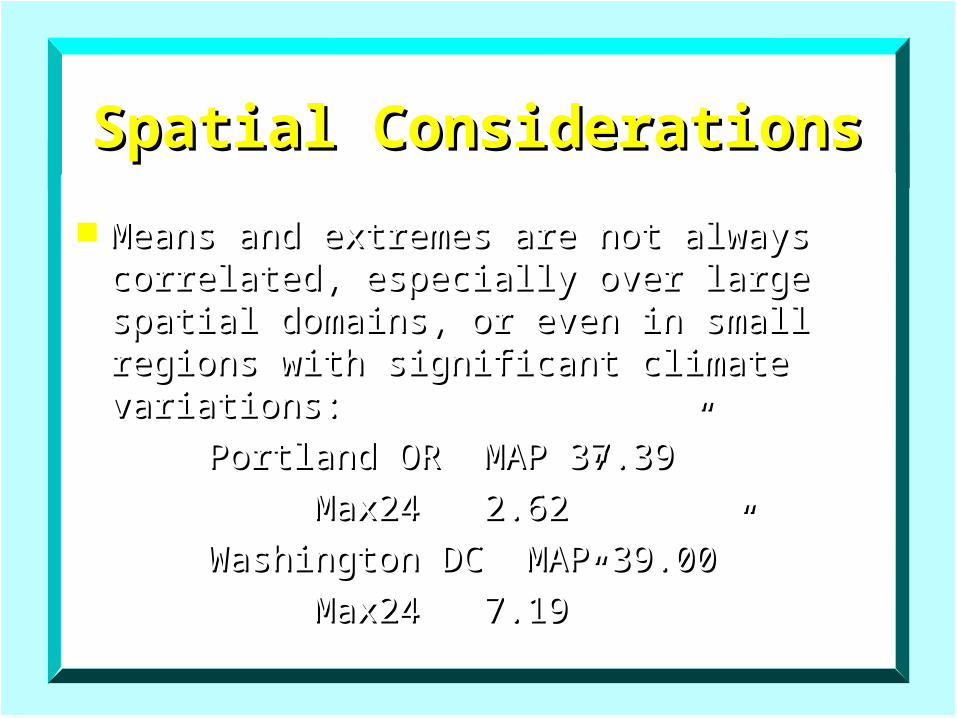
Spatial ConsiderationsSpatial Considerations
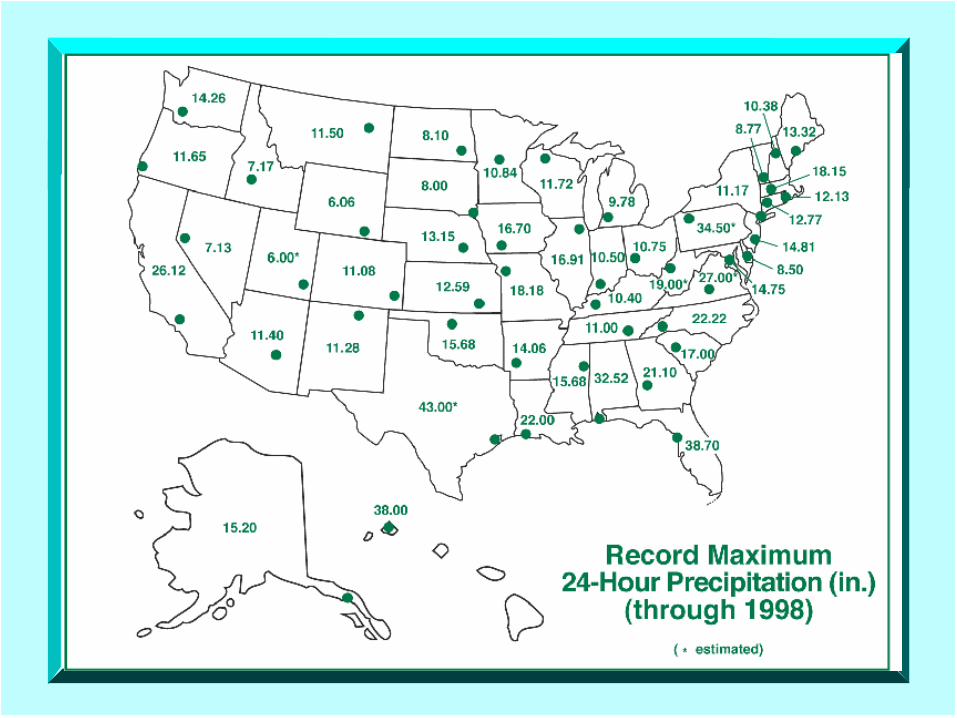
Means and extremes are not always Means and extremes are not always correlated, especially over large spatial correlated, especially over large spatial domains, or even in small regions with domains, or even in small regions with significant climate variations:significant climate variations:
Portland OR MAP 37.39” Portland OR MAP 37.39”
Max24 2.62”Max24 2.62”
Washington DC MAP 39.00” Washington DC MAP 39.00”
Max24 7.19”Max24 7.19”
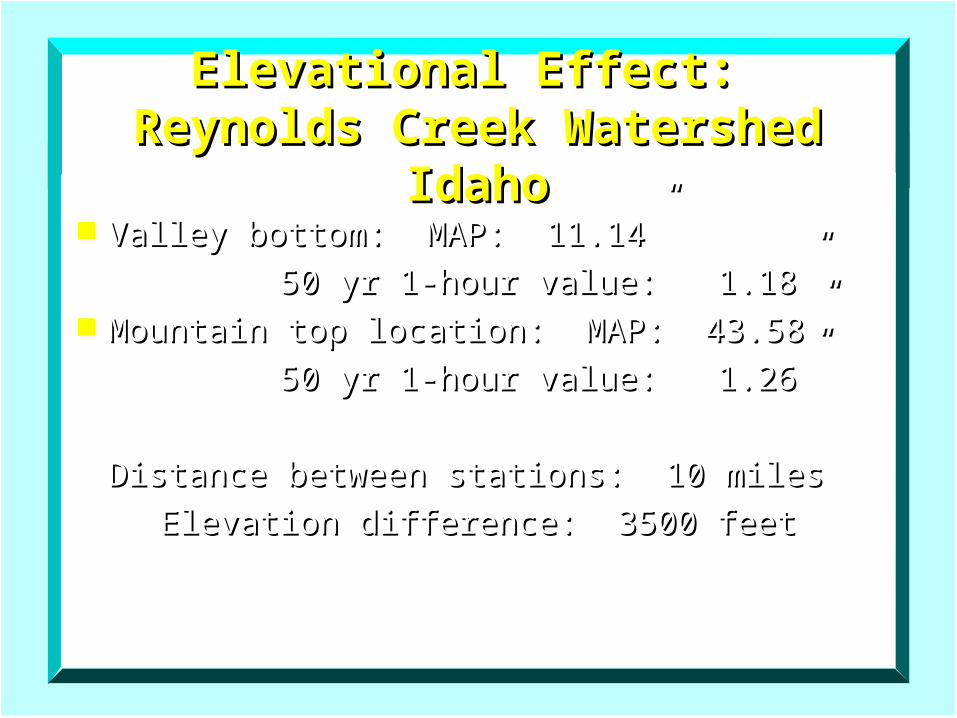
Elevational Effect: Reynolds Creek Elevational Effect: Reynolds Creek Watershed IdahoWatershed Idaho
Valley bottom: MAP: 11.14”Valley bottom: MAP: 11.14”
50 yr 1-hour value: 1.18”50 yr 1-hour value: 1.18” Mountain top location: MAP: 43.58”Mountain top location: MAP: 43.58”
50 yr 1-hour value: 1.26”50 yr 1-hour value: 1.26”
Distance between stations: 10 milesDistance between stations: 10 miles
Elevation difference: 3500 feetElevation difference: 3500 feet
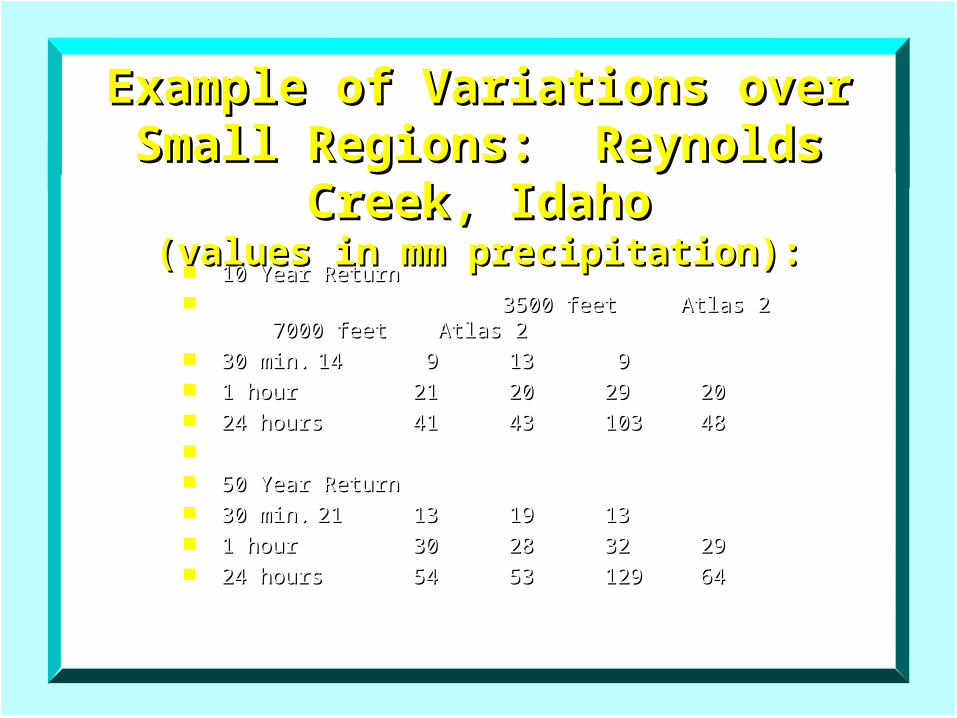
Example of Variations over Small Example of Variations over Small Regions: Reynolds Creek, IdahoRegions: Reynolds Creek, Idaho
(values in mm precipitation):(values in mm precipitation): 10 Year Return10 Year Return 3500 feet Atlas 2 7000 feet Atlas 23500 feet Atlas 2 7000 feet Atlas 2 30 min.30 min. 1414 9 9 1313 9 9 1 hour1 hour 2121 2020 2929 2020 24 hours24 hours 4141 4343 103103 4848
50 Year Return50 Year Return 30 min.30 min. 2121 1313 1919 1313 1 hour1 hour 3030 2828 3232 2929 24 hours24 hours 5454 5353 129129 6464
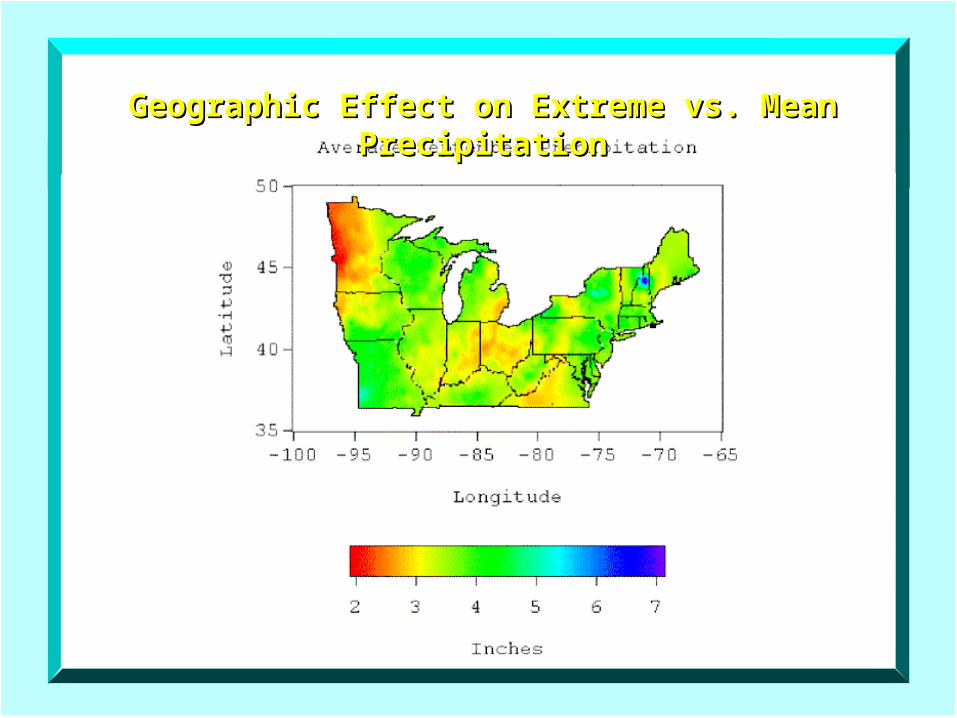
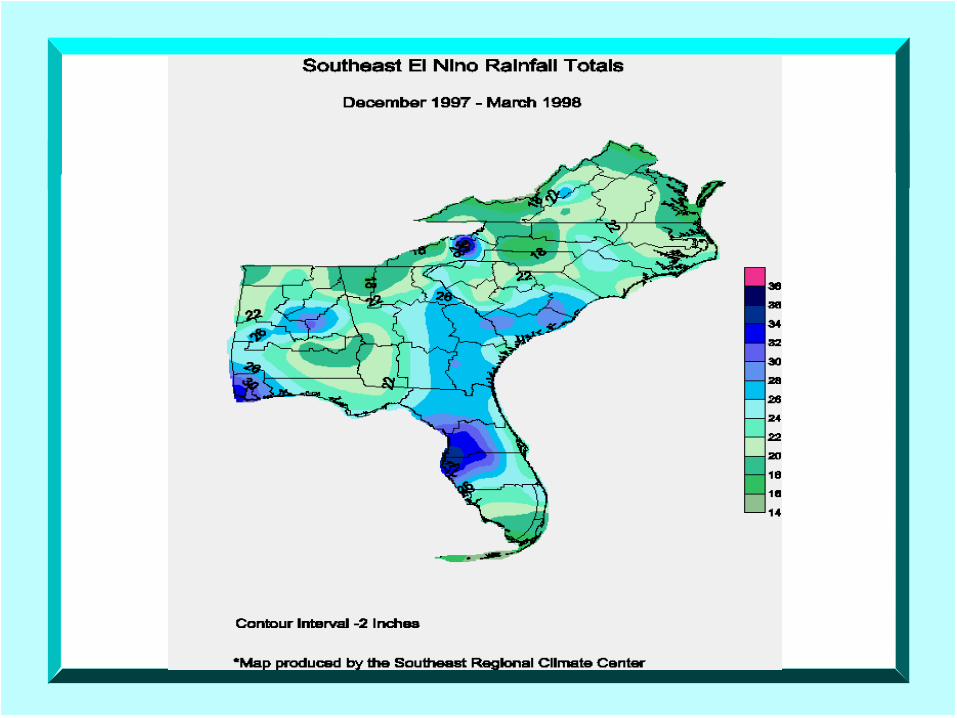
Geographic Effect on Extreme vs. Mean Geographic Effect on Extreme vs. Mean PrecipitationPrecipitation
Precipitation Frequency Precipitation Frequency DefinitionDefinition
100 - Year Event: “An event which 100 - Year Event: “An event which has a 1 percent chance of has a 1 percent chance of occurrence IN ANY YEAR; NOT ONE occurrence IN ANY YEAR; NOT ONE event every 100 years.” event every 100 years.”
Hydrometeorological Design Hydrometeorological Design Studies Center (HDSC) of the Studies Center (HDSC) of the
NWS:NWS:
http://www.nws.noaa.gov/oh/hdsc/index.http://www.nws.noaa.gov/oh/hdsc/index.htmlhtml
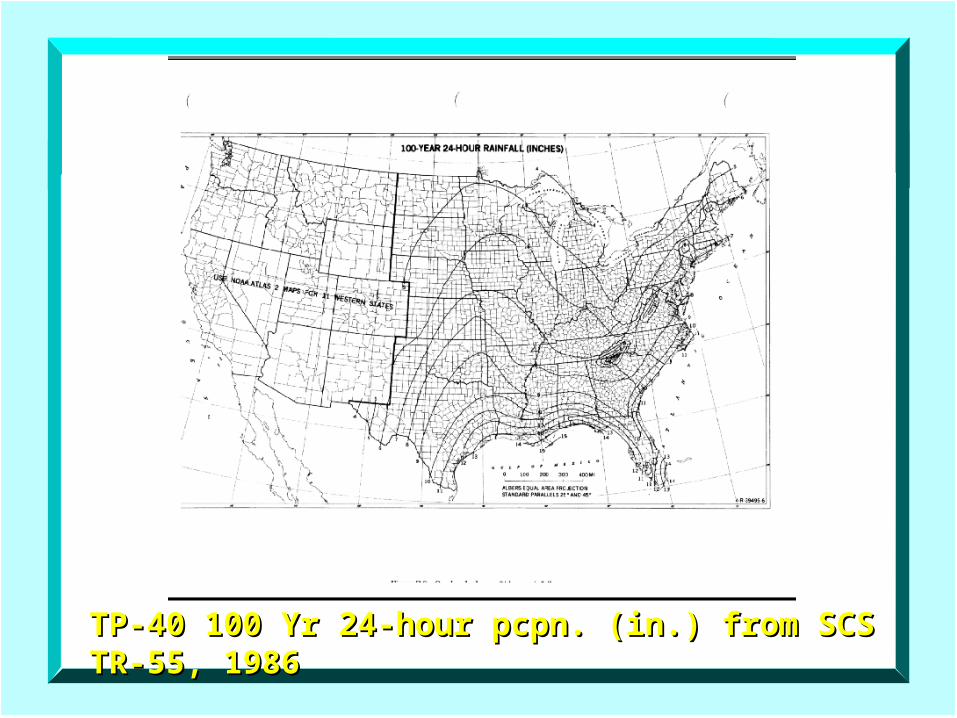
TP-40 100 Yr 24-hour pcpn. (in.) from SCS TP-40 100 Yr 24-hour pcpn. (in.) from SCS TR-55, 1986TR-55, 1986
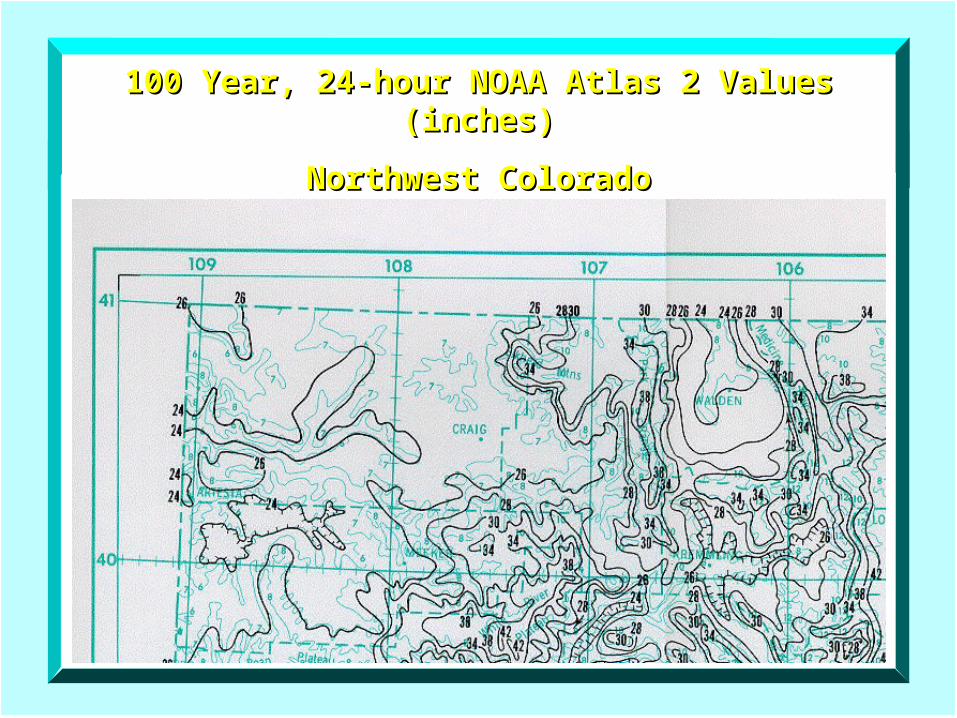
100 Year, 24-hour NOAA Atlas 2 Values (inches)100 Year, 24-hour NOAA Atlas 2 Values (inches)
Northwest ColoradoNorthwest Colorado
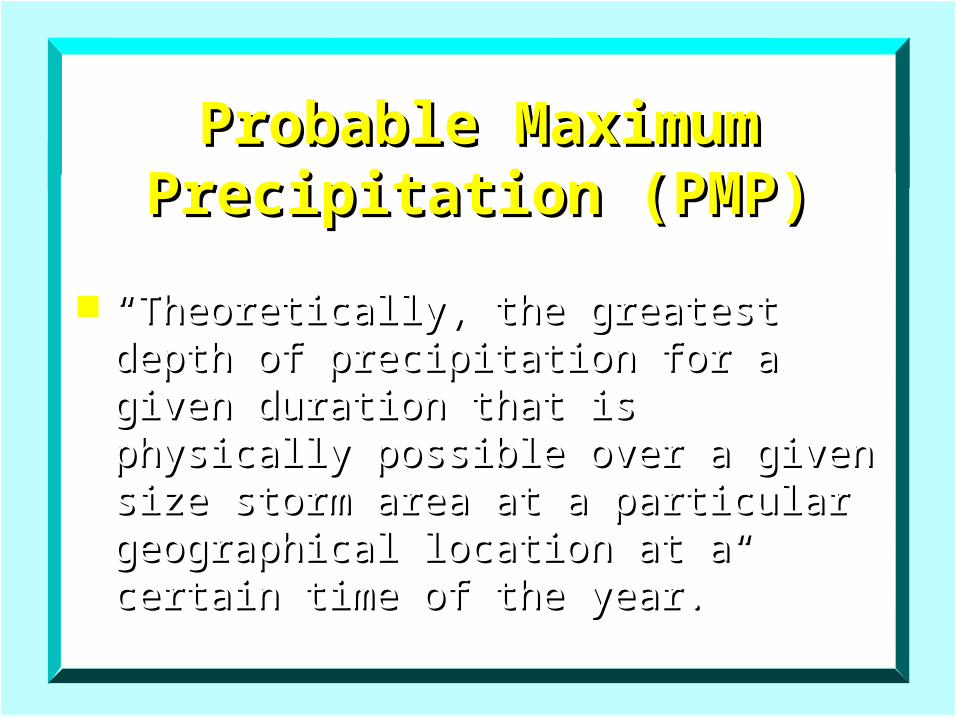
Probable Maximum Probable Maximum Precipitation (PMP)Precipitation (PMP)
““Theoretically, the greatest depth Theoretically, the greatest depth of precipitation for a given of precipitation for a given duration that is physically possible duration that is physically possible over a given size storm area at a over a given size storm area at a particular geographical location at particular geographical location at a certain time of the year.”a certain time of the year.”
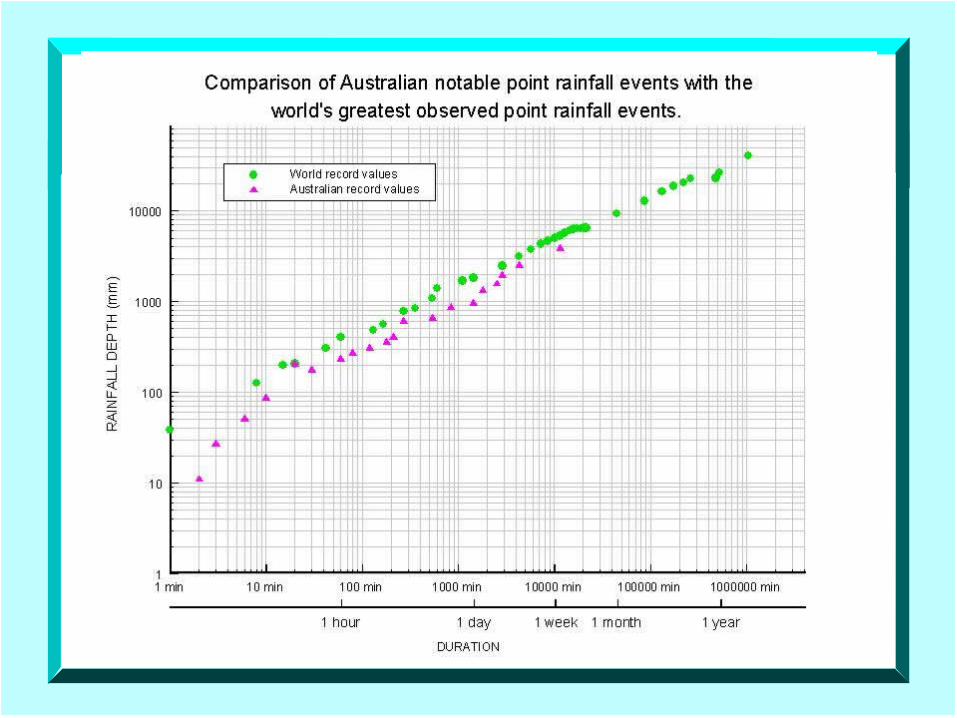
Storm CharacteristicsStorm Characteristics
0.0
0.1
0.2
0.3
0.4
0.5
0.6
0.7
0.8
0.9
1.0
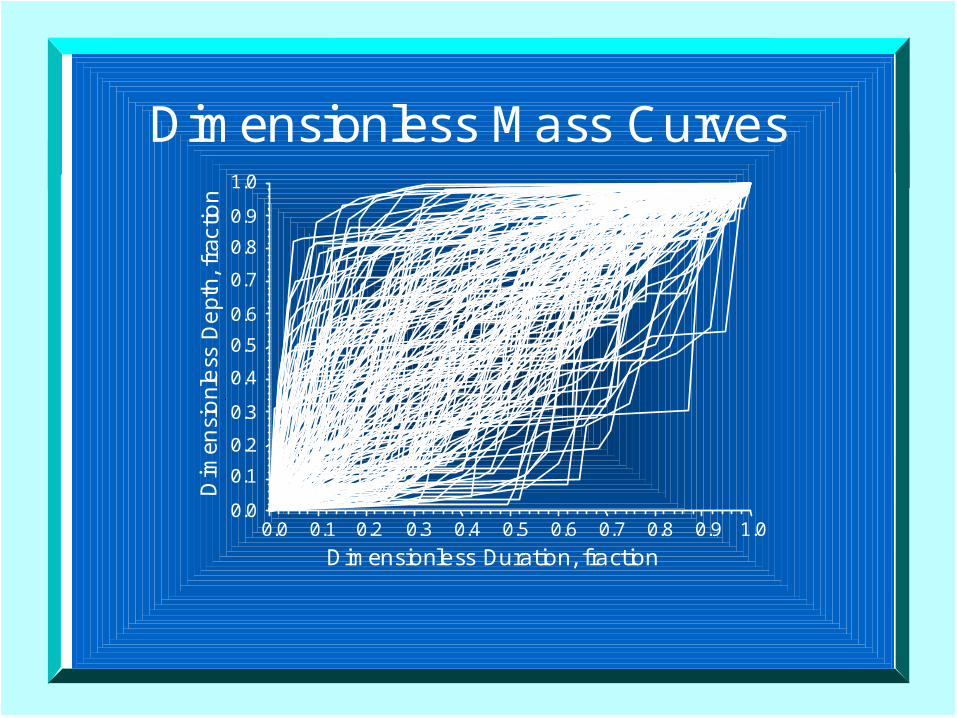
Dimensionless Duration, fraction
Dimensionless Depth, fraction
0.0 0.1 0.2 0.3 0.4 0.5 0.6 0.7 0.8 0.9 1.0
Dim
ensi
onl
ess
De
p th,
f rac
tion
Dimensionless Mass Curves
0.0
0.1
0.2
0.3
0.4
0.5
0.6
0.7
0.8
0.9
1.0
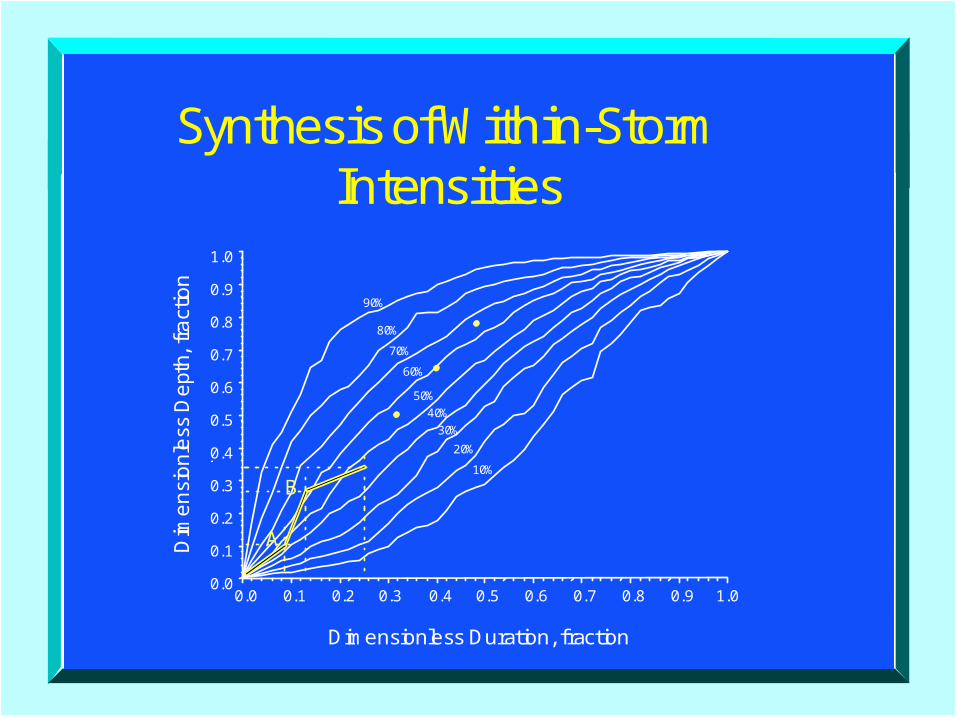
Dimensionless Duration, fraction
Dimensionless Depth, fraction
0.0 0.1 0.2 0.3 0.4 0.5 0.6 0.7 0.8 0.9 1.0
10%
20%
30%
40%
50%
60%
70%
80%
90%
Dim
en
sio
nle
ss D
ept
h, fr
act
ion
A
B
Synthesis of Within-StormIntensities