climbing the rungs of the quality ladder: fdi and domestic
TRANSCRIPT
Climbing the Rungs of the Quality Ladder:
FDI and Domestic Exporters in Romania∗
Short title: Climbing the Rungs of the Quality Ladder
Matej Bajgar† and Beata Javorcik‡§
May 25, 2019
Abstract
This paper argues that inflows of foreign direct investment can facilitate export upgrading
in host countries. Using customs data merged with firm-level information for 2005-2011, it
shows a positive relationship between the quality of products exported by Romanian firms and
the presence of multinational enterprises (MNEs) in the upstream (input-supplying) industries.
Export quality is also positively related to MNE presence in the downstream (input-sourcing)
industries and the same industry, but these relationships are less robust. These conclusions hold
both when the product quality is proxied with unit values and when it is estimated following
the approach of Khandelwal et al. (2013).
Keywords: FDI, MNEs, spillovers, exports, quality, linkages, Romania
JEL: F14, F21, F23
∗Corresponding author: Beata Javorcik, Department of Economics, University of Oxford, Manor Road Building,Manor Road, Oxford OX1 3UQ, United Kingdom. Email: [email protected].†OECD; CERGE-EI.‡University of Oxford; CEPR§The authors would like to thank Juan Carluccio, Maria Garcia De La Vega, Rocco Macchiavello, Kalina Manova,
Ferdinand Rauch, Morten Ravn, Adrian Wood, an anonymous referee as well as seminar participants at Oxford, Stan-ford, CESifo-Delphi Conference, DEV PhD Conference, GEP Post-graduate Conference and International Workshopon Firms and Globalisation in Aix-en-Provence for very useful comments and suggestions. Matej Bajgar benefitedfrom a grant from the Czech Science Foundation (grant no. P402/15-24642S). This research was started when MatejBajgar was a doctoral student at the University of Oxford. The opinions expressed and arguments employed hereinare solely those of the authors and do not necessarily reflect the official views of the OECD or its member countries.
1
Economic growth is positively correlated with the sophistication and the quality of the export
structure at the country level (Hausmann et al., 2007; Hidalgo and Hausmann, 2009). From an
individual firm’s perspective, reaching a certain quality threshold is a precondition for successful
exporting (Brooks, 2006; Verhoogen, 2008; Hallak and Sivadasan, 2013; Sutton, 2012; Iacovone and
Javorcik, 2012), which, in turn, may open doors to learning from exporting (De Loecker, 2007;
Van Biesebroeck, 2005; Atkin et al., 2017). Given the positive link between export quality and
economic prosperity, it is not surprising that upgrading of the industrial structure in general, and
of the export structure in particular, is a major objective of industrial policies in countries around
the world. This is particularly true in countries trying to escape the “middle income trap”.1
This paper argues that export upgrading can be facilitated by inflows of foreign direct invest-
ment (FDI). More specifically, we document a positive relationship between the quality of products
exported by local firms and the presence of multinational enterprises (MNEs) in the upstream
(input-supplying) industries. A similar, though less robust, relationship is found for FDI in down-
stream (input-sourcing) industries and the same industry.2 The export quality is captured using
unit values and the approach of Khandelwal et al. (2013), and our evidence comes from Romania,
a middle-income country in Eastern Europe.
MNEs play a central role in the global value chains. Their know-how, technology and marketing
prowess represent a powerful source of knowledge for indigenous firms in countries where MNEs
establish their affiliates. MNE presence can facilitate performance improvements in indigenous
firms through a number of channels. First, the presence of foreign firms in the upstream industries
may provide indigenous producers with more diverse and higher quality intermediates and capital
goods and in this way allow them to increase their productivity, upgrade the quality of their
products and broaden their product range. For instance, Javorcik et al. (2008) report that small
Mexican producers meet with their input suppliers (usually foreign affiliates) every six months to
learn about the possibilities of upgrading their products. Suppliers provide the necessary inputs
1For instance, the South African National Industrial Policy Framework states: “Given the ‘competitivenesssqueeze’ that South African industry finds itself in, industrial upgrading is a logical progression in order to avoid cut-throat price competition as certain parts of manufacturing are becoming increasingly commoditised, particularly dueto a combination of global trade liberalisation and pressure from Chinese and Indian firms in particular” (Republicof South Africa, 2007). The Comprehensive National Industrial Strategy of the Philippines mentions: “Upgradingand transforming industries would enable the movement of workers from the informal to the formal sector, as wellas from low-value added activities to high-value added activities where wages and compensation are much higher”(Republic of the Philippines, 2016).
2However, in most specifications, we cannot reject the equality of the upstream and downstream effects.
2
and often prepare a new formula for the product based on these inputs.3
Second, in their quest for cheaper and higher quality inputs, MNEs in the downstream in-
dustries may provide their local suppliers with expertise, training and incentives for quality im-
provements, and possibly even cooperate on development of new and higher quality products. Many
MNEs subject their potential suppliers to technical audits and require improvements in performance
or product quality as a pre-condition for receiving a contract. The resulting product upgrading and
improved performance may then be reflected not only in the domestic firms’ sales to the MNEs but
also in the local firms’ exports.4
Finally, domestic firms may learn from MNEs operating in the same industry. Either by ob-
serving the foreign firms or through hiring former MNE employees, they may learn about procedures
that improve the quality and standardization of their products, their marketing skills and reliabil-
ity of their shipments.5 Domestic firms may also learn about the profitability of various export
opportunities by observing their foreign peers’ exports, and this knowledge may persuade them
to make investments into quality upgrading, developing new products or even moving to different
broad product categories.6
Our analysis focuses on Romania — a manufacturing-intensive economy in Eastern Europe —
at the time of massive inflows of FDI linked to its accession to the European Union. We draw on an
annual panel of Romanian firms matched with detailed customs data recording Romanian exports
at the level of the firm, 8-digit HS (Harmonized System) product classification, destination country
3Amiti and Konings (2007), Bas and Strauss-Kahn (2015) and Goldberg et al. (2010) provide evidence on theimportance of access to imports of diverse and high-quality inputs for productivity, export quality and product scope,respectively.
4There is substantial anecdotal evidence suggesting that these effects take place. A survey among Czech manufac-turing firms analysed by Javorcik (2008) shows that 40% of domestic suppliers receive some kind of assistance fromtheir MNE customers, including personnel training (19%), provision of inputs (10%), help with quality assurance(10%) and help with finding export opportunities (7%). Even more remarkably, 50% of domestic firms selling toMNEs report they have had to improve product quality in order to become suppliers. Furthermore, Javorcik et al.(2017) show that presence of MNEs stimulates domestic firms in the supplying sectors to introduce more complexproducts where complexity is measured using an indicator due to Hidalgo and Hausmann (2009).
5However, this may be the weakest of the three channels discussed, given the mixed evidence on the link betweenFDI inflows and productivity of domestic firms in the same industry: Haskel et al. (2007) and Keller and Yeaple(2009) find positive effects, but Aitken and Harrison (1999), Javorcik (2004), Javorcik and Spatareanu (2008, 2011)fail to do so. A new generation of studies uses matched employer-employee data to provide evidence consistent withknowledge spillovers through labour mobility (see Poole (2013) and Balsvik (2011)).
6Aitken et al. (1997) demonstrate that the presence of exporting MNEs in the same region reduces the costs ofexporting for Mexican firms. Using detailed Chinese trade statistics, Chen and Swenson (2007) find that the MNEpresence is associated with more and higher unit value trade transactions by Chinese firms in the same sector, whileSwenson (2008) shows that it stimulate new export connections by Chinese exporters. Using cross-country data,Harding and Javorcik (2012) find that sectors targeted by national investment promotion efforts tend to subsequentlyincrease the unit values of exports.
3
and year. We focus on the period 2005-2011, which is determined by the data availability.
We measure ‘product upgrading’ — within-product improvements in export quality — in two
ways: (i) we apply the approach of Khandelwal et al. (2013) which builds on the work of Khandelwal
(2010); and (ii) we focus on unit values of exports.7
Our empirical strategy follows the literature on FDI spillovers (Javorcik, 2004) and relies on
the assumption that domestic firms are more likely to buy inputs from MNEs if MNEs account
for a larger share of the domestically sold output in the upstream industries, i.e., the industries
from which the domestic firms source inputs. Similarly, we assume that domestic firms are more
likely to supply MNEs when foreign firms account for a larger share of output in their downstream
industries, i.e., the industries to which they sell inputs, according to the Romanian input-output
tables. Finally, we expect the effect of foreign presence on domestic firms in the same sector to
increase with the MNE share in the sectoral output.
In our analysis, we relate the quality of product p exported by firm i located in Romanian
region r to country c at time t to the lagged proxies for FDI spillovers relevant to firm i. We control
for time-invariant unobservables specific to a particular firm exporting a particular product to a
particular destination. We also control for region-year unobservables and for linear trends specific
to each industry and region. Thus, our results are identified based on industry-specific variation in
FDI presence observed over time that cannot be captured by broad factors specific to Romanian
regions or by trends in individual industries located in particular regions.8
Our results show a positive and statistically significant relationship between the within-product
quality upgrading in goods exported by Romanian firms and the increased presence of MNEs in
upstream (input-supplying) industries. This relationship is robust across specifications in levels and
in short and long differences. We find similar relationships for FDI in downstream (input-sourcing)
manufacturing industries and in the same industry, although these are somewhat less robust. Our
results hold for both measures of quality and when foreign affiliates are defined based on different
ownership thresholds. Moreover, they do not seem to be driven by reverse causality or by third
factors, such as, international demand for particular products, demand from downstream sectors
7Despite their shortcomings, export unit values have been extensively used as a proxy for quality, see, for example,Schott (2004); Hallak (2006); Bas and Strauss-Kahn (2015).
8While we are unable to pin down the exact source of this variation, it is likely to be driven by idiosyncraticlocation decisions by MNEs made against the background of broad trends such as Romania’s EU entry, the economiccrisis and the government policy in Romania and in countries with which Romania competes for FDI.
4
or exporter entry and exit. The estimated coefficients are not only statistically significant, but also
economically meaningful. The estimates in levels suggest that the average increase in the foreign
presence in the upstream industries observed over the period studied translates into a circa 4%
increase in the quality of domestic firms’ exports. A similar magnitude is found for the average
increase in MNE presence in the downstream industries.
Although our data do not allow us to directly observe links between local firms and multina-
tionals, we find that the observed effects are stronger in cases where the impact of FDI spillovers is
more likely to manifest itself. For instance, if the positive results for downstream (input-sourcing)
FDI are indeed due to Romanian exporters supplying inputs to MNEs located in Romania, we
should see the MNE presence in the downstream sectors affecting mainly Romanian exports of
intermediates or capital goods. This is indeed the case. The effect of downstream FDI is large
and statistically significant for non-final products, whereas for final products it is not significantly
different from zero. The estimates suggest that the 6.5-percentage-point increase in downstream
FDI observed during the period studied is associated with an 8.8% increase in unit values and an
8.4% increase in the alternative export quality measure pertaining to exports of intermediates and
capital goods. In contrast, FDI in input-supplying sectors (upstream FDI) matters for both final
and non-final products.
In another exercise, we conjecture that MNEs are more likely to contract suppliers who can
provide them with higher-quality inputs and, therefore, we should expect that firms that were able
to export higher quality products to begin with would tend to benefit more from the presence
of FDI in the downstream (input-sourcing) sectors. Again the estimation results support this
view. In contrast, the initial export quality does not seem to matter when it comes to Romanian
firms benefiting from the presence of FDI in the upstream (input-supplying) industries, which is
consistent with our priors. Observing the expected patterns while examining the more nuanced
predictions boosts our confidence that the link between the quality of exports and the presence of
FDI works through the anticipated channels.9
Overall, our results suggest that FDI promotion policies, particularly those aimed at attracting
foreign investors into industries that supply inputs to domestic firms, have the potential to serve
9The lack of information on actual sourcing relationships between domestic and foreign firms means that theFDI proxies ignore the substantial heterogeneity in the exposure of different firms to MNEs. This could resultin mismeasurement of the FDI presence and, consequently, an underestimation of the impact of FDI due to anattenuation bias.
5
as an engine of export upgrading.
Our results also reconcile the common finding that access to diverse and high-quality inputs
is important for firm performance (e.g., Amiti and Konings, 2007; Goldberg et al., 2010; Manova
and Zhang, 2012) with the quantitatively limited effect of upstream FDI on productivity typically
found in the FDI spillovers literature (see survey by Havranek and Irsova, 2011). They indicate
that while the effect of upstream FDI on productivity may be small, it has a sizeable effect on the
quality of exported products.
This paper is structured as follows. The next section introduces the context of the study,
giving a brief overview of trends in FDI and exports in Romania in the period considered. The
data and the empirical strategy are described in Section 2. Section 3 discusses the results. Section
4 concludes.
1 FDI and exports in Romania
Romania is an interesting country for studying the effect of FDI on manufacturing firms for at least
three reasons. First, manufacturing plays a comparatively large role in the Romanian economy. In
fact, the share of manufacturing value added in Romanian GDP in 2004 (the last year available
in the World Development Indicators) was at 30% the largest in the European Union (EU), 5
percentage points ahead of the second largest figure found in the Czech Republic.
Second, Romania entered the European Union in 2007, and its entry was accompanied by the
highest inflows of FDI in the country’s modern history. On-line appendix Table B.1 shows the
evolution of FDI inflows for ten post-communist members of the EU for years 2003-2012. Between
2004 and 2008 the average annual FDI inflows amounted to over 7% of Romanian GDP. Our data
cover most of the high-inflow period as well as the crisis years 2009 and 2010, when the FDI inflows
fell below 3% of GDP. The only two countries in the region with higher proportional FDI inflows
in the studied period are Estonia and Bulgaria, the latter being another EU entrant from 2007.
A substantial part of FDI inflows entered the manufacturing sector. This is reflected in
Columns 2 and 3 of Table 1, which summarizes the share of output due to foreign-owned firms
in 58 manufacturing industries during our sample period. In line with the aggregate data, the
average share of output due to foreign firms increased from 55% in 2005 to 63% in 2010. Seventeen
of 58 manufacturing industries in our sample saw an increase of foreign output share of more than
6
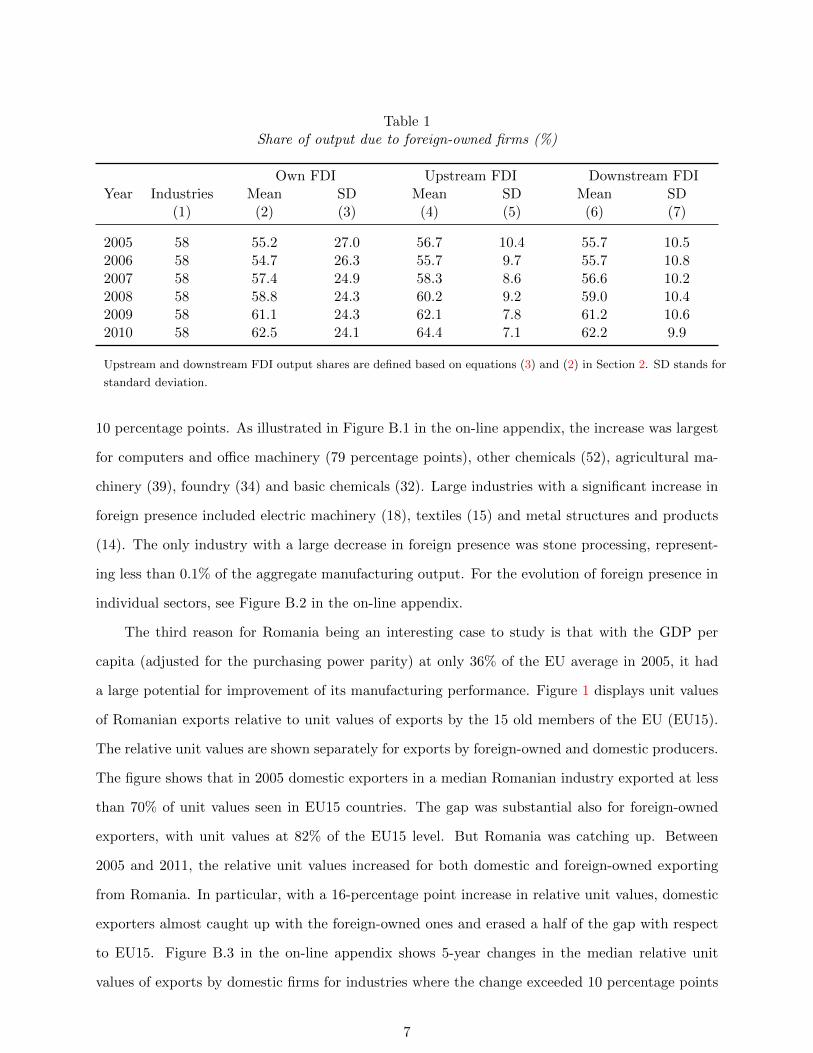
Table 1Share of output due to foreign-owned firms (%)
Own FDI Upstream FDI Downstream FDIYear Industries Mean SD Mean SD Mean SD
(1) (2) (3) (4) (5) (6) (7)
2005 58 55.2 27.0 56.7 10.4 55.7 10.52006 58 54.7 26.3 55.7 9.7 55.7 10.82007 58 57.4 24.9 58.3 8.6 56.6 10.22008 58 58.8 24.3 60.2 9.2 59.0 10.42009 58 61.1 24.3 62.1 7.8 61.2 10.62010 58 62.5 24.1 64.4 7.1 62.2 9.9
Upstream and downstream FDI output shares are defined based on equations (3) and (2) in Section 2. SD stands for
standard deviation.
10 percentage points. As illustrated in Figure B.1 in the on-line appendix, the increase was largest
for computers and office machinery (79 percentage points), other chemicals (52), agricultural ma-
chinery (39), foundry (34) and basic chemicals (32). Large industries with a significant increase in
foreign presence included electric machinery (18), textiles (15) and metal structures and products
(14). The only industry with a large decrease in foreign presence was stone processing, represent-
ing less than 0.1% of the aggregate manufacturing output. For the evolution of foreign presence in
individual sectors, see Figure B.2 in the on-line appendix.
The third reason for Romania being an interesting case to study is that with the GDP per
capita (adjusted for the purchasing power parity) at only 36% of the EU average in 2005, it had
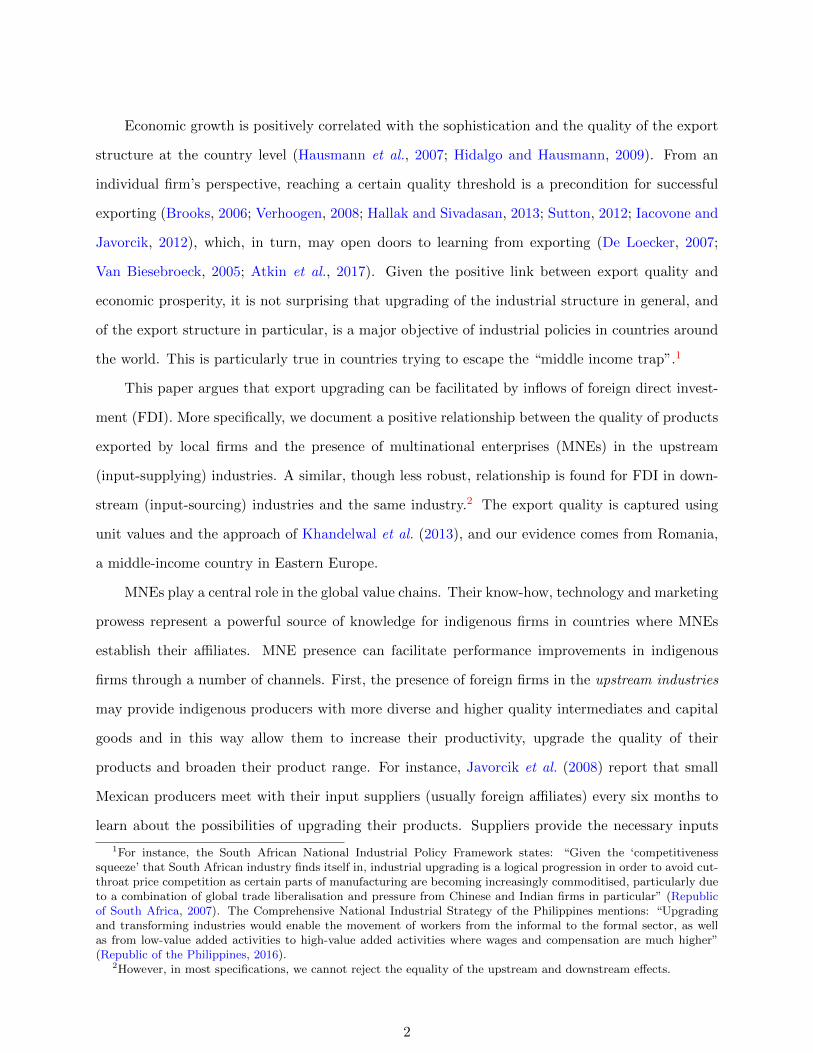
a large potential for improvement of its manufacturing performance. Figure 1 displays unit values
of Romanian exports relative to unit values of exports by the 15 old members of the EU (EU15).
The relative unit values are shown separately for exports by foreign-owned and domestic producers.
The figure shows that in 2005 domestic exporters in a median Romanian industry exported at less
than 70% of unit values seen in EU15 countries. The gap was substantial also for foreign-owned
exporters, with unit values at 82% of the EU15 level. But Romania was catching up. Between
2005 and 2011, the relative unit values increased for both domestic and foreign-owned exporting
from Romania. In particular, with a 16-percentage point increase in relative unit values, domestic
exporters almost caught up with the foreign-owned ones and erased a half of the gap with respect
to EU15. Figure B.3 in the on-line appendix shows 5-year changes in the median relative unit
values of exports by domestic firms for industries where the change exceeded 10 percentage points
7
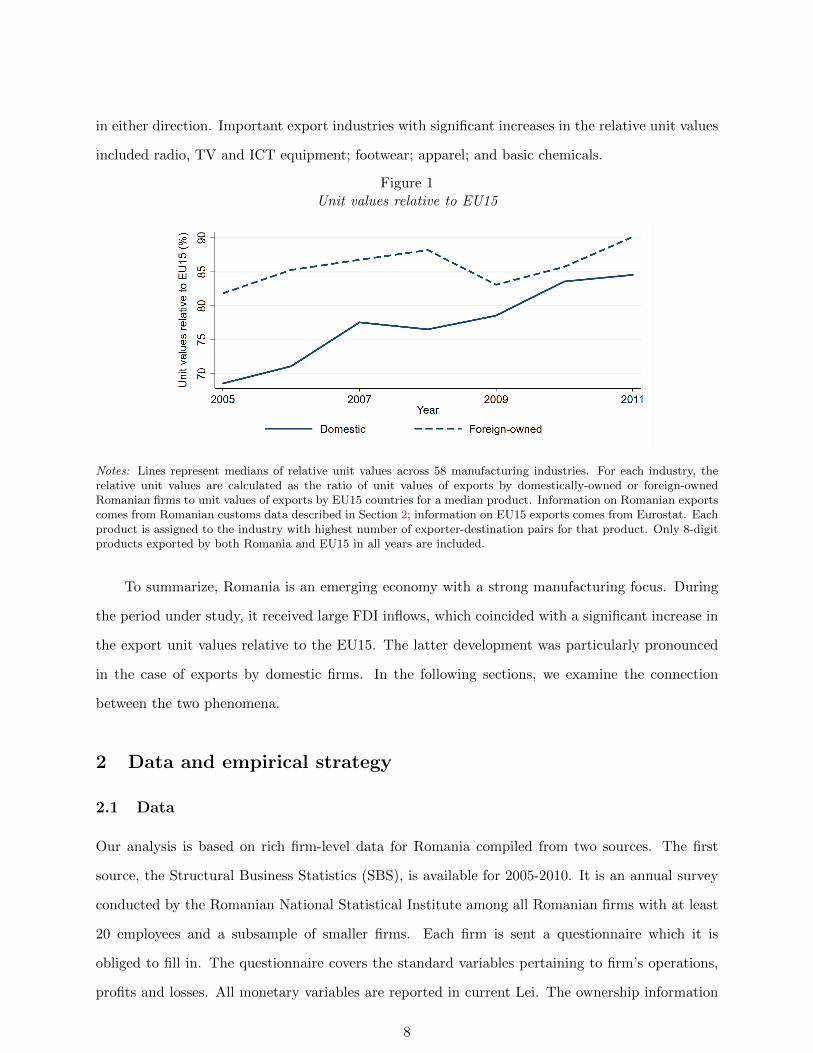
in either direction. Important export industries with significant increases in the relative unit values
included radio, TV and ICT equipment; footwear; apparel; and basic chemicals.
Figure 1Unit values relative to EU15
Notes: Lines represent medians of relative unit values across 58 manufacturing industries. For each industry, therelative unit values are calculated as the ratio of unit values of exports by domestically-owned or foreign-ownedRomanian firms to unit values of exports by EU15 countries for a median product. Information on Romanian exportscomes from Romanian customs data described in Section 2; information on EU15 exports comes from Eurostat. Eachproduct is assigned to the industry with highest number of exporter-destination pairs for that product. Only 8-digitproducts exported by both Romania and EU15 in all years are included.
To summarize, Romania is an emerging economy with a strong manufacturing focus. During
the period under study, it received large FDI inflows, which coincided with a significant increase in
the export unit values relative to the EU15. The latter development was particularly pronounced
in the case of exports by domestic firms. In the following sections, we examine the connection
between the two phenomena.
2 Data and empirical strategy
2.1 Data
Our analysis is based on rich firm-level data for Romania compiled from two sources. The first
source, the Structural Business Statistics (SBS), is available for 2005-2010. It is an annual survey
conducted by the Romanian National Statistical Institute among all Romanian firms with at least
20 employees and a subsample of smaller firms. Each firm is sent a questionnaire which it is
obliged to fill in. The questionnaire covers the standard variables pertaining to firm’s operations,
profits and losses. All monetary variables are reported in current Lei. The ownership information
8
collected in the survey allows us to distinguish between purely domestic firms, wholly foreign-owned
firms, and firms with mixed ownership. We do not observe the exact ownership shares among the
mixed firms. Fortunately, national tax identifiers assigned to individual firms allow us to match
our data to the commercial database Amadeus compiled by the Bureau van Dijk. We manage to
match ownership from Amadeus to about 80% of firm-year observations in our sample.10 For the
unmatched firms we use the SBS ownership dummies. We follow the standard practice by defining
a firm as foreign if the share of foreign ownership exceeds 10%, though in the robustness check we
consider definitions based on the 25 and 50% thresholds.11
The SBS data are matched with the Romanian customs data for years 2005-2011 using the
firm tax identifiers. The customs data contain information on annual exports at the firm-product-
destination level. The data cover all exports to countries outside the EU and over 95% of exports
to EU member countries. Starting from 2007, when Romania joined the EU, intra-EU exports
are not processed at the customs but instead have to be reported to the Intrastat. Firms with
annual exports below 900,000 Lei (approx. $250,000) are exempt from the reporting obligation
and therefore do not appear in the customs data. Products are defined in terms of the 8-digit EU
Combined Nomenclature (CN8), which is based on the 6-digit Harmonized System classification
and is further disaggregated with two additional digits. Export values are recorded in current
Lei. Besides export values, there are two variables measuring the physical quantity of exports. One
measures it in kilograms and the other in supplementary units. Supplementary units may represent
pieces, litres, square metres or other units. Where both measures of physical quantity are available,
we use supplementary units.12
We construct some of our variables with the help of the Romanian input-output tables for 2002
prepared by the National Statistical Institute. They use Lei at current prices as units, and they
are defined in terms of the Romanian industrial classification where each manufacturing industry
corresponds to one or several 3-digit NACE (rev. 1.1) industries. The SBS data state the 4-digit
NACE codes, which allows us to match the firm-level data with the input-output tables. We use
words ‘industry’ and ‘sector’ as synonyms in our analysis, and we use them to refer to the 58
103% of the observations are not found in Amadeus and further 16% are in Amadeus but with no ownershipinformation.
11A vast majority of firms appearing as mixed in the SBS data have foreign ownership above the 10% threshold.Therefore, the mixed ownership cases for which it is not possible to find information in the Amadeus are treated asforeign.
12See subsection A.1 in the on-line appendix for more details on the construction of unit values.
9
manufacturing industries as defined in the Romanian industrial classification.13
To compare Romanian export unit values to those of EU15 and to control for fluctuations in
international prices of individual products, we use EU trade data from Eurostat. They include
country-level export flows for each CN8 product in each year.
2.2 Empirical strategy
Our goal is to examine the link between upgrading by Romanian firms and the presence of foreign
affiliates in the country. Therefore, next we explain how we measure the MNE presence in the
same, downstream and upstream sectors. Following the literature on FDI spillovers, we proxy
for the presence of foreign firms in an industry (Own FDI ) with their share in the total industry
output. Let Jst denote the set of all manufacturing firms operating in Romania in sector s in year
t, fjt a dummy for whether firm j is foreign-owned in year t and Yjt the total output of the firm.
Then we define own-sector FDI presence as
OwnFDIst =
∑j∈Jst fjtYjt∑j∈Jst Yjt
. (1)
In order to identify vertical spillovers from MNEs in downstream sectors, we rely on the
assumption that a domestic firm is more likely to supply MNEs and benefit from vertical spillovers
if foreign firms account for a larger share of output in the downstream industries, i.e., industries
supplied by the industry of the domestic firm. Following Javorcik (2004), we exclude sales of inputs
within the firm’s own sector as this effect is already captured by the Own FDI variable. This means
that Downstream FDI will be capturing a lower bound on the effect of FDI in the input-sourcing
industries. Define αsd as the share of intermediate inputs supplied by industry s which is sold to
downstream industry d, according to the input-output matrix. Define further S as the set of all
manufacturing sectors. Then the proxy for downstream FDI is defined as
DownstreamFDIst =∑
d∈S,s6=d
αsdOwnFDIdt. (2)
Similarly, we proxy for access to inputs produced by MNEs by assuming that a domestic firm
is more likely to buy inputs from an MNE if foreign firms account for a larger share of output in the
13See subsection A.2 in the on-line appendix for more details on how we determine the industry affiliation of eachfirm.
10
upstream industries, i.e., industries from which the industry of the domestic firm sources inputs.
Define αsu as the share of the intermediate inputs purchased by industry s from the upstream
industry u. Again, we exclude input sourcing within the same sector, so that the coefficient on
Upstream FDI should be interpreted as a lower-bound estimate. Define OwnFDI∗st in the same
way as OwnFDIst but only counting domestically sold output. Then the upstream FDI is defined
as
UpstreamFDIst =∑
u∈S,s6=u
αsuOwnFDI∗ut. (3)
The inability to observe buyer-supplier relationships between domestic firms and foreign affili-
ates has been a shortcoming of the entire literature on FDI spillovers. The few studies that are able
to observe linkages between firms are either restricted to a particular industry (Chung et al., 2003)
or cover a small number of firms (Javorcik and Spatareanu, 2009). Measuring foreign presence at
the industry level masks the fact that FDI is likely to have highly heterogeneous effects across firms.
It can be expected to boost performance of those local firms that actually start buying inputs from
the multinationals, manage to become their suppliers or are in a position to learn from them. At
the same time, firms that do not benefit from such relationships might, if anything, be worse off
due to the intensified competition for inputs and outputs, both with the multinationals and with
the domestic firms that benefit from the FDI presence. Our estimates capture average relationships
across these different types of firms; the actual effects will be stronger for some firms and weaker
for others. The failure to properly account for the differential exposure of the different domestic
firms could result in an attenuation bias and underestimation of the effects associated with FDI.
In Section 3.2, we attempt to at least partially account for the heterogeneity by exploring observed
characteristics that make domestic firms more or less likely to benefit from the FDI presence.
Our analysis relates the presence of foreign firms to product quality of domestic exporters.
We measure within-product quality improvements using two complementary approaches. The first
approach is to analyse export unit values of narrowly defined products. This is the most common
approach used in the literature (see, for example, Schott, 2004; Hallak, 2006; Bas and Strauss-
Kahn, 2015), but it is exposed to the risk that high unit values reflect high markups rather than
superior quality. Our second approach uses the methodology of Khandelwal et al. (2013) which
11
builds on the work of Khandelwal (2010).14 Khandelwal et al. (2013) identify the relationship
between quantity and price by assuming specific elasticities of substitution. We use the estimates
of Broda and Weinstein (2006) and allow the elasticity of substitution to differ across HS 2-digit
product classes.15 We can then infer quality as the OLS residual eipct from estimating
log qipct + σs log pipct = αp + αct + σsαct + eipct (4)
where qipct and pipct are the quantity and the price, respectively, of exports of product p by firm i
to destination country c in year t, σs represents elasticity of substitution in industry s, αp captures
time-invariant product characteristics, and αct represents destination-year effects to capture aggre-
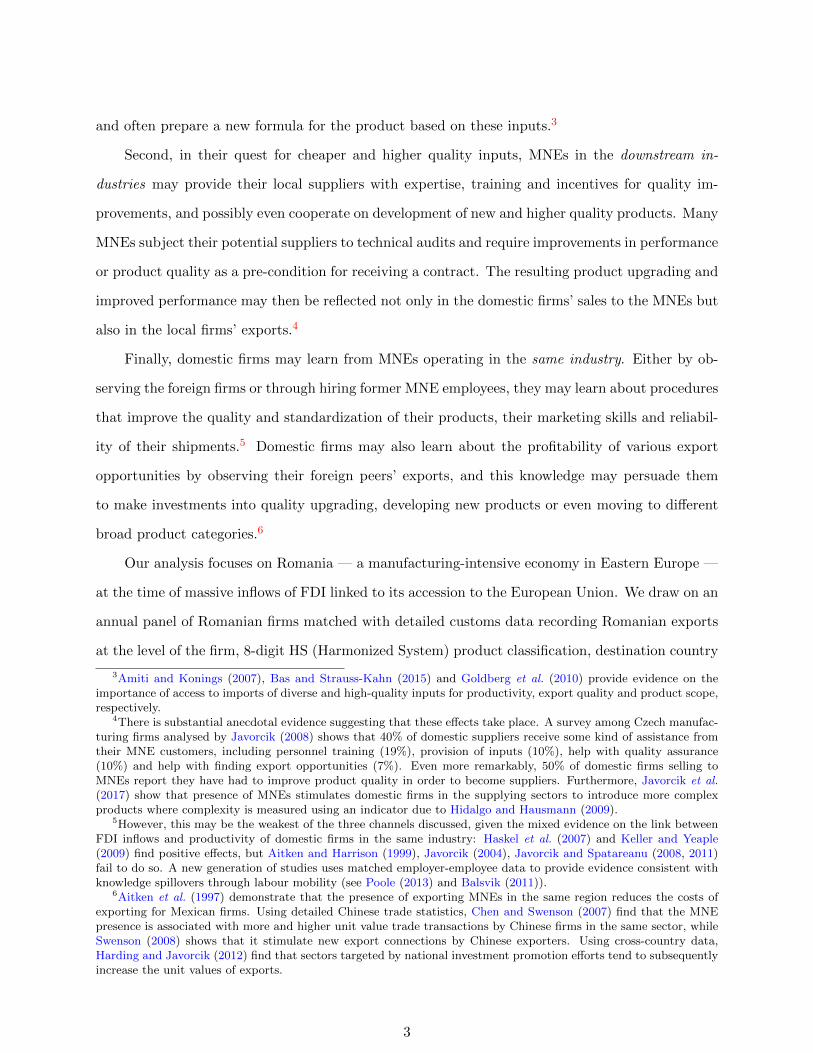
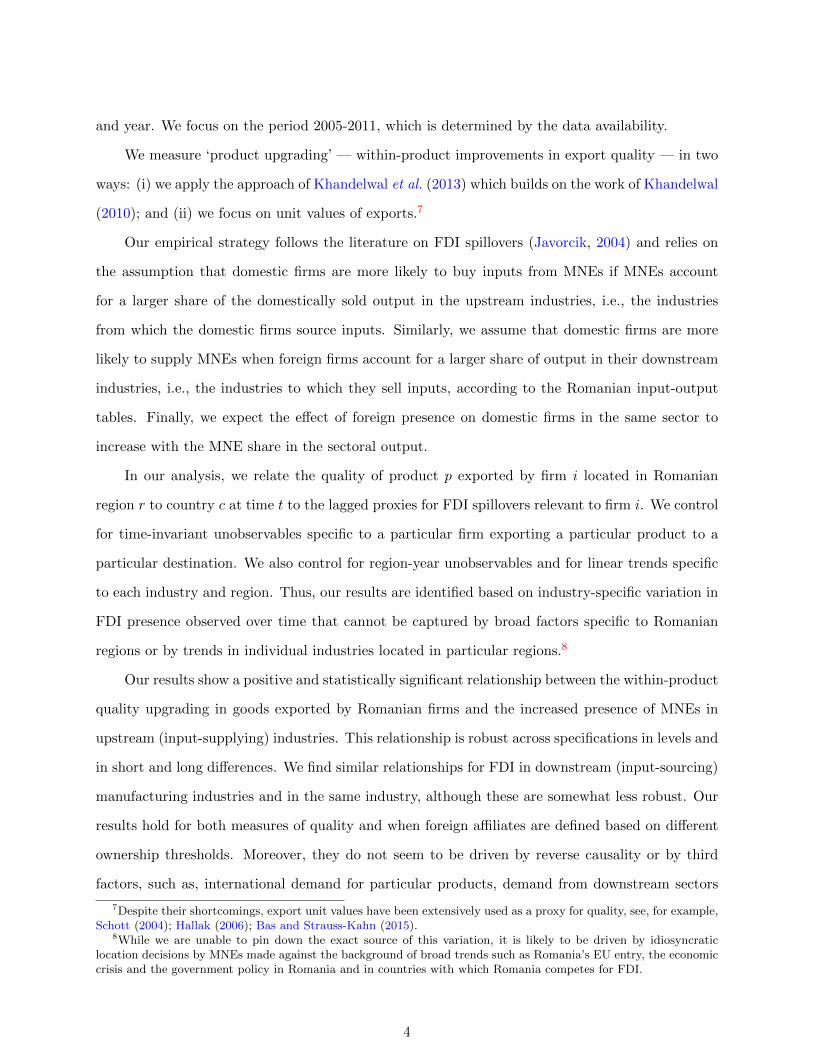
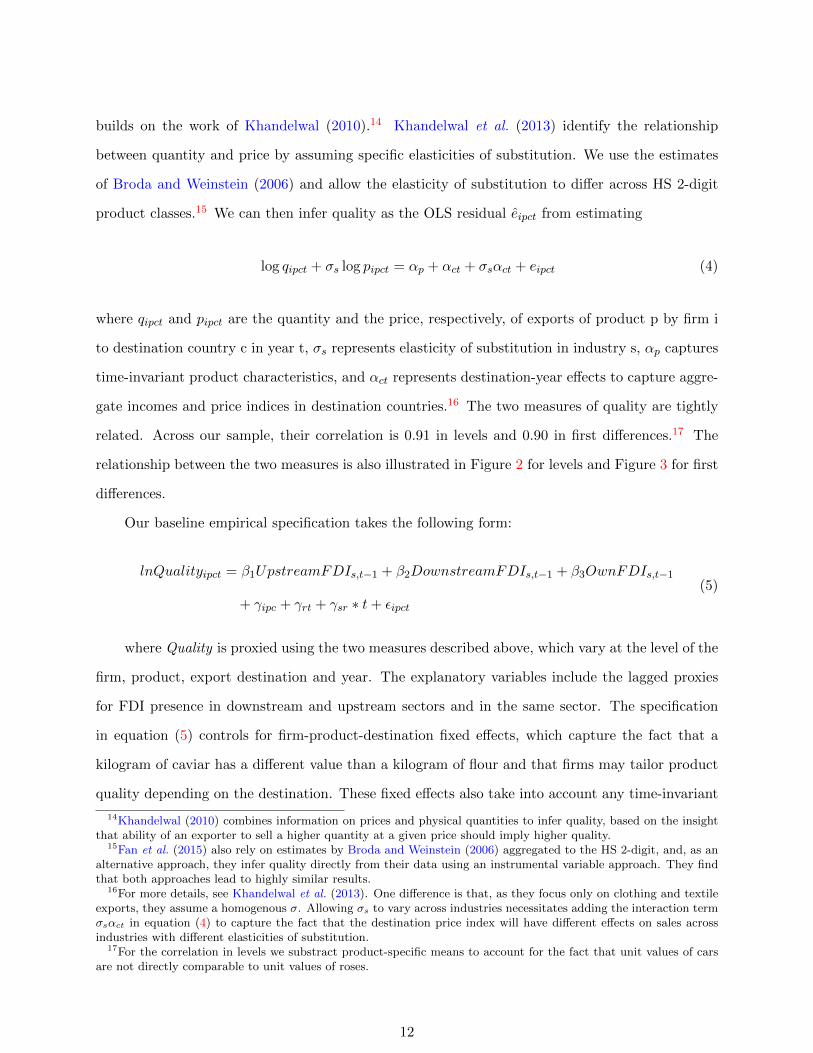
gate incomes and price indices in destination countries.16 The two measures of quality are tightly
related. Across our sample, their correlation is 0.91 in levels and 0.90 in first differences.17 The
relationship between the two measures is also illustrated in Figure 2 for levels and Figure 3 for first
differences.
Our baseline empirical specification takes the following form:
lnQualityipct = β1UpstreamFDIs,t−1 + β2DownstreamFDIs,t−1 + β3OwnFDIs,t−1
+ γipc + γrt + γsr ∗ t+ εipct
(5)
where Quality is proxied using the two measures described above, which vary at the level of the
firm, product, export destination and year. The explanatory variables include the lagged proxies
for FDI presence in downstream and upstream sectors and in the same sector. The specification
in equation (5) controls for firm-product-destination fixed effects, which capture the fact that a
kilogram of caviar has a different value than a kilogram of flour and that firms may tailor product
quality depending on the destination. These fixed effects also take into account any time-invariant
14Khandelwal (2010) combines information on prices and physical quantities to infer quality, based on the insightthat ability of an exporter to sell a higher quantity at a given price should imply higher quality.
15Fan et al. (2015) also rely on estimates by Broda and Weinstein (2006) aggregated to the HS 2-digit, and, as analternative approach, they infer quality directly from their data using an instrumental variable approach. They findthat both approaches lead to highly similar results.
16For more details, see Khandelwal et al. (2013). One difference is that, as they focus only on clothing and textileexports, they assume a homogenous σ. Allowing σs to vary across industries necessitates adding the interaction termσsαct in equation (4) to capture the fact that the destination price index will have different effects on sales acrossindustries with different elasticities of substitution.
17For the correlation in levels we substract product-specific means to account for the fact that unit values of carsare not directly comparable to unit values of roses.
12
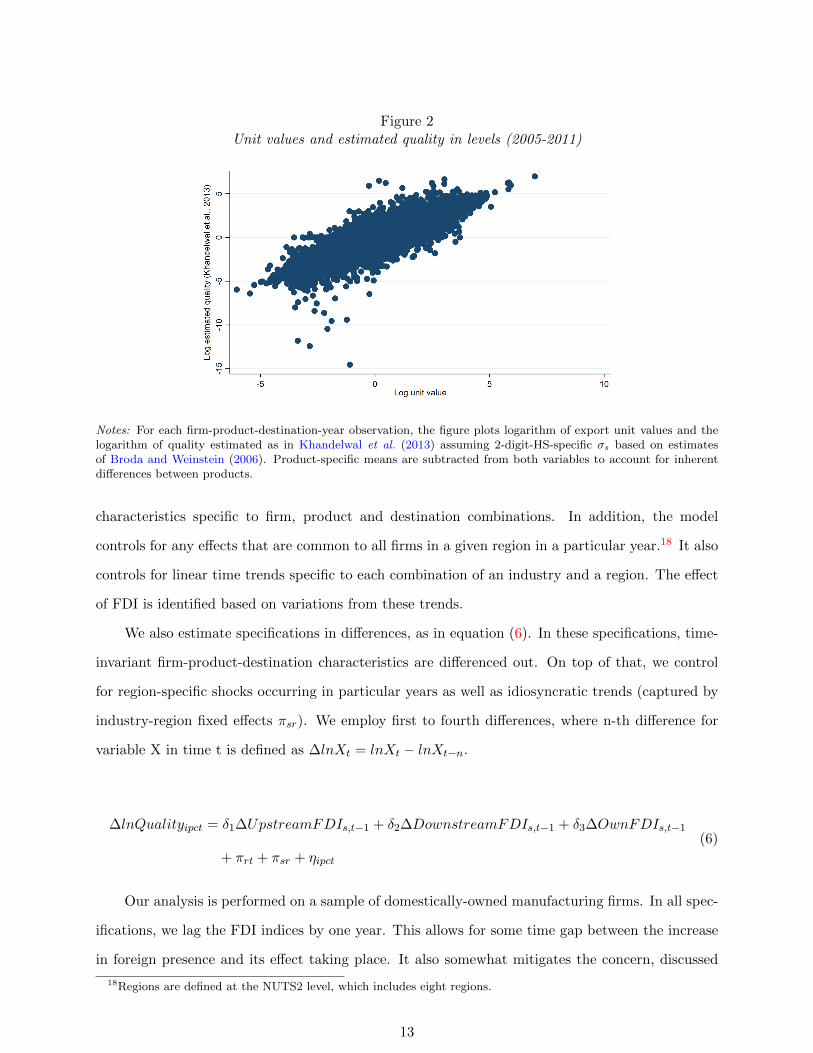
Figure 2Unit values and estimated quality in levels (2005-2011)
Notes: For each firm-product-destination-year observation, the figure plots logarithm of export unit values and thelogarithm of quality estimated as in Khandelwal et al. (2013) assuming 2-digit-HS-specific σs based on estimatesof Broda and Weinstein (2006). Product-specific means are subtracted from both variables to account for inherentdifferences between products.
characteristics specific to firm, product and destination combinations. In addition, the model
controls for any effects that are common to all firms in a given region in a particular year.18 It also
controls for linear time trends specific to each combination of an industry and a region. The effect
of FDI is identified based on variations from these trends.
We also estimate specifications in differences, as in equation (6). In these specifications, time-
invariant firm-product-destination characteristics are differenced out. On top of that, we control
for region-specific shocks occurring in particular years as well as idiosyncratic trends (captured by
industry-region fixed effects πsr). We employ first to fourth differences, where n-th difference for
variable X in time t is defined as ∆lnXt = lnXt − lnXt−n.
∆lnQualityipct = δ1∆UpstreamFDIs,t−1 + δ2∆DownstreamFDIs,t−1 + δ3∆OwnFDIs,t−1
+ πrt + πsr + ηipct
(6)
Our analysis is performed on a sample of domestically-owned manufacturing firms. In all spec-
ifications, we lag the FDI indices by one year. This allows for some time gap between the increase
in foreign presence and its effect taking place. It also somewhat mitigates the concern, discussed
18Regions are defined at the NUTS2 level, which includes eight regions.
13
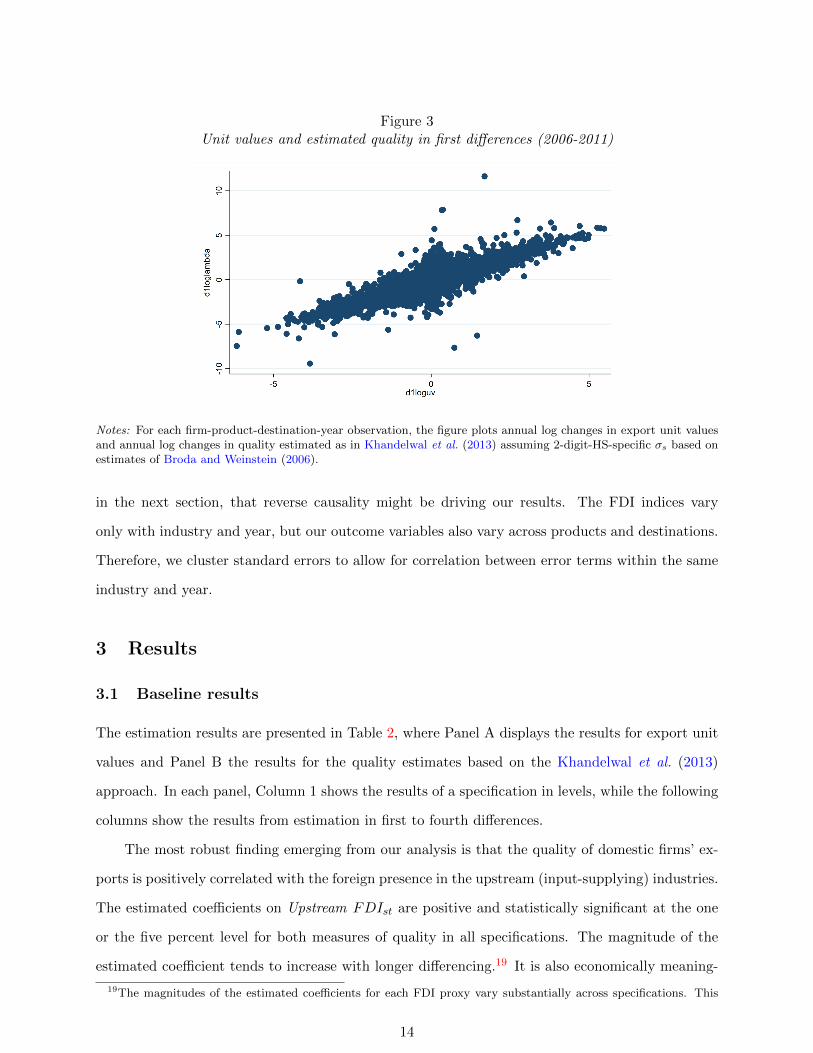
Figure 3Unit values and estimated quality in first differences (2006-2011)
Notes: For each firm-product-destination-year observation, the figure plots annual log changes in export unit valuesand annual log changes in quality estimated as in Khandelwal et al. (2013) assuming 2-digit-HS-specific σs based onestimates of Broda and Weinstein (2006).
in the next section, that reverse causality might be driving our results. The FDI indices vary
only with industry and year, but our outcome variables also vary across products and destinations.
Therefore, we cluster standard errors to allow for correlation between error terms within the same
industry and year.
3 Results
3.1 Baseline results
The estimation results are presented in Table 2, where Panel A displays the results for export unit
values and Panel B the results for the quality estimates based on the Khandelwal et al. (2013)
approach. In each panel, Column 1 shows the results of a specification in levels, while the following
columns show the results from estimation in first to fourth differences.
The most robust finding emerging from our analysis is that the quality of domestic firms’ ex-
ports is positively correlated with the foreign presence in the upstream (input-supplying) industries.
The estimated coefficients on Upstream FDIst are positive and statistically significant at the one
or the five percent level for both measures of quality in all specifications. The magnitude of the
estimated coefficient tends to increase with longer differencing.19 It is also economically meaning-
19The magnitudes of the estimated coefficients for each FDI proxy vary substantially across specifications. This
14
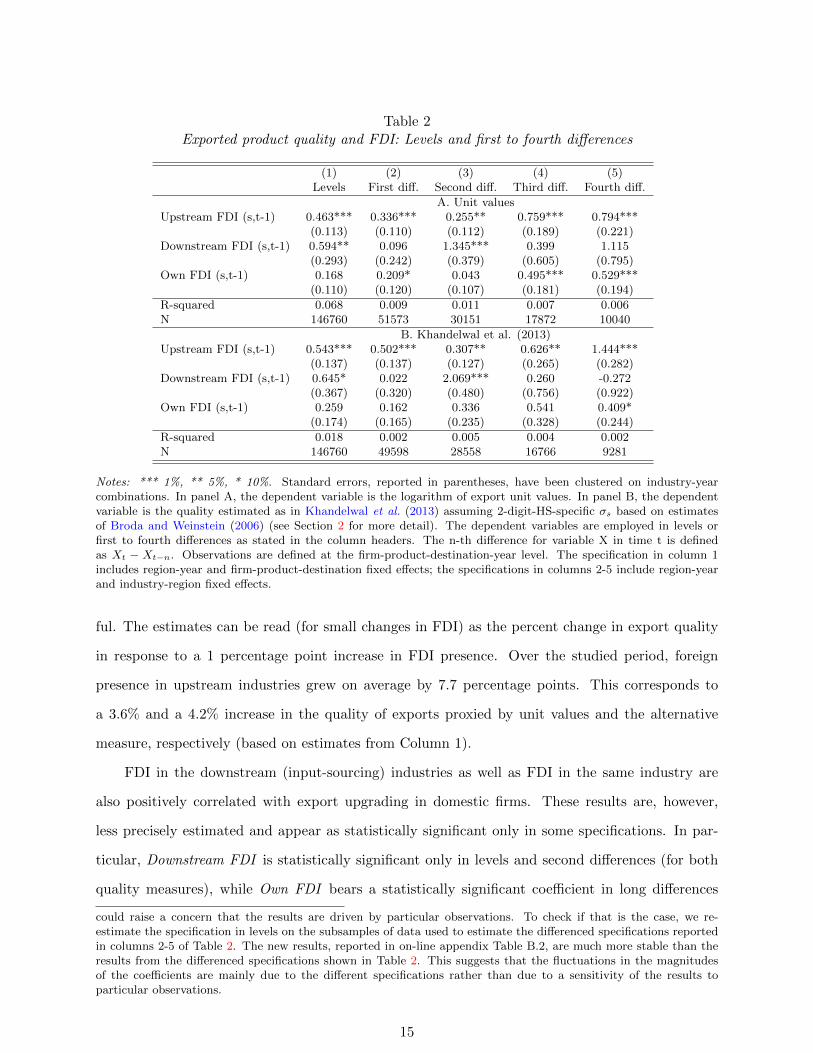
Table 2Exported product quality and FDI: Levels and first to fourth differences
(1) (2) (3) (4) (5)Levels First diff. Second diff. Third diff. Fourth diff.
A. Unit valuesUpstream FDI (s,t-1) 0.463*** 0.336*** 0.255** 0.759*** 0.794***
(0.113) (0.110) (0.112) (0.189) (0.221)Downstream FDI (s,t-1) 0.594** 0.096 1.345*** 0.399 1.115
(0.293) (0.242) (0.379) (0.605) (0.795)Own FDI (s,t-1) 0.168 0.209* 0.043 0.495*** 0.529***
(0.110) (0.120) (0.107) (0.181) (0.194)
R-squared 0.068 0.009 0.011 0.007 0.006N 146760 51573 30151 17872 10040
B. Khandelwal et al. (2013)Upstream FDI (s,t-1) 0.543*** 0.502*** 0.307** 0.626** 1.444***
(0.137) (0.137) (0.127) (0.265) (0.282)Downstream FDI (s,t-1) 0.645* 0.022 2.069*** 0.260 -0.272
(0.367) (0.320) (0.480) (0.756) (0.922)Own FDI (s,t-1) 0.259 0.162 0.336 0.541 0.409*
(0.174) (0.165) (0.235) (0.328) (0.244)
R-squared 0.018 0.002 0.005 0.004 0.002N 146760 49598 28558 16766 9281
Notes: *** 1%, ** 5%, * 10%. Standard errors, reported in parentheses, have been clustered on industry-yearcombinations. In panel A, the dependent variable is the logarithm of export unit values. In panel B, the dependentvariable is the quality estimated as in Khandelwal et al. (2013) assuming 2-digit-HS-specific σs based on estimatesof Broda and Weinstein (2006) (see Section 2 for more detail). The dependent variables are employed in levels orfirst to fourth differences as stated in the column headers. The n-th difference for variable X in time t is definedas Xt − Xt−n. Observations are defined at the firm-product-destination-year level. The specification in column 1includes region-year and firm-product-destination fixed effects; the specifications in columns 2-5 include region-yearand industry-region fixed effects.
ful. The estimates can be read (for small changes in FDI) as the percent change in export quality
in response to a 1 percentage point increase in FDI presence. Over the studied period, foreign
presence in upstream industries grew on average by 7.7 percentage points. This corresponds to
a 3.6% and a 4.2% increase in the quality of exports proxied by unit values and the alternative
measure, respectively (based on estimates from Column 1).
FDI in the downstream (input-sourcing) industries as well as FDI in the same industry are
also positively correlated with export upgrading in domestic firms. These results are, however,
less precisely estimated and appear as statistically significant only in some specifications. In par-
ticular, Downstream FDI is statistically significant only in levels and second differences (for both
quality measures), while Own FDI bears a statistically significant coefficient in long differences
could raise a concern that the results are driven by particular observations. To check if that is the case, we re-estimate the specification in levels on the subsamples of data used to estimate the differenced specifications reportedin columns 2-5 of Table 2. The new results, reported in on-line appendix Table B.2, are much more stable than theresults from the differenced specifications shown in Table 2. This suggests that the fluctuations in the magnitudesof the coefficients are mainly due to the different specifications rather than due to a sensitivity of the results toparticular observations.
15
and two other specifications. When we consider the estimates in Column 1, our results are con-
sistent with the 6.5-percentage-point increase in downstream FDI observed over the period under
study translating into about a 4% increase in the quality of domestic exporters for both quality
proxies. Importantly, in most specifications, we do not reject the equality of UpstreamFDI and
DownstreamFDI coefficients. This suggests that our results should not be interpreted as indicat-
ing a stronger relationship of export quality with upstream FDI than with downstream FDI but
merely as providing a more robust evidence for the former relationship than for the latter.20
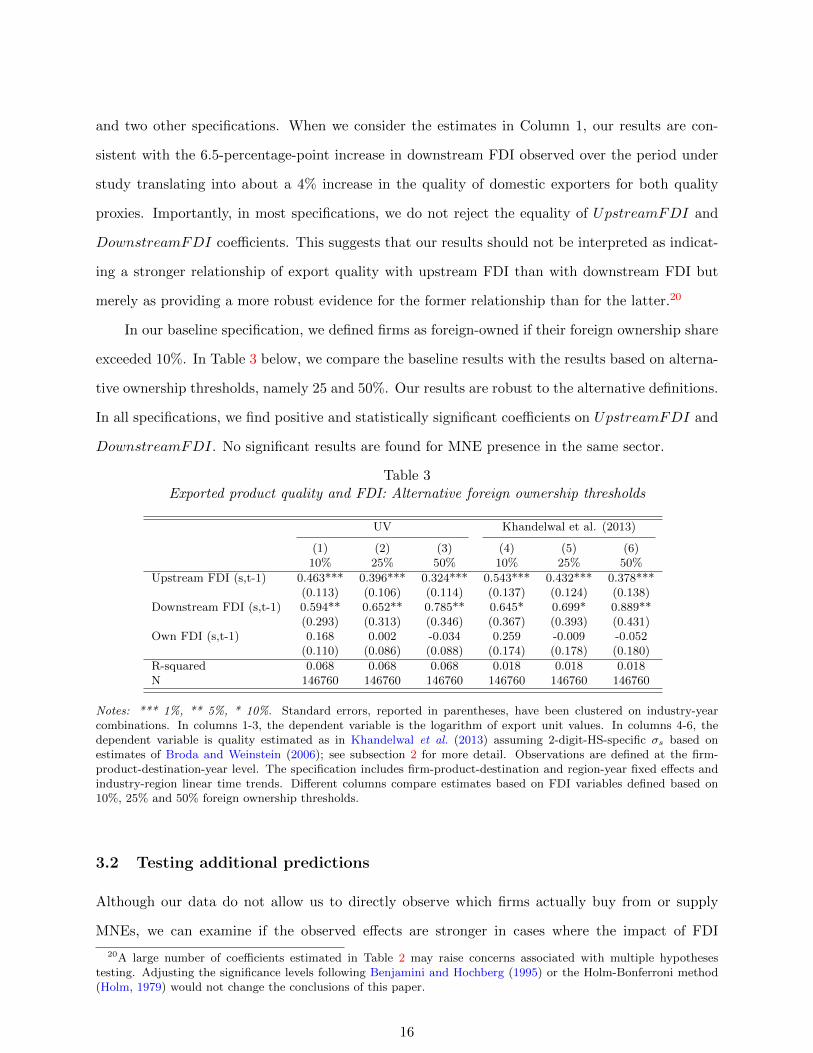
In our baseline specification, we defined firms as foreign-owned if their foreign ownership share
exceeded 10%. In Table 3 below, we compare the baseline results with the results based on alterna-
tive ownership thresholds, namely 25 and 50%. Our results are robust to the alternative definitions.
In all specifications, we find positive and statistically significant coefficients on UpstreamFDI and
DownstreamFDI. No significant results are found for MNE presence in the same sector.
Table 3Exported product quality and FDI: Alternative foreign ownership thresholds
UV Khandelwal et al. (2013)
(1) (2) (3) (4) (5) (6)10% 25% 50% 10% 25% 50%
Upstream FDI (s,t-1) 0.463*** 0.396*** 0.324*** 0.543*** 0.432*** 0.378***(0.113) (0.106) (0.114) (0.137) (0.124) (0.138)
Downstream FDI (s,t-1) 0.594** 0.652** 0.785** 0.645* 0.699* 0.889**(0.293) (0.313) (0.346) (0.367) (0.393) (0.431)
Own FDI (s,t-1) 0.168 0.002 -0.034 0.259 -0.009 -0.052(0.110) (0.086) (0.088) (0.174) (0.178) (0.180)
R-squared 0.068 0.068 0.068 0.018 0.018 0.018N 146760 146760 146760 146760 146760 146760
Notes: *** 1%, ** 5%, * 10%. Standard errors, reported in parentheses, have been clustered on industry-yearcombinations. In columns 1-3, the dependent variable is the logarithm of export unit values. In columns 4-6, thedependent variable is quality estimated as in Khandelwal et al. (2013) assuming 2-digit-HS-specific σs based onestimates of Broda and Weinstein (2006); see subsection 2 for more detail. Observations are defined at the firm-product-destination-year level. The specification includes firm-product-destination and region-year fixed effects andindustry-region linear time trends. Different columns compare estimates based on FDI variables defined based on10%, 25% and 50% foreign ownership thresholds.
3.2 Testing additional predictions
Although our data do not allow us to directly observe which firms actually buy from or supply
MNEs, we can examine if the observed effects are stronger in cases where the impact of FDI
20A large number of coefficients estimated in Table 2 may raise concerns associated with multiple hypothesestesting. Adjusting the significance levels following Benjamini and Hochberg (1995) or the Holm-Bonferroni method(Holm, 1979) would not change the conclusions of this paper.
16
spillovers is more likely to manifest itself. To that effect we undertake two exercises.
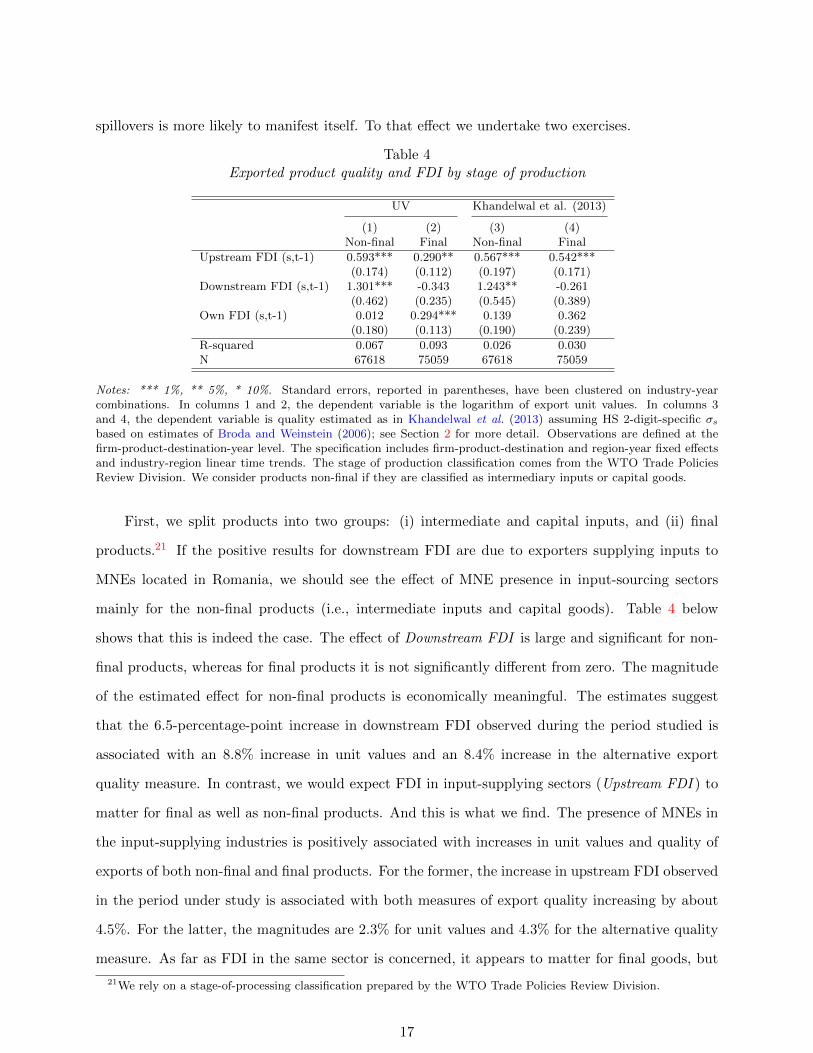
Table 4Exported product quality and FDI by stage of production
UV Khandelwal et al. (2013)
(1) (2) (3) (4)Non-final Final Non-final Final
Upstream FDI (s,t-1) 0.593*** 0.290** 0.567*** 0.542***(0.174) (0.112) (0.197) (0.171)
Downstream FDI (s,t-1) 1.301*** -0.343 1.243** -0.261(0.462) (0.235) (0.545) (0.389)
Own FDI (s,t-1) 0.012 0.294*** 0.139 0.362(0.180) (0.113) (0.190) (0.239)
R-squared 0.067 0.093 0.026 0.030N 67618 75059 67618 75059
Notes: *** 1%, ** 5%, * 10%. Standard errors, reported in parentheses, have been clustered on industry-yearcombinations. In columns 1 and 2, the dependent variable is the logarithm of export unit values. In columns 3and 4, the dependent variable is quality estimated as in Khandelwal et al. (2013) assuming HS 2-digit-specific σs
based on estimates of Broda and Weinstein (2006); see Section 2 for more detail. Observations are defined at thefirm-product-destination-year level. The specification includes firm-product-destination and region-year fixed effectsand industry-region linear time trends. The stage of production classification comes from the WTO Trade PoliciesReview Division. We consider products non-final if they are classified as intermediary inputs or capital goods.
First, we split products into two groups: (i) intermediate and capital inputs, and (ii) final
products.21 If the positive results for downstream FDI are due to exporters supplying inputs to
MNEs located in Romania, we should see the effect of MNE presence in input-sourcing sectors
mainly for the non-final products (i.e., intermediate inputs and capital goods). Table 4 below
shows that this is indeed the case. The effect of Downstream FDI is large and significant for non-
final products, whereas for final products it is not significantly different from zero. The magnitude
of the estimated effect for non-final products is economically meaningful. The estimates suggest
that the 6.5-percentage-point increase in downstream FDI observed during the period studied is
associated with an 8.8% increase in unit values and an 8.4% increase in the alternative export
quality measure. In contrast, we would expect FDI in input-supplying sectors (Upstream FDI ) to
matter for final as well as non-final products. And this is what we find. The presence of MNEs in
the input-supplying industries is positively associated with increases in unit values and quality of
exports of both non-final and final products. For the former, the increase in upstream FDI observed
in the period under study is associated with both measures of export quality increasing by about
4.5%. For the latter, the magnitudes are 2.3% for unit values and 4.3% for the alternative quality
measure. As far as FDI in the same sector is concerned, it appears to matter for final goods, but
21We rely on a stage-of-processing classification prepared by the WTO Trade Policies Review Division.
17
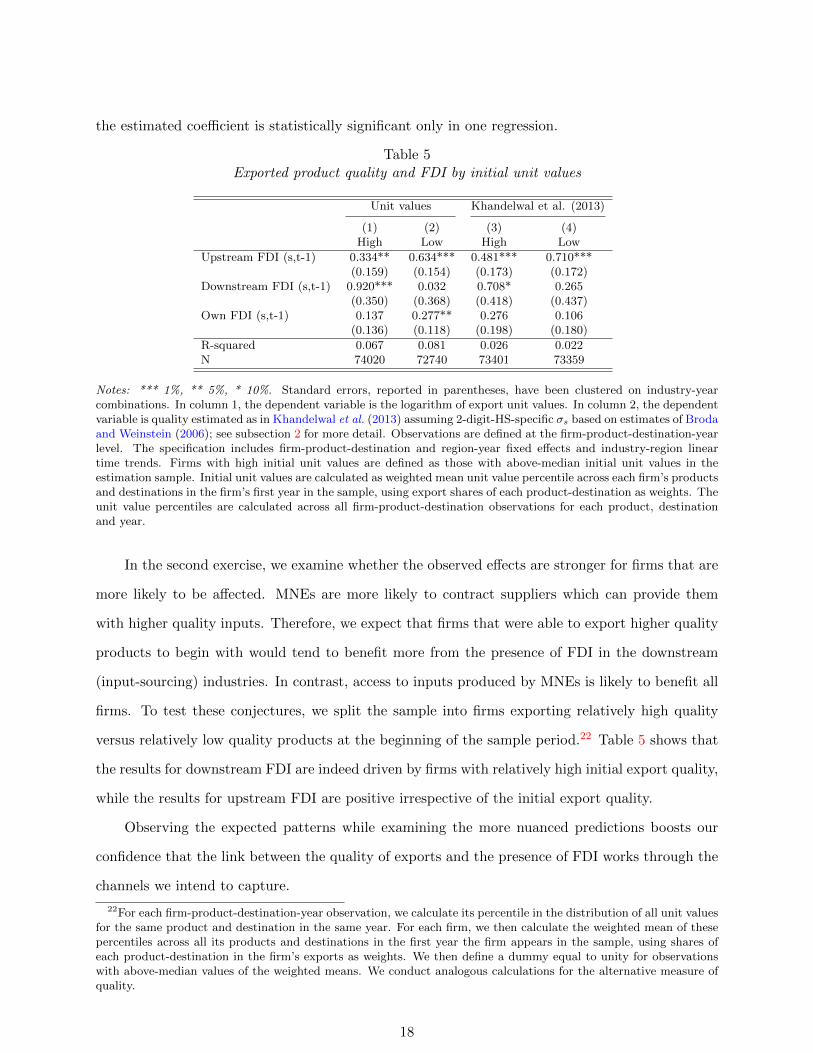
the estimated coefficient is statistically significant only in one regression.
Table 5Exported product quality and FDI by initial unit values
Unit values Khandelwal et al. (2013)
(1) (2) (3) (4)High Low High Low
Upstream FDI (s,t-1) 0.334** 0.634*** 0.481*** 0.710***(0.159) (0.154) (0.173) (0.172)
Downstream FDI (s,t-1) 0.920*** 0.032 0.708* 0.265(0.350) (0.368) (0.418) (0.437)
Own FDI (s,t-1) 0.137 0.277** 0.276 0.106(0.136) (0.118) (0.198) (0.180)
R-squared 0.067 0.081 0.026 0.022N 74020 72740 73401 73359
Notes: *** 1%, ** 5%, * 10%. Standard errors, reported in parentheses, have been clustered on industry-yearcombinations. In column 1, the dependent variable is the logarithm of export unit values. In column 2, the dependentvariable is quality estimated as in Khandelwal et al. (2013) assuming 2-digit-HS-specific σs based on estimates of Brodaand Weinstein (2006); see subsection 2 for more detail. Observations are defined at the firm-product-destination-yearlevel. The specification includes firm-product-destination and region-year fixed effects and industry-region lineartime trends. Firms with high initial unit values are defined as those with above-median initial unit values in theestimation sample. Initial unit values are calculated as weighted mean unit value percentile across each firm’s productsand destinations in the firm’s first year in the sample, using export shares of each product-destination as weights. Theunit value percentiles are calculated across all firm-product-destination observations for each product, destinationand year.
In the second exercise, we examine whether the observed effects are stronger for firms that are
more likely to be affected. MNEs are more likely to contract suppliers which can provide them
with higher quality inputs. Therefore, we expect that firms that were able to export higher quality
products to begin with would tend to benefit more from the presence of FDI in the downstream
(input-sourcing) industries. In contrast, access to inputs produced by MNEs is likely to benefit all
firms. To test these conjectures, we split the sample into firms exporting relatively high quality
versus relatively low quality products at the beginning of the sample period.22 Table 5 shows that
the results for downstream FDI are indeed driven by firms with relatively high initial export quality,
while the results for upstream FDI are positive irrespective of the initial export quality.
Observing the expected patterns while examining the more nuanced predictions boosts our
confidence that the link between the quality of exports and the presence of FDI works through the
channels we intend to capture.
22For each firm-product-destination-year observation, we calculate its percentile in the distribution of all unit valuesfor the same product and destination in the same year. For each firm, we then calculate the weighted mean of thesepercentiles across all its products and destinations in the first year the firm appears in the sample, using shares ofeach product-destination in the firm’s exports as weights. We then define a dummy equal to unity for observationswith above-median values of the weighted means. We conduct analogous calculations for the alternative measure ofquality.
18
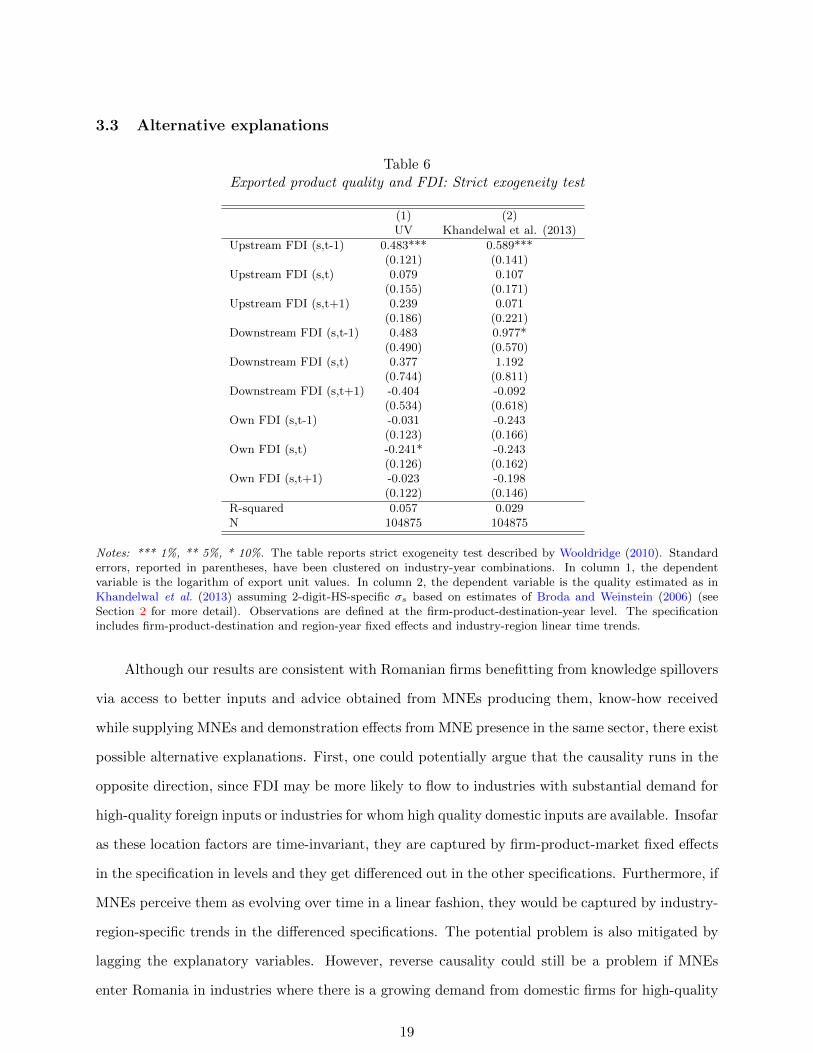
3.3 Alternative explanations
Table 6Exported product quality and FDI: Strict exogeneity test
(1) (2)UV Khandelwal et al. (2013)
Upstream FDI (s,t-1) 0.483*** 0.589***(0.121) (0.141)
Upstream FDI (s,t) 0.079 0.107(0.155) (0.171)
Upstream FDI (s,t+1) 0.239 0.071(0.186) (0.221)
Downstream FDI (s,t-1) 0.483 0.977*(0.490) (0.570)
Downstream FDI (s,t) 0.377 1.192(0.744) (0.811)
Downstream FDI (s,t+1) -0.404 -0.092(0.534) (0.618)
Own FDI (s,t-1) -0.031 -0.243(0.123) (0.166)
Own FDI (s,t) -0.241* -0.243(0.126) (0.162)
Own FDI (s,t+1) -0.023 -0.198(0.122) (0.146)
R-squared 0.057 0.029N 104875 104875
Notes: *** 1%, ** 5%, * 10%. The table reports strict exogeneity test described by Wooldridge (2010). Standarderrors, reported in parentheses, have been clustered on industry-year combinations. In column 1, the dependentvariable is the logarithm of export unit values. In column 2, the dependent variable is the quality estimated as inKhandelwal et al. (2013) assuming 2-digit-HS-specific σs based on estimates of Broda and Weinstein (2006) (seeSection 2 for more detail). Observations are defined at the firm-product-destination-year level. The specificationincludes firm-product-destination and region-year fixed effects and industry-region linear time trends.
Although our results are consistent with Romanian firms benefitting from knowledge spillovers
via access to better inputs and advice obtained from MNEs producing them, know-how received
while supplying MNEs and demonstration effects from MNE presence in the same sector, there exist
possible alternative explanations. First, one could potentially argue that the causality runs in the
opposite direction, since FDI may be more likely to flow to industries with substantial demand for
high-quality foreign inputs or industries for whom high quality domestic inputs are available. Insofar
as these location factors are time-invariant, they are captured by firm-product-market fixed effects
in the specification in levels and they get differenced out in the other specifications. Furthermore, if
MNEs perceive them as evolving over time in a linear fashion, they would be captured by industry-
region-specific trends in the differenced specifications. The potential problem is also mitigated by
lagging the explanatory variables. However, reverse causality could still be a problem if MNEs
enter Romania in industries where there is a growing demand from domestic firms for high-quality
19
inputs or where high-quality domestic suppliers are increasingly becoming available and if these
dynamics are not captured by the linear trends. To shed light on this possibility we perform the
strict exogeneity test suggested by Wooldridge (2010). It entails estimating a specification where, in
addition to the lagged FDI variables, we include their contemporaneous and lead values. If foreign
firms’ entry into Romania is a consequence of quality upgrading in upstream and downstream
industries, the coefficients on the lead values should be statistically significant.
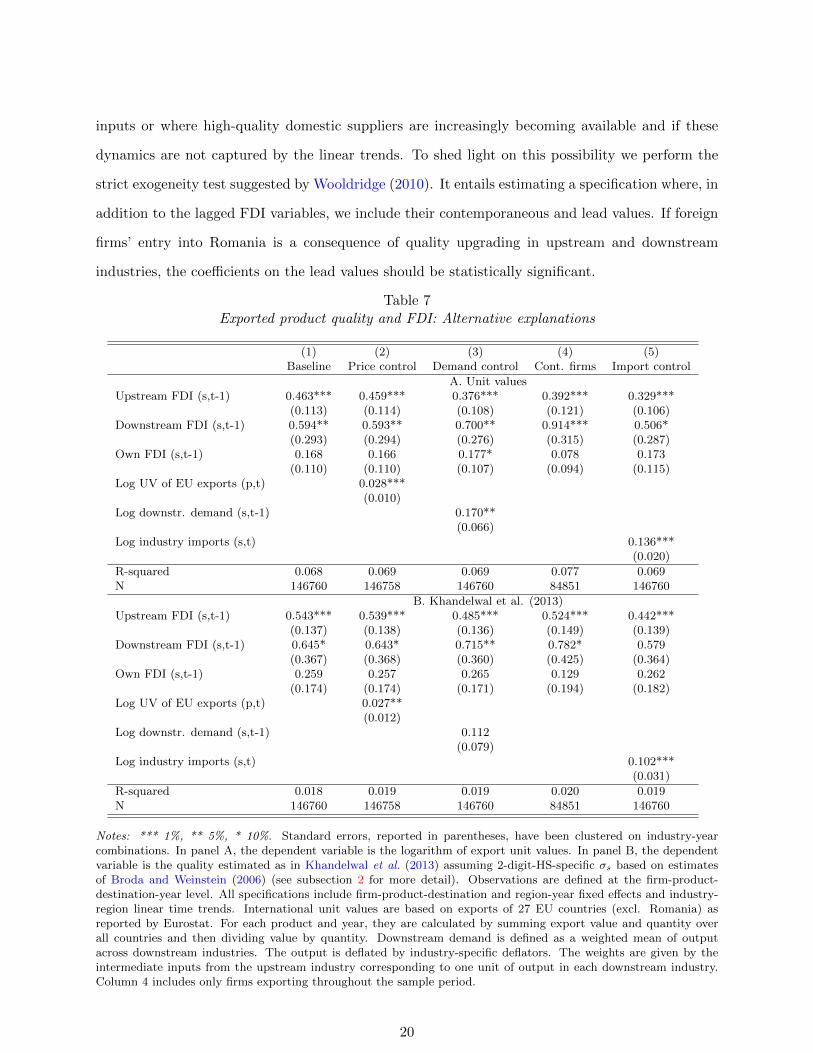
Table 7Exported product quality and FDI: Alternative explanations
(1) (2) (3) (4) (5)Baseline Price control Demand control Cont. firms Import control
A. Unit valuesUpstream FDI (s,t-1) 0.463*** 0.459*** 0.376*** 0.392*** 0.329***
(0.113) (0.114) (0.108) (0.121) (0.106)Downstream FDI (s,t-1) 0.594** 0.593** 0.700** 0.914*** 0.506*
(0.293) (0.294) (0.276) (0.315) (0.287)Own FDI (s,t-1) 0.168 0.166 0.177* 0.078 0.173
(0.110) (0.110) (0.107) (0.094) (0.115)Log UV of EU exports (p,t) 0.028***
(0.010)Log downstr. demand (s,t-1) 0.170**
(0.066)Log industry imports (s,t) 0.136***
(0.020)
R-squared 0.068 0.069 0.069 0.077 0.069N 146760 146758 146760 84851 146760
B. Khandelwal et al. (2013)Upstream FDI (s,t-1) 0.543*** 0.539*** 0.485*** 0.524*** 0.442***
(0.137) (0.138) (0.136) (0.149) (0.139)Downstream FDI (s,t-1) 0.645* 0.643* 0.715** 0.782* 0.579
(0.367) (0.368) (0.360) (0.425) (0.364)Own FDI (s,t-1) 0.259 0.257 0.265 0.129 0.262
(0.174) (0.174) (0.171) (0.194) (0.182)Log UV of EU exports (p,t) 0.027**
(0.012)Log downstr. demand (s,t-1) 0.112
(0.079)Log industry imports (s,t) 0.102***
(0.031)
R-squared 0.018 0.019 0.019 0.020 0.019N 146760 146758 146760 84851 146760
Notes: *** 1%, ** 5%, * 10%. Standard errors, reported in parentheses, have been clustered on industry-yearcombinations. In panel A, the dependent variable is the logarithm of export unit values. In panel B, the dependentvariable is the quality estimated as in Khandelwal et al. (2013) assuming 2-digit-HS-specific σs based on estimatesof Broda and Weinstein (2006) (see subsection 2 for more detail). Observations are defined at the firm-product-destination-year level. All specifications include firm-product-destination and region-year fixed effects and industry-region linear time trends. International unit values are based on exports of 27 EU countries (excl. Romania) asreported by Eurostat. For each product and year, they are calculated by summing export value and quantity overall countries and then dividing value by quantity. Downstream demand is defined as a weighted mean of outputacross downstream industries. The output is deflated by industry-specific deflators. The weights are given by theintermediate inputs from the upstream industry corresponding to one unit of output in each downstream industry.Column 4 includes only firms exporting throughout the sample period.
20
Table 6 presents the test results. The positive coefficients on upstream and downstream FDI
seem to be driven by their lagged values. Most importantly, the leads for all three FDI measures
bear insignificant coefficients, suggesting that reverse causality is not driving our results. The
results further suggest that, if anything, FDI may be more likely to flow to industries with lower
unit values of exports.
Additional analysis, reported in on-line appendix Table B.3, shows that our conclusions are
robust to allowing for a partial adjustment in the export quality. More specifically, we estimate
a dynamic specification featuring a lagged dependent variable among the explanatory variables.
Estimates based on a generalised-method-of-moments (GMM) estimator by Arellano and Bond
(1991), as well as on a fixed-effects estimator, indicate that there is a positive and statistically
significant relationship between the quality of Romanian firm exports (measured by either quality
proxy) and FDI presence in upstream industries. The long-term semi-elasticities implied by the
GMM estimates are either similar or slightly smaller than those found in the static estimation.23
The other two measures of FDI presence are not statistically significant in the GMM specifications.
Another potential alternative explanation is that a shock in the international market is driving
both FDI inflows to Romania and unit values of Romanian exports. Imagine there is a global
positive shock to demand for agricultural machines. As a result, foreign producers of agricultural
machines and of the inputs used to manufacture agricultural machines decide to expand their
production and invest in Romania. At the same time, the demand shock leads to higher prices for
such machines and their inputs, including the prices faced by Romanian exporters. It would then
be incorrect to interpret the resulting correlation between unit values of Romanian exporters and
the upstream, downstream or same sector foreign investments as evidence of spillovers. Fortunately,
we can easily test for this case by including the international price of each product as a control.
Column 2 in Table 7 shows the results of an estimation, where we control for unit values of exports
by the other EU members. Doing so has virtually no effect on the estimated coefficients on FDI
variables when compared to the baseline results reproduced in Column 1. Hence an international
shock driving both foreign investment to Romania and unit values of Romanian firms does not
seem to explain our results.
23The long-term effects in the dynamic equation can be calculated as the short term effects divided by one minusthe coefficient on the lagged dependent variable. This gives 0.359/(1 − 0.198) = 0.448) for the unit values and0.370/(1 − 0.106) = 0.414 for the alternative export quality measure.
21
Yet another potential alternative explanation for our results is related to domestic, rather
than international, demand. Foreign investment in downstream industries could lead to an increase
in their demand for inputs. If supply of these inputs is relatively inelastic, at least in the short
term, upstream domestic firms might react to the increased demand by increasing prices of both
their domestic sales and their exports. In such case, the correlation between foreign presence in
downstream industries and export prices of upstream firms would reflect a price increase in reaction
to an increased demand rather than a quality improvement. To test for this possibility, we follow
Javorcik (2004) and define an index capturing input demand by downstream industries. Column 3
of Table 7 shows that when we include this index in the estimation, it indeed has a strong positive
effect on export unit values. However, its inclusion actually makes the coefficients on downstream
FDI slightly larger and more precisely estimated, suggesting that downstream demand is not driving
our results.
It is also possible that as foreign-owned firms enter upstream or downstream industries, do-
mestic firms that are unable to improve their product quality are forced to exit the market. In
such a case, the observed results on the quality of exports by Romanian firms would be driven by
differential entry and exit rather than by spillovers. We explore this possibility by restricting the
estimation sample to firms continuously exporting throughout the sample period (see column 4 of
Table 7). The results remain robust. Thus differential entry/exit patterns are unlikely to represent
mechanisms behind the positive effect of FDI on export unit values.
Finally, we consider the possibility that the estimated positive association between export
quality and upstream FDI is driven by a concurrent increase in availability of imported interme-
diate inputs. Therefore, in the last column of Table 7, we control for the value of industry-level
imports. Imports appear to be strongly positively correlated with quality. However, the coefficient
on upstream FDI, although slightly reduced, remains statistically significant at the 1% level for
both measures of quality. The coefficient on downstream FDI is also slightly reduced and remains
statistically significant only when export quality is measured with unit values.
4 Conclusion
Economic development is inseparably related to structural change and upgrading of industrial
production and exports. Many countries use industrial policy and trade policy to facilitate such
22
upgrading, but our knowledge of factors that can contribute to this goal is limited.
This study suggests that FDI inflows can stimulate domestic firms to upgrade the quality of
their exports. Using a panel of all Romanian firms with more than 20 employees, matched with
detailed customs data and observed over the period 2005-2011, we find evidence consistent with the
view that FDI inflows have facilitated export upgrading by Romanian firms. The most robust effect
seems to have been exerted by FDI in the input-supplying industries, but FDI in the input-sourcing
or the same industry also seems to have had a positive (though a less robust) effect. These findings
hold when we proxy for export quality using unit values or estimate quality following Khandelwal
et al. (2013). The estimated effects suggest that the increases in foreign presence in the input-
supplying manufacturing industries over the period studied corresponded to an approximately 4%
increase in the quality of exports by local firms. A similar magnitude is found for FDI in the input-
sourcing industries. Although we do not claim that FDI was the only, or even the most important,
contributor to export upgrading in Romanian manufacturing, the combined estimated effect of the
FDI increases is of a similar magnitude as a half of the total catch-up relative to EU15 in terms of
unit value registered by exports of Romanian firms over the same period.
Overall, our findings indicate that when policy makers are looking for effective and actionable
policies aimed at quality upgrading among domestic exporters, they should consider FDI promotion,
and, in particular, efforts to bring foreign investors into industries which are likely to supply inputs
to domestic firms.
23
References
Aitken, B., Hanson, G.H. and Harrison, A.E. (1997). ‘Spillovers, foreign investment, and export
behavior’, Journal of International Economics, vol. 43(1-2), pp. 103–132.
Aitken, B.J. and Harrison, A.E. (1999). ‘Do domestic firms benefit from direct foreign investment?
Evidence from Venezuela’, American Economic Review, vol. 89(3), pp. 605–618.
Amiti, M. and Konings, J. (2007). ‘Trade liberalization, intermediate inputs, and productivity:
evidence from Indonesia’, American Economic Review, vol. 97(5), pp. 1611–1638.
Arellano, M. and Bond, S. (1991). ‘Some tests of specification for panel data: Monte Carlo evidence
and an application to employment equations’, Review of Economic Studies, vol. 58(2), pp. 277–97.
Atkin, D., Khandelwal, A.K. and Osman, A. (2017). ‘Exporting and firm performance: evidence
from a randomized experiment’, The Quarterly Journal of Economics, vol. 132(2), pp. 551–615.
Balsvik, R. (2011). ‘Is labor mobility a channel for spillovers from multinationals? Evidence from
Norwegian manufacturing’, The Review of Economics and Statistics, vol. 93(1), pp. 285–297.
Bas, M. and Strauss-Kahn, V. (2015). ‘Input-trade liberalization, export prices and quality upgrad-
ing’, Journal of International Economics, vol. 95(2), pp. 250–262.
Benjamini, Y. and Hochberg, Y. (1995). ‘Controlling the false discovery rate: a practical and pow-
erful approach to multiple testing’, Journal of the Royal Statistical Society. Series B (Method-
ological), vol. 57(1), pp. 289–300.
Broda, C. and Weinstein, D.E. (2006). ‘Globalization and the gains from variety’, The Quarterly
Journal of Economics, vol. 121(2), p. 541.
Brooks, E.L. (2006). ‘Why don’t firms export more? Product quality and Colombian plants’,
Journal of Development Economics, vol. 80, pp. 160–178.
Chen, H. and Swenson, D.L. (2007). ‘Multinational firms and new Chinese export transactions’,
University of California, Davis.
24
Chung, W., Mitchell, W. and Yeung, B. (2003). ‘Foreign direct investment and host country pro-
ductivity: the American automotive component industry in the 1980s’, Journal of International
Business Studies, vol. 34(2), pp. 199–218.
De Loecker, J. (2007). ‘Do exports generate higher productivity? Evidence from Slovenia’, Journal
of International Economics, vol. 73(1), pp. 69–98.
Fan, H., Li, Y.A. and Yeaple, S.R. (2015). ‘Trade liberalization, quality, and export prices’, The
Review of Economics and Statistics, vol. 97(5), pp. 1033–1051.
Goldberg, P.K., Khandelwal, A.K., Pavcnik, N. and Topalova, P. (2010). ‘Multiproduct firms and
product turnover in the developing world: evidence from India’, The Review of Economics and
Statistics, vol. 92(4), pp. 1042–1049.
Hallak, J.C. (2006). ‘Product quality and the direction of trade’, Journal of International Eco-
nomics, vol. 68(1), pp. 238–265.
Hallak, J.C. and Sivadasan, J. (2013). ‘Product and process productivity: implications for quality
choice and conditional exporter premia’, Journal of International Economics, vol. 91(1), pp.
53–67.
Harding, T. and Javorcik, B.S. (2012). ‘Foreign direct investment and export upgrading’, The
Review of Economics and Statistics, vol. 94(4), pp. 964–980.
Haskel, J.E., Pereira, S.C. and Slaughter, M.J. (2007). ‘Does inward foreign direct investment
boost the productivity of domestic firms?’, The Review of Economics and Statistics, vol. 89(3),
pp. 482–496.
Hausmann, R., Hwang, J. and Rodrik, D. (2007). ‘What you export matters’, Journal of Economic
Growth, vol. 12(1), pp. 1–25.
Havranek, T. and Irsova, Z. (2011). ‘Estimating vertical spillovers from FDI: why results vary and
what the true effect is’, Journal of International Economics, vol. 85(2), pp. 234–244.
Hidalgo, C.A. and Hausmann, R. (2009). ‘The building blocks of economic complexity’, Proceedings
of the National Academy of Sciences, vol. 106(26), pp. 10570–10575.
25
Holm, S. (1979). ‘A simple sequentially rejective multiple test procedure’, Scandinavian Journal of
Statistics, vol. 6(2), pp. 65–70.
Iacovone, L. and Javorcik, B. (2012). ‘Getting ready: preparation for exporting’, CEPR Discussion
Paper.
Javorcik, B., Keller, W. and Tybout, J. (2008). ‘Openness and industrial response in a Wal-Mart
world: a case study of mexican soaps, detergents and surfactant producers’, World Economy,
vol. 31(12), pp. 1558–1580.
Javorcik, B.S. (2004). ‘Does foreign direct investment increase the productivity of domestic firms?
In search of spillovers through backward linkages’, American Economic Review, vol. 94(3), pp.
605–627.
Javorcik, B.S. (2008). ‘Can survey evidence shed light on spillovers from foreign direct investment?’,
World Bank Research Observer, vol. 23(2), pp. 139–159.
Javorcik, B.S., Lo Turco, A. and Maggioni, D. (2017). ‘New and improved: does FDI boost pro-
duction complexity in host countries?’, The Economic Journal, vol. 128(614), pp. 2507–2537.
Javorcik, B.S. and Spatareanu, M. (2008). ‘To share or not to share: does local participation matter
for spillovers from foreign direct investment?’, Journal of Development Economics, vol. 85(1-2),
pp. 194–217.
Javorcik, B.S. and Spatareanu, M. (2009). ‘Tough love: do Czech suppliers learn from their rela-
tionships with multinationals?’, Scandinavian Journal of Economics, vol. 111(4), pp. 811–833.
Javorcik, B.S. and Spatareanu, M. (2011). ‘Does it matter where you come from? Vertical spillovers
from foreign direct investment and the origin of investors’, Journal of Development Economics,
vol. 96(1), pp. 126–138.
Keller, W. and Yeaple, S.R. (2009). ‘Multinational enterprises, international trade, and productivity
growth: firm-Level evidence from the United States’, The Review of Economics and Statistics,
vol. 91(4), pp. 821–831.
Khandelwal, A. (2010). ‘The long and short (of) quality ladders’, Review of Economic Studies,
vol. 77(4), pp. 1450–1476.
26
Khandelwal, A.K., Schott, P.K. and Wei, S.J. (2013). ‘Trade liberalization and embedded institu-
tional reform: evidence from Chinese exporters’, American Economic Review, vol. 103(6), pp.
2169–95.
Manova, K. and Zhang, Z. (2012). ‘Export prices across firms and destinations’, The Quarterly
Journal of Economics, vol. 127(1), pp. 379–436.
Poole, J.P. (2013). ‘Knowledge transfers from multinational to domestic firms: evidence from worker
mobility’, The Review of Economics and Statistics, vol. 95(2), pp. 393–406.
Republic of South Africa (2007). National Industrial Policy Framework, Pretoria: Department of
Trade and Industry.
Republic of the Philippines (2016). Comprehensive National Industrial Strategy, Department of
Trade and Industry.
Schott, P.K. (2004). ‘Across-product versus within-product specialization in international trade’,
The Quarterly Journal of Economics, vol. 119(2), pp. 646–677.
Sutton, J. (2012). Competing in Capabilities: The Globalization Process, Oxford: Oxford University
Press.
Swenson, D.L. (2008). ‘Multinationals and the creation of Chinese trade linkages’, Canadian Journal
of Economics, vol. 41(2), pp. 596–618.
Van Biesebroeck, J. (2005). ‘Exporting raises productivity in sub-Saharan African manufacturing
firms’, Journal of International Economics, vol. 67(2), pp. 373–391.
Verhoogen, E.A. (2008). ‘Trade, quality upgrading, and wage inequality in the Mexican manufac-
turing sector’, The Quarterly Journal of Economics, vol. 123(2), pp. 489–530.
Wooldridge, J.M. (2010). Econometric Analysis of Cross Section and Panel Data, Cambridge, MA:
MIT Press.
27