clinging to the past - oliverwyman.com · the americas, europe, and asia • dominant aerospace and...
TRANSCRIPT

© Oliver Wyman AVIATION, AEROSPACE & DEFENSE
David A. Marcontell General Manager CAVOK, a division of Oliver Wyman 1003 Virginia Ave, Suite 300 | Atlanta, GA 30354 Direct: +1 404 334 8040 | Mobile: +1 404 427 3079 [email protected] | www.cavokgroup.com
APRIL 25, 2017
CLINGING TO THE PAST
1 © Oliver Wyman
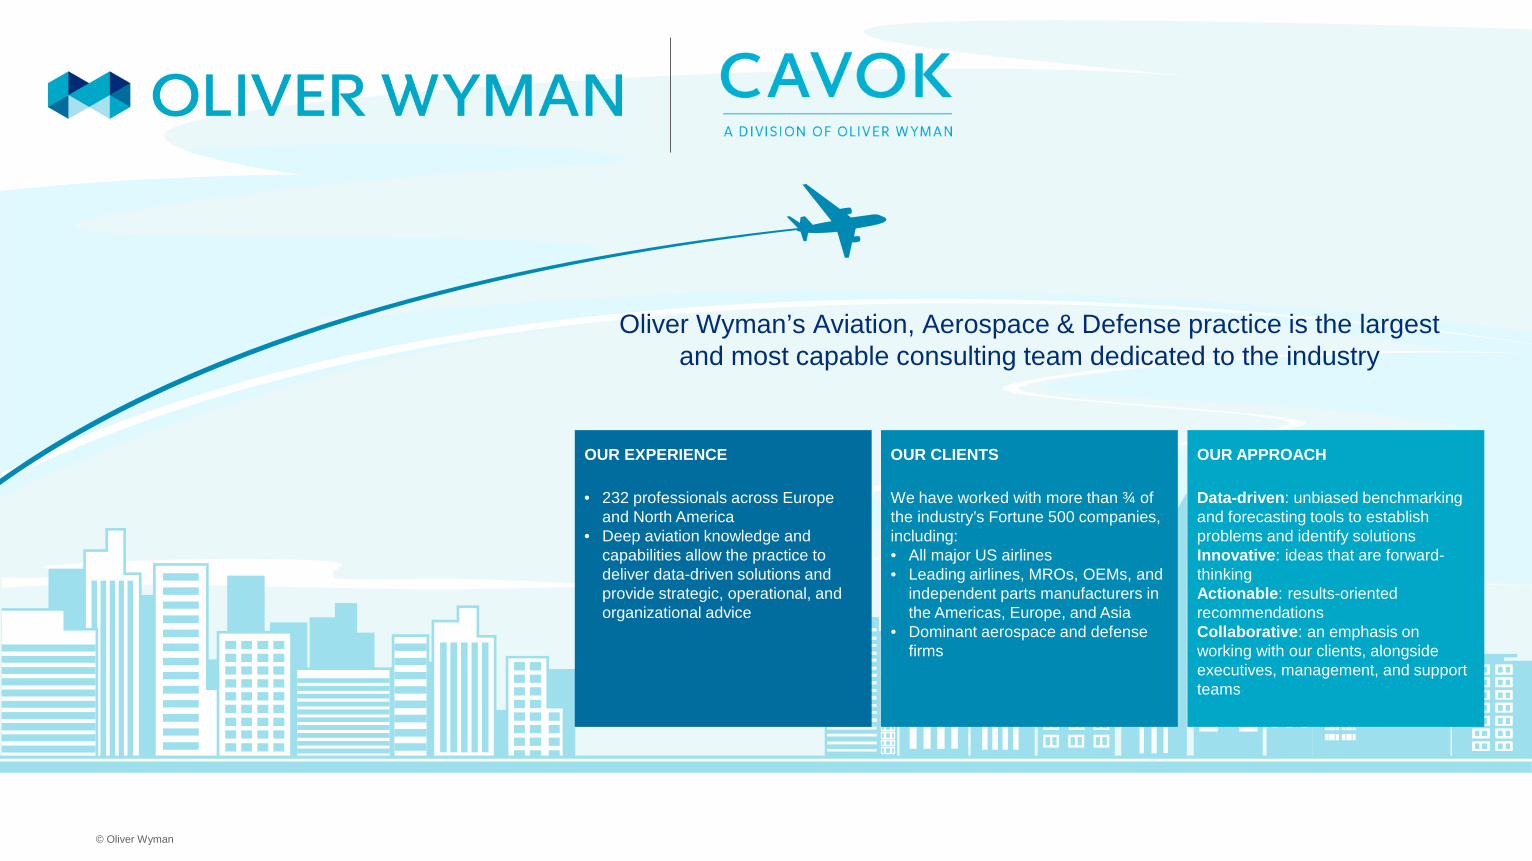
Oliver Wyman’s Aviation, Aerospace & Defense practice is the largest and most capable consulting team dedicated to the industry
OUR CLIENTS
We have worked with more than ¾ of the industry’s Fortune 500 companies, including: • All major US airlines • Leading airlines, MROs, OEMs, and
independent parts manufacturers in the Americas, Europe, and Asia
• Dominant aerospace and defense firms
OUR EXPERIENCE
• 232 professionals across Europe and North America
• Deep aviation knowledge and capabilities allow the practice to deliver data-driven solutions and provide strategic, operational, and organizational advice
OUR APPROACH
Data-driven: unbiased benchmarking and forecasting tools to establish problems and identify solutions Innovative: ideas that are forward-thinking Actionable: results-oriented recommendations Collaborative: an emphasis on working with our clients, alongside executives, management, and support teams
© Oliver Wyman
2 © Oliver Wyman © Oliver Wyman
This presentation incorporates Oliver Wyman’s 2017-2027 Global Fleet & MRO Market Forecast and 2017 MRO Survey, both of which are available at www.oliverwyman.com

Taking Care of Business 1

4 © Oliver Wyman
Global Commercial Air Transport Industry Net Profit by Year
In the face of softening revenue and rising costs, North American operators are continuing to deliver the global commercial air transport industry’s strongest financial performance
Billions of US Dollars
Peak
-$25
-$20
-$15
-$10
-$5
$0
$5
$10
$15
$20
$25
2007 2008 2009 2010 2011 2012 2013 2014 2015 2016E 2017F Co
Continued growth in revenue from ancillaries, widespread capacity discipline, and a lack of new entrants are helping the North American operators mitigate the impact of shifting economics
Rest of World
North America
Source: IATA

5 © Oliver Wyman
Crude Oil and Jet Fuel Spot Prices per Gallon by Year
Three years of record profits have allowed operators to invest heavily in the passenger experience and adopt new, more expensive labor contracts, which may be a possible source of turbulence in the near future amid a changing economic landscape as the oil market begins to recover from the glut
Brent Crude
Jet Fuel
Cone of Uncertainty
WTI Crude
Notwithstanding some operators have altered fleet plans over the past year to take advantage of current market conditions, OEM order books remain strong, and new aircraft deliveries are occurring at record rates
$0.0
$0.5
$1.0
$1.5
$2.0
$2.5
$3.0
$3.5
$4.0
2010 2011 2012 2013 2014 2015 2016 2017 2018 2019 2020 2021 2022 2023 2024 2025 2026$0.0
$0.5
$1.0
$1.5
$2.0
$2.5
$3.0
$3.5
$4.0
2010 2011 2012 2013 2014 2015 2016 2017 2018 2019 2020 2021 2022 2023 2024 2025 2026$0.0
$0.5
$1.0
$1.5
$2.0
$2.5
$3.0
$3.5
$4.0
2010 2011 2012 2013 2014 2015 2016 2017 2018 2019 2020 2021 2022 2023 2024 2025 2026
US Dollars
New gen narrowbody aircraft are more profitable than current gen
New gen widebody aircraft are more profitable than current gen
Source: U.S. Energy Information Administration, Oliver Wyman Analysis

6 © Oliver Wyman
Q: Have you pulled an aircraft out of storage and pressed it into service within the past 12 months? If so, why?*
Q: Are you delaying aircraft retirements?*
Nearly half of aircraft operator respondents in our MRO Survey are delaying retirements and nearly one third of respondents are reactivating aircraft they have pulled from long term storage
Nearly three quarters of respondents also said they are not deferring new aircraft deliveries, while the remaining respondents by equal measure cited improved operating economics of older aircraft and weakening economic conditions as reasons for deferrals
No Yes, due to improved
economics of older aircraft vs acquiring new
aircraft
Yes, due to lack of availability of new
aircraft
Yes, due to temporary capacity
opportunities
No Yes, due to improved
economics of older aircraft vs acquiring new
aircraft
Yes, due to lack of availability of new
aircraft
Yes, due to temporary capacity
opportunities
53%
3%
13%
30%
71%
3% 3%
23%
Source: Oliver Wyman 2017 MRO Survey | *Responses filtered to aircraft operators

7 © Oliver Wyman
$12.8B Line
$12.1B Component
$17.7B Airframe & Modifications
$29.6B Engine
2017 Global Commercial Air Transport MRO Market Forecast by MRO Segment
Year Over Year Changes to the Global Commercial Air Transport In-Service Fleet by Transaction Type
Over the past year, status changes to 3,792 aircraft have lead the global in-service fleet to experience a net growth of 828 aircraft, representing a 3.4% annual growth rate
Translating the changing fleet dynamics into MRO, the 2017 market is forecast to be $72.1B, with engine MRO continuing to be the driver of growth
Source: Flightglobal, Oliver Wyman Analysis
Transferred to a
commercial operator 3
Completed freighter conversion
30
Unknown prior exclusion 6
Removed from storage 630
New aircraft delivery
1,641
Storage for conversion
into a freighter (5)
Transferred to a
non-commercial operator (42)
Involved in an accident
(34)
Formally retired (198)
Sent to storage
(1,180)
2,310 Aircraft Additions (1,482)
Aircraft Removals
24,540 2017 In-Service Fleet
25,368 2017 In-Service Fleet
3.4%

8 © Oliver Wyman
21,000
23,000
25,000
27,000
29,000
31,000
33,000
35,000
37,000
39,000
41,000
2011 2012 2013 2014 2015 2016 2017 2018 2019 2020 2021 2022 2023 2024 2025 2026 202721,000
23,000
25,000
27,000
29,000
31,000
33,000
35,000
37,000
39,000
41,000
2011 2012 2013 2014 2015 2016 2017 2018 2019 2020 2021 2022 2023 2024 2025 2026 202721,000
23,000
25,000
27,000
29,000
31,000
33,000
35,000
37,000
39,000
41,000
2011 2012 2013 2014 2015 2016 2017 2018 2019 2020 2021 2022 2023 2024 2025 2026 2027
Global Commercial Air Transport MRO Market Forecast by Year
Global Commercial Air Transport Fleet Forecast by Year
While the fleet continues to grow at a healthy rate, and the industry is still recording near historic net profits, uncertainties surrounding economic growth, interest rates, and oil could disrupt and hinder growth and stability of the global commercial air transport industry
21,000
23,000
25,000
27,000
29,000
31,000
33,000
35,000
37,000
39,000
41,000
2011 2012 2013 2014 2015 2016 2017 2018 2019 2020 2021 2022 2023 2024 2025 2026 2027
The commercial air transport fleet is forecast to increase by 10,133 aircraft over the next 10 years driving the $72.1B commercial air transport MRO market to go grow at an average annual rate of 3.7% per year, topping out at $103.8B in 2027
Source: Oliver Wyman Global Commercial Air Transport Fleet & MRO Market Forecasts
50
60
70
80
90
100
110
120
130
2011 2012 2013 2014 2015 2016 2017 2018 2019 2020 2021 2022 2023 2024 2025 2026 202750
60
70
80
90
100
110
120
130
2011 2012 2013 2014 2015 2016 2017 2018 2019 2020 2021 2022 2023 2024 2025 2026 2027$50
$60
$70
$80
$90
$100
$110
$120
$130
2011 2012 2013 2014 2015 2016 2017 2018 2019 2020 2021 2022 2023 2024 2025 2026 2027$50
$60
$70
$80
$90
$100
$110
$120
$130
2011 2012 2013 2014 2015 2016 2017 2018 2019 2020 2021 2022 2023 2024 2025 2026 2027
Number of Aircraft
Billions of US Dollars Best/Worst Case Alternate
Scenarios Likely Case Alternate Scenarios
Historical MRO Forecast MRO
Best/Worst Case Alternate Scenarios
Likely Case Alternate Scenarios
Historical Fleet Forecast Fleet

9 © Oliver Wyman
Global Commercial Air Transport Fleet Age by Aircraft Class
Global Commercial Air Transport Retirement Forecast by Aircraft Vintage
Even though many have altered fleet plans to take advantage of current market conditions, the number of aircraft removed from the fleet is expected to reach historic levels over the next 10 years
Approximately 40% of the in-service fleet is forecast to retire by 2027, reducing the average age of the in-service fleet to 9.7
Number of Aircraft
0
200
400
600
800
1,000
1,200
2017 2018 2019 2020 2021 2022 2023 2024 2025 20267
8
9
10
11
12
13
14
15
16
17
2017 2018 2019 2020 2021 2022 2023 2024 2025 2026 2027
Turboprop Overall Regional Jet Widebody Narrowbody
Number of Years 1980’s 1970’s 1990’s 2000’s 2010’s
Source: Oliver Wyman Global Commercial Air Transport Fleet Forecast

Bulls, Bears, Swans, and… Elephants 2

11 © Oliver Wyman
Let’s talk about the
BLACK ELEPHANT in the room

12 © Oliver Wyman
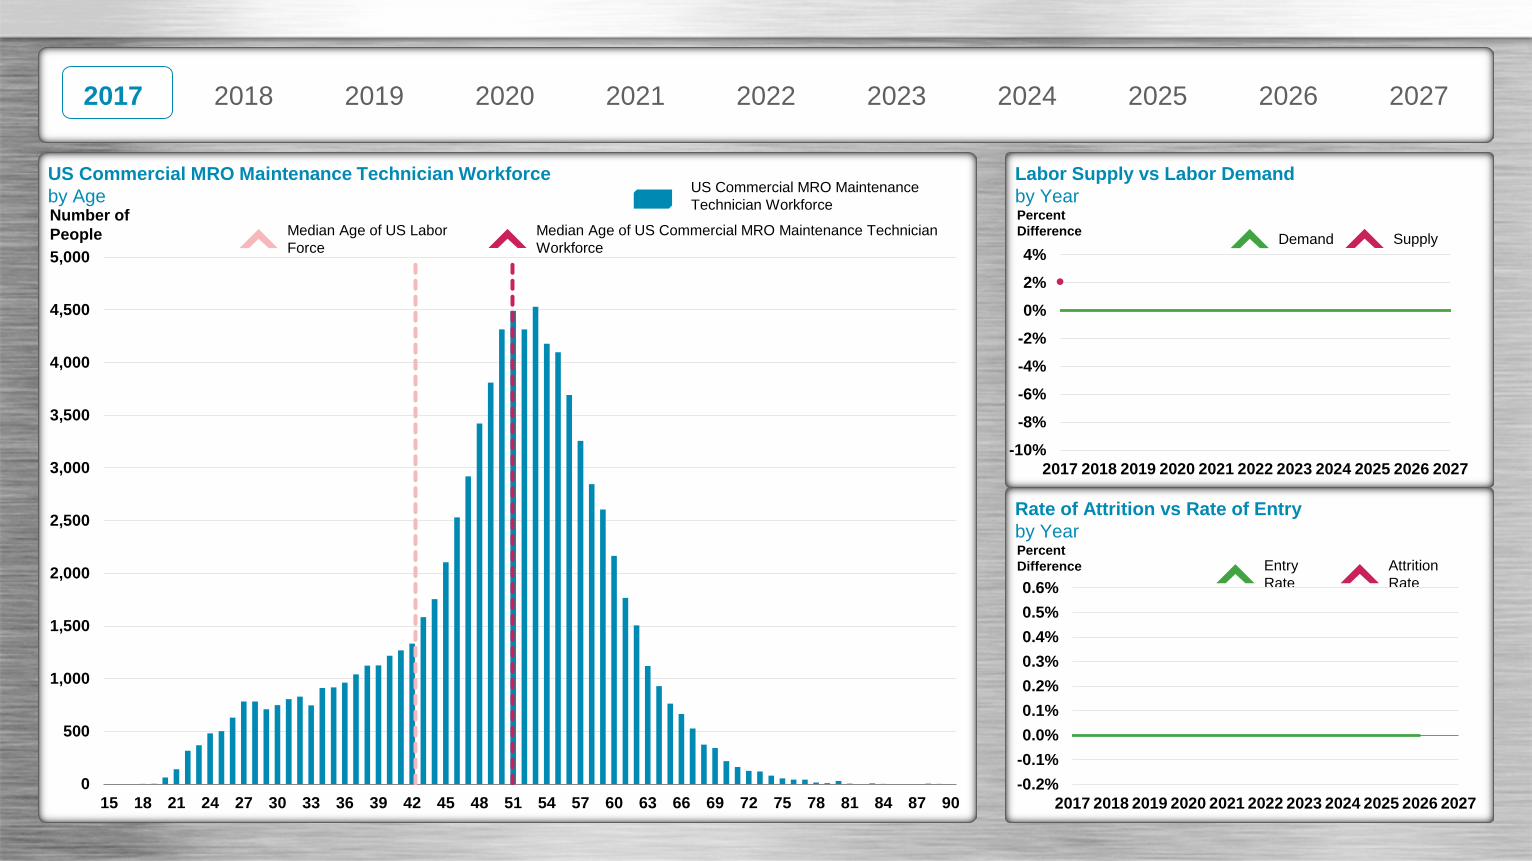
US Commercial MRO Maintenance Technician Workforce by Age
The US commercial MRO workforce is comprised of approximately 86,000 maintenance technicians with a median age of 51, nearly 9 years older than the median age of the US labor force
0
1,000
2,000
3,000
4,000
5,000
6,000
15 18 21 24 27 30 33 36 39 42 45 48 51 54 57 60 63 66 69 72 75 78 81 84 87 90
Number of People
With a record number of maintenance technicians becoming eligible for retirement, US commercial MRO providers will face an increasingly difficult challenge over the next 10 years
US Commercial MRO Maintenance Technician Workforce
Median Age of US Commercial MRO Maintenance Technician Workforce
Median Age of US Labor Force
Source: A4A Members, Other US Airlines, US MROs, BLS, FAA, Oliver Wyman Analysis

13 © Oliver Wyman
95%
In fact, the Oliver Wyman 2017 MRO Survey found that 95% of respondents in North America are already experiencing labor imbalances, choosing to mitigate shortcomings primarily through the use of overtime / internal productivity and efficiency strategies, and internal training to expand skill sets
Q: What stop-gap strategies is your organization using to temporarily address labor challenges?*
Percent of organizations using stop-gap strategies to temporarily address labor challenges:*
Over the long term, reliance on large amounts of overtime is costly, can reduce overall productivity, and unsustainable
Overtime / internal productivity and efficiency strategies
Internal training to expand worker skill sets
Certification programs to expand worker skill sets
External training to expand worker skill sets
Outsourcing
Job sharing
Hiring foreign workers
Other
85%
80%
35%
35%
30%
15%
5%
10%
Source: Oliver Wyman 2017 MRO Survey | *Responses filtered to North American respondents only

14 © Oliver Wyman
Q: Are there internal or external factors that are affecting your company’s ability to recruit maintenance technicians?*
Q: Versus today, do you expect recruiting maintenance technicians to get more difficult over the next 3 years?*
Notwithstanding current labor imbalances, the MRO Survey found that 95% of respondents in North America plan on hiring to increase or maintain headcount over the next three years, and the same percent of respondents agree that recruiting will become even more difficult than it is today
Yes, it will get more difficult
It will be about the same 5%
95%
Lack of labor supply, heavy competition, and concern about wages / benefits being offered to potential maintenance technician candidates could hinder plans for growth and indicate tightening in the commercial MRO labor market is underway
90% Lack of Supply (external factor)
Heavy Competition (external factor)
Wages / Benefits (internal factor)
67%
48%
Source: Oliver Wyman 2017 MRO Survey | *Responses filtered to North American respondents only
33% Cost of Living at Maintenance Facility Locations | 24% Recruitment Policy / Recruitment Marketing 19% Low Unemployment Rate | 10% Poor Manpower Planning | 10% Small Size of the Organization 5% Political / Social / Legal Environment | 5% High Cost of Recruitment | 5% Company Image
15 © Oliver Wyman
US Commercial MRO Maintenance Technician Workforce by Age
Labor Supply vs Labor Demand by Year
Rate of Attrition vs Rate of Entry by Year
0
500
1,000
1,500
2,000
2,500
3,000
3,500
4,000
4,500
5,000
15 18 21 24 27 30 33 36 39 42 45 48 51 54 57 60 63 66 69 72 75 78 81 84 87 90
Number of People
Percent Difference
Percent Difference
US Commercial MRO Maintenance Technician Workforce
Median Age of US Commercial MRO Maintenance Technician Workforce
Median Age of US Labor Force Supply Demand
Attrition Rate
Entry Rate
2017 2018 2019 2020 2021 2022 2023 2024 2025 2027 2026
-0.2%-0.1%0.0%0.1%0.2%0.3%0.4%0.5%0.6%
2017 2018 2019 2020 2021 2022 2023 2024 2025 2026 2027
-10%
-8%
-6%
-4%
-2%
0%
2%
4%
2017 2018 2019 2020 2021 2022 2023 2024 2025 2026 2027

16 © Oliver Wyman
US Commercial MRO Maintenance Technician Workforce by Age
Labor Supply vs Labor Demand by Year
Rate of Attrition vs Rate of Entry by Year
0
500
1,000
1,500
2,000
2,500
3,000
3,500
4,000
4,500
5,000
15 18 21 24 27 30 33 36 39 42 45 48 51 54 57 60 63 66 69 72 75 78 81 84 87 90
Number of People
Percent Difference
Percent Difference
-0.2%-0.1%0.0%0.1%0.2%0.3%0.4%0.5%0.6%
2017 2018 2019 2020 2021 2022 2023 2024 2025 2026 2027
-10%
-8%
-6%
-4%
-2%
0%
2%
4%
2017 2018 2019 2020 2021 2022 2023 2024 2025 2026 2027
2017 2018 2019 2020 2021 2022 2023 2024 2025 2027 2026
US Commercial MRO Maintenance Technician Workforce
Median Age of US Commercial MRO Maintenance Technician Workforce
Median Age of US Labor Force Supply Demand
Attrition Rate
Entry Rate

Moore Changes Required 3

18 © Oliver Wyman
Q: Which of the following game changing technologies for the shop / hangar floor are you planning on implementing within the next 3 years?
The maintenance technician shortage will make performing maintenance at just the right time, and as efficiently as possible more important than it ever has been
Paperless Shops / Hangars Predictive Maintenance Virtual Maintenance Training Drone / Robot Supported Maintenance Smart Sensors (SansEC Sensing)
More than three quarters of MRO Survey respondents plan on implementing paperless shops/hangars and predictive maintenance over the next three years – technologies aimed at increasing technician efficiency and productivity and maximizing aircraft availability
82% 77% 32% 18% 9%
Source: Oliver Wyman 2017 MRO Survey

19 © Oliver Wyman
Q: Select the top three (3) problems facing your IT systems today:
While respondents express interest in predictive maintenance, big data, and advanced analytics, there is limited evidence so far as to the benefits, largely due to the industry being plagued with major inefficiencies and a lack of innovation when it comes to information technology
Lack of Functionality
Regulatory Compliance
Flexibility Data Quality / Integrity
Cost Constrained by Old Technology
Training / User Adoption
Other There Are No Problems
54%
23%
31% 35%
46%
62%
35%
0% 0%
2016 MRO Survey
2017 MRO Survey
Aircraft designed in 2017 are being maintained by systems designed in 1970 and it’s starting to show Source: Oliver Wyman 2016 MRO Survey, Oliver Wyman 2017 MRO Survey

20 © Oliver Wyman
Q: Indicate which new technologies your company is planning to deploy in the next three (3) years?
Adaptability to Technological Change Astro Teller Illustrative Graphic
Today, the rate of technological change is accelerating so fast that it has risen above the average rate at which our industry can adapt to change, preventing us from fully benefiting from all of the new technology that is coming along
This is evident by the fact that the new technologies planning on being deployed over the next 3 years are RFID and wearable and/or handheld devices such as tablets – technologies other industries adapted to several years ago
Rate of Change
We are here
Industry’s ability to adapt to change
Technological Change
Time
RFID
Wearable and/or Handheld Devices
Barcoding
Composite Repair Capabilities
68%
68%
40%
36%
28% New Repair Technology | 24% Additive Manufacturing | 20% Artificial Intelligence (Machine Learning) | 20% Robotics | 12% Drone-Supported Maintenance
Source: Oliver Wyman 2017 MRO Survey

21 © Oliver Wyman
Most have recognized that they are behind the technology curve and plan to make significant changes to their IT systems over the next few years
Q: Indicate which IT systems have a migration or major upgrade planned within the next three (3) years?
An ever aging IT infrastructure, competing for limited resources, needs to be given higher priority because not only is the fleet getting larger, it is becoming more technologically advanced - fast
Engineering Human Resource Management
Supply Chain Planning Heavy Maintenance
Engine / Component Shop
Maintenance
Line Maintenance Technical Services Finance
68%
18%
50%
41%
55% 50%
23%
50%
23%
Source: Oliver Wyman 2016 MRO Survey, Oliver Wyman 2017 MRO Survey
2016 MRO Survey
2017 MRO Survey

22 © Oliver Wyman
Most have recognized that they are behind the technology curve and plan to make significant changes to their IT systems over the next few years
Q: Indicate which IT systems have a migration or major upgrade planned within the next three (3) years?
An ever aging IT infrastructure, competing for limited resources, needs to be given higher priority because not only is the fleet getting larger, it is becoming more technologically advanced - fast
Engineering Human Resource Management
Supply Chain Planning Heavy Maintenance
Engine / Component Shop
Maintenance
Line Maintenance Technical Services Finance
68%
18%
50%
41%
55% 50%
23%
50%
23%
Source: Oliver Wyman 2016 MRO Survey, Oliver Wyman 2017 MRO Survey
2016 MRO Survey
2017 MRO Survey
41%
Q: Is the portion of your IT budget devoted to upgrading old systems or implementing brand new systems sufficient to meet your company’s challenges and needs?
Try again
52% Yes
48% No

The Lean, Digitally Mean Airline Fleet of the Future Takes Off
4

24 © Oliver Wyman
0
5,000
10,000
15,000
20,000
25,000
30,000
35,000
40,000
2017 2018 2019 2020 2021 2022 2023 2024 2025 2026 20270
500
1,000
1,500
2,000
2,500
2017 2018 2019 2020 2021 2022 2023 2024 2025 2026
Global Commercial Air Transport Fleet Forecast by Aircraft Vintage
Global Commercial Air Transport Delivery Forecast by Aircraft Vintage
As the in-service fleet grows to over 35,000 by 2027, the rapid deployment of aircraft incorporating next generation technology will be the primary agent of change
Dealing with the technological shift in the fleet will be an enormous challenge as the new fleets will bring new complexity to the market and further change the skill requirements of the workforce maintaining the fleet
Number of Aircraft
Number of Aircraft 1980’s 1970’s 1990’s 2000’s 2010’s
0
5,000
10,000
15,000
20,000
25,000
30,000
35,000
40,000
2017 2018 2019 2020 2021 2022 2023 2024 2025 2026 2027
1980’s 1970’s 1990’s 2000’s 2010’s
0
500
1,000
1,500
2,000
2,500
2017 2018 2019 2020 2021 2022 2023 2024 2025 2026
Source: Oliver Wyman Global Commercial Air Transport Fleet Forecast

25 © Oliver Wyman
End of Life / End of Lease Value Creation Q: What tools do you use to manage the end-of-life?
Moreover, the sheer number of retirements over the next 10 years will strain the Excel based processes and methods most use to manage the last six to twelve months of an aircraft’s useful life. This approach narrows down the options available to optimize use and can also be a recipe for wasting millions of dollars
Microsoft Excel
Cost Analysis
Market Supply Analysis
Simulation-based Models
68%
60%
33%
30%
20% Third-party analysis | 5% Other
Holistic portfolio optimization
LLP matching
Module swapping
Intelligent engine swapping
Enhanced engine building and sequencing
Optimal short-term lease usage
0-20 21-50 51+
>2M
1M
0
Savings per aircraft:
End of life planning needs to move into the digital age – utilizing integrated, holistic modeling approach and big data tools and techniques to fully account of the complexity of aircraft with different requirement requirements
Source: Oliver Wyman 2015 MRO Survey, Oliver Wyman Large Asset End of Life Optimization Model

█ The industry has passed the peak of this current financial cycle.
█ The aging of the mechanic workforce and rash of anticipated retirements could not come at a worse time for the industry.
█ An ever aging IT infrastructure, competing for increasingly limited resources, needs to be given higher priority.
█ The sheer number of retirements over the next 10 years will strain the processes and methods currently use to manage the end an aircraft’s useful life. End of life planning needs to move into the digital age.
It’s time to break free of antiquated thinking, processes, and systems holding us back from fully benefiting from new technologies.

27 © Oliver Wyman
Related content
2017-2027 FLEET AND MARKET FORECAST A 10-year outlook for the commercial airline transport fleet and the associated maintenance, repair, and overhaul (MRO) market.
2016-2017 AIRLINE ECONOMIC ANALYSIS In its eighth year, this report covers a range of aviation industry-specific economic and performance data as well as global capacity growth by region.
MOBILITY 2040: STAYING AHEAD OF DISRUPTION Our new research study of emerging trends and the future of passenger transport.
2017 MRO SURVEY FINDINGS In its second decade, the annual MRO survey samples a range of executives from across the aviation industry addressing key trends and emerging issues in the MRO sector.
