clinical leader professional certificate
TRANSCRIPT
Clinical Leader Professional Certificate
2021
Dear Student/Participants,
Please find the York University copyright statement. This is an annual reminder to all students about the copyright policy of the University.
Access to and use of the course materials is restricted to students enrolled in the Clinical Leader Professional Certificate course offered by Health Leadership & Learning Network. All materials for this course are provided with the permission of the rights holder, under the terms of a license or other agreement, or under the application of statutory exceptions of the Copyright Act. Copyright and all rights are maintained by the author(s) or by other copyright holder(s). Copying this material for distribution (e.g. uploading material to a commercial third-party website) can lead to a violation of Copyright law. Find out more about copyright here: www.yorku.ca/copyright
If you have any questions, please contact us here in HLLN at 416 736 2100 X22170 or [email protected]. Thank you, Tania Xerri
____________________________________
Tania Xerri, Director, Health Leadership and Learning Network A Leader in Health Continuing Professional Education Faculty of Health York University 4700 Keele St. HNES 019, Toronto, ON M3J 1P3
Information, Privacy and Copyright | Office of the Counsel 1050 Kaneff Tower | York University | 4700 Keele St., Toronto ON M3J 1P3
Canada
Jacquie is a capable, objective, and collaborative Nursing Professional who has proven senior
management experience focused on provision of safe, patient and family-centred care. She has a
strong background in privacy and quality initiatives in the broader health sector, including
community health, long term care, and hospital settings. She has been a Surveyor for CARF aging
services accreditation since 2015, a role in which she continues to develop her strong interpersonal,
communication and facilitation skills to promote client-centered services. Jacquie is currently a
Quality Specialist at the Mount Hope Centre for Long Term Care location of St. Josephs’ Health Care
in London, ON.
Jacquie Logan-Stephens RN, BScN, MHS

1. Overview of QualityImprovement
Jacquie Logan-Stephens
February 16, 2021
1
Overview of Quality Improvement (QI)– Learning Objectives
• Define quality
• Define Healthcare Quality Improvement
• Understand the history of Healthcare Quality Improvement
• Describe the six dimensions of the Institute of Medicine framework related to QI• Describe the Triple AIM and Quadruple Aim as the target for improvement efforts
• Introduction to Lean
• Introduction to Quality Improvement Plans (QIP)
2
What is “quality”?
Dictionary
the standard of something as measured against other things of a similar kind; the degree of excellence of something
A distinguishing attribute
3
Quality Improvement (QI)
• Science developed over the past few decades by Dr. W. Edwards Deming and Dr. JosephDuran
• Promoted by Dr. Donald Berwick of the Institute for Healthcare Improvement
4
Healthcare Quality Improvement
• Definition:
“A broad range of activities of varying degrees of complexity and methodological and statisticalrigour through which healthcare providers develop, implement and assess small-scale interventions, identify those that work well and implement them more broadly in order to improve clinical practice.”
The Ethics of Improving Health Care Quality & Safety: A Hastings Center/AHRQ Project, 2004
5
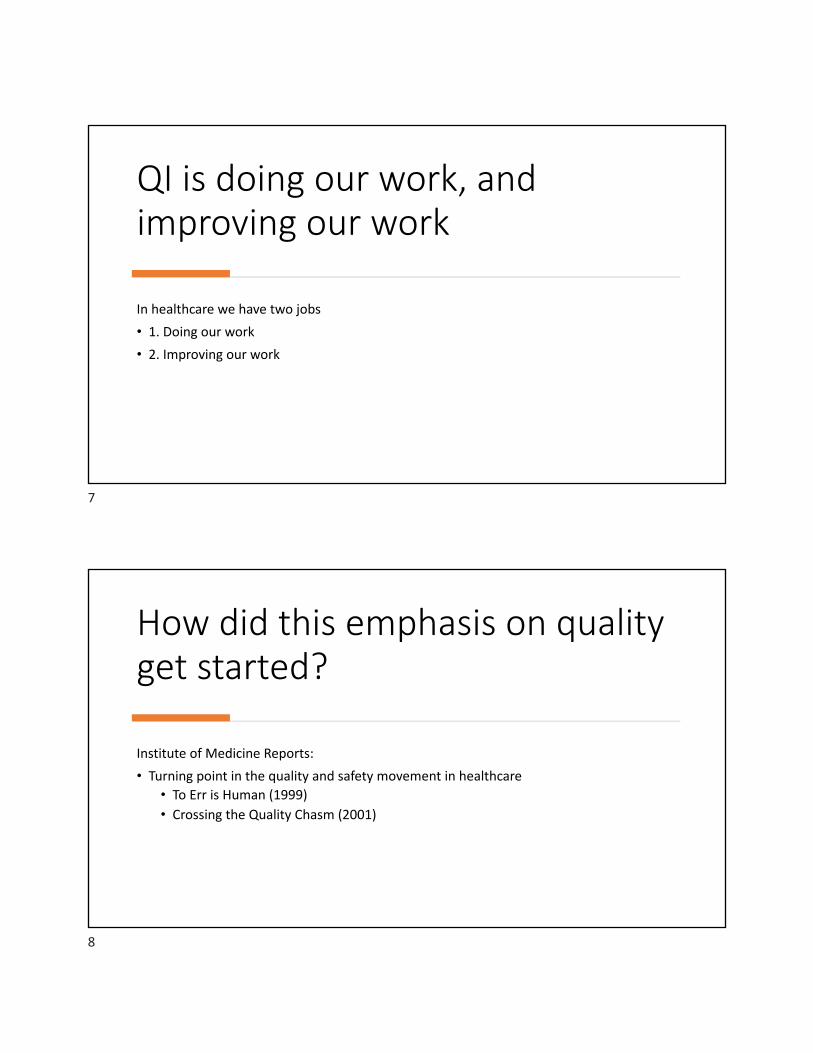
Why do we need QI?
“Here is Edward Bear, coming downstairs now, bump, bump, bump, on the back of his head, behind Christopher Robin. It is, as far as he knows, the only way of coming downstairs, but sometimes he feels that there really is another way, if only he could stop bumping for a moment and think of it”
A.A. MilneIllustration E.H. Shepard
6
QI is doing our work, and improving our work
In healthcare we have two jobs• 1. Doing our work• 2. Improving our work
7
How did this emphasis on quality get started?
Institute of Medicine Reports:• Turning point in the quality and safety movement in healthcare
• To Err is Human (1999)• Crossing the Quality Chasm (2001)
8

To Err is Human
• When extrapolated to the over 33.6 million admissions to U.S. hospitals in 1997, theresults of the study in Colorado and Utah imply that at least 44,000 Americans die eachyear as a result of medical errors. The results of the New York Study suggest the numbermay be as high as 98,000. Even when using the lower estimate, deaths due to medicalerrors exceed the number attributable to the 8th-leading cause of death. More people diein a given year as a result of medical errors than from motor vehicle accidents (43,458),breast cancer (42,297), or AIDS (16,516)
9
# Current State Future State1 Care is based primarily on visits Care is based on continuous healing relationships2 Professional autonomy drives variability Care is customized according to patients’ needs and
values3 Professionals control care The patient is the source of control4 Information is a record Knowledge is shared freely5 Decision making is based on training and
experienceDecision making is based on evidence
6 “Do no harm” is an individual responsibility Safety is a system property
7 Secrecy is necessary Transparency is necessary8 The system reacts to needs Needs are anticipated9 Cost reduction is sought Waste is continuously decreased10 Preference is given to professional roles
over the systemCooperation among clinicians is a priority
10
Dimensions of healthcare quality
Institute of medicine• Effective• Safe• Patient-Centred• Equitable• Efficient• Timely
Health Quality Ontario• Effective• Safe• Patient-Centred• Equitable• Efficient• Accessible• Appropriately resourced• Integrated• Focused on population health
11
Six Dimensions of Healthcare Quality
Effective• Providing services based on
scientific knowledge to all whocould benefit and refrainingfrom providing services to thosenot likely to benefit (avoidingunderuse and misuse,respectively)
12
Six Dimensions of Healthcare Quality
Safe• Avoiding harm to patients from
the care that is intended to helpthem
13
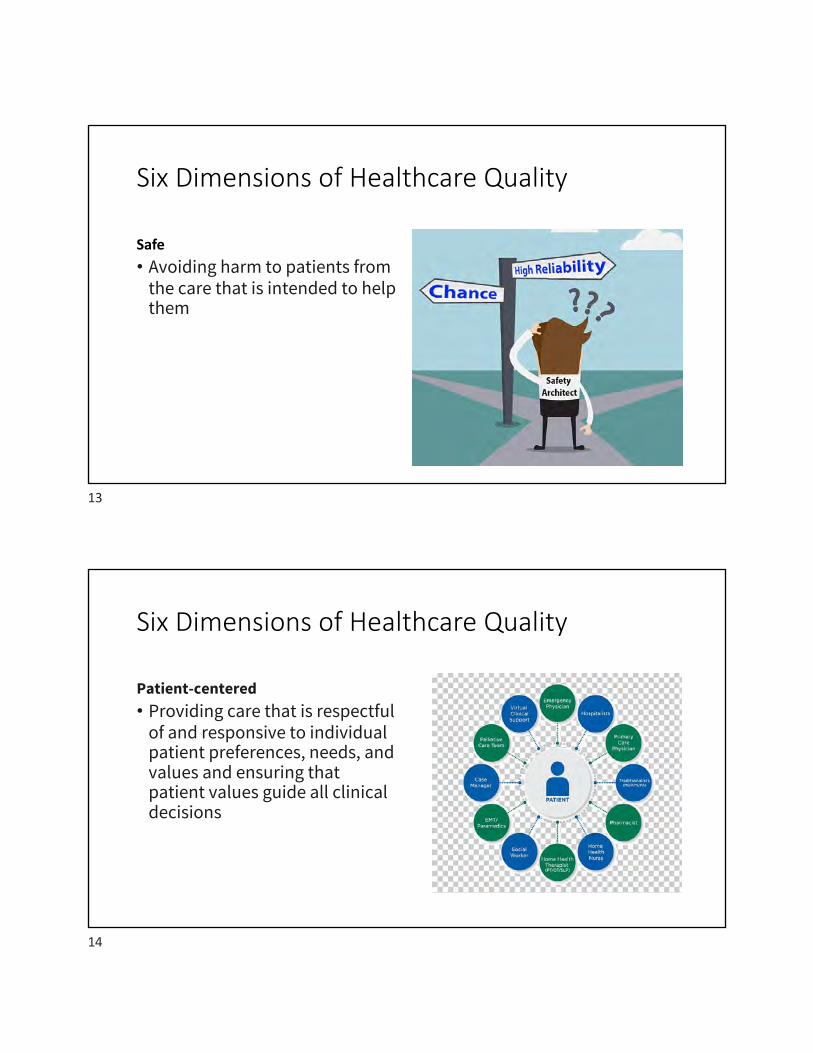
Six Dimensions of Healthcare Quality
Patient-centered• Providing care that is respectful
of and responsive to individualpatient preferences, needs, andvalues and ensuring thatpatient values guide all clinicaldecisions
14
Six Dimensions of Healthcare Quality
Timely• Reducing waits and sometimes
harmful delays for both those who receive and those who give care
15
Six Dimensions of Healthcare Quality
Efficient• Avoiding waste, including waste
of equipment, supplies, ideas, and energy
16
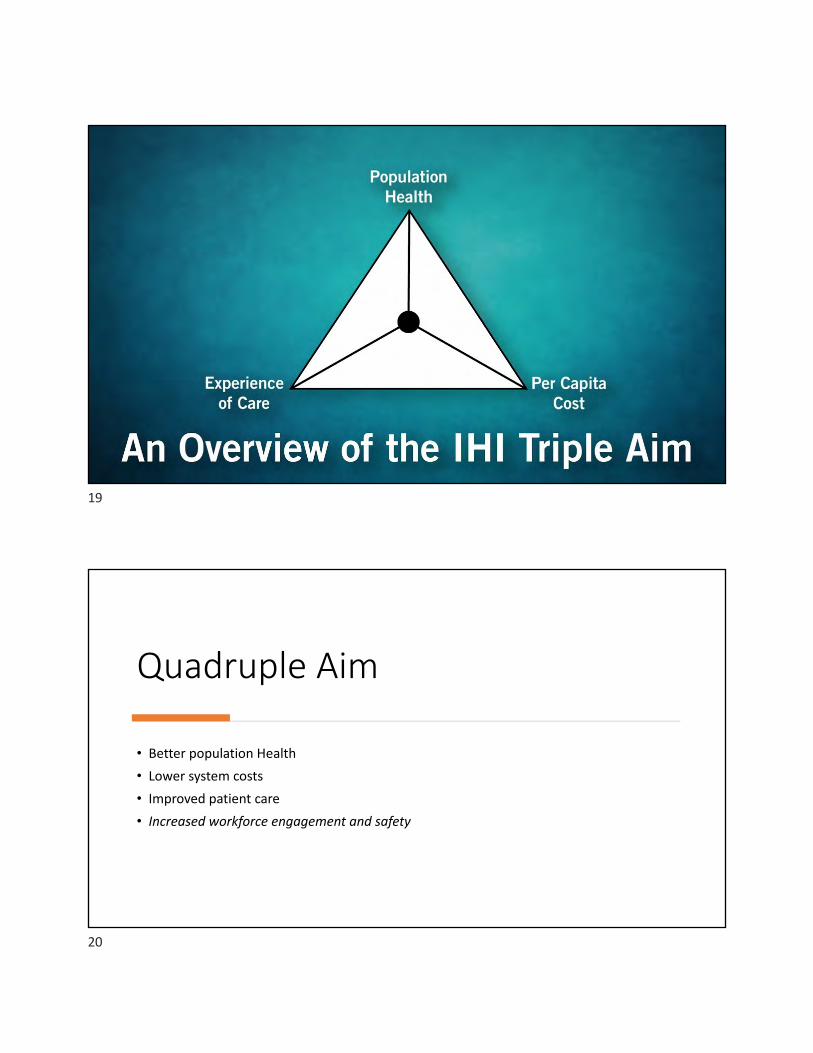
Six Dimensions of Healthcare Quality
Equitable• Providing care that does not
vary in quality because ofpersonal characteristics such asgender, ethnicity, geographiclocation, and socioeconomicstatus.
17
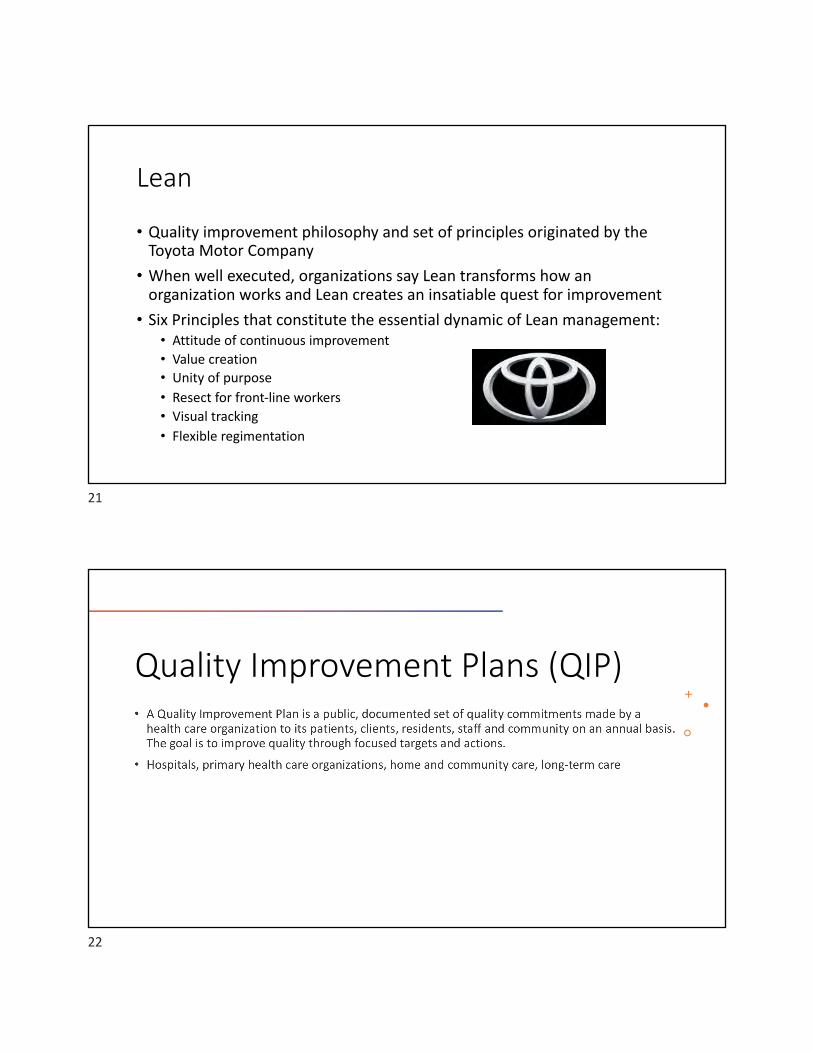
IHI Triple Aim (2012)
• The IHI Triple Aim is a framework developed by the Institute for HealthcareImprovement that describes an approach to optimizing health system performance. Itis IHI’s belief that new designs must be developed to simultaneously pursue threedimensions, which we call the “Triple Aim”:
• Improving the patient experience of care (including quality and satisfaction);• Improving the health of populations; and• Reducing the per capita cost of health care.
18
19
Quadruple Aim
• Better population Health• Lower system costs• Improved patient care• Increased workforce engagement and safety
20
Lean
• Quality improvement philosophy and set of principles originated by the Toyota Motor Company• When well executed, organizations say Lean transforms how an
organization works and Lean creates an insatiable quest for improvement• Six Principles that constitute the essential dynamic of Lean management:
• Attitude of continuous improvement• Value creation• Unity of purpose• Resect for front-line workers• Visual tracking• Flexible regimentation
21
Quality Improvement Plans (QIP)
22

Quality Improvement Plans (QIP) – 3 components
• Narrative• Progress Report• Workplan
üSubmitted by April 1 each year
23
Quality Improvement Plans (QIP) - Indicators
Mandatory indicators – hospital• # of incidents of workplace violence (overall)• Emergency department wait time to inpatient bedNew indicators• Repeat emergency visits for mental health (hospital sector)Indicators undergoing revisionRevised indicatorsRetired indicators
24
2. System Diagnostic Tools (what is the problem)
Jacquie Logan-StephensFebruary 17, 2021
1
All about tools – Learning Objectives
• Understand the importance of
measurement
• Data collection
• Introduce the Model for
Improvement
• Identify QI tools that assist in the
determination of root or system cause:
• 5 Ws and 2 Hs
• Affinity Diagram/Brainstorming
• Cause and Effect Diagram (Ishikawa)
• Pareto Diagram
• 5 Whys
• Process Map
2
Measurement and use of data for improvement
We can only be sure to improve what we can actually measure
• Lord Darzi, High Quality Care for All, June 2008
3
Measurement
If you can’t measure it – you can’t understand it….….If you can’t understand it, you can’t control it…..….If you can’t control it, you can’t improve it.
H. James Harrington
4
Measurement
• What does “good” look like?• How do we know what an improvement looks like?• How do we know if a change in process is an improvement?• How do we know when we’ve had a good day?• Week? Month? Year?
5
Measurement
• Allows you to challenge assumptions• Removes some emotion from making decisions• Directs behaviour• Improves decision making• Provides you with early warning signs• Enables prediction
6
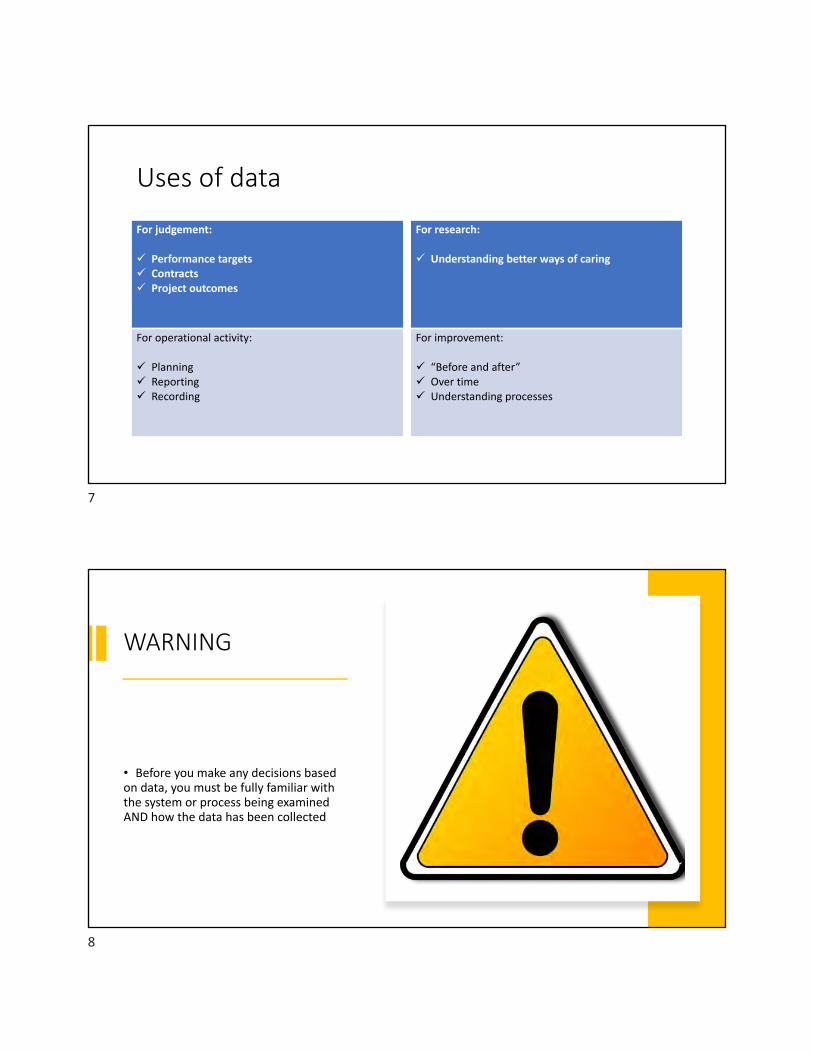
Uses of data
For judgement:
ü Performance targetsü Contractsü Project outcomes
For operational activity:
ü Planningü Reportingü Recording
For research:
ü Understanding better ways of caring
For improvement:
ü “Before and after”ü Over timeü Understanding processes
7
WARNING
• Before you make any decisions based on data, you must be fully familiar with the system or process being examined AND how the data has been collected
8
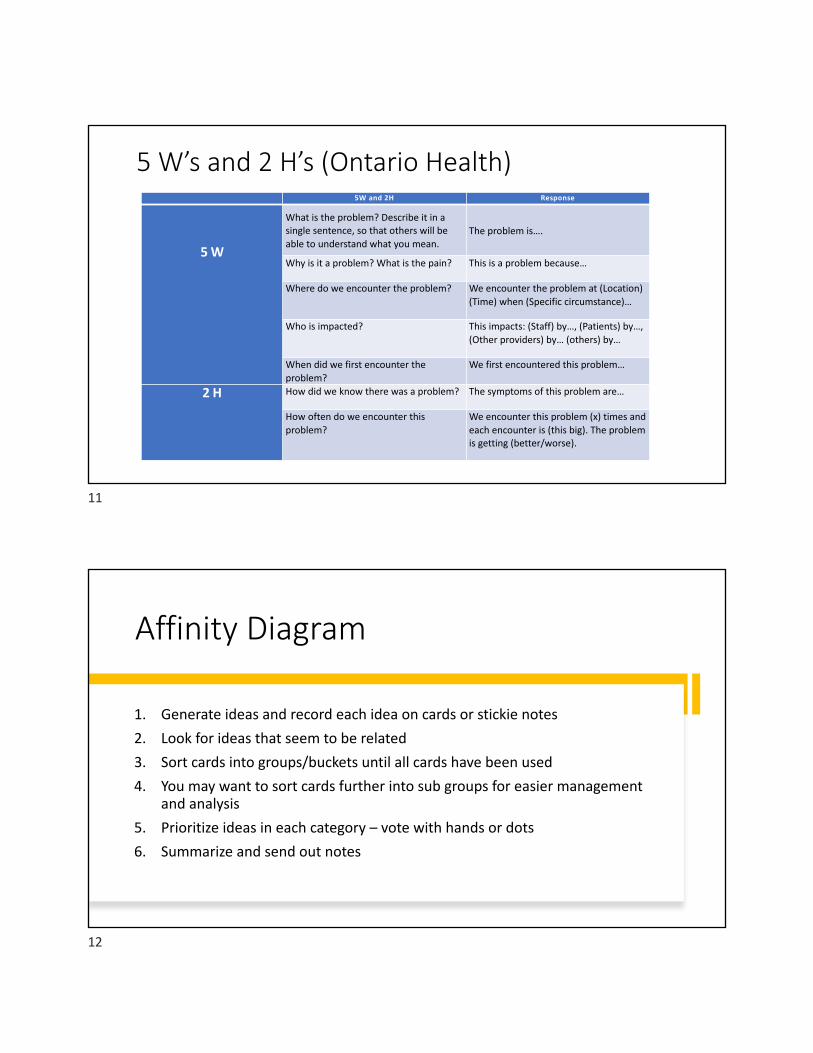
Model for Improvement
Source: Langley GL, Nolan KM, Nolan TW, et al. The improvement guide: a practical approach to enhancing organizational performance. San Francisco: Jossey-Bass; 1996.
* The Plan-Do-Study-Act cycle was developed by W. Edwards Deming. [Deming WE. The new economics for industry, government, education. Cambridge: Massachusetts Institute of Technology; 1994.]
9
5Ws and 2Hs…Symptom vs problem
• When starting an improvement initiative, it is important to step back and reflect on your current situation. Use the 5W2H questions to ensure you have uncovered all key information that is contributing to the problem area of focus.
10
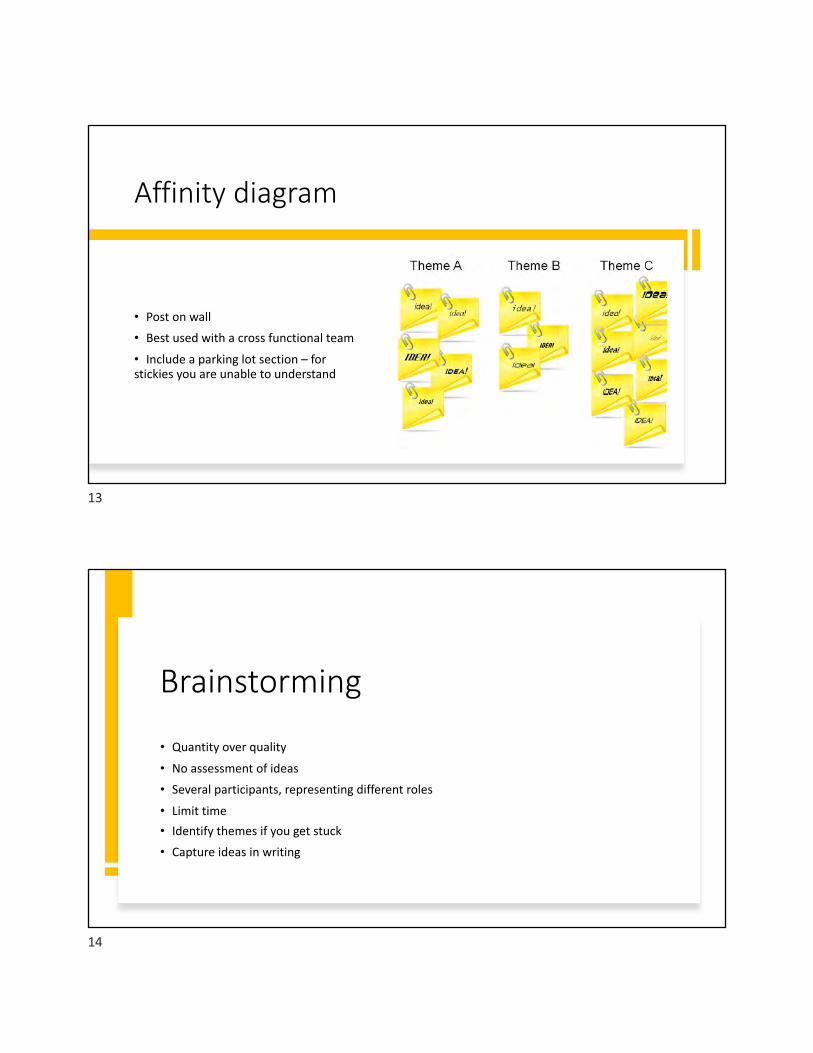
5 W’s and 2 H’s (Ontario Health)5W and 2H Response
5 W
What is the problem? Describe it in a single sentence, so that others will be able to understand what you mean.
The problem is….
Why is it a problem? What is the pain? This is a problem because…
Where do we encounter the problem? We encounter the problem at (Location) (Time) when (Specific circumstance)…
Who is impacted? This impacts: (Staff) by…, (Patients) by…, (Other providers) by… (others) by…
When did we first encounter the problem?
We first encountered this problem…
2 H How did we know there was a problem? The symptoms of this problem are…
How often do we encounter this problem?
We encounter this problem (x) times and each encounter is (this big). The problem is getting (better/worse).
11
Affinity Diagram
1. Generate ideas and record each idea on cards or stickie notes2. Look for ideas that seem to be related3. Sort cards into groups/buckets until all cards have been used4. You may want to sort cards further into sub groups for easier management
and analysis5. Prioritize ideas in each category – vote with hands or dots6. Summarize and send out notes
12
Affinity diagram
• Post on wall
• Best used with a cross functional team
• Include a parking lot section – for stickies you are unable to understand
13
Brainstorming
• Quantity over quality
• No assessment of ideas
• Several participants, representing different roles
• Limit time• Identify themes if you get stuck
• Capture ideas in writing
14

Cause & Effect Diagram aka Fishbone, Root Cause or Ishikawa diagram
• “Fish bone tool”
• A systematic and structured method for identifying where problems are occurring and potential solutions
• Classifies potential causes for a failure into separate categories• Very logical and analytical method for determining potential causes for failures
• Quantity important – not quality
• Post for front-line staff and families to contribute to – important to get everyone’s buy-in
15
Anatomy of a Fishbone Diagram
People Policy Procedures
EquipmentEnvironmentResources
Problem statement/effect
16
Cause and Effect
• After completing the diagram, review and analyze each element on the diagram
• Rank causes and prioritize actions
17
Pareto Chart
• The Pareto principle (aka the 80/20 rule, the law of the vital few) states that, for many events, 80% of the effects comes from 20% of the causes
• Helps teams see which causes or problems occur most frequently
• Helps to focus improvement efforts by:• Identifying root causes that make the
greatest contribution to the problem
How?• Calculating the cumulative contribution
(starting from greatest to smallest) of each possible cause
18
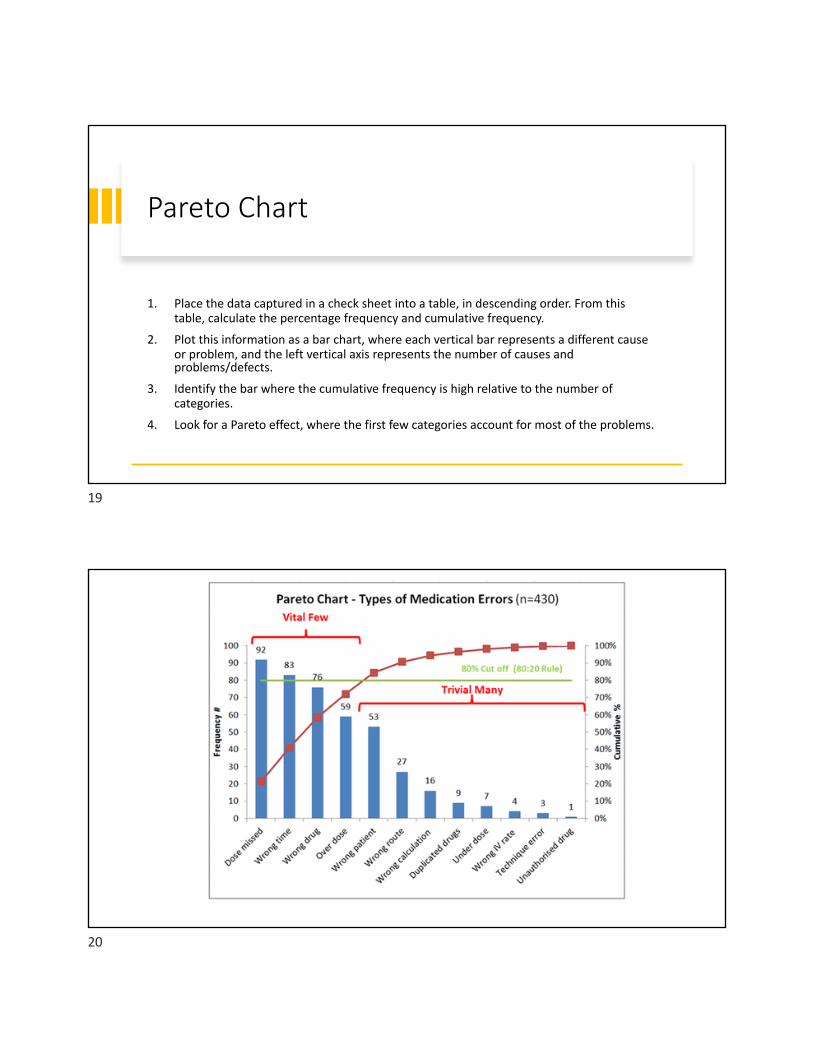
Pareto Chart
1. Place the data captured in a check sheet into a table, in descending order. From this table, calculate the percentage frequency and cumulative frequency.
2. Plot this information as a bar chart, where each vertical bar represents a different cause or problem, and the left vertical axis represents the number of causes and problems/defects.
3. Identify the bar where the cumulative frequency is high relative to the number of categories.
4. Look for a Pareto effect, where the first few categories account for most of the problems.
19
20
5 Whys
21
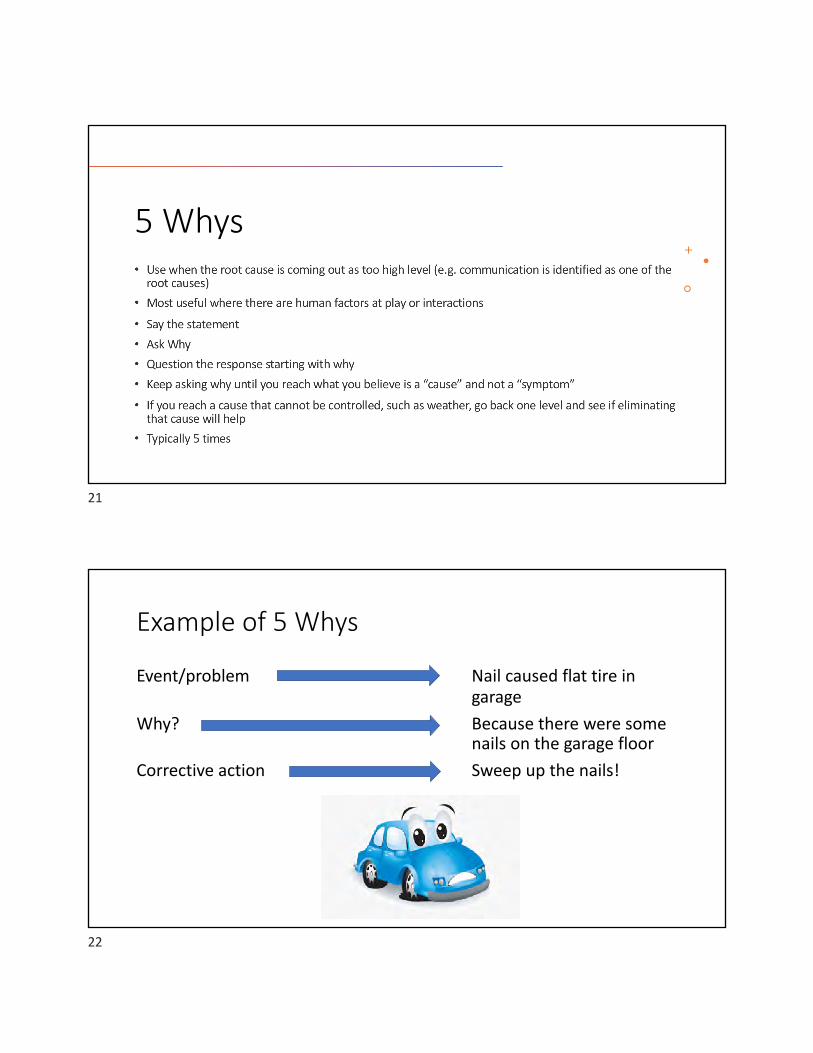
Example of 5 Whys
Event/problem Nail caused flat tire in garage
Why? Because there were some nails on the garage floor
Corrective action Sweep up the nails!
22
Correct Example of 5 Whys
Event/problem Car has a flat tire in the garage1. Why? Because there were some nails on the garage
floor2. Why? Because the box split3. Why? Because the box got wet4. Why? Because there was rain through a hole in the
garage roof5. Why? Because rain happens!
23
Integrating QI into everyone’s role
Integrating QI into everyone’s role is often perceived as challenging.
If so, why might that be?
24
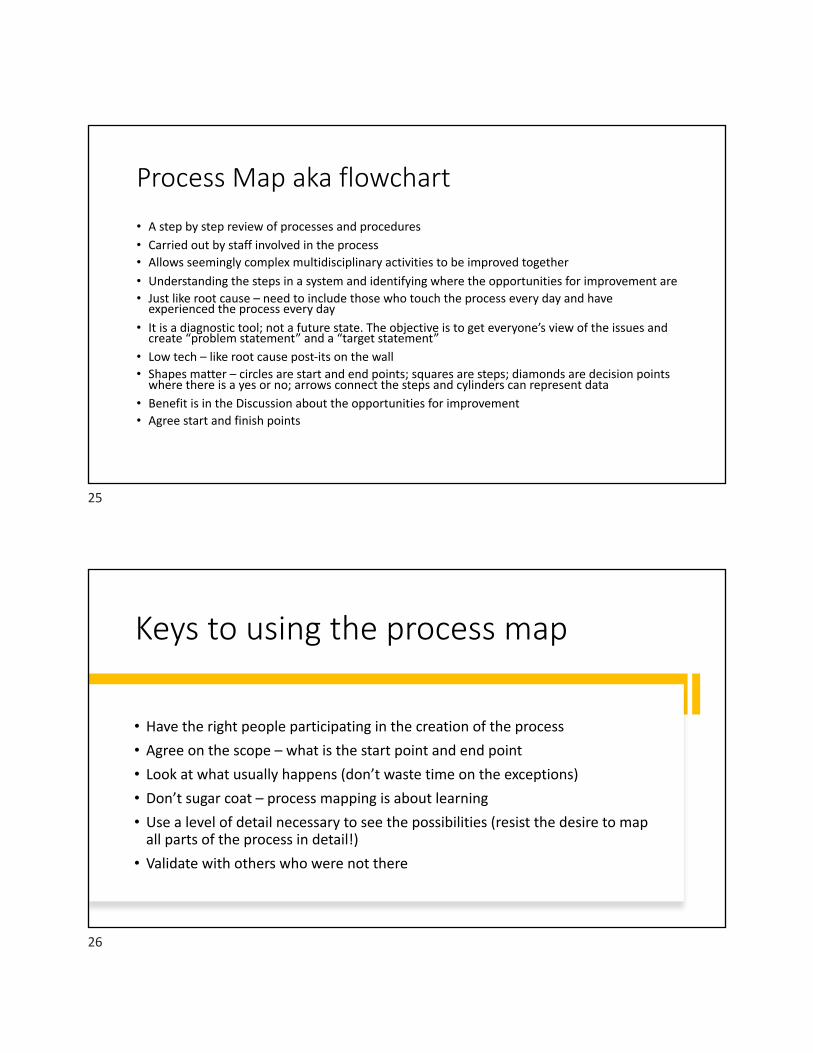
Process Map aka flowchart• A step by step review of processes and procedures• Carried out by staff involved in the process• Allows seemingly complex multidisciplinary activities to be improved together• Understanding the steps in a system and identifying where the opportunities for improvement are• Just like root cause – need to include those who touch the process every day and have
experienced the process every day• It is a diagnostic tool; not a future state. The objective is to get everyone’s view of the issues and
create “problem statement” and a “target statement”• Low tech – like root cause post-its on the wall• Shapes matter – circles are start and end points; squares are steps; diamonds are decision points
where there is a yes or no; arrows connect the steps and cylinders can represent data• Benefit is in the Discussion about the opportunities for improvement• Agree start and finish points
25
Keys to using the process map
• Have the right people participating in the creation of the process• Agree on the scope – what is the start point and end point• Look at what usually happens (don’t waste time on the exceptions)• Don’t sugar coat – process mapping is about learning• Use a level of detail necessary to see the possibilities (resist the desire to map
all parts of the process in detail!)• Validate with others who were not there
26
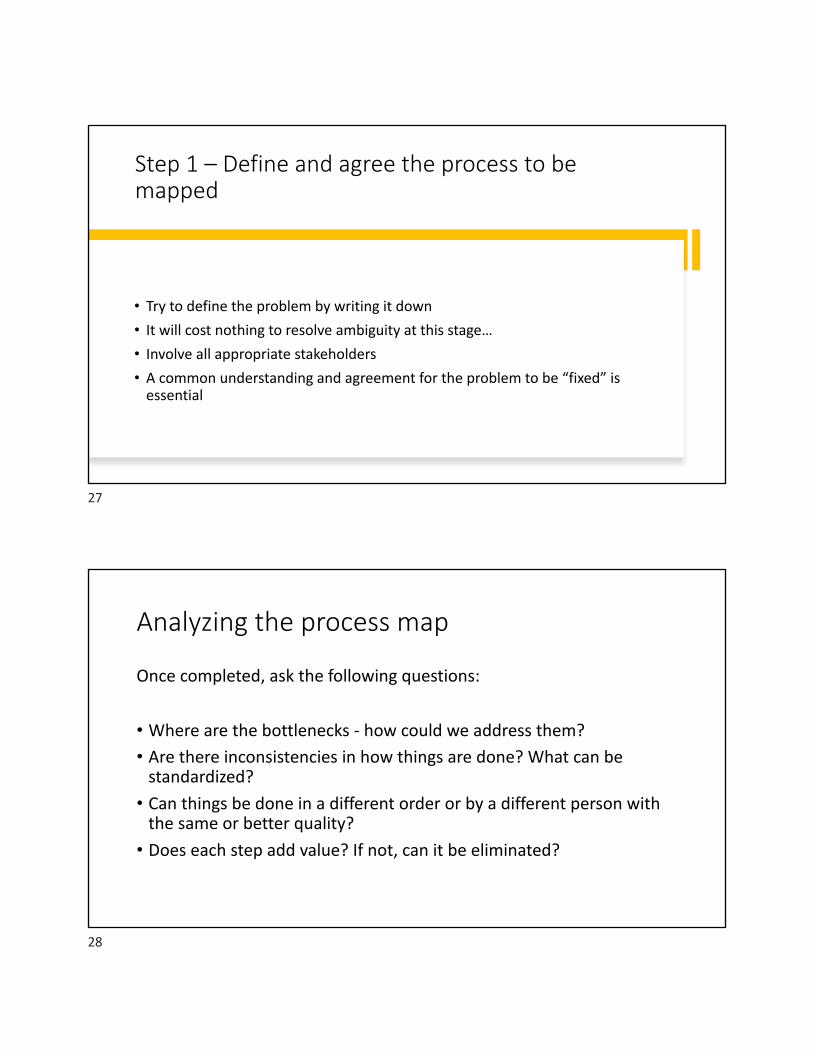
Step 1 – Define and agree the process to be mapped
• Try to define the problem by writing it down• It will cost nothing to resolve ambiguity at this stage…• Involve all appropriate stakeholders• A common understanding and agreement for the problem to be “fixed” is
essential
27
Analyzing the process map
Once completed, ask the following questions:
• Where are the bottlenecks - how could we address them?• Are there inconsistencies in how things are done? What can be
standardized?• Can things be done in a different order or by a different person with
the same or better quality?• Does each step add value? If not, can it be eliminated?
28

29
Exercise
• Choose one of the tools to practice development of a quality improvement challenge of your choice• 5 Ws and 2 Hs• Affinity Diagram/Brainstorming• Cause and Effect Diagram (Ishikawa)• Pareto Diagram• 5 Whys• Process Map
30
3. Building a QI Team Jacquie Logan-Stephens
February 18, 2021
1
Building a QI team – Learning Objectives
• Putting together a QI team• List Kotter’s eight steps of change• Understand Roger’s adoption curve
2
Recruiting your QI Team
1. Identify stakeholders2. Strategize stakeholder relations3. Describe roles needed for this QI initiative4. Select QI team
3
Identify Stakeholders
A stakeholder is:• Any person or group that can claim the project’s attention, resources or its deliverables,
or is affected by its output
• Stakeholders may or may not be part of your organization• Your QI project team will be a subset of your stakeholders
4
Identify Stakeholders of QI initiative
• Sponsors• Champions• Users• Advisors• Specialists
5
Identify Stakeholders
• Sponsors of QI initiative• Have authority• Validate project• Provide resources• E.g., CEO or executive director of
organization
• Champions of QI initiative• Passionate and enabling• Represent users• E.g., You!
6
Identify Stakeholders
• Users of QI initiative• Benefit from successful outcomes of QI project
• Directly or indirectly• Have authority• Includes pts and their families
• Advisors of QI initiative• Experts on subjects within the scope of the project• E.g., individual with QI experience
7
Identify Stakeholders
• Specialists for QI initiative• Have unique skills that contribute to products of the project• e.g., form designer, IT expert
8
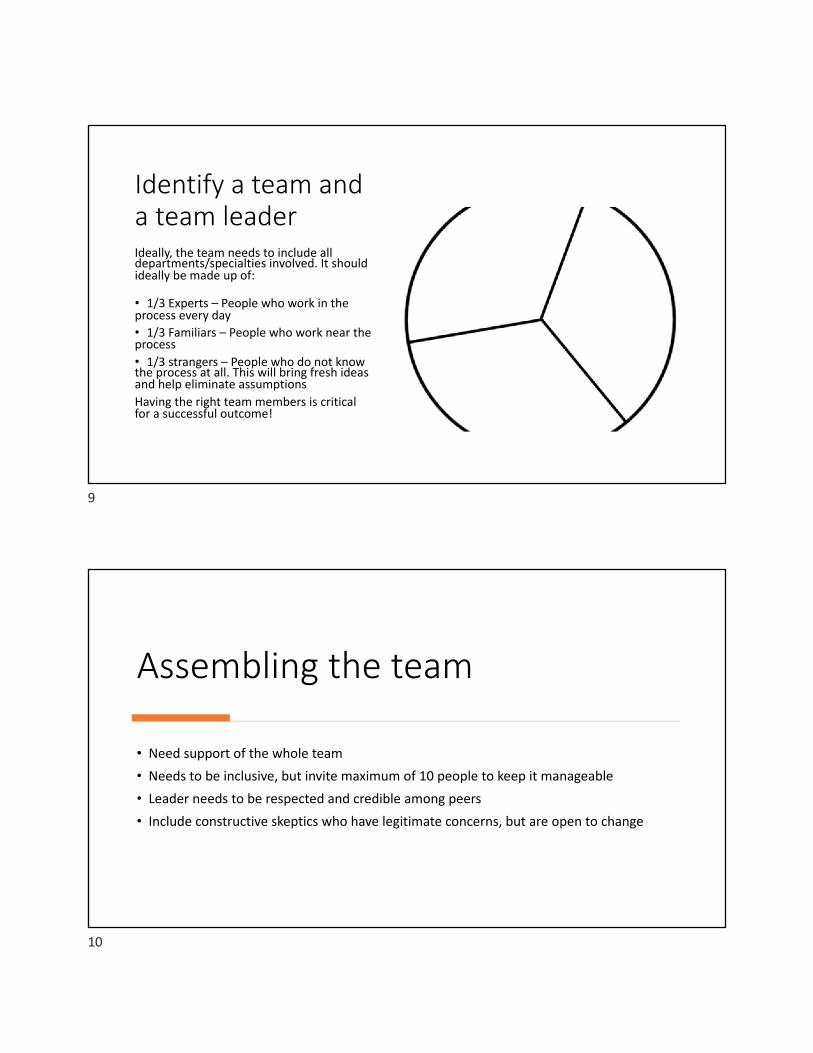
Identify a team and a team leaderIdeally, the team needs to include all departments/specialties involved. It should ideally be made up of:
• 1/3 Experts – People who work in the process every day• 1/3 Familiars – People who work near the process• 1/3 strangers – People who do not know the process at all. This will bring fresh ideas and help eliminate assumptionsHaving the right team members is critical for a successful outcome!
9
Assembling the team
• Need support of the whole team• Needs to be inclusive, but invite maximum of 10 people to keep it manageable• Leader needs to be respected and credible among peers• Include constructive skeptics who have legitimate concerns, but are open to change
10
Team checklist
üRepresentative from each discipline that has something to do with the processüTeam leaderüShould we include a constructive skeptic?üDo we have someone with QI skills to facilitate our progress?üExternal stakeholder?üPatient/family member?
11
Preparing for change
• Change management is any action or process taken to smoothly transition an individual or group from the current state to a future desired state of being.
Change Management for Effective Quality Improvement: A Primer,
Varkey, P, and Antonio, K. American Journal of Medical Quality. 25(4), 268-273, 2010.
12
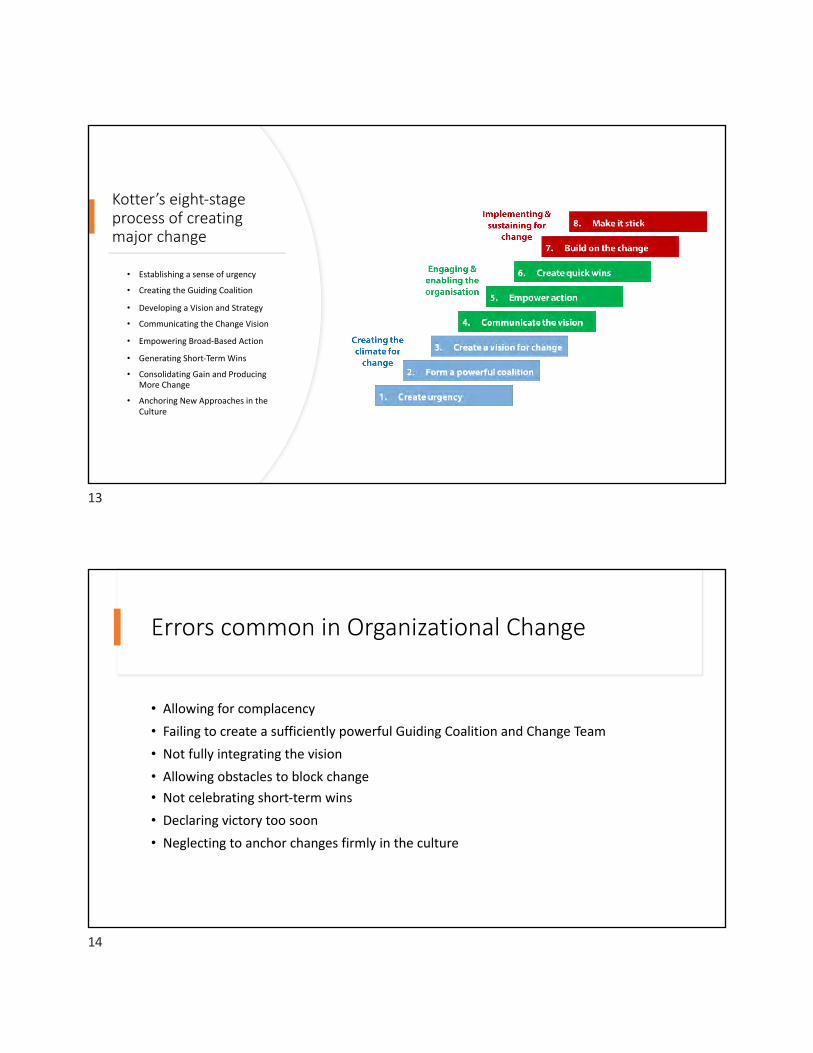
Kotter’s eight-stage process of creating major change
• Establishing a sense of urgency
• Creating the Guiding Coalition
• Developing a Vision and Strategy
• Communicating the Change Vision
• Empowering Broad-Based Action
• Generating Short-Term Wins
• Consolidating Gain and Producing More Change
• Anchoring New Approaches in the Culture
13
Errors common in Organizational Change
• Allowing for complacency• Failing to create a sufficiently powerful Guiding Coalition and Change Team• Not fully integrating the vision• Allowing obstacles to block change• Not celebrating short-term wins• Declaring victory too soon• Neglecting to anchor changes firmly in the culture
14
ESTABLISHING a sense of URGENCY
• Identifying and discussing crises, potential crises, or major opportunities
15
Creating the guiding coalition
• Putting together a group with enough power to lead the change• Getting the group to work together like a team
16
Developing a vision and strategy
• Creating a vision to help direct the change effort• Developing strategies for achieving the vision
17
Communicating the change vision
• Using every vehicle possible to constantly communicate the new vision and strategies• Having the guiding coalition role model the behaviour expected of employees
18
Empowering broad based action
• Getting rid of obstacles• Changing systems or structures that undermine the change vision• Encouraging risk taking and non-traditional ideas, activities and actions
19
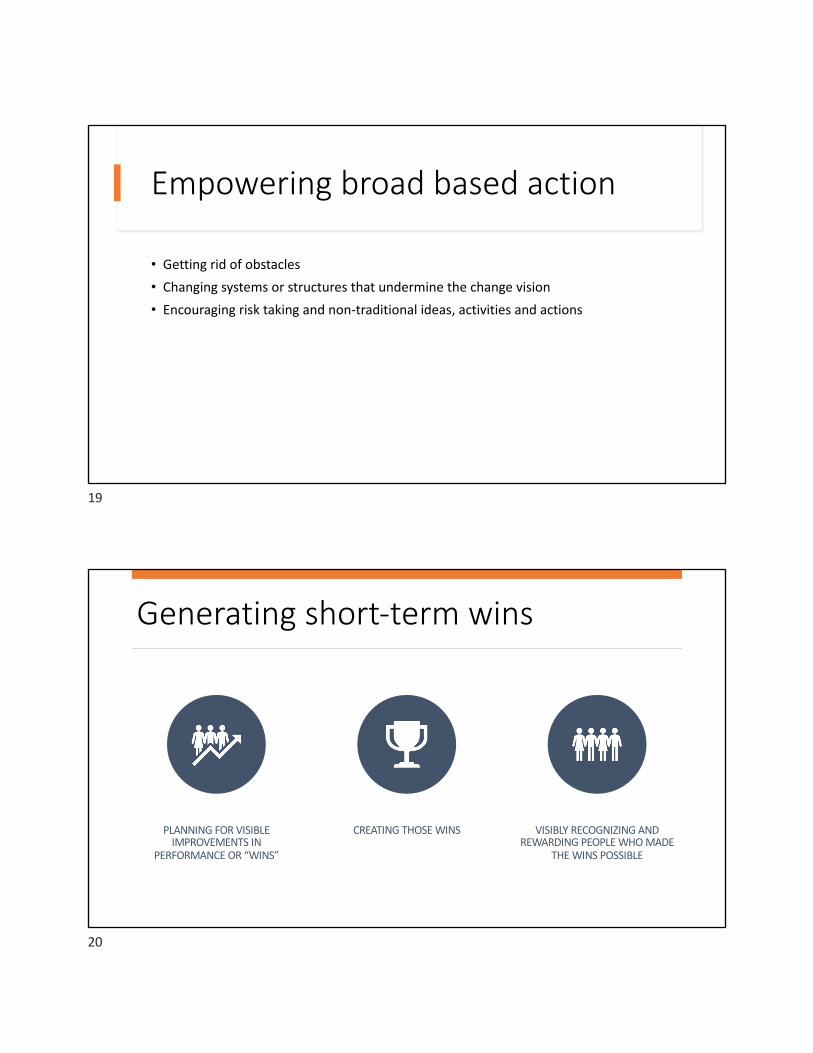
Generating short-term wins
PLANNING FOR VISIBLE IMPROVEMENTS IN
PERFORMANCE OR “WINS”
CREATING THOSE WINS VISIBLY RECOGNIZING AND REWARDING PEOPLE WHO MADE
THE WINS POSSIBLE
20
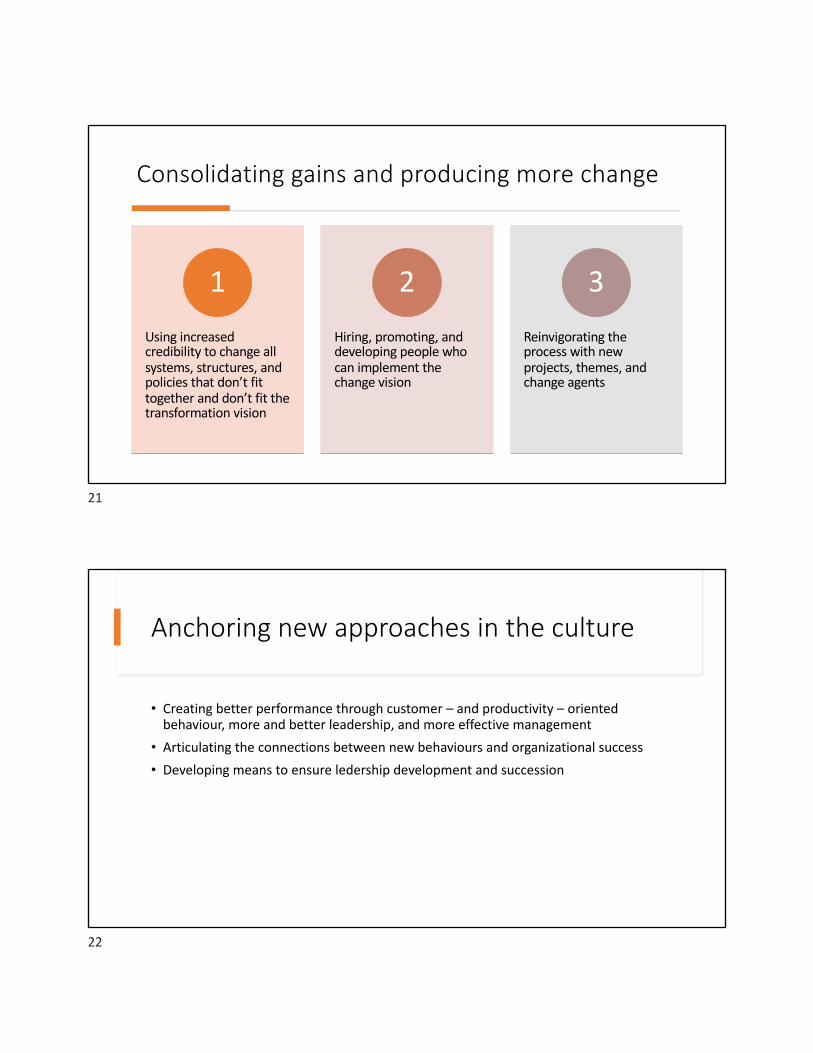
Consolidating gains and producing more change
Using increased credibility to change all systems, structures, and policies that don’t fit together and don’t fit the transformation vision
1Hiring, promoting, and developing people who can implement the change vision
2Reinvigorating the process with new projects, themes, and change agents
3
21
Anchoring new approaches in the culture
• Creating better performance through customer – and productivity – oriented behaviour, more and better leadership, and more effective management
• Articulating the connections between new behaviours and organizational success• Developing means to ensure ledership development and succession
22
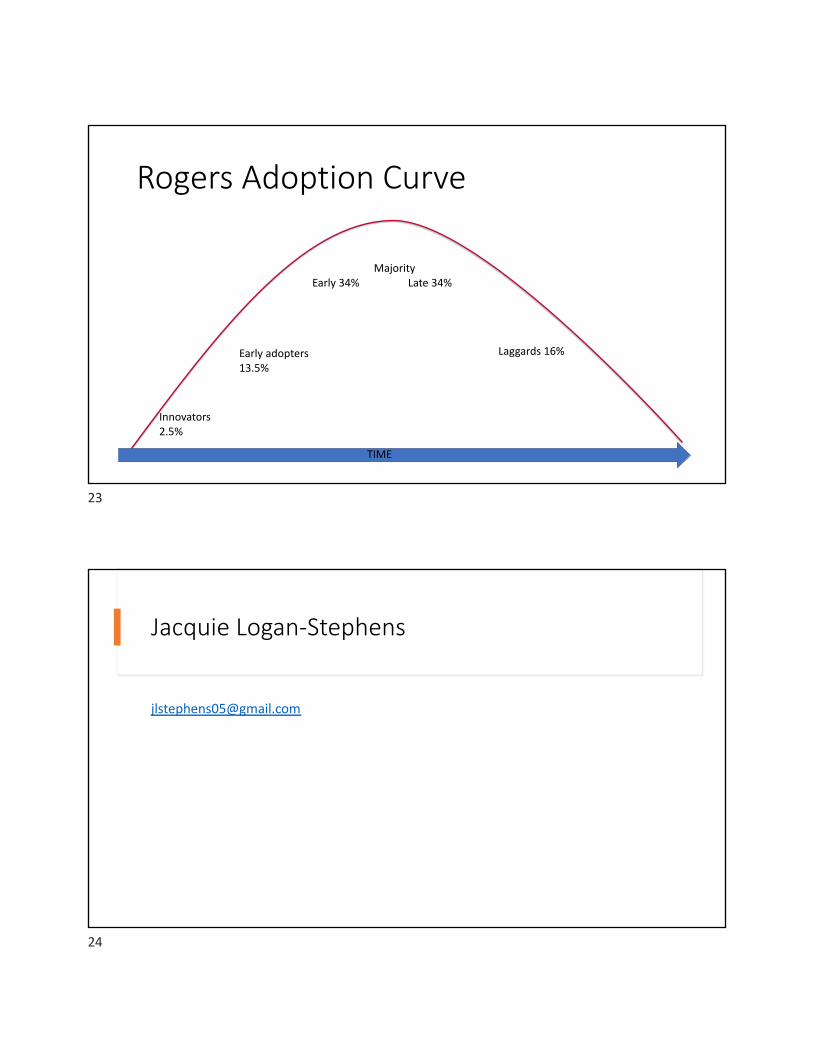
Rogers Adoption Curve
Innovators 2.5%
TIME
Early adopters 13.5%
MajorityEarly 34% Late 34%
Laggards 16%
23
Jacquie Logan-Stephens
24
4. Model for Improvement:Maximizing QI efforts
Jacquie Logan-StephensFebruary 19, 2021
1
Model for Improvement – Learning objectives
• Prepare your improvement charter• Develop your problem statement• Establish an AIM statement• Define measures relating to your AIM• Develop change ideas• Understand the PDSA cycle to test a change idea
2
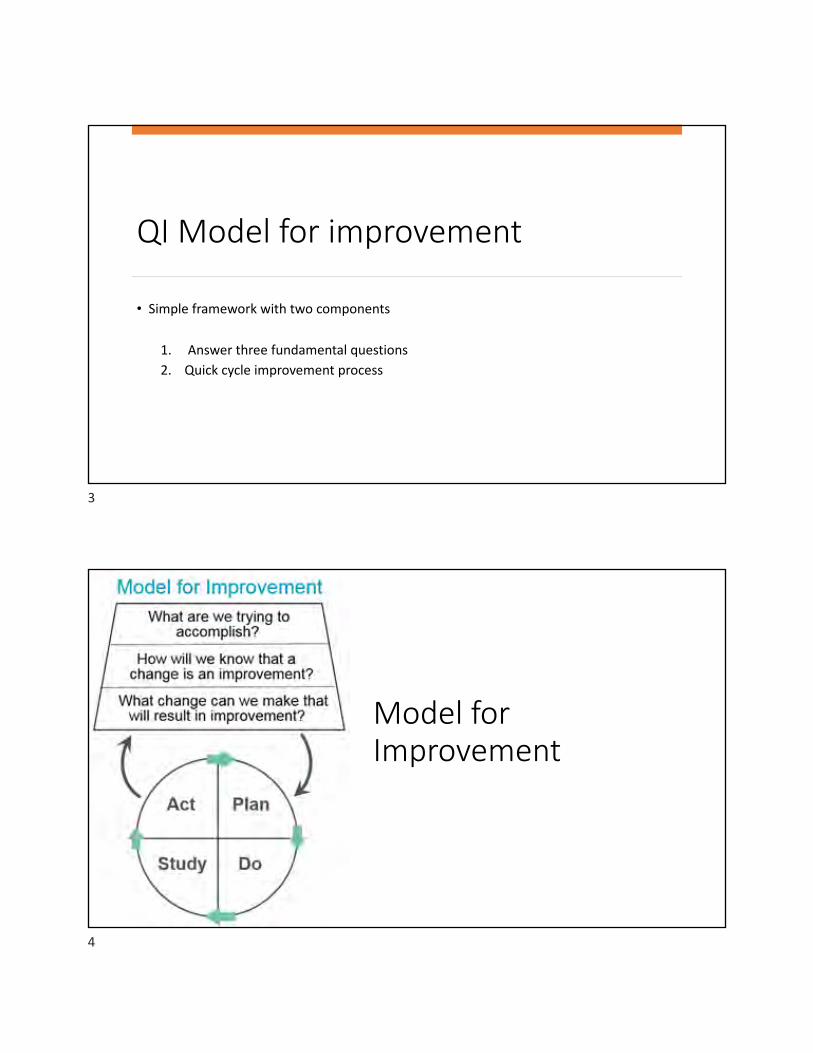
QI Model for improvement
• Simple framework with two components
1. Answer three fundamental questions2. Quick cycle improvement process
3
Model for Improvement
4
What are we trying to accomplish?
• Define the aim
• What is the problem you wish to address?• Why is it a problem? • Where do you observe the problem?• Who is impacted? • When is it ongoing or recurrent?• Which of the Quality Dimensions are involved?
• “A problem well defined is half-solved”
5
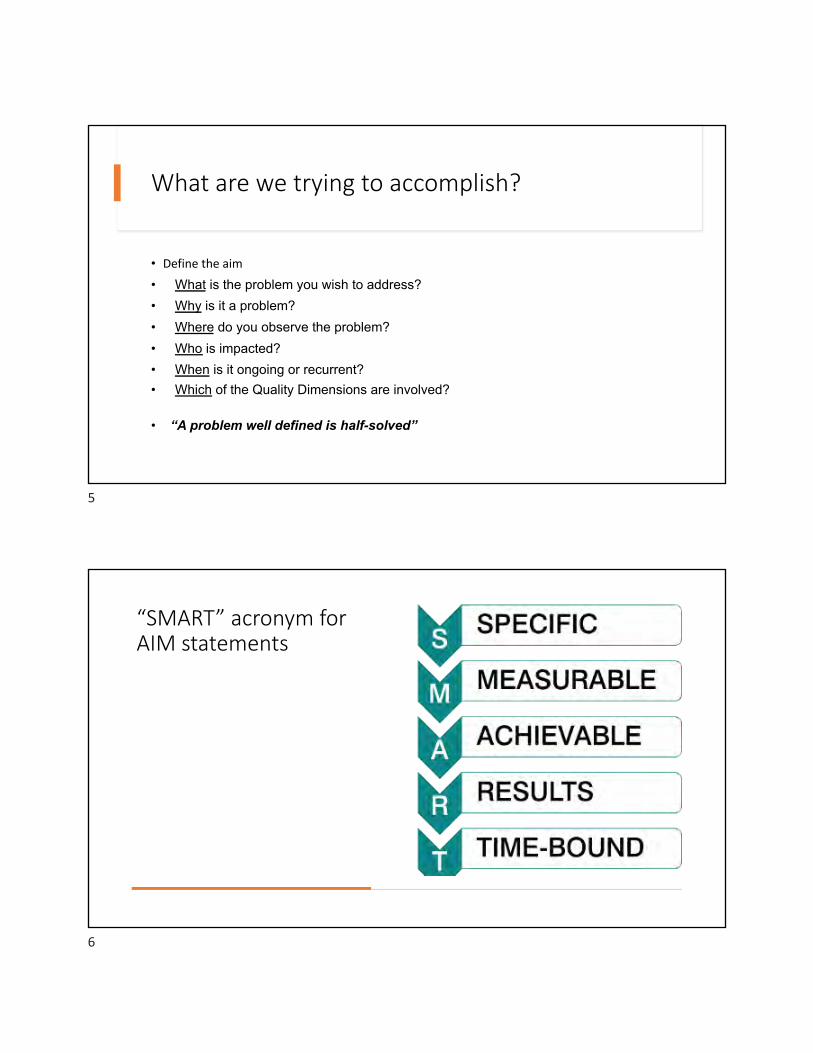
“SMART” acronym for AIM statements
6
Example of poor aim statement
I want to get in better shape by the end of the year.
7
Example of good aim statement• I will walk for a minimum of 30
minutes, Monday through Saturday starting March 30, 2021 through December 31, 2021.
8
How will we know if a change is an improvement?
Measure!
9
What changes can we make that will result in improvement?
• Change ideas• Focus on improving specific steps of a process• Practical and readily tested
10
How do you get ideas for quality improvement projects??
11
How do you get ideas for QI projects?
• Gap related to organizational objectives• Team identifies an issue based on provider or patient experience• Quality monitoring issues• Public reporting on quality indicators• New best practice guidelines
12
Where do change ideas come from?
• Evidence – best practice guidelines
• Front line – including patients – what are the “if only” (if only we could do X)
• Experience
• Creativity – great ideas often come from being creative• Current state diagnostics – what is the current state telling you? Analyze it for opportunities
• Change concepts – they are big buckets of ideas that can be used to spark discussion
13
Plan Do Study Act
• Test your change ideas using a quick succession of small tests – can even be with one patient for one day!• Analyze results and test again• Don’t try to implement the change to the whole system – this can generate
resistance• Small tests of change are low risk way to try new ideas
14
Step one - PLAN
• What is your change idea?• What indicator(s) of success will you measure?• How will data on these indicators be collected?• Who or what are the subjects of the test?• How many subjects will be included in the test and over what time period?• What do you hypothesize will happen?
15
Step two - DO
• Conduct the test• Document any problems and unintended consequences
16
Step three - Study
• Analyze the data and study the results• Compare the data to your predictions• Summarize and reflect on what was learned
17
Step four - ACT
• Refine the change idea based on lessons learned from the test• Prepare a plan for the next test
18
PDSA cycle
• Collect data and use it to monitor how you are progressing• Iterative process – each test builds on what was done in the previous cycle• As you get going, you can have more than one change going on at the same
time toward the same goal
19
Successful PDSA cycles
• Think a couple of cycles ahead – if I learn this, then I am going to do that• Use a form to document your test – PDSA templates on website• Be innovative – it will work or it will not• Use temporary supports to make the test feasible – may affect the sustainability of
the improvement• Scale down the size and the time required for the initial step- make the test small and
grow
20
Measurement
• Identify how you want to collect and show data (daily, weekly, monthly)• You want to do it frequently enough to assess the impact of the change as it
is being tested• Choose measurement that supports the aim statement• Use existing data collection systems where possible• Integrate measurement into daily routines
21
Why is measurement important?
• Real time measures are important in QI• Confirm if perception is reality• Collecting and displaying the measures is an engagement strategy• Make it as simple and easy as possible
22
Analyzing data
• Monitor the impact of QI changes• Run charts and control charts
23
Run charts
• Set up at start of project and update over time• Useful regardless of amount of data you have• Simple to produce and interpret
24
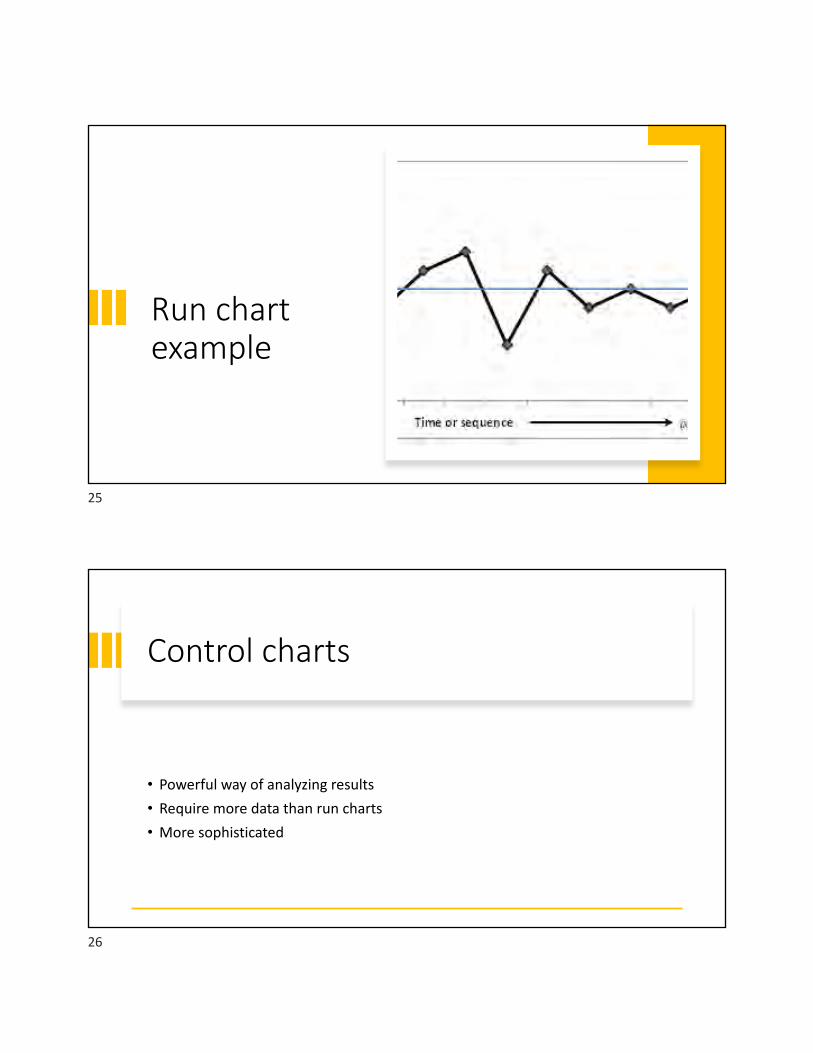
Run chart example
25
Control charts
• Powerful way of analyzing results • Require more data than run charts• More sophisticated
26
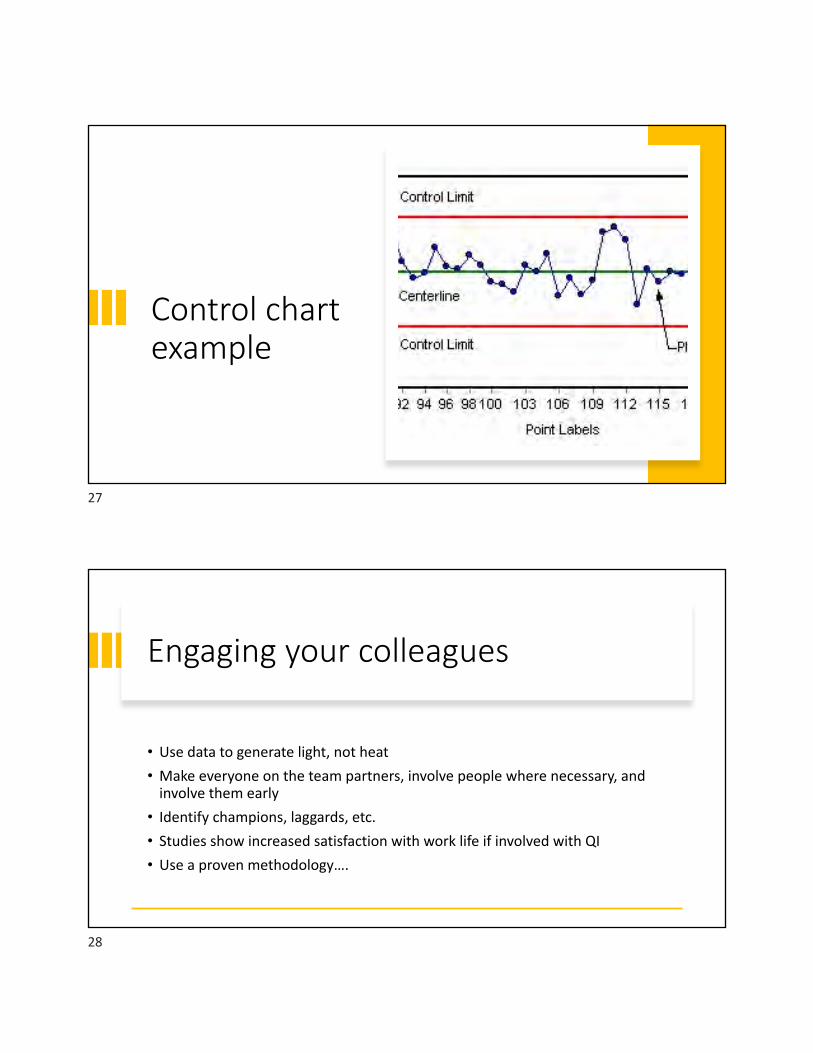
Control chart example
27
Engaging your colleagues
• Use data to generate light, not heat• Make everyone on the team partners, involve people where necessary, and
involve them early• Identify champions, laggards, etc.• Studies show increased satisfaction with work life if involved with QI• Use a proven methodology….
28
Performance Measurement & Management
• Supports a culture of accountability
• Develop a system that produces information
• Act on improvement opportunities
• Foundation of PM&M
• Leadership accountability & support• Mission-driven measurement
• Focus on results for patients/clients• Meaningful engagement of stakeholders
• Understanding of extenuating and influencing factors• Workforce knowledgeable and engaged
• Investment in necessary resources
• PM&M of business functions to sustain and enhance organization
29
Accreditation
• Accreditation is an ongoing process of assessing health and social services organizations against standards of excellence to identify what is being done well and what needs to be improved.
30
Benefits of Accreditation to quality improvement
• Findings: Staff felt that “hospital accreditation contributed to the improvement of healthcare quality in general, and more specifically to patient safety, as it fostered staff reflection, a higher standardization of practices, and a greater focus on quality improvement.”
Melo, S., Journal of Health Organization and Management, 2016 Nov 21; 30(8): 1242-1258
31
Resources
• Agency for healthcare Research and Quality www.ahrq.gov• Canadian Institute for Health Information – CIHI• Canadian Patient Safety Institute www.patientsafetyinstitute.ca• Health Quality Ontario www.hqontario.ca• Institute for Healthcare Improvement – IHI www.ihi.org
32
Resources - International
• Australian Commission on Safety and Quality in Health Care www.safetyandquality.gov.au
• Quality Health UK www.quality-health.co.uk
33
References
• Change management for Effective Quality Improvement: A Primer, Varkey, P, and Antonio, K. American Journal of Medical Quality. 25(4), 268-273, 2010.
• Change Management in Healthcare, Campbell, R.J., The Health Care Manager, 27(1), 23-39, 2008.
• Change Management: How to Achieve a Culture of Safety
• Health Quality Ontario www.hqontario.ca
• Kotter, J.P., Leading Change, 1996.
• Institute for Healthcare Improvement www.ihi.org
• Dhalla, I.A., Tepper, J. (2018, October 1). Improving the quality of health care in Canada. https://www.ncbi.nlm.nih.gov/pmc/articles/PMC6167219/
• Patient Safety and Quality: An Evidence-Based Handbook for Nurses by Molla Sloane Donaldson
• Senge, P., Kleiner, A., Roberts, C., Ross, R., Roth, G., & Smith, B. The Dance of Change: the Challenges to sustaining momentum in learning organizaitons, 1999.
• Toussaint, John & Berry, Leonard L. The Promise of Lean in Health Care, 2013.
34