clivar-ictp workshop...
TRANSCRIPT

CLIVAR-ICTPWorkshoponDecadalClimateVariabilityandPredictability:
ChallengesandOpportunity
WorkshopObjectivesandtheCLIVARDCVPRF
InternationalCenterforTheoreticalPhysics(ICTP)Trieste,Italy16-20November2015

DecadalClimateVariability impactsonhumansandtheenvironment
Thecoreissue:Theglobalandregional-scaleexpressionsoftheinteractionbetweenmulti-yearnaturalclimatevariationsandanthropogenicclimatechange:
- Saheldroughtsof1970s&1980s[AMOC/AMV+ENSO+IndianOceanSSTs+anthropogenicaerosols]
- DecadalvariationsinAtlanticTCactivity[AMOC/AMV+ENSO+GHGs]
- 1960’s-1990’sMediterraneandryingtrend[NAOtrend+AMV]- SouthwestUSmulti-yeardroughts[PDV+AMOC/AMV+GHGs]- Recent‘hiatus'–InthePacifictheeastiscoolingnotwarmingand
thetradesareintensifying[IPO/PDO(oceanheatuptake)+externalforcing(stratosphericWV+volcanicaerosols+solarvariability)]
- RecentCaliforniadrought[multi-yearnaturalvariabilitysuperimposedonawarmingtrend].
2CLIVAR-ICTPWorkshop,TriesteItaly,16-20Nov.2015

3
YK,USCLIVARIAGmee0ng,Aug20157
YK,USCLIVARIAGmee0ng,Aug2015CLIVAR-ICTPWorkshop,TriesteItaly,16-20Nov.2015

WhyDCVPresearchnow?• Newinstrumentalobservations(particularlyoftheoceanandfromspace&recentadvancedinmodelingandinreanalysis.
• CMIP5experimentsininitializeddecadalprediction(andplansforcontinuationunderCMIP6)indicateareasofsuccessandfrustrationpointingattheneedformoreworkonphysicalunderstanding.
• Thesurprising“hiatus”andincreaseindamagingclimateextremesinvokesocietalneedfornear-termknowledgeforplanning&preparedness.
• Reconstructionsofpastclimatevariabilityfromhigh-resolutionsingleandmultipleproxiesprovidenewinformationonforcedandfreedecadalvariabilityduringthepre-industrialera.
• CMIP5simulationsoftheclimateoflastmillennium:astudyoftheclimateresponsetoexternalforcingfromsolarvariability,volcanicforcing,andchangesinlanduseandcontrastthisresponsewiththeresponsetoanthropogenicGHGemissionsandaerosols. 4
CLIVAR-ICTPWorkshop,TriesteItaly,16-20Nov.2015

CLIVAR-ICTPWorkshop,TriesteItaly,16-20Nov.2015
5

CLIVARDCVPObjectives
• CLIVARDCVPseekstocharacterizethemulti-yeartomulti-decadalvariabilityoftheclimatesysteminresponsetointernalprocessesandnaturalandanthropogenicforcingaswellastheirinteraction
• todetermineandunderstandthephenomena,theirgoverningmechanisms,andimpactsthroughdiagnosticanalysisandmodeling
• toassessandsubsequentlyharnessthepredictabilityofdecadalclimatevariabilityforsocietalbenefit.
6CLIVAR-ICTPWorkshop,TriesteItaly,16-20Nov.2015

ToadvanceCLIVARDCVPobjectivestheProjectsoughttoidentifyalimitednumberofresearchobjectivesthatwillbe:
o Relevant&tractableandwillbenefitfrominternationalcollaboration.
o CutsacrossotherCLIVARpanelsagendaandtimely(preferablyisalreadyinconsiderationorimplementation).
o Leadstowidelyappealing,actionableresearchactivityresolvablewithinafinitetime(~5years)andyieldingbroadscientificandsocietalbenefit.
CommunitydiscussionyieldedthefollowingtwofocithatwereendorsedbytheSSGandarebeingdevelopedfurtherbytheDCVPWG:
1. Thedecadalmodulations–slowdownsandaccelerations–ofthelong-termanthropogenicwarmingtrend
2. Theroleofvolcaniceruptionsindecadalclimatevariabilityandtheirimpactondecadalclimateprediction
DCVPRF
7CLIVAR-ICTPWorkshop,TriesteItaly,16-20Nov.2015

Hiatusexpressions:globalmeanvs.thespatialpattern
8
NATURE CLIMATE CHANGE DOI: 10.1038/NCLIMATE2357 LETTERS
30° N
60° N
Reanalysisa
c
b
d
Initialized@1996
TAS 1998−2002 minus 1981−1995
Persistence Uninitialized
0°
30° S
120° E 180° 120° WLongitude
Latit
ude
Latit
ude
Longitude
Longitude Longitude
0°60° W
30° N
60° N
0°
30° S
120° E 180° 120° W 0°60° W
30° N
60° N
0°
Latit
ude
Latit
ude
30° S
120° E 180°
−0.6 −0.5 −0.4 −0.3 −0.2 −0.1 0.0(°C)
0.1 0.2 0.3 0.4 0.5 0.6
120° W 0°60° W
30° N
60° N
0°
30° S
120° E 180° 120° W 0°60° W
Figure 3 | Surface air temperature patterns for prediction of the IPO transition in the late 1990s. a, Observed surface temperature anomalies (TAS) for1998–2002 minus 1981–1995. b, 3–7 year average prediction initialized in 1996 for years 1998–2002 minus the observed reference period 1981–1995.c, Persistence prediction for years 1998–2002. d, Uninitialized prediction for years 1998–2002 minus the models’ reference period 1981–1995. Stippling inb,d indicates the 10% significance level from a two-sided t test.
in other contexts32, and there is no obvious relationship betweenmodel spread (individual red dots in Fig. 2d) and skill (greaterforecast skill is defined as higher anomaly pattern correlationvalues). The slowing of global warming in the early 2000s is seenin the predictions made in the second half of the 1990s (Fig. 2c), aswell as statistically significant pattern correlations for the negativephase of the IPO through the initiation of the hiatus in the late 1990s(Fig. 2d). The IPO region in the Pacific basin shows a similar result(Fig. 2e). However, the drop of predictive skill for the six initial years1986–1991 (verifying for prediction periods 1988–1992 through1993–1997) indicates a conditional predictive skill that would havebeen di�cult to anticipate in advance. A similar loss of skill forthose same years is also seen in the Atlantic (Supplementary Fig. 3),although the overall skill levels in the Atlantic are higher than in thePacific33,34 (for example, 20 hindcast periods have anomaly patterncorrelation values above +0.8 for the Atlantic in SupplementaryFig. 3, whereas there are only 5 in the Pacific in Fig. 2e). Examplesof this can be seen by eye in Fig. 3 and Supplementary Fig. 2,where the simulated surface temperature anomaly patterns in theAtlantic basin have a greater similarity to the observations than inthe Pacific basin. The loss of IPO skill for those initial years resultsin a more neutral IPO state in the Pacific for those hindcasts, andconsequent globally averaged surface air temperature values lessthan observed (Fig. 2c).
It is also possible that using the previous 15 years as a climatologyto compute predicted temperature anomalies could introduce arti-ficial skill. However, using the entire hindcast period (1960–2010)as a climatology produces a similar result for the late-1990s IPOtransition (Supplementary Fig. 4), although this procedure in-troduces an externally forced trend from increasing greenhousegases that resembles the IPO pattern. Using yet another metric,the anomaly pattern correlations between the model hindcasts fordecadal temperature trends in the Pacific with the observed IPO
pattern (Supplementary Fig. 1b), also shows skill in simulating thelate-1990s transition (Supplementary Fig. 5). It has been noted thatIPO transitions often occur in conjunction with ENSO interannualvariations. This is an intriguing research question that is currentlyunder investigation, and thus beyond the scope of this paper.
The lack of skill for the six initial years 1986–1991, out of the 46possible initial years in the hindcast period, probably contributes tothe lower overall skill for some areas of the Pacific region for theentire hindcast period from 1960 to 2005 for grid-point time seriescorrelations1,33,34. Reasons for this drop in skill for those initial yearsare at present under investigation.One possibility is that those initialyears contain prediction information that includes theMt. Pinatuboeruption in 1991. Although it is thought that large volcanic erup-tions could provide externally forced skill in hindcasts1, these resultssuggest that processes associated with that large eruption couldeither have been not well-simulated in the initialized hindcasts, orthe forcing data used by the models could have had problems.
MethodsUninitialized model simulations. All available uninitialized CMIP5 climatemodel simulations26 are analysed, with all possible ensemble members for all fourRCP scenarios. This amounts to 262 possible realizations from 45 models, withup to 10 ensemble members for the period 2000–2020. These model simulationsall start from some pre-industrial state in the nineteenth century, and useobservations for natural (volcanoes and solar) and anthropogenic (GHGs, ozone,aerosols, land use) forcings through 2005—with the four RCP scenario forcingsafter 2005. For the early 2000s, there is little di�erence among the RCP scenariosfor this short-term time frame1, so all are used.
Initialized model simulations. All available initialized CMIP5 climate modelsimulations26 are analysed from the 16 models that ran the decadal hindcastsand predictions. Some models used initial years for hindcasts every year,starting with 1960–2011, and some used initial years every five years from1960 to 2011, with various ensemble sizes for each model and each initial year(Supplementary Table 1). Results are shown for each initial year, with di�erent
NATURE CLIMATE CHANGE | VOL 4 | OCTOBER 2014 | www.nature.com/natureclimatechange 901
TAS 1998−2002 minus 1981−1995
Meehl et al. (2014)
Karl et al. (2015)
U S C L I V A R V A R I A T I O N S
US CLIVAR VARIATIONS • Summer 2015 • Vol. 13, No. 3 22
Hiatus in the increase of global surface temperature, but rather the slowdown is an artifact of bias in the observational record.
Because there is still controversy concerning the Hiatus amongst climate scientists, this has been misinterpreted by the public and provided fodder for debate that a slowdown in anthropogenic climate change is occurring. The intensity of the scientific and public discussion suggests an opportune time to review our current understanding of the mechanisms. This edition of US CLIVAR Variations aims to identify the scientific gaps in our knowledge of the Hiatus, facilitate discussion of the dominant mechanistic processes, and suggest an integrated strategy and coordinated effort towards improving observations, simulations, and predictions of the phenomena.
In addition, many authors from this publication will be presenting on the warming hiatus topic during a special session at the upcoming 2015 US CLIVAR Summit on August 4 in Tucson, Arizona.
U S CL I VA RVA R I AT I O N S
Editors: Mike Patterson and Kristan Uhlenbrock
US CLIVAR Project Office1201 New York Ave NW, Suite 400
Washington, DC 20005202-787-1682 www.usclivar.org
© 2015 US CLIVAR
and decadal climate variability/prediction are focused on interpreting and attempting to predict such decadal climate variability (e.g., Meehl et al. 2014) in the context of long term trends of warming from increasing GHGs, as well as effects from other natural (e.g., volcanoes, solar) and human-produced (e.g., sulfate aerosols, ozone) factors.
Zhang et al. (1997) first identified an El Niño-like decadal timescale SST pattern in the Pacific that was subsequently named the Pacific Decadal Oscillation (PDO, Mantua et al. 1997) or the Interdecadal Pacific Oscillation (IPO, Power et al. 1999). The former was defined based on North Pacific SSTs, and the latter for Pacific basin-wide SSTs. The two terms are often used interchangeably since they are closely related (Han et al. 2013). Typically the observed IPO pattern is defined as the second empirical orthogonal function (EOF) of low-pass filtered Pacific SSTs (Figure 2a). The principal component (PC) time series of this EOF shows a positive phase of the IPO in the first half of the 20th century, negative from the 1940s to 1970s, positive from the 1970s through the 1990s, and negative again from the late 1990s to 2013 (Figure 2b). There is evidence that most of this pattern is internally generated because the first EOF of low pass filtered SSTs from multi-century un-forced climate model control runs show a similar pattern (Figure 2c).
Thus, when performing a process-based interpretation of the time series of globally averaged surface air temperature, epochs (noted above) when the IPO is positive show warming trends greater than the long-term forced trend, and when the IPO is negative, the temperature trends are less than the long-term warming trend (Figure 1). Using the new adjusted surface temperature data from Karl et al. (2015), the warming trend when the IPO was most recently positive (1971-1995) was +0.18°C per decade, compared to the hiatus (typically defined as lasting from 2000-
Figure 1: Time series of annual mean globally averaged surface temperature anomalies (dots) based on data from Karl et al. (2015). Black line is linear trend computed from 1950-2014 showing long-term trend forced mainly by increasing GHGs. Red lines are epoch linear trends for positive phases of the IPO, blue lines for negative phases of the IPO, highlighting the need for process-based interpretation of decadal temperature trends in context of the long-term forced trend (after http://www.noaanews.noaa.gov/stories2015/noaa-anal-ysis-journal-science-no-slowdown-in-global-warming-in-recent-years.html).
FRONTIERSINDECADALCLIMATEVARIABILITY—September3-4,2015
findings of S06 based on a selection of seven models partic-ipating in CMIP3.
3.3. Geopotential Height[31] Geopotential height anomalies in the upper tropo-
sphere and mid stratosphere help define circulation changes
during winters following large volcanic eruptions. Due tothe high uncertainty in the 20CRv2 reconstructions of upperair fields [Compo et al., 2011], we decide to analyze onlythe last four eruptions since 1950 using the ERA40 data set.In the upper troposphere (Figure 4e), the observed 200 hPageopotential height anomalies are linked to the MSLP
Figure 4. Comparison between reanalysis and multimodel mean. Composite anomaly averaged after2 post-volcanic winters for (a and b) near-surface temperature (K), (c and d) mean sea level pressure (hPa),(e and f) 200 and (g and h) 50 hPa geopotential (m). The anomalies in Figures 4e and 4g are computed forthe last 4 volcanoes listed in Table 2. Hatching displays, for the left column areas at or over 95% signifi-cance using a local two tailed t-test, for the right column where at least 90% of models agree on the signof the anomaly. Notice the different scale in Figures 4a/4b and Figures 4c/4d.
DRISCOLL ET AL.: VOLCANIC IMPACTS IN THE CMIP5 MODELS D17105D17105
9 of 25
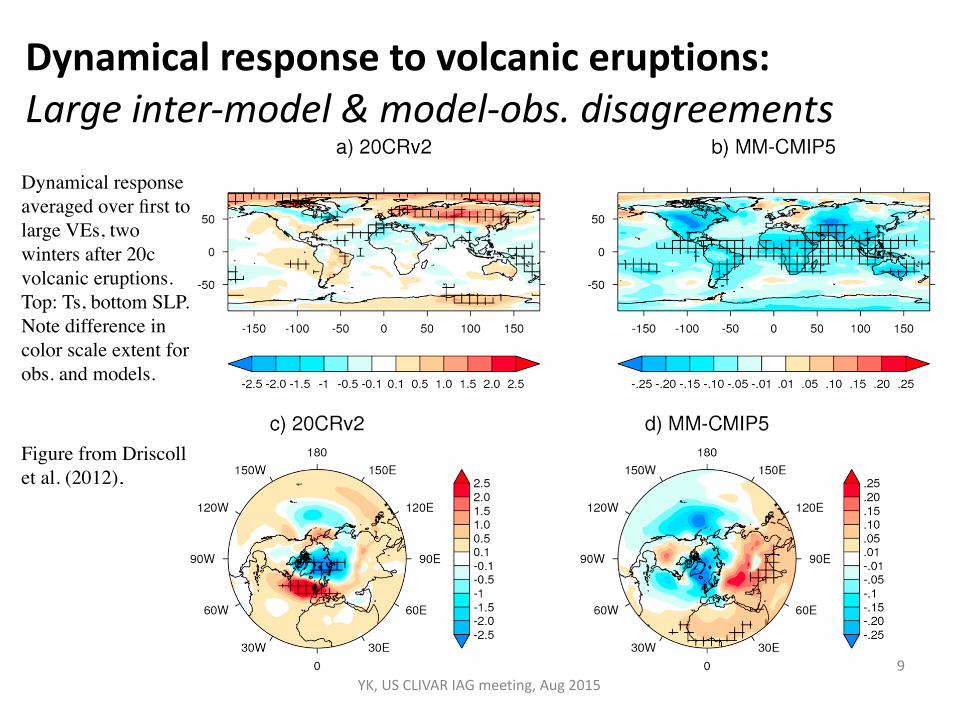
Dynamicalresponsetovolcaniceruptions:Largeinter-model&model-obs.disagreements
9YK,USCLIVARIAGmeeting,Aug2015
Dynamical response averaged over first to large VEs, two winters after 20c volcanic eruptions. Top: Ts, bottom SLP. Note difference in color scale extent for obs. and models.
Figure from Driscoll et al. (2012),

DCVPRFWorkingGroup
10

o WorkwiththeWCRP/WGSIPDecadalClimatePredictionProject(DCPP)toestablishprotocolsforCMIP6decadalpredictionactivities.Inparticular:▪ Pacemakerexperimentsforunderstandingmechanismsofclimateshifts,internalmodes
ofvariabilityandpredictability▪ Perturbationexperimentsontheimpactofvolcanoesonpredictabilityandpredictions
o PreparetheDCVPchapterinthenewCLIVARSciencePlan;organizeandconveneaDCVPsessionintheCLIVAROpenScienceConference.
o AssistinorganizingtheICTP/CLIVARInternationalWorkshoponDecadalClimateVariabilityandPredictability:ChallengeandOpportunity,tobeheldon16-20November2015,Trieste,Italy.
o UpdatetheCLIVARDCVPscienceagendaandproposeanimplementationplanthatlaysoutthepathforrapidprogressonthemostpressingresearchobjectives.
DCVP RF Activities
11CLIVAR-ICTPWorkshop,TriesteItaly,16-20Nov.2015

o ReportontheoutcomesofrecentresearchonDCVPanddiscussandshareideasinspiredbytheseresults
o IdentifytheobstaclestoprogressinDCVPscienceandrelatedpressingscientificissues,particularlythosethatrequireinternationalattentionandwouldbenefitfromenhancedinternationalcoordination
o Identifyexistingandemergingopportunitiesformakingrapidprogressontheseissues
o Suggestnewactivitiesorinitiativesthatcanfostersuchprogress
CLIVAR-ICTP Workshop Objectives
12CLIVAR-ICTPWorkshop,TriesteItaly,16-20Nov.2015