cloetta interim report q2 2015 and acquisition of lonka - presentation
TRANSCRIPT

Title
Arial, Bold, 40 pt, red
Subtitle
Arial, Bold, 40 pt, grey
Q2 2015 results and acquisition of Lonka – 17 July 2015
Bengt Baron, CEO
David Nuutinen, incoming CEO
Danko Maras, CFO
Jacob Broberg, SVP IR

Title
Arial, Bold, 40 pt, red
Text/Bullets, Level 1-5
Arial, Regular, 20 pt, grey
Subtitle
Arial, Bold, 40 pt, grey
Q2 highlights
2
Continued growth and improved operating profit
• Net sales for the quarter increased by 3.4 per cent to SEK 1,280m (1,238),
including a positive impact from foreign exchange rates of 1.4 per cent.
• Operating profit was SEK 130m (85).
• Cash flow from operating activities was very strong and amounted to
SEK 163m (44).
• Net debt/EBITDA continued to decrease and was 3.30x (4.55).
• On 16 July, 2015 Cloetta signed an agreement to acquire Locawo B.V.
(Lonka) – a Dutch company producing and selling fudge, nougat and
chocolate. The acquisition will significantly strengthen Cloetta’s position in
the Netherlands.

Title
Arial, Bold, 40 pt, red
Text/Bullets, Level 1-5
Arial, Regular, 20 pt, grey
Subtitle
Arial, Bold, 40 pt, grey
Overall market and sales development
Sales growth of 3.4 per cent
• Positive total market developments, except in
the Netherlands
• Organic growth 0.8 per cent for the quarter
• Sales grew in Sweden, Finland, Denmark and
outside the main markets. Also Nutisal and the
Jelly Bean Factory brand grew.
• Sales in Sweden and Norway negatively
impacted due to ongoing contract negotiations
with customers.
• Risk that sales to some customers in Sweden
and Norway may continue to be negatively
affected.
3
Cloetta´s main markets

SEKm Apr-Jun
2015
Margin
%
Change
%
Apr-Jun
2014
Margin
%
Net sales 1,280 3.42 1,238
Underlying EBIT 1) 129 10.3 17.3 110 9.4
Operating profit (EBIT) 130 10.2 52.9 85 6.9
Profit for the period 66 633.3 9
Net sales and EBIT
4
1) Based on constant exchange rates, the current group structure and excluding items affecting comparability related
to restructurings.
2) Organic growth at constant exchange rates and comparable units 0.8 per cent for the quarter.
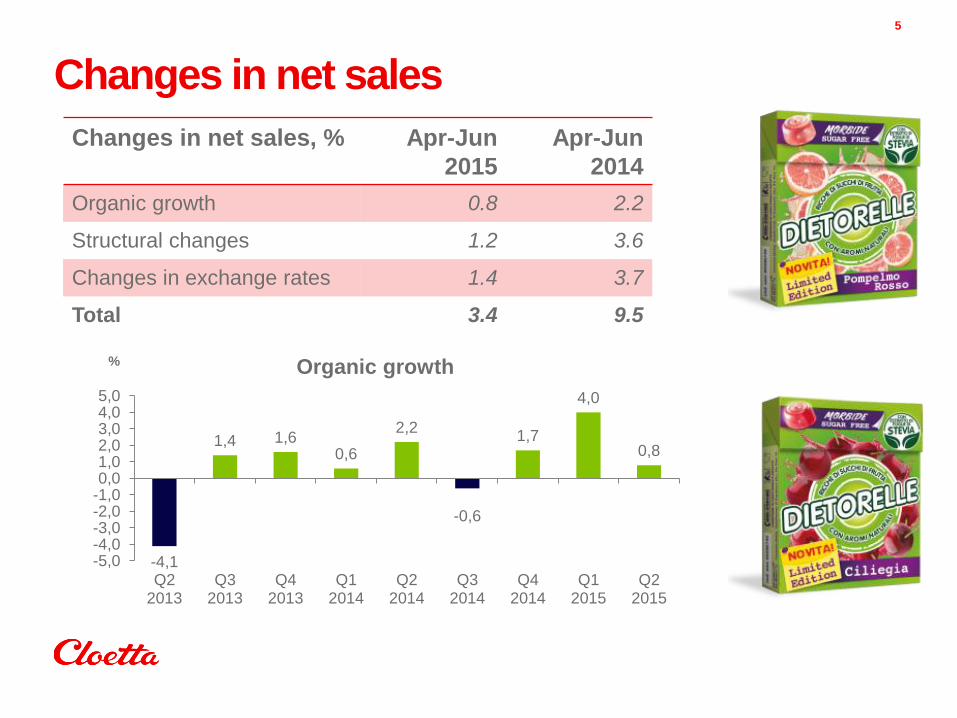
Changes in net sales
5
-4,1
1,4 1,6 0,6
2,2
-0,6
1,7
4,0
0,8
-5,0-4,0-3,0-2,0-1,00,01,02,03,04,05,0
Q22013
Q32013
Q42013
Q12014
Q22014
Q32014
Q42014
Q12015
Q22015
% Organic growth
Changes in net sales, % Apr-Jun
2015
Apr-Jun
2014
Organic growth 0.8 2.2
Structural changes 1.2 3.6
Changes in exchange rates 1.4 3.7
Total 3.4 9.5

Title
Arial, Bold, 40 pt, red
Text/Bullets, Level 1-5
Arial, Regular, 20 pt, grey
Subtitle
Arial, Bold, 40 pt, grey
Net sales, operating profit and underlying EBIT
6
Net sales Operating profit Underlying EBIT
1193 1 238 1 303
1 579
1 313 1280
0
200
400
600
800
1 000
1 200
1 400
1 600
Q1 Q2 Q3 Q4
SE
Km
2014 2015
52
85
178
262
90
130
0
50
100
150
200
250
300
Q1 Q2 Q3 Q4
SE
Km
2014 2015
81
110
200
244
107 129
0
50
100
150
200
250
300
Q1 Q2 Q3 Q4
SE
Km
2014 2015

Title
Arial, Bold, 40 pt, red
Text/Bullets, Level 1-5
Arial, Regular, 20 pt, grey
Subtitle
Arial, Bold, 40 pt, grey
-16 -23
54
116
91
44
75
290
223
163
-50
0
50
100
150
200
250
300
350
Q1 Q2 Q3 Q4
SE
Km
2013 2014 2015
Cash flow from operating activities
7
Title
Arial, Bold, 40 pt, red
Text/Bullets, Level 1-5
Arial, Regular, 20 pt, grey
Subtitle
Arial, Bold, 40 pt, grey
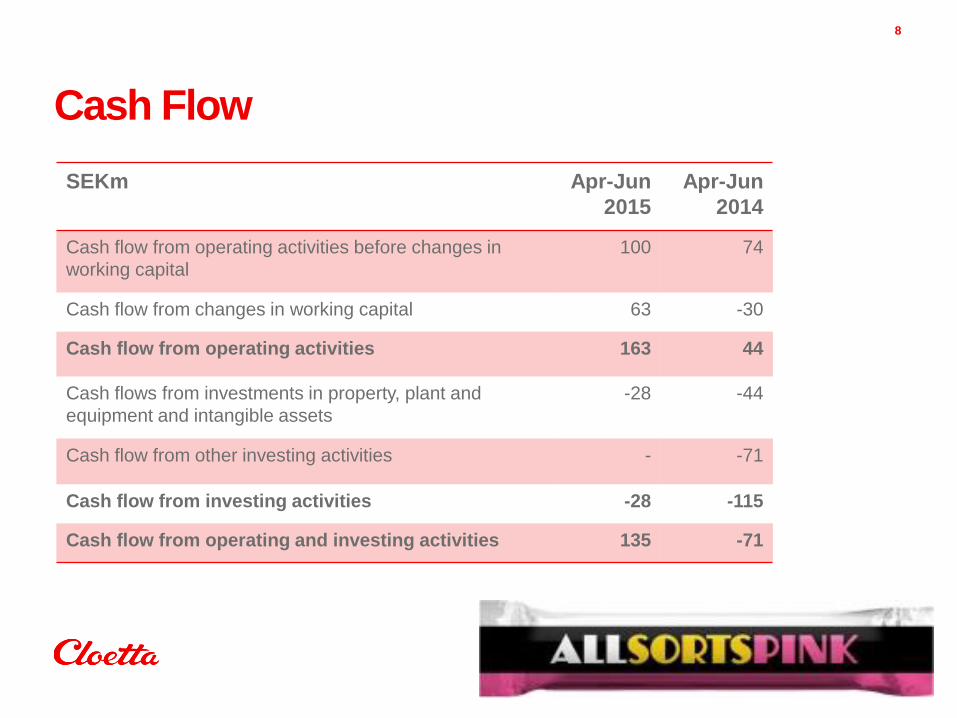
Cash Flow
8
SEKm Apr-Jun
2015
Apr-Jun
2014
Cash flow from operating activities before changes in
working capital
100 74
Cash flow from changes in working capital 63 -30
Cash flow from operating activities 163 44
Cash flows from investments in property, plant and
equipment and intangible assets
-28 -44
Cash flow from other investing activities - -71
Cash flow from investing activities -28 -115
Cash flow from operating and investing activities 135 -71

2,0
2,5
3,0
3,5
4,0
4,5
5,0
2013Q1
2013Q2
2013Q3
2013Q4
2014Q1
2014Q2
2014Q3
2014Q4
2015Q1
2015Q2
9
Financial leverage
Net debt/EBITDA, x
Target

Title
Arial, Bold, 40 pt, red
Text/Bullets, Level 1-5
Arial, Regular, 20 pt, grey
Subtitle
Arial, Bold, 40 pt, grey
10
• Supports profitable growth in core categories
• Significantly strengthens Cloetta’s market position in the Netherlands – Lonka is a well known, strong brand
– Diversifies Cloetta’s product range into new categories
– Entry into Dutch chocolate market
• Strengthens Cloetta’s product offering, including Pick & Mix, and position in
the Nordics and the UK
• Offers new production technologies: – Fudge, chocolate coated moulded products and nougat
Lonka acquisition creates value

Title
Arial, Bold, 40 pt, red
Text/Bullets, Level 1-5
Arial, Regular, 20 pt, grey
Subtitle
Arial, Bold, 40 pt, grey
11
• Founded in 1920
• Branded confectionery products, Pick & Mix products and contract
manufacturing. Specialised in fudge, nougat and chocolate products
• Sales and marketing organisation as well as two factories in the
Netherlands. In total 130 employees
• Sales of approximately SEK 300m
– Approximately 50 per cent of sales in the Netherlands
– The Nordic countries and the UK are other important markets
– Approximately 50 per cent of sales is branded and 50 per cent is Pick &
Mix sales and contract manufacturing
Lonka facts

Title
Arial, Bold, 40 pt, red
Text/Bullets, Level 1-5
Arial, Regular, 20 pt, grey
Subtitle
Arial, Bold, 40 pt, grey
Lonka product categories 12
Wrapped Caramels
P&M Nougat Soft Nougat
Chocolate Nougat
Chocolate Products
Fudge Soft Toffee Bites
Gums/Jellies
(pectine/gelatine)
Chocolate
Gums/Jellies Jamaica Rum
Chocolates
Caramel Bars

Title
Arial, Bold, 40 pt, red
Text/Bullets, Level 1-5
Arial, Regular, 20 pt, grey
Subtitle
Arial, Bold, 40 pt, grey
Core product offerings
13

Title
Arial, Bold, 40 pt, red
Text/Bullets, Level 1-5
Arial, Regular, 20 pt, grey
Subtitle
Arial, Bold, 40 pt, grey
14
• Synergies within administration, sales, procurement and supply chain
• The acquisition will over time support Cloetta’s 14% EBIT-margin target
• Long-term potential for revenue synergies with new technologies such as
fudge
Transaction supports EBIT-target

Title
Arial, Bold, 40 pt, red
Text/Bullets, Level 1-5
Arial, Regular, 20 pt, grey
Subtitle
Arial, Bold, 40 pt, grey
In focus
15
Integration of
Lonka
Profitable growth
Pricing based on
raw material and
currency changes
Acceleration of
Nutisal and The
Jelly Bean Factory

Q2 selection of product launches
16
Läkerol
Ginger Lime and Chili Licorice
Sweden Läkerol
Strawberry Lime
Norway
Malaco
Salt Sill and Colaflaskor
Sweden
Malaco
Kick Raspberry
Sweden and Norway
KING
Peppermint Orange
The Netherlands
Dietorelle
Blood Orange and Cherries
Italy
Sperlari
Strawberry and Lemon
Italy
Läkerol
Deep Dark Saltius and
Ripe Ruby Tastius
Finland
All sorts
Coco, Pink and Choco
Finland
Cloetta Sprinkle
Black Raspberry Sparks
Finland
Cloetta Crispy Bite
Cranberry and Blueberry
Finland
Jenkki
Strawberry/Blueberry
Finland

Title
Arial, Bold, 80 pt, white Q&A

Title
Arial, Bold, 40 pt, red
Text/Bullets, Level 1-5
Arial, Regular, 20 pt, grey
Subtitle
Arial, Bold, 40 pt, grey
Disclaimer
• This presentation has been prepared by Cloetta AB (publ) (the “Company”) solely for use at this presentation and is furnished to you solely for your information and may not be reproduced or redistributed, in whole or in part, to any other person. The presentation does not constitute an invitation or offer to acquire, purchase or subscribe for securities. By attending the meeting where this presentation is made, or by reading the presentation slides, you agree to be bound by the following limitations.
• This presentation is not for presentation or transmission into the United States or to any U.S. person, as that term is defined under Regulation S promulgated under the Securities Act of 1933, as amended.
• This presentation contains various forward-looking statements that reflect management’s current views with respect to future events and financial and operational performance. The words “believe,” “expect,” “anticipate,” “intend,” “may,” “plan,” “estimate,” “should,” “could,” “aim,” “target,” “might,” or, in each case, their negative, or similar expressions identify certain of these forward-looking statements. Others can be identified from the context in which the statements are made. These forward-looking statements involve known and unknown risks, uncertainties and other factors, which are in some cases beyond the Company’s control and may cause actual results or performance to differ materially from those expressed or implied from such forward-looking statements. These risks include but are not limited to the Company’s ability to operate profitably, maintain its competitive position, to promote and improve its reputation and the awareness of the brands in its portfolio, to successfully operate its growth strategy and the impact of changes in pricing policies, political and regulatory developments in the markets in which the Company operates, and other risks.
• The information and opinions contained in this document are provided as at the date of this presentation and are subject to change without notice.
• No representation or warranty (expressed or implied) is made as to, and no reliance should be placed on, the fairness, accuracy or completeness of the information contained herein. Accordingly, none of the Company, or any of its principal shareholders or subsidiary undertakings or any of such person’s officers or employees accepts any liability whatsoever arising directly or indirectly from the use of this document.
18