closed-loop design of proton donors for lithium-mediated
TRANSCRIPT

Closed-Loop Design of Proton Donors forLithium-Mediated Ammonia Synthesis with
Interpretable Models and Molecular Machine Learning
Dilip Krishnamurthy,1† Nikifar Lazouski,2† Michal L. Gala, 2
Karthish Manthiram2∗ and Venkatasubramanian Viswanathan1∗
1Department of Mechanical Engineering,Carnegie Mellon University, Pittsburgh, PA, USA
2Department of Chemical Engineering,Massachusetts Institute of Technology, Cambridge, MA, USA
†Equally Contributing Authors; ∗E-mails: [email protected], [email protected]
In this work, we experimentally determined the efficacy of several classes of
proton donors for lithium-mediated electrochemical nitrogen reduction in a
tetrahydrofuran-based electrolyte, an attractive alternative method for pro-
ducing ammonia. We then built an interpretable data-driven classification
model, which identified solvatochromic Kamlet-Taft parameters as important
for distinguishing between active and inactive proton donors. After curating a
dataset for the Kamlet-Taft parameters, we trained a deep learning model to
predict the Kamlet-Taft parameters. The combination of classification model
and deep learning model provides a predictive mapping from a given proton
donor to the ability to produce ammonia. We demonstrate that this combina-
tion of classification model with deep learning is superior to a purely mecha-
nistic or a data-driven approach in accuracy and experimental data efficiency.
1
arX
iv:2
008.
0807
8v2
[ph
ysic
s.ch
em-p
h] 1
9 A
ug 2
020
Introduction
Ammonia is an industrial chemical that is used to produce a variety of nitrogen-containing
compounds, such as fertilizers, pharmaceuticals, and polymers (1, 2). In addition to being a
useful synthetic molecule, ammonia (NH3) is also emerging as an attractive carbon-free en-
ergy carrier, as it can be liquefied at moderate pressures (>10 bar) at room temperature (3, 4);
the volumetric density of liquid ammonia greatly exceeds that of lithium-ion batteries and is
competitive with other chemical storage media, such as pressurized and liquid hydrogen (5).
NH3 is typically produced via the Haber-Bosch process at high temperatures (450-550◦ C) and
pressures (up to 200 bar) (6). The process produces up to 1.44% of the world’s carbon dioxide
emissions due to its use of fossil fuels as a hydrogen source (6, 7) and is economically viable
only in large, centralized plants (8).
With dramatically falling renewable energy prices (9), there is an incentive to produce NH3
in a distributed manner using renewable energy. Electrochemical methods have been proposed
to produce ammonia in a distributed manner from intermittent power sources with no CO2 emis-
sions and low capital costs (7). While a large number of catalyst compositions and electrolyzer
configurations have been proposed for electrochemical nitrogen reduction (10, 11), many of
them report Faradaic efficiencies and production rates too low for practical utilization. In addi-
tion, there are numerous calls for rigorous controls and reproducibility in the electrochemical
nitrogen reduction field (12–15), suggesting that ammonia is often detected from adventitious
sources.
Methods utilizing lithium metal as a mediator report some of the highest Faradaic efficien-
cies (FEs) and absolute rates, as well as strict and reproducible controls, of proposed elec-
trochemical approaches for NH3 synthesis (16–19). In this approach, lithium metal is first
2

produced via electrochemical reduction of lithium ions (Li+), which spontaneously breaks the
nitrogen triple bond to produce lithium nitride (20); this lithium nitride can then react with a pro-
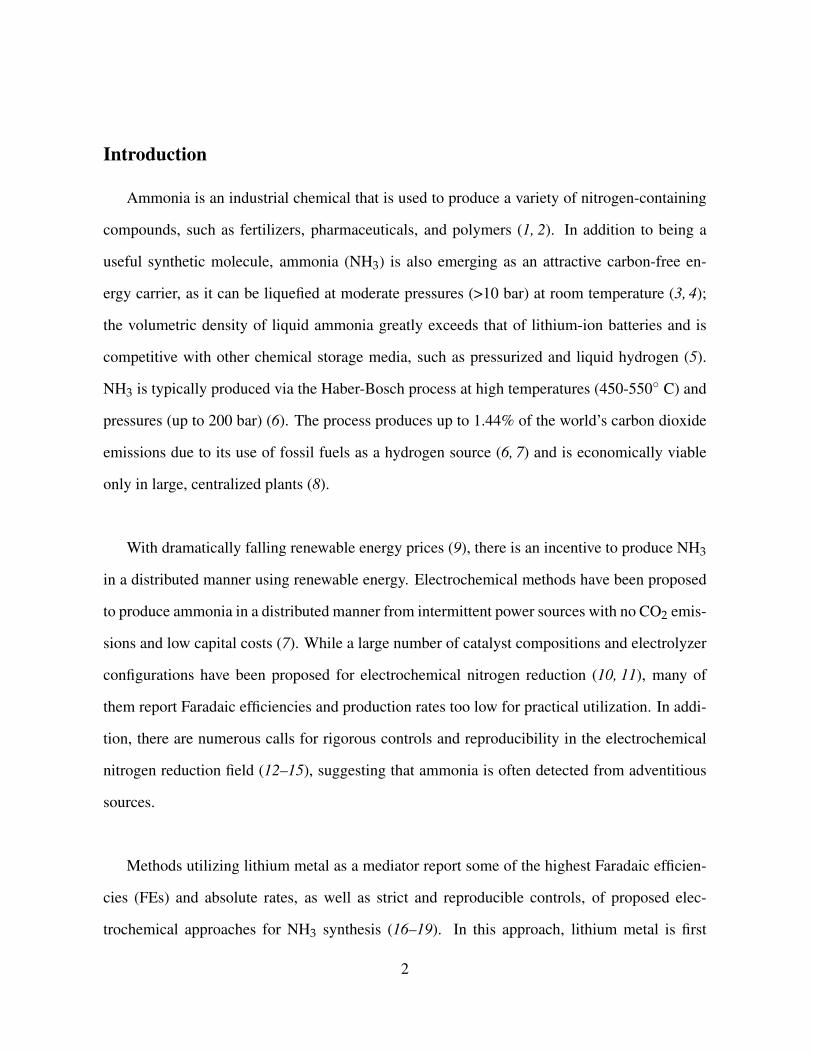
ton donor to form ammonia, recovering lithium ions (Fig. 1a). The approach has been demon-
strated to produce ammonia in both batchwise (17–19) and continuous systems (12, 16, 21, 22).
While the proton donor is responsible for protonating lithium nitride, there are reasons to
believe that its role goes beyond being a source of hydrogen in ammonia, for instance in acti-
vating the lithium nitridation reaction (16, 21, 23). A previous theoretical analysis of a general
nitrogen reduction reaction demonstrated that the thermodynamic activity of the proton donor
is important for selective continuous nitrogen reduction (24). A preliminary survey of proton
donors demonstrated that the identity of the proton donor has a profound effect on the ammonia
yields in the lithium-mediated nitrogen reduction reaction (LM-NRR). (16) A similar effect has
been observed for other reduction reactions involving proton donors (25–27). However, no de-
tailed studies of effect of the identity of the proton donor on LM-NRR have been performed to
date. It is essential to identify molecular design rules for the proton donor in order to improve
selectivity of the process toward ammonia.
Approaches to discovering material design rules typically involve learning a physics-based
functional mapping from material choice to performance through governing equations that rep-
resent relevant physical laws and underlying interactions. As these approaches rely on physical
laws, they are rationalizable or interpretable; certain approximations or empirical terms per-
taining to hard-to-encode interactions may need to be added for model accuracy. On the other
hand, with significant increases in computational power, several studies across disciplines have
demonstrated the effective use of deep learning models to learn the material-to-performance
mapping with increased predictive power albeit with limited interpretability. (28–32) The en-
3

hancement in predictive power is in part attributed to the ability of deep architecture models
to accurately learn physical interactions that are otherwise difficult to explicitly encode with a
functional form.
Our work provides a novel approach for designing the electrolyte composition to enable
electrochemical ammonia production via a lithium-mediated approach. We develop an inter-
pretable deep-learning-based model to predict the ability of a proton donor, which is a primary
electrolyte component, to activate nitrogen reduction. The model forms a part of the closed-loop
methodology between experiments and computation to predict good candidates, provide feed-
back from testing, refine the model, and discover novel proton donors of the electrolyte. Results
from human-intuition-driven experimental exploration were used to generate a data-driven in-
terpretable model to identify relevant physical descriptors. Through experimental testing, we
found 1-butanol can promote LM-NRR to a greater extent than the conventionally-used ethanol.
Through a data-driven approach, we identified most notably that Kamlet-Taft parameters, de-
noted as α and β (33,34), are descriptors of the ability of the proton donor to promote ammonia
formation. The developed closed-loop methodology between experiments and computation is
expected to be beneficial to the broader community and can be leveraged to find novel materials
for electrochemical routes in the production of other chemicals.
Experimental characterization of proton donors for ammonia production
The presence of a proton donor in the electrolyte during LM-NRR is necessary for con-
verting fixed nitrogen in the form of lithium nitride to ammonia (Fig. 1a). As lithium nitride
and its derivatives, imide and amide, are strong bases (pKa = 41 for NH3 (35)), it is likely that
many compounds irrespective of structure can thermodynamically promote liberation of am-
monia from nitride. However, there appears to exist a threshold concentration of proton donor
4

below which nitride ammonia and lithium nitride may not be detected following electrolysis of
a lithium-ion-containing solution, particularly when ethanol is used as the proton donor (16,21).
This suggests that the proton donor plays a secondary role in LM-NRR, i.e. that it promotes the
reaction to fix the nitrogen, either electrochemically or thermochemically. The ability of of a
proton donor to promote nitrogen fixation appears to depend on its structure (16).
In order to determine whether a given proton donor can promote LM-NRR, a number of can-
didate compounds were tested at flooded stainless steel electrodes at a range of concentrations
in a previously described setup (21). Briefly, a 1 M LiBF4 in tetrahydrofuran (THF) electrolyte
was used in a 2-compartment electrochemical cell with a platinum foil anode, stainless steel
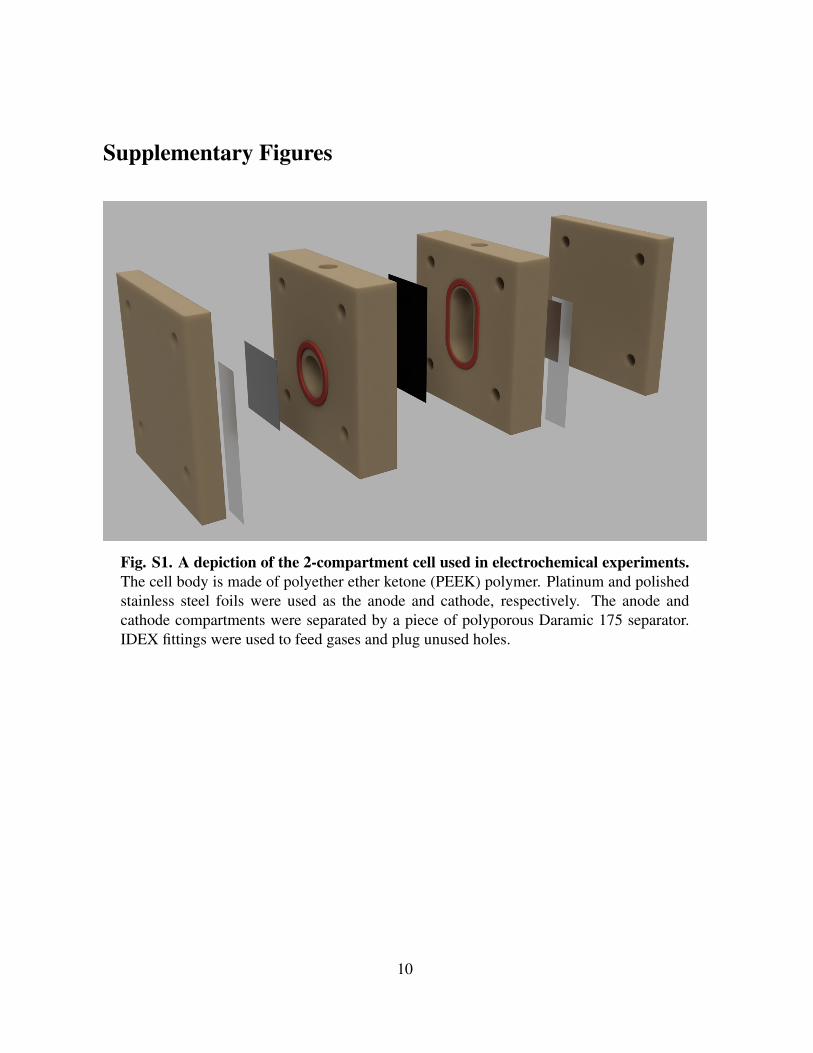
foil cathode, and polyporous Daramic separator (Fig. 1b, Fig. S1). A range of concentrations
of proton donor were added to the electrolyte prior to electrolysis. Nitrogen gas was flowed
through the the cathode compartment while a constant current was applied across the cell (Fig.
1b). If the proton donor promotes nitrogen reduction, then ammonia forms and can be detected
in the electrolyte via a colorimetric assay (see Supplementary Methods).
We decided that a proton donor is classified as active toward in LM-NRR if the Faradaic
efficiency (FE) towards ammonia in at least one operating condition exceeds 0.5%; if all exper-
iments lead to FEs below 0.5%, then the proton donor is considered inactive. This threshold
was chosen based on the minimum quantifiable FE (∼0.1%) and the spread in FE typically ob-
served at low production rates (∼0.1%); a threshold value of 0.5% increases the likelihood that
a given proton source is indeed active for LM-NRR when ammonia is detected and reduces the
likelihood that the ammonia signal is spurious or comes from adventitious sources (15, 36–38).
For a detailed description of experimental procedures, see the Supplementary Methods.
5

As it is resource-intensive and time-consuming to test a large number of conditions and
compounds for activity in LM-NRR, there is a need for determining what factors are important
for activity to reduce the number of necessary experiments. As the differences in activity are a
function of proton donor structure, several simple hypotheses could be proposed to explain the
differences in activity between various classes of compounds. For instance, one could propose
that the activity of the proton donor is correlated to its acidity (pKa value). For highly acidic
donors, such as carboxylic acids, the reaction between lithium metal and the proton donor,
or even direct electrochemical reduction of the proton donor to hydrogen gas without lithium
deposition, may be favored over the nitrogen reduction reaction. Weakly acidic proton donors,
on the other hand, may be inert in electrochemical reactions or reactions involving lithium (e.g.,
the reaction between t-butanol and lithium is slow (39)), thus not promoting nitrogen reduction
significantly. Therefore, an intermediate pKa value could be desired for nitrogen reduction. In
light of this, pKa and other potential descriptors were examined for the ability to distinguish
between active and inactive proton donors. No significant classification ability was observed
for simple descriptors chemical and steric descriptors such as pKa and Bader volume (Fig. S4).
As simple descriptors proved to be insufficient for describing the differences in tested proton
donors towards nitrogen reduction, we turned to a more rigorous, data-driven approach to find
activity correlations from experimental results
Identifying desirable properties of proton donors
We employed a data-driven approach to determine favorable properties of proton donors
towards promoting LM-NRR. Several quantitative properties of proton donors were assessed
including measures of solvent strength as acids or bases (acid dissociation constant (pK,a),
Guttman donor and acceptor numbers (40–42)), measures of reactivity (highest occupied molec-
ular orbital (HOMO) and lowest unoccupied molecular orbital (LUMO) levels (41, 43, 44)),
6

solvatochromatic Kamlet-Taft (KT) parameters (α, β, π∗ (45, 46)), measures of ionic character
and polarizability (Bader charge), and computable measures of steric hindrance and diffusiv-
ity (Bader volume) (47, 48). Using these properties, we built and trained a range of models
(linear and non-linear supervised learning models, regression models, decision trees) to predict
the experimentally observed binary activity classification for the initial set of compounds. We
curated a training dataset composed of all the aforementioned properties curated from existing
literature (49–51) and our density functional theory (DFT) calculations. We then found that a
decision tree (Fig. 3a) which takes KT parameters as inputs was associated with high classifi-
cation ability (≈ 96% accuracy) in addition to being interpretable. Specifically, KT parameters
denoted as α and β, which quantify solvent hydrogen-bond donating and accepting ability, were
identified as descriptors of activity. The decision tree was optimized through cross-validation
to balance tree complexity and misclassification error of the model (see Supporting Information
for details).
The obtained decision tree (Fig. 3a) identifies a simple criterion for above-threshold activity
towards electrochemical ammonia production: α > αt = 0.78 and β > βt = 0.59. The iden-
tified classification can be rationalized based on the fact that promising proton donors should
exhibit both high proton donating (α > αt) and accepting ability (β > βt). Such a criterion can
be rationalized as the key nitrogen fixation reaction (6Li + N2→ 3Li3N) involves formation of
undercoordinated lithium ions (Li+), the closest chemical analogue to a proton, during forma-
tion of lithium nitride; these ions can be stabilized by the basicity of the proton donor (β), thus
accelerating nitrogen fixation. The need for a threshold solvent acidity (α) can be rationalized
by the fact that the nitrogen must be protonated to ultimately produce ammonia; stabilization of
deprotonated forms of nitrogen during reduction may accelerate the fixation reaction. Alterna-
tively, proton donating character may be necessary for promoting the formation of defect sites
7

in the lithium metal, which may be necessary for formation of lithium nitride (23). An inherent
proton donating-accepting trade-off emerges in the α− β space (Fig. 3b), where only a small
fraction of candidates strike a balance above identified threshold values.
A majority of compounds identified to be promising for ammonia production from the first
set of experimentally tested candidates are recovered (Table S3), which indicates the robust-
ness of the developed classification model. Several additional candidates with experimentally
known KT parameter values were then tested as to more accurately determine αT and βT (Fig.
3, Tables S2 and S4). This closed-loop refinement of the interpretable model (Fig. 5) was
performed thrice after initial experiments, which decreased the uncertainty in fitted αT and βT.
The limited number of proton donors exceeding these threshold KT parameter values (Fig. 3b,
Fig. S5) highlights that identifying novel candidates is challenging due to the narrow diversity
of chemical structures that occur within these thresholds for α and β.
Deep-learning framework for prediction of KT parameters
Given that KT parameters were identified as key descriptors of the ability of proton donors to
promote LM-NRR and that they are experimentally known only for a limited set of compounds,
we developed a deep learning model to predict these parameters for arbitrary compounds in
order to assess the activity of a wide range of candidate donors. While other approaches to
predict KT parameters have been proposed, (52, 53) their associated computational cost is sig-
nificantly high for exploring a large chemical space. Our model was trained on a curated dataset
of compounds for which experimentally measured values for α and β are reported in the liter-
ature (49–51); the dataset size was n = 222 compounds (low-data regime), thereby requiring
careful and robust model training using an ensemble of models. Using an ensemble of models,
i.e. a population of independently trained models with varied initial starting configurations,
8

allowed us to quantify the uncertainty of predictions for novel compounds and families of com-
pounds.
We employed a deep learning-based model as implemented in the DeepChem package (54)
to predict the KT parameters since deep learning models have proven useful especially in the
low-data regime (55). In addition, the mapping from molecular features to activity is likely
high-dimensional due to the complex underlying physics. The model was trained on molecu-
lar features from candidates using the simplified molecular-input line-entry system (SMILES)
representation. Out of several molecular featurization approaches based on SMILES represen-
tations, the weave featurization coupled with a weave model (deep neural network) (56) led
to the most accurate (training and testing RMSEs of ≈0.01) and generalizable predictions, i.e.
ones with low cross-validation error, of α and β (Fig. 4). The weave featurization (57) encodes
both local chemical environment and connectivity of atoms in a molecule. A detailed descrip-
tion of the featurization scheme, neural network architecture, and training routines can be found
in the Supplementary Information.
The deep learning model (material-descriptor relationship) coupled with the classification
model (descriptor-activity relationship) was used to predict the activity of tested and novel pro-
ton donors (Fig. 3). In order to evaluate the robustness of predictions associated with various
proton donors and to determine promising candidates to experimentally test, for each candidate
we computed the c-value (confidence value) (58) from an ensemble of deep learning models.
The c-value for a given material, cM, is computed as the fraction of ensemble models that pre-
dict the candidate to exhibit desirable performance, which in this context can be defined as
9

cM =# of models with desirable parameters
# of models in ensemble=
1Nens
Nens
∑n=1
Θ(αMpred,n − αT)Θ(βM
pred,n − βT).
(1)
where, Nens is the number of models in the ensemble, Θ is the Heaviside function, αMpred,n
and βMpred,n are the predicted values of KT parameters from the nth model in the ensemble, and
αT and βT represent the threshold values identified by the classification model. The approach
involving an ensemble of models allows us to identify candidates for which there is disagree-
ment between individual models, which indicates additional training data is necessary for higher
certainty.
The solvatochromic parameters α and β were predicted for 1,000,000 compounds from the
PubChem database. We observed that a large fraction of the compounds have predicted KT
parameter values that lie outside the region described by the decision tree obtained from ex-
periments. Only ∼0.54% of the 1 million compounds have c-values exceeding 0.5 and only
∼0.19% have c-values exceeding 0.7, suggesting that compounds which the models predict to
be active with a high degree of confidence are rare. Linear aliphatic alcohols, which were ex-
perimentally determined to be active in LM-NRR, are recovered through the models with high
c-values. However, the vast majority of candidates with high c-values are biological compounds
with both hydrogen bond donating (hydroxyl) and accepting (amine) groups, hence their large α
and β. These candidates could not be tested for activity in LM-NRR as they contained nitrogen
and were not readily commercially available.
As many candidates with high c-values could not be tested due to the aforementioned rea-
sons, the goal of further experiments was to learn the descriptor-activity relationship or the
delineating surface between active and inactive candidates with greater accuracy. It is worth
10

highlighting that after every batch of performed experiments, the experimental activity was
used to augment the input data to the classification model in a closed-loop fashion to more ac-
curately learn and update the descriptor-activity relationship (Fig. 5).
Experimental validation of models
In order to assess and improve the predictive capability of the interpretable decision tree and
deep learning models, we selected a number of the candidates from various regions of the α-β
space for experimental validation (Fig. 6). Several proton donors with known KT parameters
above the identified threshold values were tested as a result of the decision tree model. Novel
proton donors for which experimentally measured KT parameters were not known, but were
estimated to be promising using the deep-learning model, were also tested; a total of seven
candidates were selected for further experimental testing. Two proton donors were predicted
to be inactive with a large degree of confidence (c ≈ 0): formic acid and ethyl acetate. Five
proton donors were predicted to be active with various degrees of confidence (c = 0.17− 0.67):
2-ethyl-1-butanol, triethylene glycol, 2,2-dimethyl-1,3-propanediol, 4-methoxybutan-1-ol, and
1,4-cyclohexanedimethanol.
Formic acid and ethyl acetate were found to not promote nitrogen reduction, as predicted
by the decision-tree and deep-learning models, due to their extreme α and β values (Fig. 6).
Of the five potentially active candidates tested, two were found to promote LM-NRR: 2-ethyl-
1-butanol and 2,2-dimethyl-1,3-propanediol produced ammonia with FEs of 3.62% and 0.84%,
respectively (Fig. 6). The ether-group-containing compounds were found to be inactive, even
despite relatively large c-values, especially in the case of triethylene glycol. While both of the
ether-group-containing compounds have above-threshold α and β values, they have higher α
11

and lower β than the two active aliphatic alcohols (Table S3). This may suggest the relative
importance of having a high β or balanced α and β values for proton donors that are active in
LM-NRR.
Discussion
Differences between experimentally measured and predicted proton donor activity could
have several origins. One reason could be changes in the proton donors’ structures under the
very reductive conditions of the experiment (in the presence of lithium metal). For instance,
halogenated compounds could easily decompose to form lithium halide salts on the electrode,
preventing further electrochemical reactions, as well as changing the structure of the proton
donor significantly. Analyzing the effect of these decomposition pathways is outside the scope
of this study. Alternatively, the model correlating the activity with bulk KT parameters may
not be all-encompassing; there may be additional descriptors that may need to be incorporated
into the model to fully capture the differences between proton donors. The decision tree from
data-driven modeling maximized classification performance while striking the right complexity-
performance trade-off based on decision tree optimization through cross-validation; the inclu-
sion of additional nodes to the model was identified to lead to overfitting of the model and an
associated lower information criterion. Additional experimental data using predicted candidates
could prove to be useful and necessitate the inclusion of additional parameters or altering the
values of existing parameters to accurately predict experimental results (Fig. 3).
We highlight that the two-model approach involving the material-descriptor mapping (deep-
architecture model) in conjunction with the descriptor-activity mapping (shallow-learning model)
is a novel paradigm in material discovery. The shallow-learning model allows the interpretation
12

of identified descriptors. In the current work, the ability of the solvatochromic parameters to de-
scribe the activity towards ammonia production is rationalized based on mechanistic hypotheses
regarding the key nitrogen fixation reaction. Alongside, the deep-learning model has the ability
to capture the potentially non-linear mapping between a given material and the descriptors.
A purely deep-learning approach to predict experimental activity directly from tested com-
pounds would be limited to a few tens of experimental training data. A key advantage in the
current approach is its ability to learn the mapping on hundreds of relevant experimentally-
derived training data pertaining to solvatochromic parameters, the importance of which was
shown via the interpretable model. On the other hand, a purely mechanistic approach (shal-
low model) would enable activity prediction only on a few hundred materials for which sol-
vatochromic parameters are known. The developed methodology allows interpretability while
enabling predictions on a vast set of materials with the ensemble of models as a way to calibrate
the associated confidence.
Conclusions
In the present work, we determined the effect of chemical structure of proton donors on
lithium-mediated nitrogen reduction by testing a number of families of proton donors for activ-
ity. After experimentally testing a number of families of proton donors, some structure-activity
trends were observed. Through the testing, 1-butanol was discovered as the most effective pro-
ton donor for LM-NRR. After failing to explain observed structure-activity trends with simple
parameterization models, a rigorous data-driven driven approach was used to identify descrip-
tors of activity towards ammonia production. Solvatochromic Kamlet-Taft parameters α and
β were found to best describe proton donors’ ability to promote nitrogen reduction, leading to
an interpretable classification model involving the two parameters. The fact that these solva-
tochromic parameters emerge as the descriptors can be rationalized based on the mechanistic
13

hypothesis that the solvent’s hydrogen bond donating (captured by α) and accepting (captured
by β) ability are important in the key reaction of simultaneous lithium ion stabilization and pro-
tonation of nitrogen by the proton donor.
A deep learning based model (material-descriptor mapping) was developed on molecular
features to predict α and β values for any given compound, and was used in conjunction with
the classification model (descriptor-activity mapping) to perform a vast search for promising
candidates from about 1M compounds. Through a closed-loop approach, candidates were pro-
posed for experimental testing with the primary goal of best learning the delineating surface
(in α − β space) between active and inactive candidates. The loop between computation and
experiments was closed by data augmentation after every batch of experimental testing. After
the initial experimentation phase four loops were carried out (Fig. 5) with batches of experi-
ments performed each time towards learning the material-activity relationship. The closed-loop
approach between experiments and theory has enabled an increase in the fraction of tested ac-
tive candidates from 30% during the initial exploration to 65% during the combined effort.
In the process, several novel active proton donors were discovered, demonstrating the robust-
ness and power of the coupled experimental-data driven approach to studying complex systems.
We believe that the approach presented in this work can be utilized for studying and im-
proving a range of chemical and catalytic systems. While the approach identified descriptors
based on strong correlations with desired outputs, sufficiently strong correlations help build hy-
potheses for mechanistic understanding of complex chemical processes. By using a limited set
of experimental data, we are able to determine experimental parameters than can predict and
affect future experiments (Fig. 3). An automated method for predicting the values of relevant
parameters allows for rapid identification of potential leads. By testing novel leads, the model
14

and understanding of the process can be significantly improved when compared to a conven-
tional, intuition-driven experimental approach.
15

References
1. F. FAO, et al., Food and Agriculture Organization of the United Nations. (2017).
2. J. W. Erisman, M. A. Sutton, J. Galloway, Z. Klimont, W. Winiwarter, Nat. Geosci. 1, 636
(2008).
3. G. L. Soloveichik, Beilstein J. Nanotechnol. 5, 1399 (2014).
4. F. Jiao, B. Xu, Adv. Mater. 31, 1805173 (2019).
5. T. M. Gür, Energy Environ. Sci. 11, 2696 (2018).
6. S. Giddey, S. Badwal, C. Munnings, M. Dolan, ACS Sustain. Chem. Eng. 5, 10231 (2017).
7. G. Soloveichik, Nat. Catal. 2, 377 (2019).
8. S. L. Foster, et al., Nat. Catal. 1, 490 (2018).
9. IRENA, Renewable Power Generation Costs in 2019, Tech. rep. (2020).
10. I. J. McPherson, T. Sudmeier, J. Fellowes, S. C. E. Tsang, Dalton Trans. 48, 1562 (2019).
11. L. Shi, Y. Yin, S. Wang, H. Sun (2020).
12. S. Z. Andersen, et al., Nature 570, 504 (2019).
13. L. F. Greenlee, J. N. Renner, S. L. Foster, ACS Catal. 8, 7820 (2018).
14. C. MacLaughlin, ACS Energy Lett. pp. 1432–1436 (2019).
15. M. A. Shipman, M. D. Symes, Electrochim. Acta 258, 618 (2017).
16. A. Tsuneto, A. Kudo, T. Sakata, J. Electroanal. Chem. 367, 183 (1994).
16

17. J. M. McEnaney, et al., Energy Environ. Sci. 10, 1621 (2017).
18. J.-L. Ma, D. Bao, M.-M. Shi, J.-M. Yan, X.-B. Zhang, Chem 2, 525 (2017).
19. K. Kim, et al., ChemSusChem 11, 120 (2018).
20. N. Greenwood, A. Earnshaw, Chemistry of the Elements 2nd Edition (Butterworth-
Heinemann, 1997).
21. N. Lazouski, Z. J. Schiffer, K. Williams, K. Manthiram, Joule 3, 1127 (2019).
22. J. A. Schwalbe, et al., ChemElectroChem p. celc.201902124 (2020).
23. E. F. McFarlane, F. C. Tompkins, Trans. Faraday Soc. 58, 997 (1962).
24. A. R. Singh, et al., ACS Catal. 9, 8316 (2019).
25. B. K. Peters, et al., Science 363, 838 (2019).
26. C. Jiang, A. W. Nichols, J. F. Walzer, C. W. Machan, Inorg. Chem. 59, 1883 (2020). PMID:
31935070.
27. S. Ren, et al., Science 365, 367 (2019).
28. B. Meredig, et al., Mol. Syst. Des. Eng. 3, 819 (2018).
29. L. Ward, A. Agrawal, A. Choudhary, C. Wolverton, npj Comput. Mater. 2, 1 (2016).
30. P. V. Balachandran, et al., Phys. Rev. Mater. 2, 043802 (2018).
31. L. Ward, et al., Acta Mater. 159, 102 (2018).
32. F. Ren, et al., Sci. Adv. 4, eaaq1566 (2018).
33. M. J. Kamlet, R. Taft, J. Am. Chem. Soc. 98, 377 (1976).
17

34. R. Taft, M. J. Kamlet, J. Am. Chem. Soc. 98, 2886 (1976).
35. F. G. Bordwell, G. E. Drucker, H. E. Fried, J. Org. Chem. 46, 632 (1981).
36. H.-L. Du, T. R. Gengenbach, R. Hodgetts, D. R. MacFarlane, A. N. Simonov, ACS Sustain.
Chem. Eng. 7, 6839 (2019).
37. B. Hu, M. Hu, L. Seefeldt, T. L. Liu, ACS Energy Lett. 4, 1053 (2019).
38. R. Dabundo, et al., PLoS One 9, e110335 (2014).
39. T. V. Talalaeva, G. V. Tsareva, A. P. Simonov, K. A. Kocheshkov, Bulletin of the Academy
of Sciences, USSR Division of Chemical Science 13, 595 (1964).
40. A. Khetan, A. Luntz, V. Viswanathan, J. Phys. Chem. Lett. 6, 1254 (2015).
41. A. Khetan, H. Pitsch, V. Viswanathan, J. Phys. Chem. Lett. 5, 1318 (2014).
42. V. Gutmann, Coord. Chem. Rev. 18, 225 (1976).
43. B. D. McCloskey, et al., J. Phys. Chem. Lett. 3, 3043 (2012).
44. A. Khetan, H. Pitsch, V. Viswanathan, Phys. Rev. Mater. 1, 045401 (2017).
45. L. Crowhurst, R. Falcone, N. L. Lancaster, V. Llopis-Mestre, T. Welton, J. Org. Chem. 71,
8847 (2006).
46. L. Y. Wilson, G. R. Famini, J. Med. Chem. 34, 1668 (1991).
47. V. Pande, V. Viswanathan, J. Phys. Chem. Lett. 10, 7031 (2019).
48. M. García-Mota, et al., J. Phys. Chem. C 116, 21077 (2012).
49. Y. Marcus, Chem. Soc. Rev. 22, 409 (1993).
18

50. P. Meyer, G. Maurer, Ind. Eng. Chem. Res. 34, 373 (1995).
51. R. Stenutz, Kamlet-taft solvent parameters, http://www.stenutz.eu/chem/
solv26.php (accessed June 2020).
52. W. E. Waghorne, J. Solution Chem. pp. 1–20 (2020).
53. J. Sherwood, J. Granelli, C. R. McElroy, J. H. Clark, Molecules 24, 2209 (2019).
54. B. Ramsundar, et al., Deep Learning for the Life Sciences (O’Reilly Media, 2019). https:
//www.amazon.com/Deep-Learning-Life-Sciences-Microscopy/dp/
1492039837.
55. M. Moret, L. Friedrich, F. Grisoni, D. Merk, G. Schneider, Nat. Mach. Intell. 2, 171 (2020).
56. S. Kearnes, K. McCloskey, M. Berndl, V. Pande, P. Riley, J. Comput.-Aided Mol. Des. 30,
595 (2016).
57. Z. Wu, et al., Chem. Sci. 9, 513 (2018).
58. G. Houchins, V. Viswanathan, Phys. Rev. B 96, 134426 (2017).
Acknowledgments
We thank Matt Wolski of Daramic for providing us with polyporous separator samples.
This material is based upon work supported by the National Science Foundation under Grant
No. 1944007. Funding for this research was provided by the Abdul Latif Jameel World Water
and Food Systems Lab (J-WAFS) at MIT. N.L. acknowledges support by the National Science
Foundation Graduate Research Fellowship under Grant No. 1122374. D.K. and V.V. grate-
fully acknowledge funding support from the National Science Foundation under award CBET-
1554273. D.K and V.V. thank Bharath Ramsundar for useful discussions and feedback about
19
the computational models and the deep learning methodology. V.V. acknowledges support from
the Scott Institute for Energy Innovation at Carnegie Mellon University. D.K. acknowledges
discussions with Victor Venturi regarding the deep learning model implementation.
Author Contributions
Conceptualization, N.L. and K.M.; Methodology - Experimental - N.L.; Methodology -
Modeling - D.K., V.V.; Investigation, N.L. and M.L.G.; Formal Analysis, D.K. and V.V.; Data
Curation, D.K.; Writing - Original Draft, N.L. and D.K.; Writing - Review & Editing - N.L.,
D.K., K.M., and V.V.; Supervision. K.M. and V.V.
Competing Interests
D.K., V.V., N.L., and K.M. are inventors on a provisional patent application, 63/066841,
related to hydrogen donors for lithium-mediated ammonia synthesis.
Data and Materials Availability
All code and supporting data used in the work will be made available on Github. We will
release this dataset into the MoleculeNet benchmark suite named as the KamletTaft-dataset.
Supplementary materials
Materials and Methods
20

Supplementary Text
Figs. S1 to S11
Tables S1 to S5
References (1-17)
21
Figure 1. Lithium-mediated ammonia production from nitrogen. (a) The lithium-mediatedcatalytic cycle, with species flows highlighted. (b) The electrochemical cell setup used forcontinuous ammonia production and proton donor testing.
22

Figure 2. Maximum obtained ammonia Faradaic efficiencies for a variety of tested protondonors. Proton donors for which FE values are given in green are classified as active (ammoniaFE > 0.5%), those in red are classified as inactive (ammonia FE < 0.5%). One proton donor,tert-butanol, was classified as inactive as the maximum obtained FE (labeled in yellow) did notexceed 0.5% when accounting for the error in the measurements. Note that the conditions atwhich maximum reported FEs were obtained differ between proton sources (Table S2). Protondonors labeled with a star (*) were used in closed-loop improvement of an interpretable model(see below), while those labeled with two stars (**) were selected for validation of a deep-learning model (see below).
23
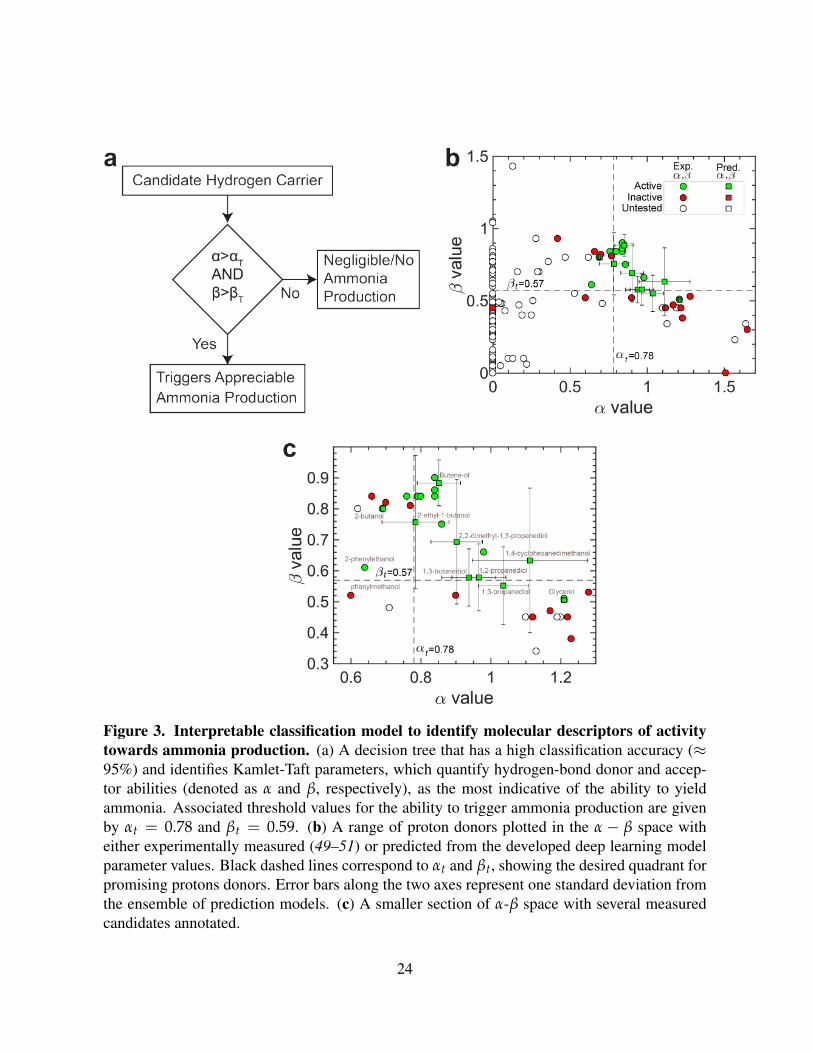
Figure 3. Interpretable classification model to identify molecular descriptors of activitytowards ammonia production. (a) A decision tree that has a high classification accuracy (≈95%) and identifies Kamlet-Taft parameters, which quantify hydrogen-bond donor and accep-tor abilities (denoted as α and β, respectively), as the most indicative of the ability to yieldammonia. Associated threshold values for the ability to trigger ammonia production are givenby αt = 0.78 and βt = 0.59. (b) A range of proton donors plotted in the α − β space witheither experimentally measured (49–51) or predicted from the developed deep learning modelparameter values. Black dashed lines correspond to αt and βt, showing the desired quadrant forpromising protons donors. Error bars along the two axes represent one standard deviation fromthe ensemble of prediction models. (c) A smaller section of α-β space with several measuredcandidates annotated.
24

Figure 4. A deep learning model to predict Kamlet-Taft parameters. (a) Steps involved in theapproach to predicting α and β (KT) parameters. (b) The weave featurization technique anddeep learning framework involving an ensemble of models for robust predictions (57). Parityplots for (c) α and (d) β values obtained from the developed deep-learning model. Note thatthe predictions on test set after cross-validation have comparable performance to that on thetraining set indicating generalizability of the model.
25

Figure 5. Closed-Loop Learning of the Material-Activity Mapping. (a) The two-part model,consisting of the interpretable decision tree model and the deep-learning model, used to pro-posed the next batch of experiments to test in order to learn the most about the material-activitymapping with every successive batch of experiments. (b) A schematic showing informationflow towards identifying novel proton donors and learning the material-activity relationship.The depicted task of model learning refers to the process of learning the material-activity rela-tionship based on the initial set of experiments (initial model). The task of model refinementbegins with activity predictions on several possible candidates using the initial model, whichis then used to propose a sequence of experimental testing. The testing outcomes are used toaugment the data to re-learn the descriptor-activity relationship, which closes the training loop.
26

Figure 6. Experimental testing of candidates suggested from deep-learning models. (a)Predicted α and β values from an ensemble of models for selected proton donors. Not allproton donors are included so as to maintain clarity in the figure. (b) Experimentally measuredmaximum FEs towards NH3 for several proton donors with their c-values for activity. FEs givenin green represent that the binary activity classification matches the predicted one, while a thosein red do not match the predicted activity. 4/7 of the predictions were correct.
27

Supplementary Information forClosed-Loop Design of Proton Donors for
Lithium-Mediated Ammonia Synthesis withInterpretable Models and Molecular Machine Learning
Dilip Krishnamurthy,1† Nikifar Lazouski,2† Michal L. Gala, 2
Karthish Manthiram2∗ and Venkatasubramanian Viswanathan1∗
1Department of Mechanical Engineering,Carnegie Mellon University, Pittsburgh, PA, USA
2Department of Chemical Engineering,Massachusetts Institute of Technology, Cambridge, MA, USA
†Equally Contributing Authors; ∗E-mails: [email protected], [email protected]
MaterialsTetrahydrofuran (THF, 99+%, stabilized with BHT), molecular sieves (3Å, 4-8 mesh), 1-
propanol (99+%, extra pure), L-alanine (99%), and 2-methyl-1-propanol (isobutanol, ACSreagent, spectro grade, 99+%) were purchased from Acros Organics. Lithium tetrafluoroborate(LiBF4, 98%), tert-butyl alcohol (99%), 2-butanol (>99%), 2-ethyl-1-butanol (98%), 1-pentanol(ACS reagent, ≥99%), 1-hexanol (reagent grade, 98%), 1-heptanol (98%), 1-nonanol (98%),benzyl alcohol (99.8%, anhydrous), phenol (unstabilized, ≥99%), 1-phenylethanol (98%), 2-phenylethanol (99%), 2-chloroethanol (99%), 2,2,2-trifluoroethanol (ReagentPlus,≥99%), hex-afluoro 2-propanol (≥99%), ethylene glycol (anhydrous, 99.8%), 1,3-butanediol (±, 99%, an-hydrous), glycerol (ReagentPlus,≥99%), triethyleneglycol (ReagentPlus, 99%), 1,5-pentanediol(≥97%), acetic acid (ReagentPlus, ≥99%), hexanoic acid (≥99%), allyl alcohol (99%), 2-methoxyethanol (99.8%, anhydrous), 1-propanethiol (99%), hydrochloric acid (HCl, ACS Reagent,37%), sodium salicylate (ReagentPlus, ≥99.5%), and sodium hypochlorite (NaOCl, 10-15%)were purchased from Sigma-Aldrich. Methanol (anhydrous, 99.9%), cyclohexanol (99%), 3-butene-1-ol (98+%), sodium nitroprusside (99-102%), and ammonium chloride (NH4Cl, anhy-drous, 99.99%) were purchased from Alfa Aesar. Ethanol (Koptec, anhydrous, 200 proof),2-propanol (Semi grade, BDH), sodium hydroxide (NaOH, Macron Fine Chemicals, pellet
1

form), and acetone (ACS, BDH Chemical) were purchased from VWR International. 1-butanol(Certified ACS), 3-methyl-1-butanol (isoamyl alcohol, for molecular biology), dichloromethane(DCM, 99.5%), and hexanes (C6H14) were purchased from Fisher Scientific. Formic acid (ACSReagent, 98-100%) and ethanolamine were purchased from EMD Millipore. Milli-Q water wasobtained by filtering deionized (DI) water through a Milli-Q purification system (Merck, Milli-pore Corporation). Platinum foil (Pt, 0.025 mm thick, 99.99%, trace metals basis) and 1-octanol(99%) were purchased from Beantown Chemical. Argon gas (UHP, 5.0 grade) was purchasedfrom Airgas. Nitrogen gas was available in-house; it is generated by boil-off of liquid nitro-gen from Airgas. Steel foil (cold-worked 304 stainless steel, 0.002" thick) was purchased fromMcMaster-Carr. Polyporous Daramic 175 separators were received as a sample from Daramic(Charlotte, NC).
Electrolyte preparationDry molecular sieves were prepared by washing as-purchased or previously used molecular
sieves with acetone and drying in a muffle furnace at 300 ◦C for 5 hours. The sieves were addedas 20% by volume to as-purchased THF in a round-bottom flask. The flask was sealed from theatmosphere with a rubber septum are dried for at least 96 hours before use.
As purchased LiBF4 was dissolved in dry THF to obtain a 1 M LiBF4 in THF electrolytesolution. The LiBF4 must be sufficiently pure for successful ammonia production; we foundthat salt purchased from Sigma-Aldrich is sufficiently pure for these experiments, while othervendors’ may require additional purification; one potential purification procedure is given inprior work (1). The solution was centrifuged at 6000 rpm (4430 rcf) to remove insoluble pre-cipitates. The clear solution was transferred to oven-dried vials, stored in a desiccator, and usedwithin 12 hours of preparation. The solution transfer operations can be performed in the am-bient atmosphere; the solutions should not be stored open to the atmosphere, however, as theelectrolyte solution can absorb a significant amount of water from ambient air.
The proton donor was added to the electrolyte immediately prior to experiments. The totalvolume of proton donor-containing electrolyte solution prepared for each experiment is 4 mL.If the volume of proton donor that needs to be added to obtain the desired concentration is <100µL, then the proton donor was added to 4 mL of electrolyte directly. If the volume required is>100 µL, then the proton donor added to a smaller volume of electrolyte that was rounded tothe nearest 0.1 mL, so that the final volume of the proton donor in electrolyte solution wouldequal 4 mL. For example, to prepare 0.2 M ethanol, 47 µL of ethanol were added to 4 mL ofelectrolyte solution, while to prepare 0.6 M 1-butanol, 220 µL of 1-butanol were added to 3.8mL of electrolyte solution.
2

Nitrogen reduction experimentsPolished stainless steel electrodes were used as the cathode Stainless steel shims were cut
into 2x2 cm pieces, wet with DI water, and polished with 400 grit followed by 1500 grit sand-paper thoroughly. The polished foils were rinsed thoroughly with DI water and dried in air at80 ◦C. Stainless steel cathodes were used in a single experiment before discarding.
Parallel plate cells described in prior work were used to perform nitrogen reduction exper-iments (1). Briefly, a polished steel foil was used as the cathode, a platinum foil was used asthe anode, a piece of Daramic was used as a separator, and machined polyether ether ketone(PEEK) cell parts were used for the cell body (Fig. S1). All cell parts were dried in air at 80◦Cfor at least 20 minutes prior to use.
Nitrogen (or argon, in control experiments) gas was flowed at 10 standard cubic centimetersper minute (sccm) through a vial containing THF and molecular sieves to saturate the feed gaswith THF. The THF-saturated feed gas was then flowed to an assembled 2-compartment cell.The proton-donor electrolyte was added first to the anode compartment, then to the cathodecompartment. 1.75 mL of electrolyte was added to each compartment; note that this is the vol-ume added to each compartment, and may not be the final volume in each compartment at theconclusion of the experiment due to solvent evaporation. The feed gas was flowed through theelectrolyte for 10 minute at open circuit to saturate the electrolyte with gas and to strip oxygenfrom the solution.
After saturating the solution with the feed gas, a constant current of 20 mA was appliedfor 6 minutes using a Tekpower 5003 DC power source, for a total of 7.2 coulombs of chargepassed. In some experiments (see Supplementary Table 2), the potential required to applied 20mA exceeded 50 V. In experiments where an excess of 50 V was required to apply 20 mA, aconstant potential of 50 V was applied across the cell for 6 minutes, and the total charge passedwas quantified by measuring the potential drop across a resistor in series with the cell (Fig. S6).As the electrolyte resistance does not significantly change with concentration of most protondonors, the higher voltage required is likely due to changes in SEIs at the cathode or anode inthese experiments.
Following application of current, the catholyte was immediately removed from the cell anddiluted in water. In most experiments, the electrolyte was used directly to prepare samplesfor ammonia quantification. In these cases, the samples were made as follows: one by adding200 µL of catholyte to 1800 µL of Milli-Q water (10-fold dilution), and another by adding100 µL of catholyte to 1900 µL of water (20-fold dilution), to be able to accurately quantifyammonia at both lower and higher Faradaic efficiencies. In some cases, the proton donor canaffect the colorimetric assay negatively by either phase separating with water (e.g. octanol),leading to higher spurious absorbances, or chemically (e.g. ethyl acetate, thiols), leading to
3

lower or shifted absorbances (Fig. S3). In these cases, the proton donor was extracted from theammonia-containing samples. To extract the proton donor, 500 µL of electrolyte were addedto 4.5 mL of 0.05 M H2SO4 in water. The proton donor in resulting acidified solution wasextracted with 3 mL of either DCM or hexanes three times. Milli-Q water was then added tothe aqueous phase to a final volume of 5 mL if the volume decreased, which may occur if theTHF was extracted into the organic phase. The aqueous phase was centrifuged at 6000 rpm(4430 rcf) for 10 minutes to promote complete phase separation. The aqueous phase was thenquenched with base by adding 1500 µL of the acidified solution to 500 µL of 0.4 M NaOH, orby adding 750 µL of the acidified solution to 250 µL of 0.4 M NaOH and 1000 µL of Milli-Qwater.
After experiments, Daramic separator pieces were rinsed with acetone and soaked in DIwater for at least 10 minutes to remove traces of solvent and ammonia. Cell parts and platinumanodes were rinsed with acetone and washed thoroughly with DI water. All cell parts, elec-trodes, and separators were dried at 80 ◦C in air prior to use in further experiments.
Choosing proton carrier concentrationsIn order to determine whether a proton donor can be used to produce ammonia using the
lithium-mediated approach, a range of proton concentrations had to be efficiently screened foractivity. From prior work (1), it is known that ammonia yields depend on the concentration ofethanol, the proton donor. At low concentrations, no ammonia is formed and a large amountof lithium remains on the cathode, while at high concentrations, no ammonia is formed due tocompetition from the hydrogen evolution reaction. We posited that this behavior is not uniqueto ethanol and can be observed for various proton donors. From this hypothesis, we developed aheuristic to rapidly screen the concentration range. Initially, electrolyte containing 0.2 M of theproton donor was used to test for ammonia production. If a significant amount of lithium metalwas found to remain on the cathode or in solution, the concentration of the proton donor wasincreased for the next run. Typically, the concentration was increased 2- or 3-fold, dependingon the extent of lithium coverage on the surface. If the surface is clean and the steel cathode isvisible, the concentration of the proton donor was decreased by a similar amount. Every protondonor was tested at three concentrations, with a maximum concentration tested of 1 M. The 1M cutoff is arbitrary, and was chosen as it is a concentration that results in fairly large volumefractions of proton donor in electrolyte for most proton donors. Using this heuristic, we typicallyobtained runs with a high lithium coverage after the experiment, a low lithium coverage, andan intermediate coverage, except for cases where 1 M of proton donor did not decrease lithiumcoverage; in these cases, all experiments had a large lithium coverage. We believe that approachallowed us to probe a large compound-concentration phase space efficiently to determine whichcompounds are capable of promoting lithium-mediated nitrogen reduction.
4

Ammonia quantificationThe amount of ammonia in samples produced in nitrogen reduction experiments was quanti-
fied by using the salicylate assay according to a procedure described in earlier work (1). Briefly,280 µL of 1% NaOCl in 0.4 M NaOH solution was added to 2 mL of ammonia sample solution,followed by 280 µL of 2.5 M sodium salicylate, 3.5 mM sodium nitroprusside solution. Theresulting solution was mixed vigorously and left to evolve color in the dark for at least 2 hours.The absorbance spectrum of the resulting solution was measured using an Ocean Optics Flame-S UV-Vis spectrophotometer. The relevant signal for ammonia quantification was taken to bethe difference in absorbance values at 650 nm and 475 nm to avoid overestimating the amountof ammonia produced (1).
A fresh ammonia calibration curve was made for each quantification batch. Calibrationcurves were made by adding 100 µL of electrolyte to solutions of known ammonium sulfateconcentrations, ranging from 0 to 80 µM. A typical calibration curve and absorbance spectracan be seen in Fig S9. Addition of most proton donors to the electrolyte used do not changethe calibration curve significantly; proton donors which may affect the quantification (suchas thiols or long chain alcohols) were typically removed by extraction prior to quantification(Supplementary Table 2). The lowest accurately quantifiable concentration of ammonia in thesolutions was typically 2 µM, computed from the error in the intercept of the calibration curve.Assuming a ten-fold dilution of the electrolyte solution to make a sample, the minimum quan-tifiable ammonia FE from a typical experiment is 0.1%.
Analysis of water contentA possible explanation for the differences in activity between various compound could the
difference in water content between various proton donors. However, even the most water-rich proton donor tested, triethylene glycol, contained only 2600 parts per million (ppm) water,which corresponds to a water concentration of 130 mM in the pure proton donor. Consideringthat the maximum concentration of proton donor used was 1 M (Supplementary Table 2), theamount of water added by the proton donor is at most 17 mM. While this is a non-negligibleamount, it is similar to the amount of water present in the electrolyte initially, as measured byKarl Fischer titration. In addition, an increase in the water content by 17 mM is predicted todecrease the ammonia yields of an active proton donor, such as ethanol, by 20-30% (1), noteliminate it entirely. As mentioned in the main text, there is not a strong correlation betweenthe water content of the pure proton donor and its activity toward LM-NRR (Fig. S8). Allthis supports the notion that the differences in activity observed between proton donors are notsimply due to a difference in water content, but are instead related to the chemical structure andproperties of the proton donors.
5

Classification Model to Identify Promising Regimes of CandidatesClassification trees are a class of machine-learning methods for constructing models to parti-
tion data into different classes. Classification models are constructed by recursively partitioningthe data space and fitting a simple prediction model within each partition. The partitioning canbe represented graphically as a decision tree as shown in the main manuscript (Fig. 3). Theprediction error of classification trees is typically measured in terms of misclassification cost.Classification trees are designed for dependent variables that take a finite number of unorderedvalues. A key advantage of the tree structure is its applicability to any number of variables. Inthis work, we employ a binary classification tree for experimental activity classification since itis particularly well suited for this application.
The specific classification problem
In the activity classification problem at hand, we have a training sample of many observa-tions on a class variable Y (for activity towards ammonia production) that takes values 0 or1 (inactive or active respectively), and p predictor variables, X1,..., Xp. Our goal is to find amodel for predicting the values of Y from new X values. In theory, the solution is simply apartition of the X space into disjoint sets, A1, A2,..., Ak, such that the predicted value of Yis j if X belongs to Aj, for j = 0, 1. In our case, p = 8 with candidate descriptors of activ-ity towards ammonia production being acid dissociation constant (pKa), donor number (DN),Dielectric Constant (εr), Kamlet-Taft parameters (α, β, π), highest occupied molecular orbitallevel (HOMO), lowest unoccupied molecular orbital level (LUMO), band gap (BG), Bader vol-ume (BV).
Classification algorithm employed
Classification tree methods yield rectangular sets Aj of the predictor variable by recursivelypartitioning the data set one X variable at a time. Several classification tree algorithms, abbre-viated as C4.5 (2), CART (3), CHAID (4), CRUISE (5, 6), GUIDE (7) and QUEST (8) havebeen proposed since the first published classification tree algorithm, THAID (9, 10).
The typical algorithm (pseudocode) for the construction of classification trees is (11):
1. Start at the root node
2. For each ordered variable X, convert it to an unordered variable X′ by grouping its valuesin the node into a small number of intervals. If X is unordered, set X′ = X.
3. Perform a chi-squared test of independence of each X′ variable versus Y (activity classi-fication, in this case) on the data in the node and compute its significance probability.
4. Choose the variable X* associated with the X′ that has the smallest significance proba-bility.
6

5. Find the split set {X* ∈ S*} that minimizes the sum of Gini indexes and use it to split thenode into two child nodes. The Gini index is a generalization of the binomial variance,which is used as an impurity index. Other algorithm use entropy as the impurity index.
6. If a stopping criterion is reached, exit. Otherwise, apply steps 2–5 to each child node.
7. Prune the tree with the CART method (3).
Choosing the Right Size Tree
Decision trees have to be optimized before being used for classification of new data be-cause the highest accuracy model could be highly complex and consist of hundreds of levels.Therefore, tree optimization implies choosing the right size of tree, which involves cutting offinsignificant nodes and even subtrees. Cross-validation is a typical pruning algorithm used inpractice (12).
Cross-validation
The process of cross-validation is based on optimal proportion to strike the general trade-offbetween tree complexity and misclassification error. With an increase in size of the tree, mis-classification error typically decreases and in the case of maximum tree size, misclassificationerror equals 0. On the other hand, complex decision trees poorly perform on generalizabilitytowards independent data, which is termed true predictive power of the tree. Therefore, theprimary task is to find the optimal proportion between the tree complexity and misclassificationerror, which is achieved through a cost-complexity function:
Rα(T) = Rα(T) + α(T̃) −→ minT
where R(T) is the misclassification error of the tree T, α(T̃) is complexity measure whichdepends on T̃, the total sum of terminal nodes in the tree. The α parameter is found through thesequence of in-sample testing when a part of learning sample is used to build the tree, the otherpart of the data is taken as a testing sample.
The process repeated several times for randomly selected learning and testing samples. Al-though cross-validation does not require adjustment of any parameters, this process is timeconsuming since the sequence of trees is constructed. Because the testing and learning sampleare chosen randomly, the final tree may differ from time to time. The classification tree (model)reported in this work is well-converged and validated through several runs with different startingpoints.
7

Deep Learning Model to Predict Identified Molecular DescriptorsThe deep learning model’s input is the molecular features of candidates obtained from the
simplified molecular-input line-entry system (SMILES). Out of several molecular featurizationapproaches on SMILES representations, we find that the Weave featurization coupled with aWeave model (deep neural network) (13) yielded the most accurate (RMSE of ≈0.016 for bothα and β) and generalizable predictions with low cross-validation error). The Weave featur-ization (14) method encodes both local chemical environment and connectivity of atoms in amolecule. The Weave featurization is similar to graph convolution in the atomic feature vectors,whereas in terms of encoding the connectivity it uses more detailed pair-wise features insteadof just neighbor listing by means of "weaving" atom and pair features (Fig. 4). The Weavefeaturization computes a feature vector for each pair of atoms in the molecule, including bondproperties, graph distance and ring information, giving rise to a feature matrix. This approachsupports graph-based models that make use of properties of both atoms and bonds.
The molecular features from the weave featurization method were input into a neural net-work with a converged architecture, which was found to consist of two weave layers and a fullyconnected layer in regression mode to predict α and β. For the training process, the learning ratewas selected to be 0.001, batch size was set to 50 and number of epochs were 100 for the 222data points available of experimentally obtained α and β values. The details of the DeepChempackage, Weave featurizer and the Weave convolution model are as follows:DeepChem version: ’2.3.0’Tensorflow version: ’1.14.0’Python version: Python 3.7.7Featurizer: WeaveFeaturizer as implemented in DeepChem (RDKit) with default settingsDataset Split details: frac_train=0.8, frac_valid=0.1, frac_test=0.1, with random seedWeave Model Details/Settings (several set to default): n_tasks (number of tasks): 2, mode=’regression’n_atom_feat (number of atom features): 75n_pair_feat (number of pair features): 14n_hidden: 5n_graph_feat: 128n_weave: int = 2fully_connected_layer_sizes: [2000, 100]weight_init_stddevs: [0.01, 0.04]bias_init_consts: [0.5, 3.0]weight_decay_penalty: 0.0weight_decay_penalty_type: "l2"dropouts: 0.25activation_fns: Tensorflow relubatch_normalize: bool = Truebatch_normalize_kwargs: Dict = "renorm": True,"fused": False
8

gaussian_expand: Truecompress_post_gaussian_expansion: False.
In order to quantify the robustness of predictions we employ an ensemble of models andlook for the degree of agreement between the models. The ensemble is comprised of about 400equivalent models (404 precisely) with randomly initialized weights.
9
Supplementary Figures
Fig. S1. A depiction of the 2-compartment cell used in electrochemical experiments.The cell body is made of polyether ether ketone (PEEK) polymer. Platinum and polishedstainless steel foils were used as the anode and cathode, respectively. The anode andcathode compartments were separated by a piece of polyporous Daramic 175 separator.IDEX fittings were used to feed gases and plug unused holes.
10

Fig. S2. Nitrogen reduction experiments run with nitrogen-containing protondonors. (a) Raw absorbance signal data for runs using 0.2 M ethanolamine or saturatedalanine as a proton donor in LM-NRR. Note that alanine is not readily soluble in theelectrolyte, so a saturated solution with a concentration <0.1 M was used. In these experi-ments, significant absorbance signals were detected in the ethanolamine argon blank solu-tions and alanine-containing solutions. (b) NH3 FE values computed from the absorbancesignals in (a). Note that a non-zero FE is computed even in the ethanolamine argon blank.The FE value computed for the alanine experiment has significant uncertainty.
11

Fig. S3. Various effects of proton donors on the salicylate quantification assay. (a)Effect of addition of 0.5 M of 1,2-propanediol and 1,3-propanediol to the electrolyte usedto make a 10 v/v% electrolyte in water solution containing a known concentration ofammonium. Note that the addition of the proton donors does not significantly alter thepeak shape or signal magnitude. (b) Effect of addition of 0.5 M of 1,2-propanediol and1,3-propanediol to the electrolyte used to make a 10 v/v% electrolyte in water solutioncontaining 80 µM ammonium. Note that the shape of the peak changes significantly,rendering it useless for quantification of ammonia in the solution. Samples containingprotons sources such as these were typically extracted with dichloromethane or hexanesprior to quantification.
12

Fig. S4. Simple refuted hypotheses for explaining experimentally proton donor activ-ity trends. (a) The binary activity of the proton donor plotted against the proton donor’spKa in DMSO. Note that while there is no direct correlation between the proton donorpKa and activity. (b) The binary activity of the hydrogen source plotted against the protondonor’s donor number.
13

Fig. S5. Predicted average Kamlet-Taft parameters for a subset of proton donors.Proton donors with Pubchem IDs below 10,000 and with above-threshold (standard devia-tion≤ 0.2) agreement between models in the ensemble are plotted; candidates with higherstandard deviations are considered to have uncertain predictions. The inherent trade-offemerges in the α − β space as shown whereby achieving high α and β is challenging,which can rationalized based on the trade-off between proton donating and accepting ten-dencies of molecules represented by the K-T parameters.
14

Fig. S6. A diagram of the wiring scheme used to measure charge passed in experi-ments. As the DC power source cannot independently quantify charge, the current passedthrough the circuit was measured with an accurate VMP3 potentiostat.
15
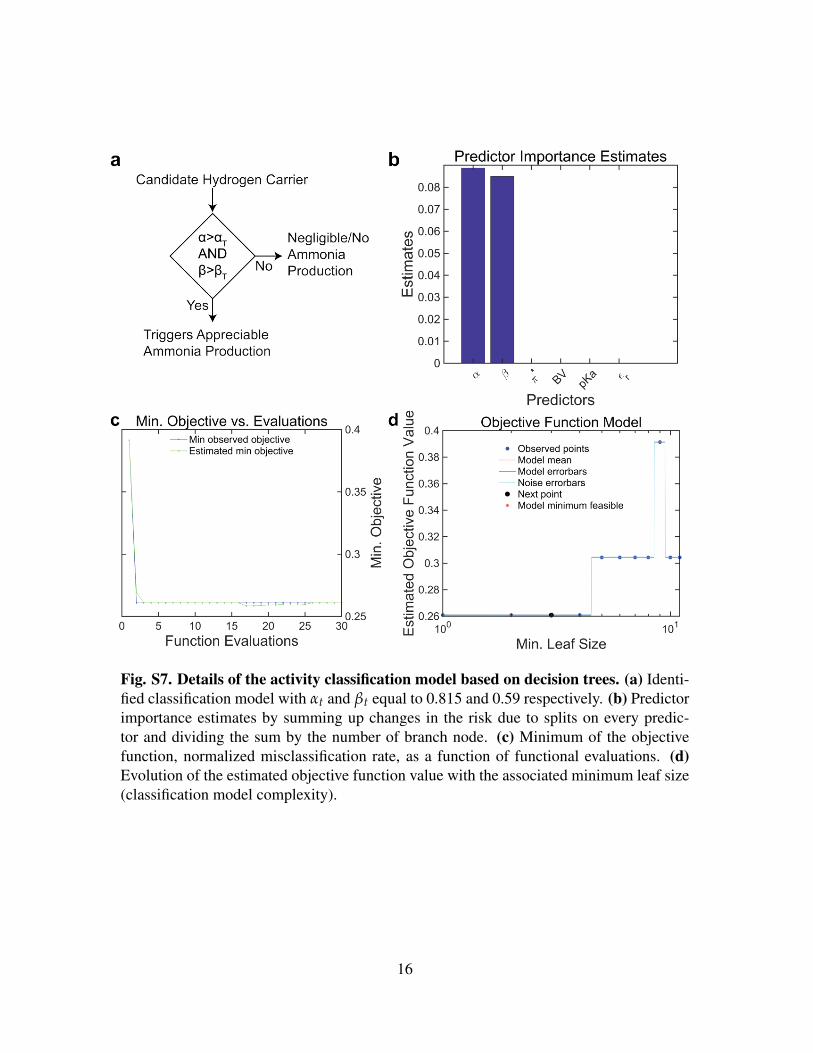
Fig. S7. Details of the activity classification model based on decision trees. (a) Identi-fied classification model with αt and βt equal to 0.815 and 0.59 respectively. (b) Predictorimportance estimates by summing up changes in the risk due to splits on every predic-tor and dividing the sum by the number of branch node. (c) Minimum of the objectivefunction, normalized misclassification rate, as a function of functional evaluations. (d)Evolution of the estimated objective function value with the associated minimum leaf size(classification model complexity).
16

Fig. S8. Effect of water in the proton donor on nitrogen reduction activity (a, b)Dependence of the maximum ammonia FE obtained with a single proton donor on watercontent (a) parts per million (ppm) and (b) millimolar units. Note the maximum FE cor-relates poorly with water concentration (p≈0.12 for a non-zero slope), suggesting that thewater content of the proton donor is a poor predictor of nitrogen reduction activity. (c)The water content in parts per thousand (ppt) of various proton donors before drying withmolecular sieves and after. (d) The NH3 FE for several proton donors before and afterdrying the proton donors with molecular sieves. Note that the FE does not change in apredictable manner after drying with sieves.
17

Fig. S9. Typical ammonia quantification calibration curves. (a) Absorbance spectraobtained from solutions containing known concentrations of ammonia ions in 10 v/v%1 M LiBF4 in THF electrolyte in water. (b) A typical calibration curve made from thespectra in (a). Note that the absorbance signal is taken to be the difference between theabsorbance at 650 and 475 nm (1).
18

Fig. S10. Classification models trained on the initial set of data (post initial experimentaltesting) to delineate active candidates from inactive candidates.
19

Fig. S11. Classification models trained on the initial set of data (after all experimentaltesting) to delineate active candidates from inactive candidates.
20

Supplementary Tables
Table S1. Measured water content of pure proton donors.
Proton donor Water content (ppm) Water concentration (mM)1,2-propanediol 2430 ± 30 140 ± 11,3-butanediol 78 ± 9 4.4 ± 0.5
1,3-propanediol 166 ± 2 9.7 ± 0.11-butanol 470 ± 10 21.3 ± 0.61-heptanol 123.6 ± 0.9 5.62 ± 0.041-hexanol 383 ± 5 17.5 ± 0.21-octanol 239 ± 1 11.04 ± 0.05
1-pentanol 346 ± 8 15.7 ± 0.41-propanol 310 ± 10 13.7 ± 0.62-propanol 860 ± 5 37.6 ± 0.2
Benzyl alcohol 820 ± 10 47.1 ± 0.6Cyclohexanol 455 ± 8 24.3 ± 0.4
Ethanol 668 ± 6 29.3 ± 0.3Ethylene glycol 39 ± 1 2.42 ± 0.07
Glycerol 390 ± 10 27.4 ± 0.8Isoamyl alcohol 1177 ± 1 52.97 ± 0.06
Isobutanol 2420 ± 20 108 ± 1Methanol 128 ± 2 5.64 ± 0.09
Triethylene glycol 2680 ± 70 164 ± 4
Table S2. Experimentally tested proton donors and details of experimental results.Proton donors were tested at several concentrations (see Supplementary methods); theconcentration at which the highest FE was obtained is reported along with the FE. Ifammonia quantification solutions required extraction (see Supplementary methods), it isreported below. The binary activity classification is also given.
Compound Name Max FE(%)
Max FEerror(%)
Conc.at maxFE (M)
Charge(C)
Solventused forextrac-tion
Experimentalactivity clas-sification
1,2-propanediol 0.04 0.02 0.2 7.2 None FALSE1,3-butanediol 1.65 0.17 0.2 7.2 None TRUE1,3-propanediol 8.38 1.51 0.1 7.2 None TRUE1,4-cyclohexanedimethanol
0.02 0.05 0.2 7.2 None FALSE
21

Compound Name Max FE(%)
Max FEerror(%)
Conc.at maxFE (M)
Charge(C)
Extractionsolvent
Experimentalactivity clas-sification
1,5-pentanediol 4.43 1.39 0.2 1.5 None TRUE1-butanol 15.58 5.29 0.1 7.2 None TRUE1-decanol 0.09 0.05 1 7.2 Hexane FALSE1-heptanol 2.19 0.08 1 7.2 Hexane TRUE1-hexanol 7.79 0.55 0.6 7.2 Hexane TRUE1-nonanol 0.18 0.08 0.6 7.2 Hexane FALSE1-octanol 0.08 0.05 0.2 7.2 Hexane FALSE1-pentanol 10.42 3.06 0.2 7.2 None TRUE1-phenylethanol 1.02 0.20 0.8 7.2 None TRUE1-propanol 9.93 1.20 0.1 7.2 None TRUE2,2,2-trifluoroethanol
0.02 0.06 0.4 7.2 None FALSE
2,2-difluoroethanol 0.02 0.00 0.5 7.2 None FALSE2,2-dimethyl-1,3-propanediol
0.84 0.17 0.4 7.2 None TRUE
2-butanol 1.36 0.06 1 7.2 None TRUE2-chloroethanol 0.06 0.02 0.2 7.2 None FALSE2-ethyl-1-butanol 3.62 0.59 0.2 7.2 None TRUE2-phenylethanol 1.64 0.26 0.9 7.2 None TRUE3-butene-1-ol 1.94 0.08 0.6 7.2 None TRUE4-methoxybutan-1-ol
0.34 0.02 0.4 7.2 None FALSE
Acetic acid 0.19 0.07 0.07 7.2 None FALSEAllyl alcohol 0.69 0.14 0.6 7.2 None TRUEBenzyl alcohol 0.34 0.21 0.8 7.2 None FALSECyclohexanol 0.00 0.04 0.6 7.2 None FALSEEthanol 13.16 1.27 0.1 7.2 None TRUEEthyl acetate 0.15 0.06 0.2 7.2 DCM FALSEEthylene glycol 0.44 0.03 0.4 4.1 None FALSEFormic acid 0.00 0.07 0.2 7.2 None FALSEGlycerol 4.20 0.45 0.2 4.6 None TRUEHexafluoro iso-propyl alcohol
0.03 0.09 0.4 7.2 None FALSE
Hexanoic acid 0.00 0.07 0.2 7.2 None FALSEIsoamyl alcohol 6.74 2.24 0.6 7.2 None TRUEIsobutanol 3.09 0.43 0.4 7.2 None TRUEIsopropyl alcohol 3.12 0.61 0.2 7.2 None TRUELactic acid -0.03 0.22 0.1 7.2 None FALSE
22
Compound Name Max FE(%)
Max FEerror(%)
Conc.at maxFE (M)
Charge(C)
Extractionsolvent
Experimentalactivity clas-sification
Methanol 6.55 1.41 0.2 7.2 None TRUEPhenol -0.05 0.06 0.2 7.2 None FALSEPropanethiol 0.03 0.03 0.1 7.2 DCM FALSEt-butyl alcohol 0.57 0.08 0.6 7.2 None FALSETriethylene glycol -0.15 0.03 0.2 7.2 None FALSEWater -0.06 0.02 0.2 7.2 None FALSE
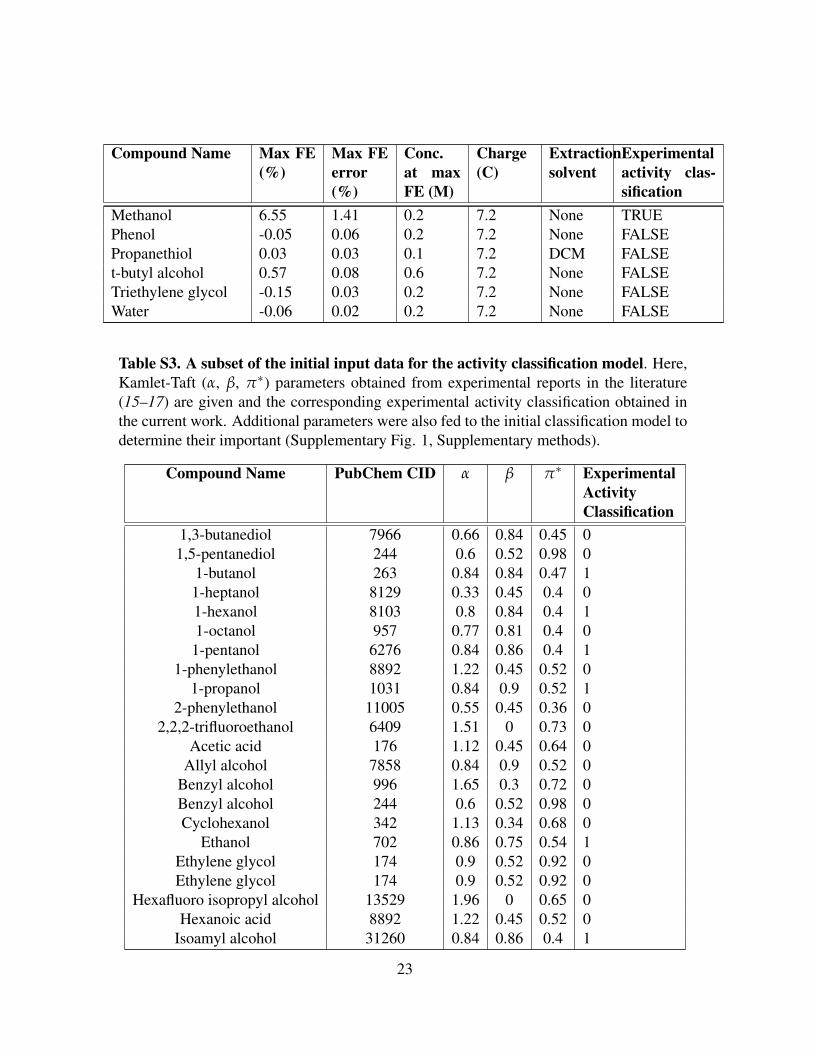
Table S3. A subset of the initial input data for the activity classification model. Here,Kamlet-Taft (α, β, π∗) parameters obtained from experimental reports in the literature(15–17) are given and the corresponding experimental activity classification obtained inthe current work. Additional parameters were also fed to the initial classification model todetermine their important (Supplementary Fig. 1, Supplementary methods).
Compound Name PubChem CID α β π∗ ExperimentalActivityClassification
1,3-butanediol 7966 0.66 0.84 0.45 01,5-pentanediol 244 0.6 0.52 0.98 0
1-butanol 263 0.84 0.84 0.47 11-heptanol 8129 0.33 0.45 0.4 01-hexanol 8103 0.8 0.84 0.4 11-octanol 957 0.77 0.81 0.4 01-pentanol 6276 0.84 0.86 0.4 1
1-phenylethanol 8892 1.22 0.45 0.52 01-propanol 1031 0.84 0.9 0.52 1
2-phenylethanol 11005 0.55 0.45 0.36 02,2,2-trifluoroethanol 6409 1.51 0 0.73 0
Acetic acid 176 1.12 0.45 0.64 0Allyl alcohol 7858 0.84 0.9 0.52 0
Benzyl alcohol 996 1.65 0.3 0.72 0Benzyl alcohol 244 0.6 0.52 0.98 0Cyclohexanol 342 1.13 0.34 0.68 0
Ethanol 702 0.86 0.75 0.54 1Ethylene glycol 174 0.9 0.52 0.92 0Ethylene glycol 174 0.9 0.52 0.92 0
Hexafluoro isopropyl alcohol 13529 1.96 0 0.65 0Hexanoic acid 8892 1.22 0.45 0.52 0
Isoamyl alcohol 31260 0.84 0.86 0.4 1
23

Compound Name PubChem CID α β π∗ ExperimentalActivityClassification
Isobutanol 6560 0.79 0.84 0.4 0Isopropyl alcohol 3776 0.76 0.84 0.48 0
Lactic acid 612 - - - 0Methanol 887 0.98 0.66 0.6 1
Phenol 6054 0.64 0.61 0.88 0Propanethiol 7848 - - - 0
t-butyl alcohol 6386 0.42 0.93 0.41 0Water 962 1.17 0.47 1.09 0
Table S4. The final input data for the activity classification model. Here, Kamlet-Taft (α, β) parameters obtained from experimental reports in the literature (15–17) aregiven for a larger set of compounds and the corresponding experimental activity classifi-cation obtained in the current work. For compounds for which experimentally measuredKT parameters are not known, the values predicted from the deep-learning. The set ofcompounds here include compounds that were initially tested and compounds which weresuggested by the data-driven approach for testing. Note that experimental values for KTparameters for some compounds were not known, so predicted values from the deep learn-ing model were given in italics for these compounds.
Compound Name PubChem CID α β Experimental Activity Classification1,2-propanediol 1030 - - 01,3-butanediol 7966 0.66 0.84 01,3-butanediol 7896 - - 1
1,3-propanediol 10442 - - 11,5-pentanediol 244 0.6 0.52 0
1-butanol 263 0.84 0.84 11-decanol 8174 0.7 0.82 01-heptanol 8129 0.33 0.45 01-hexanol 8103 0.8 0.84 11-nonanol 8914 - - 01-octanol 957 0.77 0.81 0
1-pentanol 6276 0.84 0.86 11-phenylethanol 8892 1.22 0.45 0
1-propanol 1031 0.84 0.9 12-butanol 6568 0.69 0.8 1
2-chloroethanol 34 1.28 0.53 02-methoxyethanol 8019 - - 02-phenylethanol 11005 0.55 0.45 0
24

Compound Name PubChem CID α β Experimental Activity Classification2,2,2-trifluoroethanol 6409 1.51 0 0
3-butene-1-ol 69389 - - 1Acetic acid 176 1.12 0.45 0
Allyl alcohol 7858 0.84 0.9 0Benzyl alcohol 996 1.65 0.3 0Benzyl alcohol 244 0.6 0.52 0Cyclohexanol 342 1.13 0.34 0
Ethanol 702 0.86 0.75 1Ethylene glycol 174 0.9 0.52 0Ethylene glycol 174 0.9 0.52 0
Glycerol 753 1.21 0.51 1Hexafluoro isopropyl alcohol 13529 1.96 0 0
Hexanoic acid 8892 1.22 0.45 0Isoamyl alcohol 31260 0.84 0.86 1
Isobutanol 6560 0.79 0.84 0Isopropyl alcohol 3776 0.76 0.84 0
Lactic acid 612 - - 0Methanol 887 0.98 0.66 1
Phenol 6054 0.64 0.61 0Propanethiol 7848 - - 0
t-butyl alcohol 6386 0.42 0.93 0Water 962 1.17 0.47 0
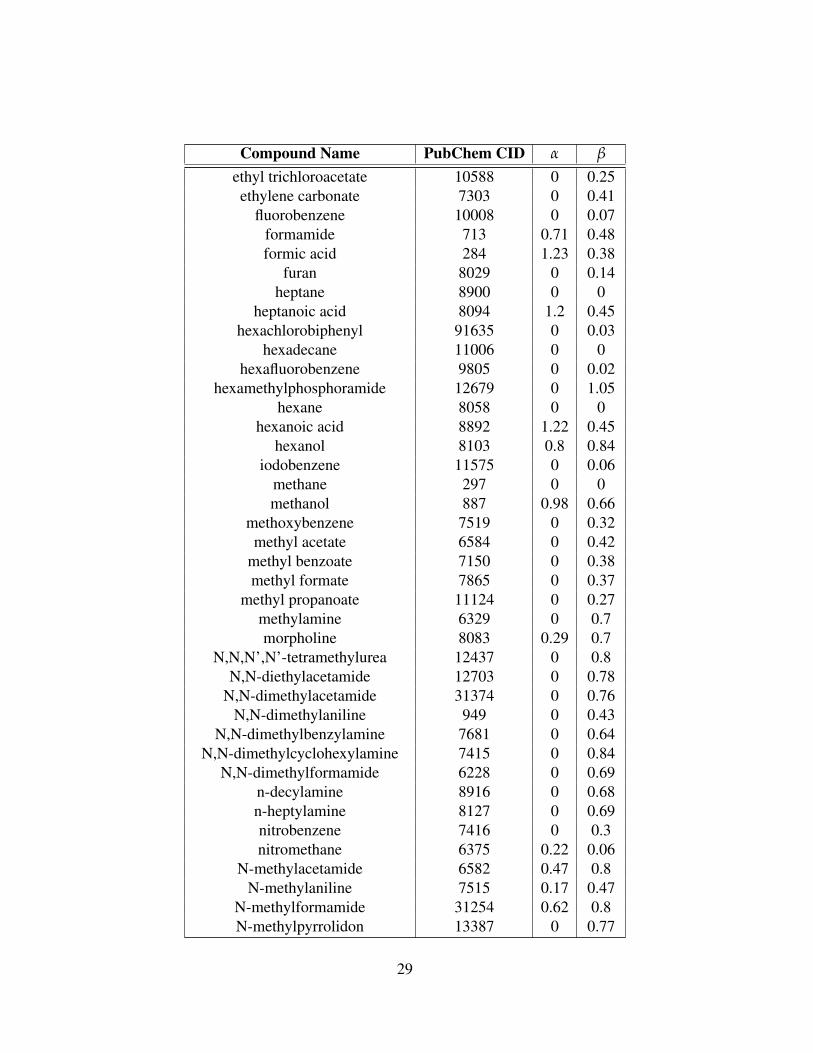
Table S5. Input Data for the Deep Learning Prediction Model Kamlet-Taft (α and β)parameters obtained from experimental reports in the literature (15–17).
Compound Name PubChem CID α β
1,1,1,3,3,3-hexafluoro-2-propanol 13529 1.96 01,1,1-trichloroethane 6278 0 0
1,1,2,2-tetrachloroethane 6591 0 01,1,3,3-tetramethylguanidine 66460 0 0.86
1,1-dichloroethane 6365 0.1 0.11,2,3-propanetriol 753 1.21 0.511,2-diaminoethane 3301 0.13 1.431,2-dibromoethane 7839 0 0
1,2-dichlorobenzene 7239 0 0.031,2-dichloroethane 11 0 0.1
1,2-dimethoxyethane 8071 0 0.411,3,5-trimethylbenzene 7947 0 0.13
1,3-dichlorobenzene 10943 0 0.03
25

Compound Name PubChem CID α β
1,3-dimethylbenzene 7929 0 0.111,3-dioxolane 12586 0 0.45
1,4-difluorobenzene 10892 0 0.031,4-dimethylbenzene 7809 0 0.12
1-bromobutane 8002 0 0.131-chlorobutane 8005 0 01-iodobutane 10962 0 0.23
2,2,2-trifluoroethanol 6409 1.51 02,3,4-trifluoronitrobenzene 69871 0 0.242,3-difluoronitrobenzene 81335 0 0.26
2,6-dimethylpyridine 7937 0 0.762-bromoacetophenone 6259 0 0.45
2-bromopyridine 7973 0 0.532-butanol 6568 0.69 0.8
2-butanone 6569 0.06 0.482-chloroacetophenone 10757 0 0.45
2-chloroaniline 7240 0.25 0.42-chlorobenzaldehyde 6996 0 0.4
2-chloroethanol 34 1.28 0.532-cyanopyridine 7522 0 0.29
2-decanone 12741 0 0.482-fluoroacetophenone 96744 0 0.472-fluoronitrobenzene 73895 0 0.28
2-fluoropyridine 9746 0 0.512-heptanone 8051 0.05 0.48
2-methyl-1-propanol 6560 0.79 0.842-methyl-2-butanol 6405 0.28 0.93
2-methyl-2-propanol 6386 0.42 0.932-methylnitrobenzene 6944 0 0.3
2-nonanone 13187 0 0.482-octanone 8093 0 0.48
2-pentanone 7895 0 0.522-phenylacetonitrile 8794 0 0.41
2-phenylethanol 6054 0.64 0.612-propanol 3776 0.76 0.84
2-propanone 180 0.08 0.432-propen-1-ol 7858 0.84 0.92-pyrrolidone 12025 0.36 0.77
3,4,5-trifluoronitrobenzene 2782793 0 0.243,4-difluoronitrobenzene 123053 0 0.26
26

Compound Name PubChem CID α β
3,4-dimethylpyridine 11417 0 0.783-bromoacetophenone 16502 0 0.45
3-bromopyridine 12286 0 0.63-chlorobenzaldehyde 11477 0 0.4
3-chlorophenol 7933 1.57 0.233-fluoroacetophenone 9967 0 0.473-fluoronitrobenzene 9823 0 0.283-methyl-1-butanol 31260 0.84 0.86
3-methylphenol 342 1.13 0.343-pentanone 7288 0 0.45
3-phenylpropanol 31234 0.53 0.553-trifluoromethylnitrobenzene 7386 0 0.25
4-chlorobenzaldehyde 7726 0 0.44-fluoronitrobenzene 9590 0 0.28
4-methyl-2-oxo-1,3-dioxolane 7924 0 0.44-methyl-2-pentanone 7909 0.02 0.48
4-methylphenol 2879 1.64 0.344-methylpyridine 7963 0 0.67
acetic acid 176 1.12 0.45acetic anhydride 7918 0 0.29
acetonitrile 6342 0.19 0.4acetophenone 7410 0.04 0.49
aniline 6115 0.26 0.5benzene 241 0 0.1
benzonitrile 7505 0 0.37benzyl alcohol 244 0.6 0.52
bis(2-chloroethyl) ether 8115 0 0.4bis(2-methoxyethyl) ether 8150 0 0.4
bromobenzene 7961 0 0.06butane 7843 0 0
butanenitrile 8008 0 0.4butanoic acid 264 1.1 0.45
butanol 263 0.84 0.84butyl acetate 31272 0 0.45butylamine 8007 0 0.72
carbon disulfide 6348 0 0.07chloroacetonitrile 7856 0 0.34
chlorobenzene 7964 0 0.07cis-decalin 7044 0 0.08
cyclohexane 8078 0 0
27

Compound Name PubChem CID α β
cyclohexanol 7966 0.66 0.84cyclohexanone 7967 0 0.53cyclopentanone 8452 0 0.52
decane 15600 0 0decanol 8174 0.7 0.82
diaminoethane 3301 0.13 1.43dibenzyl ether 7657 0 0.41
dibromomethane 3024 0 0dibutyl ether 8909 0 0.46
dichloromethane 6344 0.13 0.1diethyl carbonate 7766 0 0.4
diethyl ether 3283 0 0.47diethyl sulfide 9609 0 0.37diethylamine 8021 0.3 0.7
diethylformamide 12051 0 0.79diiodomethane 6346 0 0
diisopropyl ether 7914 0 0.49diisopropyl sulfide 12264 0 0.38dimethyl carbonate 12021 0 0.43dimethyl phthalate 8554 0 0.78
dimethyl sulfate 6497 0 0.36dimethyl sulfide 1068 0 0.34
dimethyl sulfoxide 679 0 0.76dimethylamine 674 0 0.7
dimethylcyanamide 15112 0 0.64di-n-butyl sulfide 11002 0 0.38
dioxane 31275 0 0.37dipentylamine 16316 0 0.7dipentylether 12743 0 0.47diphenyl ether 7583 0 0.13dipropyl ether 8114 0 0.46
dodecane 8182 0 0ethane 6324 0 0
ethanediol 174 0.9 0.52ethanol 702 0.86 0.75
ethoxybenzene 7674 0 0.3ethyl acetate 8857 0 0.45
ethyl benzoate 7165 0 0.41ethyl chloroacetate 7751 0 0.35
ethyl formate 8025 0 0.36
28
Compound Name PubChem CID α β
ethyl trichloroacetate 10588 0 0.25ethylene carbonate 7303 0 0.41
fluorobenzene 10008 0 0.07formamide 713 0.71 0.48formic acid 284 1.23 0.38
furan 8029 0 0.14heptane 8900 0 0
heptanoic acid 8094 1.2 0.45hexachlorobiphenyl 91635 0 0.03
hexadecane 11006 0 0hexafluorobenzene 9805 0 0.02
hexamethylphosphoramide 12679 0 1.05hexane 8058 0 0
hexanoic acid 8892 1.22 0.45hexanol 8103 0.8 0.84
iodobenzene 11575 0 0.06methane 297 0 0methanol 887 0.98 0.66
methoxybenzene 7519 0 0.32methyl acetate 6584 0 0.42
methyl benzoate 7150 0 0.38methyl formate 7865 0 0.37
methyl propanoate 11124 0 0.27methylamine 6329 0 0.7morpholine 8083 0.29 0.7
N,N,N’,N’-tetramethylurea 12437 0 0.8N,N-diethylacetamide 12703 0 0.78
N,N-dimethylacetamide 31374 0 0.76N,N-dimethylaniline 949 0 0.43
N,N-dimethylbenzylamine 7681 0 0.64N,N-dimethylcyclohexylamine 7415 0 0.84
N,N-dimethylformamide 6228 0 0.69n-decylamine 8916 0 0.68n-heptylamine 8127 0 0.69nitrobenzene 7416 0 0.3nitromethane 6375 0.22 0.06
N-methylacetamide 6582 0.47 0.8N-methylaniline 7515 0.17 0.47
N-methylformamide 31254 0.62 0.8N-methylpyrrolidon 13387 0 0.77
29

Compound Name PubChem CID α β
n-nonylamine 16215 0 0.69n-octylamine 8143 0 0.69
nonane 8141 0 0octadecafluoronaphthalene 9386 0 -0.05
octane 356 0 0octanol 957 0.77 0.81oxane 8894 0 0.54
oxolan-2-one 7302 0 0.49pentachlorobiphenyl 17348 0 0.06
pentadecane 12391 0 0pentafluoropyridine 69690 0 0.16
pentane 8003 0 0pentanoic acid 7991 1.19 0.45
pentanol 6276 0.84 0.86perfluoro(methylcyclohexane) 9637 0 -0.06
phenol 996 1.65 0.3piperidine 8082 0 1.04propane 6334 0 0
propanenitrile 7854 0 0.39propanoic acid 1032 1.12 0.45
propanol 1031 0.84 0.9propyl acetate 7997 0 0.4
pyridine 1049 0 0.64pyrrolidine 31268 0.16 0.7quinoline 7047 0 0.64styrene 7501 0 0.12
sulfolane 31347 0 0.39tetrachloroethene 31373 0 0.05
tetrachloromethane 5943 0 0.1tetradecafluorohexane 9639 0 -0.08
tetradecane 12389 0 0tetrahydrofuran 8028 0 0.55
tetramethylsilane 6396 0 0.02thiane 15367 0 0.36
thiolane 1127 0 0.44thiolane-1-oxide 1128 0 0.81
toluene 1140 0 0.11trans-1,2-dichloroethene 638186 0 0
tribromomethane 5558 0.05 0.05tributyl phosphate 31357 0 0.8
30

Compound Name PubChem CID α β
tributylamine 7622 0 0.62trichloroethene 6575 0 0.05
trichloromethane 6212 0.2 0.1tridecane 12388 0 0
triethyl phosphate 6535 0 0.77triethylamine 8471 0 0.71
trimethyl phosphate 10541 0 0.77undecane 14257 0 0
water 962 1.17 0.47
References1. N. Lazouski, Z. J. Schiffer, K. Williams, K. Manthiram, Joule 3, 1127 (2019).
2. J. Quinlan, San Mateo (1993).
3. L. Breiman, J. Friedman, C. J. Stone, R. A. Olshen, Classification and regression trees(CRC press, 1984).
4. G. V. Kass, Journal of the Royal Statistical Society: Series C (Applied Statistics) 29, 119(1980).
5. H. Kim, W.-Y. Loh, Journal of the American Statistical Association 96, 589 (2001).
6. H. Kim, W.-Y. Loh, Journal of Computational and Graphical Statistics 12, 512 (2003).
7. W.-Y. Loh, The Annals of Applied Statistics pp. 1710–1737 (2009).
8. W.-Y. Loh, Y.-S. Shih, Statistica sinica pp. 815–840 (1997).
9. A. Fielding, C. O’Muircheartaigh, Journal of the Royal Statistical Society: Series D (TheStatistician) 26, 17 (1977).
10. R. Messenger, L. Mandell, Journal of the American statistical association 67, 768 (1972).
11. W.-Y. Loh, Wiley Interdisciplinary Reviews: Data Mining and Knowledge Discovery 1, 14(2011).
12. R. Timofeev, Humboldt University, Berlin pp. 1–40 (2004).
13. S. Kearnes, K. McCloskey, M. Berndl, V. Pande, P. Riley, Journal of computer-aided molec-ular design 30, 595 (2016).
14. Z. Wu, et al., Chem. Sci. 9, 513 (2018).
31

15. Y. Marcus, Chemical Society Reviews 22, 409 (1993).
16. P. Meyer, G. Maurer, Industrial & engineering chemistry research 34, 373 (1995).
17. R. Stenutz, Kamlet-taft solvent parameters, http://www.stenutz.eu/chem/solv26.php (accessed June 2020).
32