closing the gap disabilities: analyzing of and...
TRANSCRIPT

1
ClosingtheOpportunityGapforStudentswithDisabilities:AnalyzingAlignmentofInstructionandStandardsinEnglishLanguageArtsand
Mathematics
SummaryReport
Kansas EAG State Consortium SEC Special Education Project December 2012
The contents of this report were developed under a grant from the U.S. Department of Education. However, those contents do not necessarily represent the policy of the U.S. Department of Education and you should not assume endorsement by the Federal government.
The US ED grant (#S368A100013) was awarded to the Kansas State Department of Education in 2010. The Council of Chief State School Officers (CCSSO) is the project contractor and manager for the grant project involving districts and schools in three states: Kansas, North Carolina, Ohio. The project grant proposal was titled: “Develop Instrumentation to Analyze Fidelity of Instruction for Students with Disabilities in relation to Standards and Assessments and Report on Opportunity to Learn and Student Achievement.”
Debbie Matthews, Project Director, Kansas State Department of Education Rolf K. Blank, Ph.D., Principal Investigator Council of Chief State School Officers Project webpage: www.SECsurvey.org

2
Contents page
Executive Summary 3
Project Goals and Design 5
Project Questions and Analysis
1) What is the fidelity of classroom instruction in relation to state standards and assessments? To Common Core Standards? 8 2) How can we analyze instruction related to standards for students with IEPs, including students with significant cognitive disabilities? 23 3) What are the differences in instruction between special education and general education? What are the implications? 34 4) What is the relationship of instruction students receive to student achievement results in math and ELA? 45
Appendix A: Project Design and Implementation 62 Appendix B: Data Collection by State 63 Appendix C: List of Project Products 64 Appendix D: SEC Instructional Practices Scales 66 Appendix E: Reading the SEC Charts and Graphs 69 References 71 Additional Project Reports and Data Appendices (separate documents)
Using SEC Special Education Data: Applications by Level State‐level Data Analyses—Alignment Content Analyses, Instructional Practices, Teacher and
Class Descriptive Data
Acknowledgements
The Kansas EAG State Consortium SEC Special Education Project was carried through the excellent leadership and cooperation of leaders and educators in three states: Kansas, North Carolina, and Ohio. The Kansas Department of Education and CCSSO thank particularly the Consortium leadership team: Colleen Riley, Deborah Matthews, Kris Shaw (Kansas), Claire Greer (North Carolina), Wendy Stoica, Andrew Hinkle, Chris Woolard (Ohio), John Smithson (Wisconsin Center for Education Research), Sandra H. Warren (ASES SCASS Adviser), Joe McCrary (WestEd), and Rolf Blank, Bob Olsen, and Adam Petermann (CCSSO). We also thank the U.S. Department of Education for cooperation in administering the Enhanced Assessment Grant which supported the project.

3
ClosingtheOpportunityGapforStudentswithDisabilities:AnalyzingAlignmentofInstructionandStandardsinEnglishLanguageArtsandMathematics
Kansas EAG State Consortium SEC Special Education Project
The Kansas EAG State Consortium project has collected, reported and demonstrated use of data from the Surveys of Enacted Curriculum (SEC) online system for analyzing opportunity to learn for Students with Disabilities (SwD). The project has tested the use of SEC online tools and reports for analyzing special education instruction and alignment of instruction to state standards and assessments. The project was designed and implemented with leadership from a consortium comprised of leaders from three state departments of education, CCSSO, the Wisconsin Center for Education Research, and WestEd. The project rationale and design is detailed in two documents—grant proposal (Kansas State Department of Education, 2010) and project design prospectus (CCSSOa, 2010). A key goal of the project is to assist and support states in working to close the opportunity gap of students with disabilities. Through this summary report, the Consortium is providing description and evidence of how the project data and outcomes are used to address the project questions.
ExecutiveSummary Project Outcomes and Products Instrument development and demonstration. Through the state consortium leadership and technical assistance from experts, the Surveys of Enacted Curriculum (SEC) data collection and reporting instruments were revised and adapted to increase their applicability for analysis of instruction provided to students with disabilities. The revised versions of the SEC Math and ELAR instruments were used for data collection and reporting with 600 general and special education teachers in grades 4‐8. Also, a new instrument was designed and tested to analyze opportunity to learn for students with significant cognitive disabilities. Data workshops for educator teams. Professional development workshops were convened in each state for participating district leaders and each school was invited to send a team of administrators and teachers. The teams analyzed SEC data focused on analysis of special education and learned how to apply data results to curriculum and instruction in their schools. Professional Development Guide. With results from the project data reports and feedback through the in‐state workshops with school teams, the consortium designed and implemented an Online SEC PD Guide which provides step‐by‐step plans and guidance for school staff and teachers to access and use the SEC data to support their efforts to improve instruction and close the opportunity gap. The Guide is structured around five PD modules addressing key questions for implementation of the Common Core. Research by state and cross‐state. Four data sources were used to address the leading questions for the project: surveys of teachers assigned in general and special education, content analysis of standards and assessments, school‐level program data, and student achievement scores on state assessments. All of the data were collected and analyzed over the two years of the project with cooperation of the three states, 19 districts, 50 schools, and 600 teachers that participated. The results of the data analyses and reports through the KS State Consortium project are briefly summarized.

4
Website posting of products: All the project results, products and dissemination materials are posted online by CCSSO (see www.SECsurvey.org). The SEC Special Education project was designed to address four key questions for analysis of opportunity to learn concerning opportunity to learn for students with disabilities and all students. 1. What is the fidelity of Instruction in relation to Standards and Assessments? The project data collected through teacher surveys using the SEConline system were used to report to state leaders and local educators on the alignment between content of instruction provided in grades 4‐8 classrooms and the standards for student learning required by each of the three project states (Kansas, North Carolina, Ohio). The analysis of alignment included statewide assessments used for all students—both general end‐of grade academic assessments and modified or alternate assessments used with students with disabilities. Third, the project analyzed and reported on the degree of alignment between current instruction and the Common Core Standards, including fine‐grain analysis within topics by grade.
For each state, and participating districts within states, the project reports were able to identify specific topics and cognitive demands in current instruction that indicate lack of alignment with Common Core Standards. The data analysis and professional development support provided assistance to leaders and educators in identifying where shifts in instructional practices and curriculum organization will need to be made. Specific examples of SEC data charts used in reporting and technical assistance are highlighted in this Summary Report.
2. How can we analyze opportunity to learn for students with disabilities and differences from general education? The design for the project requested that each participating district and school request that surveys be used to report instructional data on ELA and math in grades 4‐8, and that both general education and special education teachers participate. The Consortium project reported data on four topics regarding students with disabilities:
• Differences in content of instruction in classes taught by general education teachers vs. special education teachers
• Gaps between current classroom instruction and content defined in Standards • Alignment between state extended standards for students with significant cognitive disabilities
and regular, academic standards? • Degree of content alignment between instruction for students with significant cognitive
disabilities and extended standards. Several patterns in differences in opportunity to learn were noted across states. In language arts, time and emphasis on specific topics differed by class composition, including more emphasis on Phonics and Comprehension in classes with more special education students, and less emphasis on Vocabulary, Writing applications, and Elements of Presentation. Mathematics instruction in classes with more special education students had more time and emphasis on topics of Number sense and Operations, and less emphasis on topics of Measurement, Geometry, and Algebraic concepts, and Data and Statistics. Cognitive demands of instruction also showed differences. The classes with more special education students emphasize instruction asking students for Recall and Performing Procedures than the classes with more general education students. In comparison to Common Core Standards, expectations for student learning will need to shift instruction toward more emphasis on the Communicate, Analyze and Evaluate areas of cognitive expectations. The project developed and pilot tested a teacher survey for teachers of students with significant cognitive disabilities. The pilot results showed that teachers can report data on instruction by student

5
rather than a whole group, and the design asked for reports on three students. The data were reported in comparison to state extended standards, and the results showed instructional content heavily focused on a small number of content topics in language arts and in math, with expectations focused on the Attend and Recall levels.
3. What are differences in instructional practices between special education and general education classrooms? In the study, survey data from teachers provided for analysis of classroom instructional practices and reporting differences by class composition. The data analysis included teacher attitudes, teacher preparation, professional development, classroom assessments, homework, and use of technology. The reporting of SEC special education data focused on three types of data charts:
• Classroom instructional practices—variation in practices by class composition/ percentage of students with IEPs
• Small‐group activities in ELA and Math – types of activities by class composition • Teacher perceptions toward teaching ELA and Math – differences by class composition
In language arts, classes with primarily special education students (more than 70% IEP) were found to use practices that involved less time in reading, collecting information, presenting information, and writing in class, but slightly more use of manipulatives and work in small groups. The classes with more special education students had greater use of small groups or pairs during instruction. In mathematics instruction, classes with more special education students used more time on practices involving learning math outside the classroom, use of portfolio in assessment, and practicing test taking strategies. Small group activities in math classes with more special education students used less time on solving non‐routine problems and discussing math problems or reasoning with mathematics. 4. What is the relationship of instruction students receive to student achievement? The cross‐state analysis to address the question of achievement effects comprises data collected at three levels; program (school or district), teacher (instructional content and practice), and student (characteristics and achievement) from each of the three states that participated in the study. The analyses in the Cross‐State Report consider multivariate regression models designed to explain student achievement scores controlling for prior achievement and economic disadvantage in order to examine the relative impact of program inclusiveness, OTL, pedagogy, and disability status on achievement. The multivariate analysis had two key findings regarding opportunity to learn for students with disabilities. First, using the school‐level indicator of Least Restrictive Environment (KRE), schools with more inclusive classrooms for students with disabilities were found to have greater alignment of instruction to Common Core Standards and professional standards for math and language arts. Second, students receiving instruction that was more closely aligned to Common Core Standards in languages arts and reading had higher achievement gains than other students, while mathematics instruction alignment to older state standards predicted higher achievement gains. The analysis of achievement gains controlled for prior student achievement, student demographics, and disability status of students. ProjectGoalsandDesign
States are expected to provide all students with standards‐based instruction and inclusive assessments that are well aligned with such instruction. Although federal legislation has underscored the right of students with disabilities (SWD) to have access to the general curriculum, instructional content, and tests aligned with standards (IDEA, 1997, 2004; NCLB, 2001), little is known about the extent to which standards‐based instruction at grade level is delivered by general education or special

6
education teachers (Roach, Namisi‐Chilungu, et al., 2009). Recent research suggests that students with disabilities in special education classrooms at the same grade level as their general education peers are likely to be getting fewer opportunities to learn expected content (Kurz, Elliott, & Smithson, 2009).
Traditionally, students with disabilities have not been a focus in standards‐based reform efforts. In the early 2000s, survey research in 34 large school districts found that students with disabilities were not considered in the same way as other students in the context of reforms (Gagnon, McLaughlin, Rhim, & Davis, 2002). Later, Nolet and McLaughlin (2005) summarized their research effort noting that many special educators did not understand the meaning of “curriculum” and saw state content standards and curricular frameworks as too challenging for their students. The study found that many special education teachers reported that it was more important to use instructional time for functional skills than academics; and they showed limited understanding of alternative strategies to meet instructional needs within academically challenging content.
Education policy researchers (e.g., Quenemoen, Thurlow, Moen, Thompson, & Morse, 2003) have noted that students with disabilities have historically had limited access to challenging curriculum, instruction, and assessment. This is sometimes driven by differences in what specific content that access should cover, with some educators believing they need to focus on direct instruction on basic skills and others calling for a full range of rich and challenging grade‐level content. Quenemoen et al. (2003) suggest these controversies are intertwined with limited practitioner capacity for effective provision of instructional strategies, interventions, and supports in a standards‐based system. Simply put, many special education teachers do not know the content to be taught and many content teachers do not know how to teach atypical learners well.
This project addresses the core need for instruments and data that can assist state and local leaders with objective evidence of the status of curricular and practice deficits for this at‐risk student population and to demonstrate the effects of aligned instruction and opportunity to learn on student achievement measured in state assessments. A priority concern voiced by members of CCSSO's SCASS for students with disabilities relates to the limited availability of (a) data and appropriate instrumentation in this area, (b) research‐based professional development resources addressing instruction aligned with state standards, and (c) strategies for organizing curriculum and instruction towards this objective. While states have received guidance, and the research base is growing, we do not have the decades‐long experience in this area that is available for students without disabilities.
The project design builds on the prior instrument development and validation of the Surveys of Enacted Curriculum (SEC), an online system for data collection and reporting on curriculum, instruction and alignment of standards assessments in academic subjects (www.seconline.org; Blank, et al, 2006; Porter, et al, 2005; Smithson & Blank, 2006; Blank, et al, 2010). The project design included steps to adapt and improve the data collection instruments to address issues of instructional practices, curriculum, and instructional alignment for students with disabilities (CCSSO, 2010a). The analysis of opportunity to learn through this study provides a useful model for states and school districts in their analysis of assessment results and the relation of instruction to achievement gaps. Currently, the validity of assessment scores for the at‐risk population of students with disabilities continues to be questionable and the use of these scores for accountability purposes falls short of the shared goal to drive improved achievement for all students. The project research questions were developed from the experience of

7
two state SCASS projects in working with state leaders to identify key questions of high interest and relevance to the field of special education and, more broadly, questions regarding opportunity to learn and alignment of instruction to state standards and assessments.
ProjectQuestions
1) What is the fidelity of classroom instruction in relation to state standards and assessments? To Common Core State Standards?
2) How can we analyze instruction related to standards for students with IEPs, including students with significant cognitive disabilities?
3) What are the differences in instruction and content taught between special education and general education? What are the implications for decisions on curriculum and instruction?
4) What is the relationship of instruction students receive to student achievement results in math and ELA?
The analyses and results for each question are reported in the sections below starting on page 6.
Design Steps. The following steps in the project contributed to the outcomes that are being reported at the end of the two‐year project:
• Web‐based collection with teachers (general education and special education) using the Surveys of Enacted Curriculum (SEC) to report on classroom instruction in math and English language arts, and alignment to standards assessments
• Content analysis of standards and assessments used in the three participating states in math and English language arts
• Presentation and discussion of SEC data and initial analyses with local district and school teams through data‐reporting workshops in each state
• Data review discussions with the Consortium leaders and with state members of two CCSSO State collaboratives (ASES and SEC)
• Cross‐state research with completed survey data from 600 teachers and 50 schools across the three participating states: KS, NC, OH
• Conference for presentation and discussion of project data and reports with state and local participants.
School and Teacher Participation. Each participating state was asked to select four to six school districts that had interest in testing and demonstrating the SEC Special education instrumentation and use of data. The study design focused on instruction in grades 4‐8 and each district was asked to involve schools and teachers so that a minimum of 10 ELA teachers, 10 math teachers, and 5 special education teachers would participate. The selected districts and participating schools and teachers would not necessarily be representative of teaching in the district or the state. A total of 19 districts, 50 schools and 600 teachers participated in the project (see Appendix B for totals by state). Each of the participating schools and their teachers had three specific types of participation and support through the project:

8
a) Orientation to SEC Data. Schools received an in‐person or webinar presentation regarding the objectives and design for the project, and participating teachers were provided with orientation to the SEConline website and how to enter and report data on their instruction;
b) Data Reports. The collected data for each of the participating schools were reported to the states and districts through the SEConline website and through hard‐copy reports, and schools and teachers were provided access to the online reports and data that they could then use based on the initial project orientation;
c) In‐State workshops. Professional development workshops were convened in each state for participating district leaders and each school was invited to send a team of administrators and teachers, with project funding support for the teams. A key feature of the workshop was training on asking and analyzing questions with the SEC Special Education data for a school or district. Following are the types of questions that were discussed:
• What does level of instructional alignment reported in the SEC chart tell us about instruction in our school? How can teachers use the analysis of content topics and cognitive demand?
• What can teachers observe about differences in instructional practices within the school and between schools in a district?
• How can educators improve alignment of instruction to Common Core Standards? • What differences are found in instruction provided by general education teachers as
compared to special education teachers? What further questions can be discussed about these differences and how to interpret the data?
The following section reports on research results from the project for the core questions.
1.Whatisthefidelityofclassroominstructioninrelationtostatestandardsandassessments?The project data collected through teacher surveys in spring and fall 2011 allowed the project team to report to state leaders and local educators on the degree of fidelity or agreement between the content of instruction provided in classrooms and the standards for student learning required by each of the three project states (Kansas, North Carolina, Ohio). The analysis of alignment is also provided for the statewide assessments used for all students—both general end‐of grade academic assessments and modified or alternate assessments used with students with disabilities. Third, we analyze the degree of alignment between current instruction and the Common Core Standards, including fine‐grain analysis within topics by grade.
The fidelity between the instruction reported by teachers and their state standards and assessments is measured in this project with the SEC content framework for each subject and the SEC coding and analysis procedures (see, Smithson, 2009). The operational definition of alignment includes both content topics and level of expectations for student learning (or cognitive demand). Thus for a specific subject and grade level it is possible to analyze the degree of alignment, or consistency, between instruction provided to students and the state standards or assessments. The alignment is reported both as a statistic (varying from 0, no alignment, to 1, perfect alignment), as well as a visual

9
display chart which highlights the degree of alignment across topics and expectations for learning. The project data on fidelity of instruction are reported in four sections below with example data analysis from states included.
a. Instructional alignment to state standards, b. Instructional alignment to state assessments, c. Alignment of instruction to Common Core Standards, d. Fine‐grain alignment analysis with Common Core Standards.
The content analyses of standards and assessments for the three participating states were conducted by subject specialist teams through the project in June 2011. The content analyses of the Common Core State Standards were conducted through the CCSSO SEC State Collaborative (CCSSO, 2010b).
a) Instructional alignment to State Standards. The two example SEC analysis charts below illustrate how the project has reported and demonstrated use of alignment analysis data between instruction and standards for ELA and Math.1 The first chart below shows the alignment content analysis of English language arts instruction at grade 6 in Kansas classrooms in comparison to the KS state standards for grade 6. The chart shows the use of SEC alignment analysis using results from 21 grade 6 teachers. A total of 72 teachers in grades 4‐8 in four KS districts reported on instruction in English language arts. The math alignment analysis example from Ohio is based on a data reported by 14 grade 7 math teachers and the OH state math standards. A total of 87 teachers of math in four Ohio districts participated in the project.
1 For guidance on reading the SEC content analysis charts, and the other types of charts in this report, go to Appendix E, or to the Project webpage, http://siksolutions.com/ccsso/sec‐data/ “Quick Reference Guide” and “How to Read an SEC Chart.”

•
•
•
The analysexpectatioFor exampemphasis ohigh emphinstruction The overalindicating expectatio The data cadded supimprove alearning, a
sis of grade 6ons for which ple, instructioon Critical Rehasis in the exnal emphases
ll alignment othat based onons for studen
chart can supppport for scholignment withas well as to e
6 KS English lainstruction dn in the classeasoning and xpectations iss is at the leve
of grade 6 instn this group ont learning dif
port decisionools and teachh the Generatexamine with
anguage artsiffers from strooms reportAuthor’s Crafs for studentsels of Memor
truction in laof teachers seffer between
s by state or hers with instte/Create andschools why
informs Kanstandards, andted in Kansasft defined in ts on Analyze/ize/Recall an
nguage arts teveral topics instruction a
local leaders tructional strad Analyzed/Inseveral topic
sas educatorsd where they s does not mathe state stanInvestigate, ad Perform Pr
to the State stare not taughand standards
on how and wategies and mnvestigate excs are receivin
s on the topicare consistenatch the degrendards, and thand the curreocedures.
tandards is .3ht and the s.
where to promaterials thatpectations fong little
10
cs and nt. ee of he nt
37,
ovide will or

• ThananStarcota
instructionto confirm
he Ohio Gradnd Operationnd Basic Algetandards havre receiving roncepts, Dataaught at all by
n. Also, leadem these initial
de 7 mathemns, while the Obra. The stude emphasis oelatively littlea displays, any the 14 respo
ers may decidresults.
atics instructOhio standarddent expectaton expectatione instructionad Statistics anonding grade
de to collect fu
tional data reds for the grations of teachns at three dial emphasis –nd Probability 7 Ohio teach
urther data fr
eveal a heavy ade place morhers focus on ifferent levels– Geometric cy—and thesehers.
rom other dis
emphasis onre emphasis oPerform Procs (2, 3, 4). Seoncepts, Base topics were
stricts and sch
n Number senon Measuremcedures, whileveral math tic algebra not reported
11
hools
nse ment e the opics
as

12
• The statistic of alignment across all topics and expectations is .49, indicating that while most of the topics taught were consistent with those in the state standards, the level of expectations of teachers differs from expectations outlined in the Standards. This statistic means that about half the topics and expectations defined by state standards were being taught at the level of emphasis set out in the standards.
b) Alignment of instruction with State Assessments. The analysis of alignment of instruction to the State assessment provides a more direct measure of “opportunity to learn” in relation to student achievement as measured by the state education agency. Generally, the required statewide assessment for each grade only tests student knowledge and skills on a portion of the state standards, because of limitations of time and test design. The two charts below demonstrate analysis of instructional alignment to assessments used in two states.
• The North Carolina End of Grade mathematics state assessment grade 5 was analyzed as of
spring 2011. The statistic of alignment is .4 which indicates a moderate level of alignment (prior state assessment analyses in relation to instruction should variation by state from .2 to .7). By topic, the analysis of alignment shows that the main topics tested are taught, however, the NC EOG assessment places greater emphasis on the topics Operations and Geometric concepts than is reported by teachers as instructional time. The expectations dimension of the assessment across all content topics is focused on Perform Procedures, which is highly consistent with the level of student expectations on the state assessment.
• The Ohio grade 5 ELA assessment was also analyzed through the project in 2011, and the
assessment is being used during the transition to assessments based on the Common Core. The statistic of alignment at .36 shows that instruction in the 13 classrooms reported has only a moderate degree of alignment to the assessment. Like other states in the study, the OH grade 5 assessment emphasizes assessing student Comprehension knowledge and skills as does Instruction. Instruction includes topics that are not tested by Ohio, but are aligned to state standards, e.g., Elements of presentation, and Writing process. The dimension of expectations for instruction is not well aligned with the assessment, with the assessment showing heavy emphasis on Analyze/investigate and instruction in grade 5 in these classrooms focused largely on Memorize/Recall and Generate/Create expectations.

13

c) AlignmCommon http://www
anticipateinstructiothe Commwww.SEC
The KS EAinstructiosupport ethe Commparticipan
ent of InstrucCore State St.corestandards
e the instructin in ELA and mon Core Stanonline.org/ C
AG consortiumn in relation tducators in tmon Core datants, review of
ction with Cotandards wers.org). State leional changesMath at gradndards by graContent Analy
m project inclto the Commhe transition a—including f initial analys
ommon Core e being approeaders in the s that will be des 4‐8. Also ade, and the dysis).
uded reportinon Core Stanto the Commdata analysissis findings wi
standards. Aoved and adoproject consneeded with in 2010, CCSSdata were ava
ng, analysis adards and ho
mon Core. Th workshops, dith state lead
As the two‐yeopted by mosortium encouthe CommonSO completedailable for use
and discussionow the analyshe steps in thedata reports ers, and proje
ear project best states (see uraged the usn Core. The pd the SEC cone in this proje
n of the analysis results cane project supfor each stateect webinars
egan in 2010,
se of SEC dataproject targetntent analysisect (see
ysis of currentn be used to pported work e and the locled by math
14
the
a to ted s of
t
with al and

15
ELA instructional experts and special education experts. For the three consortium states, the project data reports, analysis and discussion provided a means of examining current curriculum and instruction in a sample of classrooms and schools, and at the state level the data and analyses gained an active role for state‐level planning for the Common Core implementation.
Through the KS EAG project, the SEC Special Education data were used to address the following key questions to assist state and local educators with planning for transition to the Common Core Standards:
1) What are the key content differences between prior state standards and the Common Core Standards, as analyzed through the SEC topics by expectations content matrix? What are differences between current classroom instruction in ELA and Math based on prior standards and the new Common Core Standards?
2) What are the differences in what is now being taught at the fine‐grain, concept‐level and the concepts by expectations outlined in the Common Core Standards for each grade?
3) What are content alignment differences between instruction for general education and special education students?
4) How can educators examine learning progressions, a central structure for the Common Core Standards, using the SEC data and reports?
English language arts alignment analysis to Common Core. Following are examples of how the SEC data that were reported and demonstrated for Common Core Standards support to states and local educators:
• Grade 6 language arts instruction reported by 21 KS teachers was analyzed for alignment with the Common Core ELA standards. The alignment statistic is .53, however the analysis shows that topics emphasized in the Common Core that will need to be brought more significantly into the curriculum for grade 6 are: Critical Reasoning, Writing process, Writing applications, and Speaking and listening, and significantly more emphasis on Elements of presentation (verbal and writing). The analysis of instruction in Kansas classrooms in relation to Common Core is very similar to the results of instructional content analysis for other states. The analysis using the SEC contour maps highlights the topics at each grade that will need to shift to align with the Common Core .
• Expectations for learning will also shift with instruction under the Common Core. The CCSS emphasize students’ capacity to Generate/Create and Analyze/Investigate as part of their ELA learning, while current instruction focuses more on Recall and Performing procedures.

16

d) Fine‐Grthe “fine‐instructiotaught in statistic is
• TtEampetla
rain Commongrain” chartsn, or under‐ethe curriculus low (or high
The chart beloo Common CElements of Panalysis showmiddle gradesproject statesemphasis of Chat will needanguage arts.
n Core alignm to be most uemphasized inm for a specif), as well as t
ow reporting ore StandardPresentation, ed that this ts, and little tim. The next chCCSS across se to be taught. Instruction
ment analysisuseful in highln instruction. fic grade ando pin‐point w
alignment ofs provides a dboth verbal aopic is strongme was devohart highlightseveral gradest with significawill be at the
‐‐ ELA. Educalighting the sp At this level, subject it is p
where schools
f instruction indetailed pictuand written, dgly emphasizeted to classros Critical Rea. The SEC chaantly greater e Generate/Cr
ators participapecific conten, where teachpossible to ses and teacher
n 23 North Caure of time anduring languaed in the Comoom instructiasoning conceart highlights time and attreate level of
ating in data wnt that is mishers are repoee clearly whyrs are placing
arolina classrnd emphasis age arts class.mmon Core ELon on this toepts to be taufor educatorsention in gradf expectations
workshops fosing from curorting on whay the alignmeemphasis.
ooms in relatat grade 6 on. The project LA standards pic in any of tught, a major s the conceptde 6 English s.
17
ound rrent t is ent
tion n
in the the topic ts

18

Mathemaof grade 6degree ofbelow ind
The analytaught in differenceMeasuremalgebra, a
atics Instructi6‐8 Mathemaf consistency dicates the sta
ysis shows thaOhio classrooes that can bement, Statistiand Geometri
ional Alignmetics instructioof current insatistic of align
at most of theoms, accordine noted: the cs and Probaic concepts th
ent with Comon from data struction withnment is .67 (
e broad topicsng to the repoCommon Corbility at thesehat are now b
mmon Core. Treported by h the Commo(a high level c
s emphasizedorts from 32 tre standards ee grades, in adbeing taught.
The SEC chart32 Ohio teacon Core at thecompared to
d in the Commteachers’ clasemphasize inddition to the
t below demohers. The rese broad topic other analyse
mon Core aressrooms. Thenstruction in te topics Nubm
onstrates anasults show a hlevel. The ches and states)
e currently beere are severathese grades mer sense, Ba
19
alysis high hart ).
ing al on asic

Fine‐Graialignmentanalysis bchange fotheir classconcepts PolynomiThe graphfocus of in
n Common Ct to Commonby expectationor this topic. Tses devote a semphasized ials, and Multh reveals thatnstruction for
ore Analysis: Core Standans for learninThe 14 Ohio gsmall amountin the Commoiple represent key conceptsr teachers and
: Math. The crds for the Bag indicates wgrade 7 matht of time to spon Core are nntations. Thes in the develd this strand
chart below sasic Algebra twhere the Comh teachers incpecific concenot taught, inalignment stlopment of stis not well int
shows the Ohtopic in grademmon Core focluded in this pts under Bascluding Absotatistic for Batudent knowltegrated into
hio Math Instre 7. The fine‐gocus for instrureport indicasic Algebra, alute Value, Osic algebra inledge of Algeo the curriculu
ructional grain conceptuction will reate on averagand several Operations onnstruction is .4bra are not a um for grade
20
ts quire e
4.
7.

Analysis o
One stratconcepts content mfor core st CCSS Mattopics in mmeasuremthe expec
of Standards‐
egy for using to be taught maps is best ctrands of con
th Analysis grmath across gment at gradectations shift t
‐by‐Grade Pro
the SEC analyfrom grade toonducted acrntent.
rade 5 to 6. Tgrades, for exe 5, and buildto the right to
ogressions w
ysis of Commo grade. Theross grades si
The SEC contexample the gring into gradeoward Conjec
with Common
mon Core to g fine grain annce the CCSS
ent maps cleaeater emphae 6 more empcture/prove a
Core Standa
uide instructinalysis of topiS are written b
arly shows thesis on numbephasis on Basand Solve non
ards
ional improvecs by expectabased on lear
e change in eer, operationssic Algebra ann‐routine pro
ement is analations using Srning progres
emphasis of ms, and nd Statistics. blems.
21
yzing SEC ssions
main
Also

Basic Algegrades fotopics to bthe contenow recoggrade 8 o
ebra progressr basic algebrbe taught in gnt progressiognize how algr 9 but a proc
sion grade 5 tra with four tograde 6. The ons, and to plgebra is expeccess of buildin
to 6. The chaopics emphasSEC maps allan how curriccted to be taung student kn
art below shosized in gradeow state andculum and maught under Conowledge and
ows the Comme 5 to provide district curriaterials shouommon Cored skills across
mon Core proe the foundatculum speciald be organize – not as a coa number of
ogression acrotion for eight alists to easilyed. Teachersourse startingf grades.
22
oss
y see s can g at

23
2.HowcanweanalyzeinstructionrelatedtostandardsforstudentswithIEPs,includingstudentswithsignificantcognitivedisabilities?
The design for the project requested that each participating district and school request that surveys be used to report instructional data on ELA and math in grades 4‐8, and that both general education and special education teachers participate. Thus the objective was to have a sample of teachers participating from each state that would represent instruction being provided for general education students and special education. The survey includes questions on teacher assignments and class organization, thus allowing the project to analyze instruction in special education for teachers that are working in a co‐teaching model, a pull‐out model, one‐to‐one or other instructional arrangements. The steps in the KS EAG Consortium project allow us to report data that address the following questions:
a) What are the differences in content of instruction being taught by general education teachers vs. special education teachers? b) How does instructional content differ between student groups in comparison to Standards? c) What is the alignment between State Extended Standards for students with significant cognitive disabilities (1% population) and regular, academic standards? What is the alignment of instruction to Extended Standards for students with Significant Cognitive Disabilities?

a) DifEnglisSEC Sby spegrade• S
t• C
G• O
s
fferences in sh language apecial Educatecial educatioes 4‐8). SeverSpecial educathrough 8. ThComprehensioGeneral Ed. teOther topics rlightly more t
content of rts example ation project won teachers (1ral key points tion teachershey are providon is the topiceachers are foeceive a smatime on Writi
instruction ianalysis. Thewere able to c13 teachers gof difference
s are includingding less instrc with greatesocusing morell amount of ing and Eleme
in Special Ed chart below compare and grades 4‐8) ane were observg instruction ruction on Vost time and at time on the instructional ents of presen
ducation vs.demonstrateanalyze instrnd general acved: in Phonics in ocabulary thanttention by bGenerate/Cretime from bontation by Ge
. General Edes how Kansaruction providademic teach
instruction an General Ed.both groups oeate expectatoth groups ofeneral Ed. tea
ducation— Ks educators ided and repohers (55 teach
t these grade. teachers. of teachers, antion in this tof teachers, witachers.
24
KS n the rted hers
es 4
nd opic. th

Fine g
• Th8)tee
grain analysis
he data from ) indicate thaeachers (28 Smphasized, th
s of Special Ed
teacher survt the topics tpecial educathe types of w
ducation vs. G
veys on Writinaught in Writtion, 85 Genewriting taught
General Educ
ng Applicationting are quiteeral educationare similar b
cation‐‐ELA O
ns instructione similar betwn). Thus althoetween teach
Ohio example
n in Ohio classween the assigough Writing hers.
e
srooms (gradgned groups ois not curren
25
es 4‐of ntly

b) Antype osteps team
•
•
nalysis of Coof 3‐panel chawith the SECto analyze daThe chart of teacherAuthor’s cSpeaking. The expectAnalyze/EvPerform Pinstruction
ommon Coreart shown beC online data. ata by teachereporting Coms in Ohio neeraft, and Writ
tations for stvaluate expecrocedures – in in both type
e Standards low was prov The databas
er assignmentmmon Core Sed to re‐focusting applicati
udent learninctations whilendicating a nes of classes.
and Special vided for eachse downloadet (General vs. Standards by ts ELA instructions and Writ
ng in the Come teachers in eed for shift
Education Ch of the stateed to excel spSpecial Ed.) ateacher assigion at grade 4ting process, a
mmon Core foboth groups in the strateg
Classroom Ines using additpreadsheet allas well as gragnment shows4 toward Critas well as List
cus heavily ofocus more ogies and mate
nstruction—ional analysislowed the proade level. s that both grical Reading, tening and
n on Recall and erials used fo
26
—The s oject
roups
r
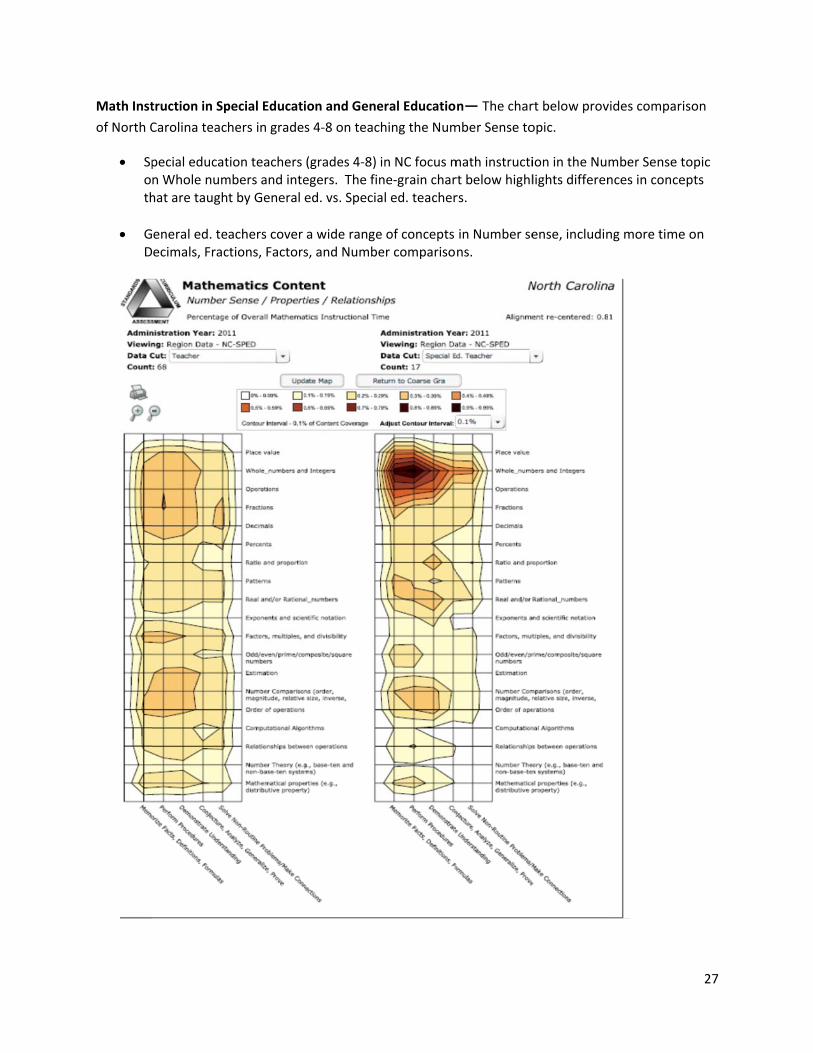
Math Instof North C
• Spoth
• GD
truction in SpCarolina teach
pecial educatn Whole numhat are taugh
eneral ed. teecimals, Frac
pecial Educatihers in grade
tion teachers mbers and intet by General
achers cover ctions, Factors
ion and Genes 4‐8 on teac
(grades 4‐8) egers. The fined. vs. Specia
a wide ranges, and Numbe
eral Educatiohing the Num
in NC focus mne‐grain charal ed. teacher
e of concepts er compariso
n— The charmber Sense to
math instructirt below highlrs.
in Number sens.
rt below provopic.
ion in the Nulights differen
ense, includin
vides compari
mber Sense tnces in conce
ng more time
27
son
topic epts
e on

•
•
In the 3‐pateachers (1amount ofconcepts. Special edGeneral edexpectatio
anel OH Math19 Special edf time on man
ucation teachducation teacons for studen
h Basic Algebrucation, 60 Gny concepts, w
hers of math chers and thents.
ra chart belowGeneral educawhile the Com
in grades 6‐8 time is large
w, the data shation teachermmon Core o
spend less tily at the Reca
how that botrs) are shownoutlines focus
me on Basic Aall and Proced
h groups of to teach a sms on five to 6
Algebra than dures level of
28
mall
f

29
c) Special education analysis: Students with significant cognitive disabilities (1% students)
The Consortium project provided content analysis of the Extended Standards developed and approved by each of the three State Education Agencies instruction. The charts below highlight analysis of Standards and Instruction for the 1% student population and teachers reported on their instruction for specific students.
The example charts below show ELA extended standards are compared to Common Core Standards. The Kansas standards were developed through the DLM (Dynamic Learning Maps) multi‐state consortium project (supported by a grant from US ED). The analysis indicates that the extended standards developed with DLM have a moderate level of alignment to the Common Core Standards at grade 6 main topics level (.53). Alignment at the fine grain level for all topics is .32.
The ELA instructional content taught to NC students with significant cognitive disabilities is compared to NC extended standards for grade 5. Teachers of 1% students in the three states reported on their instruction for specific students in their classes. The content analysis chart used for the extended standards and 1% instructional analysis includes one additional category of cognitive demand, or expectations for learning—Attention. The alignment of the coarse grain content (large topics) is relatively low (.24). Instruction for these students is focused primarily at the Attention level of cognitive demand (col. 1). A modified version of the SEC instrument was developed and used with these teachers. (The SEC modified instrument is included in the Project Products.)

30

The Ohio relation to The Mathalignmenttopics is lobe taughtConjectur
Extended Stao the Commo
h extended stat at the large ower (.33) indt to the 1% stre/prove or So
andards wereon Core for gr
andards analygrain / main dicating moreudent group.olve non‐rout
e developed inrades 6‐8 in th
ysis for gradetopics level (e divergence f The Ohio extine problem
n the state in he chart belo
es 6‐8 shown .60). The aligfrom Commoxtended stans (cols. 4 and
2011‐12. Thow.
below indicatgnment statison Core in thedards do not 5).
he Standards a
tes relatively stic at the finee specific con include expe
are analyzed
high level of e‐grain level fcepts that areectations for
31
in
for all e to

In the chadisabilitielarge topi(col. 1) aninclude in
art below, thes is comparedcs is low (.11nd the topics tnstruction in M
e Math instrud to NC exten). Instructiontaught are mMeasurement
ctional contended standardn for these stuostly in Numbt, Basic algeb
ent taught to ds for grade 5udents is focuber Sense andra, and Data
NC students w5, as reportedused at the Atd OperationsDisplays.
with significad in 2011. Thttention leve. The NC exte
nt cognitive e alignment ol of expectatiended standa
32
of ions ards

33

34
3.Whatarethedifferencesininstructionalpracticesandcontenttaughtbetweenspecialeducationandgeneraleducationclassrooms?Whataretheimplicationsofthedifferences? The SEC Special education data were reported by teachers with characteristics of the class they are teaching. Reporting survey data by the percentage of students with IEPs in each class, the data on instructional practices in classrooms become very informative for understanding current differences, and similarities, in instruction for special education students and general education students. In the SEC survey, a wide variety of survey items are asked of teachers to provide multiple possibilities for analysis of practices—including teacher attitudes, teacher preparation, professional development, classroom assessments, homework, and use of technology. In the SEC special education project, the reports and applications focused on three types of data charts and reporting:
Classroom practices by state in ELA and Math—frequency by percentage of students with IEPs
Small‐group activities in ELA and Math – frequency by percentage with IEPs Teacher perceptions toward teaching ELA and Math – frequency by percentage with IEPs
ELA Instructional Practices. The first chart reports on a variety of types of instructional practices and classroom activities based on example data from one state and one district in the state. The colored bars display the variation across the teacher group and the black bar is the average.
In English language arts, classes with primarily special education students (more than 70% IEP) have widely varied instructional practices, and practices tend to differ from classes with a mix of general education and special education students. The classes with >70% IEP students have less reading, less collecting information, less presenting information, less writing, and slightly more use of manipulatives and more work in small groups. These classes do have more use of small groups or pairs during instruction.

Instructio
onal Activities
s in ELA by %
students wit
State
th IEPs – Exam
mple Graph
Districct
35

36

ELA groupeducationwritten asstudents a
p activities dun students hassignments frabout reading
uring instructve widely varrom texts or wg and writing
tion. The Ohiried use of smworksheets, a, and less pre
io ELA classesmall group actand the groupeparation for
s with a highetivities. Thesep work involvpresentation
er percentagee classes tendes less discusns to the class
e of special d to use moression among s.
37
e

Mathema
All three tabout halis used in activities class time Classes wtime), andtaking stra
atics Instructi
types of classf of all the clawriting in maand using edue and class siz
ith more specd also learninategies.
ional Practice
es (by % IEP) asses spend oath class. In aucational tecze by teacher
cial educationg math outsid
NC
es
spend almosone‐fourth to all three categhnology to leassignment –
n students usde the classro
–State level
st half the clasone‐half of tgories, studenarn math. (N– special educ
se more time oom, using po
ss time workiime on wholents spend conNote: See Appcation vs. gen
with manipuortfolio in ass
District le
ing individuale class discusnsiderable timpendix by Statneral educatio
latives (averasessment, and
evel
lly on math, asions. Little tme in small grte for averageon.)
aging over 50d practicing t
38
and ime roup e
0% of est
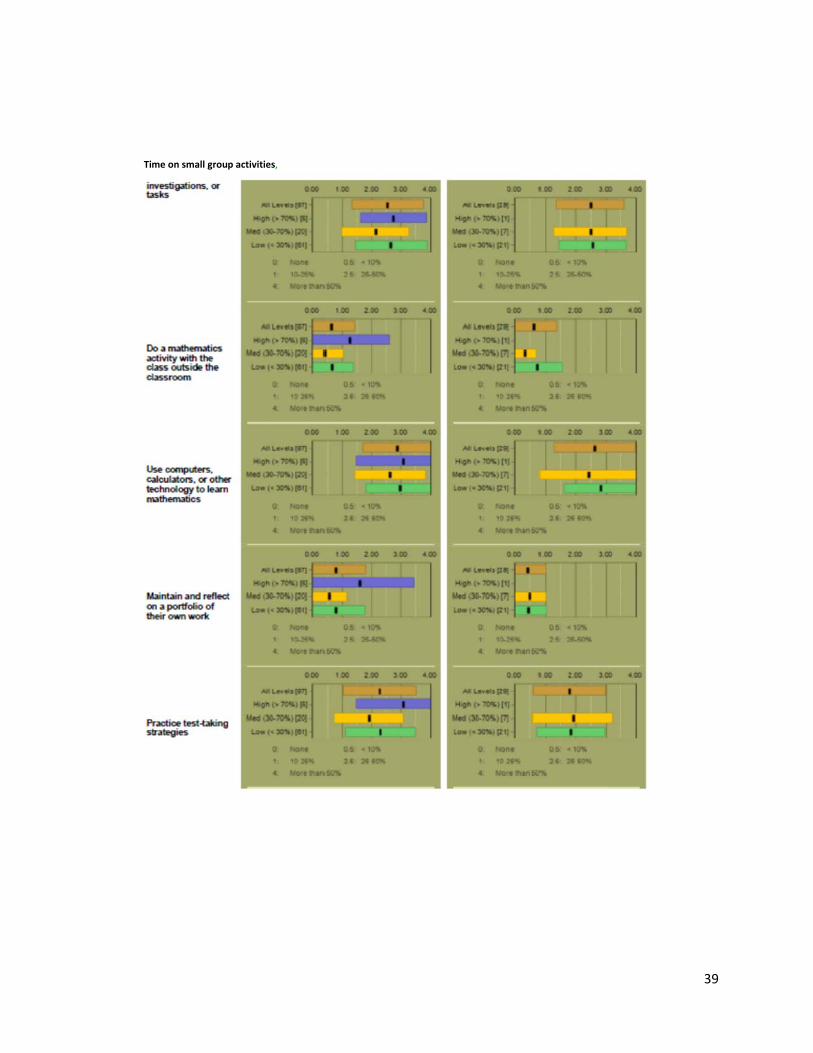
Ti
me on small grou
p activities,
39

Small‐Gro
During smleast a quin this praproblems
oup Classroom
mall group claarter of timeactice in classduring group
m Activities:
ssroom activi in solving woes with high p work and lit
Ohio –State
Types of act
ities in Ohio iord problemsIEP enrollmenttle time in di
e level
ivities used in
n math instrus from a text onts. High IEP scussing mat
Cent
n Math
uction, all thror worksheetclasses do noh problems.
tral OH distric
ee types of ct, although wiot focus on so
cts
lasses spend ith wide variaolving non‐ro
40
at ation outine

41
Teacher Perceptions related to Instruction
Another application of the SEC Special Education data demonstrated through the KS EAG project was reporting on teacher opinions regarding their assigned class and students, as well as their views of their capacity to work with varying students and use different instructional practices. The charts below highlight the kinds of data that were used with state and local participants, and demonstrate how the data can be used.
In the first chart, Ohio teachers’ views on teaching mathematics are reported by position: Special Education vs. General Education. The data show that Special education teachers have more varied opinions about students needing to learn computation first and about whether all students can learning challenging math, and the averages are slightly lower than General education teachers. Both groups of teachers have varied view on grouping of students to learn math, with some favoring and some less favorable toward grouping students by ability.
The second data chart shows the responses of North Carolina teachers to their preparation for teaching diverse students and abilities. The teacher data are reported by the percent of students with IEPs in the class on which they are reporting data. The results for both NC districts show that teachers with mixed General Ed/Special Ed. classes have the most varied perceptions of their preparation and readiness. These teachers are less well prepared for teaching students with different cultural backgrounds, limited English proficiency, and learning disabilities.

42

Instructio
onal Readines
ss of Teacher
NC District
rs by Percent
A
Students wit
th IEP
NC Districct B
43

44
Analysis of Opportunity to Learn for Students with Disabilities. The data on classroom activities can be combined with analysis of instructional content to improve the analysis of changes and shifts in instruction and curriculum that are indicated by the Common Core. Under the project goal of understanding the link between instruction and student achievement (or “opportunity to learn”):
a) What is the alignment of content of current instruction provided in special education with the content of State Assessment? (access SEC chart)
b) Are there differences in the content taught by General Education teaches and Special Education
teachers? What art the differences by topic and expectations? (access SEC chart by Teacher assignment)
In the SEC content analysis charts which report content of instruction between general education teachers and special education teachers (e.g., the attached charts with NC and KS data), if the instructional topics and expectations for student learning are quite different, we have a good idea that content of instruction can help explain differences in student achievement for special education students vs. general education students.
c) If the content of instruction between general education teachers and special education teachers as reported by teachers on SEConline is reported as very similar (aligned between teacher groups) on topics and expectations for student learning – Then, three steps in data analysis can be taken with the SEC special education reporting charts: c.1) Is content of instruction also very similar at the fine grain topic level? c.2) Are the expectations for learning similar? c.3) If NO for 1 or 2, the content of instruction differences may explain differences in student
achievement. If YES for 1 and 2, then we can examine differences in types of instructional practices, and
ask, Are general education and special education teachers using different kinds of instruction which could explain student achievement differences?
Example data to illustrate the Analysis of OTL steps in Math and ELA are shown in the Using SEC Special Education Data document. (See Additional Reports in the Project Products list)

45
4)WhatistherelationshipofinstructionstudentsreceivetostudentachievementresultsinmathandELA?Cross‐stateresearchanalysisresultsreportedbyJohnSmithson,WisconsinCenterforEducationResearch While regional and local data results can serve to inform practitioners and administrators at the local level regarding instructional practices in their schools, looking at results across states provides the opportunity to consider the larger picture of special education and perhaps identify patterns accessible with the larger numbers of reporting teachers that would otherwise be lost in the specifics of local findings. The cross‐state research analysis provides results that can be generalized to the larger population of teachers and students, potentially providing insights into basic elements of mathematics and reading instruction that have relevance for teachers, administrators and researchers beyond the boundaries of the schools, districts and states that participated in the study. The cross‐state results also provide a baseline picture of instructional practices in ELA and mathematics for both general and special education students which can be used in tracking changes in practices over time, and thus potentially be useful for analyzing effects of instructional improvement initiatives.
The cross‐state analysis for this study comprises data collected at three levels from three distinct sources. Program data on least restrictive environmCommon Core State Standardsent (LRE’s) was provided from district or state‐level records for those schools participating in the study in the three states. Teacher reports of instructional content coverage and classroom practices were collected using the Surveys of Enacted Curriculum (SEC) online data collection and reporting system housed and maintained at the Wisconsin Center for Education Research at the University of Wisconsin‐Madison. Student level reading and math scores on state assessments for school years 2009‐2010 (prior year) and 2010‐2011 (study year), along with information that allowed us to connect teacher instructional data with their students’ test scores for the study year (2010‐2011) were provided by the participating state education agencies. Student scores for the relevant subject (math or language arts) from the prior year (2009‐2010) served as a prior achievement measure for the analyses described below.
Of particular note with this data‐set is that student data was able to be connected with teacher data in a way that allows for a more detailed examination of the role that opportunity to learn (OTL) and instructional activities play in the achievement of students. The analyses reported below use multivariate regression models designed to predict (explain) student achievement scores controlling for prior achievement and economic disadvantage in order to examine the relative impact of program inclusiveness, opportunity to learn, instructional practices, and students’ disability status on achievement.

46
DescriptiveResults
OpportunitytoLearn(OTL)The alignment index provides a measure of the extent to which instruction is aligned to (or matches) the content emphasized by a given instructional target and is a key measure relevant to each of the four research questions considered in this study (RQ1‐4). In this way the alignment index (AI) provides a convenient summary measure for indicating students’ opportunity to learn (OTL) standards‐based content as emphasized by one or another instructional target. For the purposes of this study, several instructional targets were considered; state standards, extended or modified standards, the new Common Core State Standards and previous state assessments. Thus any one teacher has multiple OTL measures, and the impact of each on student achievement can be considered (RQ4).
To examine differences between the OTL of general and special populations of students (RQ3) we first consider the effect of teacher position (i.e. general versus special education certification) on a student’s OTL as measured by the alignment index. However since special education students may receive mathematics or language arts instruction from either general or special educators, we also examine differences in OTL for students across the sample based on students’ disability status (i.e., 1 = SWD; 0 = no disability) and using the relevant alignment index reported for the teacher a given student was assigned to. This allows us to consider OTL based on a student’s disability status regardless of whether that student was taught by a general or special education teacher.
Each of these analyses provides a slightly different perspective from which to consider the extent a students’ opportunity to learn standards‐based content differs among the general and special education populations. Considering the impact of teacher position on OTL provides an opportunity to consider whether there are systematic differences in the academic content delivered to students by general and special educators. If differences in OTL are noted based on teacher position, then one may conclude that efforts to improve the OTL of students with disabilities could be addressed through strategies that address the academic content delivered by special education teachers. Similarly, if a student’s disability status appears to impact OTL, regardless of whether a student’s teacher is a general or special educator, then strategies focused on student placement may better serve to improve SWD’s access to standards‐based content.
Two types of placement issues could be at play in these cases. Either 1) students with IEP’s have a tendency to be pulled from the classroom during math or reading instruction, or 2) students with IEP’s tend to be assigned to math and reading classrooms with teachers (regardless of teacher certification) that report lower instructional alignment to academic standards. If both teacher certification and disability status reveal a significant difference in OTL, then (1) above is most likely at play. If teacher certification reveals no difference in OTL, but disability status does, then (2) above is more likely to be the cause of lower OTL for students with IEP’s. The implications of these factors will be considered below.
TeacherCertification

47
Whether teachers identified themselves as a general or special educator yields some difference in the extent of alignment or OTL provided for a given instructional target (e.g. one or another standard or assessment), for language arts and reading, but not mathematics.
For English Language Arts & Reading (ELAR), general and special education teachers in the sample varied substantially based on whether the teacher was a special educator (SpEd), regardless of which alignment target is considered. In each case SpEd teachers reported significantly lower alignment measures compared to their general education peers (see Chart 1), and thus fewer opportunities to learn standards‐based content for their students with disabilities. This pattern persists even for the state extended standards and the modified assessment, where one might expect special educators to place more emphasis than teachers of students in the general population.
While mathematics teacher reports indicate no significant difference in OTL associated with teacher position, it is interesting to note the patterns of alignment for the two groups of mathematics. As one might expect, special education teachers reported higher alignment to the state extended standards as well as to the state modified assessment. Curiously, special education teachers also reported more alignment to previous state assessments, suggesting that special educators may be somewhat more focused on what is assessed than what is in the state standards.
Interestingly, teachers in the study, regardless of certification or subject area, tended to report content coverage more aligned to the common core state standards than any other instructional target examined. The other notable pattern that emerges from Chart 1 is that in general, mathematics teachers tend to report content coverage that is better aligned to each of the instructional targets than reported by language arts and reading teachers.
0.00 0.10 0.20 0.30 0.40 0.50 0.60
State Standards (cg)
CCSS (cg)
Extended Standards (cg)
Modified Assessment (cg)
State Assesment (cg)
Special Ed. Tchr. (56) General Ed. Tchr. (181)
Chart 1: Instructional Alignment by Teacher Certification
English Language Arts & Reading Mathematics
* Significant at p < 0.05 ** Significant at p < 0.01 Whisker = 1 Standard Deviation
0 0.1 0.2 0.3 0.4 0.5 0.6
State Standards (cg)**
CCSS (cg)**
Extended Standards (cg)**
Modified Assessment (cg)**
State Assessment (cg)*
Spec. Ed. Tchr. (n=97) General Ed. Tchr. (n=242) Special Ed. Tchr. (n=56) General Ed. Tchr. (n=181)

48
StudentDisabilityStatus
Since not all students with disabilities receive their language arts, reading or mathematics instruction from a special educator, it is important to also consider OTL from the perspective of the student, regardless of whether taught by a general or special educator.
For English, Language Arts and Reading, alignment results based upon students’ disability status reported in Chart 2 indicate much the same pattern as seen with the results noted for teachers in Chart 1. One notable difference is that from the perspective of the student, SWDs receive instruction slightly more aligned to the state’s extended standards than received by the general student population. For mathematics alignment to state standards (whether old or new common core) indicate statistically significant differences between the general and special student populations. What is surprising here is that SWDs on average receive instruction that is slightly more aligned than the instruction received by the general student population.
InstructionalPedagogy In addition to examining questions about the opportunity for students to learn standards‐based content in reading and mathematics, the data collected as part of this study allow for the consideration of the role and impact of certain pedagogical practices for students with disabilities.
Five scale measures related to instructional pedagogy were constructed from survey items for each subject. In language arts the five scale measures focus on instructional time that students spend engaged in activities related to: 1) demonstrating/presenting to others; 2) generating written text; 3) analyzing information; 4) evaluating arguments and/or evidence; and 5) activities related to test preparation. The five scales for mathematics generally mirror the language arts scale with the exception
Chart 2: Instructional Alignment by Students’ Disability Status
English Language Arts & Reading Mathematics
0.00 0.10 0.20 0.30 0.40 0.50 0.60
State Standards (cg)**
CCSS (cg)**
Extended Standards (cg)**
Modified Assessment (cg)*
State Assessment (cg)*
Special Ed. Student (674) General Ed. Student (5123)
0.00 0.10 0.20 0.30 0.40 0.50 0.60
State Standard (cg)**
CCSS (cg)*
Extended Standards (cg)
Modified Assessment (cg)
State Assesment (cg)
Special Ed. Student (580) General Ed. Student (3598)
* Significant at p < 0.05 ** Significant at p < 0.01 Whisker = 1 Standard Deviation
Special Ed. Student (n=580) General Ed. Student (n=3598)Special Ed. Student (n=674) General Ed. Student (n=5123)

49
of a scale on ‘performing procedures’ in place of the ‘generating written text’ scale. Scale definitions and reliability measures are reported in Appendix D.
TeacherCertification.
Of the five scale measures examined for language arts only classroom practices associated with analyzing information reveal a statistically significant difference in the reporting of special and general education teachers, and this only in language arts.
In mathematics no significant difference in pedagogical practices are noted between general and special education teachers across any of the five instructional practice scales. For language arts and reading, results indicate that special educators spend less time engaging students in activities related to analyzing information compared to general education teachers.
StudentDisabilityStatus
When examined from the student’s perspective, results indicate that students with disability are more likely to spend less time engaged in activities associated with analyzing information as well as less time spent engaged in evaluating/critiquing arguments and evidence when compared to their general education peers.
Chart 3: Instructional Activities by Teacher Certification
English Language Arts & Reading Mathematics
0.00 0.05 0.10 0.15 0.20 0.25
Demonstrate Understanding
Perform Procedures
Analyze Information*
Evaluate arguments & evidence
Test Preparation
Special Ed. Tchr. (59) General Ed. Tchr (194)
0.00 0.10 0.20 0.30 0.40 0.50
Demonstrate Understanding
Perform Procedures
Analyze Information
Evaluate arguments & evidence
Test Preparation
Special Ed. Tchr. (50) General Ed. Teacher (188)
* Significant at p < 0.05 ** Significant at p < 0.01 Whisker = 1 Standard Deviation
Special Ed. Tchr. (n=50) General Ed. Tchr. (n=188)Special Ed. Tchr. (n=59) General Ed. Tchr. (n=194)
50
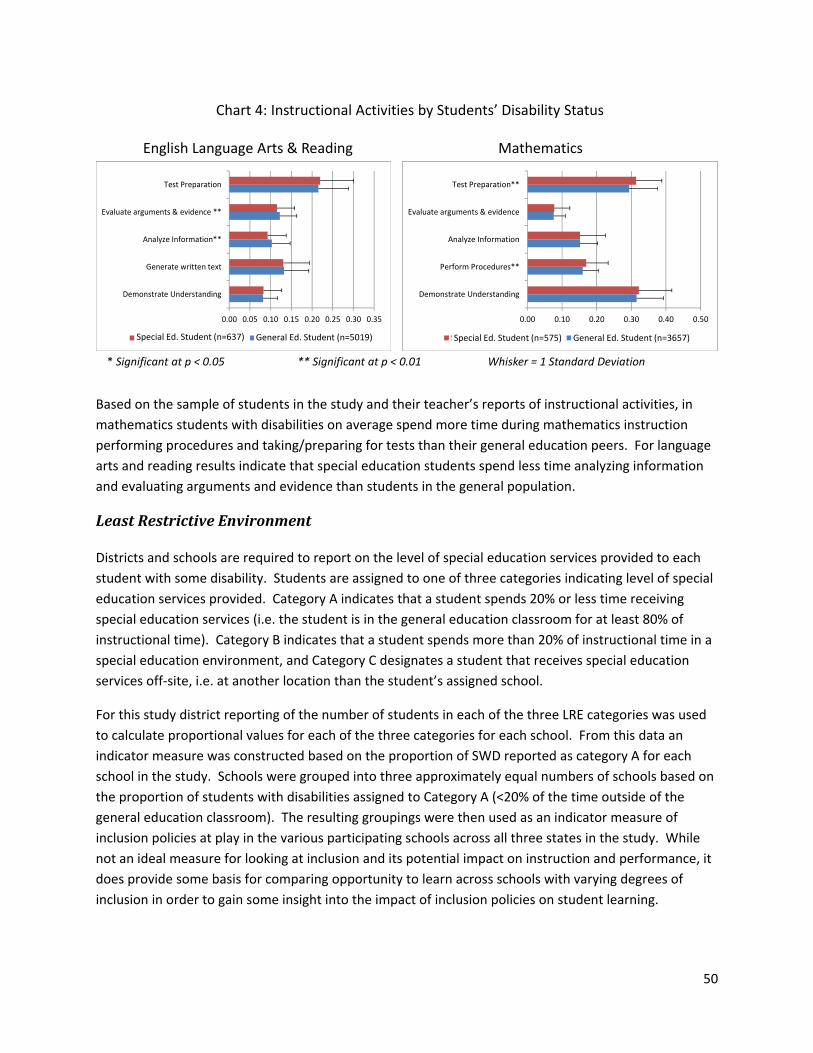
Based on the sample of students in the study and their teacher’s reports of instructional activities, in mathematics students with disabilities on average spend more time during mathematics instruction performing procedures and taking/preparing for tests than their general education peers. For language arts and reading results indicate that special education students spend less time analyzing information and evaluating arguments and evidence than students in the general population.
LeastRestrictiveEnvironment
Districts and schools are required to report on the level of special education services provided to each student with some disability. Students are assigned to one of three categories indicating level of special education services provided. Category A indicates that a student spends 20% or less time receiving special education services (i.e. the student is in the general education classroom for at least 80% of instructional time). Category B indicates that a student spends more than 20% of instructional time in a special education environment, and Category C designates a student that receives special education services off‐site, i.e. at another location than the student’s assigned school.
For this study district reporting of the number of students in each of the three LRE categories was used to calculate proportional values for each of the three categories for each school. From this data an indicator measure was constructed based on the proportion of SWD reported as category A for each school in the study. Schools were grouped into three approximately equal numbers of schools based on the proportion of students with disabilities assigned to Category A (<20% of the time outside of the general education classroom). The resulting groupings were then used as an indicator measure of inclusion policies at play in the various participating schools across all three states in the study. While not an ideal measure for looking at inclusion and its potential impact on instruction and performance, it does provide some basis for comparing opportunity to learn across schools with varying degrees of inclusion in order to gain some insight into the impact of inclusion policies on student learning.
0.00 0.05 0.10 0.15 0.20 0.25 0.30 0.35
Demonstrate Understanding
Generate written text
Analyze Information**
Evaluate arguments & evidence **
Test Preparation
Special Ed. Population (637) General Ed. Population (5019)
Chart 4: Instructional Activities by Students’ Disability Status
English Language Arts & Reading Mathematics
* Significant at p < 0.05 ** Significant at p < 0.01 Whisker = 1 Standard Deviation
0.00 0.10 0.20 0.30 0.40 0.50
Demonstrate Understanding
Perform Procedures**
Analyze Information
Evaluate arguments & evidence
Test Preparation**
Special Ed. Population (575) General Ed. Population (3657)Special Ed. Student (n=575) General Ed. Student (n=3657)Special Ed. Student (n=637) General Ed. Student (n=5019)

51
Chart 5 provides an overview of the opportunity to learn indicators across the five instructional targets disaggregated by levels of inclusiveness. The results are based upon teacher reports without regard to teacher certification, and since special education teachers represent only a small percentage of the overall sample of teachers, the results are mostly indicative of instruction in the general education classroom.
For Language Arts & Reading, statistically significant differences in the level of OTL delivered by teachers based on inclusiveness are noted for both the modified and regular state assessments, where schools with medium levels of inclusiveness tend to emphasize assessed content to a greater extent than reported by teachers in schools with either low or high levels of inclusiveness. At the same time, schools reporting medium levels of inclusion indicate notably less emphasis on content related the the state’s extended standards. This latter finding is most likely due to the small number of special education teachers represented in the sample
For mathematics the case looks quite different with teachers in schools with medium levels of inclusiveness tend to emphasize assessed content less than either high or low inclusive schools, though the differences are not statistically significant due to the similarity of emphasis on assessed content in low and high inclusive schools. Where statistically significant group differences are noted in mathematics is with OTL state standards, both old and new. In both cases teachers in schools with low inclusion rates tend to report more emphasis on standards‐based content compared to reports of teachers in schools with higher inclusion rates.
In order to consider the effect of inclusion more specifically on students with disabilities, the following two sections examine the impact of inclusion on OTL is examined from the perspective of the student.
0.00 0.10 0.20 0.30 0.40 0.50 0.60
StateStandards (cg)
CCSS (cg)
Extended Standards (cg)**
Modified Assessment (cg)*
State Assessment (cg)*
High Med Low
0.00 0.10 0.20 0.30 0.40 0.50 0.60
State Standards (cg)**
CCSS (cg)*
Extended Standards (cg)
ModifiedAssessment (cg)
StateAssesment (cg)
High Med Low
Chart 5: Opportunity To Learn by Level of Inclusiveness
English Language Arts & Reading Mathematics
* Significant at p < 0.05 ** Significant at p < 0.01 Whisker = 1 Standard Deviation

52
Mathematics
In mathematics students with disabilities that were in schools with a high incidence of inclusion tended to receive similar opportunities to learn standards‐based content as their general education peers. However somewhat surprisingly, in schools with low levels of inclusion SWD tend to be in classrooms with notably lower OTL on content emphasized in the state’s extended standards and assessed on the modified assessment. Moreover SWD in schools with relatively lower levels of inclusion appear to be placed in classrooms with somewhat more emphasis on the old state standards, but somewhat lower emphasis on content related to the newer Common Core State Standards.
LanguageArts&Reading
For language arts & reading the pattern looks quite different, with SWD in schools reporting relatively lower levels of inclusion reporting the lower measures for opportunity to learn standards‐based content whether related to the old or new state standards. By contrast students in schools from with relatively
0.00 0.10 0.20 0.30 0.40 0.50 0.60
State Standards (cg)*
CCSS (cg)**
Extended Standards (cg)*
ModifiedAssessment (cg)**
StateAssesment (cg)
Special Population (201) General Population (1068)
0.00 0.10 0.20 0.30 0.40 0.50 0.60
State Standards (cg)
CCSS (cg)
Extended Standards (cg)
ModifiedAssessment (cg)
StateAssesment (cg)*
Special Population (179) General Population (1290)
Chart 6: Opportunity To Learn by Level of InclusivenessMathematics
Low Levels of Inclusiveness (<62%) High Levels of Inclusiveness (>80%)
* Significant at p < 0.05 ** Significant at p < 0.01 Whisker = 1 Standard Deviation
Special Population (n=179) General Population (n=1290)Special Population (n=201) General Population (n=1068)
0.00 0.10 0.20 0.30 0.40 0.50 0.60
StateStandards (cg)**
CCSS (cg)**
Extended Standards (cg)
Modified Assessment (cg)
State Assessment (cg)
Special Population (n=218) General Population (n=1709)
0.00 0.10 0.20 0.30 0.40 0.50 0.60
StateStandards (cg)*
CCSS (cg)
ExtendedStandards (cg)**
Modified Assessment (cg)**
State Assessment (cg)
Special Population (n=188) General Population (n=1472)
Chart 7: Opportunity To Learn by Level of InclusivenessLanguage Arts & Reading
Low Levels of Inclusiveness (<62%) High Levels of Inclusiveness (>80%)
* Significant at p < 0.05 ** Significant at p < 0.01 Whisker = 1 Standard Deviation

53
higher levels of inclusion show little difference in opportunity to learn standards‐based content compare to their general education peers. At the same time, SWD in schools with the highest rates of inclusion also tend to be in classrooms with relatively higher emphasis on the state’s extended standards. Of particular note in Chart 7 is that students in schools with the highest rates of inclusion tend to be in classrooms with the highest levels of OTL content related to the common core standards, regardless of whether the student is in the special or general population.
ModelingPredictorsofStudentAchievement
While it is generally accepted that students’ opportunity to learn standards‐based content and the pedagogical practices students experience have some impact on student performance, statistical evidence to support these pre‐suppositions are not common. Certainly isolated examples of achievement growth and gap reductions can be found, and these in turn associated with some important element of classroom practice, but large scale indicators that capture elements of practice and policy that contribute to explanations of variation in student achievement are rare.
The Survey of Enacted Curriculum (SEC) data collection system was selected for this study in order to provide a broad set of indicator measures describing the instruction delivered to general and special student populations. The results serve to inform teachers, administrators, and other educational stakeholders about current practices and provide opportunities for reflection and discussion about appropriate changes to instruction as a result of these reflections and discussion.
In addition, SEC data serve in one form or another to answer each of the questions posed for the study, whether considering the alignment of instruction to key instructional targets (RQ1); the instructional practices and content experienced by students with IEP’s, including the so‐called 1% population (students with significant cognitive disabilities)(RQ2); the comparison of key general and special education instructional characteristics (RQ3); or the relationship of these instructional characteristics to student achievement (RQ4) SEC data provide the relevant indicator measures.
When combined with student achievement data that can be associated with specific teachers reporting their practice using the SEC instruments, the SEC data‐set provides a unique opportunity to examine the predictive properties for a variety of OTL and classroom activity measures in explaining variation in student achievement scores. One of the largest successes of the study then has been acquiring access to student achievement data from participating states for the schools in the study in a manner that permitted making the connection of SEC teacher reports with performance data for the students in their class during the time of the study.
Mathematics
The sample for mathematics comprises 5,004 students across 276 classrooms. Data provided by the states include mathematics and reading achievement scores for students in participating schools for the target year (2011) as well as student achievement data for the prior year (2010). In addition students

54
were flagged on disability status (SWD), and economic disadvantage status (EDS). Identifiers were also provided that permitted students to be associated with the relevant mathematics or language arts teacher to which they were assigned. The data support a wide variety of statistical models for predicting/explaining student achievement scores, offering multiple alignment targets as indicators of opportunity to learn, as well as several scale measures related to classroom activities. The basic model employed controls for prior achievement, economic disadvantage status, disability status, and the proportion of special education students assigned to category A in the school. A simple multivariate linear regression model based on these variables yielded an adjusted R2 of 0.568, with all variables contributing significantly to the model. Adding alignment to the state’s content standards increases the adjusted R2 slightly (to 0.573) and the inclusion of the instructional practice scale measures further increases the adjusted R2 to 0.587. Thus the addition of these classroom measures provide a modest but positive improvement to the predictive model. While modest, the models indicate that the teacher reports of practice using the SEC instruments do contribute to predicting student achievement, suggesting that the measures have some predictive validity, and in turn increasing confidence in the validity of the teacher self‐report data.
In order to appreciate the relative impact of each variable in the model, Table 1 reports the standardized coefficient for each variable in the model. The data‐set offers myriad possibilities for constructing explanatory models, with widely divergent results. Manipulation of instructional practice variables tend to cause the most volatile fluctuations in model results, with the positive or negative direction of the impact of instructional practice on achievement sensitive to the inclusion or exclusion of other instructional practice variables. Prior achievement, economic disadvantage, and disability status tend to provide fairly stable predictors of achievement, while alignment (OTL) and levels of inclusion tend behave somewhat less stable than prior achievement etc. but more stable than instructional practice measures.
The model presented in Table 1 represents the best model fit found through exploration of various regression models, and indicates that OTL does have a positive impact on achievement, though at a level somewhat less than the negative effects of economic disadvantage or disability. The model also indicates that schools with higher proportions of SWD spending more time in general education classrooms tend to have a positive impact on achievement scores. Among the five scales of instructional practice, analyzing information represents the one instructional practice that has a positive impact on student achievement.
Table 1: Mathematics Multivariate Regression Equation predicting mathematics achievement
Variable Standardized Beta Coefficient
Significance
Prior achievement 0.70 0.000 Disability status ‐0.096 0.000 Economic Disadvantage ‐0.069 0.000 Level of Inclusion 0.048 0.001 State Standard (pre‐CCSSM) 0.065 0.000 CCSSM ‐0.073 0.000

55
NCTM 0.132 0.000 Analyzing Information 0.040 0.000
While the effects are modest, they do indicate that the instruments capture important elements of practice that are linked to achievement, and increase confidence that at the level of school and classroom practice the data has the potential to yield actionable information for teachers that can contribute to increased student performance.
In order to determine whether the predictive variables are the same for students with disabilities, regression models were also run for just those students identified as SWD (n=425). Results of those analyses indicate that predictive models for student with disabilities look somewhat different than the model presented in Table 1 for all students. For one thing, the economic disadvantage is not predictive of student achievement for this sample of students, but the positive effect of inclusion policies is notably stronger, with a standardized beta coefficient (SBC) of .148 compared to .048 in models including all students . Moreover, amongst the opportunity to learn variables, only alignment to the state’s extended standards show a significant (and positive) impact on student achievement (SBC = .071). None of the instructional practice scales demonstrated a predictive capacity for SWD. However breadth of coverage (how many mathematics topics are covered in the classroom) shows a significant negative impact on student achievement (SBC = ‐.097). While the sample size here is notably smaller, including only 425 students, the model fit is much higher (Adj. R2 = .707) than reported for models including all students (Adj. R2 =.587).
LanguageArts&Reading
For language arts and reading, 4,004 students in 303 classrooms are represented in the sample across all three states. Perhaps not surprisingly, the predictive models for reading achievement look quite different than the results reported for mathematics. In general, multivariate regression models in language arts tend to report higher adjusted R2, however this is largely due to the greater predictive power of prior achievement in language arts (adj. R2= .70 versus .58 for math). While OTL and classroom activity indicators do provide statistically significant contributions to the predictive models, the direction of the influence varies from one indicator to another and in ways that may appear to be counter‐intuitive. This may in part be due to the inability to distinguish students in reading classes from other types of language arts courses in the sample, while the achievement scores used in the models are reading scores. This can result in peculiar effects relative to the OTL indicators that may reflect instruction legitimately focused on other language arts content, but not predictive (or negatively predictive) of reading achievement. Nonetheless, the results do support the assertion that opportunity to learn and pedagogical indicators can contribute to explaining variations in student achievement gains and thus inform curriculum decisions designed to optimize student performance.
Table 2 Language Arts Regression Equation predicting 2011 Raw Reading Score
Variable Standardized Beta Coefficient
Significance

56
Prior Achievement .777 .000 Disability Status ‐.076 .000 Economic Disadvantage ‐.065 .000 Prop. LRE Cat. A at school .045 .000 State Standard ‐.178 .000 CCSS .090 .000 State Mod. Test .062 .000 State Ext. Standard .030 .004 Generate Written Text .022 .037
The adjusted R2 for the equation represented in Table 2 above is .701, and alternate models based on removing one or more alignment measures from the model also hover around .70. Somewhat surprisingly, these represents a better model fit that seen with the mathematics predictive models. Among the classroom practice scales generating written text tends to be the best predictor, with alignment to the (old) state standards having the strongest predictive contribution to the model aside from prior achievement. Curiously though, the relationship is negative. Each of the other OTL targets however offer a positive impact and the combined Standardized Beta Coefficients (SBC) exceed the negative contributions of economic and disability status.
Once again, separate analyses were conducted to examine changes in the model when only SWD are included in the model. As seen in mathematics, only alignment to the state’s extended standards showed a significant and positive influence on achievement (SBC= .10) while the predictive capacity of economic disadvantage disappears. Interestingly, unlike mathematics where the positive impact of inclusion increases, for language arts and reading, inclusion practices reveal no predictive capacity in models based on only SWD.
StudentswithSignificantCognitiveDisabilities
AnalysisofDatafromSECSurveyVersionBIn order to collect descriptive data regarding the educational experiences of students with significant cognitive disabilities, a custom survey was designed as part of the study to collect information on this particular population within the special education community. This group is sometimes referred to as the “1% population”, and the survey instrument developed for describing the pedagogical practices and opportunity to learn provided to this population is herein referred to as ‘Version B’.
Because the instructional needs of this population often requires specialized and individual services, a data collection instrument was needed to provide teachers the opportunity to describe the academic interactions with specific students, rather than groups of students as collected by the standard SEC survey. For this reason the project team, with advice from an advisory panel of experts with this population of students, constructed a shorter version of the SEC survey that would allow a teacher to report on the educational experiences of up to 5 students with significant cognitive disabilities. In order to make this possible without undue teacher burden, the survey was shortened to include only the first

57
of five instructional practice sections included in the survey completed by the majority of teachers in the study. As a result only limited comparisons are possible between these teachers and their colleagues in both special and general education classrooms.
The content section of the version B survey was also shortened to reduce teacher burden. Thus, In the version B survey teachers are only asked about coarse grain content; i.e. time spent on Number Sense, Operations, Measurement, etc. for mathematics, or Phonemic Awareness, Vocabulary, Reading Comprehension, etc. in language arts, and not about specific topics within these coarse grain areas of mathematics or language arts content. Another difference in the content section of the version B survey is that an additional category of cognitive demand, to represent the ‘Attend to’ level of cognitive engagement as a category below or prior to Memorize/Recall, to accommodate descriptions of cognitive engagement of the most significantly cognitively disable as needed.
Following the initial administration of the version B survey in the spring of 2011, teachers completing the version B survey were asked to provide feedback that was reviewed by the project team and advisory panel, and revisions were made. Revisions were for the most part minor, in most cases involving changes in wording to make a question clearer. However some structural changes were made as well. For example, instead of providing descriptions for up to 5 students, the revised version B asks teachers to describe instruction for 3 students that represent the range of significantly cognitively disabled students that the teacher works with. Reporting on cognitive demand was also altered to allow teachers to indicate primary and supporting performance expectations. This latter revision has also been implemented for the newest version of the general surveys as well. The revised version B survey was administered to a small pilot group of teachers in the Spring of 2012. The finalized versions of these surveys (for mathematics and language arts and reading) are included in the Appendices to the Summary Report.

58
OTLandInstructionalPracticeswiththe1%Population
Clear differences can be seen between the educational practices of teachers of students with significant cognitive disabilities, and both their special and general education peers. While different, we do not have any clear evidence on whether the differences are to the benefit or detriment of students with significant cognitive disabilities. Rather the data serves a descriptive purpose to establish a baseline description of instructional practice and thereby provide teachers with data for reflection and discussion. For example, of particular interest in Chart 8 above are those practices that show the most variation among 1% teachers. In language arts this appears to be listening/viewing, while in mathematics it is use of hands‐on materials. Both of these could well be topics for conversations among teachers responsible for instruction of 1% students to better understand the factors that play into use of these classroom practices. In this and similar ways the data can serve to inform teacher decisions about instructional practice and our understanding about the similarities and differences in practice across student populations.
Discussion—Cross‐stateanalysisfindings
Results of the cross‐state analyses indicate that opportunity to learn, classroom activities and inclusion policies all contribute to student performance to degree. The cross‐state data provides a descriptive baseline while suggesting dynamics and relationships that deserve further investigation. A basic
0.00 0.05 0.10 0.15 0.20 0.25 0.30
Listening/Viewing**
Reading **
Collecting**
Presenting**
Work Individually
Discussing*
Writing**
Hands‐on**
Small Group work
ELAR outside classroom**
Using Ed. Tech.**
Portfolio**
Test Prep.**
Take Tests*
Use Assistive Tech.**
1 Pct. (n=65) Spec. Ed.(n=59) General Ed. (n=194)
0.00 0.05 0.10 0.15 0.20 0.25 0.30 0.35 0.40
Listening
Reading
Collecting**
Presenting
Work Individually
Discussing**
Writing**
Hands‐on**
Small Group work*
Math outside classroom**
Using Ed. Tech.
Portfolio
Test Prep.**
Take Tests**
Use Assistive Tech.**
1 Pct. (n=23) Special Ed. (n=62) General Ed. (n=200)
Chart 8: Instructional Practices by Student Demographic
English Language Arts & Reading Mathematics
* Significant at p < 0.05 ** Significant at p < 0.01 Whisker = 1 Standard Deviation

59
question underlying all of the results is the degree to which the findings from this study are generalizable. Considering the diversity of teachers and program represented in the data‐set, collected from approximately 300 teachers in each subject across the three states, there is good reason to believe the results are reflective of special education more broadly. However results from further studies and other data collection efforts are needed to either confirm or alter the picture of special education portrayed in this report. With this in mind, key findings from the cross‐state analysis are summarized below by study research question.
Q1) Fidelity of classroom instruction in relation to state standards and assessments? The term fidelity deserves some clarification with respect to the SEC data set. The SEC data are fundamentally descriptive, though quantitative data; and while amenable to a variety of analyses that can provide insights into instructional practice and its impact on achievement, the data‐set does not easily yield qualitative findings. For the purposes of the cross‐state findings, fidelity is here associated with alignment and opportunity to learn standards‐based content. This however begs the question of what amounts to ‘good’ alignment.
Thus far opportunity to learn (as measured by alignment), is conceptualized as a linear relationship (i.e., as alignment rises so too will achievement). If this linear relationship is roughly correct (and our predictive models suggest it is), then it seems reasonable to look at the upper quartile of alignment measures as providing a somewhat challenging mark for ‘good’ alignment (after all, by this definition ¾ of the teaching population will have alignment measures that could be described as ‘less than good’. Interestingly, in mathematics the lower end of the upper quartile hovers right around 0.50 regardless of the alignment target selected. For language arts and reading the distribution of alignment scores vary somewhat by instructional target. However for both of the primary instructional targets (old state academic standards and the new Common Core State Standards) also have the lower end of the upper quartile for instructional alignment hovering around 0.50 (0.49 for the previous state standards and 0.53 for the new Common Core State Standards).
Another reason to select 0.50 as a threshold measure for good alignment is that conceptually this measure indicates that at least half of instructional content is aligned to the appropriate standards. This may at first seem like a low number, particularly for anyone holding the opinion that all instruction should be standards‐based. However instructional content must include some foundational content depending on where students are in the learning continuum for any given topic, making 100% a questionable, if not unrealistic goal for instructional alignment. The measure of 0.50 then represents a threshold where aligned content is important, but allowing plenty of room for teachers’ pedagogical decisions to cover supporting, technically ‘unaligned’ instruction.
If 0.50 is accepted as a reasonable minimal threshold then as already noted, about ¾ of the teacher population, whether in mathematics or language arts and reading, fall below the desirable level of alignment, whether referencing old or new academic standards. That a quarter of the sample of teachers taught with ‘fidelity’ as so defined indicates that the desirable is attainable. That three out of four teachers need to improve their alignment to the relevant instructional targets provides an indication that there is much room for improvement in the targeting of instructional content. The good

60
news is that the SEC indicators provide teachers with information that directly assists them in determining the types of curricular changes most needed in their classrooms.
Q2. Analyze instruction related to standards for students with IEPs? The SEC data provide both descriptive and analytic opportunities for examining instructional practices of all teacher, whether special or general education teacher delivering instruction to the general, special or 1% student population. Descriptively, both instructional practice and opportunity to learn (alignment) measures provide teachers feedback on practice and provide opportunities for personal reflection and collegial discussions that can lead to positive changes with respect to student achievement. The opportunity to learn measures indicate that for students with IEP’s, alignment to the state’s extended standards has a significant and positive impact on student achievement, while other OTL targets show either no influence or a negative influence on student achievement. In mathematics those schools with higher proportions of students with IEP’s in LRE category A also demonstrated a positive and statistically significant effect on student achievement. However this positive benefit of inclusion practices does not appear to extend to language arts and reading. Another feature of instruction that emerges from examination of instructional practices for students with IEP’s is that increased breadth of mathematics topics covered in the class tends to have a negative impact on student achievement, though breadth of coverage showed no impact on achievement using similar predictive models for language arts.
Q3) Differences in instruction between special education and general education?
The data reveal notable differences between the instruction delivered by special and general education teachers. The differences tend to be in the amount of time devoted to one or another instructional practice, though special education teachers also tend to focus on a narrower portion of the reading and mathematics curriculum, leading in turn to lower alignment or opportunity to learn state standards for students with IEP’s. For mathematics, this narrowing of the mathematics curriculum appears to have a beneficial effect, so long as the narrower scope of content coverage aligns to the state’s extended standards. In language arts and reading, the impact of a narrowed curriculum appears to have neither a beneficial nor detrimental effect on student achievement. As with mathematics though, analyses indicate that opportunity to learn the content emphasized in the state’s extended standards does appear to have a significant and positive impact on SWD reading scores. Similarly, the effects of inclusion on the achievement scores of students with IEP’s appear to have a positive impact in mathematics, but not for language arts and reading achievement.
With regard to opportunity to learn, language arts and reading instructional data reveal the most differences between special and general educators, with nearly every instructional target selected indicating a statistically significant difference between the instructional alignment of general and special education teachers. Moreover, in every case the alignment reported for special education teachers as a group is lower than that reported by the general education teachers in the sample. Nonetheless it would be over simplistic to simply say that special education teaches must improve alignment. Indeed in looking at predictive models focused on students with IEP’s the data suggest that greater alignment to state standards can actually have a negative impact on student achievement, especially in mathematics.

61
Teachers must meet students where they are in terms of learning readiness. Determining what that means instructionally for special education students can be a challenging task. For that reason the data should be taken as a starting point for discussions. Through reflection and conversations with others, using the SEC data to inform those discussions, teachers have the opportunity to examine their practice and find areas where alignment to state standards can be improved (especially alignment to the state’s extended standards, while also attending to the students’ individual learning needs.
Q4) Relationship of instruction students receive to student achievement results? In this study opportunity to learn (as measured by instructional alignment), is treated as a linear relationship, i.e. the working assumption is that as alignment goes up, so too will achievement; and the data for this study tends to support that assumption. The predictive models designed using simple multivariate regression equations reveal a clear and persistent relationship between the opportunity to learn and student achievement. That said, this emerging field of curriculum analytics is still relatively new, and much more can potentially be gleaned from further exploration of the data‐set than these models alone suggest.
Further study may, for example suggest that alignment is better understood as having some type of curvilinear relationship. It may be that at a given point further increases alignment becomes counter‐productive. Indeed if we believe that instruction must provide the teacher some leeway in addressing students’ learning needs, then such a limit seems inevitable. Hints that such a relationship might exist appear in the predictive models presented above. In language arts and reading, alignment to the Common Core Standards has a significant and positive effect on student achievement, while in mathematics it is alignment to the older state academic standards that reveal the significant and positive impact on achievement. Once again, replication of these findings will be important to see; but based on these results, those teachers feeling the bind of transitioning to the Common Core State Standards while being held accountable to state assessments should worry… if they are math teachers. The results for language arts and reading by contrast suggest that teachers might as well proceed apace with the transition to the common core, as it appears to have a positive impact on achievement scores… at least for the general student population.
Can these findings be generalized to mathematics and reading instruction more broadly? Only additional research with measures like these will answer that question. In any case the data‐set collected as part of this study provides a baseline description of both general and special education practices against which future results can be compared in order to track changes in practice and performance over time and among differing cohorts of teachers. More generally the data adds to a growing database of information on classroom practice and content coverage that serves to increase our understanding of curricular practices and students’ opportunities to learn.

62
Appendix A
Project Design and Implementation: 2010‐12
1. Project Design, Instrument develop‐‐new SEC teacher survey items for reporting on teaching Students with Disabilities, Fall 2010 ‐ Feb. 2011
2. Gain state and local cooperation in project‐‐ Orientation sessions held in each state
for local leader teams, March‐April 2011 3. Collect data from teachers through Online surveys, Spring and fall 2011 4. Content specialists analyze standards and assessments for each state, June 2011 5. Professional Development data analysis workshops with local teams in each state, Fall
2011 6. Local districts develop plans and strategies for use of SEC Special ed. data, Winter
2011‐2012 7. Present webinars with experts on Common Core Standards instructional transitions
and use of SEC data to analyze alignment, Spring 2012 8. Develop Online SEC Professional Development guide with modules addressing key
data applications for use of SEC data at the school and teacher levels, Summer‐Fall 2012
9. Cross‐state research and data analysis with data on school programs, instruction and
classroom activities, and student achievement, 2012 10. Report research findings, materials, and models for use of data, including
Dissemination Conference for state and local leaders, October‐ December 2012 11. Extend project tools and data processes for use by other states and school districts.

63
Appendix B
SEC Special Education Project: Data Collection by State 2011
Districts Schools Teachers ELA Math SwSCD
Kansas 3 15 63 72 11
North Carolina 5 16 86 88 23
Ohio 4 19 87 115 10
Note: Additional State‐level data from SEC content analysis of standards and assessments—approx. 30 grade‐level or grade‐band standards and assessments per state. (See State Content Analysis data by state in Project Products)

64
Appendix C
List of Project Products ‐‐ provided electronically on project webpage (see www.SECsurvey.org) and limited print copies.
Project Reports
Summary Report (2012)
Using SEC Special Education Data: Applications for State, Local, Teacher levels (2012)
Content Alignment Analyses by State, Instructional Practices, Teacher and Class Descriptive Data (2012)
Cross‐state Research Results (2012)
Project Design Prospectus (2010)
State Workshop Reports (2011)
Description of SEC Content Analysis of Common Core State Standards (2010)
SEC ELA and Math Surveys for Teachers
Version B Surveys for teachers of Students with Significant Cognitive Disabilities
List of Content Analyses completed for Standards and Assessments in Three States
Presentations Closing the Opportunity Gap for Students with Disabilities: Kansas State Consortium SEC Special Education Project, CCSSO National Conference on Student Assessment, Minneapolis, June 2012.
Closing the Opportunity Gap for Students with Disabilities: State Consortium SEC Special Education Project, 2012 IDEA Leadership Conference, U.S. Department of Education, Washington, DC, August 2012.
Symposium: Research on Standards and Implementation of Common Core State Standards “Analyzing Opportunity to Learn for Students with Disabilities: Kansas EAG State Consortium project on Surveys of Enacted Curriculum and Special Education,” American Educational Research Association, San Francisco, April 2013
State Consortium SEC Special Education Project Preliminary Results Presentation to ASES SCASS State Collaborative, Washington, DC, May 2012.
65
Professional Development Workshop for Local Educators on Use of SEC Special Education Data (Ohio example, 2011)
Orientation to the SEC Special Education Project and Data Collection Procedures for Local Educators (Kansas example, 2011)
Webinars: Transition of Instruction for the Common Core Standards, 5 webinars led by instructional specialists, Spring 2012
Websites for Project
SECsurvey.org / CCSSO SEC Collaborative – Links to SEC Special Education project (KS EAG State Consortium) and project webpage http://www.ccsso.org/Resources/Programs/Surveys_of_Enacted_Curriculum_(SEC).html
SEC Professional Development Online –including all Project Products http://siksolutions.com/ccsso/
SEConline.org / Data collection & reporting http://seconline.wceruw.org/secWebHome.htm
KS EAG Consortium community webpage – Access to all Project Materials, presentations, reports, meetings (by invitation, with username and password) http://spaces.ccsso.org/Home/
Dissemination Conference: Presentations, Materials October 2012, Indianapolis
Introduction and Objectives for Conference
Karen Erickson presentation (ppt plus video clips) Using SEC Analysis and Transition to Common Core
Lisa Campbell presentation (ppt plus video clips) Transition of Instruction in ELA for Students with Disabilities and All Students
Nicole Paulson presentation (ppt plus video clips) Mathematics Instruction and the Common Core Standards
Guiding Questions for Breakout Sessions
Example KS ELA SEC Special Education Data Charts
Example NC ELA SEC Special Education Data Charts
Example Ohio Math SEC Special Education Data Charts
Plan for Implementing and Using SEC Special Education in States and Districts

Appendix
x D SEC Instruuctional Prac
tices Scales
66

67

68

Appendix
x E – Reading the SEC Charrts and Graphhs
69

70

71
References
Blank, R., Smithson, J., Porter, A., Nunnaley, D., & Osthoff, E. (2006) Improving instruction through
school wide professional development: Effects of the data‐on‐enacted‐curriculum model, ERS Spectrum, Spring.
Blank, R., Smithson, J., Deeter, T., (2010) Improving methods of aligning instruction to standards and assessments for English language learners and analyzing the relationship of alignment to student achievement. Final report: Iowa SEC ELL State Consortium Project, Study Conducted under a grant from U.S. Department of Education. CCSSO, Washington, DC.
CCSSO (2010a) Project design prospectus: Develop instrumentation to analyze fidelity of instruction for students with disabilities in relation to standards and assessments and report on opportunity to learn and student achievement. Council of Chief State School Officers, Washington, DC, November 2010.
CCSSO (2010b) Description of SEC Content Analysis of Common Core State Standards and Initial Data Analysis Results, CCSSO SEC State Collaborative, Washington, DC.
Gagnon, J. C., McLaughlin, M. J., Rhim, L. M., & Davis, G. A. (2002). Standards‐driven reform policies at the local level: Report on a survey of local special education directors in large districts. Journal of Special Education Leadership, 15(1), 3‐9.
Kansas State Department of Education (2010) Project proposal: Develop instrumentation to analyze fidelity of instruction for students with disabilities in relation to standards and assessments and report on opportunity to learn and student achievement. Proposal for Enhanced Assessment Grant to U.S. Department of Education, May 2010.
Kurz, A., Elliott, S. N., & Smithson, J. L. (2009). Alignment of the intended, planned, and enacted curriculum in general and special education and its relation to student achievement. Manuscript submitted for publication.
Nolet, V. & McLaughlin, M. J. (2005). Accessing the general curriculum: Including students with disabilities in standards‐based reform (2nd ed.). Thousand Oaks, CA: Corwin Press.
Porter, A. C., Blank, R. K., Smithson, J. L., & Osthoff, E. (2005). Place‐based randomized trials to test the effects on instructional practices of a mathematics/science professional development
program for teachers. The Annals of the American Academy of Political and Social Science, 599(1), 147–175.
Quenemoen, R., Thurlow, M., Moen, R., Thompson, S., & Morse, A. B. (2003). Progress monitoring in an
inclusive standards‐based assessment and accountability system (Synthesis Report 53). Minneapolis, MN: University of Minnesota, National Center on Educational Outcomes.
Roach, A. R., Namisi‐Chilungu, E., LaSalle, T. P., Talapatra, D., Vignieri, M. J., & Kurz, A. (2009). Alternate
assessment based on modified achievement standards: Opportunities and options for facilitating

72
and evaluating access to the general curriculum for students with disabilities. Manuscript submitted for publication.
Smithson, J., & Blank, R. (2006). Indicators of quality of teacher professional development and instructional change using data from surveys of enacted curriculum: Findings from NSF MSP‐RETA project. Washington, DC: Council of Chief State School Officers. Retrieved from http://jsmithson. wceruw.org/reference/indicators_tchrpd_smithson‐blank.pdf
Smithson, J.L. (2009) Coding procedures for curriculum content analysis, WCER, University of
Wisconsin‐Madison. www.SEConline.org