cloud-based system for iot data acquisition daniel filipe
TRANSCRIPT

Universidade de Evora - Escola de Ciencias e Tecnologia
Mestrado em Engenharia Informatica
Dissertacao
Cloud-based system for IoT data acquisition
Daniel Filipe Raimundo Coutinho
Orientador(es) | Jose Saias
Pedro Salgueiro
Vitor Beires Nogueira
Evora 2021


Universidade de Evora - Escola de Ciencias e Tecnologia
Mestrado em Engenharia Informatica
Dissertacao
Cloud-based system for IoT data acquisition
Daniel Filipe Raimundo Coutinho
Orientador(es) | Jose Saias
Pedro Salgueiro
Vitor Beires Nogueira
Evora 2021


I dedicate this to my Parents, my girlfriend and Lee
v


Acknowledgements
Start by thanking my parents, who supported me for all my education, and my girlfriend, Liliana,for being by my side in the last 4 years.
I also want to thank my supervisors, Prof. Pedro Salgueiro, Prof. José Saias e Prof. Vitor Nogueira forthe tremendous amount of patience they had while I was writing the dissertation and while theywere reading it. Without them, this dissertation would have been more challenging to read andunderstand.
vii


Contents
Contents ix
List of Figures xi
List of Tables xiii
List of Acronyms xv
Sumário xvii
Abstract xix
1 Introduction 1
1.1 Motivation . . . . . . . . . . . . . . . . . . . . . . . . . . . . . . . . . . . . . . . . . . . 2
1.2 Structure . . . . . . . . . . . . . . . . . . . . . . . . . . . . . . . . . . . . . . . . . . . . 2
2 The State of Art 3
2.1 Similar systems . . . . . . . . . . . . . . . . . . . . . . . . . . . . . . . . . . . . . . . . 4
2.2 Cloud Computing Model . . . . . . . . . . . . . . . . . . . . . . . . . . . . . . . . . . . 4
2.3 Fog Computing Model . . . . . . . . . . . . . . . . . . . . . . . . . . . . . . . . . . . . . 5
2.4 Edge Communication Protocols . . . . . . . . . . . . . . . . . . . . . . . . . . . . . . . 5
2.5 Communication Protocols Implementation . . . . . . . . . . . . . . . . . . . . . . . . . 7
2.6 Message brokers Implementations . . . . . . . . . . . . . . . . . . . . . . . . . . . . . 9
2.7 Pre-processing . . . . . . . . . . . . . . . . . . . . . . . . . . . . . . . . . . . . . . . . . 10
2.8 Data Storage Implementations . . . . . . . . . . . . . . . . . . . . . . . . . . . . . . . . 11
2.9 Container . . . . . . . . . . . . . . . . . . . . . . . . . . . . . . . . . . . . . . . . . . . . 13
2.10Container Orchestration . . . . . . . . . . . . . . . . . . . . . . . . . . . . . . . . . . . 15
ix

x CONTENTS
3 Proposal 17
3.1 Overview . . . . . . . . . . . . . . . . . . . . . . . . . . . . . . . . . . . . . . . . . . . . 18
3.2 Aggregator Module . . . . . . . . . . . . . . . . . . . . . . . . . . . . . . . . . . . . . . 19
3.3 Message Structure . . . . . . . . . . . . . . . . . . . . . . . . . . . . . . . . . . . . . . 22
3.3.1 Authentication . . . . . . . . . . . . . . . . . . . . . . . . . . . . . . . . . . . . . 25
3.4 Central System . . . . . . . . . . . . . . . . . . . . . . . . . . . . . . . . . . . . . . . . 26
4 Implementation 29
4.1 Connection with External Systems . . . . . . . . . . . . . . . . . . . . . . . . . . . . . . 32
4.2 Confluent Schema Registry . . . . . . . . . . . . . . . . . . . . . . . . . . . . . . . . . . 32
4.3 Kafka Streams . . . . . . . . . . . . . . . . . . . . . . . . . . . . . . . . . . . . . . . . . 33
4.4 ZooKeeper . . . . . . . . . . . . . . . . . . . . . . . . . . . . . . . . . . . . . . . . . . . 34
4.5 Containerization . . . . . . . . . . . . . . . . . . . . . . . . . . . . . . . . . . . . . . . . 34
5 Experimental Evaluation 37
5.1 HTTP protocol testing . . . . . . . . . . . . . . . . . . . . . . . . . . . . . . . . . . . . . 39
5.2 HTTP Tests . . . . . . . . . . . . . . . . . . . . . . . . . . . . . . . . . . . . . . . . . . . 41
5.2.1 HTTP Tests on Single Machine deployment . . . . . . . . . . . . . . . . . . . . . 41
5.2.2 HTTP Tests without Produce API . . . . . . . . . . . . . . . . . . . . . . . . . . . . 43
5.2.3 HTTP Tests with Kafka Distributed . . . . . . . . . . . . . . . . . . . . . . . . . . 44
5.3 MQTT protocol testing . . . . . . . . . . . . . . . . . . . . . . . . . . . . . . . . . . . . . 45
5.3.1 MQTT Tests . . . . . . . . . . . . . . . . . . . . . . . . . . . . . . . . . . . . . . . 47
6 Conclusions and Future Work 51

List of Figures
3.1 Overview of the systems application context . . . . . . . . . . . . . . . . . . . . . . . . 18
3.2 System Architecture Overview, including the sensors . . . . . . . . . . . . . . . . . . . 18
3.3 An example of functional modules interaction . . . . . . . . . . . . . . . . . . . . . . . 19
4.1 Proposed implementation of functional modules in cloud system . . . . . . . . . . . . 29
4.2 Proposed implementation of functional modules in the Aggregator . . . . . . . . . . . 31
5.1 The active threads versus response time graph of HTTP test number 1 . . . . . . . . . 41
5.2 The response time graph of HTTP test number 1 . . . . . . . . . . . . . . . . . . . . . . 41
5.3 The active threads versus response time graph of HTTP test number 2 . . . . . . . . . 42
5.4 The response time graph of HTTP test number 2 . . . . . . . . . . . . . . . . . . . . . . 42
5.5 The active threads versus response time graph of HTTP test number 3 . . . . . . . . . 43
5.6 The response time graph of HTTP test number 3 . . . . . . . . . . . . . . . . . . . . . . 43
5.7 The response time graph of HTTP test number 4. . . . . . . . . . . . . . . . . . . . . . 43
5.8 The active threads versus response time graph of HTTP test number 5. . . . . . . . . . 44
5.9 The response time graph of HTTP test number 5. . . . . . . . . . . . . . . . . . . . . . 44
5.10The response time graph of HTTP test number 6. . . . . . . . . . . . . . . . . . . . . . 45
5.11Response time graph of MQTT test number 1 . . . . . . . . . . . . . . . . . . . . . . . . 48
5.12Response time graph of MQTT test number 2 . . . . . . . . . . . . . . . . . . . . . . . . 49
5.13Response time graph of MQTT test number 3 . . . . . . . . . . . . . . . . . . . . . . . . 49
xi


List of Tables
3.1 HTTP POST request headers meaning. . . . . . . . . . . . . . . . . . . . . . . . . . . . 20
3.2 HTTP POST request headers example. . . . . . . . . . . . . . . . . . . . . . . . . . . . . 20
3.3 The fields of a JSON object "message". . . . . . . . . . . . . . . . . . . . . . . . . . . . 24
3.4 The fields of a JSON object "sensors". . . . . . . . . . . . . . . . . . . . . . . . . . . . . 24
3.5 The fields of a JSON object "data". . . . . . . . . . . . . . . . . . . . . . . . . . . . . . . 24
5.1 Header used HTTP POST request . . . . . . . . . . . . . . . . . . . . . . . . . . . . . . . 39
5.2 MQTT Connect sampler parameters. . . . . . . . . . . . . . . . . . . . . . . . . . . . . 45
5.3 MQTT Pub sampler parameters. . . . . . . . . . . . . . . . . . . . . . . . . . . . . . . . 46
xiii


List of Acronyms
URL Uniform Resource Locator
MQTT Message Queue Telemetry Transport
HTTP Hyper Text Transfer Protocol
CoAP Constrained Application Protocol
IoT Internet of Things
SSL Transport Layer Security
TLS Transport Layer Security
TCP Transmission Control Protocol
UDP User Datagram Protocol
IP Internet Protocol
M2M Machine-to-Machine
QoS Quality of Service
URI Universal Resource Identifier
DTLS Datagram Transport Layer Security
DNS Domain Name System
VM Virtual Machine
AMQP Advanced Message Queueing Protocol
RDD Resilient Distributed Dataset
DAG Directed Acyclic Graph
OS Operative System
WAL Write-ahead logging
API Application Programming Interface
REST Representational State Transfer
JSON JavaScript Object Notation
HMAC Hash-Based Message Authentication
JDBC Java Database Connectivity
xv


Sumário
Sistema cloud-based para aquisição dedados de IoT
IoT permite-nos trazer o mundo físico para o mundo virtual, dando o poder de o controlar e moni-torizar.
Isto tem encorajado um aumento no interesse em IoT, devido às múltiplas aplicações nos maisvariados contextos.
Ainda assim sistemas de IoT enfrentam desafios tais como o suporte de altos volume de conexõesou a baixa capacidade de computação face a algoritmos para segurança dos dados.
O objectivo desta dissertação é criar um sistema de recolha de dados de sensor de qualidade do arque resolva esses desafios usando tecnologias de estado de arte, dando preferência a ferramentasde código aberto.
O sistema foi implementado em volta Apache Kafka, com Spring Boot e VerneMQ responsáveispor receber dados e PostgreSQL, com plugin Timescale, encarregue de os guardar. Um protótipodo sistema foi implementado usando contentores Docker, mas não foi possível organiza-los comKubernetes.
Palavras chave: Internet of Things, Containers, MQTT, HTTP, Sensores, Base de dados de sériestemporais, HMAC, Recolha de dados
xvii


Abstract
Cloud-based system for IoT data acquisition
The purpose of IoT is to bring the physical world into a digital one and allowing it to be controlledand monitored from a virtual standpoint.
The interest in IoT has increased due to its many applications in various fields, but IoT systems stilldeal with challenges such as the support of a high volume of connections or the low processingcapacity of devices faced with data security algorithms.
The objective of this dissertation is to create a data collection for air quality sensors system, thatsolves those challenges based on state of the art technologies, giving preference to open-sourcetools.
Implementation was done around Apache Kafka, with Spring Boot and VerneMQ receiving data,HMAC granting a level security on data transport and PostgreSQL with the plugin Timescale storingthe data. A prototype of the system was implemented in Docker containers, but we were unable toorchestrate them through Kubernetes.
Keywords: Internet of Things, Containers, MQTT, HTTP, Sensors, Time series Database, HMAC,Data Collection
xix


1Introduction
In this chapter, we introduce the context where the work presented in this dissertationwas developed, by explaining the topic of the growing presence of IoT nowadays andwhat were our motivations. In the end, we give an insight into what are the objectivesof this work and how can they be used in the future.
According to the research done by the authors of [13], from the year 2010 onwards, there wasan exponential growth of research in the area of Internet of Things. This is a good index of theincreasing presence of this technology and this can be found across multiple industries. This de-velopment of IoT in the industry had more impact on agriculture, health, and public service. Afrequent situation faced when it comes to IoT systems is the amount of sensors sending data,which can represent a challenge if there is a large number of sensors. Although this is a commonchallenge, there is not a state of the art tool for that effect, and the closest there is to a state ofthe art is the proposal of system architectures[16][2][38].
In this dissertation, we propose a solution to the challenges that are faced in the data collectionfrom air-quality sensors by proposing an efficient architecture with an implementation using stateof the art open-source tools.
1

2 CHAPTER 1. INTRODUCTION
1.1 Motivation
This dissertation was done in the context of the project "NanoSen-AQM: Development and vali-dation on-field of low-cost and low power consumption nano-sensor systems for real-time envi-ronment air-quality monitoring" (SOE2/P1/E0569), funded by the European Regional DevelopmentFund. This project is about the development of low-cost gas nano-sensors, and the deployment ofa distributed and ubiquitous platform for real-time air quality monitoring. In this project, Universityof Évora was responsible for the data reception and storage, from the sensors that would send thedata to the platform. The motivation for this project was to raise air pollution awareness.
The work developed in this dissertation, opens the opportunity for the creation of a tool fit forthe easy deployment of sensor data collection. This tool has the flexibility and potential to beintegrated into any context where there is the deployment of sensors.
1.2 Structure
This dissertation is structured as follows: Chapter 2 is State of the Art, Chapter 3 is the proposal ofthe system, Chapter 4 is the implementation of the system, Chapter 5 is evaluated during devel-opment, and Chapter 6 is the conclusion and future work.
Chapter 2 is presented the paradigms and communication protocols considered for the system.Following the theoretical principles, it is presented a list of potential candidates considered toimplement them.
Chapter 3 proposes an architecture for the data collection system using the paradigms and proto-cols in Chapter 2. We describe the multiple modules of architecture and the components of eachmodule. We also describe the sensor message structure and the authentication method.
In Chapter 4 we describe implementation of the architecture proposed in Chapter 3 with the im-plementations considered in Chapter 2. The considered implementations are explained why theywere chosen over the rest and how they were used.
Chapter 5 describes the experimental evaluation of the system during the development stagesand presents the results of tests that were executed to evaluate the system. We also present stepstaken to optimize bottlenecks found, in both MQTT and HTTP protocol.
Chapter 6 is presented the conclusion reached in this dissertation and future work.

2The State of Art
In this chapter, we present the State of the Art in the relevant domains for the workdescribed in this, including: computing practices, edge communication protocols andfog architecture.
In the following sections, we describe the the principles that were considered to be the state of theart, as well as some more technical aspects, such as used protocols and implementations.
The proposed system comprehends two types of computational methods, cloud computing, andfog computing[52].
Their cooperation allows them to leverage each other by compensating for their shortcomings,such as the fog computing difficulty to deal with big data processing, whereas cloud computingexcels at it[52].
For the choice of communication protocols, we needed protocols that could fit the needs whencommunicating with sensor networks. The protocols had to be lightweight and preferable machine-to-machine (M2M) communication protocols. The most used protocols for IoT are MQTT, CoAP,
3

4 CHAPTER 2. THE STATE OF ART
HTTP. However, HTTP was considered because of its previous popularity in the World Wide Webwhile MQTT and CoAP are because of their efficiency in delivering messages.
After the previous remarks, we will pass on to the considered solutions for each system compo-nent: the data collection and the data storage. The first components are the HTTP and MQTT datacollection modules. For the HTTP the only considered option was Spring Boot Server; meanwhile,for the MQTT data collection, two candidates presented a great potential: EMQ X and VerneMQ.
After the data is collected from the MQTT and HTTP data collection modules, it is then sent toa message broker. Two implementation for the message broker were considered: RabbitMQ andApache Kafka.
However before the data can be inserted into a database, it requires some pre-processing stage.For this end a list of processing applications was compiled: Kafka Streams, Apache Storm, andApache Spark.
The end goal of the data is to be stored into a database. The type of data uploaded by the sensorsis considered to be a time-series data type, making it ideal for time-series databases. These twodatabase were considered: InfluxDB and TimescaleDB.
To facilitate the deployment andmaintenance of the system, the use of containers is a requirement.The state of the art for container runtime implementations is Docker Engine, Rkt, and LXC. Forcontainer orchestration we only considered Kubernetes, because there was no time look for others.
2.1 Similar systems
The growth of IoT has raised issues from a data collection standpoint because of the large numberof devices involved. Several papers have been published discussing several approaches to resolvethose issues.
In the paper by A. Erroutbi, A. E. Hanjri, and A. Sekkaki [16], authors explain IoT-Fog environments,and how the use of Fog Computing does not substitute but complements Cloud Computing sys-tems. The cooperation between these architectures allows them to benefit from the perks of eachother, such as the scalability of Fog Computing or the ability for heavy processing of information ofCloud Computing. The paper also proposes the use of a lightweight authentication protocol usingHMAC, to solve some security threats faced by IoT, in a way that even IoT devices with scarceprocessing resources can handle.
A practical application of what is proposed in this dissertation is the NanoSen-AQM project. TheNanoSen-AQM project objective is the development of a system with low-cost sensors for air-qualitymonitoring. Multiple papers have been published describing the how the system is built: [11] [31][40] [39].
2.2 Cloud Computing Model
Before cloud computing[52], each organization had its servers on-premise and they were in chargeof the maintenance costs, which could range from electric bills to replacement of hardware onthe server. The on-premise server required a lot of work and was not cost-effective. The cloud

2.3. FOG COMPUTING MODEL 5
computing paradigm would make the necessary computing a cost-effective resource.
Cloud computing favors centralized computing when compared to fog, and data storing on a clusterof large-sized data centers. This allows companies to deliver Infrastructure as a service, platformas a service, or software as a service[52]. These services can provide their users with computingresources according to their needs, on-demand, meaning that users can upgrade their resourceson-demand, without having to worry about the actual maintenance of the bare-metal machine. Thisallows cutting costs on the common alternative of owning on-premise, such as server maintenance,energy consumption, and server upgrading.
2.3 Fog Computing Model
In recent years, with the mainstreaming of paradigms like the Internet of Things, it is expected anincrease of connected devices to the Internet[52][13]. Most of these devices are going to mobileor monitoring devices, in other words, they will be located at the edge of networks. With too manyconnections, using traditional cloud computing frameworks/systems becomes challenging, causedby the difficulty to handle the high volume and velocity of data accumulation of IoT devices orlatency due to the distance between cloud servers and IoT devices.
Fog computing[52] aim is to provide data processing, storage and other services for end-users,through the dense geographical distribution and proximity. Fog computing does not substitutecloud computing, it works as an extension of the cloud, allowing to unburden the cloud of smalltasks and only resource-demanding tasks need to be taken care of by the cloud. This implies thedeployment and distribution of services through multiple data centers with a location closer to theend-user, combining with the shifting of computing and storage closer to the edge. These practicescan lead to the reduction of data movement across a network, network congestion, end-to-endlatency, and bottleneck, while also achieving security improvement because the data traffic is alot shorter compared to cloud computing, therefore, making it less likely for data to be interceptedon the route.
2.4 Edge Communication Protocols
The communication between the cloud systems and sensor networks systems has been the targetof a lot of studies[29][33][14], which can be attributed to the expansion of the Internet of Things.Even though the development has been steadily increasing, there are still challenges that sensorsface that can raise security and privacy issues, like the fact of the low processing capacity ofmost sensors cannot ensure a fully secure and private data transfer through processes like SSL orTLS. The sensor communication protocols have the requirements of being lightweight messagesand machine-to-machine protocols because the communication has to be as efficient as possible.The considered options that fulfilled the required needs were MQTT and CoAP. On the other hand,HTTP qualifies to be considered because of its popularity, which grants multiple implementationsacross devices as well as easier usability. This topic is further explored in [34], where a thoroughcomparison of popular messaging protocols in IoT systems like MQTT, CoAP, and HTTP is presented.
MQTT[37] is a M2M communication protocol, developed by Andy Stanford-Clark, from IBM, andArlen Nipper, from Arcom Control Systems Ltd (Eurotech). It was first introduced in 1999, like a

6 CHAPTER 2. THE STATE OF ART
publish/subscribe messaging protocol featuring lightweight M2M communication with easy adap-tation to constrained networks. The basic concept of MQTT is the same as publish/subscribe proto-cols. First, a client publishes a message on a topic inside a MQTT broker. In the meanwhile, someother client has subscribed the same topic to receive the associated message. The topics consistsof a path to where a message can be published. MQTT is a binary protocol that uses TCP/IP fortransport protocol and can use TLS/SSL for security. The message structure consists of 2 bytes fora fixed header and payloads of maximum size 256 MB[36]. The communication between agentsis connection-oriented, also enabling to set three levels of QoS for the message delivery: level 1sending messages at most once, level 2 at least once, and level 3 exactly once. MQTT is frequentlyused for the monitoring and management of networks of small devices, from a back-end server.
CoAP[3] is another lightweight M2M binary protocol just like MQTT, produced by the IETF CoRE(Constrained RESTful Environments) Working Group. CoAP supports a variant of publish/subscribearchitecture resource/observe and request/response. CoAP is developed to act use HTTP and REST-ful Web services. CoAP uses URI for message location, just like MQTT uses topics. A client publishesdata to a specific URI and at the same time, another client subscribes to the same URI, to accessthe data. When data is published to a URI, all the clients that subscribed to that URI receives anotification about new data. The messages are transported through UDP protocol and use DTLSfor security, having a structure that usually requires a fixed header of 4-bytes with small payloadswhere the maximum is dependent on the implementation. The use of UDP protocol means that thecommunication between the client and the server is connectionless with less reliability. RegardingQoS, it provides two levels, confirmable where the messages are acknowledged by the receiverwith an ACK packet, and non-confirmable which simply sends the message once.
HTTP[17] is a messaging protocol, first developed by Tim Berners-Lee and later by IETF and W3Cand published as a standard protocol in 1997. Since HTTP was developed to meet the requirementsof the World Wide Web, it uses a request/response that is used by RESTful Web architecture, as wellthe URI for resources path. A server has a URI that is prepared to receive requests, and accordingto the request, the server reacts depending on what was implemented. In this case, the reactionwould be to verify the data integrity and send it to the message broker, and after that, sendinga HTTP response confirming the message was received or that it failed. HTTP is a text-basedprotocol and it doesn’t have a fixed size of headers and message payloads also depend on theimplementation. For the default transport protocol, HTTP uses TCP/IP and TLS/SSL for security,and just like MQTT the server/client communication is connection-oriented. Unlike other protocols,HTTP does not have any QoS defined, so it requires more work to be able to guarantee any QoS. Onthe account of being such a popular web messaging standard, it has added features like persistentconnections, requests pipelining and chunked transfer encoding.
CoAP has the lowest message size and overhead, compared to MQTT and HTTP because of its useof TCP for transport protocol, meaning they suffer from the connection closing and establishmentoverheads.
However, MQTT is lightweight and has the least header size of 2-byte per message but its require-ment of TCP connection increases the overall overhead, and thus the whole message size.

2.5. COMMUNICATION PROTOCOLS IMPLEMENTATION 7
2.5 Communication Protocols Implementation
In this section, we will review several options for data reception, including the HTTP and MQTTprotocols, and why they were chosen. For the HTTP protocol, two approaches were considered: 1)Kafka REST, which is a proxy that provides a RESTful interface to consume and produce messagesfrom the Kafka broker and 2) the development of a RESTful Interface, using Spring Boot with KafkaProducer API. In the second approach, Spring Boot would receive the data from the HTTP requestmeanwhile the Producer API sends the received data to the Kafka broker.
In the case of MQTT protocol, from the several implementations of MQTT, the most prominent oneswere VerneMQ and EMQ X. Both these options contain basic MQTT broker features and are build ontop of the Erlang/OTP platform and also include clustering features.
HTTP Implementation
Spring Boot works over Spring Framework[43], being an easy way to develop Web applicationproduction-ready, making easy the development of a REST interface to receive the sensors data,and working together with Apache Kafka library Producer API[24] which allows the publishing ofmessages into Kafka topics.
The Spring Boot application receives an HTTP POST request with sensor data in the body togetherwith the the hash of the sensor data in the "Authentication" header.
After the HTTP request is received, the application first verifies the integrity of the message, there-after verifies the data structure, only then if passed through that verification the data is publishedinto a Kafka broker. In case of failure in the verification, a debugging response is sent back to thesensor.
The load balancing of the data collection needs to be done in two steps: 1) first, we need to loadbalance the data received by Spring Boot server; and 2) then, second step, we need load balancethe Kafka broker.Spring Boot can load balance across multiple instances, in the meanwhile theload balancing of the Producer API library is done through the configuration of an available Kafkacluster, by dividing the Kafka topics into multiple partitions.
A possible approach for receiving the sensors data from the HTTP protocol was the Kafka REST[6],a REST interface that serves as a proxy to Apache Kafka by HTTP request and interacts with Kafkabroker. Although it is an easy method of producing messages for Kafka broker through HTTP, whileallowing the deployment with multiple instances working together, by spreading the load accordingto a chosen algorithm(such as round-robin DNS, discovery services, load balancer).
There is a problem with this approach: to add the required authentication method, we had to re-write the open-source code. Although more recent versions have been added a plugin that facilitiesthe authentication process[8].
MQTT Implementation
For the support of the MQTT protocol, we used VerneMQ[51], an open-source implementation ofthe OASIS industry-standard MQTT protocol with Erlang/OTP. Proving features that cover the needs

8 CHAPTER 2. THE STATE OF ART
for IoT and messaging applications, such as scalability, [49], reliability and high-performance aswell as fast deployment.
It uses master-less clustering technology giving it the ability to withstand node failure and to guar-antee a continuous working cluster. VerneMQ also ensures the three levels of Qos.
VerneMQ is implemented in Erlang/OTP, giving it space for the development and deployment ofplugins on an Erlang/VM. The plugins can be developed with Erlang/VM compatible languages,such as Erlang and Elixir.
An important feature of VerneMQ is that it allows the development of new plugins to expand itscapabilities. Each plugin is associated with a hook. A hook is what defines when the plugins shouldbe triggered or what can affect data. In a plugin development guide[50], we can see how hookscan be divided into three categories:
• Hooks that allow the change of protocol flow, for example, authentication of client whenregistering;
• Hooks that are triggered by an event, this is frequently used to do custom logging;
• Hooks triggered by a conditional event;
For message authentication, we created a plugin with hook that allows for the change of protocol,to be more precise the hook "auth_on_publish", which is triggered before a message is publishedso it can be authorized.
The data flow would authenticate the message when it is published, which means that whenevera message is published, the plugin would verify the message according to the implementation ofthe plugin, and publish it if valid.
EMQ X Broker is another open-source MQTT message broker based on the Erlang/OTP platform.
Among the features of EMQ X, there is the support QoS0, QoS1, QoS2 message service, and thedeployment of nodes across multiple servers[46]. At the time of writing of this document, the EMQhas been renamed to EMQ X and has been added many more features.
In the open-source version of EMQ X, there are features like the support of cluster discovery in-cluding:
• Manual - where the cluster is created manually
• Static - Autocluster of static node lists
• mcast - Autocluster of UDP multicast mode
• dns - Autocluster DNS A record
• etcd - Autocluster by etcd
• k8s - Autocluster of Kubernetes service

2.6. MESSAGE BROKERS IMPLEMENTATIONS 9
EMQ X includes the concept of shared subscription [48], which is a subscription method that allowsload balancing across multiple subscribers.
Just like Kafka architecture, EMQ X also allows to configure nodes by partitions, meaning a sin-gle topic can be broken into partitions and distributed across a cluster, giving the possibility ofdistributing connections load across a cluster.
EMQ X Broker Rule Engine[47] is used to control message flow, device event processing, and re-sponse rules, through flexible configuration. The rule engine can be triggered by either a publishingmessage or a defined trigger event. Once a rule meets the conditions to be triggered, the engineexecutes a set of SQL statements to filter and process the message and events.
Some examples of new features that could have been useful would be the Kafka Bridge, whichconsists of a bridge that forwards the messages to a Kafka broker or schema registry. This wouldallow to encode and decode the sensor messages.
Although EMQ X had an overall better development than VerneMQ, most of its features are onlyavailable in a paid version called EMQ X Enterprise.
2.6 Message brokers Implementations
Data ingestion is expected to be high, as each sensor can produce multiple data points per second.A traditional system could be overwhelmed, which could lead to loss of data but also the qualityof service. That is where the need for a data ingestion module comes. To be more precise, amessaging system that can hold data until the next module is ready to receive it.
Apache Kafka is a distributed streaming platform for data ingestion. It serves as a messagingsystem that allows for the publishing and subscribing into distributed queues. The architecture ofApache Kafka is developed in Java and Scala, based on publish/subscribe queues, named topics andthe data itself, which is called records. What makes Apache Kafka so special, in relation to othermessaging systems, is the fact that all data received is written directly into the hard disk[23]. Thiskind of operation makes the data persistent and less susceptible to losses. This means that if thereis failure in the broker, once restarted, the data would still be there. Despite I/O operations beingconsiderably slower in comparison to operations with memory, according to Apache Kafka, it canrise to challenge.
The Producers are the clients that publishes the records into topics. On the other hand, there arethe clients that subscribe to these topics, called Consumers, which can be put into consumers-group, allowing load-balancing of the consumers. The topics have the opportunity to be allocatedinto different parts of the cluster. This permits to have load-balancing between the cluster nodes,while the topics replication allows for fault-tolerance. Since Kafka does not have a master node onthe cluster and can have topic replication is possible for it to have high-availability.
RabitMQ is a message broker middleware, that follows AMQP 0-9-1 implemented in Erlang/OTP.Unlike Apache Kafka, most operations are performed at the memory level. By default, it only usesthe disk when the memory can not handle the operations. The data flow consists of data sent byproducers and received by the RabbitMQ brokers, through an exchange. An exchange is a logicalentry point that makes the decision to which queue the data is sent. The data is queued randomlyand then pushed to the consumers, as opposed to Kafka where the consumers are the ones that

10 CHAPTER 2. THE STATE OF ART
ask for the data. Since there is not an order in which the data arrives in the queues, there is noneed to save any data for queue states, but this also makes it impossible to get specific data onthe queues. The consumers are always connected to the brokers, which means that at any timea broker knows what consumers are connected and what queue they are connected to. Althoughthis protocol steals the freedom of the consumer, it compensates with the reliability to which thedata is delivered, meaning that the data is only removed from the broker’s memory after receivingacknowledgment from the consumer. A useful tool within the RabbitMQ architecture is the abilityto create queues and exchanges on the fly. This allows the producer to create queues as needed,which is useful for the agile deployment of data flows.
2.7 Pre-processing
In data collection systems, it is common to have some form of pre-processing before sending datato the central system, to prevent it from being overloaded. This type of processing consists ofsimple tasks, that can range from message transformation to validation. Apache Kafka includes aclient library for building applications and microservices, called Kafka Streams. It takes advantageof writing and deploying Java or Scala applications on the client-side and using Kafka broker as inputand output for the applications, leveraging the benefits of Kafka server-side cluster technology.The deployment of these applications can be done through containers, VM’s, bare-metal, or cloud,giving the applications the chance of being elastic, highly scalable, and fault-tolerant. This libraryhas proven itself in production trough some companies like The New York Times, LINE, Pinterest,and Trivago[26].
Apache Storm is a distributed stream processing computation framework, written in Java and Clo-jure. The project was initially developed at BackType, but later when it was acquired by Twitterwas made open-source. The development of Storm applications revolves around directed acyclicgraphs. The vertices of these graphs are called bolts and spouts. The spouts are the source thedata streams, while the bolts can receive multiple data streams, apply necessary processing, andif needed create new streams. The topologies having this structure act as a data transformationspipeline, that allows real-time data processing and run indefinitely until the process is killed, asopposing to individual batches use by MapReduce architectures. These topologies are to be run inparallel and across a cluster of machines, making it highly scalable[45]. The Apache Storm deploy-ment architecture consists of two types of nodes: Master Nodes and Worker Nodes. The masternode runs a Nimbus process, that assigns tasks to a machine and monitors their performances.While the worker nodes run a process called Supervisor, that assigns tasks among the worker’snodes and operates them according to the system needs. For the monitoring of the state andhealth of the cluster, Storm relies on Zookeeper for the discovery of Nimbus and the Supervisors.Giving it a fault tolerance[44], meaning that when workers die, Apache Storm will automaticallyrestart them. If a node dies, the worker will be restarted on another node.
Apache Spark[42] is a distributed general-purpose cluster-computing framework, first developed atthe University of California, Berkeley’s AMPLab, and later its codebase was donated to the ApacheSoftware Foundation, making it an open-source software. Apache Spark has a layered architec-ture, with several components in its eco-system. The development of components, such as SparkStreaming or MLlib, gives it the ability to be a useful tool across many fields, like data streamingand machine learning. All components depend on Spark Core, as it is the base engine in chargeof distributed task dispatching, scheduling, and basic I/O functionalities. The deployment of Spark

2.8. DATA STORAGE IMPLEMENTATIONS 11
applications is based on RDD and DAG. RDDs are abstract data of distributed collection, which isimmutable and follows lazy transformations. Its immutable nature means once the RDD is createdthe state can’t be changed, but can be transformed, meaning that in case of failure the data canbe reconstructed. RDDs in distributed environments are divided into logical partitions. This featuregives a transparent way of performing transformations or actions, in parallel inside a cluster. Thecomponent library Spark Streaming is used to process real-time streaming processing. It achievesthe stream processing through the ingestion of mini-batches and applies RDD transformations.On the upside, this facilitates the translation between application code for batch analytics andstreaming analytics. The design raises a problem, the fact that it is not real streaming, meaningthe latency is going to be the same as the duration of the mini-batch. It reserves the possibilityto be fault-tolerant out of the box, meaning it can recover both lost work and the operator statein case of failure. It is also prepared to read data from HDFS, Flume, ZeroMQ, and Kafka, whilemaintaining high availability through the use of ZooKeeper and HDFS.
2.8 Data Storage Implementations
In this section, we will describe the data storage implementation that were taken into account,according to the thesis of M. Martinviita [32] and why they were chosen.
Data Storage, because of the nature of the stored, the data can be divided into two types: time-series and static. The raw data originated from the sensors can be categorized as time-series datatype. For this data type, time-series databases should be used. Under the time-series databasestwo implementations stand out: 1) TimescaleDB an extension of PostgreSQL, which is closer torelational databases; and 2) InfluxDB which is closer to NoSQL. Meanwhile the static data from thesensor is more indicated for use in relational databases, we decided to use PostgreSQL.
InfluxDB is a time-series database that is partially open-source. In a spectrum of SQL and NoSQLdatabases, its data treatment would fall closer to NoSQL, unlike TimescaleDB that falls closer toSQL. InfluxDB can be found free under the open-source product collection TICK Stack, with an MITlicense. TICK Stack is a single-node machine system and is a collection of open-source projectscreated to handle vast amounts of time-stamped data to perform metrics analysis. InfluxDB En-terprise is a paid version of InfluxDB, where features like clustering are available, and since thatfeature is reserved in the paid version, other features such as high-availability and scalability arealso be inaccessible in open-source versions. Thus, in most systems, this could represent a prob-lem, making it more of a learning tool than a production-ready product.
The deployment of InfluxDB can be done in Linux, OS X, and Docker. Meanwhile, hardware wise,it faces a soft limitation on the type of disk it operates on. InfluxDB was developed to operate onsolid-state disks, meanwhile, other types of hard drives can be used with it but it is not recom-mended to be used in production because it will not perform to its best capabilities.
InfluxDB can support clustering in general through meta nodes, that have the cluster managementdata and data location information, working together with data nodes that store the actual data.The distribution of the data across a cluster is done through the distribution and replication of databy shard files, which are a set of data divided by time intervals. InfluxDB uses retention policies tocontrol the scaling of data stored in the database. The retention policies are a set of rules to definewhen data can be compressed or deleted, based on heuristics such as time. A single databasesupports multiple retention policies working concurrently.

12 CHAPTER 2. THE STATE OF ART
The security aspect of the open-source version is limited to authentication and authorization anddatabase level read and write permissions. While in the enterprise version it adds features thatallow for the measurement, series, and tags, while at cluster levels have 16 levels of permissions,such as managing nodes, databases, users, and cluster monitoring.
InfluxDB was developed to give support to all time-series, in case of data being inserted without atimestamp, one is appointed according to the server’s locale nanosecond UTC timestamp. To makeefficient storage management, the database engine resorts to data timestamps to manage andlocate data.
Like in most database engines, InfluxDB supports data types such as strings, floats, integers, andbooleans. Given the database nature being that of time-series, there are built-in functions thatallow doing basic data aggregation, perform a query with sampling and filling, and data predictionwith the Holt-Winters method[5]. Furthermore, the complex functions can be developed usingthe basic built-in functions. Among the built-in features, there are continuous queries that allowautomatic operations on the data. Examples of such operations are the automatic aggregationcalculations or outliers detection.
For the development and management of alarms, events, and data processing, the TICK Stackenvironment provides the component Kapacitator.
The communication with the database engine can be done through HTTP, being the main commu-nication protocol used to write and read, and UDP because of its unconnected nature is not advisedto use for data writing.
InfluxDB comes included in TICK Stack, meaning it supports interaction with Telegraf, Chronograf,and Kapacitator, but also can interact with other software like CollectD, Graphite, OpenTSBD, andPrometheus.
TimescaleDB is a fully open-source time-series database built on top of the PostgreSQL database.TimescaleDB as a PostgreSQL expansion is under Apache 2.0 license, meanwhile, PostgreSQL hasits license called PostgreSQL license. The deployment of TimescaleDB can be done across differentplatforms such as Windows, Linux, and Docker. Adding to the base version there is the TimescaleEnterprise edition, which provides deployment support and management of the PostgreSQL sys-tem.
TimescaleDB allows for replication, through the use of a primary node that is mirrored across thenodes in a cluster. In case of a node failure, another node in the cluster can easily replace it, givingthe database a high availability status. The replication is done through the streaming of a WAL fileto all the nodes in the cluster. Above that, it also allows for horizontal scaling, by creating a replicanode that is in charge of reading queries. TimescaleDB supports features like backups and func-tionality restoring, as well as security support from PostgreSQL. By allowing user authenticationand access control at various levels, such as database, table, column, row-level permissions, alongwith this comes the creation of roles and user groups to distribute those permissions. An advantageof TimescaleDB is most features that made PostgreSQL a relevant database, can be also used withTimescaleDB, so, if there is previous knowledge of the user with PostgreSQL, he easily translatesthat knowledge to TimescaleDB. When using any tool, the user needs to count on the developersfor regular updates, for bug fixes or adding features, and support from an active community anddeveloping team. In this front, PostgreSQL has maintained a fully open-source life cycle for thepast 24 years, with regular updating and an active community, which made PostgreSQL among

2.9. CONTAINER 13
the most popular database used in the world. Compared to PostgreSQL, Timescale is very young interms of development, but the development of PostgresSQL can create the expectations towardsthe development of Timescale, and since PostgreSQL is the backbone of Timescale, every updateto PostgreSQL also improves Timescale.
TimescaleDB gives PostgresSQL the ability to support time-series data, while still leveraging theadvantages that have been collected by the years of development of PostgreSQL. Timescale canconvert a pure relational database into a time-series database by implementing a wide-columndata model, that places all data points with the same time-series point sharing that same time-series point, instead of each data point having its time-series point. The data is organized bychunks, which are time partitioned individual tables, that have the smallest supported time unit asa microsecond. These chunks, being integrated into a larger table called hypertable, which indexesthose chunks by time.
TimescaleDB can support SQL and it also supports the same APIs that are supported by Post-greSQL, such as OBDC, JDBC, ADO.NET, and REST API. Even though it is based on a relationaldatabase model, the TimescaleDB supports both SQL function, as well as functions time-seriesdriven like bucketing, first and last values, histogram, and data filling.
The active community around PostgreSQL, not only gives the active support of the community butas well as access to community plugins. This allows access to solutions created by the communityand granting a wider range of solutions that can be provided with, but because these solutions arefrom the community there is risk associated with that, like underperformance or detrimental.
2.9 Container
The traditional way of deploying multiple applications would be in a single infrastructure with asingle operating system for all the applications. This raised problems on the resource allocationbetween the applications and the management of applications dependencies, translating to someapplications using most of the resources and making the rest of the applications underperform orthe arduous task of solving conflicting dependencies for different applications.
To compensate for the raised issues with traditional deployment, the deployment of applicationsthrough virtual machines started to be a common practice. Each application would be deployed ona virtual machine, while all virtual machines would be deployed on a hypervisor and the hypervisorwould sit on top of the operating system on infrastructure. The hypervisor allowed to managethe resources that would be available to each virtual machine. This also brings better isolationbetween applications, promoting higher levels of security in a machine. The only problem withvirtual machine usage is that for each one we need an operating system, and this results in theredundancy of processes, making the deployment of a single application have a great increase indeployment overhead.
Later containerization came on, at some levels working the same way as a virtual machine, exceptthere is less isolation between applications since all containers are going to share the same oper-ating system. Since it can carry its own file-system, CPU, memory, process space, and more, theycan be decoupled from the underlying infrastructure. Yet what makes containers such an attractivechoice for application deployment, are not the container themselves but are orchestration systemsthat manage them, because of the flexibility and easiness of the deployment.

14 CHAPTER 2. THE STATE OF ART
Container images are the mount point used to start a container. Generally, container images arefiles stored in Registry Servers, that are pulled, when it is wanted to start a container. Containerimage files have different formats across implementations, but recently multiple leaders in thecontainer industry have created the Open Container Initiative, shortened OCI. OCI[21] proposesthe definitions of a Runtime Specification and an Image Specification. According to the initiativeRuntime Specification layouts how to run a filesystem bundle that is unpacked on disk, while ImageSpecification is how to create an image, by creating a format that supports for a container to belaunched from UX design that has been expected from container engines. For the deployment ofcontainers, we need to pull the image of the container from the Registry Server and then unpack itinto a Runtime. The Container Engines manage user input, image pulling, deployment of containersin runtime, and as well handling input over an API from a container orchestrator. Starting withDocker popularity and then the OCI, the container has become an easy option to use in a cloudservice, such as PaaS and SaaS [19].
Docker engine is a container runtime that can run on Linux or Windows servers operating systems.It offers simple tools for the packaging of applications with their dependencies and that can bedeployed on the Docker Engine. Docker Engine had been broken down into smaller modules, con-tainerd[12] and runC[20]. This was done to make Docker Ecosystem easier to maintain as well asto make these components open-source. Containerd was developed on top of runC, to manage thelocal containers system through known input API. It provides advanced features like a checkpoint, arestore, seccomp, and user namespace support. RunC is a lightweight, portable container runtimethat has functions to interact with the features of the operating system related to the containers.RunC was later donated to the OCI, to serve as an example of open industry standards aroundcontainer formats and runtime.
Rkt[9] is an open-source security-oriented application container engine developed by Red Hat. Itsmost relevant features are customizable isolation and built-in pods as an atomic unit in rkt. Rktcreates levels of isolation through the setting of "stage1 flavor", ranging from: fly, a simple chrootenvironment where there are light security measures, meaning it doesn’t have a network, CPU,and memory isolation; systemd/nspawn, a cgroup/namespace based isolation environment usingsystemd, and systemd-nspawn; kvm, consist in the deployment of a container with a lightweightvirtual machine with just the Linux kernel, which is the most isolate level achieve with Rkt. TheRkt pods are deployable and executable units, that allow for the deployment of groups of one ormore app images sharing resources. In essence, they are going to share a common kernel space.The deployment of images in pods can include metadata that allow features such as resourceconstraining at a pod level or a container level. The pods in Rkt work the same concepts as thepods defined in Kubernetes architecture.
LXC[30] is a popular low-level Linux container runtime. In the first releases of Docker Engine, itwas used as its main container runtime until they created their own, runC. This container runtime’smain focus is the deliverance of containers with as much isolation as a virtual machine can havebut without the overheads that come from it. LXC does this by creating an interface to interactwith Linux kernel features such as ipc, uts, mount, pid, network, and user namespaces, whichallows creating namespaces that isolate components from different namespaces, and Cgroups forresources management, such as limiting the CPU usage.

2.10. CONTAINER ORCHESTRATION 15
2.10 Container Orchestration
The state of the art when it comes to container orchestration systems considered for this disserta-tion is Kubernetes[28]. Kubernetes was first developed by Google to be used inside the companyand after 15 years of maturing inside, it was released as an open-source system. The deploymentof Kubernetes is done through a cluster with at least one master node and several worker nodes.The master node is in charge of scheduling and deployment of application instances across thecluster. This communication is established through the Kubernetes API server. On all nodes, thereis a process called kubelet, that receives information from the Kubernetes API server for managingthe state of the node that is on. Pods are the most basic scheduling unit, which can handle oneor more containers and assures that these containers are deployed in the same machine, so theycan share resources. Each pod has its unique IP address inside a cluster, for more flexible use ofnetwork ports.


3Proposal
In this chapter, we propose the modules that are the constituents of the architecture,which will have three main stages:
• The Sensor stage: the data source;
• The Aggregators stage: management of sensors connections and data processing;
• The Central System stage: data insertion into database.
17

18 CHAPTER 3. PROPOSAL
3.1 Overview
Figure 3.1: Overview of the systems application context
The proposed system aims to collect data from the sensors and store it in a database. Figure3.1 gives an outlook of the system, and it shows the elements that interact with it. The Figureshows the system taking as input air quality sensors and making the data available to the end-userthrough the web. Moreover, it also provides sensors management throughout a mobile applicationor a web application.
Figure 3.2: System Architecture Overview, including the sensors

3.2. AGGREGATOR MODULE 19
The architecture of the proposed system can be divided into the Central System, the Aggregatormodules, and the Sensor modules, just like it can be observed in Figure 3.2. The Central Systemhas the role of storage and major processing tasks. The Aggregator modules are a collection ofmodules working concurrently, in charge of receiving the data from the sensors, validate the data,and do the necessary pre-processing to be inserted into a database. The Sensors are in chargeof reading the data and send it to the Aggregator modules. The development of this system wasmore focused on the Aggregator stage and less on the Central System.
Figure 3.3: An example of functional modules interaction
Figure 3.3 presents the inner workings of the Central System and the Aggregator module, and howthey interact.
In the following sections, we explain the modules and the roles of the components inside them,starting with the brief introduction Sensors in Aggregators Section and ending in the Data StorageModule in Central System.
3.2 Aggregator Module
In the following paragraphs, we will explain the Aggregator Section presented in Figure 3.3 bydescribing the path traversed by the message.
The Sensor modules can be more accurately described as being sensor stations, meaning eachSensor module can have a heterogeneous collection of sensors. The sensor modules are registeredin the Central System, so thereafter when data is collected it is formatted according to the systemconfiguration for that sensor (see Section 3.3 for the corresponding message structure).
Once the message is received by Data Reception Module, the REST Authentication interface is

20 CHAPTER 3. PROPOSAL
called to give the necessary information to authenticate the message. After the message is ap-proved, it is sent from the Data Reception Module to the Message Broker, so it can be consumedby the Database connector when possible.
The reason for the Aggregator module is a collection over a single Aggregator, comes from theneed of having data collection with high-availability. The unavailability of the Aggregator, impliesrelying on the Sensor modules to store the data until the message can be received. This raises aproblem because the sensor stations are expected to have low computation resources, meaning iftoo much data is accumulated, we can end up in data loss situation.
The Data Reception module can be further divided into the HTTP module and the MQTT module.They will be in charge of message authentication from their respective communication protocols.
All messages sent to the server are processed, authenticated, and if it is accepted they are sent tothe message broker.
The HTTP module is prepared to receive HTTP POST requests, with the data from the sensors insidethe request body in JSON format (see Section 3.3 for the corresponding message structure) and theauthentication Hash is stored in a header. The Table 3.1 refers to the necessary headers, that haveto be present in HTTP POST request so it can be accepted, and also explains what each headerrepresents.
Table 3.1: HTTP POST request headers meaning.Header Name Value
Content-Type application/JSONHost host:portAccept client user agent
Content-Length length of upload messageAuthentication signature of sensor data JSON object
The Content-Length header value should be the size of the uploaded message. If this value isincorrect or the header is not included in the request, the data will be discarded and a debuggingresponse will be given back.
An example of a potential HTTP POST request sent by a sensor station using an Arduino device, bypresenting an example of the headers, in Table 3.2, followed by the respective request body, in theListing 3.1.
Table 3.2: HTTP POST request headers example.Header Name Value
Content-Type application/JSONHost 129.137.120.78:8080Accept Arduino/1.0
Content-Length 212Authentication c213182e462b51c147269b8c99b67545

3.2. AGGREGATOR MODULE 21
Listing 3.1: Example of an HTTP POST request body.
1 {2 "message": {3 "device_id": 123456789,4 "message_date": "2019-07-10T13:46:59+00:00",5 "latitude": "-38.5714",6 "longitude": "-7.9135",7 "sensors": [8 {9 "sensor_id": 123456781,
10 "data": [11 {12 "date": "2019-07-10T13:46:59+00:00",13 "value": "24.90"14 }15 ]16 }17 ]18 }19 }
Regarding the MQTT protocol, it simply sends a JSON formatted message with both the data fromthe sensor station as well as the authentication Hash. In order to send messages through the MQTTprotocol, first, a topic needs to be defined so the data can be stored, as well a JSON schema thatsupports both data from the sensor station and the authentication Hash. Below we provide anexample of this type of message, in the Listing 3.2.
Listing 3.2: Example of an MQTT published message.
1 {2 "message": {3 "device_id": 123456789,4 "message_date": "2019-07-10T13:46:59+00:00",5 "latitude": "-38.5714",6 "longitude": "-7.9135",7 "sensors": [8 {9 "sensor_id": 123456781,
10 "data": [11 {12 "date": "2019-07-10T13:46:59+00:00",13 "value": "24.90"14 }15 ]16 }17 ]18 },19 "authentication": "c213182e462b51c147269b8c99b67545"

22 CHAPTER 3. PROPOSAL
20 }
The message field is the data sent from the sensor station, and it is further explored in the Section3.3, meanwhile, the authentication field has the hash that is used to authenticate the message,being detailed in the Section 3.3.1. The system should ensure that only messages sent from au-thorized sensors are accepted, discarding any message from unauthorized clients.
3.3 Message Structure
The message needed a well defined structure but it had to be flexible so it could be used by anykind of sensor station. The definition of a schema would set a message a structure while allowingdata serialization when storing data in Apache Kafka with Schema Registry. Thinking of that, wedesigned an Avro Schema in the Listing 3.3.
Listing 3.3: Avro schema shows the structure of the message.
1 {2 "type": "record",3 "name": "message",4 "fields": [5 {6 "name": "device_id",7 "type": "string"8 },9 {
10 "name": "message_date",11 "type": "string"12 },13 {14 "name": "latitude",15 "type": "string"16 },17 {18 "name": "longitude",19 "type": "string"20 },21 {22 "name": "sensors",23 "type": [24 "null",25 {26 "type": "array",27 "items": {28 "type": "record",29 "name": "sensors",30 "fields": [31 {

3.3. MESSAGE STRUCTURE 23
32 "name": "sensor_id",33 "type": "string"34 },35 {36 "name": "data",37 "type": [38 "null",39 {40 "type": "array",41 "items": {42 "type": "record",43 "name": "data",44 "fields": [45 {46 "name": "date",47 "type": "string"48 },49 {50 "name": "value",51 "type": "string"52 }53 ],54 "connect.name": "data"55 }56 }57 ],58 "default": null59 }60 ],61 "connect.name": "sensors"62 }63 }64 ],65 "default": null66 }67 ]68 }
The example in the Listing 3.3 is an Avro Schema used by Schema Registry to define a structureto the messages that can be accepted into the message broker. Tables 3.3, 3.4, and 3.5 are anexplanation of the organization of the message fields and their meaning.
The "message" field is a JSON object with the fields referring to those that are associated with thegeneral information of the sensor station, such as the identification code of the sensor station thedata originated from or the coordinates giving the sensor station location. Table 3.3 describes allthe object fields what their contents.

24 CHAPTER 3. PROPOSAL
Table 3.3: The fields of a JSON object "message".Fields Type Description Mandatory/Optional Example
device_id string id of thedevice/cluster
Mandatory 123456789
message_date string date of themessage (in ISO8601 format)
Mandatory 2019-07-10T13:46:59+00:00
latitude number latitude of thedevice (indecimaldegrees)
Optional 38.5714
longitude number longitude of thedevice (indecimaldegrees)
Optional -7.9135
sensors array array of sensorobjects
Mandatory
Inside the message object, there is a field called "sensors", which is an array of JSON objects. Itwas chosen to use an array of sensors over a single sensor object because it was expected multiplesensors sending data over the same device, so in order avoid sending a message for every singlesensor on the sensor station, they are grouped up in one single message. The sensor objects areused to store the data related to a specific sensor and fields are explained in the Table 3.4.
Table 3.4: The fields of a JSON object "sensors".Fields Type Description Mandatory/Optional Example
sensor_id string id of the sensor Mandatory 123456789data array array of data objects Mandatory
A raised issue with the development of message structure was that if a sensor station uploadedevery batch of reading from sensors, it would result in sending more messages. Most devices willdepend on a limited battery, meaning energy conservation becomes a very relevant subject, andevery time a message is sent, it consumes energy. The best solution found was to arrange an arrayto store the values read during a time interval, this array would store data in JSON objects, thatthemselves would store values measured and the time it was measured, as presented in Table 3.5.
Table 3.5: The fields of a JSON object "data".Fields Type Description Mandatory/Optional Example
value number sensor value toupload
Mandatory 54.20
date string sensor valueacquisition date (inISO 8601 format)
Mandatory 2019-07-10T13:46:59+00:00
The combination of the fields "message_date" and "device_id" is a combination that only happens

3.3. MESSAGE STRUCTURE 25
once, making it a nonce value for the hash.
As presented in [16], IoT devices face security threats when sending data. A possible solutionto deal with possible threats was to encrypt the data uploaded by the sensors, using a securecommunication channel. Although this option solves the problem of having unauthorized clients toupload harmful data to the system, it is not the best approach due to low computations capacitiesof the sensor stations. The alternative method was to use an authentication algorithm that wouldonly allow authorized sensors stations to upload data to the system, by verifying the integrity ofthe message, further explored in the Section 3.3.1.
When the sensor data is received in the message broker, the Data Processing module will convertit into multiple data points to be inserted in the database. After this transformation is completed,each new data point is published to a new topic. From that topic, each data point is then uploadedto the database through the Data Loader module.
3.3.1 Authentication
The authentication of messages prevents attacks ill-intentioned to the system. An example of aprejudicial attack this system is sensitive to is a Man-in-the-middle attack, where an intruder caneavesdrop on the data sent by the sensor and tamper with the messages contents.
The authentication of messages from a sensor represents a crucial component for the securityof the system. The most likely vector of attack to the system will take advantage of the datainput point that sensors use. Security measures are needed between the sensor and the cloud.When defining what would be the security measures, first though the data encryption would bethe perfect choice to ensure the security of the system but it was called to our attention thatsensor stations have limited computation capacity, meaning most devices would not be able tohandle complex data encryption.
With the limited processing capacity of the devices sending data to the system, instead of encrypt-ing the data, the alternative was using a Hash-Based Message Authentication. This alternativemakes messages very hard to be tampered while sacrificing data privacy. If the message is inter-sected by an attacker, he can change the message and re-send it as if it was the owner but unlesshe can re-hash the message with the secret password, it will fail. Because when the tamperedmessage arrives in the Data Reception module it will be discarded, the moment the calculatedhash does not match the one sent in the message, explained in this Section.
In both communication protocols, the steps related to the authentication are the same. The onlynuance between the two is how the hash is sent, as seen before. The process of authenticationstarts with the sensor owner registering the sensor station with the respective sensors in the sensormanagement system. After the sensor station is registered, a password is shared with the sensor’sstation owner and stored in the database.
When configuring the sensor station, the sensor owner uses the shared password to generate themessage hash on each transmission from this registered sensor station. The hashing is done byconcatenating the password to the end of the message object, in a string format, and the resultingstring is passed through an MD5 hashing function.

26 CHAPTER 3. PROPOSAL
Hash = MD5(message+ password)
The hashing result is sent with the message to the Data Reception module, according to the com-munication protocol. Once the message is received, the message integrity is verified. The firststep is to send a request with device_id to the REST Authentication Interface, to get the respectivepassword and list of associated sensors from the database. It then grabs the message object, sentby the sensor station, and repeats the same process that was done in the sensor station but witha password received from the REST Authentication Interface.
After that, both resulting hashes are compared, and if they don’t match, it is concluded that themessage might have been tampered with and therefore it is rejected.
Based on the message presented before, in Listing 3.1, and assuming that the device_id associatedwith sensor station is 123456789 and the password associated to that device_id is 7b2f8461-98fd-4425-a404-1477583a2fbf, Listing 3.4 shows the resulting string before hashing.
Listing 3.4: An example of string used for hashing
1 {"device\_id":123456789,"message\_date":"2019-07-10T13:46:59+00:00","latitude":"-38.5714","longitude":"-7.9135","sensors":[{"sensor\_id":123456781,"data":[{"date":"2019-07-10T13:46:59+00:00","value":"24.90"}]}]}7b2f8461-98fd-4425-a404-1477583a2fbf
Using the previous string, we will call fused_message, and the MD5 algorithm creates hash result-ing in the following:
MD5(fused_message) = ”3afedb3c5bf80ff71c2870ccc4543fe5”
The generated hash is sent according to the protocol, MQTT sends the hash through the messageand HTTP sends it through a header. The message is then received by the server, in both protocols,the server sends an HTTP GET request to an interface close to the database with device_id, to getthe password used to create the hash associated with the message. In MQTT protocol, because thesensor data is bundled with the hash in the message, there is a need to use a REGEX to extract thepart of the message that needs to be hashed for authentication.
A problem that was discovered during implementation was that a sensor station was able to trans-mit data from sensors that were not in the station. To solve this issue, when the password is sentfrom the REST Authentication Interface, a list of sensors is also received and is used to confirm thatthe sensor station only sends data from its respective sensors.
3.4 Central System
The Central System, as the name implies, is the core of the system. It collects all the data fromAggregator modules, as seen in Figure 3.3. After the data is collected from the Aggregator, the datais processed and made available in the database. Even though not planned, the Central System

3.4. CENTRAL SYSTEM 27
has the potential to:
• calibrate sensor raw data and save calibrated data in the database;
• apply machine learning techniques over sensor calibrated sensor data to create predictionmodules ;
• provide sensor management mechanisms;
• provides data exploration and visualization mechanisms to end-users.
The Central System can be divided into three sections: Data Processing, Data Storage, and DataAccess.
The Data Processing Section is where the Data Connector module resides, and other potentialprocessing units. The Data Loader module is in charge of the collection of the data from theAggregator modules and loads that same data into the Data Storage module.
The Data Storage module is where all system data is stored, from the data sent from sensorsto the static sensor information such as sensor location, sensor type, and sensor password. Thedata types to be stored are very different, so to have better use of the available storage, modulehas to manage different types of databases working in parallel. The data from the sensor can bedescribed as time-series, making the most appropriate a time-series database, and for static data,the one that fits the best is the relational database type.
The REST Authentication Interface is in charge of making all the necessary data from the databaseavailable to external sinks. In this system, the module will only create data access for the Aggre-gators to have access to the sensors station’s passwords.


4Implementation
In this chapter, we present the technologies chosen to implement the proposed systemand describe the components that were configured or implemented in the system.
The Figure 4.1, we can see an overview of the cloud system with the corresponding technologiesused to implement the modules in the Figure 3.3.
Figure 4.1: Proposed implementation of functional modules in cloud system
The Data Collection Module uses Spring Boot for handling HTTP protocol and VerneMQ for handlingMQTT, as seen in Figure 4.2.
The chosen implementation for the HTTP protocol uses a Spring Boot application that receivesan HTTP POST request with data from the sensor station in the requests body, together with thehash of the message in the "Authentication" header. First, the application verifies the integrity ofthe message and then verifies the data structure. Only then, if the messages are valid, data is
29

30 CHAPTER 4. IMPLEMENTATION
published into Kafka. In case of failure in the verification process, a debugging message is sentback to the sender.
One of the options considered was Kafka REST, but it was discarded because there was no way toadd an authentication system without having fully understood the code and change it accordingto the needs of the system. This would result in a time-consuming task when comparing to thedevelopment of s Spring Boot REST interface using Kafka Producer API.

31
Figure 4.2: Proposed implementation of functional modules in the Aggregator
For the implementation of the MQTT protocol, we considered the use of VerneMQ and EMQ. Aftera detailed analysis of each solution, we concluded that there was not a significant difference,besides the fact that the popularity of EMQ would slightly surpass that of VerneMQ’s. While workingwith VerneMQ, there was the opportunity to implement plugins with Elixir, which we had previousexperience with. At the time, we decided to use VerneMQ over EMQ.
For this project, we decided to implement the plugin, responsible for the authentication of sensorstation data using Elixir v.1.6 for VerneMQ v.1.6 both compatible with Erlang/OTP 21.
Although there was an issue finding the compatibility’s between the versions of Elixir, VerneMQ,and Erlang/OTP, the real challenge was in the implementation of a process capable of extractingthe sensor station data from the message sent. The authentication process requires for the sensorstation data to be isolated and exactly how it was sent from the sensor otherwise it is impossibleto authenticate as intended.
The first method considered for the data extraction was the use of a JSON library in Elixir that wouldallow extracting fields from JSON objects in string format, but when the fields were extracted, thevalues of the message were correct but the resulting string was different from the one originallysent.
This happened because when the message was parsed into an object, only the values and fieldsare passed to the object. When it is converted into a string the values and fields are present butits missing the spacing and other unnecessary characters compared to the original message.
Therefore resulting in a different hash when applied to the authentication process. The solution

32 CHAPTER 4. IMPLEMENTATION
was to use a REGEX library, the "re" module of Elixir. The REGEX expression was developed toextract from the message the sensor station data without changing from the original form.
In the next sections, we will describe the implementation chosen around the message broker, andhow it interacts with the system, as shown in Figure 4.2. The chosen message broker was ApacheKafka, for its ability to store the data persistently. We will also describe the implementations usedto assist Apache Kafka.
4.1 Connection with External Systems
Kafka Connect plays a vital role in the Kafka Ecosystem, it presents an easy framework to deployscalable connectors to interact with Kafka broker and outside systems. This simplifies the integra-tion of Kafka with other systems by creating a standard that allows the development, deployment,and management of connectors.
Kafka Connect is used with Stream Reactor MQTT Source connector to established a data flowfrom the MQTT Broker to the Kafka broker. To insert the data in the database, we had to flatten andindividualize each data point. To do so, we used Kafka Streams lightweight processing applications.
To establish the connection between Apache Kafka and the database, two options were consid-ered, the use of Confluent JDBC connector for Kafka Connect or a Java application using the KafkaConsumer API and JDBC library.
The Confluent JDBC connector allows establishing the connection from Kafka to a database JDBCinside the Kafka Connect environment. This approach, from a processing standpoint, is the mostcorrect since it provides a production-ready solution with efficient use of resources.
In a context, where data insertion into a database requires a more complex operation beyondthe operations provided by Kafka Connect, there are two possible approaches: 1) recreate theConfluent JDBC Sink connector; or 2) develop a Java application using Kafka Consumer API andJDBC library.
The first option is the correct approach because it allows us to leverage the production-readysolution of the Confluent JDBC Sink connector. The downside of this approach is that it requires afull understanding of the code involved and a considerable amount of time to do so. Also, the lackof comments/documentation on the code, to help to understand it, only makes it more challengingto reverse engineer it, which increases the efforts to opt for this approach.
The solution with a Java application with JDBC and Kafka Consumer, compared to the previous solu-tion, is easy to implement and can scale effortlessly across multiple machines. The only downsideis the use of multiple JVM, one for each Java application deployed. With the project timetable inmind, this choice was chosen, even if wasn’t be most efficient.
4.2 Confluent Schema Registry
The Confluent Schema Registry serves as a support software to store the schema of Kafka topics,providing a REST interface for storing and retrieving Avro, JSON Schema, and Protobuf schemas.Not being as simple as a storage system, it also includes features like storing the history of versions

4.3. KAFKA STREAMS 33
based on a specific subject name strategy, and allied to that, it has multiple compatibility settingsbetween versions allowing schema evolution. The storage of the schema of each subject meansthat the metadata of the subject is stored in one place, and together with the serialization of thedata, it removes the overhead and verbosity of data sent into Kafka.
The Schema Registry works concurrently with Kafka broker. The producers and consumers com-municate with Kafka but before they use the Schema Registry to serialize and deserialize the databefore sending or receiving the messages.
The chosen data serialization system was Apache Avro, which relies on the use of a schema. Theserialization of data to Avro data is done using the schema, so it can be written without no per-valueoverheads, making serialization both fast and small. The schema is needed to read Avro data, soit can be deserialized. The serialization allows the use of rich data structures, compact, fast dataformat.
4.3 Kafka Streams
Kafka Streams is a lightweight processing application that uses Kafka topics as input and output ofdata. In the context of this project, it is used to process the messages in batch and convert eachdata point into a single message. The output Kafka topic is going to store the data ready for thedatabase, and the database connector consumes from that topic to insert the data in the database.The Avro schema of the input topic can be found in Chapter 3, Listing 3.3, and the schema for theoutput topic in Listing 4.1.
Listing 4.1: Output Kafka topic Avro schema
1 {2 "type": "record",3 "name": "myrecord",4 "fields": [5 {6 "name": "sensor_id",7 "type": "int"8 },9 {
10 "name": "time",11 "type": "string"12 },13 {14 "name": "latitude",15 "type": [16 "null",17 "double"18 ]19 },20 {21 "name": "longitude",22 "type": [

34 CHAPTER 4. IMPLEMENTATION
23 "null",24 "double"25 ]26 },27 {28 "name": "value",29 "type": "double"30 }31 ]32 }
4.4 ZooKeeper
In the Kafka ecosystem, ZooKeeper plays a crucial role across all elements in the system. Zookeeperis an open-source configuration and synchronization service, with the capacity to be distributed.The distribution of these services made this the standard tool for distributed applications, such asApache Spark or Hadoop.
The role played by Zookeeper, is the sharing of information about the Kafka consumers and Kafkabrokers. Related to the Kafka broker, the data stored is linked to the brokers state, topic consum-mation and production quotas, data replication, and topics registry, further explained:
• Broker state - Zookeeper periodically sends a request to verify if a broker is running, so incase failure, it can react and elect a new leader for the cluster.
• Quotas - different producer and consumer quotas for different clients.
• Replicas - each topic can be replicated across a cluster. The Zookeeper storage keeps trackof the Kafka broker that have in-sync replicas. If a leader broker fails, the election of a newleader will be the broker that has the most in-sync replicas.
• Broker and Topics Registry - keeps a registry of the borkers and topics in the cluster, withinformation about what Kafka topic partitions are held by each Kafka broker.
The stored consumer data is the consumer offsets and registry. The consumer offsets are theoffset from the beginning of the message queue that determines the position of the last consumedmessage. This is very useful for consumer groups so the multiple members don’t consume thesame message more than once.
4.5 Containerization
In this section, we describe the containerization process to Docker containers of every componentin the system previously described, followed by the deployment strategy through Kubernetes.
For each component previously, it is needed at least one Docker image in order to deploy thecontainers with the necessary software. Software is developed for multiple platforms such as Linux

4.5. CONTAINERIZATION 35
or Windows operative systems, but it can also be available as a Docker image. The only officialDocker images we used, without having to change them, were Schema Registry, Zookeeper, andApache Kafka
Nonetheless, in some cases, the official images aren’t enough and there is the need to include filesin a container. For that purpose, new images are created based on official ones.
We had to follow this approach for the deployment of VerneMQ and Kafka Connect. As a result ofusing Kafka Connect, we had to use a connector out of those that were available with the official im-age. As such, it created a new image with the binaries of the necessary connector. VerneMQ wentthrough a similar process, where in order to add the authentication plugin, it was also necessaryto add the plugin files to the VerneMQ official image.
The situations where components that we implemented ourselves: the database connector, HTTPdata collection, and pre-processing module. All of these modules are Java applications, as such,for each one, an image was built from the image from the repository of OpenJDK of Java 8 and withall necessary dependencies inside.
It was achieved the full deployment of system through Docker container.
It was planned to have a fully automatic deployment of the system, distributed across the deployedmachines, through Kubernetes. Among the tasks that had to be done in this project, containerorchestration was among the last ones because we can not do the container orchestration withoutthe system being implemented and because of that, we did not have time to apply the containerorchestration, leaving it for future work.
The plan to deploy the system in Kubernetes consists of using a pre-existing application fromHelms, a package manager for Kubernetes and if it couldn’t be done through existing applications,we would create the necessary charts with Docker images.

5Experimental Evaluation
In this chapter we present a collection of tests that were done to understand where thesystem could have a bottleneck, and how could it be fixed. In the end we compare theresults, using some chosen metrics like the response time versus the number of activerequests or the number of requests dispatched over a period of time.
37
38 CHAPTER 5. EXPERIMENTAL EVALUATION
The first version of the system was deployed on a single machine. Since this deployment was doneon a single machine, it was not able to take advantage of the distributed capabilities of Kafka, orSpring Boot and VerneMQ load balancing.
After deploying the first version of the system, we tested the system to understand if we hadany bottleneck, and which component could be the cause. The tests consisted of having twomachines, in the same local network as the system, with multiple threads making requests to theData Collection Module.
The tool used to perform the tests was Apache JMeter[22], which is used for load testing functionalbehavior and measure performance in a distributed manner.
The test parameters that were used to fine-tune the tests were:
1. the number of threads created per machine;
2. how many loops each thread completes;
3. ramp-up period.
Each thread executes the task defined for the test, and when finished, it reports the relevant datato the test. An example of an HTTP test thread, is a thread sending an HTTP POST request and aftera response or timeout, the thread is closed and the data related HTTP request is stored.
The number of threads is the number of tasks to be executed concurrently. Considering the sameexample of HTTP test, the number of threads it would be the number of HTTP requests done at thesame time.
The number of loops is how many times the threads are going to cycle. If we consider two loops inthe HTTP, after finishing the first thread, it would repeat it once more before closing.
The ramp-up time is the amount of time it takes for the test to reach the maximum threads defined.
We can conclude, that with the number of loops we can define the duration of the test, and in themeanwhile, the number of threads allows us to establish a limited number of concurrent requests.
The beginning and ending phases of the test have different behaviors. In the beginning, becauseof the ramp-up time, there is a delay in starting all threads, meaning there are fewer concurrentrequests, therefore, the response time escalates until the maximum number of threads is achieved.In the final stages of the test, some threads finish faster than others, this is due to the de-escalationof concurrent threads.
The purpose of these tests was to identify and set the maximum number of concurrent requeststhat the system could handle, while still meeting the minimum quality of service.
To perform these tests, we used three machines to deploy the system, all with the following speci-fications:
• CPU: Intel(R) Xeon(R) Bronze 3106 CPU @ 1.70GHz
• Memory: 2 x 16 GB Memory RAM 2666 MHz
• Disk: 1199 GB HDD

5.1. HTTP PROTOCOL TESTING 39
5.1 HTTP protocol testing
The first test of the Spring Boot Server was done with Kafka system deployed only in a single ma-chine, without load balancing with Spring Boot Server. The task assigned the threads to consistedan HTTP POST request with the headers described in Table 5.1 and the body described in Listing5.1.
Table 5.1: Header used HTTP POST requestHeader Name Value
Content-Type application/jsonHost 193.112.345.298:8080Accept Arduino/1.0
Content-Length 212Authentication 1dd0725b1861b6248d362a6d2e954ef2
Listing 5.1: HTTP POST request body
1 {2 "device_id": "1095",3 "message_date": "2019-07-10T13:46:59+00:00",4 "latitude": "-38.5714",5 "longitude": "-7.9135",6 "sensors": [7 {8 "sensor_id": "3391",9 "data": [
10 {11 "date": "2019-07-10T13:46:59+00:00",12 "value": "24.90"13 }14 ]15 }16 ]17 }
Without knowledge of what were the system capacities, the objective of the first tests, in Section5.2.1, was to know what was the limits of the system single machine deployment. Meaning westarted with a low number of request, increasing the number of requests until we were met with atest that had any failed request from connection timeout.
The tests were configured using 3 parameters: 1) the number of threads is the number of HTTPrequests that can be done at the same time; 2) the number of loops is the number of requests thatthreads have to send before the thread can be closed; and 3) the ramp-up time is the amount oftime that it takes to activate all the threads. From this, we can realize that the total number ofrequests performed on each test is equal to the number of loops times the number of threads.

40 CHAPTER 5. EXPERIMENTAL EVALUATION
The considered metric was the requests response time throughout the test and the response timecompared to the active number of threads.
The tests in the Section 5.2.1, are the following tests were done:
• Test number 1:
Parameter Value
Number of Threads 5000Ramp-up time 30 seconds
Loops 100
• Test number 2:
Parameter Value
Number of Threads 5500Ramp-up time 30 seconds
Loops 100
• Test number 3:
Parameter Value
Number of Threads 6000Ramp-up time 30 seconds
Loops 100
After executing the tests, it was noticed a relative high response, as it can be seen in Figures 5.2,5.4 and 5.6. To understand high response times, we analyzed the Spring Boot metrics and logs andmade the same experiments to understand what components were impacting response time.
One of the experiments was the removal of some parts from data collection module, in the case ofHTTP protocol we removed the Producer API. The experiment led to running the Spring Boot serverwith an authentication process but excluded the function send data to a Kafka broker. The resultresponse times were drastically improved, as it can be seen in Figure 5.7, making it clear there wasa bottleneck while using the Producer API. This issue can be easily solved by modifying the datacollection module to use an asynchronous mechanism to validate messages.
This solution has a drawback: if the Kafka broker is down, the messages are still accepted bythe Spring Boot server and can be lost for not being able to publish the messages in the Kafkabroker. Since the message upload is asynchronous, the sensor station sends data without havingthe feedback that the message was received in the Kafka broker.
The best alternative to solve this issue was to upgrade the resources dedicated to Kafka, in order todeploy Kafka cluster across the 3 machines and to split the topic into 3 partitions to be distributedin the 3 available machines.
With these changes implemented, we made a new deployment of the system which consists ofhaving Kafka cluster distributed in the 3 machines, including the distribution of Zookeeper, while

5.2. HTTP TESTS 41
still maintaining every other component of the system running in a single machine. With this newdeployment, the system was tested again with 5000 threads doing 100 loops with a ramp-up timeof 30 seconds, because the parameters had the most acceptable results in the previous test.
The test results of this new deployment, presented in Figure 5.9, shows a in slightly faster response.Noticing little difference between average response time with 3 partitions on Kafka or 1 partition,the next step would be to distribute the Spring Boot server across the available machines, but dueto the project planning, this would have to be considered future work to be done.
5.2 HTTP Tests
In this Section, we show all HTTP tests done referred to in the previous Section. The data outputfrom the test is shown, as well as a brief interpretation of the data.
5.2.1 HTTP Tests on Single Machine deployment
Test number 1
Figure 5.1: The active threads versus response time graph of HTTP test number 1
Figure 5.2: The response time graph of HTTP test number 1
Test number 1 assesses how the system reacts to having 5000 HTTP requests being sent concur-

42 CHAPTER 5. EXPERIMENTAL EVALUATION
rently over time. Analyzing active threads versus response time graph, in Figure 5.1, we see astabilizing tendency in the response time on maximum requests. In the response time graph, inFigure 5.2, we can see the beginning of the sinusoidal wave, and overall the graph is stable onaverage response time 21275 milliseconds.
Test number 2
Figure 5.3: The active threads versus response time graph of HTTP test number 2
Figure 5.4: The response time graph of HTTP test number 2
Test number 2 assesses how the system reacts to having 5500 HTTP requests being sent concur-rently over time. Analyzing active threads versus response time graph, in Figure 5.3, we see astabilizing tendency in the response time on maximum requests. In the response time graph, inFigure 5.4, we can see the beginning of the sinusoidal wave, and overall the graph is stable onaverage response time 23317 milliseconds.
Test number 3
Test number 3 assesses how the system reacted to having 6000 HTTP requests being sent con-currently over time. Analyzing active threads versus response time graph, in Figure 5.5, we see a

5.2. HTTP TESTS 43
Figure 5.5: The active threads versus response time graph of HTTP test number 3
Figure 5.6: The response time graph of HTTP test number 3
stabilizing tendency in the response time on maximum requests. In the response time graph, wecan see a sinusoidal wave with decreasing amplitude over time, and overall the graph is stabilizingon the average response time of 24175 milliseconds.
5.2.2 HTTP Tests without Produce API
Figure 5.7: The response time graph of HTTP test number 4.

44 CHAPTER 5. EXPERIMENTAL EVALUATION
Test number 4 was done without the component of Producer API, resulting in data not being sentto the Kafka broker. This test was done with 2000 threads, 4 loops, and 1 seconds ramp-up. Theexperiment resulted in a drastically reduced average response time of 1885 milliseconds.
5.2.3 HTTP Tests with Kafka Distributed
Test number 5
Figure 5.8: The active threads versus response time graph of HTTP test number 5.
Figure 5.9: The response time graph of HTTP test number 5.
Test number 5 results of distributed deployment, with parameters of 5000 active threads, 100loops, and a ramp-up period of 30 seconds, are presented in Fig. 5.9. It presents a slightly lowerresponse time compared to a single machine deployment of Kafka, with an average response timeof 20392 milliseconds.
Test number 6
Test number 6 was made with 5000 active threads with 1000 loops and a ramp-up of 30 seconds,doing a total of 5 000 000 HTTP requests. The test took about 5 hours and 44 minutes, making itan endurance test for the system.

5.3. MQTT PROTOCOL TESTING 45
Figure 5.10: The response time graph of HTTP test number 6.
5.3 MQTT protocol testing
Unlike the HTTP protocol, the MQTT broker doesn’t depend on Kafka broker response to finish theprocess of receiving the messages. The only application that is in charge of receiving messagesfrom the MQTT protocol is VerneMQ. All the tests were executed in a single machine deploymentof VerneMQ. Although VerneMQ advises the use of MZBench to load test a VerneMQ broker, wedecided to look up other solutions, due to some problems that were encountered when usingMZBench. A widely used approach to load testing an MQTT broker, and also recommended toload test EMQ X MQTT, is the Apache JMeter with the MQTT JMeter plugin. This choice had evenmore in favor, given the fact that Apache JMeter had already been used.
The first test simulates the worst-case scenario, where every sensor connects to the MQTT broker,sends a single message before it disconnects. These tests consisted of three different actions,the first action was to establish a connection to the MQTT broker with sampler MQTT Connectparameters in Table 5.2:
Table 5.2: MQTT Connect sampler parameters.Parameter Value
Server name/IP server1MQTT version 3.1
Timeout 10 secondsProtocol TCP
Since the MQTT broker-defined configurations don’t use any user authentication, there is no needto have any user credentials in MQTT publish request.
The second action is that of publishing a message to the MQTT broker, using the sampler MQTTPub Sampler with the parameters in the Table 5.3 and body in Listing 5.2.

46 CHAPTER 5. EXPERIMENTAL EVALUATION
Table 5.3: MQTT Pub sampler parameters.Parameter Value
QoS 1Topic name /SensorMQTT
Message type String
Listing 5.2: MQTT request body
1 {2 "message": {3 "device_id": "1077",4 "message_date": "2019-07-10T13:46:59+00:00",5 "latitude": "-38.5714",6 "longitude": "-7.9135",7 "sensors": [8 {9 "sensor_id": "123456781",
10 "data": [11 {12 "date": "2019-07-10T13:46:59+00:00",13 "value": "24.90"14 }15 ]16 }17 ]18 },19 "authentication": "6f93002d7bf394354d1fa2561141260f"20 }
The last action is to disconnect, with a sampler MQTT DisConnect. The main metric chosen wasthe response time from each action over-time and just like it was done with HTTP, the tests wereexecuted with different parameters.
In all tests presented in Section 5.3.1, there is a clear conclusion: the most time-consuming actionis the one that establishes the connection to the MQTT broker, meaning there could be a clearimprovement in the number of messages processed if the sensor can send more than one messagefor each established connection. The first two tests behaved according to what was expected,maintaining the same pattern of response but only increasing the average response time. WithMQTT test number 3, there was a residual amount of sent messages that failed.

5.3. MQTT PROTOCOL TESTING 47
The following tests were done:
• Test number 1:
Parameter Value
Number of Threads 4000Ramp-up time 30 seconds
Loops 100
• Test number 2:
Parameter Value
Number of Threads 5000Ramp-up time 30 seconds
Loops 100
• Test number 3:
Parameter Value
Number of Threads 5000Ramp-up time 30 seconds
Loops 500
5.3.1 MQTT Tests
In this Section, we show all MQTT tests done referred to in the previous Section. The data outputfrom the test is shown, as well as a brief interpretation of the data.
MQTT Test number 1
The first test consists of 4000 threads and 100 loops yielded an average response time whenconnecting to an MQTT broker of 5480.2 milliseconds, an average time of 5 milliseconds whilepublishing the message, and an average of 0.2 milliseconds while disconnecting.
MQTT Test number 2
The second test consist of 5000 threads and 100 loops yielded an average response time whenconnecting to an MQTT broker of 8 389.2 milliseconds, an average time of 4.9 milliseconds whilepublishing the message, and an average of 0.2 milliseconds while disconnecting.

48 CHAPTER 5. EXPERIMENTAL EVALUATION
Figure 5.11: Response time graph of MQTT test number 1
MQTT Test number 3
In the third test of the system, we tested consisted 5500 threads and 100 loops. That resulted inan average response time when connecting to an MQTT broker of 7884 milliseconds, an averagetime of 4.5 milliseconds while publishing the message, and an average of 0.2 milliseconds whiledisconnecting.
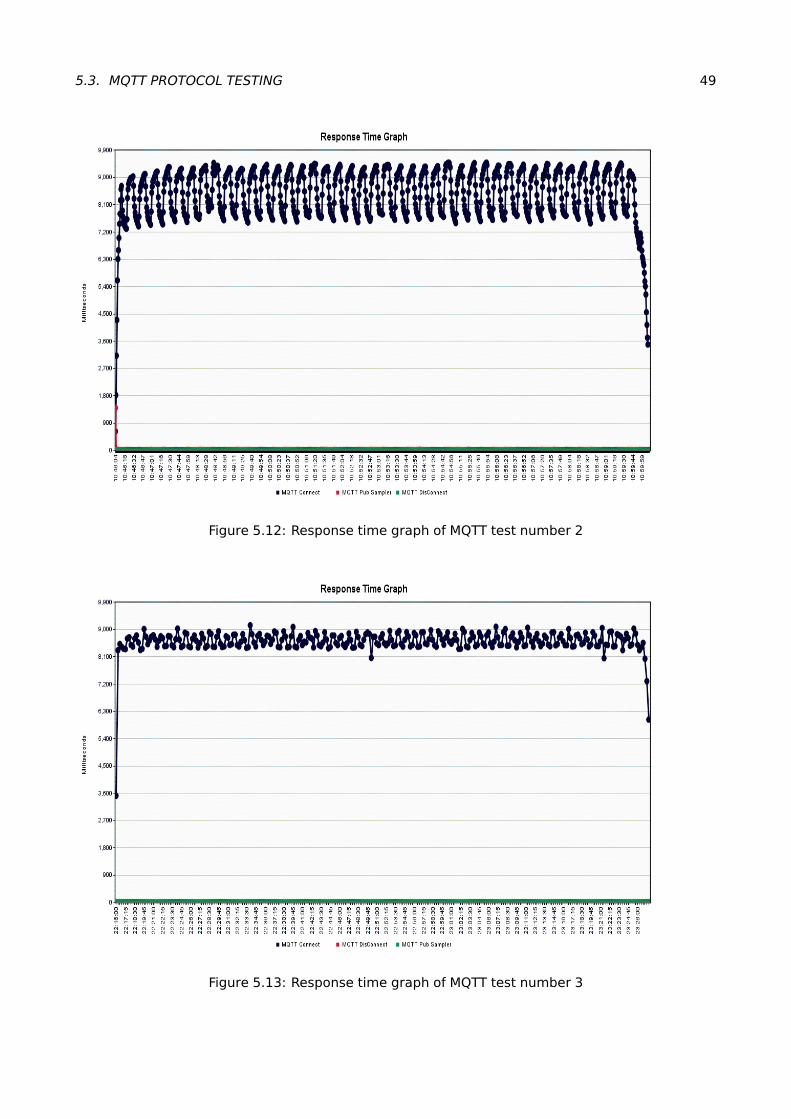
5.3. MQTT PROTOCOL TESTING 49
Figure 5.12: Response time graph of MQTT test number 2
Figure 5.13: Response time graph of MQTT test number 3


6Conclusions and Future Work
In this dissertation, we present a data collection system from the sensors. The main objective wasthe development of a system using the state of the art Open Source tools.
For the same components, there were multiple tools considered to be state of art, for example,the message broker had two options that did the same but RabbitMQ relies more on memorymeanwhile Apache Kafka keeps its operation on disk level. In this case, we choose Apache Kafkabecause we considered more relevant the data persistence over a faster data flow.
During the development, there was a series of challenges, and some difficult choices had to bemade. The situation with the low computation capacity of sensor and the choice between dataencryption and data hashing, referred in Section 3.3.1; and between the implementation of thedatabase connector or modifying the Confluent JDBC connector, referred in Section 4.1.
During development, some tasks had to be left unfinished because there was not enough time.A task not completed was the clustering VerneMQ and Spring Boot. During the testing phase,it was noticed high response time for both MQTT and HTTP requests, and the next logical stepwas to cluster the services in charge of handling the respective protocols, this would allow takingadvantage of load balancing features present in both VerneMQ and Spring Boot.
51

52 CHAPTER 6. CONCLUSIONS AND FUTURE WORK
The testing allowed us to conclude that system could support at least 5000 devices sending con-stant messages without failing to respond to any of them. This scenario in production is not ex-pected but we could have 10 000 devices sending messages every 5 minutes and the system isexpected to handle that situation.
Although most of the objectives were achieved, there was work planned or components that couldstill be improved. The following task were left to be completed:
• Add the functionally of load balancing of Spring Boot to HTTP data collection.
• Configure the VerneMQ to a cluster, and by default also add MQTT data collection.
• Substitute the Java application that establishes the connection between Kafka broker and thedatabase, for a customized version of Kafka Connect JDBC connector.
• Create an automated deployment with Kubernetes
• Create a monitoring tool with Graphana and PrometheusDB, to monitor all components of thesystem.
The objective of creating a prototype of a data collection system for IoT devices made of OpenSource tools was a success. Some points have clear improvements to be made, as referred to inprevious remarks. Nonetheless, it resulted in a fully functional system with the ability to supportthe data collection of hundreds of IoT devices.

Bibliography
[1] Carlos Arango Gutierrez, Remy Dernat, and John Sanabria. “Performance Evaluation of Container-based Virtualization for High Performance Computing Environments”. In: Revista UIS Inge-nierías 18 (Sept. 2017). DOI: 10.18273/revuin.v18n4-2019003.
[2] Flavio Bonomi et al. “Fog Computing and Its Role in the Internet of Things”. In: Proceedingsof the First Edition of the MCC Workshop on Mobile Cloud Computing. MCC ’12. Helsinki,Finland: Association for Computing Machinery, 2012, pp. 13–16. ISBN: 9781450315197. DOI:10.1145/2342509.2342513. URL: https://doi.org/10.1145/2342509.2342513.
[3] C. Bormann, A. P. Castellani, and Z. Shelby. “CoAP: An Application Protocol for Billions of TinyInternet Nodes”. In: IEEE Internet Computing 16.2 (2012), pp. 62–67.
[4] Emiliano Casalicchio and Vanessa Perciballi. “Measuring Docker Performance: What a Mess!!!”In: Proceedings of the 8th ACM/SPEC on International Conference on Performance Engineer-ing Companion. ICPE ’17 Companion. L’Aquila, Italy: Association for Computing Machinery,2017, pp. 11–16. ISBN: 9781450348997. DOI: 10.1145/3053600.3053605. URL: https://doi.org/10.1145/3053600.3053605.
[5] C. Chatfield. “The Holt-Winters Forecasting Procedure”. In: Journal of the Royal StatisticalSociety: Series C (Applied Statistics) 27.3 (1978), pp. 264–279. DOI: https://doi.org/10.2307/2347162. eprint: https://rss.onlinelibrary.wiley.com/doi/pdf/10.2307/2347162. URL: https://rss.onlinelibrary.wiley.com/doi/abs/10.2307/2347162.
[6] Confluent. Confluent - Kafka REST Proxy. Feb. 12, 2020. URL: https://docs.confluent.io/3.0.0/kafka-rest/docs/intro.html#features.
[7] Confluent. Confluent - SchemaManagement. June 14, 2020. URL: https://docs.confluent.io/current/schema-registry/index.html.
[8] Confluent. Confluent REST APIs. Feb. 12, 2020. URL: https://docs.confluent.io/platform/6.0.1/kafka-rest/index.html.
[9] CoreOS. rkt - Overview. Feb. 12, 2020. URL: https://coreos.com/rkt/.
[10] CoreOS. rkt vs Other Projects. Feb. 12, 2020. URL: https://coreos.com/rkt/docs/latest/rkt-vs-other-projects.html.
[11] Daniel Coutinho et al. Considerations for a cloud-based system for IoT data acquisition fromheterogeneous sensors. Nov. 2019. DOI: 10.13140/RG.2.2.17221.81121.
53
54 BIBLIOGRAPHY
[12] Michael Crosby. What is containerd ? Feb. 12, 2020. URL: https://www.docker.com/blog/what-is-containerd-runtime/.
[13] M. Dachyar, Teuku Yuri M. Zagloel, and L. Ranjaliba Saragih. “Knowledge growth and de-velopment: internet of things (IoT) research, 20062018”. In: Heliyon 5.8 (2019), e02264.ISSN: 2405-8440. DOI: https://doi.org/10.1016/j.heliyon.2019.e02264. URL: http://www.sciencedirect.com/science/article/pii/S2405844019359249.
[14] Jasenka Dizdarevi et al. “A Survey of Communication Protocols for Internet of Things andRelated Challenges of Fog and Cloud Computing Integration”. In: ACM Comput. Surv. 51.6(Jan. 2019). ISSN: 0360-0300. DOI: 10.1145/3292674. URL: https://doi.org/10.1145/3292674.
[15] EMQ Enterprise. EMQ-3.0 Benchmark Report. Oct. 6, 2020. URL: https://emq- xmeter-benchmark-en.readthedocs.io/en/latest/.
[16] A. Erroutbi, A. E. Hanjri, and A. Sekkaki. “Secure and Lightweight HMAC Mutual Authentica-tion Protocol for Communication between IoT Devices and Fog Nodes”. In: 2019 IEEE Inter-national Smart Cities Conference (ISC2). 2019, pp. 251–257.
[17] R. Fielding et al. RFC2616: Hypertext Transfer Protocol – HTTP/1.1. USA, 1999.
[18] Apache Software Foundation. Apache Avro - Apache Avro 1.9.1 Documentation. Feb. 12,2020. URL: https://avro.apache.org/docs/1.9.1/.
[19] S. Fu et al. “Toward a Standard Interface for Cloud Providers: The Container as the NarrowWaist”. In: IEEE Internet Computing 20.2 (2016), pp. 66–71.
[20] Solomon Hykes. Introducing runC: a lightweight universal container runtime. Feb. 12, 2020.URL: https://www.docker.com/blog/runc/.
[21] Open Container Iniciative. About the Open Container Initiative. Feb. 12, 2020. URL: https://opencontainers.org/about/overview/.
[22] Apache Jmeter. Apache Jmeter - Home. June 14, 2020. URL: https://jmeter.apache.org/.
[23] Apache Kafka. Apache Kafka - Persistence. Feb. 12, 2020. URL: https://kafka.apache.org/documentation/#persistence.
[24] Apache Kafka. Apache Kafka - Producer API. Feb. 12, 2020. URL: https://kafka.apache.org/documentation/#producerapi.
[25] Apache Kafka. Introduction. June 26, 2020. URL: https://kafka.apache.org/intro.
[26] Apache Kafka. Kafka Streams - Introduction. Feb. 12, 2020. URL: http://kafka.apache.org/documentation/streams/.
[27] Hugo Krawczyk, Ran Canetti, and Mihir Bellare. “HMAC: Keyed-hashing for message authen-tication”. In: (1997). URL: https://www.hjp.at/doc/rfc/rfc2104.html.
[28] Kubernetes. What is Kubernetes? Feb. 12, 2020. URL: https://kubernetes.io/docs/concepts/overview/what-is-kubernetes/.
[29] Werner Kurschl and Wolfgang Beer. “Combining Cloud Computing and Wireless Sensor Net-works”. In: Proceedings of the 11th International Conference on Information Integration andWeb-Based Applications amp; Services. iiWAS ’09. Kuala Lumpur, Malaysia: Association forComputing Machinery, 2009, pp. 512–518. ISBN: 9781605586601. DOI: 10.1145/1806338.1806435. URL: https://doi.org/10.1145/1806338.1806435.

BIBLIOGRAPHY 55
[30] Canonical Ltd. Linux Containers - LXC - Introduction. Feb. 12, 2020. URL: https://linuxcontainers.org/lxc/introduction/.
[31] Pedro Lucas et al. “NanoSen-AQM: From Sensors to Users”. Apr. 2020. URL: https://www.learntechlib.org/p/217964.
[32] Mikael Martinviita. Timeseries database in Industrial IoT and its testing tool. Pentti Kaiterankatu 1, 90570 Oulu, Finland, 2018.
[33] Subasish Mohapatra and K. Rekha. “Sensor-Cloud: A Hybrid Framework for Remote PatientMonitoring”. In: International Journal of Computer Applications 55 (Oct. 2012), pp. 7–11. DOI:10.5120/8725-2296.
[34] N. Naik. “Choice of effective messaging protocols for IoT systems: MQTT, CoAP, AMQP andHTTP”. In: 2017 IEEE International Systems Engineering Symposium (ISSE). 2017, pp. 1–7.
[35] Nicolas Nannoni. “Message-oriented Middleware for Scalable Data Analytics Architectures”.PhD thesis. KTH Information and Communication Technology School, 2015. URL: http://kth.diva-portal.org/smash/get/diva2:813137/FULLTEXT01.pdf.
[36] OASIS. MQTT Version 3.1.1. June 27, 2020. URL: http://docs.oasis-open.org/mqtt/mqtt/v3.1.1/errata01/os/mqtt-v3.1.1-errata01-os-complete.html#_Toc442180831.
[37] OASIS. MQTT Version 3.1.1. June 27, 2020. URL: http://docs.oasis-open.org.
[38] C. Perera et al. “Context Aware Computing for The Internet of Things: A Survey”. In: IEEECommunications Surveys Tutorials 16.1 (2014), pp. 414–454. DOI: 10.1109/SURV.2013.042313.00197.
[39] J. Silva et al. “A Hybrid Application for Real-Time Air Quality Monitoring”. In: 2019 5th Exper-iment International Conference (exp.at’19). 2019, pp. 270–271.
[40] J. Silva et al. “An Online Platform For Real-Time Air Quality Monitoring”. In: 2019 5th Experi-ment International Conference (exp.at’19). 2019, pp. 320–325.
[41] Vitor Silva, Marite Kirikova, and Gundars Alksnis. “Containers for Virtualization: An Overview”.In: Applied Computer Systems 23 (May 2018), pp. 21–27. DOI: 10.2478/acss-2018-0003.
[42] Apache Spark. Introduction. June 26, 2020. URL: https://spark.apache.org/.
[43] Spring. Spring Boot. Feb. 12, 2020. URL: https://spring.io/projects/spring-boot#overview.
[44] Apache Storm. Fault tolerant. 2020-06-26. URL: https : / / storm . apache . org / about /fault-tolerant.html.
[45] Apache Storm. Scalable. June 26, 2020. URL: https://storm.apache.org/about/scalable.html.
[46] EMQ Technologies. EMQ X - Cluster. Feb. 12, 2020. URL: https://docs.emqx.io/broker/latest/en/advanced/cluster.html.
[47] EMQ Technologies. EMQ X - Rule Engine. Feb. 12, 2020. URL: https://docs.emqx.io/broker/latest/en/rule/rule-engine.html.
[48] EMQ Technologies. EMQ X - Shared Subscrition. Feb. 12, 2020. URL: https://docs.emqx.io/broker/latest/en/advanced/shared-subscriptions.html.
[49] VerneMQ. Clustering - Introduction. Feb. 12, 2020. URL: https://docs.vernemq.com/clustering/introduction.

56 BIBLIOGRAPHY
[50] VerneMQ. Plugin Development - Introduction. Feb. 12, 2020. URL: https://docs.vernemq.com/plugindevelopment/introduction.
[51] VerneMQ. VerneMQ - Home. Feb. 12, 2020. URL: https://vernemq.com/.
[52] M. Yannuzzi et al. “Key ingredients in an IoT recipe: Fog Computing, Cloud computing, andmore Fog Computing”. In: 2014 IEEE 19th International Workshop on Computer Aided Mod-eling and Design of Communication Links and Networks (CAMAD). 2014, pp. 325–329. DOI:10.1109/CAMAD.2014.7033259.

Contacts:Universidade de Évora
Escola de Ciências e TecnologiaColégio Luis António Verney, Rua Romão Ramalho, n°59
7000 - 671 Évora | PortugalTel: (+351) 266 745 371
email: [email protected]