clr profiler
TRANSCRIPT
CLRProfiler
Peter SollichCommon Language Runtime Performance ArchitectMicrosoft Corporation
October 2003, updated October 2005
1
Legal Information
This is a preliminary document and may be changed substantially prior to final commercial release of the software described herein.
The information contained in this document represents the current view of Microsoft Corporation on the issues discussed as of the date of publication. Because Microsoft must respond to changing market conditions, it should not be interpreted to be a commitment on the part of Microsoft, and Microsoft cannot guarantee the accuracy of any information presented after the date of publication.
This White Paper is for informational purposes only. MICROSOFT MAKES NO WARRANTIES, EXPRESS, IMPLIED OR STATUTORY, AS TO THE INFORMATION IN THIS DOCUMENT.
Complying with all applicable copyright laws is the responsibility of the user. Without limiting the rights under copyright, no part of this document may be reproduced, stored in or introduced into a retrieval system, or transmitted in any form or by any means (electronic, mechanical, photocopying, recording, or otherwise), or for any purpose, without the express written permission of Microsoft Corporation.
Microsoft may have patents, patent applications, trademarks, copyrights, or other intellectual property rights covering subject matter in this document. Except as expressly provided in any written license agreement from Microsoft, the furnishing of this document does not give you any license to these patents, trademarks, copyrights, or other intellectual property.
2003, 2007 Microsoft Corporation. All rights reserved.
Microsoft is a registered trademark of Microsoft Corporation in the United States and/or other countries.
The names of actual companies and products mentioned herein may be the trademarks of their respective owners.
2
ContentsLegal Information.....................................................................................................................2Contents......................................................................................................................................3Overview.....................................................................................................................................4
Highlights................................................................................................................................4Lowlights................................................................................................................................4Changes in the new version....................................................................................................4Internals overview...................................................................................................................5
CLRProfiler UI...........................................................................................................................5The File Menu.........................................................................................................................6Command-line interface..........................................................................................................7Edit Menu................................................................................................................................8Views......................................................................................................................................9
Summary...........................................................................................................................10Histogram Allocated Types..............................................................................................13Histogram Relocated Types..............................................................................................15Objects by Address...........................................................................................................16Histogram by Age.............................................................................................................19Allocation Graph...............................................................................................................21Assembly Graph................................................................................................................33Function Graph.................................................................................................................33Module Graph...................................................................................................................33Class Graph.......................................................................................................................33Heap Graph.......................................................................................................................34Call Graph.........................................................................................................................40Time Line..........................................................................................................................42Comments.........................................................................................................................47Call Tree View..................................................................................................................47
Common garbage collection problems and how they are reflected in the views......................52Programs that allocate too much...........................................................................................53Holding on to memory for too long......................................................................................64Tracking down memory leaks...............................................................................................78
CLRProfiler API.......................................................................................................................92Producing reports from the command line..............................................................................100Some CLRProfiler Internals...................................................................................................103
Environment variables........................................................................................................103Log file format....................................................................................................................104
FAQ.........................................................................................................................................107
3
OverviewCLRProfiler is a tool that you can use to analyze the behavior of your managed applications. Like any such tool, it has specific strengths and weaknesses.
Highlights CLRProfiler is a tool that is focused on analyzing what is going on in the garbage
collector heap:o Which methods allocate which types of objects?o Which objects survive?o What is on the heap?o What keeps objects alive?
Additionally:o The call graph feature lets you see who is calling whom how often.o Which methods, classes, modules get pulled in by whom
The tool can profile applications, services, and ASP.NET pages. The profiled application can control profiling:
o You can add comments that can also serve as time markers.o You can turn allocation and call logging on or off.o You can trigger a heap dump.
The log files produced are self-contained – you do not need to save symbol files and the like to later analyze the log file.
There is also a command-line interface allowing log files to be produced in batch mode, and allowing you to produce text file reports.
Lowlights CLRProfiler is an intrusive tool; seeing a 10 to 100x slowdown in the application
being profiled is not unusual. Therefore, it is not the right tool to find out where time is spent – use other profilers for that.
Log files can get huge. By default, every allocation and every call is logged, which can consume gigabytes of disk space. However, allocation and call logging can be turned on and off selectively either by the application or in the CLRProfiler UI.
CLRProfiler cannot “attach” to an application that is already running.
Changes in the new version
There have been quite a few changes since the last version, including: After profiling or loading a log file, a new Summary Page gives you an overview
about the behavior of the profiled application. From the summary page, you can open the most popular views.
There are now many more command line options, allowing you to produce simple reports without any mouse click in the GUI. This is primarily useful in automatic testing.
CLRProfiler now also keeps track of GC handles, and so can be used to find GC handle leaks.
CLRProfiler has been updated to support generics.
4

The interface between the CLR and CLRProfiler has been enhanced so that CLRProfiler now has more exact information about the garbage collected heap - for example, it now knows where the boundaries between generations are, or when objects die, where before, it had to use heuristics to guess this information.
The heap graph view can now optionally show all reference paths to an object instance or group of instances - this is sometimes useful while tracking down memory leaks.
The log file format has been enhanced to convey the additional information mentioned above - for details see the "Log file format" section.
CLRProfiler now also works on x64 and IA64 systems. CLRProfiler's support for profiling ASP.NET applications and managed services has
been improved so that in most cases, profiling works fine even when not running under the SYSTEM account.
Internals overview The tool uses the public profiling interfaces that the CLR exposes. These work by
loading a COM component (implemented by "profilerOBJ.dll") that then gets called whenever a significant event happens – a method gets called, an object gets allocated, a garbage collection gets triggered, and so on.
The COM component writes information about these events into a log file (with names such as “C:\WINDOWS\Temp\pipe_1636.log”).
The GUI (CLRProfiler.exe - a Windows Forms application) analyzes the log file and displays various views.
5
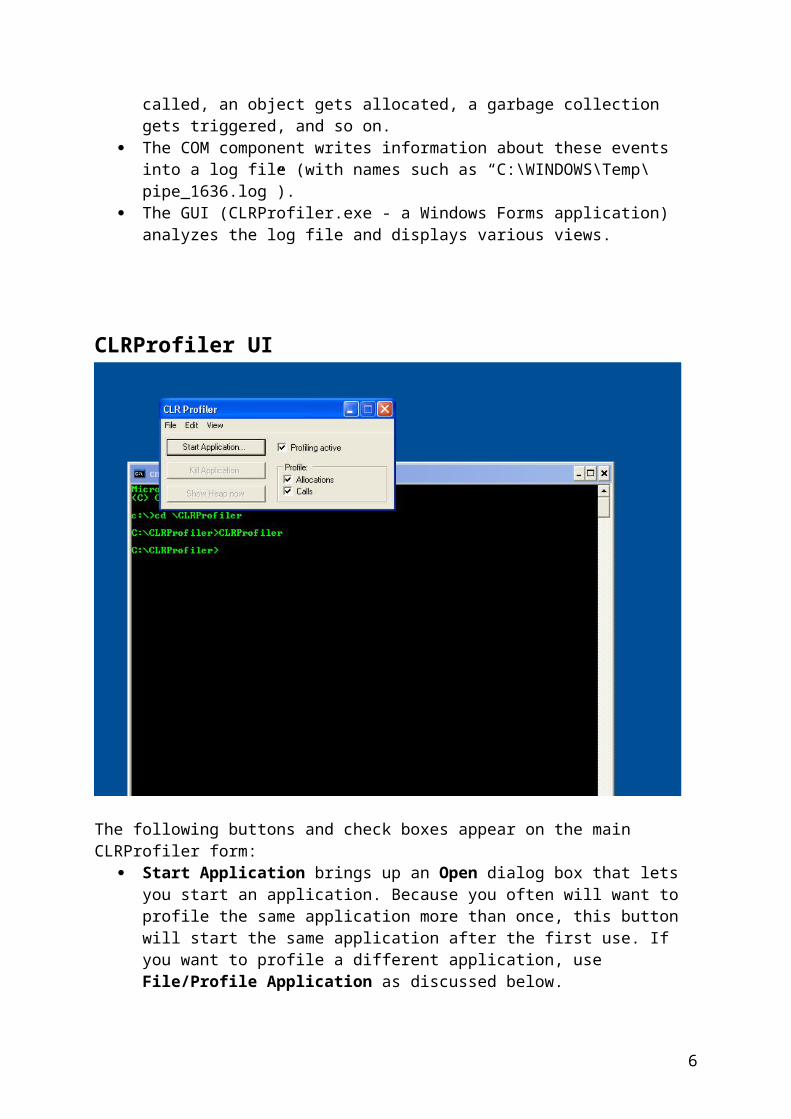
CLRProfiler UI
The following buttons and check boxes appear on the main CLRProfiler form: Start Application brings up an Open dialog box that lets you start an application.
Because you often will want to profile the same application more than once, this button will start the same application after the first use. If you want to profile a different application, use File/Profile Application as discussed below.
Kill Application lets you terminate your application. It also causes the generated log file to be loaded into CLRProfiler.
Show Heap now causes the application to do a heap dump and shows the result as a “Heap Graph”, discussed in a later section.
The Profiling active check box lets you turn profiling on and off selectively. You can do that either to save time (for example during application startup), or to profile selectively. For example, if you wanted to see what happens in your Windows Forms application when a certain button gets clicked, you would clear this box, start your application, then check the box, click your button, and then clear the box again. Another usage would be to turn this off when starting to profile your ASP.NET application, load a specific page, and then turn it on to see what gets allocated in the steady state for that specific page.
The Profile: Allocations and Profile: Calls check boxes let you turn off certain kinds of logging. For example, if you are not interested in the call graph or call tree views, you can make your application run a lot faster under the profiler (and save a lot of disk space) by turning off Profile: Calls.
6

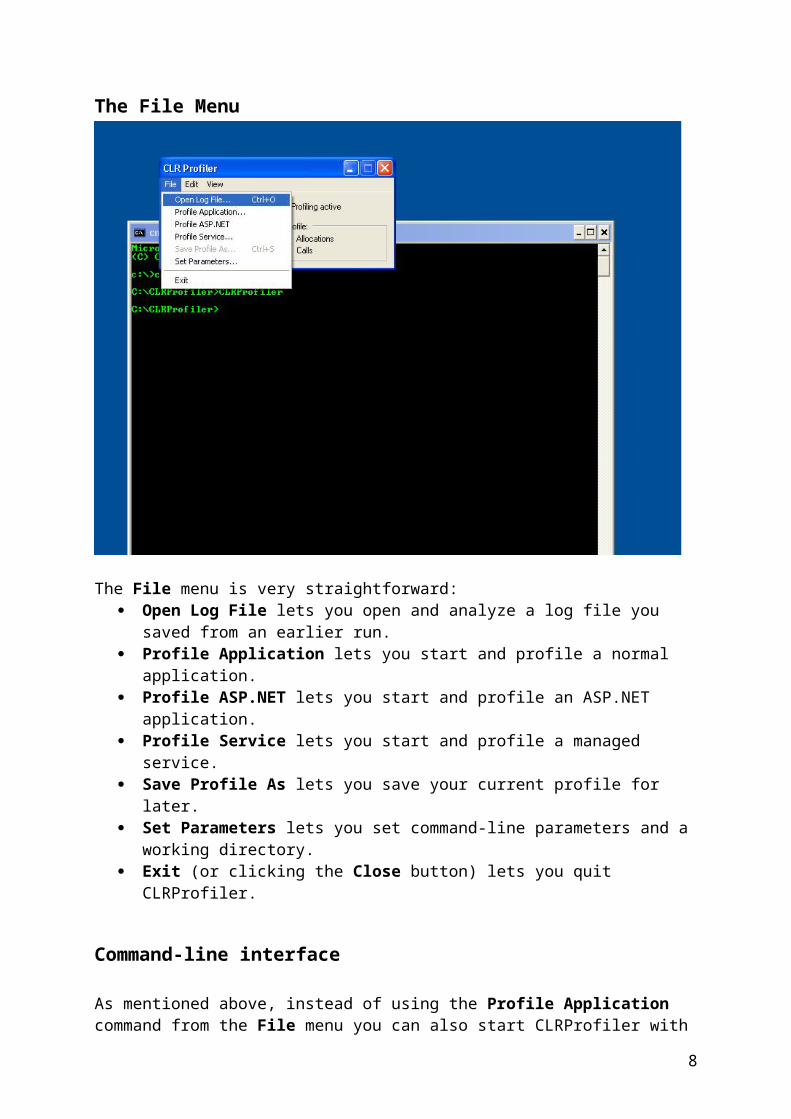
The File Menu
The File menu is very straightforward: Open Log File lets you open and analyze a log file you saved from an earlier run. Profile Application lets you start and profile a normal application. Profile ASP.NET lets you start and profile an ASP.NET application. Profile Service lets you start and profile a managed service. Save Profile As lets you save your current profile for later. Set Parameters lets you set command-line parameters and a working directory. Exit (or clicking the Close button) lets you quit CLRProfiler.
Command-line interface
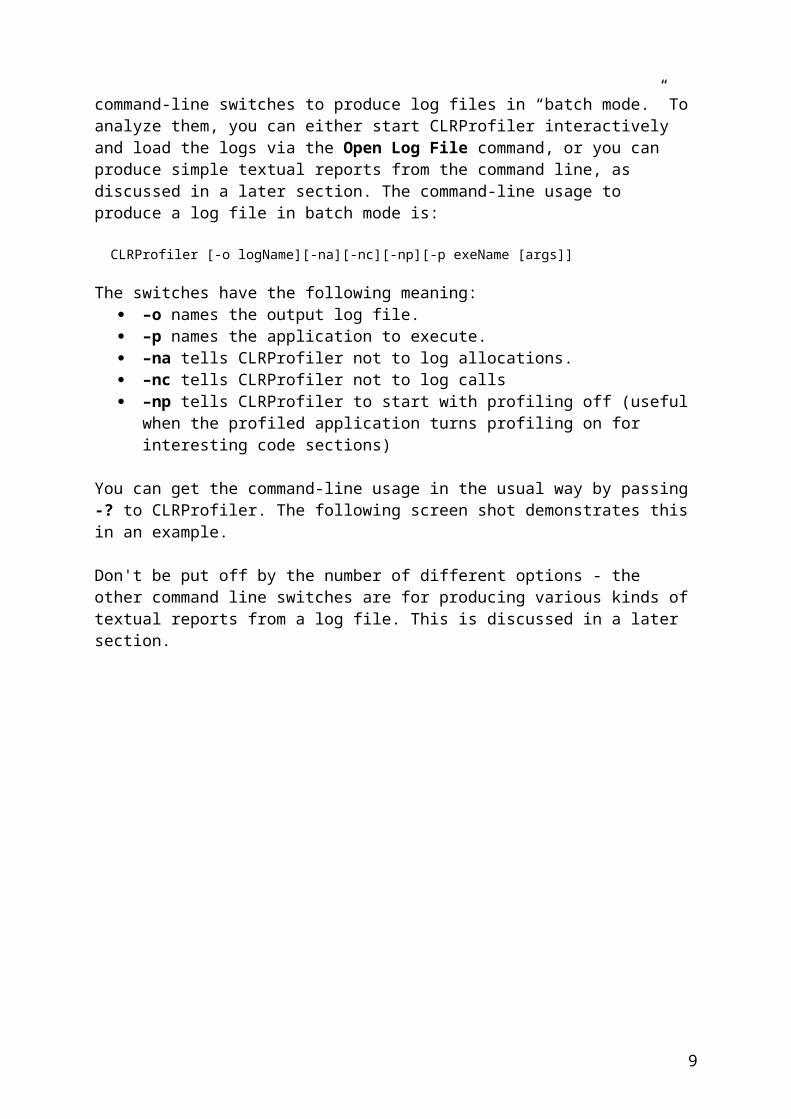
As mentioned above, instead of using the Profile Application command from the File menu you can also start CLRProfiler with command-line switches to produce log files in “batch mode.” To analyze them, you can either start CLRProfiler interactively and load the logs via the Open Log File command, or you can produce simple textual reports from the command line, as discussed in a later section. The command-line usage to produce a log file in batch mode is:
CLRProfiler [-o logName][-na][-nc][-np][-p exeName [args]]
The switches have the following meaning: –o names the output log file. –p names the application to execute. –na tells CLRProfiler not to log allocations.
7
–nc tells CLRProfiler not to log calls –np tells CLRProfiler to start with profiling off (useful when the profiled application
turns profiling on for interesting code sections)
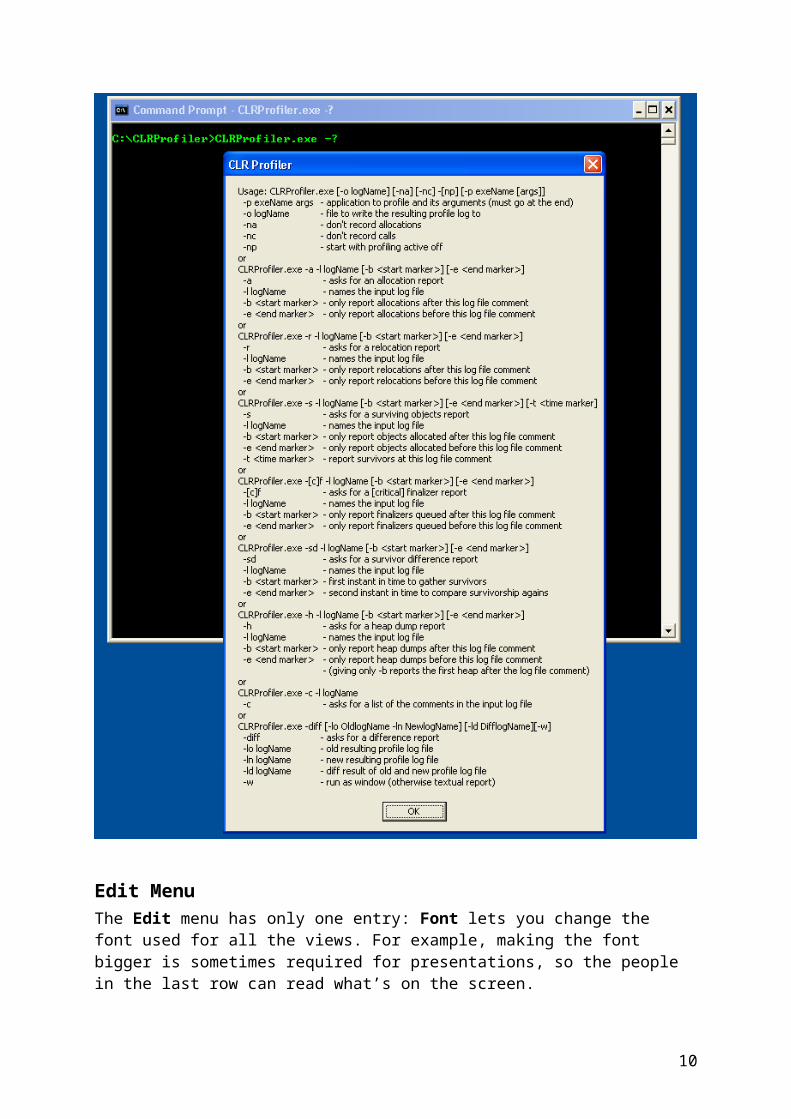
You can get the command-line usage in the usual way by passing -? to CLRProfiler. The following screen shot demonstrates this in an example.
Don't be put off by the number of different options - the other command line switches are for producing various kinds of textual reports from a log file. This is discussed in a later section.
8
Edit MenuThe Edit menu has only one entry: Font lets you change the font used for all the views. For example, making the font bigger is sometimes required for presentations, so the people in the last row can read what’s on the screen.
ViewsThe Views reachable from the View Menu and the Summary menu require a lot of explanation; the following profile of a simple demo application demonstrates almost of the views.
The demo application is a word and line counter, written in C# code in a very straightforward way, as shown below.
using System;using System.IO;
class Demo1{ public static void Main() { StreamReader r = new StreamReader("Demo1.dat"); string line; int lineCount = 0; int itemCount = 0; while ((line = r.ReadLine()) != null) { lineCount++; string[] items = line.Split(); for (int i = 0; i < items.Length; i++) { itemCount++; // Whatever... } } r.Close();
Console.WriteLine("{0} lines, {1} items", lineCount, itemCount); }}
This simply opens a text file, Demo1.dat, initializes counters for lines and items (such as words), and then iterates over each line, splits it into pieces and increments the counters appropriately. At the end, it closes the file and reports the results.
The text file the demo reads for this example consists of 2,000 lines, each line simply repeating “0123456789” ten times. So, there are 2,000 lines and 20,000 “words”. This adds up to exactly 222,000 characters.
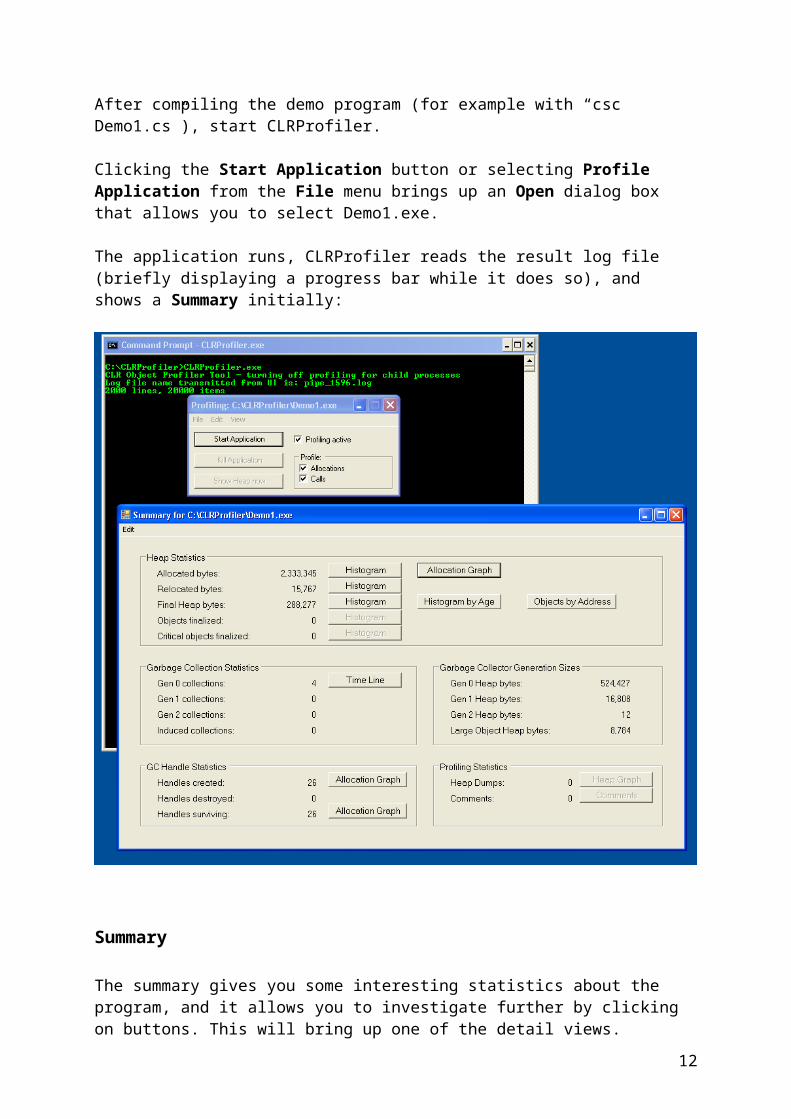
After compiling the demo program (for example with “csc Demo1.cs”), start CLRProfiler.
Clicking the Start Application button or selecting Profile Application from the File menu brings up an Open dialog box that allows you to select Demo1.exe.
9
The application runs, CLRProfiler reads the result log file (briefly displaying a progress bar while it does so), and shows a Summary initially:
Summary
The summary gives you some interesting statistics about the program, and it allows you to investigate further by clicking on buttons. This will bring up one of the detail views.
The section labeled "Heap Statistics" gives statistics about the object allocation and retention behavior of the program:
Allocated bytes is simply the sum of the sizes of all the objects the program allocated. This also includes some objects the CLR allocated on behalf of the program.
Relocated bytes is the sum of the sizes of the objects the garbage collector moved during the program run. These are longer lived objects that get compacted as the program is running.
Final Heap bytes is the sum of the sizes of all the objects in the garbage collected heap at the end of the program run. This may include some objects that are no longer referenced, but that have not yet been cleaned up by the garbage collector.
10
Objects finalized is simply the number of objects that were finalized, i.e. whose finalizer actually ran. This is as opposed to the object being cleaned up by calling its Dispose method explicitly or as part of a C# using statement.
Critical objects finalized are a subcategory of the above. Version 2.0 of the .NET Framework lets you mark certain finalizers as especially important to run, for example those for objects encapsulating important system resources.
The buttons labeled "Histogram" bring up histogram views of the objects allocated, relocated etc. The way these histograms work is explained in more detail below, as are the views shown by the "Allocation Graph", "Histogram by Age" and "Objects by Address" buttons.
The section labeled "Garbage Collection Statistics" gives statistics about the garbage collections that happened during the program run. The garbage collector in the .NET CLR is generational, which means that many garbage collections only consider the newest objects on the heap. These are referred to as generation 0 collections and are quite fast. Generation 1 collections consider a bigger portion of the heap and are thus a bit slower, while generation 2 collections (also referred to as "full collections") consider the complete heap and can take a significant amount of time if the heap is large. Thus, you want to see a relatively small number of generation 2 collections compared to gen 1 and gen 0 collections. Finally, "induced collections" are the collections triggered outside of the garbage collector, for example by calling GC.Collect from the application. The view reachable via the "Time Line" button is explained in detail below.
The section "Garbage Collector Generation Sizes" gives the sizes of the various garbage collector generations. One additional twist is that there is a special area for large objects, called the "Large Object Heap". Note that these numbers are averages over the program run which may not reflect the situation at the end of the run.
The section "GC Handle Statistics" lists how many GC handles have been created, destroyed, and how many are surviving at the end of the program run. If the last number is particularly large, you may have a GC handle leak that you can investigate by clicking on the "Allocation Graph" button next to the number.
Finally, the section "Profiling Statistics" summarizes events having to do with the profiling run itself:
"Heap Dumps" simply shows the number of heap dumps triggered either by the profiler (by clicking on the "Show Heap now" button), or by the profiled application (by calling the DumpHeap() method in the CLRProfiler API).
"Comments" shows the number of comments added to the log file by code in the application (by calling the LogWriteLine method in the CLRProfiler API).
The "Heap Graph" and "Comments" views reachable via the buttons are again explained below.
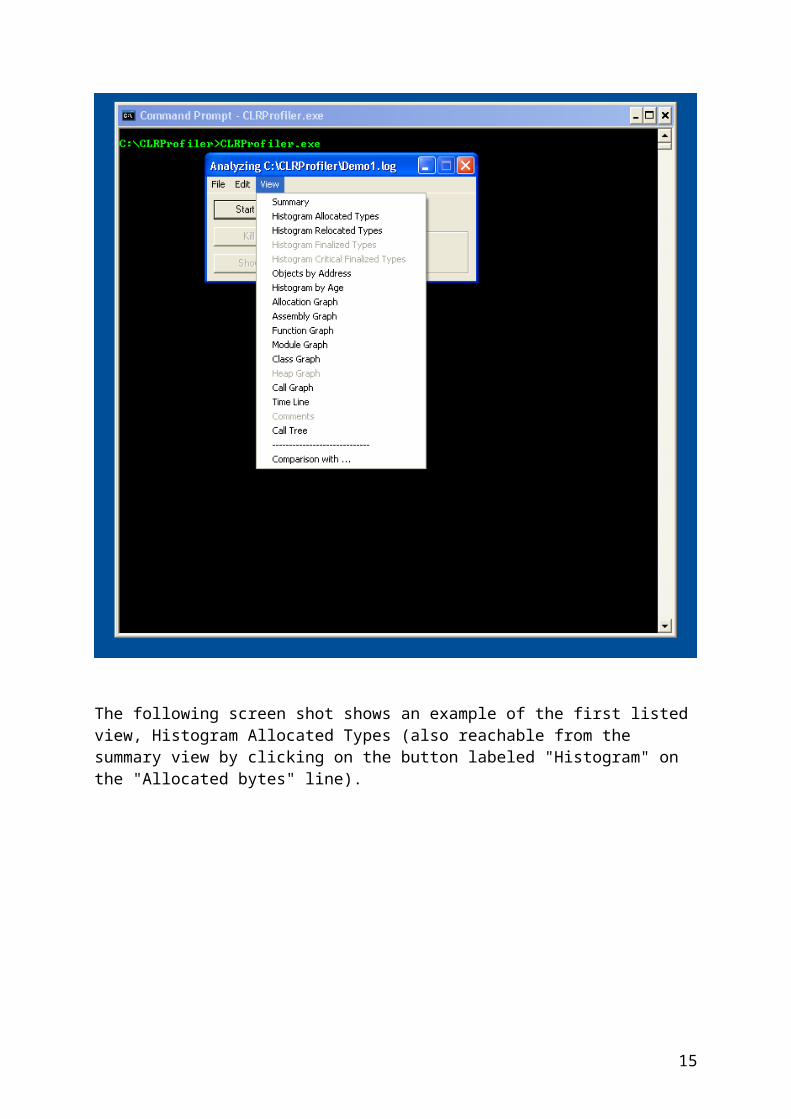
Instead of clicking on one of the buttons in the summary, you can also bring up one of the views by choosing from the View menu, as shown in the following screen shot.
11
The following screen shot shows an example of the first listed view, Histogram Allocated Types (also reachable from the summary view by clicking on the button labeled "Histogram" on the "Allocated bytes" line).
12
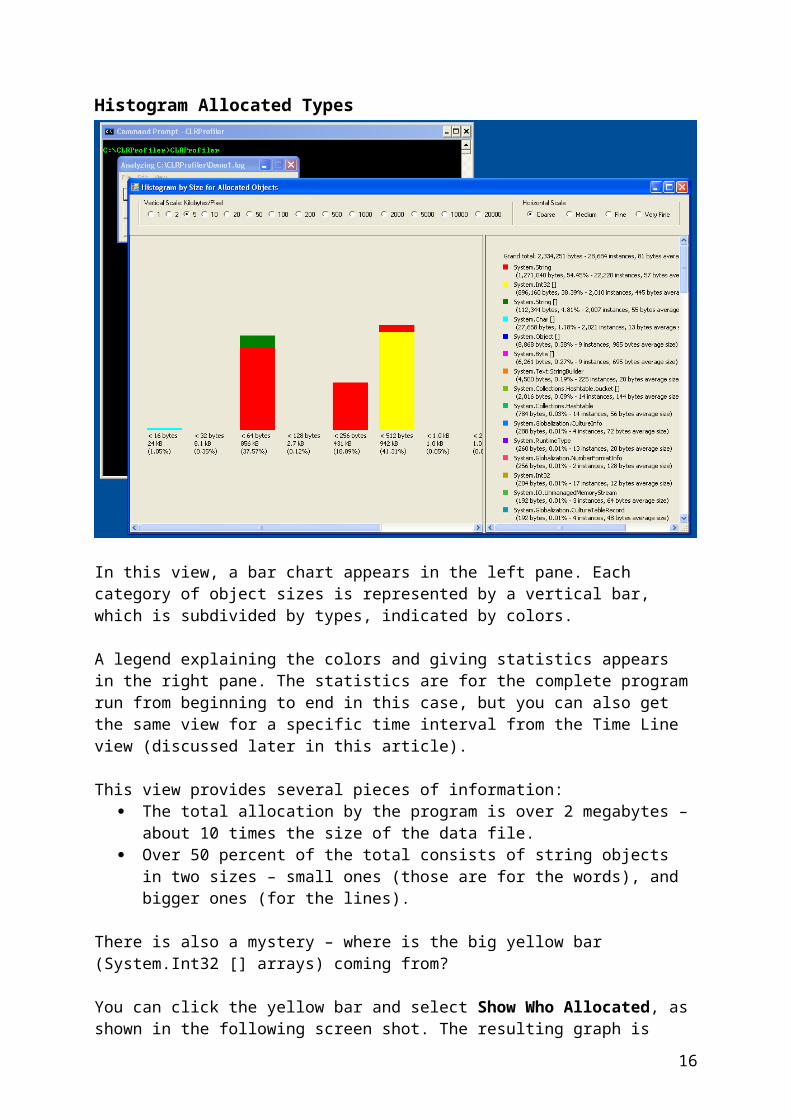
Histogram Allocated Types
In this view, a bar chart appears in the left pane. Each category of object sizes is represented by a vertical bar, which is subdivided by types, indicated by colors.
A legend explaining the colors and giving statistics appears in the right pane. The statistics are for the complete program run from beginning to end in this case, but you can also get the same view for a specific time interval from the Time Line view (discussed later in this article).
This view provides several pieces of information: The total allocation by the program is over 2 megabytes – about 10 times the size of
the data file. Over 50 percent of the total consists of string objects in two sizes – small ones (those
are for the words), and bigger ones (for the lines).
There is also a mystery – where is the big yellow bar (System.Int32 [] arrays) coming from?
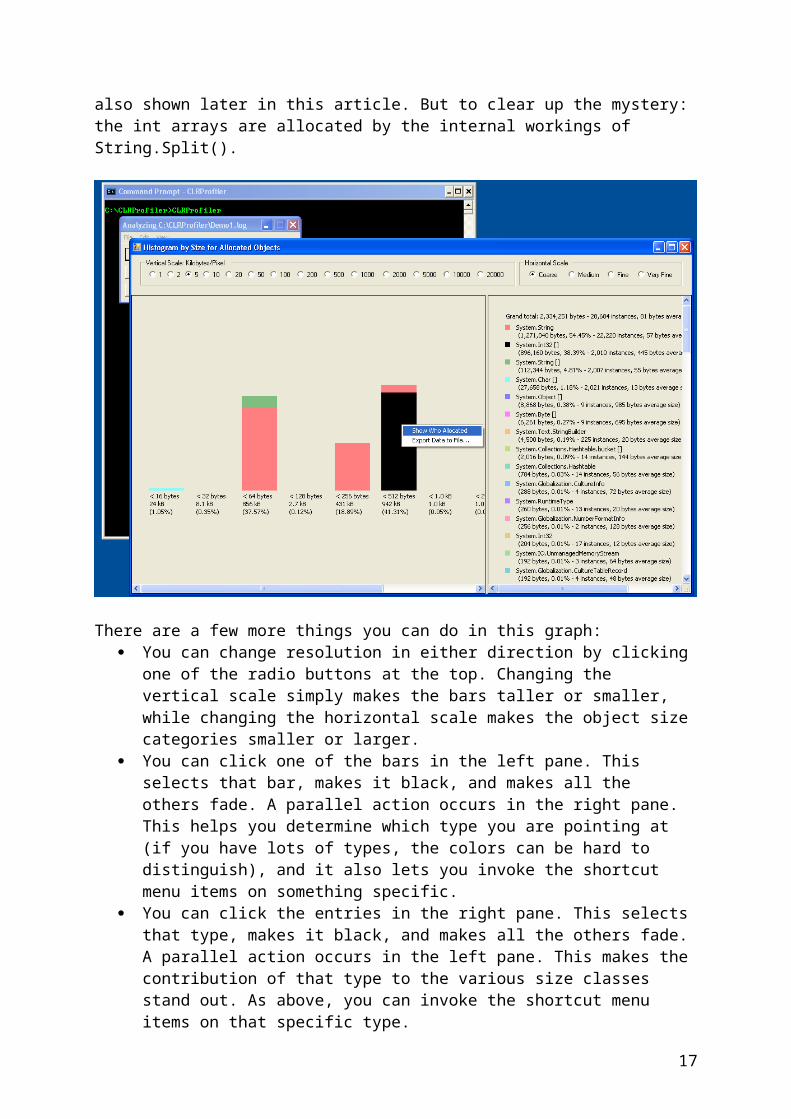
You can click the yellow bar and select Show Who Allocated, as shown in the following screen shot. The resulting graph is also shown later in this article. But to clear up the mystery: the int arrays are allocated by the internal workings of String.Split().
13
There are a few more things you can do in this graph: You can change resolution in either direction by clicking one of the radio buttons at
the top. Changing the vertical scale simply makes the bars taller or smaller, while changing the horizontal scale makes the object size categories smaller or larger.
You can click one of the bars in the left pane. This selects that bar, makes it black, and makes all the others fade. A parallel action occurs in the right pane. This helps you determine which type you are pointing at (if you have lots of types, the colors can be hard to distinguish), and it also lets you invoke the shortcut menu items on something specific.
You can click the entries in the right pane. This selects that type, makes it black, and makes all the others fade. A parallel action occurs in the left pane. This makes the contribution of that type to the various size classes stand out. As above, you can invoke the shortcut menu items on that specific type.
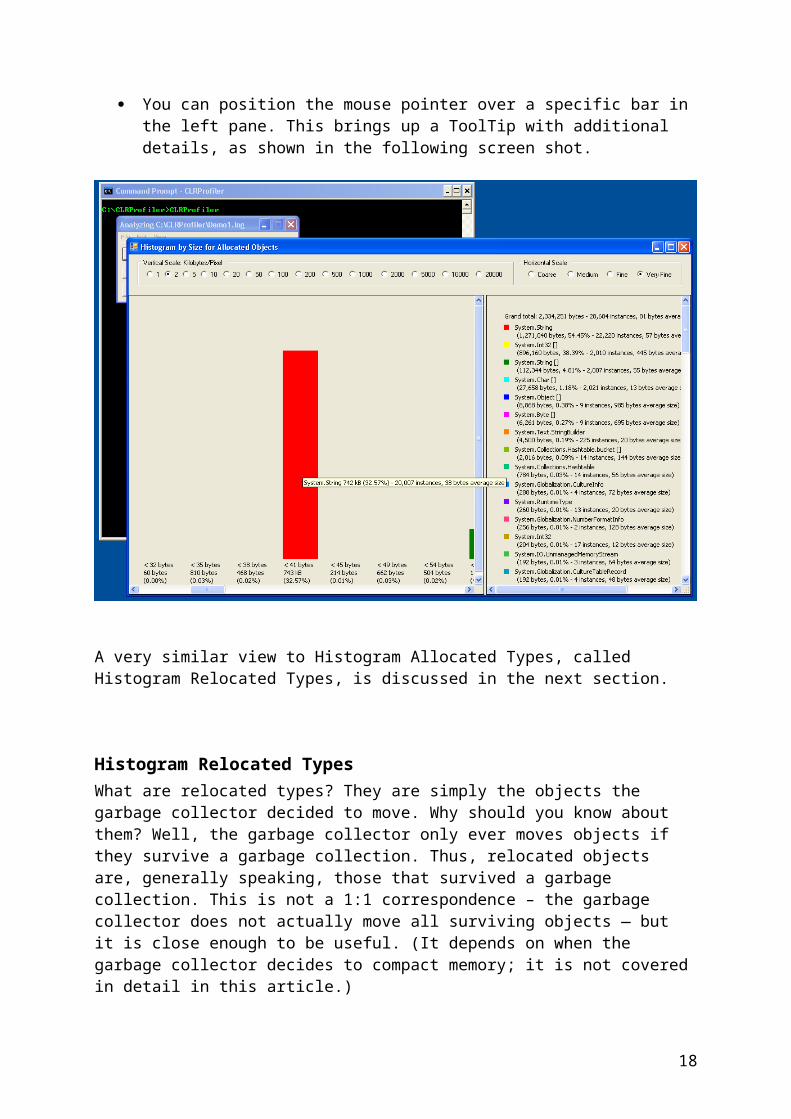
You can position the mouse pointer over a specific bar in the left pane. This brings up a ToolTip with additional details, as shown in the following screen shot.
14
A very similar view to Histogram Allocated Types, called Histogram Relocated Types, is discussed in the next section.
Histogram Relocated TypesWhat are relocated types? They are simply the objects the garbage collector decided to move. Why should you know about them? Well, the garbage collector only ever moves objects if they survive a garbage collection. Thus, relocated objects are, generally speaking, those that survived a garbage collection. This is not a 1:1 correspondence – the garbage collector does not actually move all surviving objects — but it is close enough to be useful. (It depends on when the garbage collector decides to compact memory; it is not covered in detail in this article.)
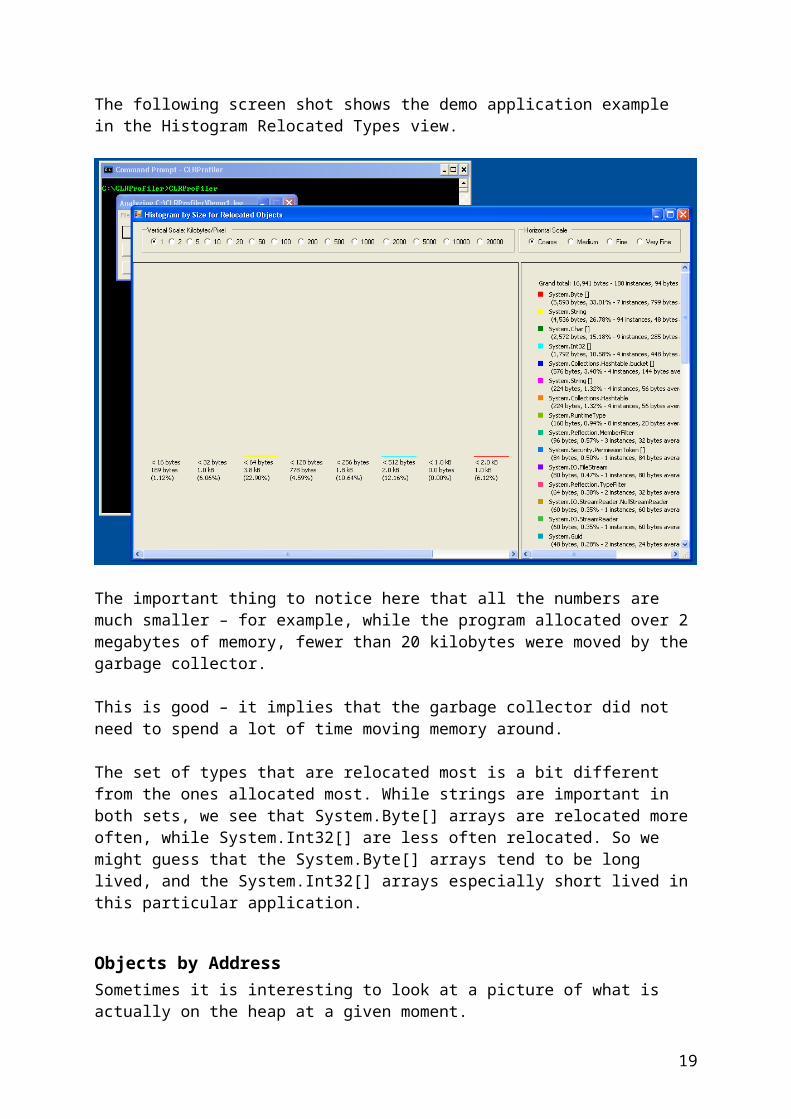
The following screen shot shows the demo application example in the Histogram Relocated Types view.
15
The important thing to notice here that all the numbers are much smaller – for example, while the program allocated over 2 megabytes of memory, fewer than 20 kilobytes were moved by the garbage collector.
This is good – it implies that the garbage collector did not need to spend a lot of time moving memory around.
The set of types that are relocated most is a bit different from the ones allocated most. While strings are important in both sets, we see that System.Byte[] arrays are relocated more often, while System.Int32[] are less often relocated. So we might guess that the System.Byte[] arrays tend to be long lived, and the System.Int32[] arrays especially short lived in this particular application.
Objects by AddressSometimes it is interesting to look at a picture of what is actually on the heap at a given moment.
This is what the Objects by Address view provides. By default, you get the state of the heap at the end of the program run, but you can also select a moment in the Time Line view (discussed below), and get the state at this moment.
This view can help you develop some intuition about what your application actually does. Some applications operate in different phases, and these are often reflected in the heap as layers composed of different objects. Those look different, and you get to do a bit of “archeology” on your heap. Just as in real archeology, the bottom layers are the older ones.
The following screen shot shows the demo application in Objects by Address view.
16
First of all, in the left pane a vertical bar appears for each contiguous address range where the garbage collector stores objects. You will typically see at least two of these because there is a separate heap for large objects.
Within each bar, addresses increase from left to right, and from bottom to top. Each pixel within the bar thus corresponds to a specific address. The type of object that is stored at each address determines the color of the pixel. Similar to the histogram views discussed above, the colors are listed along with various statistics in the right pane.
The radio buttons at the top let you control how many bytes are represented by one pixel on the screen, and also how wide (in pixels) each address range bar is drawn. This is useful for either getting a broad overview or details in a specific address range.
To the left of each bar, you see heap addresses listed (the dots in the addresses are just for easier reading, in case you wonder), while on the right side you see the limits of each garbage collector generation. In this example, you can see that generation 0 (the youngest generation) is mostly composed of System.String and System.Int32 [] objects. However, very few of these ever survive a garbage collection and get promoted to generation 1. The small bar on the right side is the so called Large Object Heap, which is not technically a generation, but is collected together with generation 2. It is denoted by the letter "LOH" in the screen shot below.
If you position the mouse pointer over one of the bars in the left pane, a ToolTip appears that provides you with details about the address of an object, its size and its age.
In the screen shot below, part of the left bar in the left pane is selected – you can do this by dragging the mouse. The right pane then provides you with statistics about the objects inside the selection.
17
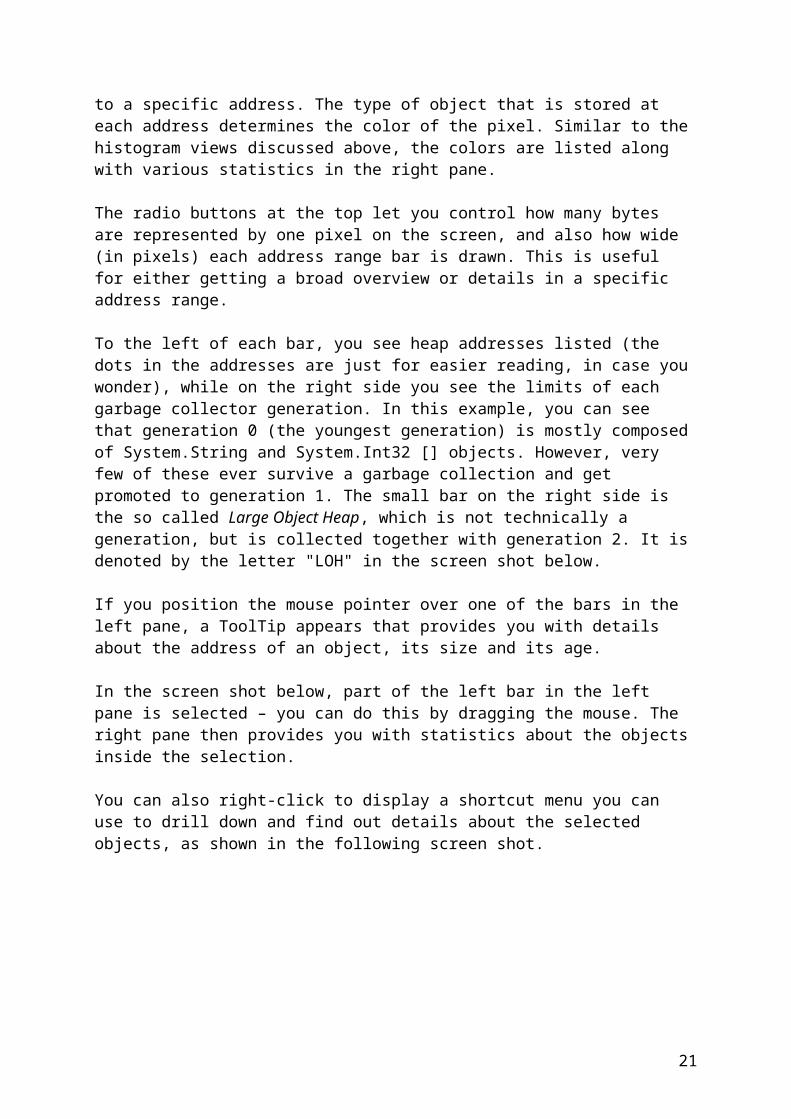
You can also right-click to display a shortcut menu you can use to drill down and find out details about the selected objects, as shown in the following screen shot.
With the shortcut menu, you can: Find out which methods allocated the objects that you selected. The Show Who
Allocated command gets an allocation graph (discussed later in this article) for just those objects.
Get a histogram of the selected objects by types and sizes, similar to the Histogram Allocated Types view discussed above.
Get a list of all the objects as a text file (a .csv file suitable for import into Microsoft Excel). For each object, you get the address, size, type, age, and the call stack that allocated it.
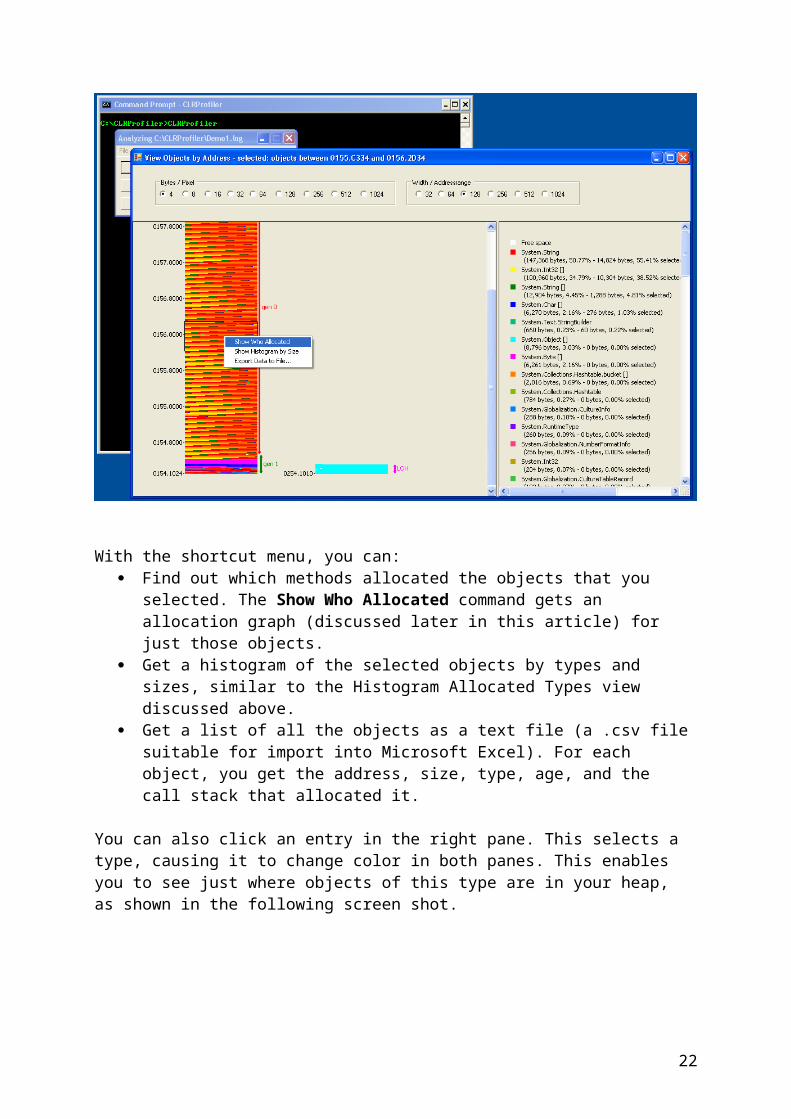
You can also click an entry in the right pane. This selects a type, causing it to change color in both panes. This enables you to see just where objects of this type are in your heap, as shown in the following screen shot.
18
In this example, System.Int32 [] was selected. The same shortcut menu items apply. Thus, you can find out who allocated all the System.Int32 [] objects in the address range you selected.
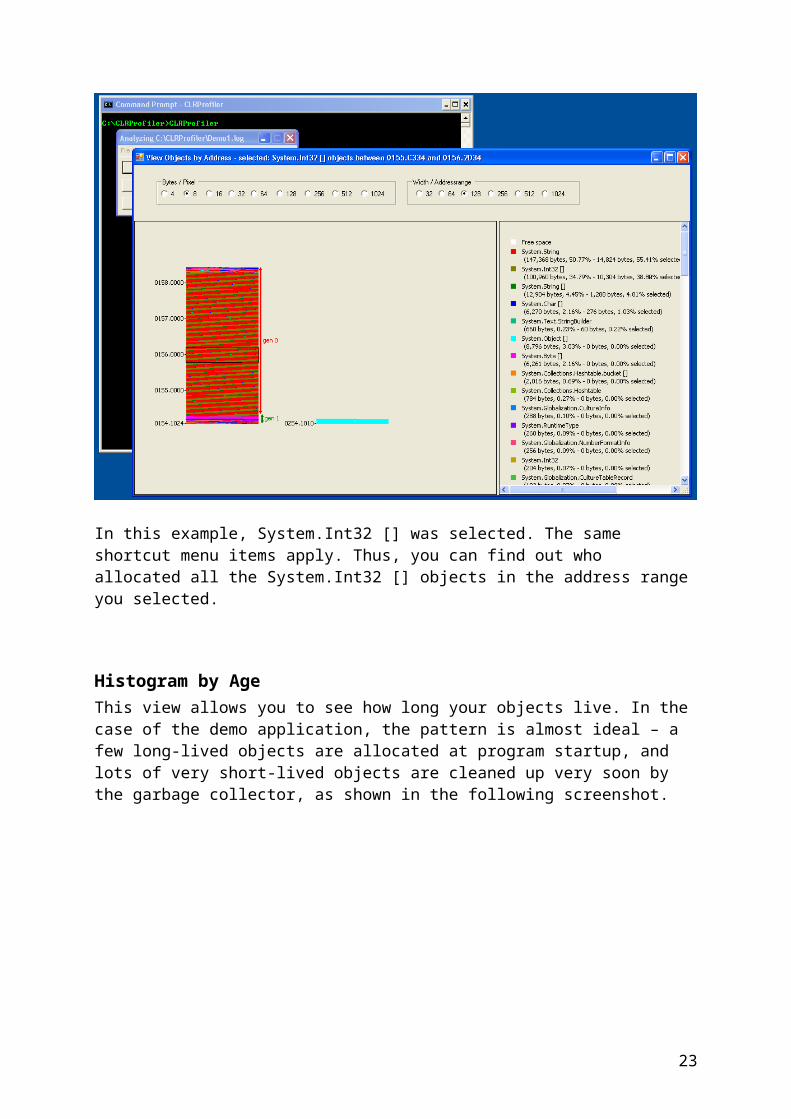
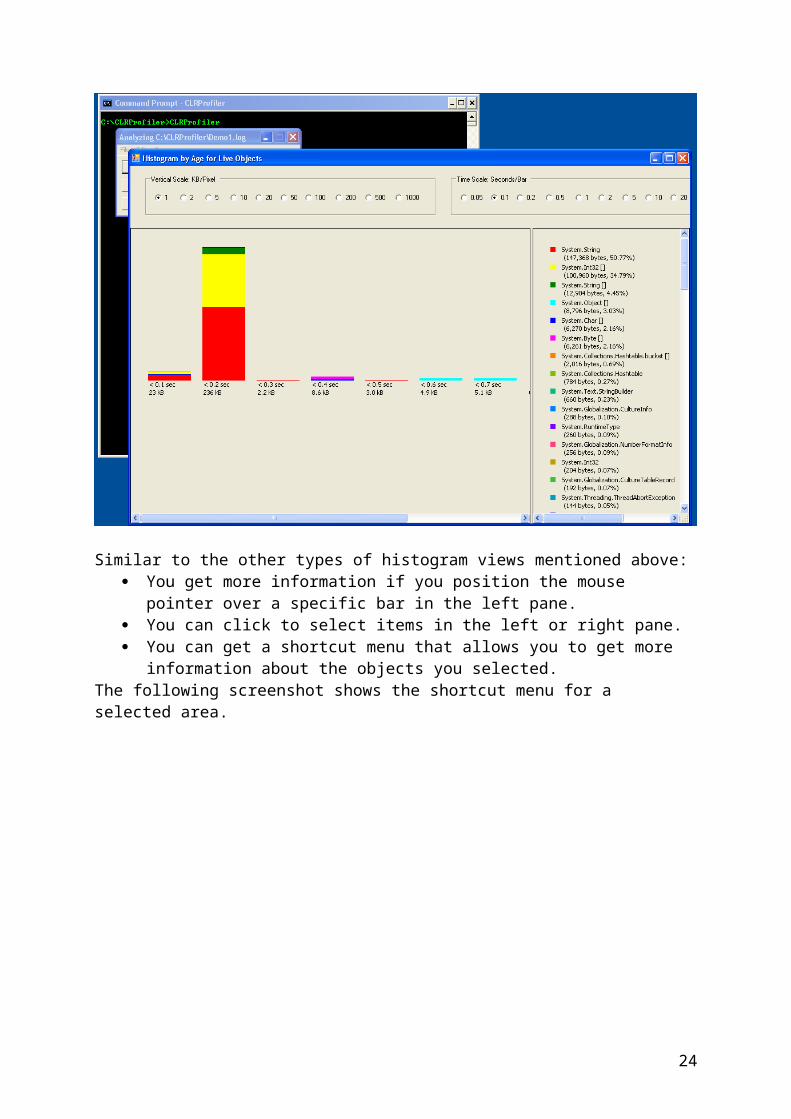
Histogram by AgeThis view allows you to see how long your objects live. In the case of the demo application, the pattern is almost ideal – a few long-lived objects are allocated at program startup, and lots of very short-lived objects are cleaned up very soon by the garbage collector, as shown in the following screenshot.
19

Similar to the other types of histogram views mentioned above: You get more information if you position the mouse pointer over a specific bar in the
left pane. You can click to select items in the left or right pane. You can get a shortcut menu that allows you to get more information about the
objects you selected.The following screenshot shows the shortcut menu for a selected area.
20
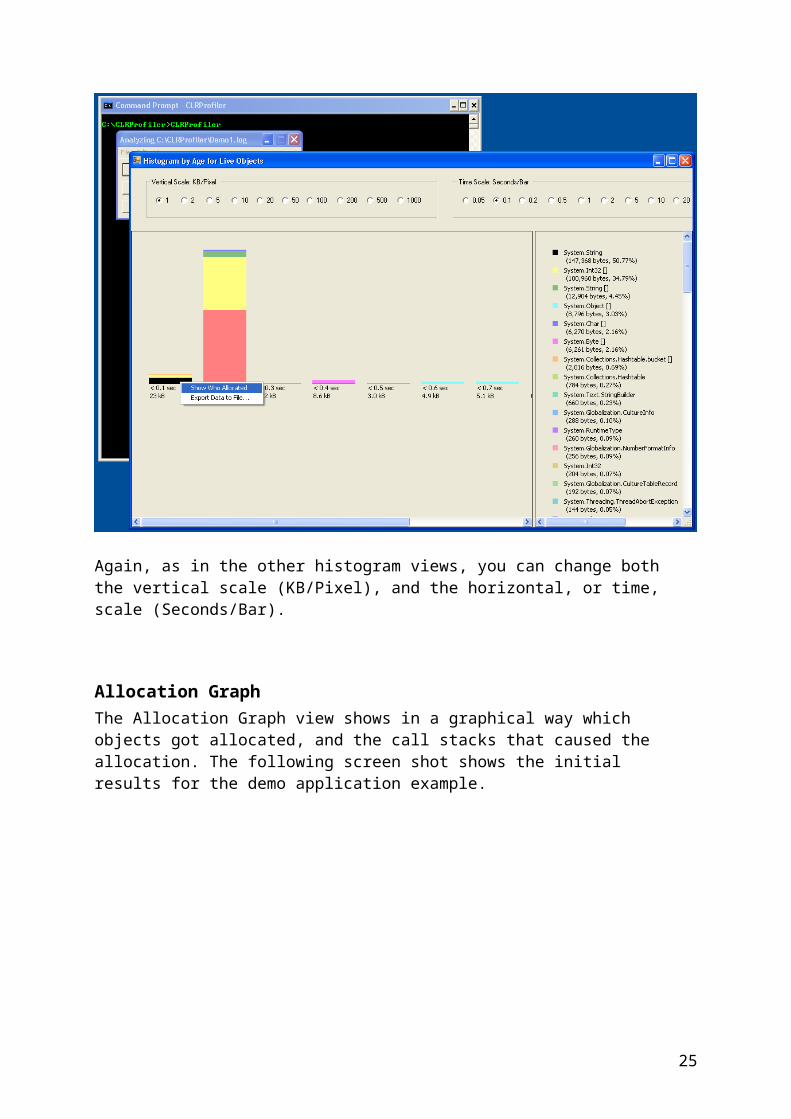
Again, as in the other histogram views, you can change both the vertical scale (KB/Pixel), and the horizontal, or time, scale (Seconds/Bar).
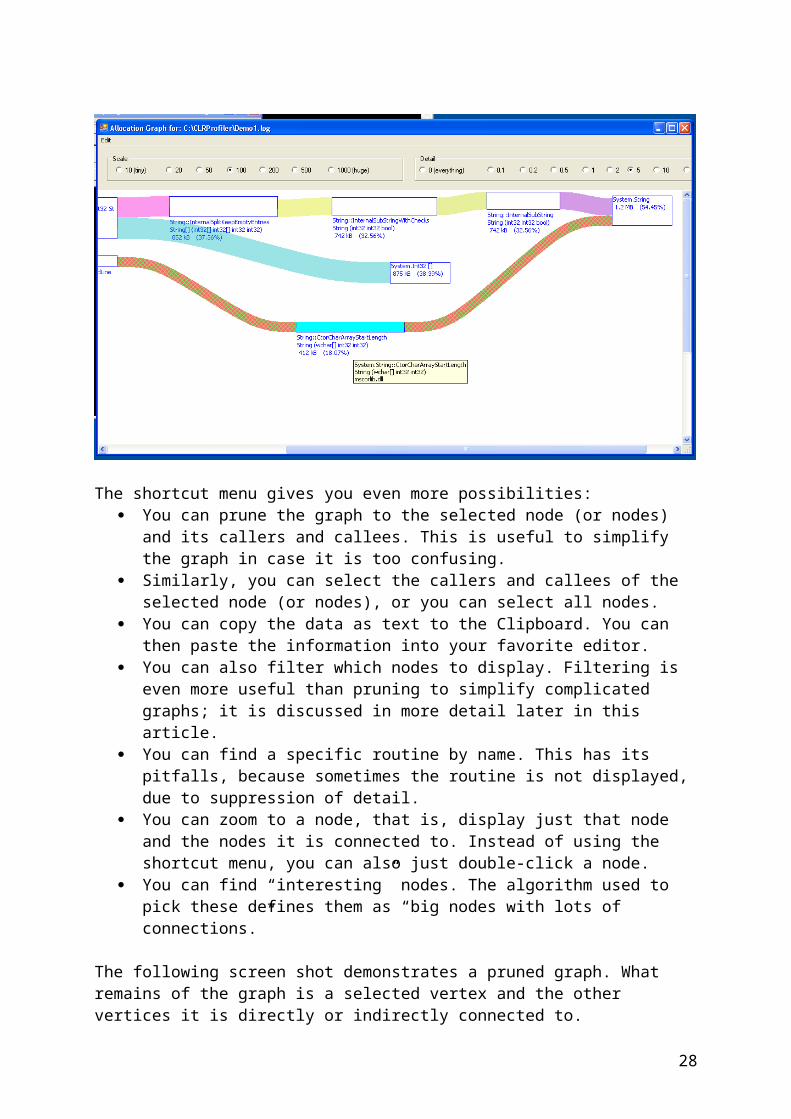
Allocation GraphThe Allocation Graph view shows in a graphical way which objects got allocated, and the call stacks that caused the allocation. The following screen shot shows the initial results for the demo application example.
21
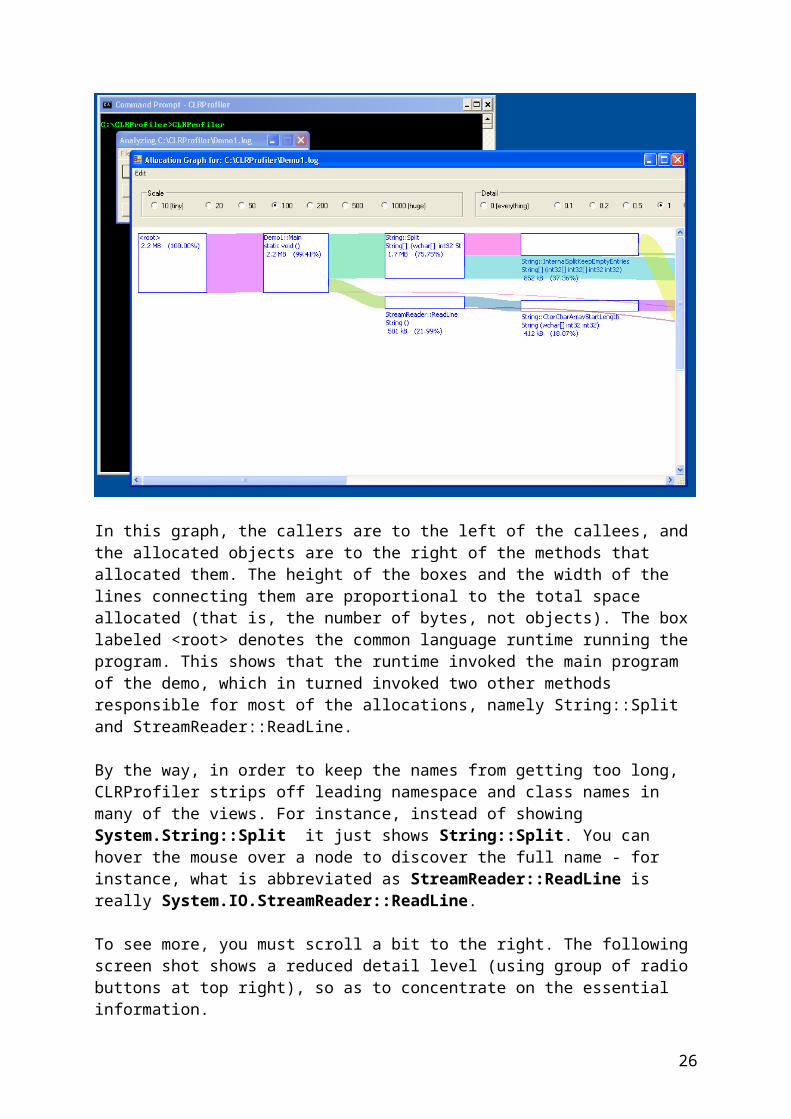
In this graph, the callers are to the left of the callees, and the allocated objects are to the right of the methods that allocated them. The height of the boxes and the width of the lines connecting them are proportional to the total space allocated (that is, the number of bytes, not objects). The box labeled <root> denotes the common language runtime running the program. This shows that the runtime invoked the main program of the demo, which in turned invoked two other methods responsible for most of the allocations, namely String::Split and StreamReader::ReadLine.
By the way, in order to keep the names from getting too long, CLRProfiler strips off leading namespace and class names in many of the views. For instance, instead of showing System.String::Split it just shows String::Split. You can hover the mouse over a node to discover the full name - for instance, what is abbreviated as StreamReader::ReadLine is really System.IO.StreamReader::ReadLine.
To see more, you must scroll a bit to the right. The following screen shot shows a reduced detail level (using group of radio buttons at top right), so as to concentrate on the essential information.
22
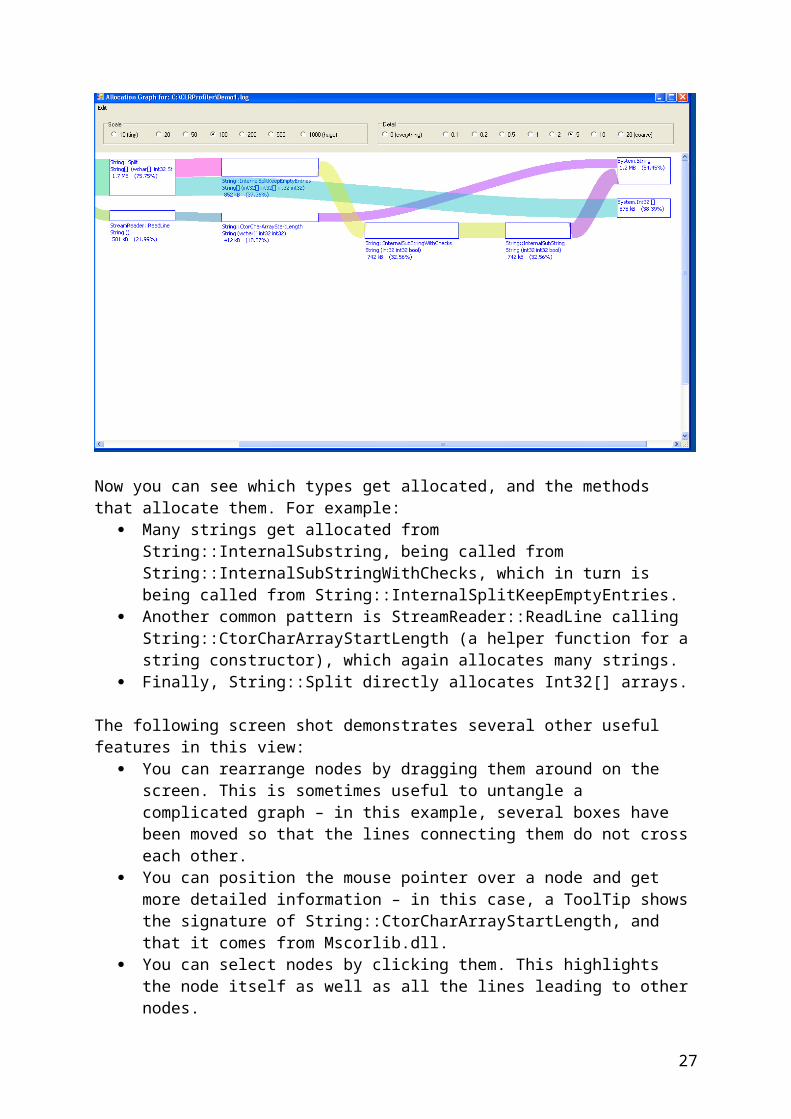
Now you can see which types get allocated, and the methods that allocate them. For example: Many strings get allocated from String::InternalSubstring, being called from
String::InternalSubStringWithChecks, which in turn is being called from String::InternalSplitKeepEmptyEntries.
Another common pattern is StreamReader::ReadLine calling String::CtorCharArrayStartLength (a helper function for a string constructor), which again allocates many strings.
Finally, String::Split directly allocates Int32[] arrays.
The following screen shot demonstrates several other useful features in this view: You can rearrange nodes by dragging them around on the screen. This is sometimes
useful to untangle a complicated graph – in this example, several boxes have been moved so that the lines connecting them do not cross each other.
You can position the mouse pointer over a node and get more detailed information – in this case, a ToolTip shows the signature of String::CtorCharArrayStartLength, and that it comes from Mscorlib.dll.
You can select nodes by clicking them. This highlights the node itself as well as all the lines leading to other nodes.
23
The shortcut menu gives you even more possibilities: You can prune the graph to the selected node (or nodes) and its callers and callees.
This is useful to simplify the graph in case it is too confusing. Similarly, you can select the callers and callees of the selected node (or nodes), or you
can select all nodes. You can copy the data as text to the Clipboard. You can then paste the information
into your favorite editor. You can also filter which nodes to display. Filtering is even more useful than pruning
to simplify complicated graphs; it is discussed in more detail later in this article. You can find a specific routine by name. This has its pitfalls, because sometimes the
routine is not displayed, due to suppression of detail. You can zoom to a node, that is, display just that node and the nodes it is connected to.
Instead of using the shortcut menu, you can also just double-click a node. You can find “interesting” nodes. The algorithm used to pick these defines them as
“big nodes with lots of connections.”
The following screen shot demonstrates a pruned graph. What remains of the graph is a selected vertex and the other vertices it is directly or indirectly connected to.
24
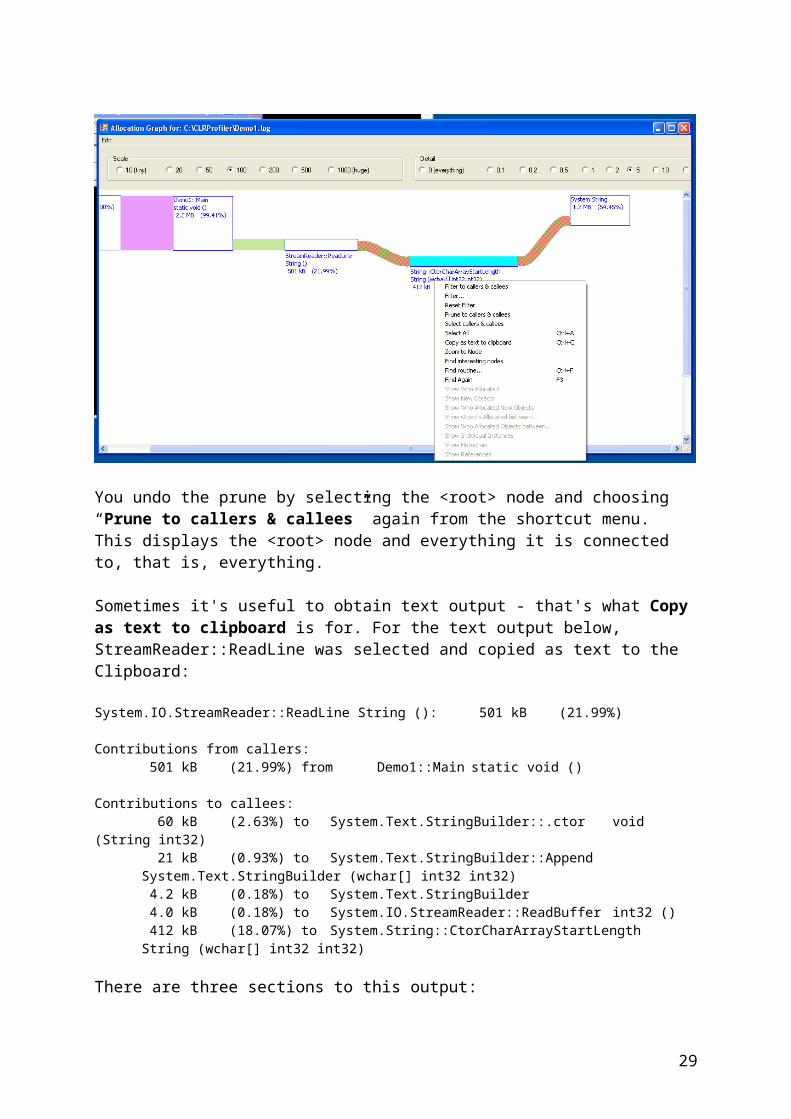
You undo the prune by selecting the <root> node and choosing “Prune to callers & callees” again from the shortcut menu. This displays the <root> node and everything it is connected to, that is, everything.
Sometimes it's useful to obtain text output - that's what Copy as text to clipboard is for. For the text output below, StreamReader::ReadLine was selected and copied as text to the Clipboard:
System.IO.StreamReader::ReadLine String (): 501 kB (21.99%)
Contributions from callers: 501 kB (21.99%) from Demo1::Main static void ()
Contributions to callees: 60 kB (2.63%) to System.Text.StringBuilder::.ctor void
(String int32) 21 kB (0.93%) to System.Text.StringBuilder::AppendSystem.Text.StringBuilder (wchar[] int32 int32) 4.2 kB (0.18%) to System.Text.StringBuilder 4.0 kB (0.18%) to System.IO.StreamReader::ReadBuffer int32 () 412 kB (18.07%) to System.String::CtorCharArrayStartLengthString (wchar[] int32 int32)
There are three sections to this output: First, the routine itself is listed by its complete name and signature, followed by its
contribution to the total allocation by the program. Then, the callers are listed in order of decreasing contribution. This is not what they
themselves allocate, but what they contribute by calling the selected routine. Lastly, the callees of the selected routine are listed.
If you select more than one node, you get abbreviated output:
<root> : 2.2 MB (100.00%) Demo1::Main static void (): 2.2 MB (99.41%)
25
System.String::Split String[] (wchar[] int32 System.StringSplitOptions): 1.7 MB (75.75%)
System.IO.StreamReader::ReadLine String (): 501 kB (21.99%) System.String::InternalSplitKeepEmptyEntries String[] (int32[] int32[] int32 int32): 852 kB (37.36%) System.String::CtorCharArrayStartLength String (wchar[] int32 int32):
412 kB (18.07%) System.String::InternalSubStringWithChecks String (int32 int32 bool):
742 kB (32.56%) System.String::InternalSubString String (int32 int32 bool): 742 kB (32.56%) System.String : 1.2 MB (54.45%) System.Int32 [] : 875 kB (38.39%)
The “detail level” still applies, so this output only shows vertices that are also visible in the graph.
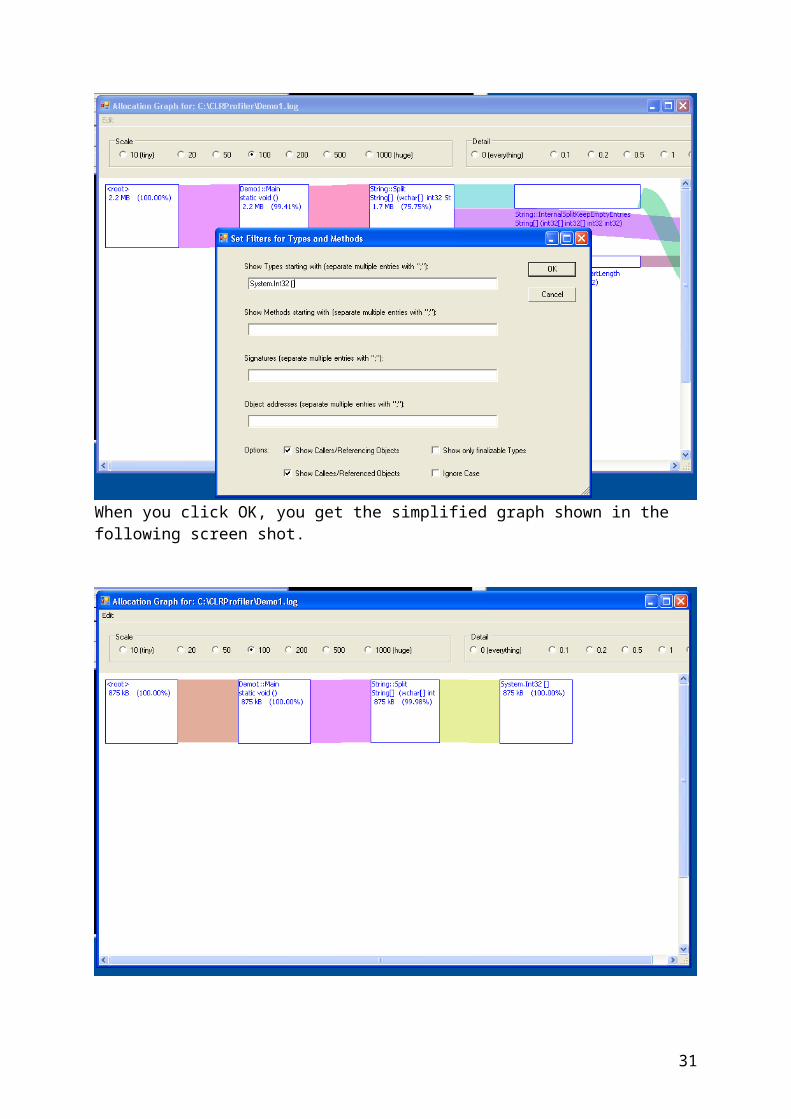
As mentioned above, filtering is important to simplify complicated graphs.
You can filter on both types and methods. For example, if you wanted to find out only who allocates all the System.Int32 [] arrays, you would enter the filter shown in the following screen shot.
When you click OK, you get the simplified graph shown in the following screen shot.
26
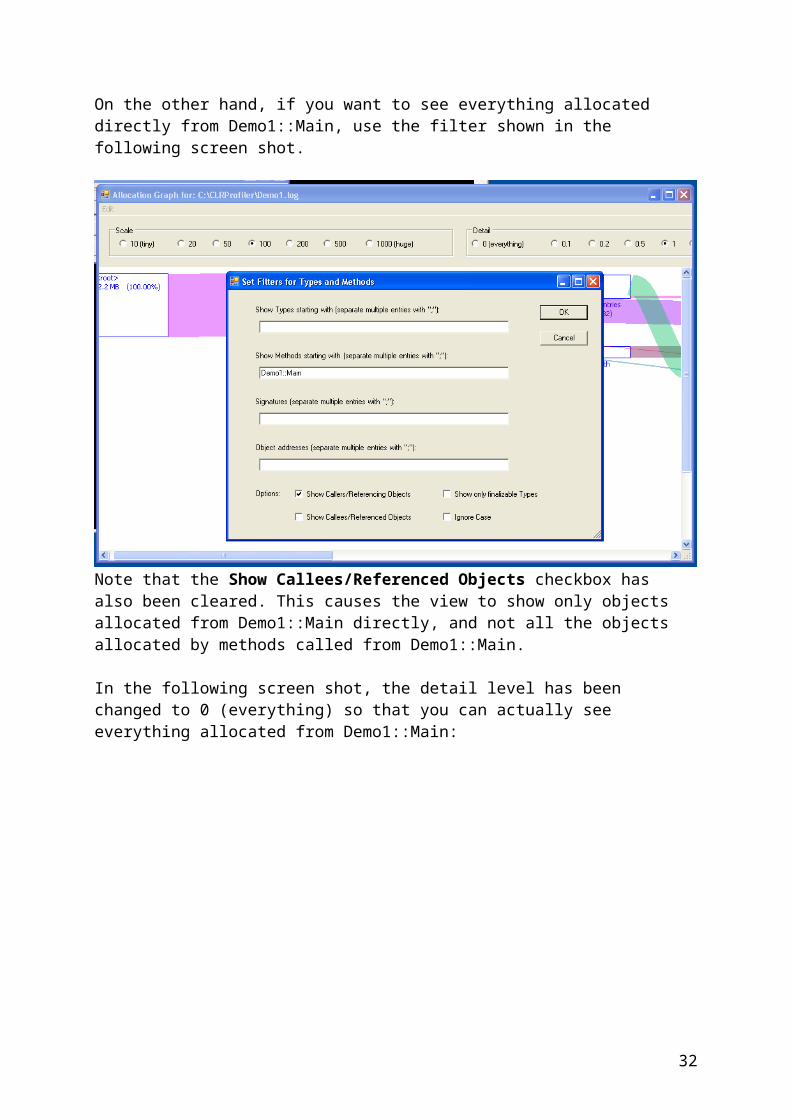
On the other hand, if you want to see everything allocated directly from Demo1::Main, use the filter shown in the following screen shot.
Note that the Show Callees/Referenced Objects checkbox has also been cleared. This causes the view to show only objects allocated from Demo1::Main directly, and not all the objects allocated by methods called from Demo1::Main.
27
In the following screen shot, the detail level has been changed to 0 (everything) so that you can actually see everything allocated from Demo1::Main:
The System.Char [] objects are actually allocated from an overload of String.Split, which got inlined. The IO.StreamReader object was allocated by the main program itself, and the System.Int32 objects are boxed integers allocated for the Console.WriteLine statement at the bottom.
To save you from having to fill out the filter form manually for simple cases, you can also select a node and select Filter to callers & callees.
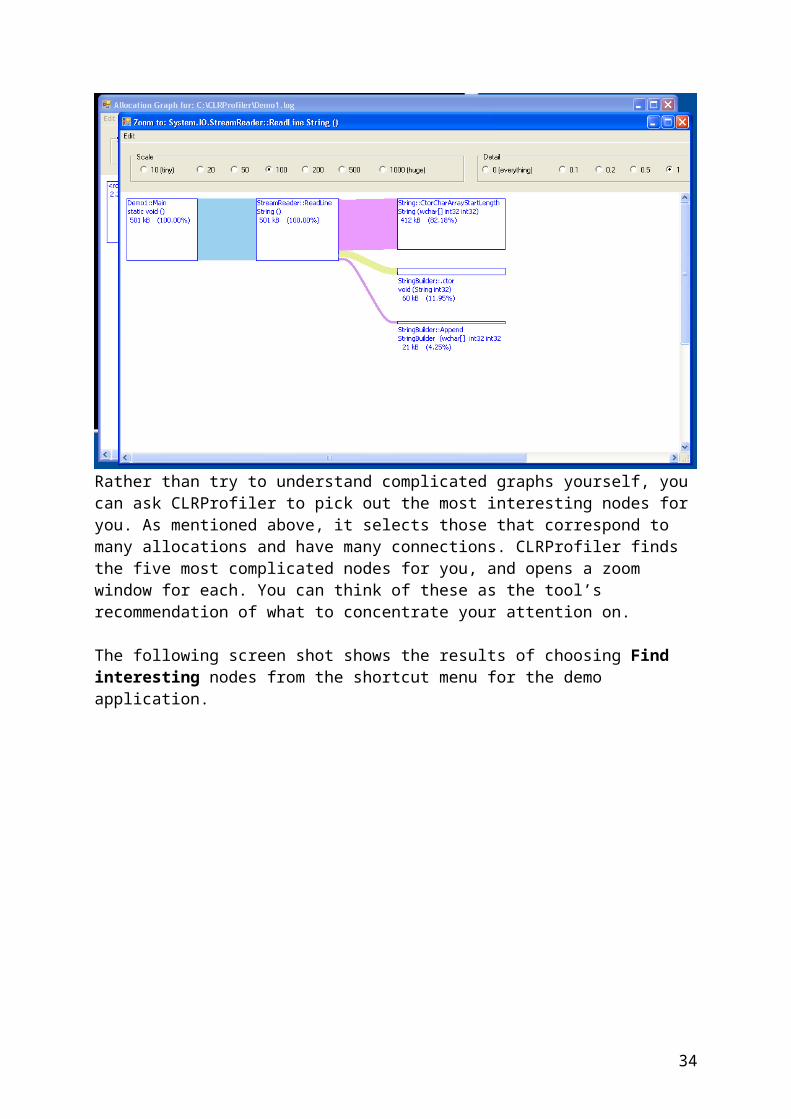
Zooming is another interesting feature useful for complicated graphs. Assume you have found an interesting method or type. In large graphs, the nodes it is connected to can be pretty far away. Zoom allows you to see the connections of a node quickly - you select the node and choose Zoom to Node from the shortcut menu (or, even quicker, you can double-click on the node). The following screenshot shows the zoom feature applied to StreamReader::ReadLine.
28
Rather than try to understand complicated graphs yourself, you can ask CLRProfiler to pick out the most interesting nodes for you. As mentioned above, it selects those that correspond to many allocations and have many connections. CLRProfiler finds the five most complicated nodes for you, and opens a zoom window for each. You can think of these as the tool’s recommendation of what to concentrate your attention on.
The following screen shot shows the results of choosing Find interesting nodes from the shortcut menu for the demo application.
29
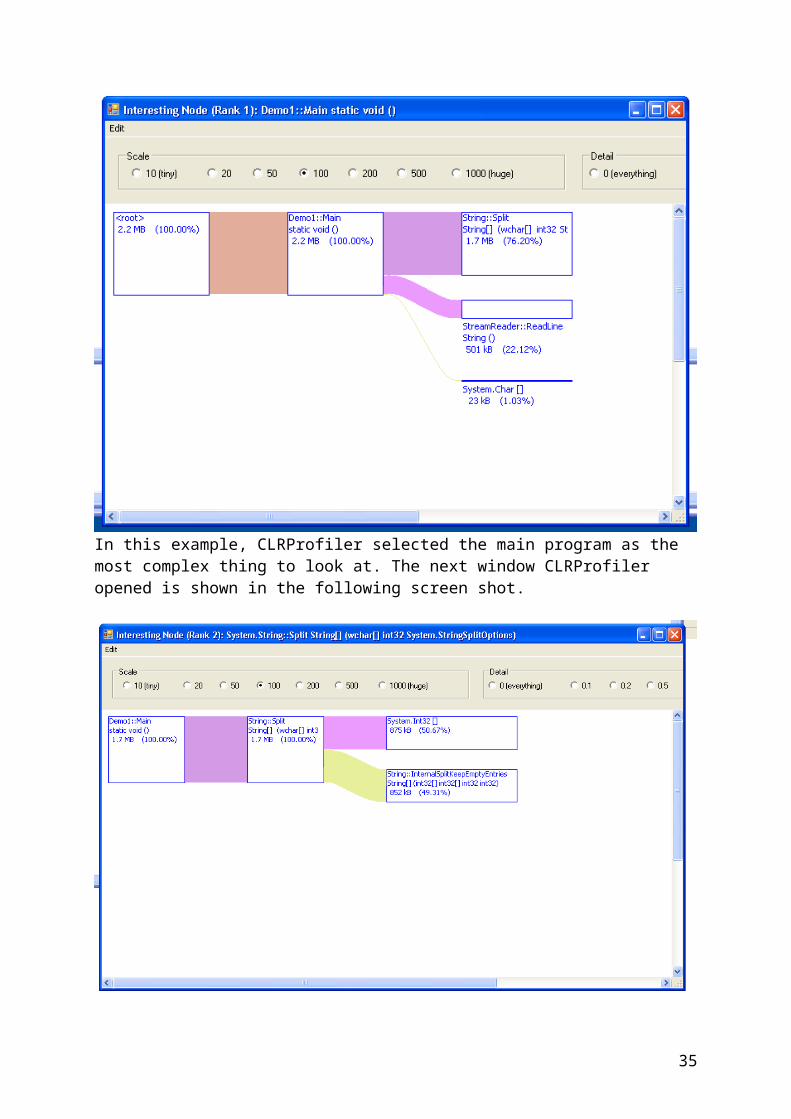
In this example, CLRProfiler selected the main program as the most complex thing to look at. The next window CLRProfiler opened is shown in the following screen shot.
So, splitting strings is also interesting. This makes sense – if you wanted to reduce the amount of memory this application allocates, you would probably want to get rid of splitting strings altogether.
30
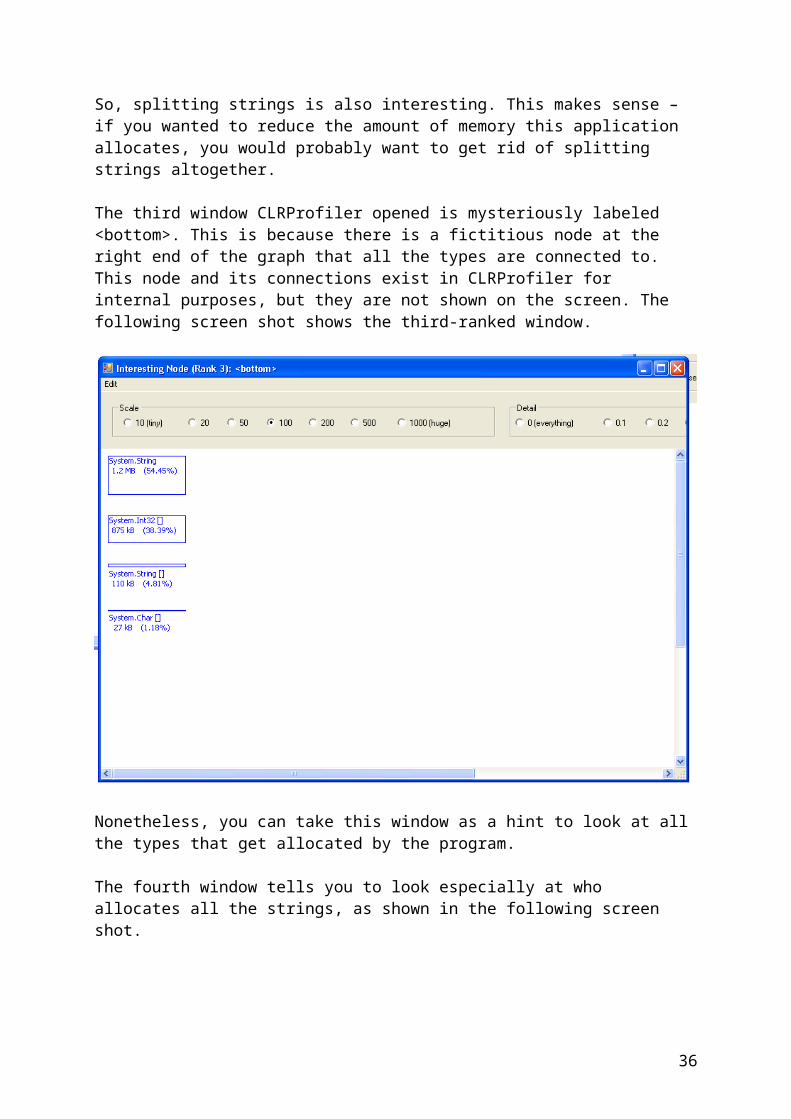
The third window CLRProfiler opened is mysteriously labeled <bottom>. This is because there is a fictitious node at the right end of the graph that all the types are connected to. This node and its connections exist in CLRProfiler for internal purposes, but they are not shown on the screen. The following screen shot shows the third-ranked window.
Nonetheless, you can take this window as a hint to look at all the types that get allocated by the program.
The fourth window tells you to look especially at who allocates all the strings, as shown in the following screen shot.
31
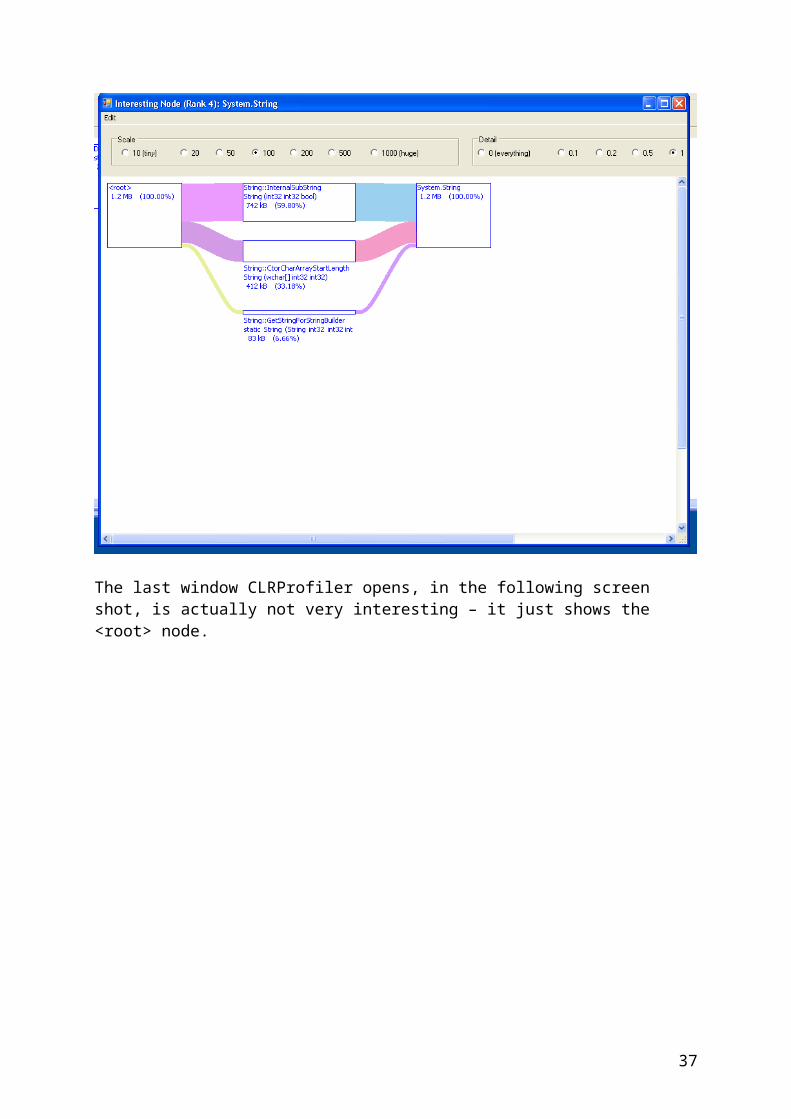
The last window CLRProfiler opens, in the following screen shot, is actually not very interesting – it just shows the <root> node.
32

Presumably, CLRProfiler just ran out of interesting things to show for this tiny example.
Assembly Graph
Function Graph
Module Graph
Class GraphThese four views are all very similar. They allow you to see which methods pulled in which assemblies, functions, modules, or classes.
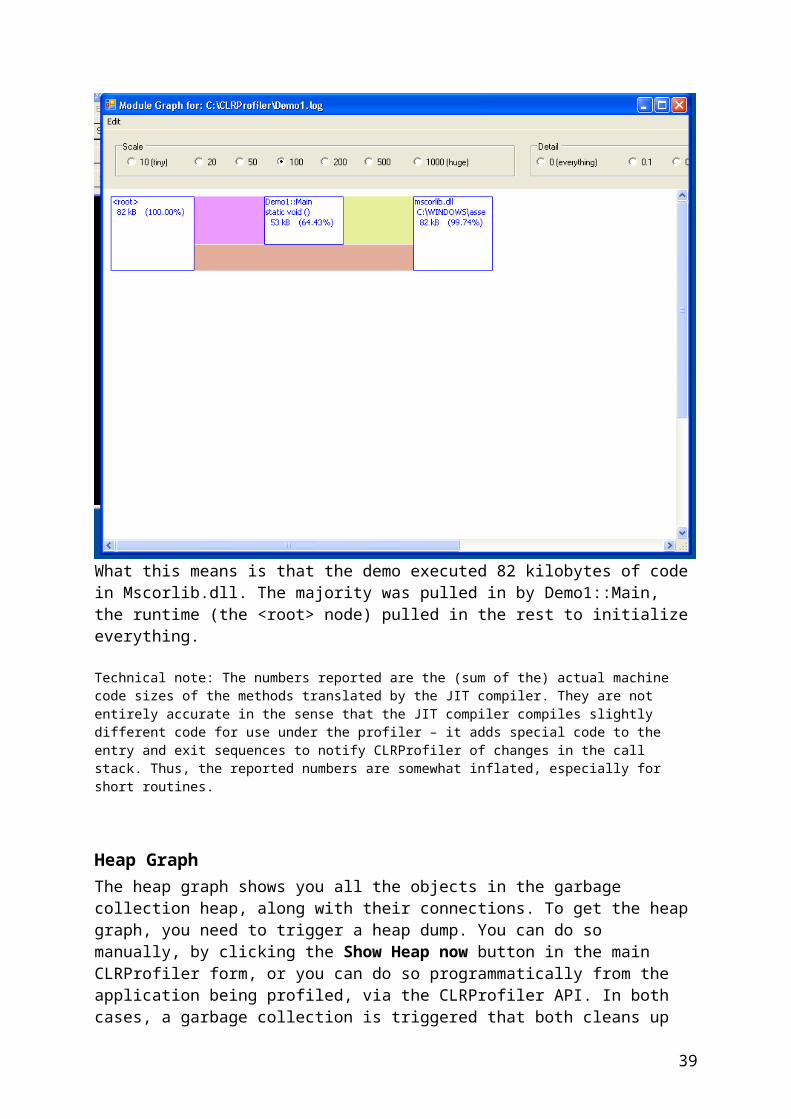
As an example, the following screen shot shows the module graph for the demo application.
33
What this means is that the demo executed 82 kilobytes of code in Mscorlib.dll. The majority was pulled in by Demo1::Main, the runtime (the <root> node) pulled in the rest to initialize everything.
Technical note: The numbers reported are the (sum of the) actual machine code sizes of the methods translated by the JIT compiler. They are not entirely accurate in the sense that the JIT compiler compiles slightly different code for use under the profiler – it adds special code to the entry and exit sequences to notify CLRProfiler of changes in the call stack. Thus, the reported numbers are somewhat inflated, especially for short routines.
Heap GraphThe heap graph shows you all the objects in the garbage collection heap, along with their connections. To get the heap graph, you need to trigger a heap dump. You can do so manually, by clicking the Show Heap now button in the main CLRProfiler form, or you can do so programmatically from the application being profiled, via the CLRProfiler API. In both cases, a garbage collection is triggered that both cleans up any objects that are no longer needed, and makes a complete list of those that remain.
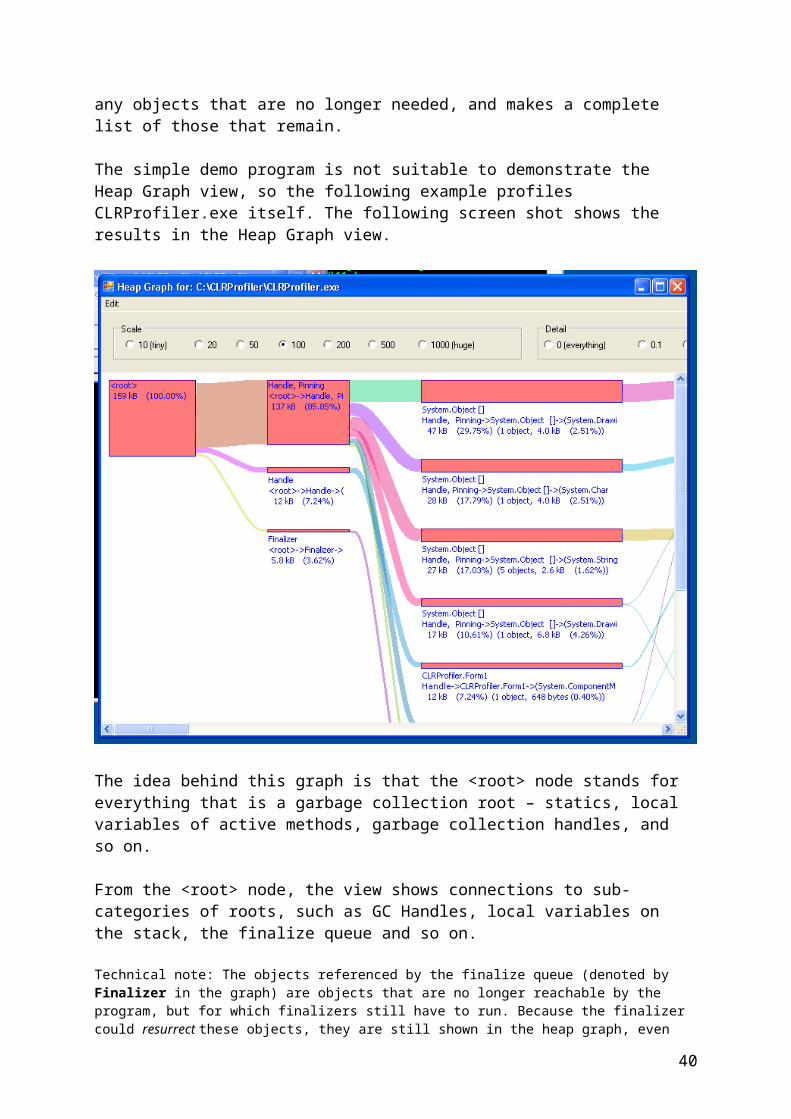
The simple demo program is not suitable to demonstrate the Heap Graph view, so the following example profiles CLRProfiler.exe itself. The following screen shot shows the results in the Heap Graph view.
34
The idea behind this graph is that the <root> node stands for everything that is a garbage collection root – statics, local variables of active methods, garbage collection handles, and so on.
From the <root> node, the view shows connections to sub-categories of roots, such as GC Handles, local variables on the stack, the finalize queue and so on.
Technical note: The objects referenced by the finalize queue (denoted by Finalizer in the graph) are objects that are no longer reachable by the program, but for which finalizers still have to run. Because the finalizer could resurrect these objects, they are still shown in the heap graph, even though the vast majority of them are about to die and their memory is about to be recycled.
The GC roots in turn have connections to the groups of objects that are directly reachable from garbage collection roots. From those objects, other objects are reachable, and so on.
In each case, not every object is shown separately – rather, they are grouped together based on their “signatures,” which consist of each object’s own type, the type that points to it, and the types it points at. If you really want to see individual instances, select Show Instances from the shortcut menu. The signature is shown under the type name of the object.
As in other views that show graphs, the type names and signatures are abbreviated - thus, instead of System.Windows.Forms.MenuItem, the view just shows Forms.MenuItem. Hovering the mouse cursor over the node shows the complete type name and signature.
35
The height of each box corresponds to the total amount of memory held alive by each group of objects. The text associated with a box gives more detailed statistics, including how many objects are in the group, and how much space they occupy themselves, excluding the objects they point at. For instance, under the System.Object [] array in the upper right corner, there is the text "47 kB (29.75%) (1 object, 4.0 kB (2.51%))". This means that this group of objects consists of just one object occupying 4 kB of memory (which amounts to 2.51% of the total). Further, this object references another 43 kB worth of objects, so that the total is 47 kB (which amounts to almost 30% of the total).
To keep the graph from becoming a confusing tangle of lines, the Heap Graph view shows only one possible path from the root to each object, rather than all possible ones. It selects one of minimal length – you can be sure there is no shorter one, but there can be many others of equal or greater length.
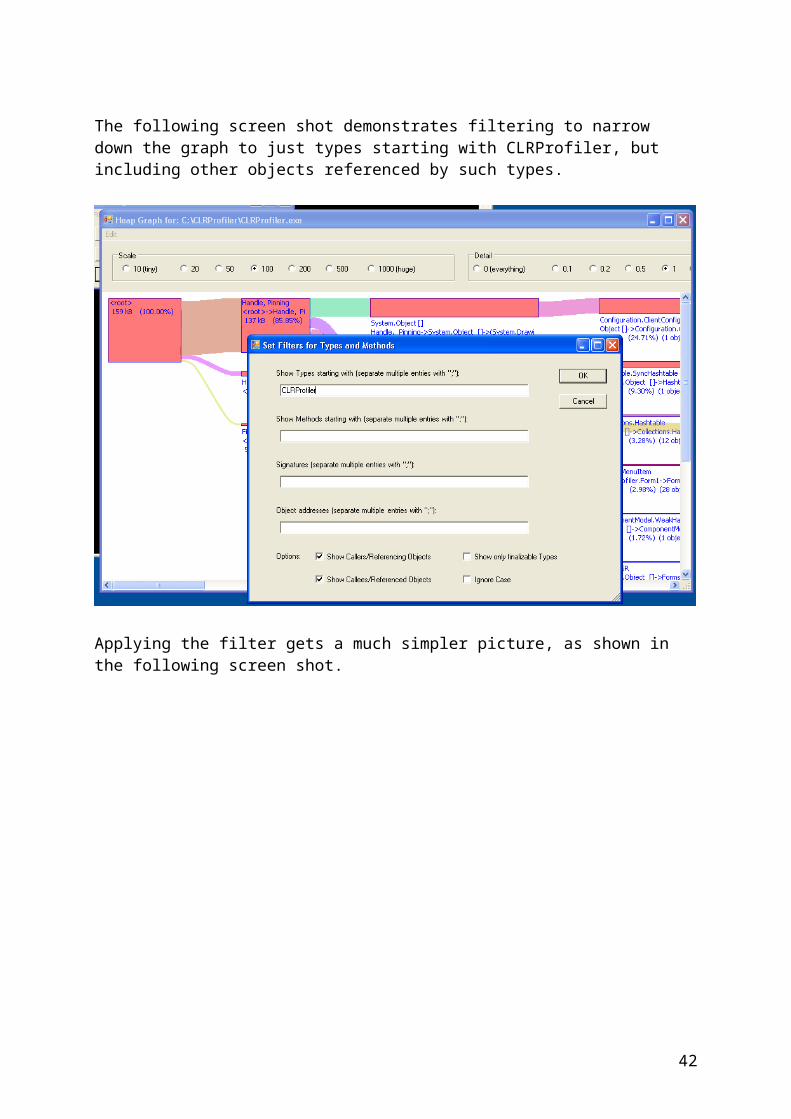
Despite this, in this case, the graph is rather confusing and complicated in this case. Part of the problem is that there is some clutter from library components that have nothing to do with the application itself.
The following screen shot demonstrates filtering to narrow down the graph to just types starting with CLRProfiler, but including other objects referenced by such types.
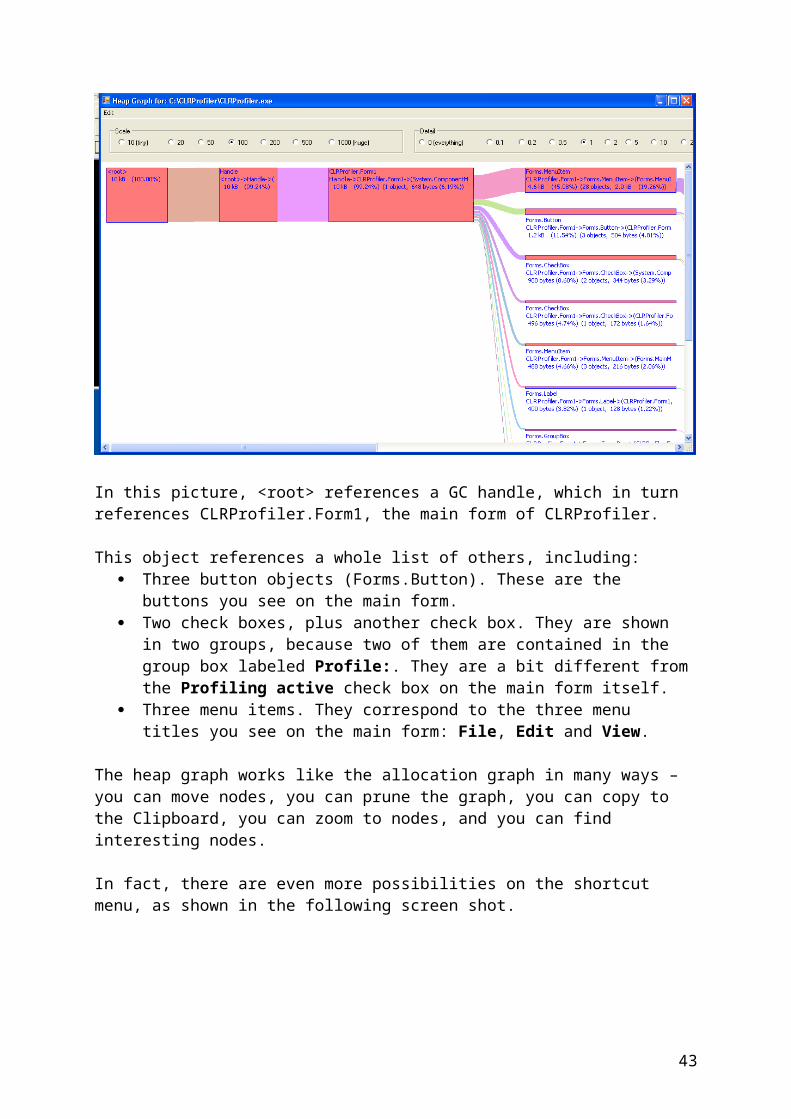
Applying the filter gets a much simpler picture, as shown in the following screen shot.
36
In this picture, <root> references a GC handle, which in turn references CLRProfiler.Form1, the main form of CLRProfiler.
This object references a whole list of others, including: Three button objects (Forms.Button). These are the buttons you see on the main form. Two check boxes, plus another check box. They are shown in two groups, because
two of them are contained in the group box labeled Profile:. They are a bit different from the Profiling active check box on the main form itself.
Three menu items. They correspond to the three menu titles you see on the main form: File, Edit and View.
The heap graph works like the allocation graph in many ways – you can move nodes, you can prune the graph, you can copy to the Clipboard, you can zoom to nodes, and you can find interesting nodes.
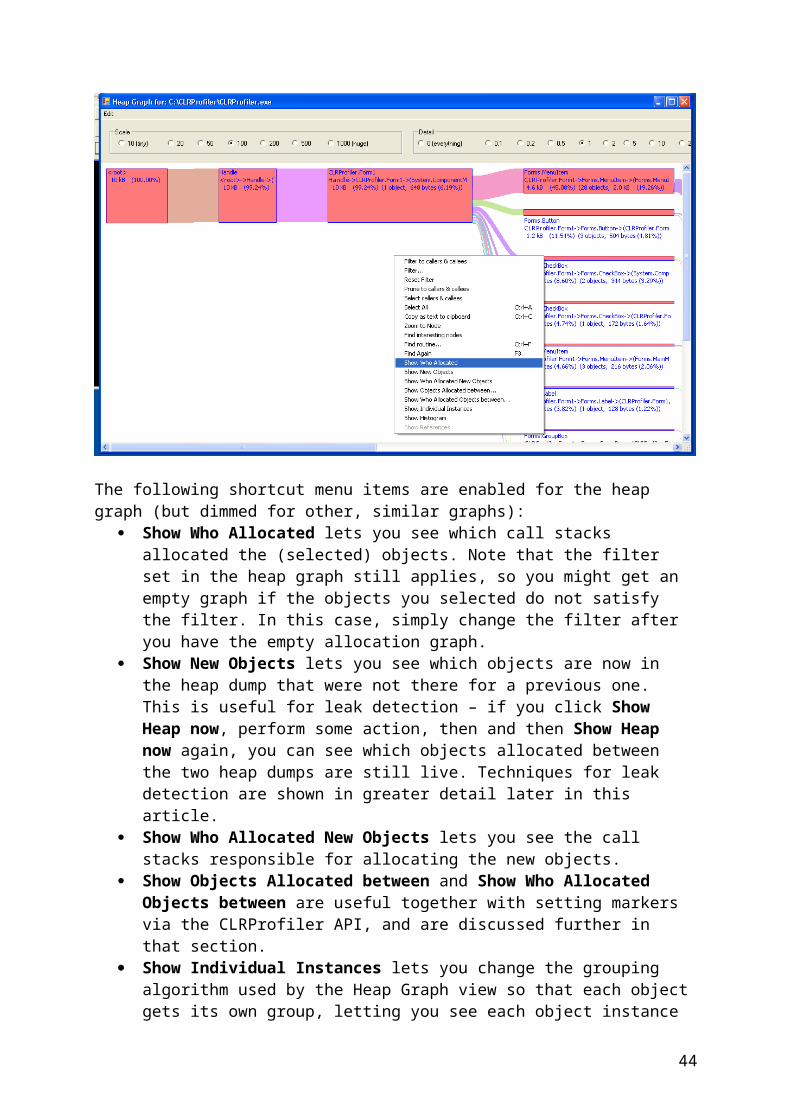
In fact, there are even more possibilities on the shortcut menu, as shown in the following screen shot.
37

The following shortcut menu items are enabled for the heap graph (but dimmed for other, similar graphs):
Show Who Allocated lets you see which call stacks allocated the (selected) objects. Note that the filter set in the heap graph still applies, so you might get an empty graph if the objects you selected do not satisfy the filter. In this case, simply change the filter after you have the empty allocation graph.
Show New Objects lets you see which objects are now in the heap dump that were not there for a previous one. This is useful for leak detection – if you click Show Heap now, perform some action, then and then Show Heap now again, you can see which objects allocated between the two heap dumps are still live. Techniques for leak detection are shown in greater detail later in this article.
Show Who Allocated New Objects lets you see the call stacks responsible for allocating the new objects.
Show Objects Allocated between and Show Who Allocated Objects between are useful together with setting markers via the CLRProfiler API, and are discussed further in that section.
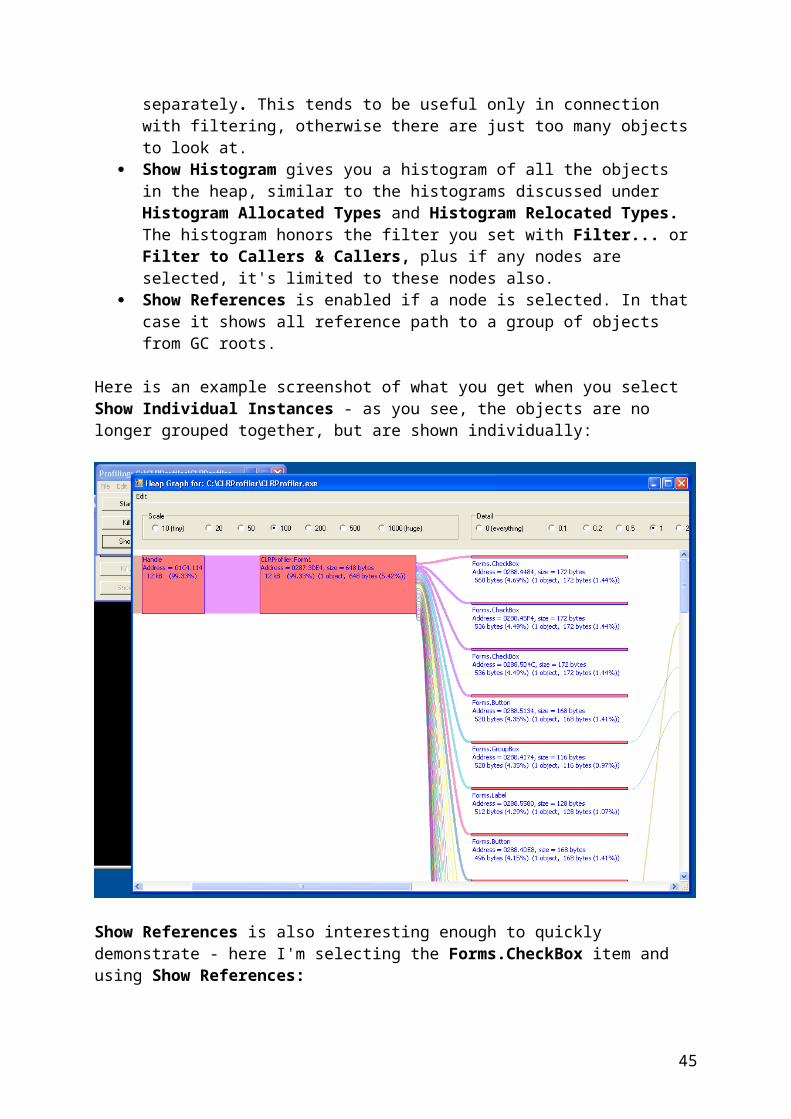
Show Individual Instances lets you change the grouping algorithm used by the Heap Graph view so that each object gets its own group, letting you see each object instance separately. This tends to be useful only in connection with filtering, otherwise there are just too many objects to look at.
Show Histogram gives you a histogram of all the objects in the heap, similar to the histograms discussed under Histogram Allocated Types and Histogram Relocated Types. The histogram honors the filter you set with Filter... or Filter to Callers & Callers, plus if any nodes are selected, it's limited to these nodes also.
Show References is enabled if a node is selected. In that case it shows all reference path to a group of objects from GC roots.
Here is an example screenshot of what you get when you select Show Individual Instances - as you see, the objects are no longer grouped together, but are shown individually:
38
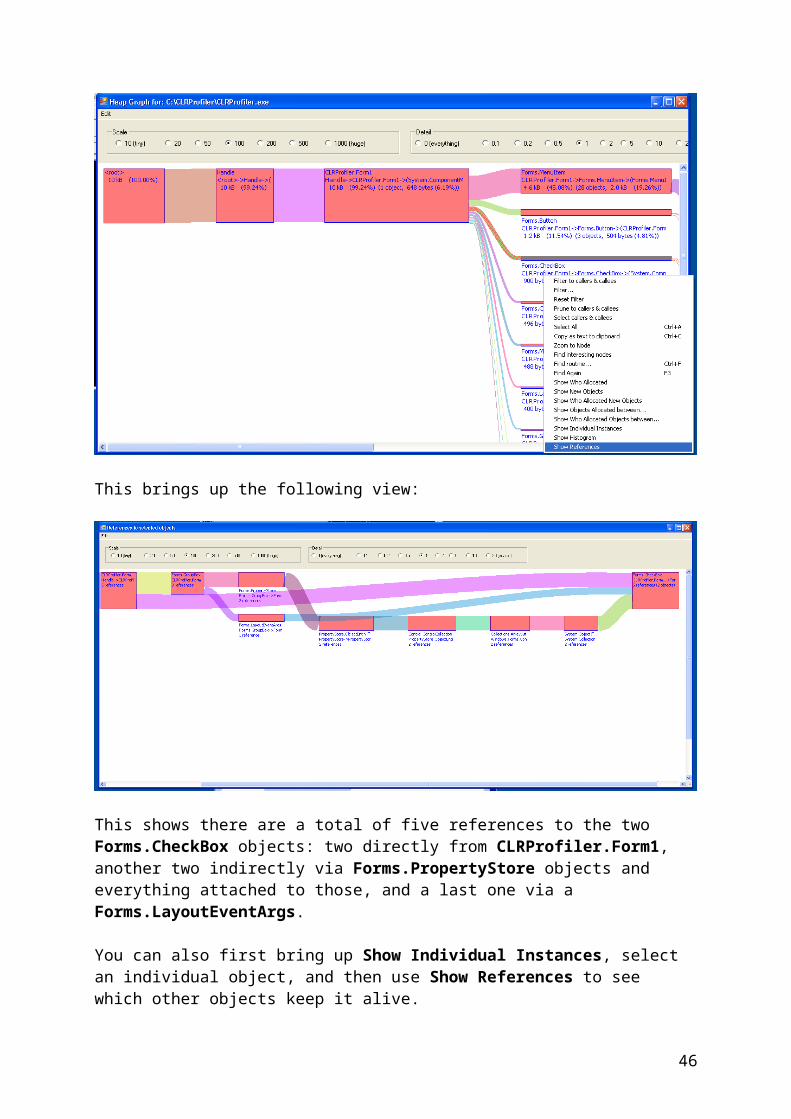
Show References is also interesting enough to quickly demonstrate - here I'm selecting the Forms.CheckBox item and using Show References:
This brings up the following view:
39
This shows there are a total of five references to the two Forms.CheckBox objects: two directly from CLRProfiler.Form1, another two indirectly via Forms.PropertyStore objects and everything attached to those, and a last one via a Forms.LayoutEventArgs.
You can also first bring up Show Individual Instances, select an individual object, and then use Show References to see which other objects keep it alive.
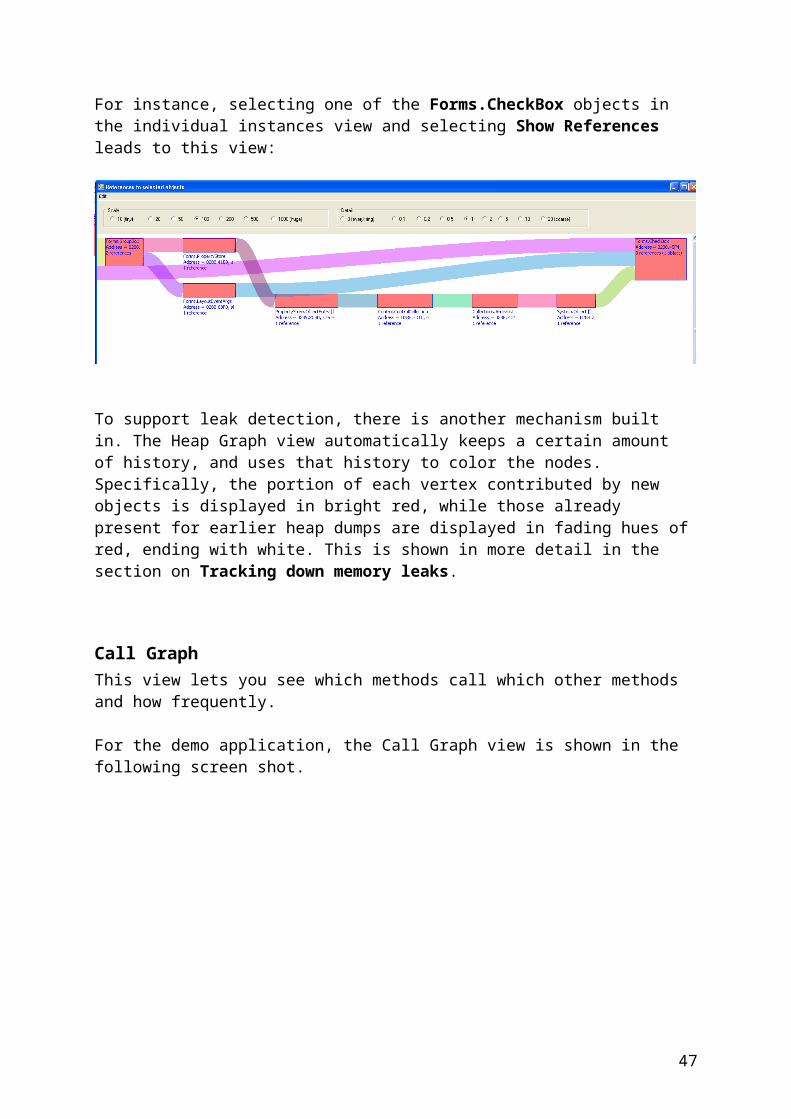
For instance, selecting one of the Forms.CheckBox objects in the individual instances view and selecting Show References leads to this view:
To support leak detection, there is another mechanism built in. The Heap Graph view automatically keeps a certain amount of history, and uses that history to color the nodes. Specifically, the portion of each vertex contributed by new objects is displayed in bright red, while those already present for earlier heap dumps are displayed in fading hues of red, ending with white. This is shown in more detail in the section on Tracking down memory leaks.
Call GraphThis view lets you see which methods call which other methods and how frequently.
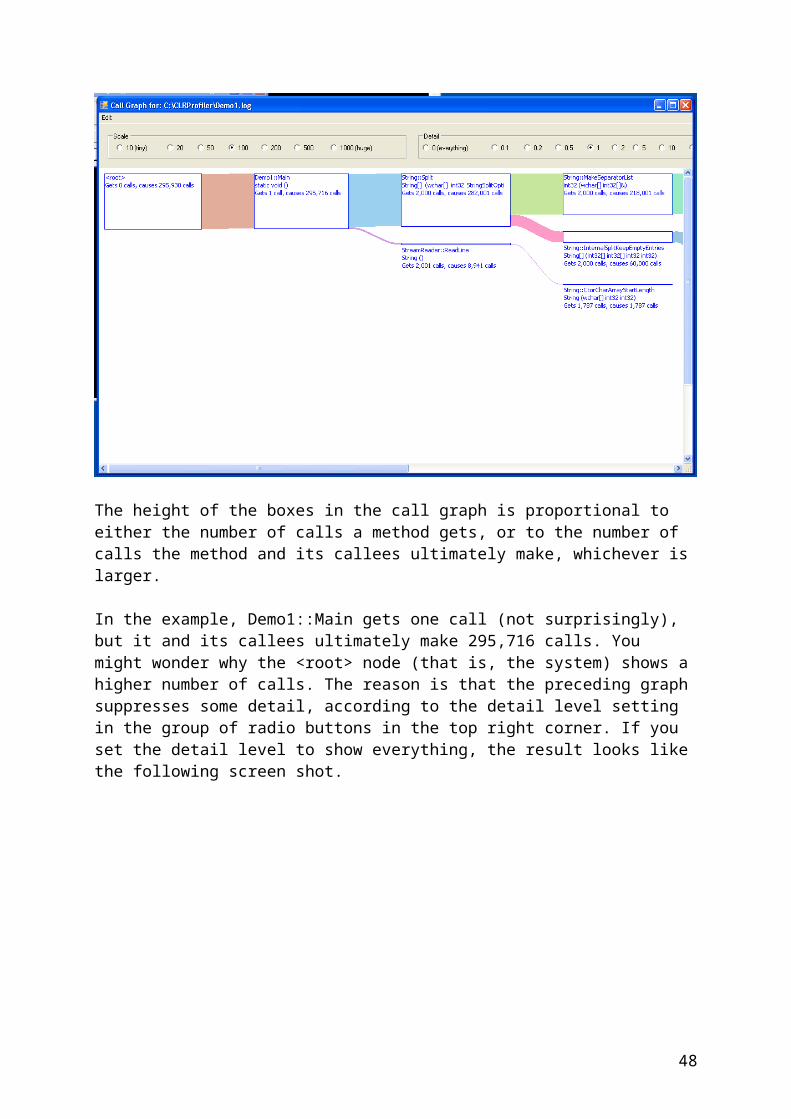
For the demo application, the Call Graph view is shown in the following screen shot.
40
The height of the boxes in the call graph is proportional to either the number of calls a method gets, or to the number of calls the method and its callees ultimately make, whichever is larger.
In the example, Demo1::Main gets one call (not surprisingly), but it and its callees ultimately make 295,716 calls. You might wonder why the <root> node (that is, the system) shows a higher number of calls. The reason is that the preceding graph suppresses some detail, according to the detail level setting in the group of radio buttons in the top right corner. If you set the detail level to show everything, the result looks like the following screen shot.
41
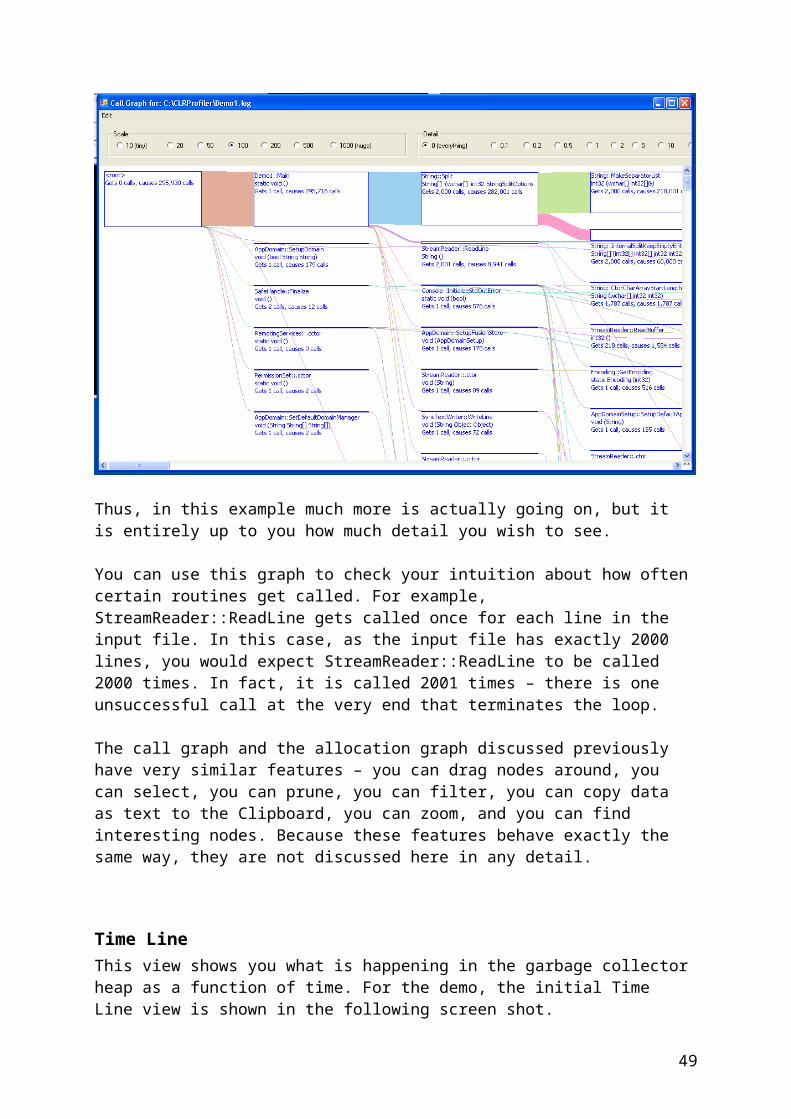
Thus, in this example much more is actually going on, but it is entirely up to you how much detail you wish to see.
You can use this graph to check your intuition about how often certain routines get called. For example, StreamReader::ReadLine gets called once for each line in the input file. In this case, as the input file has exactly 2000 lines, you would expect StreamReader::ReadLine to be called 2000 times. In fact, it is called 2001 times – there is one unsuccessful call at the very end that terminates the loop.
The call graph and the allocation graph discussed previously have very similar features – you can drag nodes around, you can select, you can prune, you can filter, you can copy data as text to the Clipboard, you can zoom, and you can find interesting nodes. Because these features behave exactly the same way, they are not discussed here in any detail.
Time LineThis view shows you what is happening in the garbage collector heap as a function of time. For the demo, the initial Time Line view is shown in the following screen shot.
42
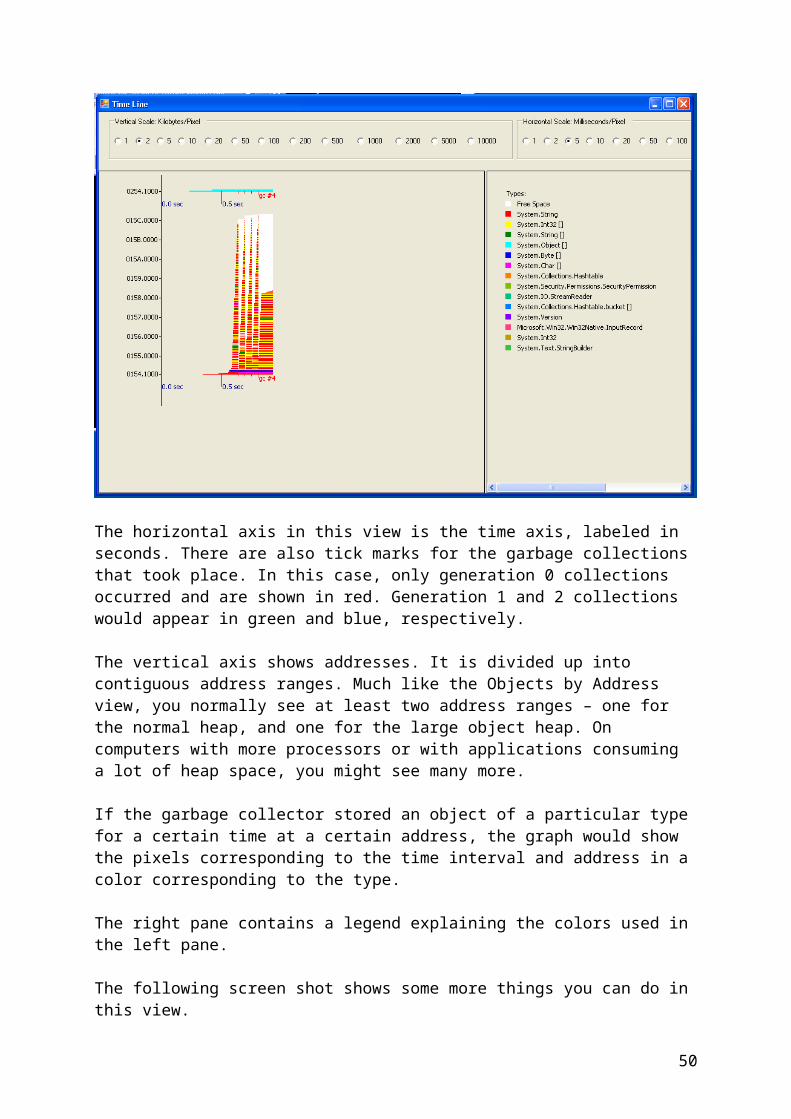
The horizontal axis in this view is the time axis, labeled in seconds. There are also tick marks for the garbage collections that took place. In this case, only generation 0 collections occurred and are shown in red. Generation 1 and 2 collections would appear in green and blue, respectively.
The vertical axis shows addresses. It is divided up into contiguous address ranges. Much like the Objects by Address view, you normally see at least two address ranges – one for the normal heap, and one for the large object heap. On computers with more processors or with applications consuming a lot of heap space, you might see many more.
If the garbage collector stored an object of a particular type for a certain time at a certain address, the graph would show the pixels corresponding to the time interval and address in a color corresponding to the type.
The right pane contains a legend explaining the colors used in the left pane.
The following screen shot shows some more things you can do in this view.
43
You can adjust vertical and horizontal scales to your liking using the radio buttons at the top.
Positioning the mouse pointer over a specific point in the graph will give you more detailed information about what was stored there, the address, and the point in time you are pointing at.
Also, you can drag to select a time interval. If you do so, the legend in the right pane adds statistics about the types allocated in that time interval.
The legend says “estimated sizes …” because this view does not keep track of every single object that was allocated and moved and cleaned up by the garbage collector – rather, it just keeps track of a sample of them.
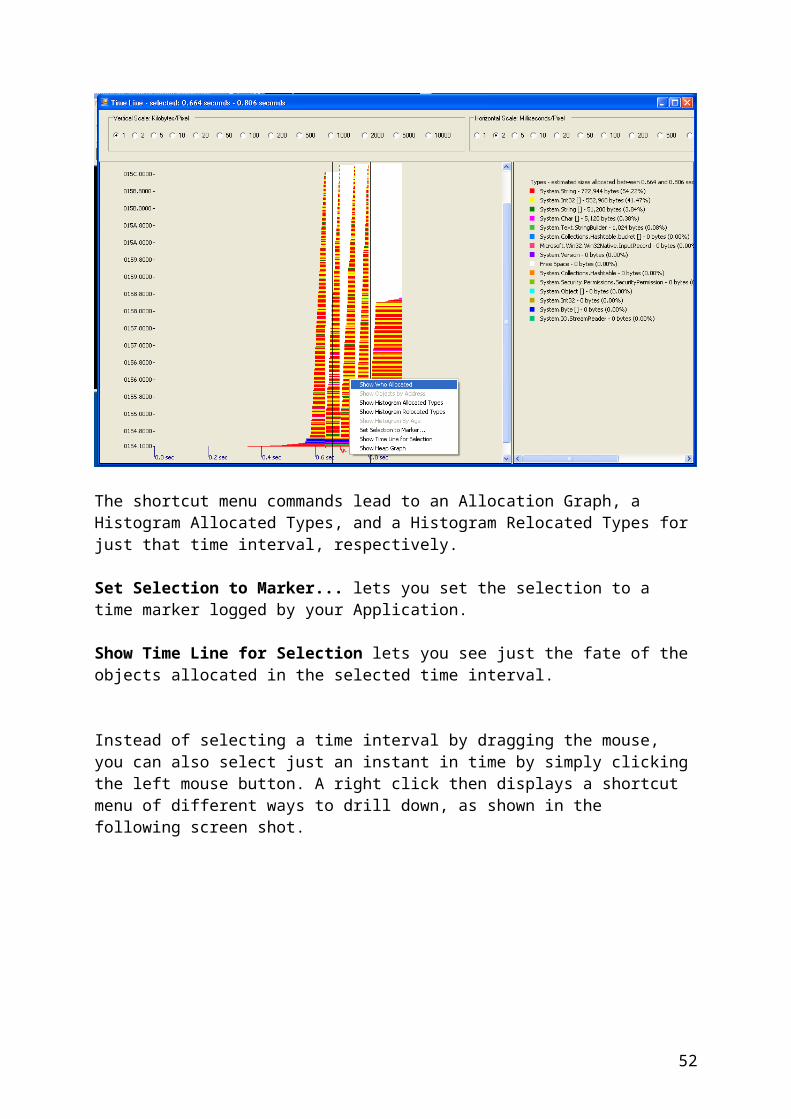
A shortcut menu, shown in the following screen shot, lets you find out more about the objects allocated in the selected time interval.
44
The shortcut menu commands lead to an Allocation Graph, a Histogram Allocated Types, and a Histogram Relocated Types for just that time interval, respectively.
Set Selection to Marker... lets you set the selection to a time marker logged by your Application.
Show Time Line for Selection lets you see just the fate of the objects allocated in the selected time interval.
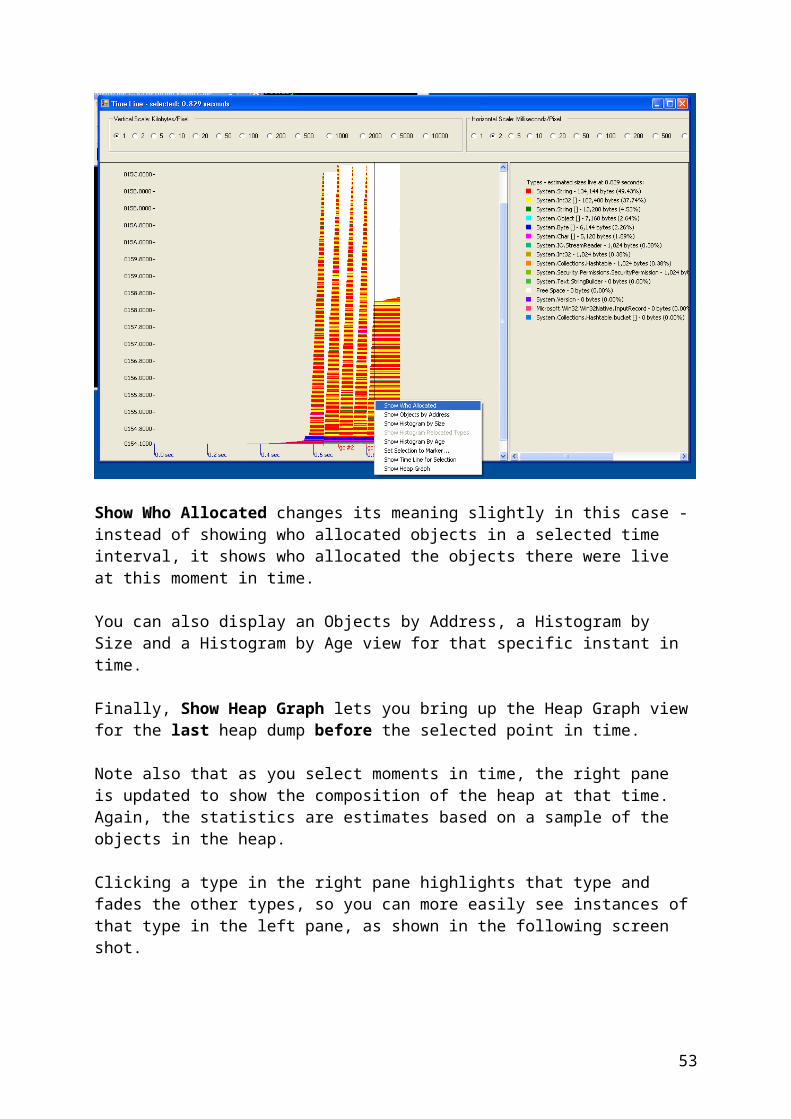
Instead of selecting a time interval by dragging the mouse, you can also select just an instant in time by simply clicking the left mouse button. A right click then displays a shortcut menu of different ways to drill down, as shown in the following screen shot.
45
Show Who Allocated changes its meaning slightly in this case - instead of showing who allocated objects in a selected time interval, it shows who allocated the objects there were live at this moment in time.
You can also display an Objects by Address, a Histogram by Size and a Histogram by Age view for that specific instant in time.
Finally, Show Heap Graph lets you bring up the Heap Graph view for the last heap dump before the selected point in time.
Note also that as you select moments in time, the right pane is updated to show the composition of the heap at that time. Again, the statistics are estimates based on a sample of the objects in the heap.
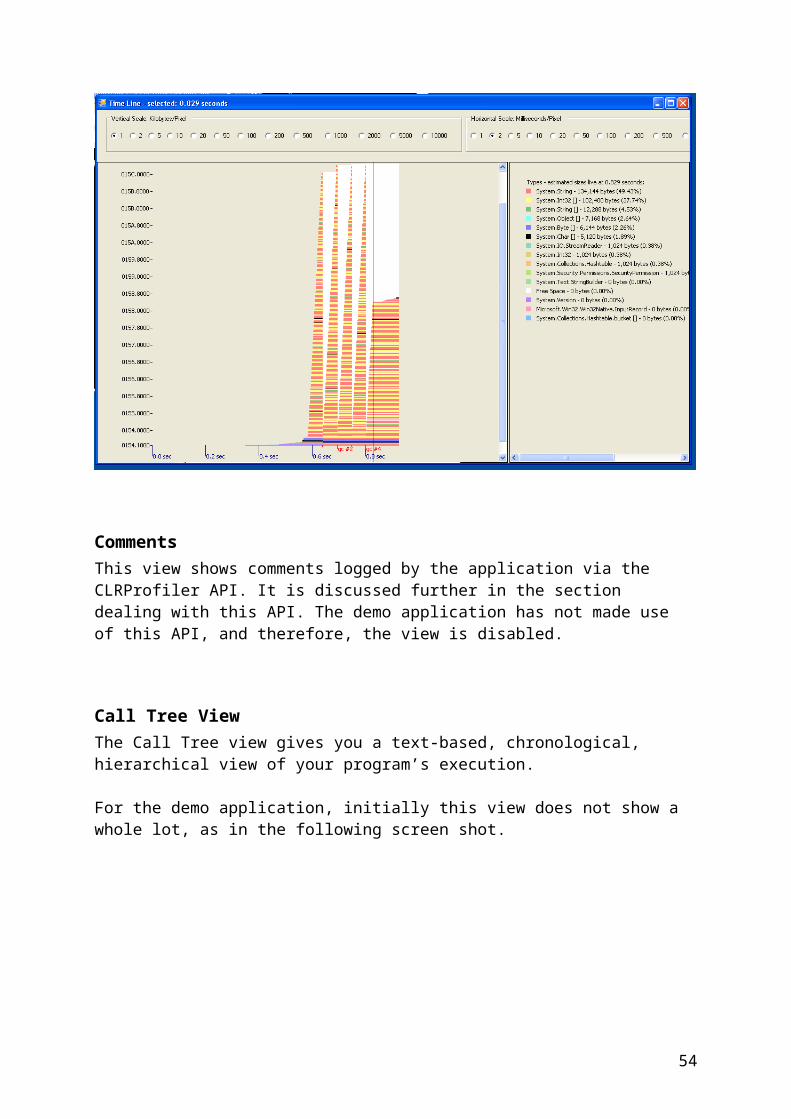
Clicking a type in the right pane highlights that type and fades the other types, so you can more easily see instances of that type in the left pane, as shown in the following screen shot.
46
CommentsThis view shows comments logged by the application via the CLRProfiler API. It is discussed further in the section dealing with this API. The demo application has not made use of this API, and therefore, the view is disabled.
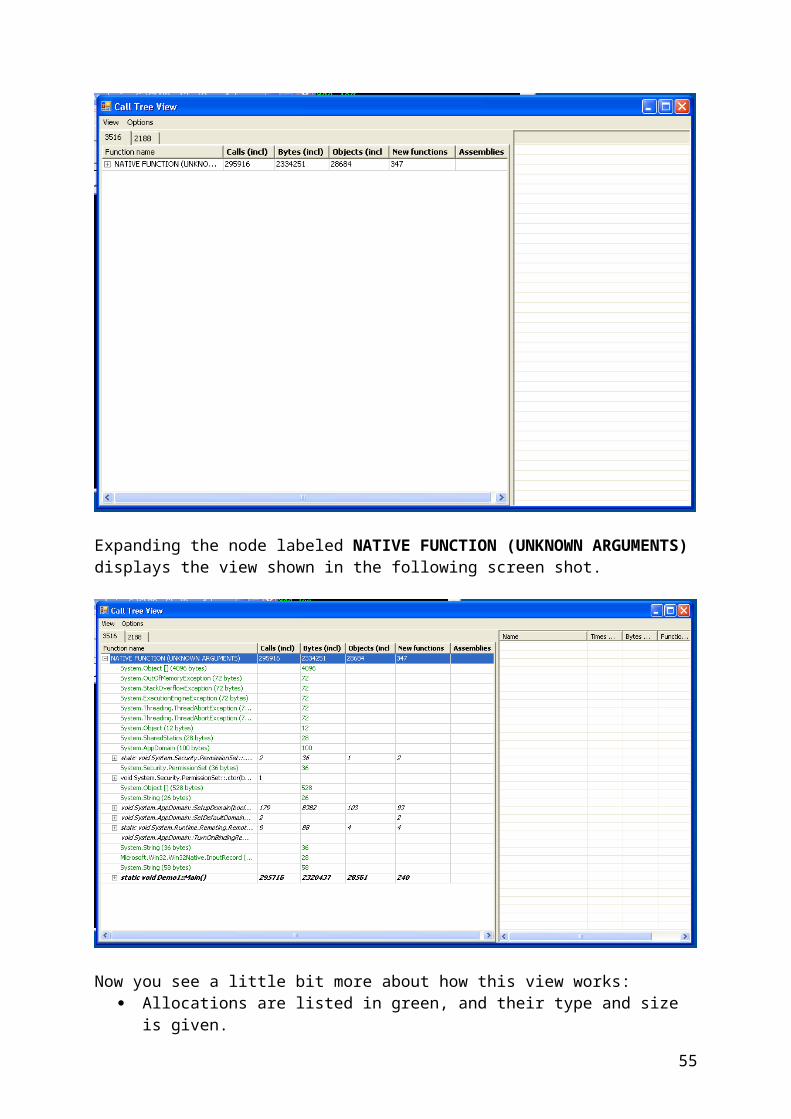
Call Tree ViewThe Call Tree view gives you a text-based, chronological, hierarchical view of your program’s execution.
For the demo application, initially this view does not show a whole lot, as in the following screen shot.
47
Expanding the node labeled NATIVE FUNCTION (UNKNOWN ARGUMENTS) displays the view shown in the following screen shot.
Now you see a little bit more about how this view works: Allocations are listed in green, and their type and size is given. Method calls are listed in black, and they can be expanded to show what happened
inside the method.
48
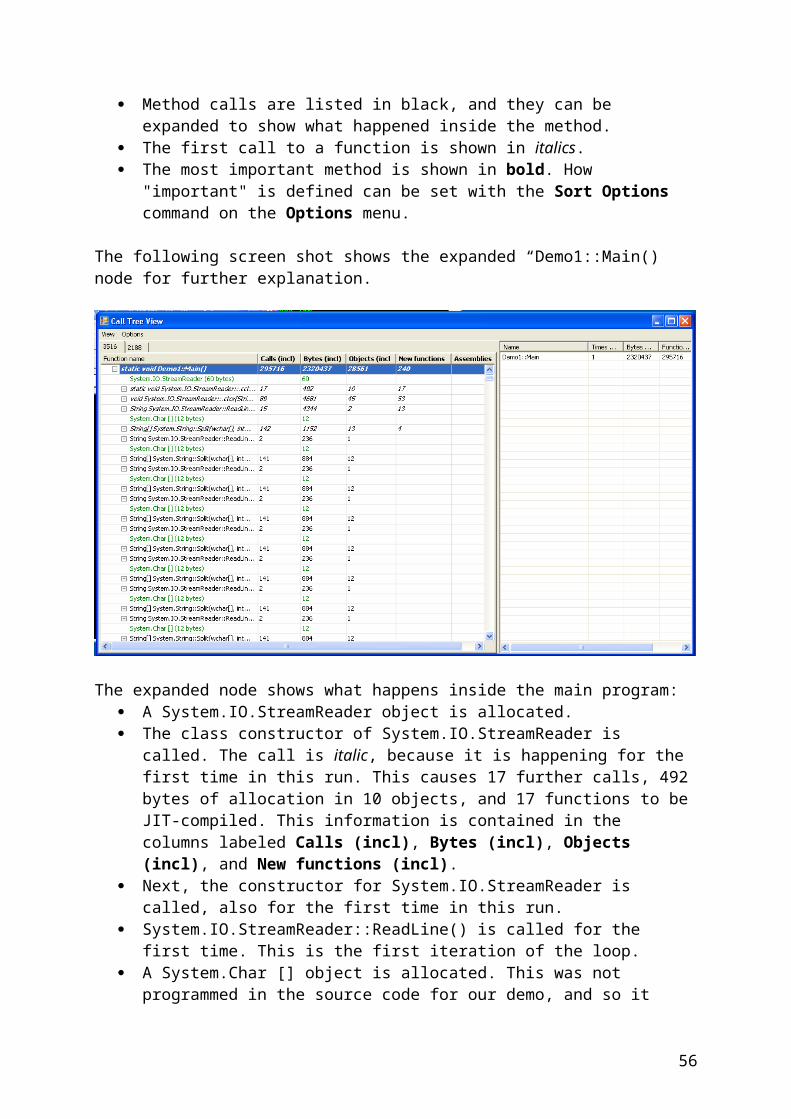
The first call to a function is shown in italics. The most important method is shown in bold. How "important" is defined can be set
with the Sort Options command on the Options menu.
The following screen shot shows the expanded “Demo1::Main() node for further explanation.
The expanded node shows what happens inside the main program: A System.IO.StreamReader object is allocated. The class constructor of System.IO.StreamReader is called. The call is italic, because
it is happening for the first time in this run. This causes 17 further calls, 492 bytes of allocation in 10 objects, and 17 functions to be JIT-compiled. This information is contained in the columns labeled Calls (incl), Bytes (incl), Objects (incl), and New functions (incl).
Next, the constructor for System.IO.StreamReader is called, also for the first time in this run.
System.IO.StreamReader::ReadLine() is called for the first time. This is the first iteration of the loop.
A System.Char [] object is allocated. This was not programmed in the source code for our demo, and so it must be an inlined copy of String.Split() that does this internally.
System.String::Split(wchar[], int...) is called for the first time. After this, the regular execution of the parsing loop starts, each iteration consisting of:
o A call to System.IO.StreamReader::ReadLine(), which causes another call to allocate and construct a string, which amounts to 236 bytes and one string object per iteration.
o An allocation of a System.Char [] object, from the inlining of String.Split().o A call to System.String::Split(wchar[], int...), causing a total of 141 calls and
allocation of 12 objects with a total of 884 bytes. This goes on for 2000 iterations.
49
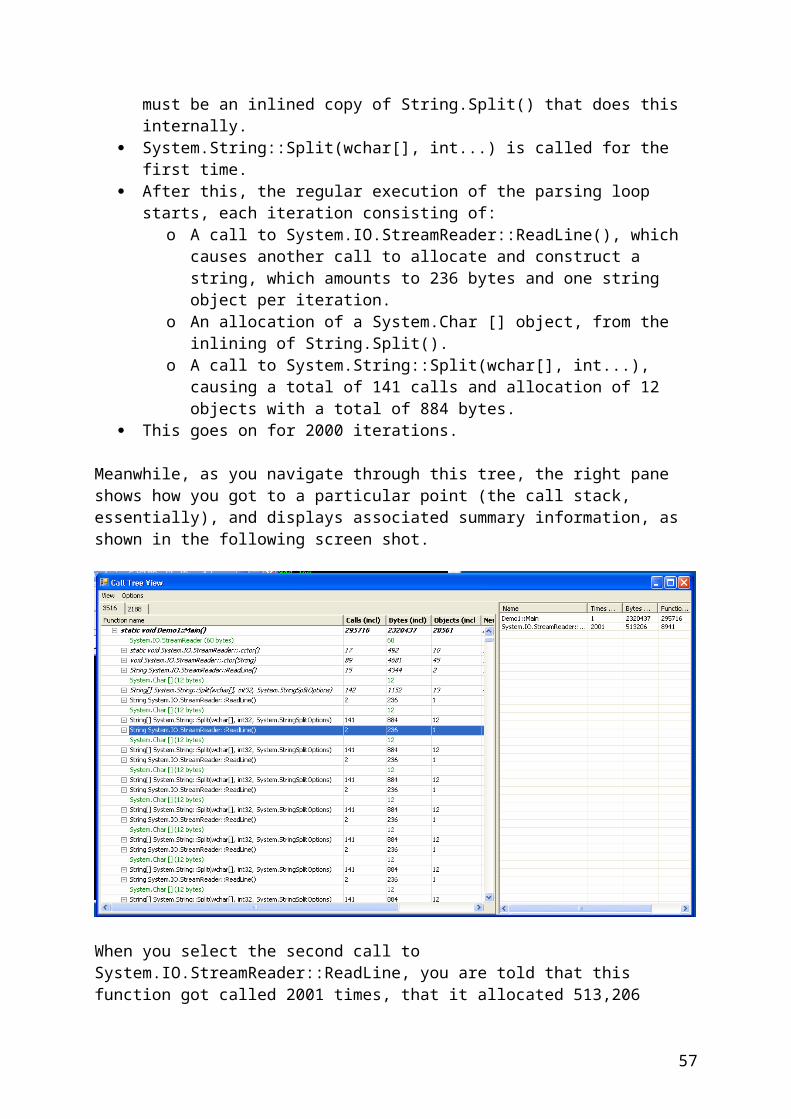
Meanwhile, as you navigate through this tree, the right pane shows how you got to a particular point (the call stack, essentially), and displays associated summary information, as shown in the following screen shot.
When you select the second call to System.IO.StreamReader::ReadLine, you are told that this function got called 2001 times, that it allocated 513,206 bytes, that it caused 8,941 calls, and so on. It was called from Demo1::Main, which was called just once.
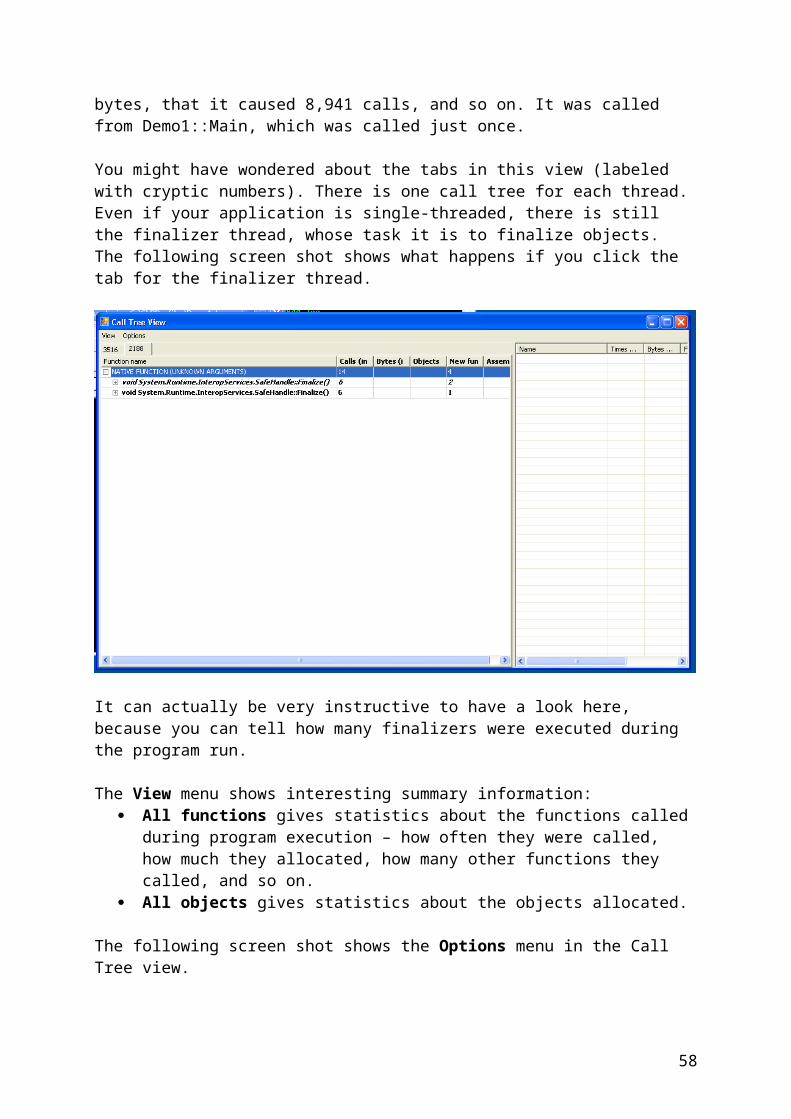
You might have wondered about the tabs in this view (labeled with cryptic numbers). There is one call tree for each thread. Even if your application is single-threaded, there is still the finalizer thread, whose task it is to finalize objects. The following screen shot shows what happens if you click the tab for the finalizer thread.
50

It can actually be very instructive to have a look here, because you can tell how many finalizers were executed during the program run.
The View menu shows interesting summary information: All functions gives statistics about the functions called during program execution –
how often they were called, how much they allocated, how many other functions they called, and so on.
All objects gives statistics about the objects allocated.
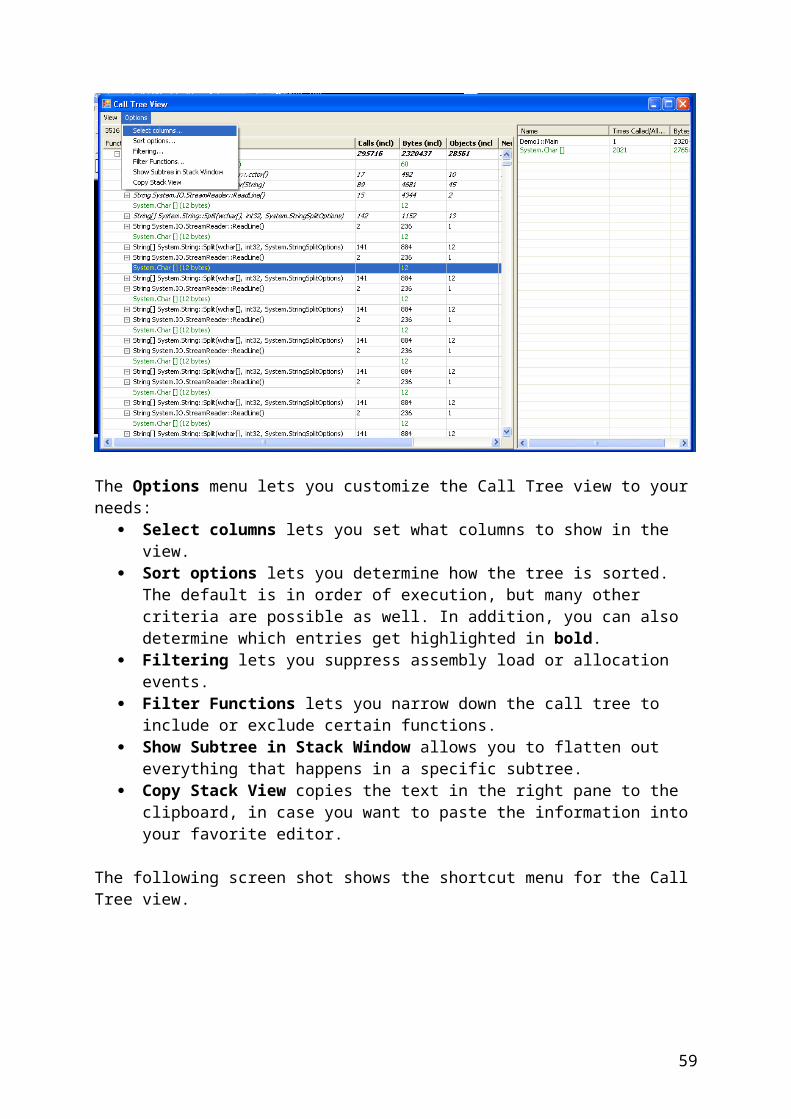
The following screen shot shows the Options menu in the Call Tree view.
51
The Options menu lets you customize the Call Tree view to your needs: Select columns lets you set what columns to show in the view. Sort options lets you determine how the tree is sorted. The default is in order of
execution, but many other criteria are possible as well. In addition, you can also determine which entries get highlighted in bold.
Filtering lets you suppress assembly load or allocation events. Filter Functions lets you narrow down the call tree to include or exclude certain
functions. Show Subtree in Stack Window allows you to flatten out everything that happens in
a specific subtree. Copy Stack View copies the text in the right pane to the clipboard, in case you want
to paste the information into your favorite editor.
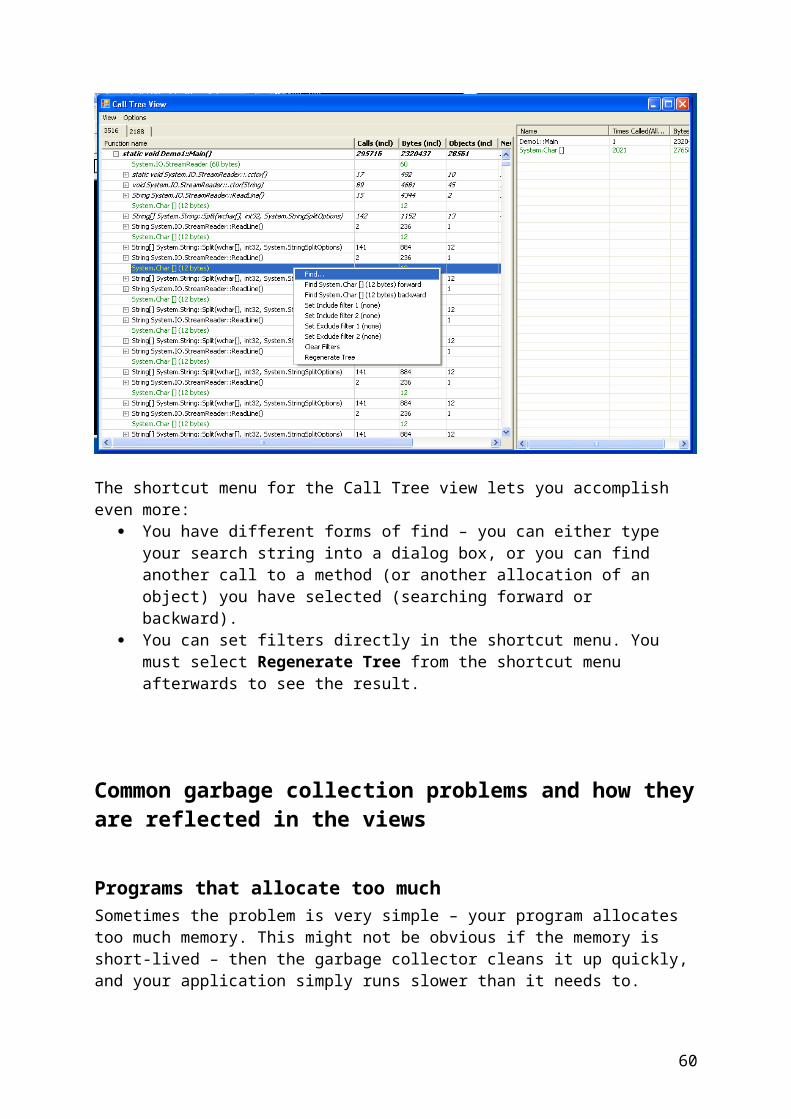
The following screen shot shows the shortcut menu for the Call Tree view.
The shortcut menu for the Call Tree view lets you accomplish even more: You have different forms of find – you can either type your search string into a dialog
box, or you can find another call to a method (or another allocation of an object) you have selected (searching forward or backward).
You can set filters directly in the shortcut menu. You must select Regenerate Tree from the shortcut menu afterwards to see the result.
Common garbage collection problems and how they are reflected in the views
52
Programs that allocate too muchSometimes the problem is very simple – your program allocates too much memory. This might not be obvious if the memory is short-lived – then the garbage collector cleans it up quickly, and your application simply runs slower than it needs to.
This section includes a simple demo with this type of problem, and will go through the views and see how the problem appears.
The source code for the demo application is as follows.
// Demo program: building long strings using string type.
using System;
class test{ public static void Main() { int start = Environment.TickCount; for (int i = 0; i < 1000; i++) { string s = ""; for (int j = 0; j < 100; j++) { s += "Outer index = "; s += i; s += " Inner index = "; s += j; s += " "; } } Console.WriteLine("Program ran for {0} seconds", 0.001*(Environment.TickCount - start)); }}
It is really simple – the inner loop builds a long string by repeatedly appending, and then the string is wrapped in an outer loop just so it runs long enough for reasonably accurate timing.
Running this program on a 2.4 GHz Opteron box gives the following result:
C:\CLRProfiler>string_append.exeProgram ran for 1.141 seconds
This is not really slow, but could it be faster?
You can run this demo application under CLRProfiler and go through the views.
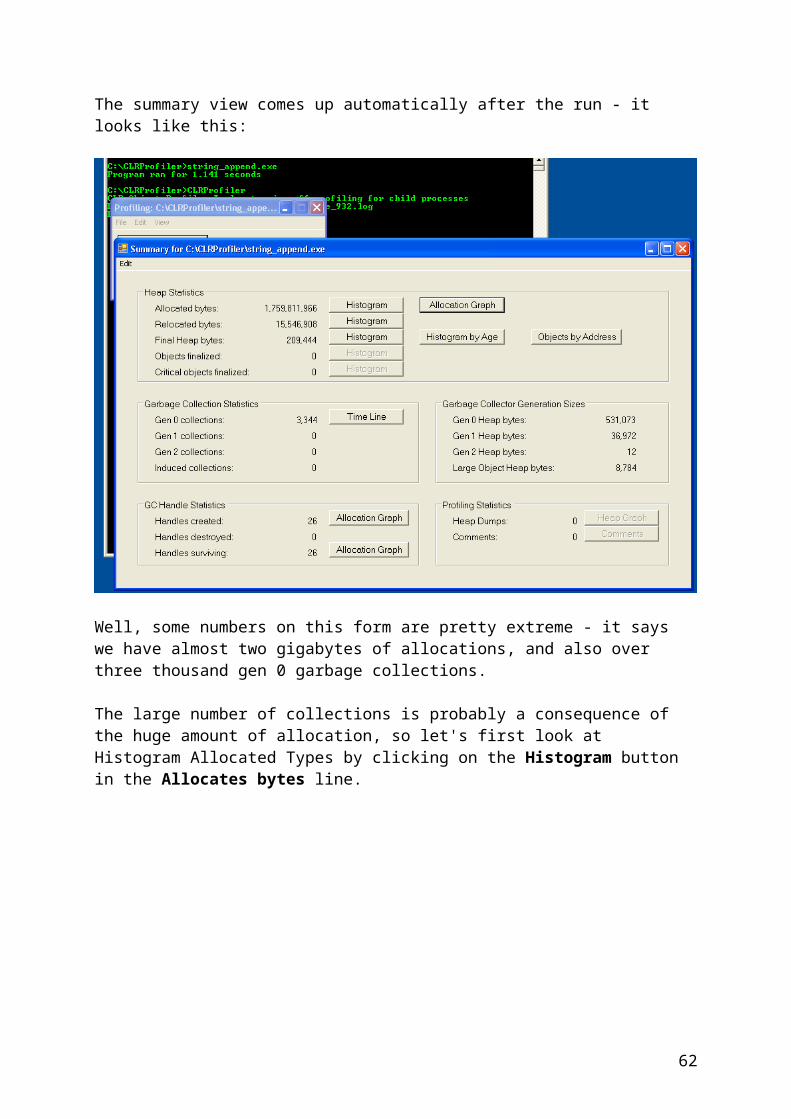
The summary view comes up automatically after the run - it looks like this:
53
Well, some numbers on this form are pretty extreme - it says we have almost two gigabytes of allocations, and also over three thousand gen 0 garbage collections.
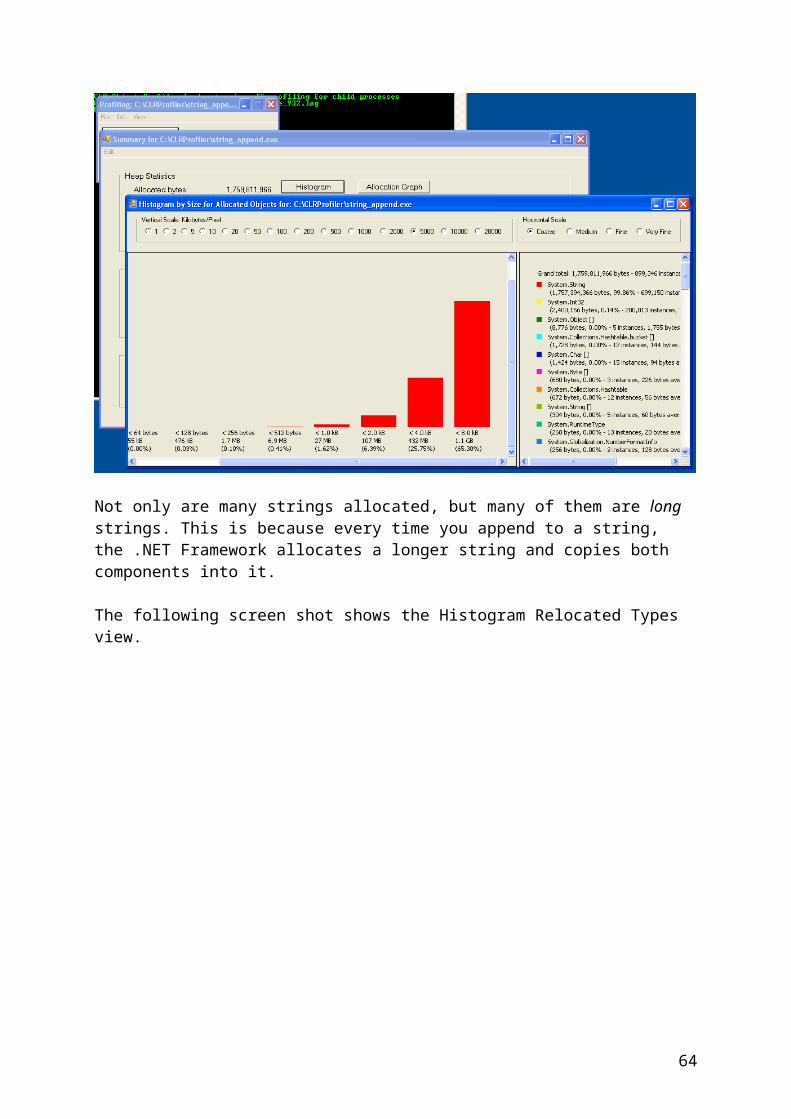
The large number of collections is probably a consequence of the huge amount of allocation, so let's first look at Histogram Allocated Types by clicking on the Histogram button in the Allocates bytes line.
54
Not much appears at first. But the view does show this: The total amount of memory allocated is almost 2 gigabytes. This means the program
allocates way over a gigabyte per second when it is not running under the profiler. That is actually quite a respectable performance by the garbage collector.
What is allocated is almost entirely composed of strings – 99.86 percent. Everything else is negligible.
The following screen shot shows the left pane scrolled to the right.
55
Not only are many strings allocated, but many of them are long strings. This is because every time you append to a string, the .NET Framework allocates a longer string and copies both components into it.
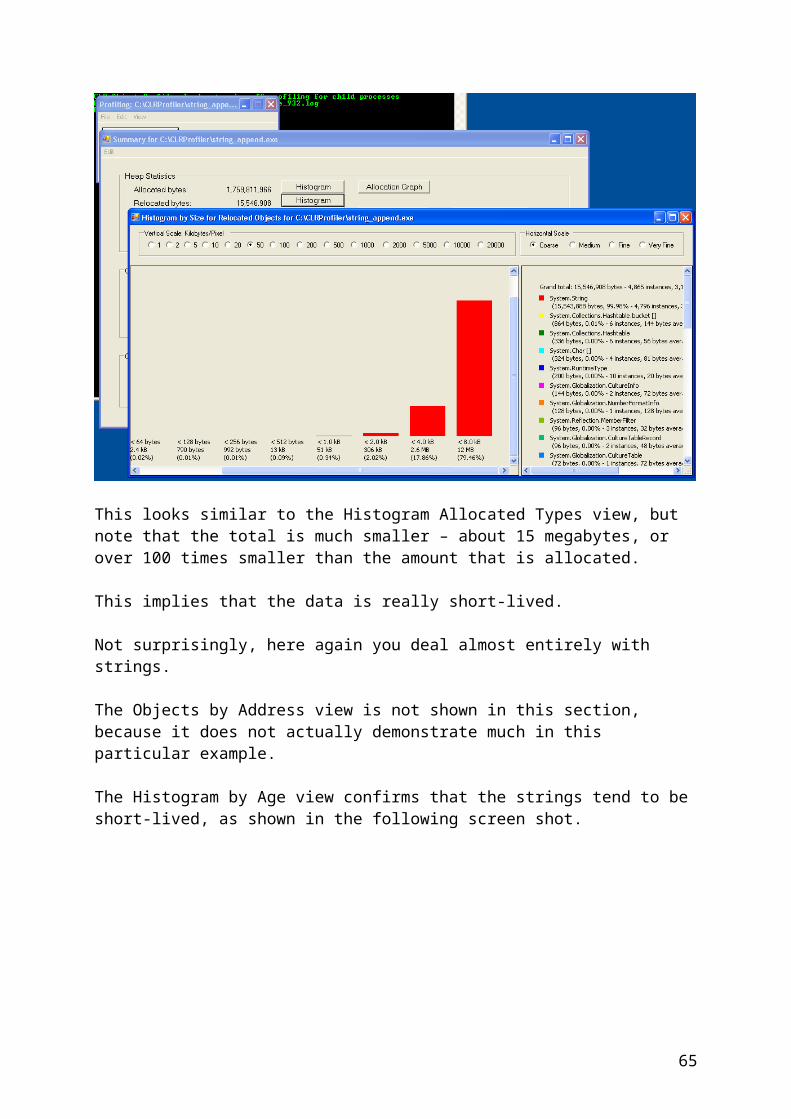
The following screen shot shows the Histogram Relocated Types view.
This looks similar to the Histogram Allocated Types view, but note that the total is much smaller – about 15 megabytes, or over 100 times smaller than the amount that is allocated.
This implies that the data is really short-lived.
Not surprisingly, here again you deal almost entirely with strings.
The Objects by Address view is not shown in this section, because it does not actually demonstrate much in this particular example.
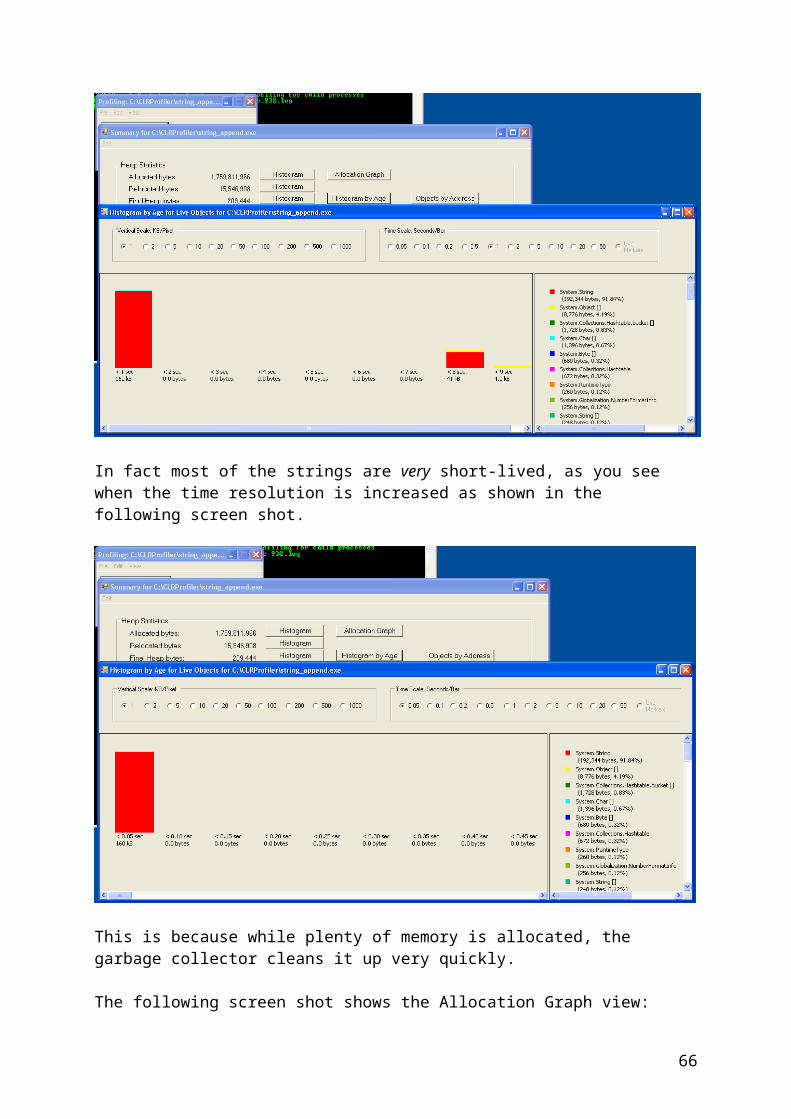
The Histogram by Age view confirms that the strings tend to be short-lived, as shown in the following screen shot.
56
In fact most of the strings are very short-lived, as you see when the time resolution is increased as shown in the following screen shot.
This is because while plenty of memory is allocated, the garbage collector cleans it up very quickly.
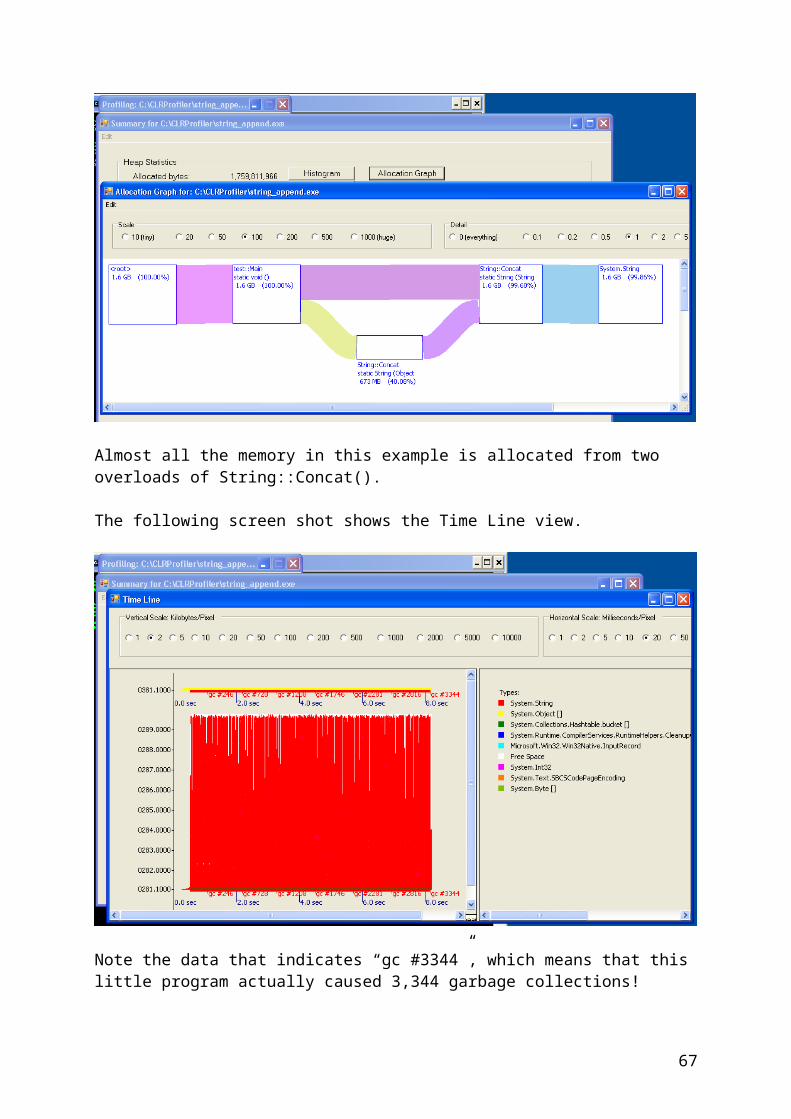
The following screen shot shows the Allocation Graph view:
57
Almost all the memory in this example is allocated from two overloads of String::Concat().
The following screen shot shows the Time Line view.
Note the data that indicates “gc #3344”, which means that this little program actually caused 3,344 garbage collections!
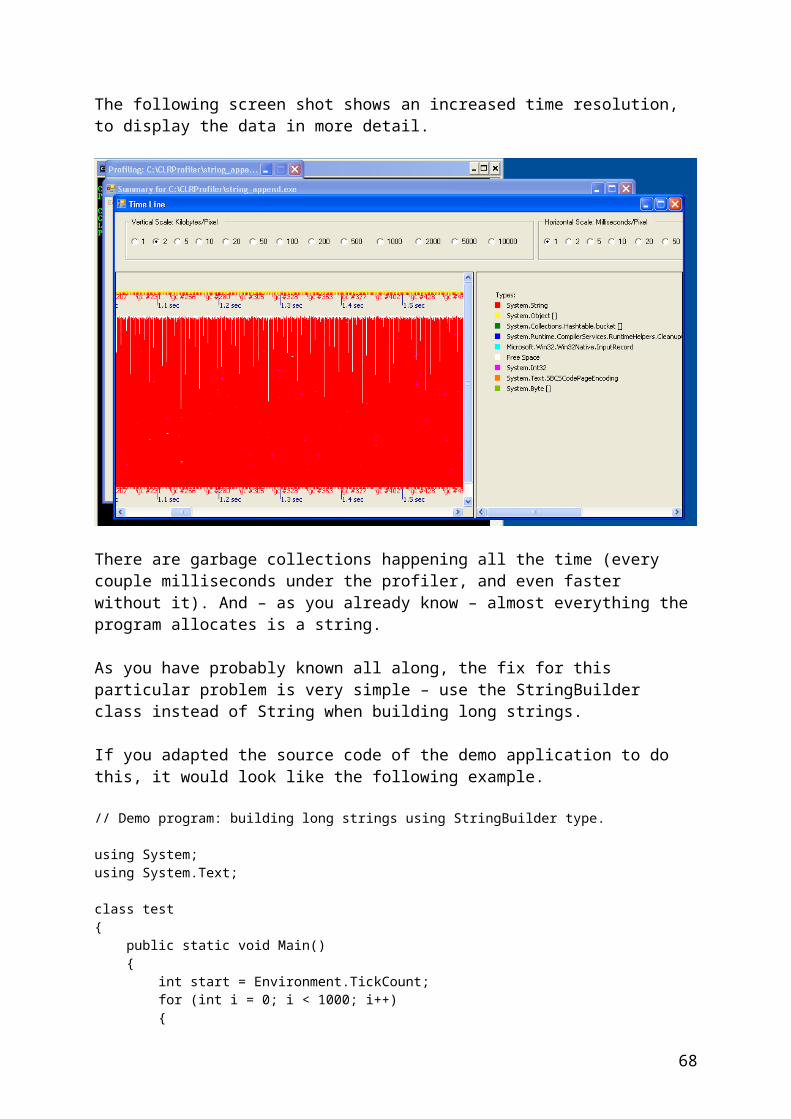
The following screen shot shows an increased time resolution, to display the data in more detail.
58
There are garbage collections happening all the time (every couple milliseconds under the profiler, and even faster without it). And – as you already know – almost everything the program allocates is a string.
As you have probably known all along, the fix for this particular problem is very simple – use the StringBuilder class instead of String when building long strings.
If you adapted the source code of the demo application to do this, it would look like the following example.
// Demo program: building long strings using StringBuilder type.
using System;using System.Text;
class test{ public static void Main() { int start = Environment.TickCount; for (int i = 0; i < 1000; i++) { StringBuilder sb = new StringBuilder(); for (int j = 0; j < 100; j++) { sb.Append("Outer index = "); sb.Append(i); sb.Append(" Inner index = "); sb.Append(j); sb.Append(" "); } string s = sb.ToString(); } Console.WriteLine("Program ran for {0} seconds", 0.001*(Environment.TickCount - start));
59
}}
This code looks a bit less elegant now, but is a lot faster. On 2.4 GHz Opteron computer described before, it prints the following:
C:\CLRProfiler>stringbuilder_append.exeProgram ran for 0.156 seconds
Thus, it is about 7 times faster than the original – not bad for such a simple change.
CLRProfiler should be able to tell you a bit about how this improved speed comes about, using the same views as with the first version of the demo application.
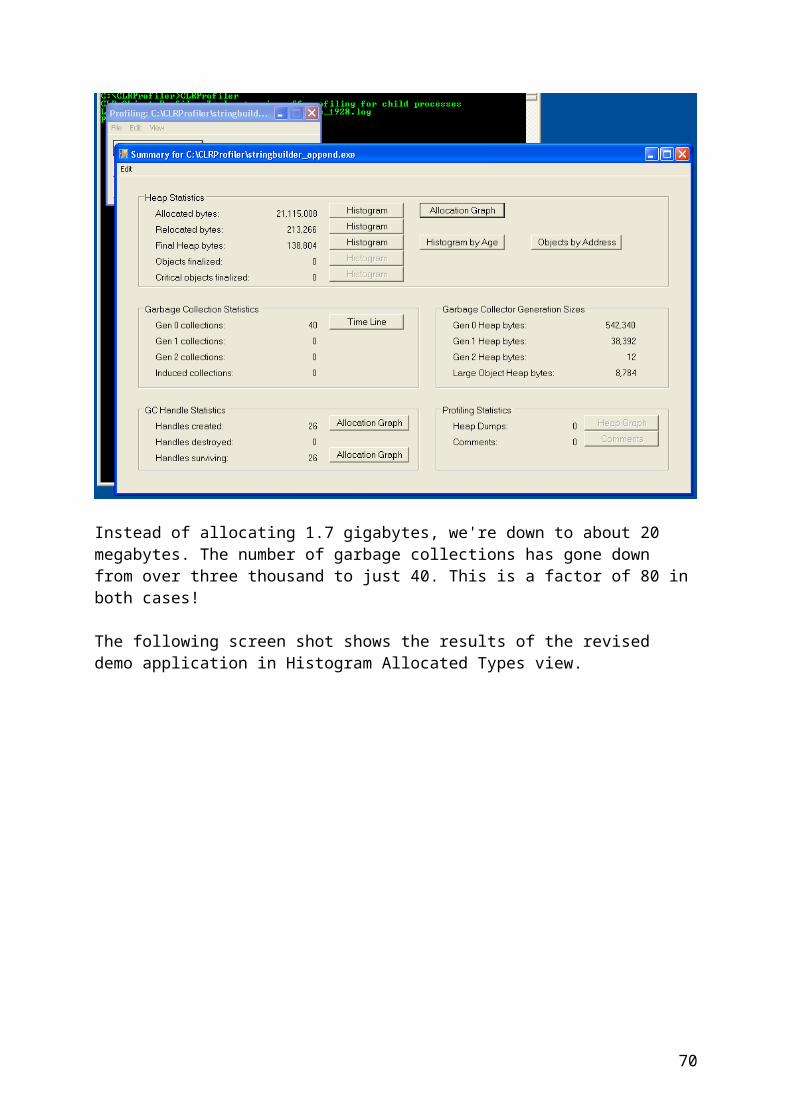
As always, the summary view comes up automatically:
Instead of allocating 1.7 gigabytes, we're down to about 20 megabytes. The number of garbage collections has gone down from over three thousand to just 40. This is a factor of 80 in both cases!
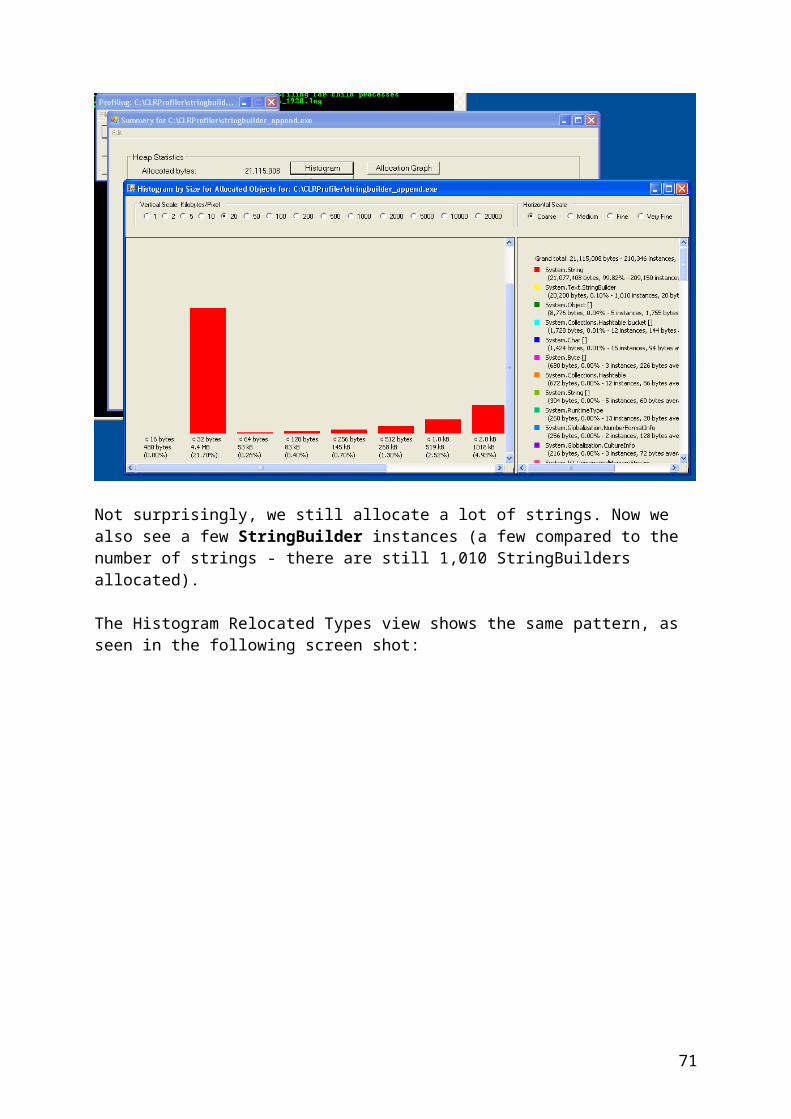
The following screen shot shows the results of the revised demo application in Histogram Allocated Types view.
60
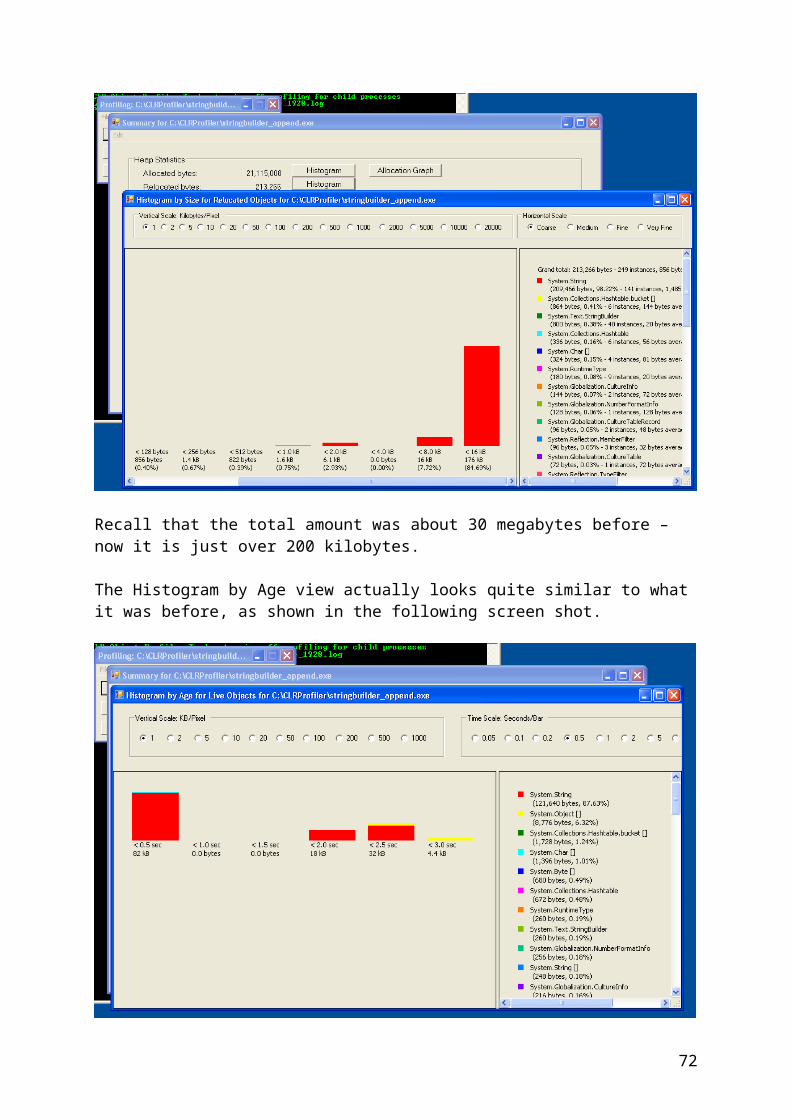
Not surprisingly, we still allocate a lot of strings. Now we also see a few StringBuilder instances (a few compared to the number of strings - there are still 1,010 StringBuilders allocated).
The Histogram Relocated Types view shows the same pattern, as seen in the following screen shot:
61
Recall that the total amount was about 30 megabytes before – now it is just over 200 kilobytes.
The Histogram by Age view actually looks quite similar to what it was before, as shown in the following screen shot.
The objects are still very short-lived, not surprisingly.
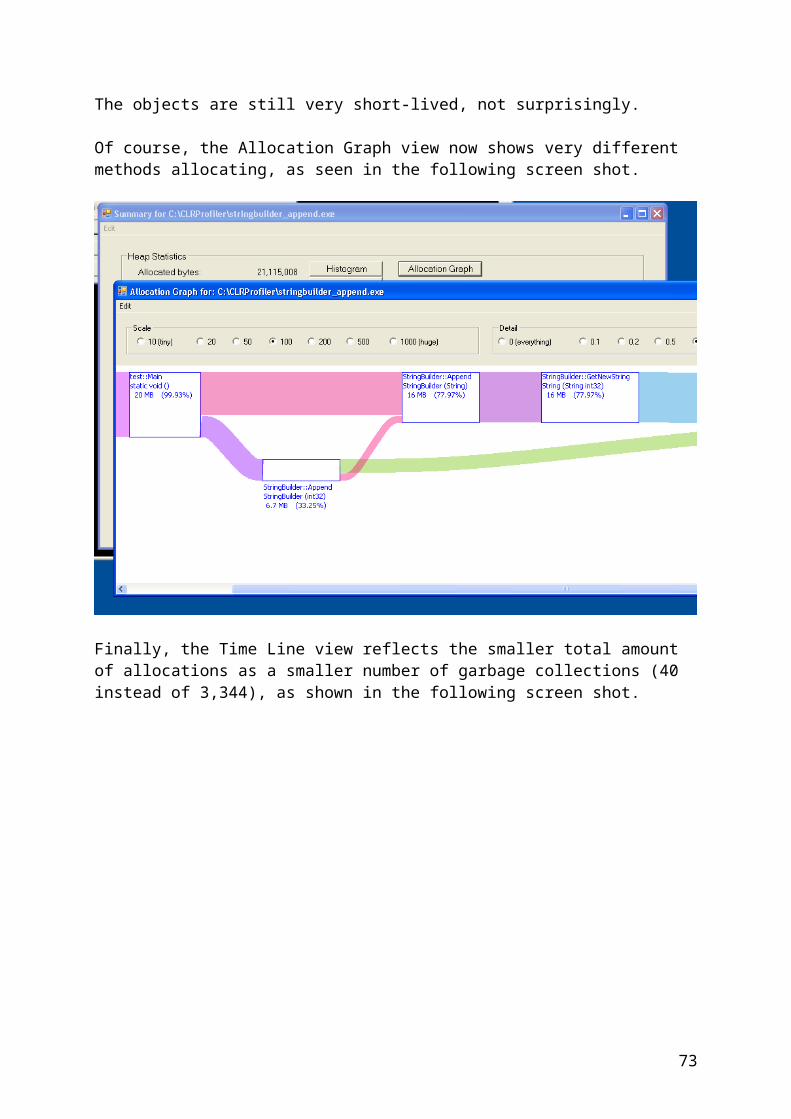
Of course, the Allocation Graph view now shows very different methods allocating, as seen in the following screen shot.
62

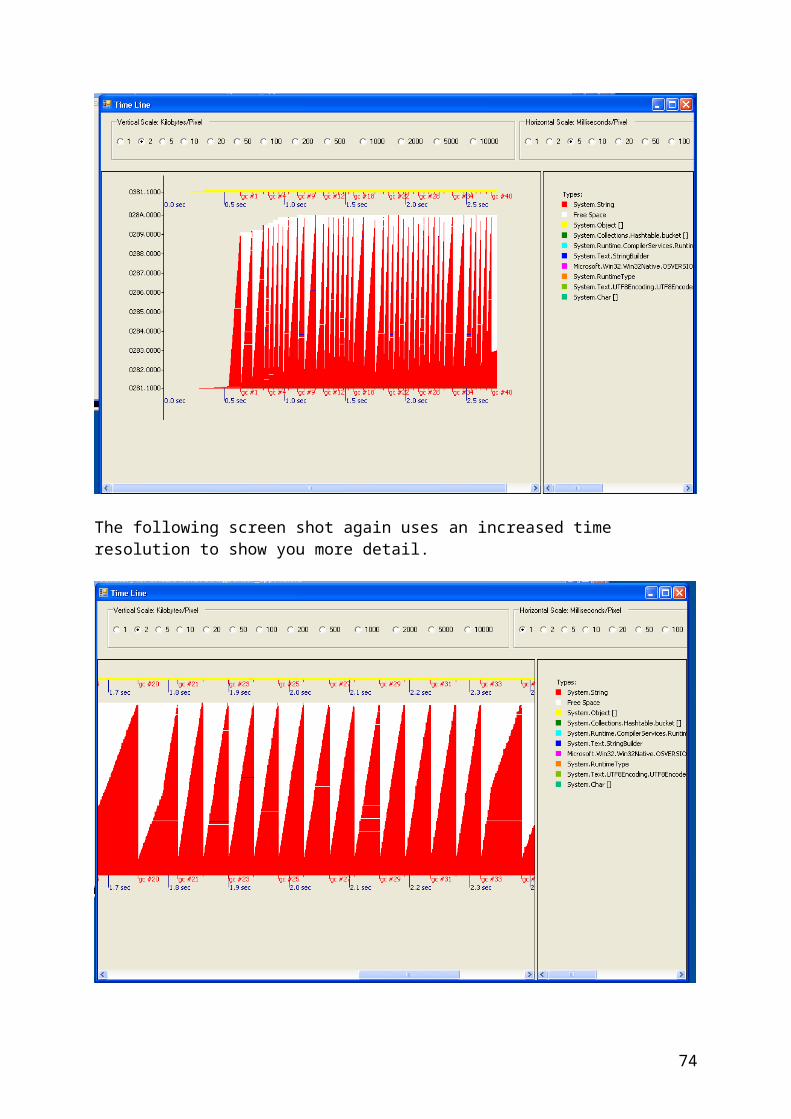
Finally, the Time Line view reflects the smaller total amount of allocations as a smaller number of garbage collections (40 instead of 3,344), as shown in the following screen shot.
The following screen shot again uses an increased time resolution to show you more detail.
63
Now you can actually see the effect of allocations and individual garbage collections – the memory usage steadily rises until a garbage collection kicks in and cleans up memory again, yielding a very characteristic saw-tooth pattern.
Holding on to memory for too longAnother common problem is to hold on to memory for too long. Not necessarily forever (that would be a leak, and that type of problem is covered later in this article), but far longer than is really necessary.
A popular way to fall into this trap (though there are others – caches, slow I/O, and so on) is with finalizers. The finalizer has to run, and it still needs the object. Thus, an object with a finalizer has to survive at least one additional garbage collection even if it is no longer reachable from the program.
To illustrate what this chapter is about, the following (somewhat nonsensical) example allocates many objects with finalizers.
// Demo program for the performance perils of finalizers.
using System;using System.Drawing;
class test{ public static void Main() { int start = Environment.TickCount; for (int i = 0; i < 100*1000; i++)
64
{ Brush b = new SolidBrush(Color.Black); // Brush has a finalizer
string s = new string(' ', i % 37);
// Do something with the brush and the string. // For example, draw the string with this brush - omitted... } Console.WriteLine("Program ran for {0} seconds", 0.001*(Environment.TickCount - start)); }}
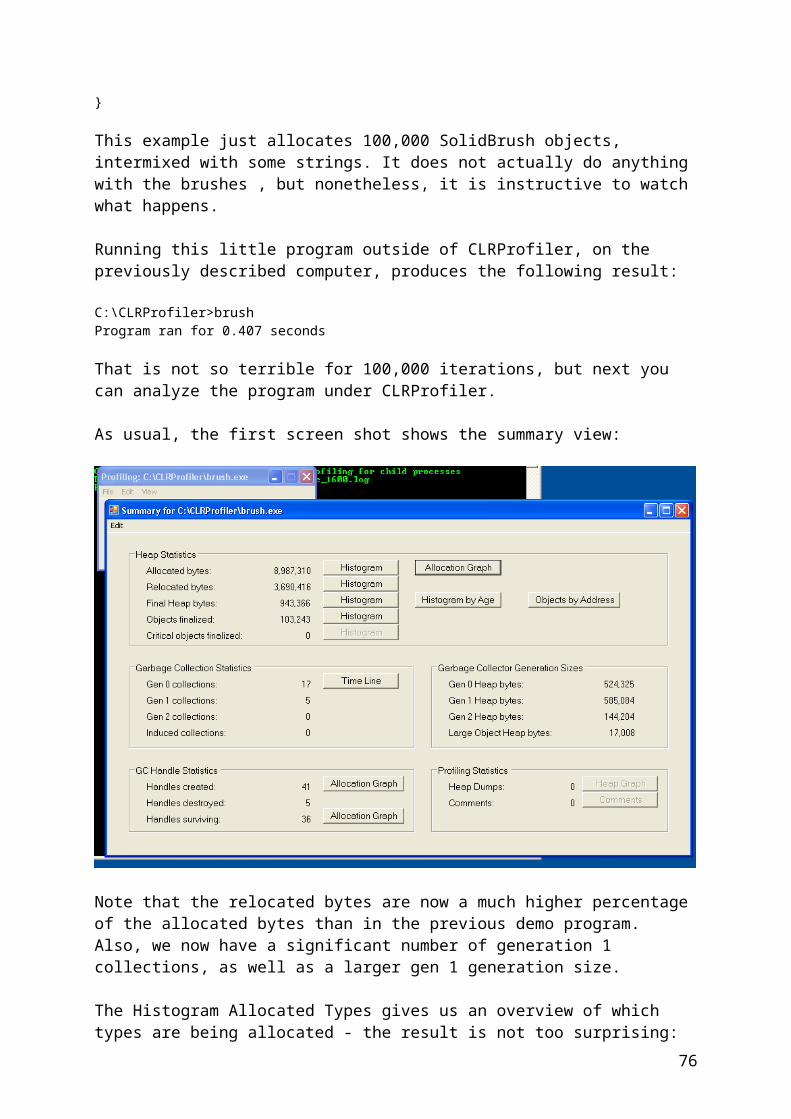
This example just allocates 100,000 SolidBrush objects, intermixed with some strings. It does not actually do anything with the brushes , but nonetheless, it is instructive to watch what happens.
Running this little program outside of CLRProfiler, on the previously described computer, produces the following result:
C:\CLRProfiler>brushProgram ran for 0.407 seconds
That is not so terrible for 100,000 iterations, but next you can analyze the program under CLRProfiler.
As usual, the first screen shot shows the summary view:
65
Note that the relocated bytes are now a much higher percentage of the allocated bytes than in the previous demo program. Also, we now have a significant number of generation 1 collections, as well as a larger gen 1 generation size.
The Histogram Allocated Types gives us an overview of which types are being allocated - the result is not too surprising:
Note two things here: Total allocation is about 9 megabytes. The program allocates mostly SolidBrush (all of one size) and String objects (of
varying sizes); this is what the main loop does.
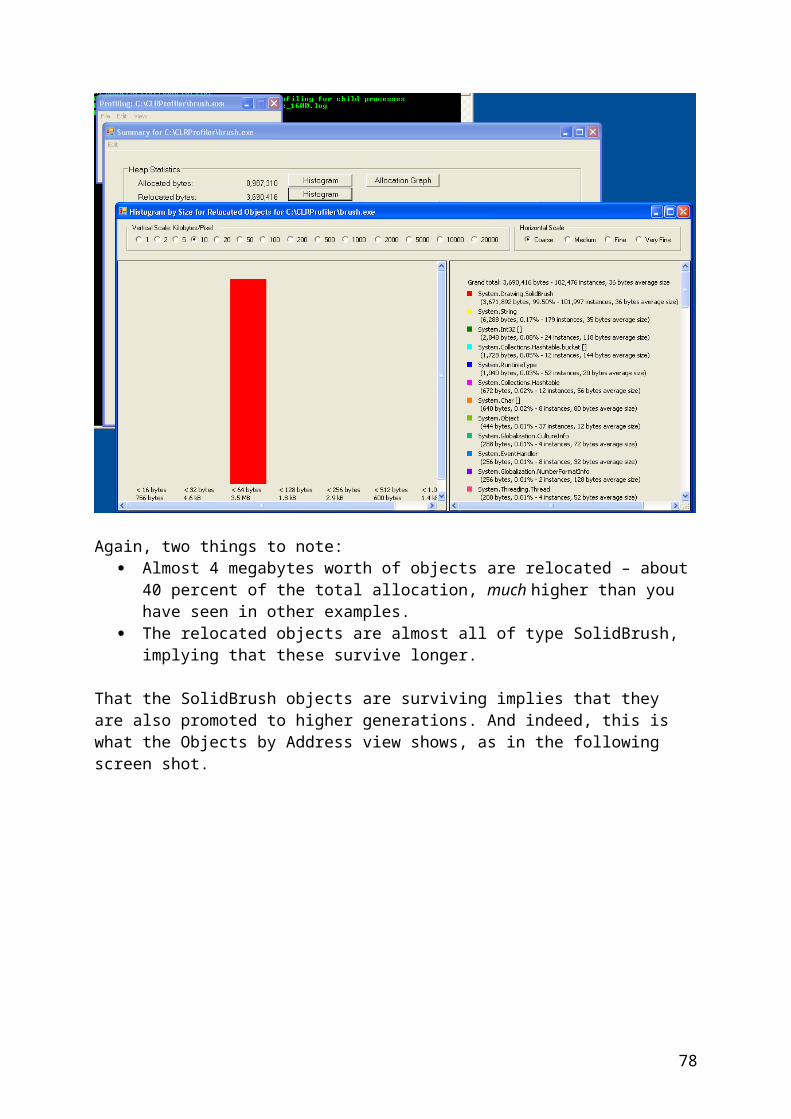
Now contrast this with what the Histogram Relocated Types view shows, as in the following screen shot:
66
Again, two things to note: Almost 4 megabytes worth of objects are relocated – about 40 percent of the total
allocation, much higher than you have seen in other examples. The relocated objects are almost all of type SolidBrush, implying that these survive
longer.
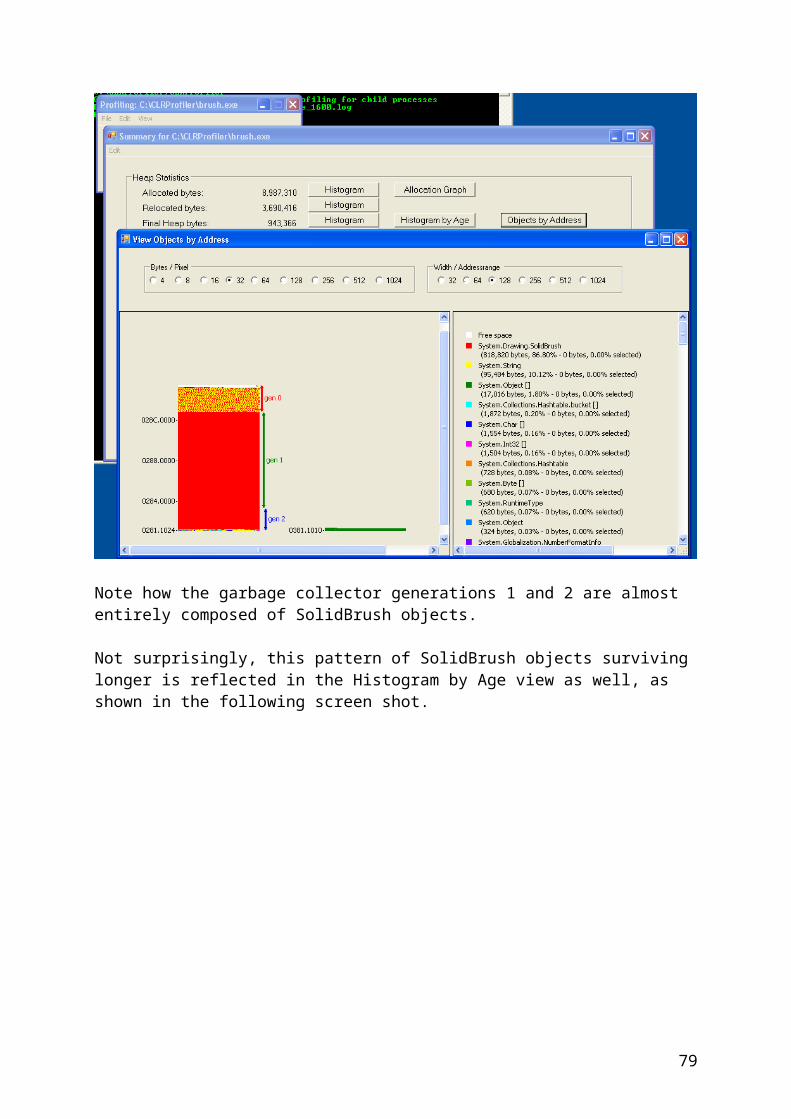
That the SolidBrush objects are surviving implies that they are also promoted to higher generations. And indeed, this is what the Objects by Address view shows, as in the following screen shot.
67
Note how the garbage collector generations 1 and 2 are almost entirely composed of SolidBrush objects.
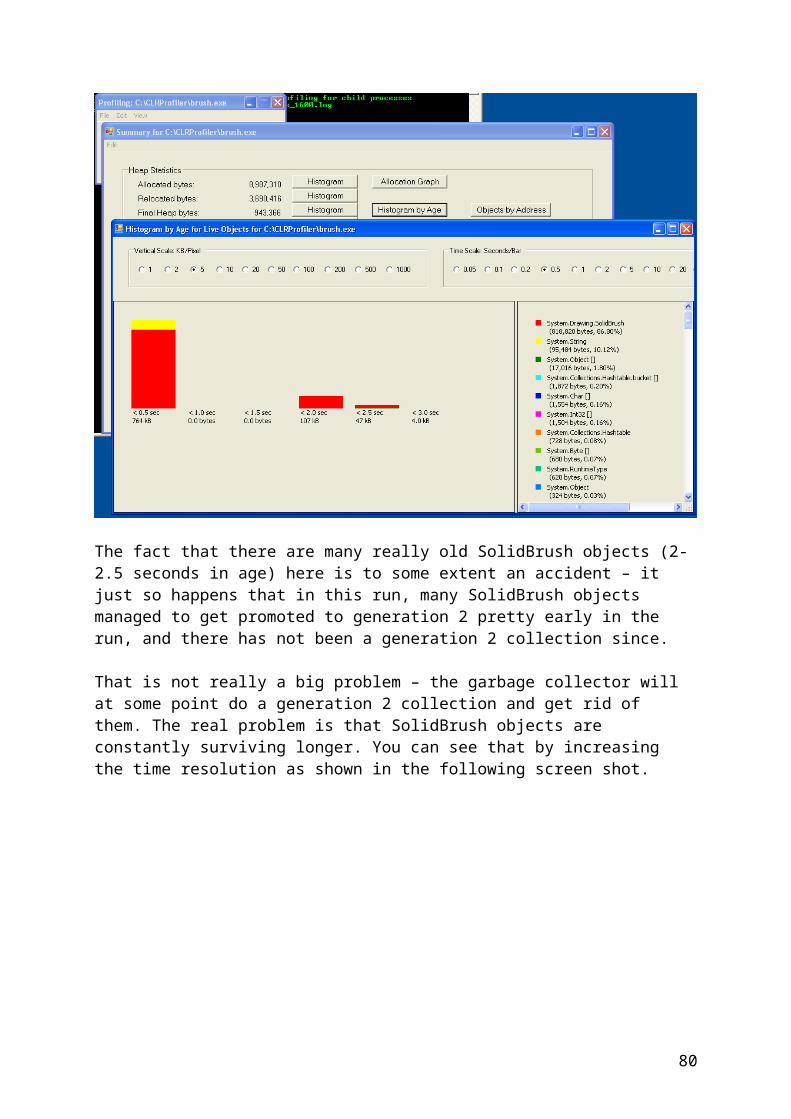
Not surprisingly, this pattern of SolidBrush objects surviving longer is reflected in the Histogram by Age view as well, as shown in the following screen shot.
68
The fact that there are many really old SolidBrush objects (2-2.5 seconds in age) here is to some extent an accident – it just so happens that in this run, many SolidBrush objects managed to get promoted to generation 2 pretty early in the run, and there has not been a generation 2 collection since.
That is not really a big problem – the garbage collector will at some point do a generation 2 collection and get rid of them. The real problem is that SolidBrush objects are constantly surviving longer. You can see that by increasing the time resolution as shown in the following screen shot.
69
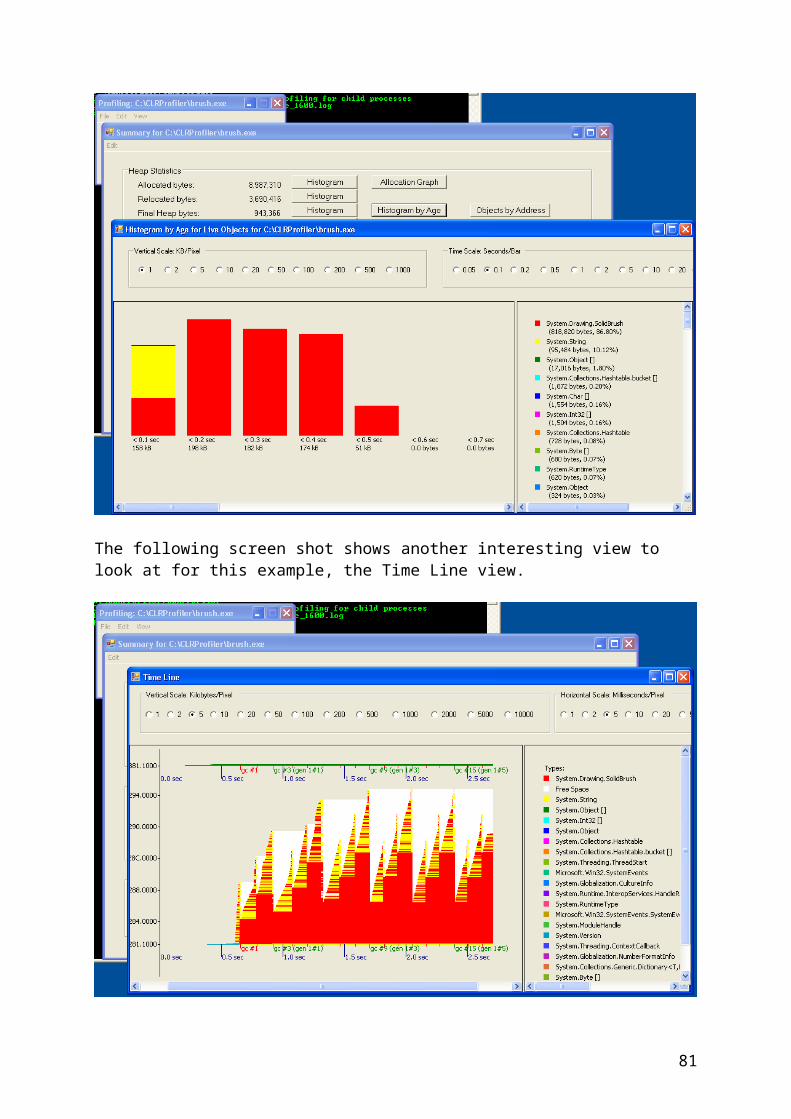
The following screen shot shows another interesting view to look at for this example, the Time Line view.
Here you can see a double saw-tooth pattern – the generation 0 collections get rid of strings, while the brushes survive. After a while, a generation 1 collection takes care of cleaning up
70
the brushes. The following screen shot shows an increased resolution to display this in more detail.
In this screen shot, one of these cycles is selected: at the start, there is a generation 1 collection (labeled “gc #12 (gen 1#4)”), after which each generation 0 collection (labeled “gc #13” thru “gc #14” ) gets rid of strings, but compacts the surviving SolidBrush objects down. Finally, another generation 1 collection (“gc #15 (gen 1#5)”) cleans up the SolidBrush objects whose finalizers have run in the meantime.
You may wonder why this view shows an irregular pattern of brushes and strings being allocated, while the demo application always allocates a brush followed by a string. This is simply because of the algorithm this view uses to determine the color to use for a certain pixel. Conceptually, the view just translates the pixel coordinates to an address and a time, and it bases the color of the pixel on the type of object that was in the heap at that time and address. The resolution of the screen is limited, and so the view can only show a sample.
Finally, looking at the Call Tree view it becomes totally obvious how many finalizers have to run, as shown in the following screen shot.
71
To get this view, you can click through the thread tabs on top until you find the finalizer thread.
Note especially that NATIVE FUNCTION (UNKNOWN ARGUMENTS) is shown as triggering a total of 798,370 calls. In other words, that's the number of method calls needed to finalize up all the SolidBrush objects.
So what do you do if you have this kind of problem?
This certainly does not suggest that you get rid of finalizers altogether. (Though if you have useless finalizers, do get rid of them.)
Instead, there are two things you should do: If you are implementing an object with a finalizer, consider implementing the Dispose
pattern. This gives users of your object the choice to clean up the object early. Your Dispose method should then notify the garbage collector that finalization is no longer required (via GC.SuppressFinalize). The finalizer is still there in case the user of such an object forgot to call Dispose.
If you are allocating such an object, you should either call Dispose yourself, or, if you are programming in C#, employ the using statement that does this automatically, even if exceptions are thrown in the middle of your code.
In this case, you were just a user of SolidBrush objects, and thus the second alternative applies. The example is written in C# and thus an obvious way to fix the problem is to rewrite it with the using statement:
// Demo program for the performance perils of finalizers.
72
using System;using System.Drawing;
class test{ public static void Main() { int start = Environment.TickCount; for (int i = 0; i < 100*1000; i++) { using (Brush b = new SolidBrush(Color.Black)) // Brush has a finalizer { string s = new string(' ', i % 37);
// Do something with the brush and the string. // For example, draw the string with this brush - omitted... } // After the using statement, Dispose will automatically be called, // thus the finalizer does not have to run. } Console.WriteLine("Program ran for {0} seconds", 0.001*(Environment.TickCount - start)); }}
After compiling this, first run it to see if it makes any difference in speed:
C:\CLRProfiler>brushProgram ran for 0.313 seconds
Recall that before, it was 0.407 seconds, so now it is almost 25 percent faster.
Let's run the application again through the CLRProfiler views to note what has changed.
The summary view already shows a difference - the number of relocated bytes, and the size of generation 1 both went down a lot:
73
The number of allocated bytes stayed the same, and thus Histogram Allocated Types view also has not changed:
However, the Histogram Relocated Types view shows a dramatic difference - look at the the following screen shot:
74
In fact, there are two important things to notice here: Instead of nearly 4 megabytes of objects being relocated, it is now down to about 11
kilobytes. The SolidBrush objects that survived in droves before are now not even visible. Yes,
they are indeed still there, but their contribution has become negligible.
The Objects by Address view reflects the same effect, as shown in the following screen shot.
75
So now the large number of SolidBrush objects promoted into generations 1 and 2 is just gone. (The layer of objects at the top of generation 0 is stuff allocated by the final Console.WriteLine statement - remember the Objects by Address view gives you the final state of the heap by default).
Not surprisingly, the Histogram by Age view shows a much shorter lifetime for SolidBrush objects in the following screen shot.
In fact, for this screen shot the time resolution has been increased almost to the maximum, and still very few SolidBrush objects are shown to survive.
Clearly, this improvement has to show up in the Time Line view as well, as shown in the following screen shot.
76

The following screen shot again increases the resolution to show that the pattern of garbage collections is now indeed quite different.
Now there are very frequent generation 0 collections. These clean up almost everything that was allocated, and generation 1 and 2 collections have become very rare.
Finally, the fact that the finalizers for SolidBrush are not run anymore is also reflected in the following screen shot of the Call Tree view.
77
Also, note that the total number of calls from the finalizer thread has gone down from almost a million to just 53.
Tracking down memory leaksYou might have heard that the garbage collector eliminates memory leaks.
This is true in a sense – what cannot happen any more is that you allocate some memory, completely forget about it, and never free it.
The garbage collector will discover that you do not have a reference to an object, and so it can clean up the object and recycle the memory.
What you can still do is allocate some object, remember the reference somewhere, but nonetheless never reference the object again.
This might be perfectly all right – your program might have stored something, and still needs to hold on to it, but just has not needed to refer again to it yet.
On the other hand, you might also have a list, a cache, or an array that is constantly growing, remembering new information but never letting go of old data. This situation is another sort of memory leak, and it can really be a problem for long-running applications.
This type of problem is important enough that CLRProfiler has special mechanisms built into it to help you find out whether you have this sort of problem, and to help you pinpoint the cause.
78
The program provided for this demonstration illustrates the problem simply– it leaks, but it leaks only a little bit, and you could use the program without noticing the leak.
This program is a bit more complicated, and so is explained in several easy steps.
First of all, the example is about computing the Fibonacci function. The following code example shows a simple recursive implementation of this function in C#.
// Recursive version of Fibonacci - slow. static int Fibo(int i) { if (i <= 1) return i; else return Fibo(i-1) + Fibo(i-2); }
In fact, this function is very recursive and hence very slow. The bigger the argument, the slower it gets. Computing Fibo(40) takes several seconds on the previously described computer, while Fibo(45) takes almost a minute. And it keeps getting slower.
If you investigate a bit, you see that the reason for the slowness is simply that the program keeps computing the same partial results again and again and again.
Thus, a simple way to speed it up is to cache results, as shown in the following example.
// Still recursive, but remembers previous results - much faster. static int Memo_Fibo(int i) { int result;
if (!fibo_memo.FindResult(i, out result)) { if (i <= 1) result = i; else result = Memo_Fibo(i-1) + Memo_Fibo(i-2); }
// This call leaks memory, // because it always adds to the list. fibo_memo.Enter(i, result);
return result; }
You can simply look in a cache to determine whether you already computed Fibo with this argument. If so, you simply return the previous result; otherwise, you compute it. And of course, if you compute it, you enter it into the cache. The following example shows how the cache works. It is nothing fancy – a linear list, with ways to search and enter new information.
// List to remember association of previous arguments and results. class ListEntry { int argument; int result;
79
ListEntry next;
public ListEntry(int argument, int result, ListEntry next) { this.argument = argument; this.result = result; this.next = next; }
public bool FindResult(int argument, out int result) { if (this.argument == argument) { result = this.result; return true; } else if (next != null) { return next.FindResult(argument, out result); } else { result = 0; return false; } } }
ListEntry memoList;
public Memo() { memoList = null; }
void Enter(int argument, int result) { memoList = new ListEntry(argument, result, memoList); }
bool FindResult(int argument, out int result) { if (memoList != null) { return memoList.FindResult(argument, out result); } else { result = 0; return false; } }
Finally, the testing code to drive it all looks like the following example.
public static void Main() { while (true) { Console.WriteLine("Press any key to continue"); Console.ReadLine(); for (int i = 0; i < 40; i++)
80
Console.WriteLine("Memo_Fibo({0}) = {1}", i, Memo_Fibo(i)); } }
Next, analyze this example using CLRProfiler.
Start the application under CLRProfiler. When it comes up, it prompts you to “Press any key to continue.” At this point, you can request a heap dump by clicking “Show Heap now”.
This view does not tell you much and it is not supposed to; the testing code has not even run yet, so this heap dump just gives you a baseline to compare against later snapshots.
Press Enter once and click Show Heap now again to get another heap dump, as shown in the following screen shot.
81
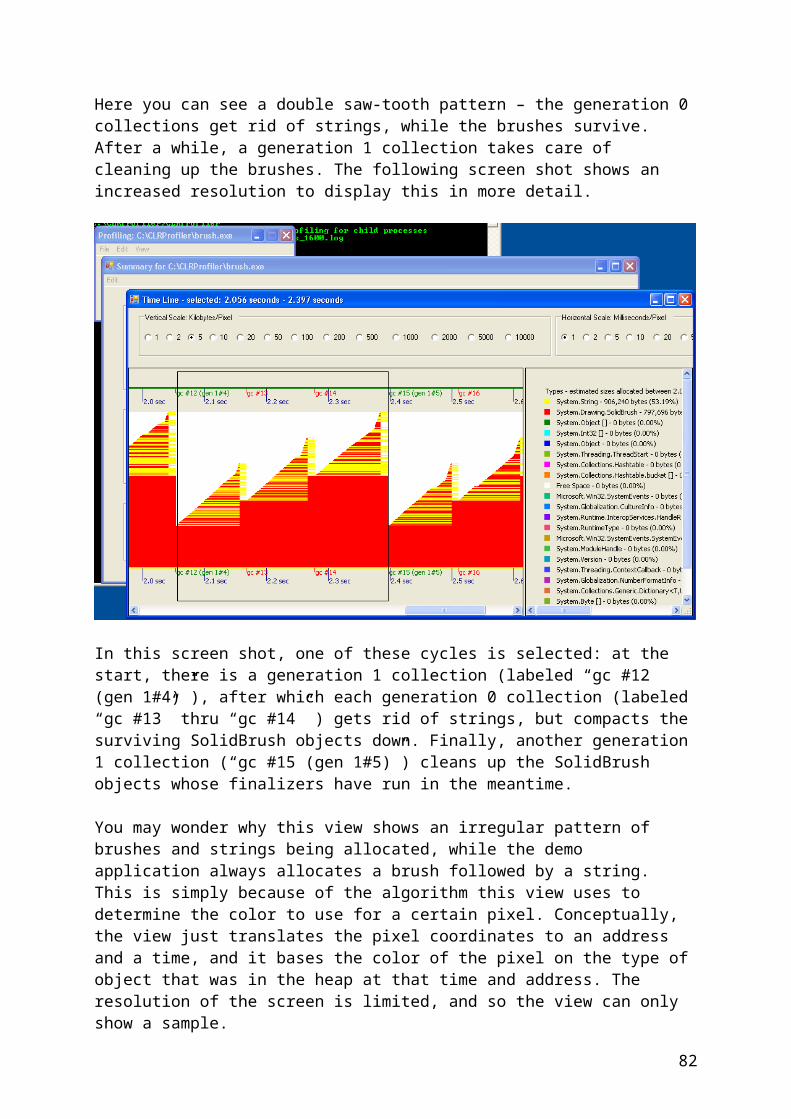
This view still does not show much, even though you can expect some new objects in the program’s cache of previous results. What is apparent is the fact that everything that was already there at the time of the previous heap dump gets shown in faded red.
The new objects show up in bright red, but their contribution in this case is relatively small. However, you can select Show New Objects from the shortcut menu, as shown in the following screen shot.
82
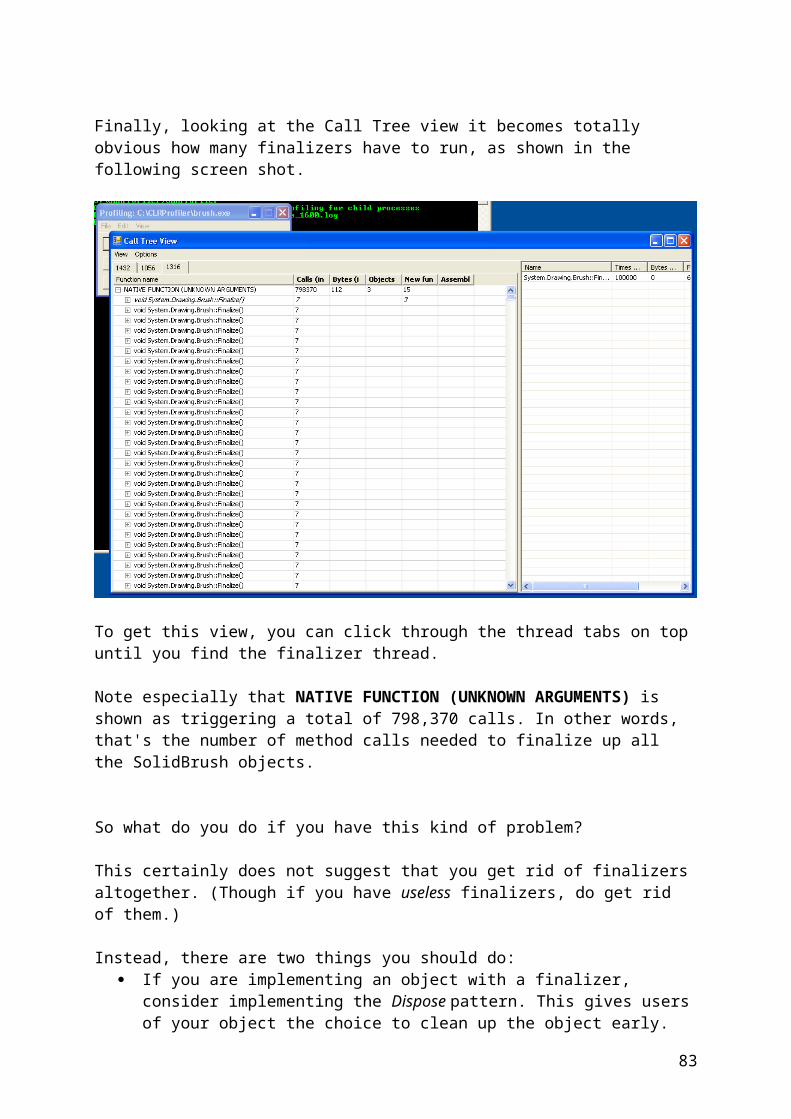
There are now 5.3 kilobytes of new objects present. The following screen shot is scrolled a bit to the right, so you can see what they are.
83
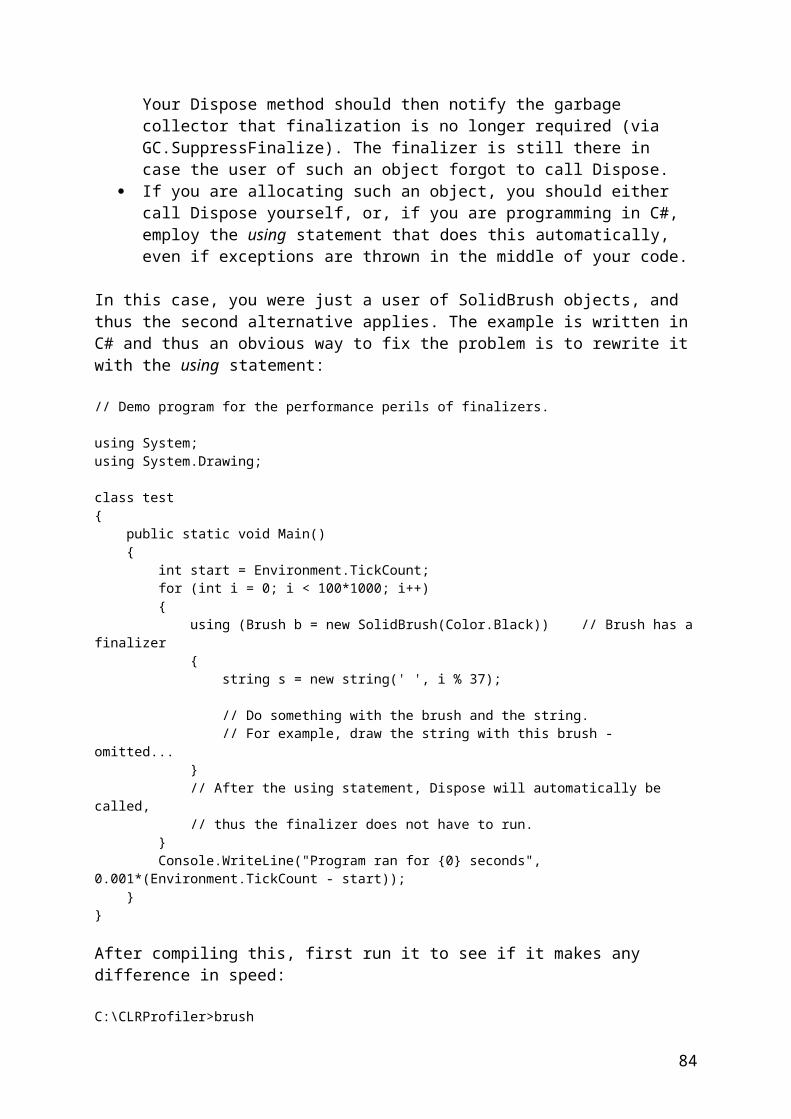
The Text.SBCSCodePageEncoding and Globalization.NumberFormatInfo items have to do with the Console.ReadLine and Console.WriteLine statements, and you can disregard them for now.
More interesting are the items labeled Memo.ListEntry – they are the linked list elements that you use to remember the results. Because of the way CLRProfiler groups objects, there are actually three boxes corresponding to these list elements: one for the first element in the list (the head element), one for the last (tail) element, and one for all the elements in between. In the screen shot above, the first element and the elements in between are shown, but not the tail element (for two reasons – it is suppressed by the detail setting, but even if it wasn’t, it would not appear on the screen without scrolling to the right).
All this is in a sense a dry run. You can expect the first run through the loop to allocate some list elements for results to remember. To be exact, you can expect about 40 such elements – after all, the testing loop runs up to 40. However, you see 114 plus one head element and one tail element. This indicates that something is indeed wrong.
Technical note: You might want to do a similar computation for your own programs. Try to determine for a given test case how many instances of certain types of objects you expect, and then try to determine whether your computation agrees with what CLRProfiler shows you.
Ignore for the moment the disagreement between the expected number of list elements, and the number CLRProfiler reported. Instead repeat the cycle and have the program compute the same results again. You might expect no additional list elements, as no new results should have been entered into the cache.
Unfortunately, you still get new list elements, about 40 of them, as shown in the following screen shot.
84
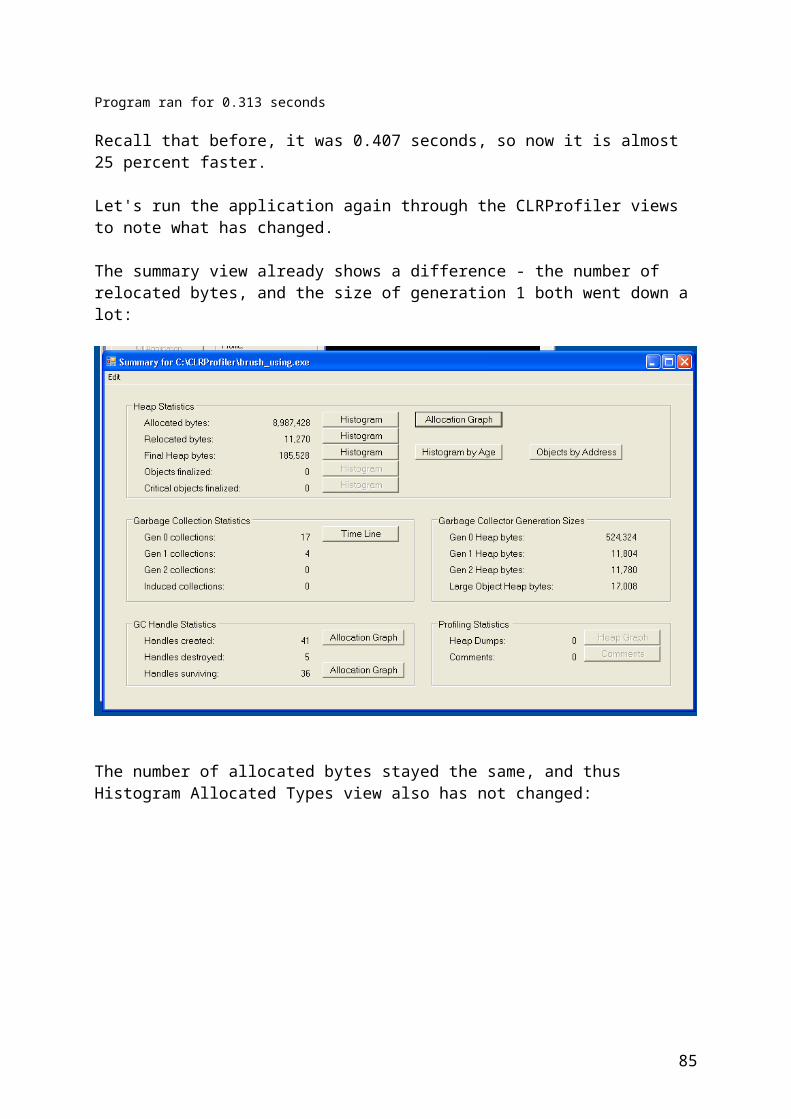
To find out where these new elements came from, click the right-most box in the graph, and when it is selected, use the Show Who Allocated command from the shortcut menu to show the allocation stack trace. The following screen shot shows the result.
From this screen shot, you can see that the Memo::Memo_Fibo method allocated these objects. The following example shows the source code of that method; if all the cache lookups succeed, why would any objects still be allocated?
static int Memo_Fibo(int i) { int result;
if (!fibo_memo.FindResult(i, out result)) { if (i <= 1) result = i; else result = Memo_Fibo(i-1) + Memo_Fibo(i-2); }
// This call leaks memory // because it always adds to the list. fibo_memo.Enter(i, result);
return result; }
The problem is that fibo_memo.Enter(i, result) gets executed whether or not the call fibo_memo.FindResult succeeded. Maybe the programmer intended Memo::Enter to not enter duplicate copies, but in order to ensure that, it would have to search the cache again. Thus, when the programmer implemented it, it seemed better to eliminate that burden of
85
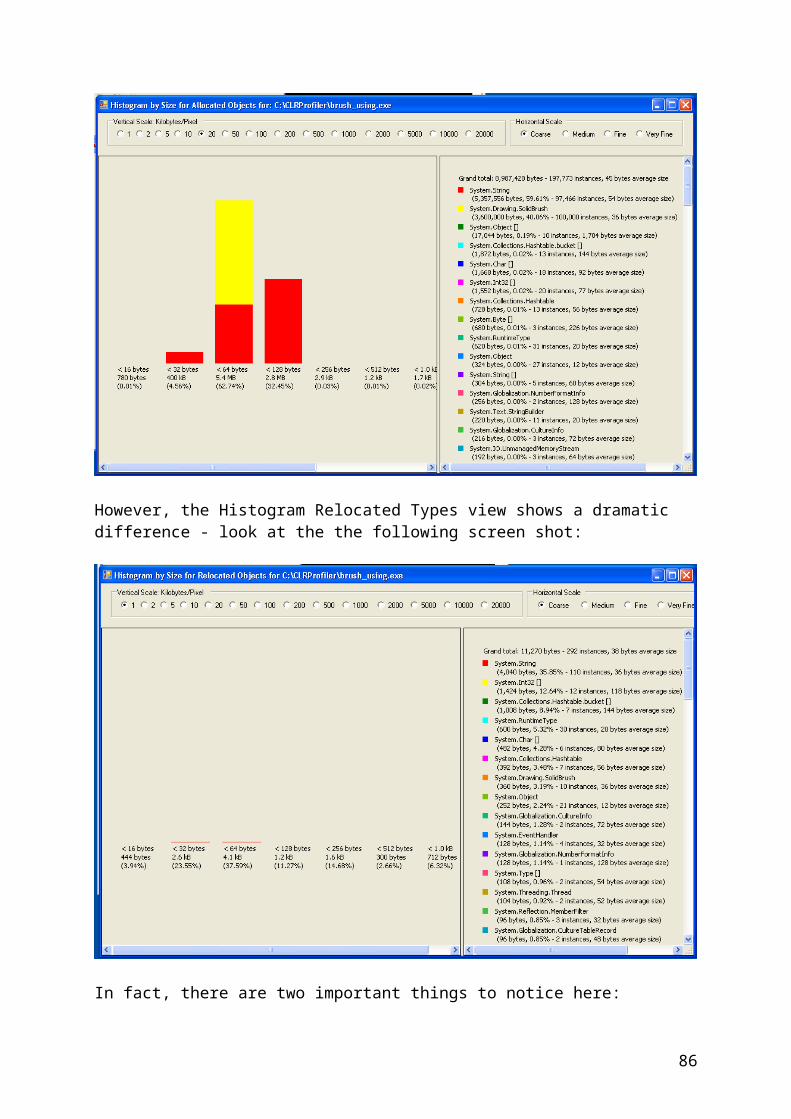
checking for the sake of efficiency. But now, the burden of checking for duplicates is on the calling method, and it was not updated.
You might wonder why Memo::Enter did not show up in the allocation graph. Memo::Enter is so simple that the JIT compiler could actually expand it inline.
Now it is also clear how to fix the memory leak – just move the statement fibo_memo.Enter(i, result)to the inside of the if-statement, as shown in the following code example.
static int Memo_Fibo(int i) { int result;
if (!fibo_memo.FindResult(i, out result)) { if (i <= 1) result = i; else result = Memo_Fibo(i-1) + Memo_Fibo(i-2);
// This version does not leak memory, // because it only adds to the list // if it does not find the argument. fibo_memo.Enter(i, result); }
return result; }
Next, run the corrected program through the same test.
The following screen shot shows the new objects after the first iteration of the test.
86
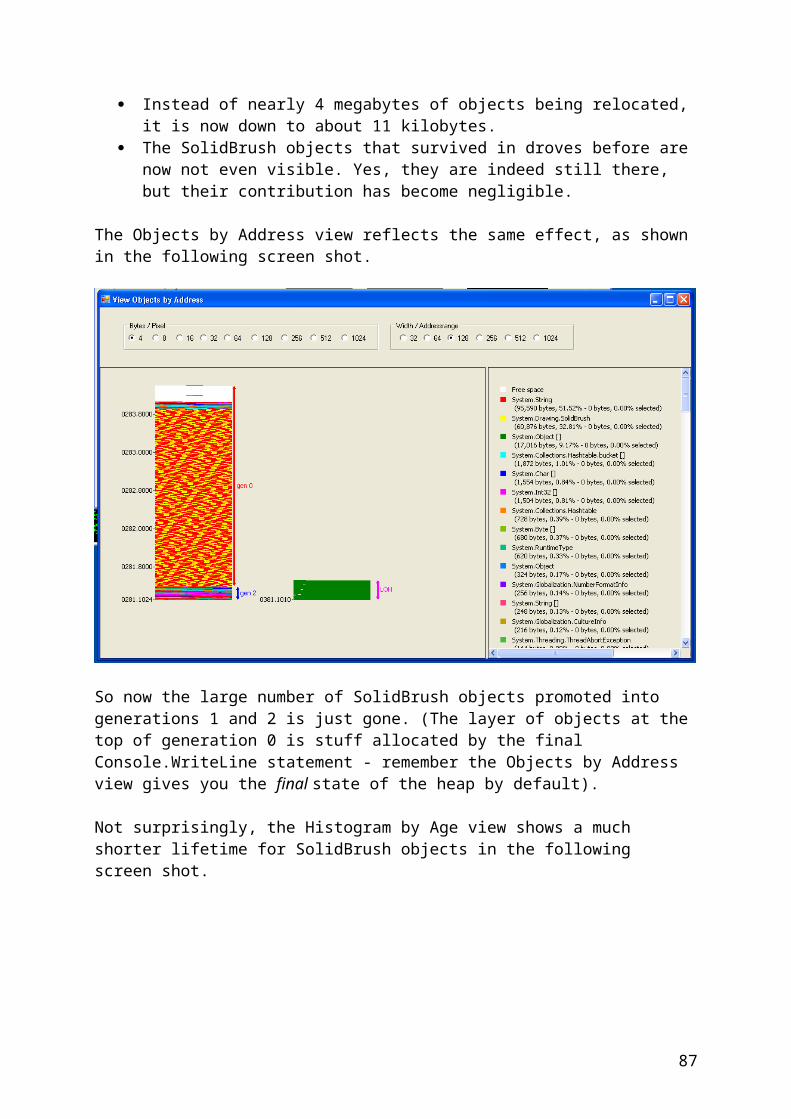
There were 114 ListEntry objects in that box before, and now there are 38. Clearly the memory leak also had an impact on the very first iteration of the test.
The following screen shot shows no resulting new objects from the second iteration.
87
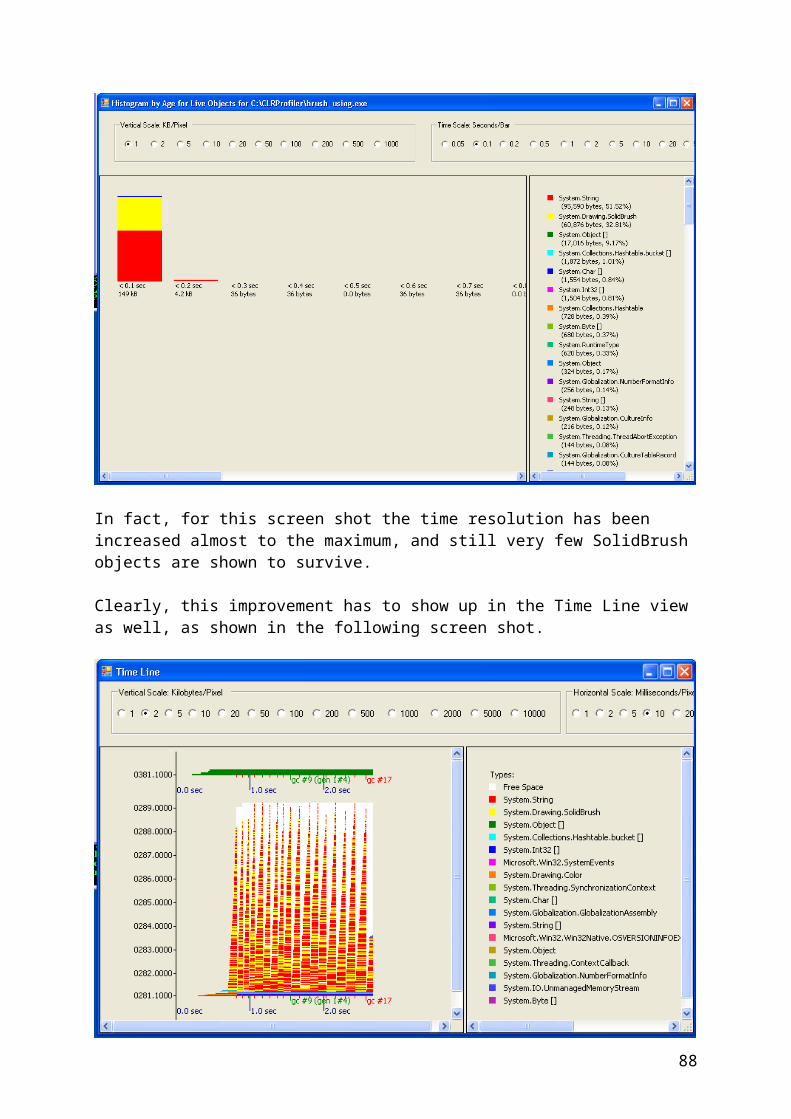
There are other techniques for finding out the same thing. The technique showed here is the most sensitive, that is, the one best suited to finding small leaks.
If the leak is bigger, it will make itself known in other ways. To simulate that, you can run the incorrect version through many more iterations.
The most obvious appearance of the leak, perhaps, is through the Time Line view, as shown in the following screen shot.
88
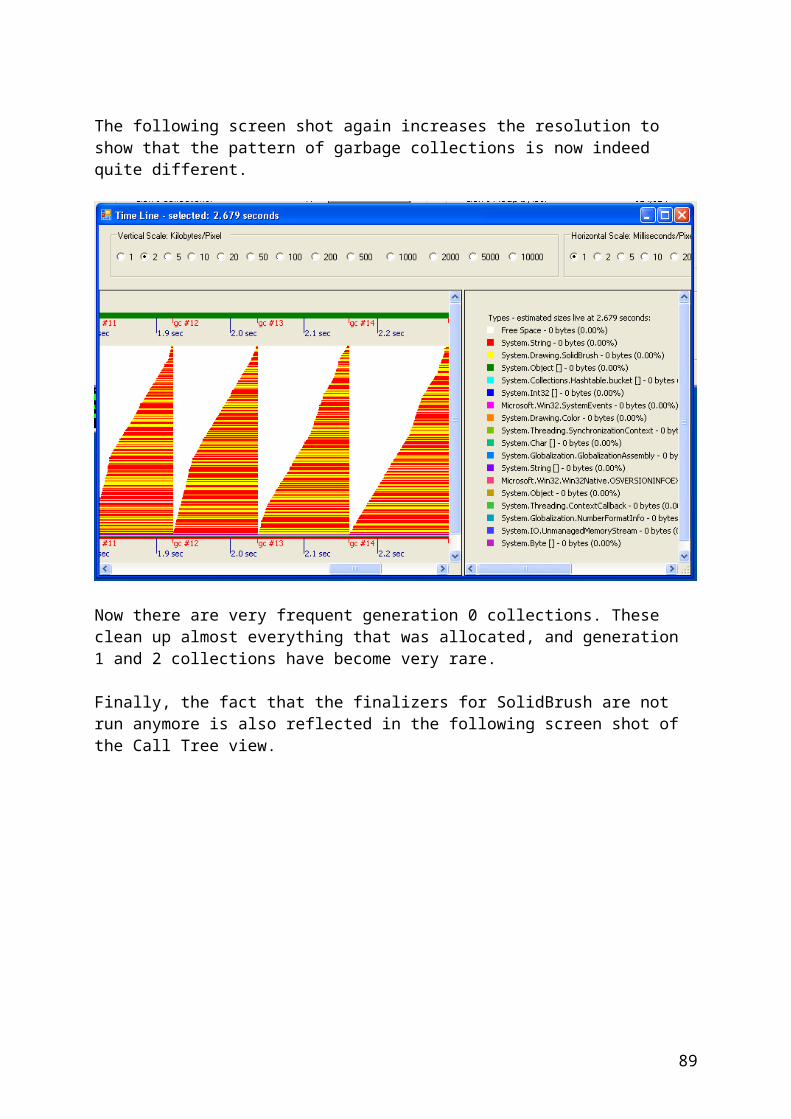
Here you can see MemoList entries piling up on the heap.
It is easy to select a time interval in this view and choose Show Who Allocated from the shortcut menu. You will still get the full allocation graph (for all types), but you can scroll all the way to the right, click Memo.ListEntry, and then right-click and choose Prune to callers & callees. The following screen shot shows the resulting graph.
89

Again, you get a pretty good pointer to the code causing the leak.
Another good way would be to bring up the Objects by Address view, as shown in the following screen shot.
90
This shows that almost all the Memo.ListEntry objects ended up in generation 1, all together, and so it is easy to select a whole bunch of them, and again choose Show Who Allocated, as shown in the following screen shot.
The results bring you back to the same item, Memo::Memo_Fibo.
91

CLRProfiler APIIn some cases, you want to be able to control profiling from within your application.
For example, you might want to switch it off for the startup, and then switch it on for a specific routine. Or you might want to trigger a heap dump from within your application. Or you might want to put some output of your own into the log file.
All these things can be accomplished by communicating directly with the profiling DLL (ProfilerOBJ.dll) that is loaded into your process for profiling.
To make it a bit more convenient, there is a very thin managed layer on top of it – so thin, in fact, that its entire source code can be shown in the following example. (The public methods and properties are marked in red.)
using System;using System.Runtime.InteropServices;
public class CLRProfilerControl{ [DllImport("ProfilerOBJ.dll", CharSet=CharSet.Unicode)] private static extern void LogComment(string comment);
[DllImport("ProfilerOBJ.dll")] private static extern bool GetAllocationLoggingActive();
[DllImport("ProfilerOBJ.dll")] private static extern void SetAllocationLoggingActive(bool active);
[DllImport("ProfilerOBJ.dll")] private static extern bool GetCallLoggingActive();
[DllImport("ProfilerOBJ.dll")] private static extern void SetCallLoggingActive(bool active);
[DllImport("ProfilerOBJ.dll")] private static extern bool DumpHeap(uint timeOut);
private static bool processIsUnderProfiler;
public static void LogWriteLine(string comment) { if (processIsUnderProfiler) { LogComment(comment); } }
public static void LogWriteLine(string format, params object[] args) { if (processIsUnderProfiler) { LogComment(string.Format(format, args)); } }
public static bool AllocationLoggingActive
92
{ get { if (processIsUnderProfiler) return GetAllocationLoggingActive(); else return false; } set { if (processIsUnderProfiler) SetAllocationLoggingActive(value); } }
public static bool CallLoggingActive { get { if (processIsUnderProfiler) return GetCallLoggingActive(); else return false; } set { if (processIsUnderProfiler) SetCallLoggingActive(value); } }
public static void DumpHeap() { if (processIsUnderProfiler) { if (!DumpHeap(60*1000)) throw new Exception("Failure to dump heap"); } }
public static bool ProcessIsUnderProfiler { get { return processIsUnderProfiler; } }
static CLRProfilerControl() { try { // If AllocationLoggingActive does something, // this implies ProfilerOBJ.dll is attached // and initialized properly. bool active = GetAllocationLoggingActive(); SetAllocationLoggingActive(!active); processIsUnderProfiler = active != GetAllocationLoggingActive(); SetAllocationLoggingActive(active); } catch (DllNotFoundException) { } }
93
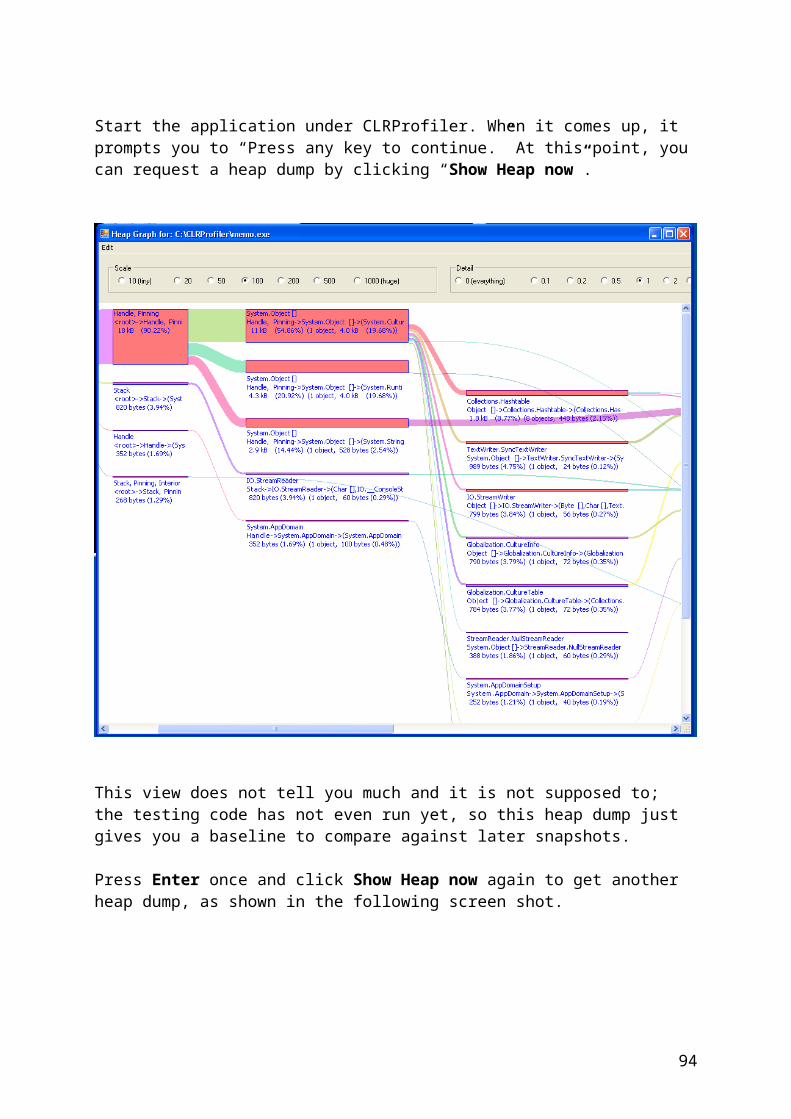
}
This code provides the following: A method LogWriteLine to put comments into the log. A method DumpHeap to trigger a heap dump. A read/write property, AllocationLoggingActive. A read/write property, CallLoggingActive. A read-only property, ProcessIsUnderProfiler.
This is pretty simple, but you can do some interesting things with it.
Note that all the methods and properties can be used even if running without the profiler. They will not do anything, but they will not crash your application either.
You can compile this little piece of source code into a managed DLL by invoking csc with the /target:library switch.
The sample word count demo program has been changed to take advantage of this in the following code example.
using System;using System.IO;
class Demo2{ public static void Main() { StreamReader r = new StreamReader("Demo1.dat"); string line; int lineCount = 0; int itemCount = 0;
CLRProfilerControl.LogWriteLine("Entering loop"); CLRProfilerControl.AllocationLoggingActive = true; CLRProfilerControl.CallLoggingActive = true;
while ((line = r.ReadLine()) != null) { lineCount++; string[] items = line.Split(); for (int i = 0; i < items.Length; i++) { itemCount++; // Whatever. } } CLRProfilerControl.AllocationLoggingActive = false; CLRProfilerControl.CallLoggingActive = false; CLRProfilerControl.LogWriteLine("Exiting loop");
r.Close();
Console.WriteLine("{0} lines, {1} items", lineCount, itemCount);
CLRProfilerControl.DumpHeap(); }}
94
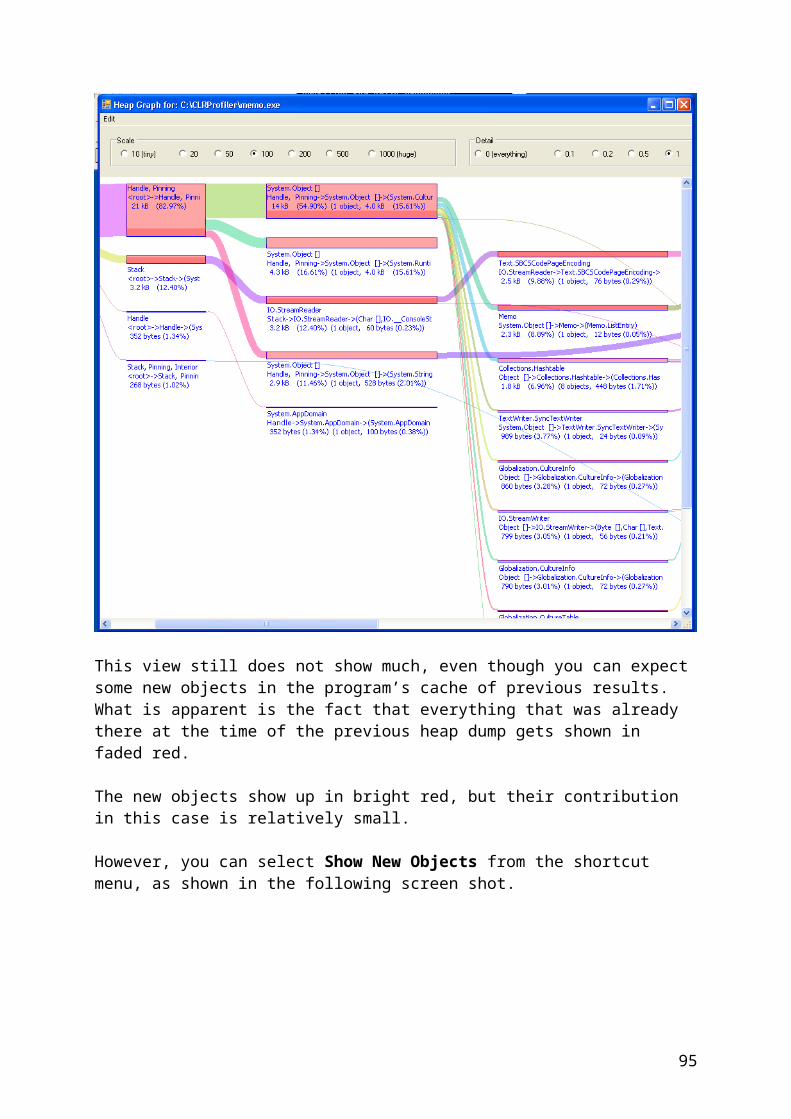
After you compile this code (passing the appropriate /r: option to csc), and run it under CLRProfiler, note that the Summary form now shows two comments, and the Comments command on the View menu is now enabled. When you select it, your screen should look like the following screen shot.
These are just what the program output to the log file. This can be useful; for example, you can put a comment into the log file about the scenario you tested, the version of the software and so on.
But that is not all you can do with the log file comments – they also show up in the Time Line view as thin green vertical lines, in the correct time position when they were logged. The following screen shot shows the log file comments in Time Line view.
95
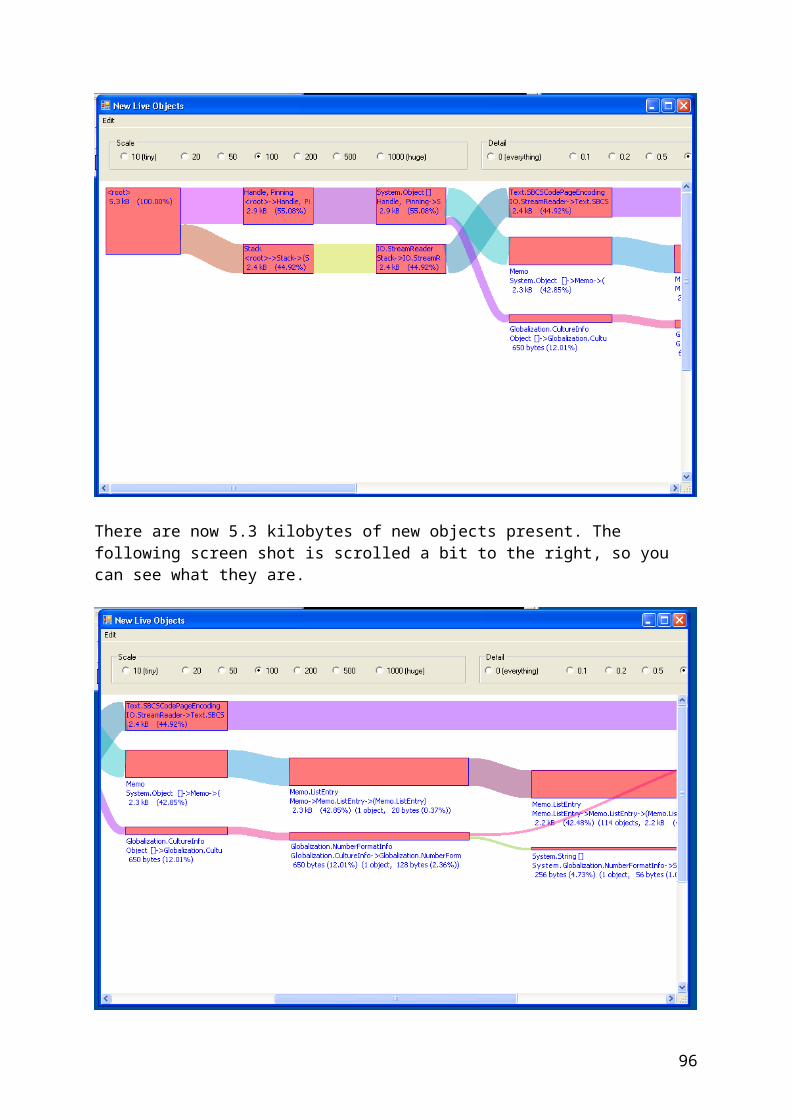
When you position the mouse pointer over a comment, the actual text of the comment shows up in the ToolTip, as shown above.
You can turn off profiling when starting this application, because the application will turn it back on when appropriate. Clear the Profiling Active check box in the first CLRProfiler form and run this program again. The following screen shot shows the result.
The portion of the run before the first green line no longer shows any allocations, and neither does the portion after the second green line (no new objects are added after that line, but the
96
ones already there persist). In fact, this is true for every view dealing with allocation or call information – you will now see allocation and call information only for the time when that kind of logging was actually enabled.
This way, you can get a call graph or allocation graph only for a specific portion of your application.
As the little demo application also requested a heap dump, that is contained in the log file as well. You can bring up the heap graph in Heap Graph view, as shown in the following screen shot.
Perhaps what you are really interested in is whether the loop has actually leaked any objects. To check, you can ask for objects that were allocated between the two comments “Entering loop” and “Exiting loop,” and that are still live on the heap.
Select the shortcut menu item Show Objects Allocated between, as shown in the following screen shot.
97
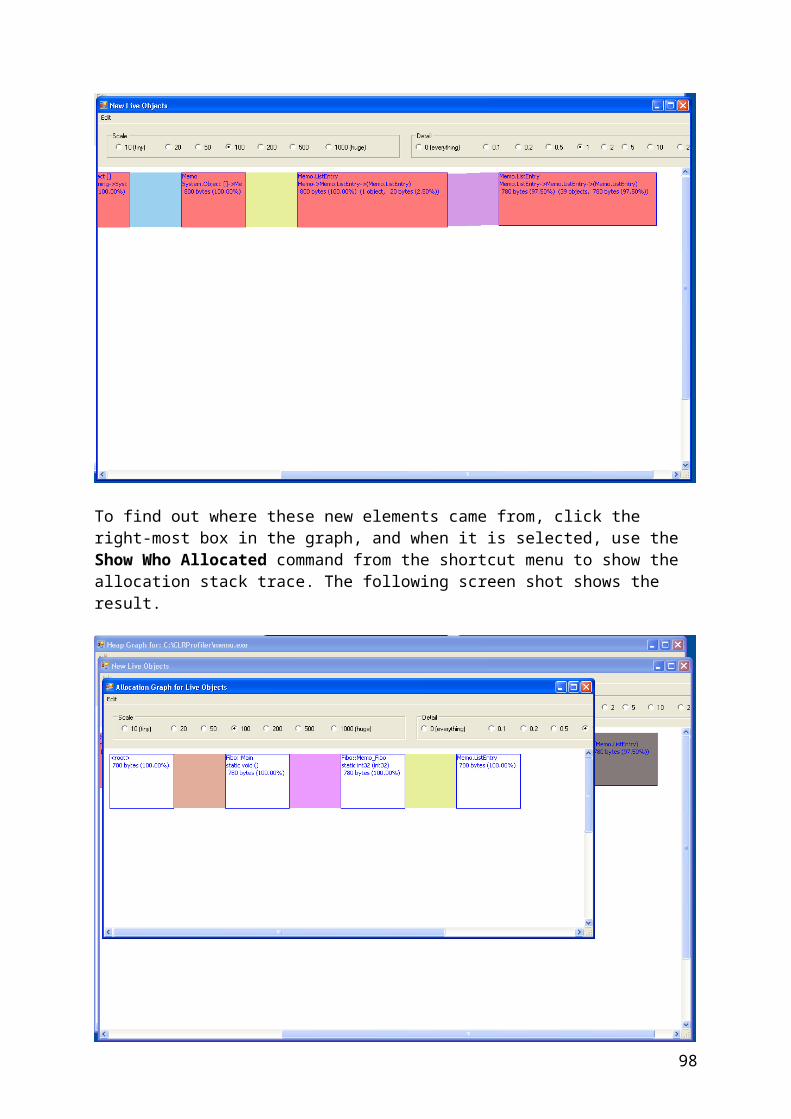
This in turn brings up a Select Range dialog box that lets you select various instants in time, including the markers, as shown in the following screen shot.
98
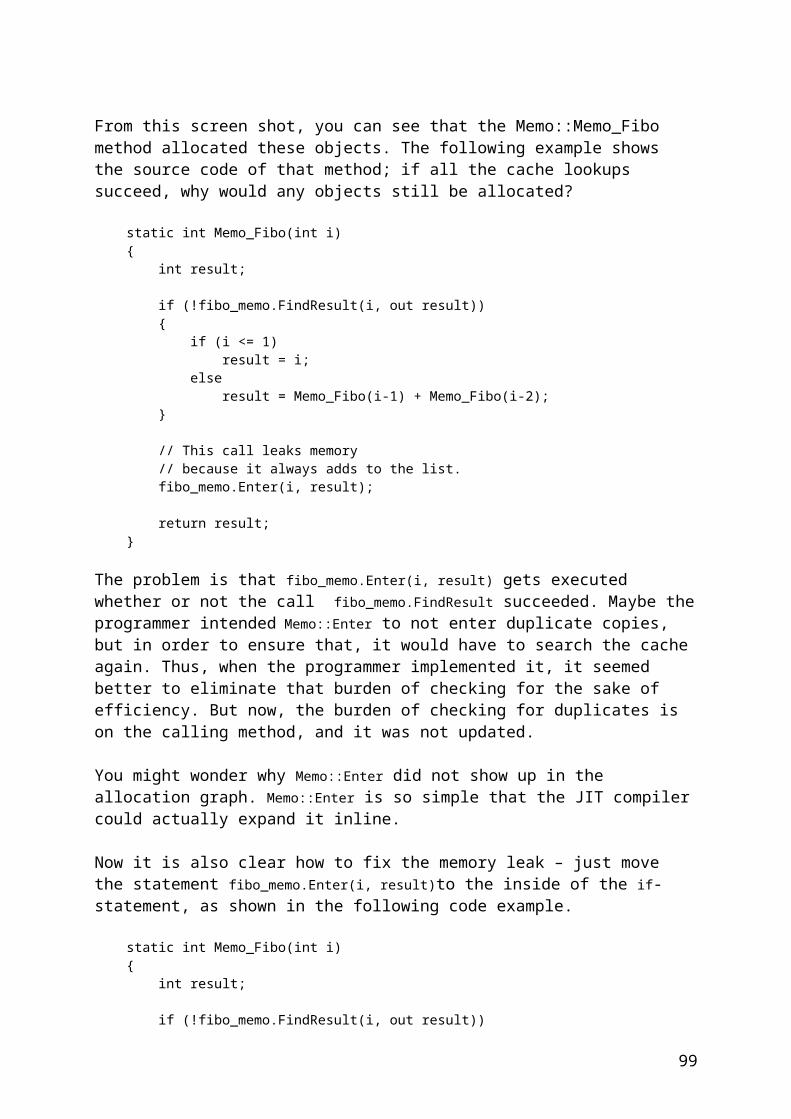
In fact, it turns out this little application did leak:
That is strange - who allocated this System.Byte[] array? Selecting Show Who Allocated on the local menu gives us the answer:
99
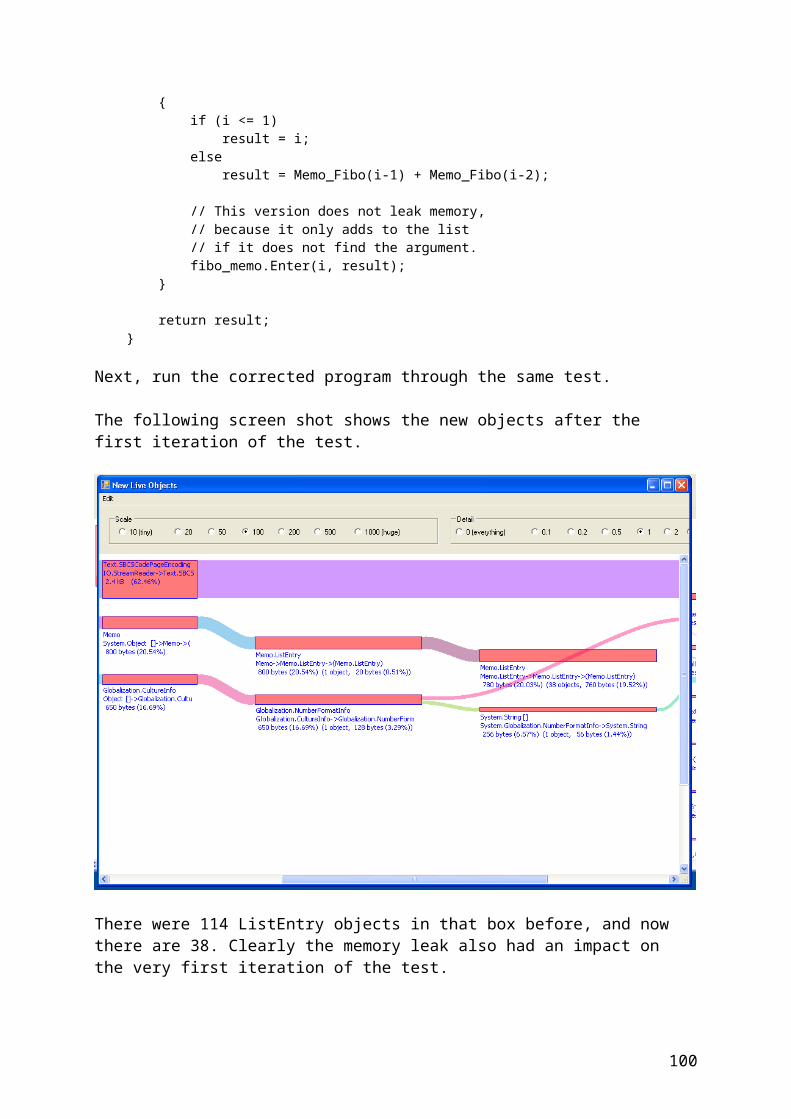
It is the class constructor of the System.Char type that is allocating this Sytem.Byte[] array, presumably as a lookup table to speed up further operations. So we would guess that this only happens in the first iteration through the loop of our demo program, but not in subsequent iterations.
To make sure, we could add another marker to the log file after the first iteration through the loop, and then investigate which objects got leaked between that marker and the end of the loop.
Producing reports from the command line
One interesting usage of CLRProfiler we had not initially considered is in automatic regression testing.
In this case what you want to do is run an application under CLRProfiler and produce some reports as a baseline.
Later, you run the the same application again, produce the same reports and compare them against the baseline reports. Interesting questions to ask could be:
Is the total amount of allocation different now? Are more objects relocated now? Is the final heap size different? Do more objects survive? Are more objects live at a certain point in the run?
For regression testing, we first of all needed command line arguments to tell CLRProfiler which program to run, where to write the log file and so on.
100

The syntax for this has already been described earlier, under Command-line interface:
CLRProfiler [-o logName][-na][-nc][-np][-p exeName [args]]
The switches have the following meaning: –o names the output log file. –p names the application to execute. –na tells CLRProfiler not to log allocations. –nc tells CLRProfiler not to log calls –np tells CLRProfiler to start with profiling off (useful when the profiled application
turns profiling on for interesting code sections)
For instance, if we wanted to run the Demo2.exe application of the previous chapter, storing the result in Demo2.log, and starting with profiling off, we would use the following command:
C:\CLRProfiler>CLRProfiler -o Demo2.log -np -p Demo2.exe
and we get the following output:
CLR Object Profiler Tool - turning off profiling for child processesLog file name transmitted from UI is: Demo2.log2000 lines, 20000 items
We could load the resulting Demo2.log into CLRProfiler using File/Open Log File... (passing Demo2.log as a command line argument also works), but we really want to produce reports without human intervention.
There is a set of command line options to produce such reports - for instance, the -a option produces an Allocation Report:
C:\CLRProfiler>CLRProfiler -a Demo2.logAllocation summary for Demo2.logTypename,Size(),#Instances()Grand total,2305474,28270System.String,1264838,22055System.Int32 [],896000,2000System.String [],112000,2000System.Char [],24000,2000System.Byte [],4376,2System.Text.StringBuilder,4260,213
This produces comma-separated output that you can redirect to a file and thus produce a .csv file that is suitable for import into Excel:
Allocation summary for Demo2.logTypename Size() #Instances()Grand total 2305474 28270System.String 1264838 22055System.Int32 [] 896000 2000System.String [] 112000 2000System.Char [] 24000 2000System.Byte [] 4376 2System.Text.StringBuilder 4260 213
101
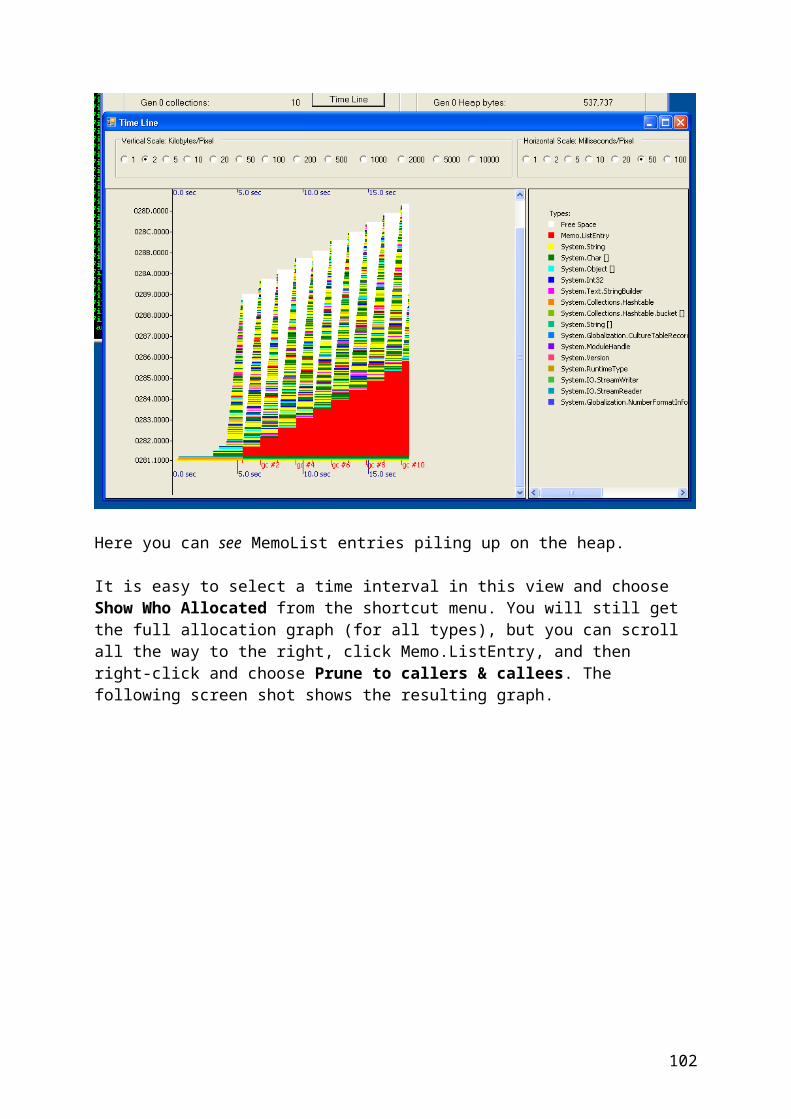
There is a title line that describes what kind of report this is, and the log file it was produced from. Then you have a header line that describes what is in the columns - it's the Typename, the total number of bytes and the total number of instances allocated for each type.
If you are interested in the amount of allocation between two points in time, you can pass in the -b and -e options. The argument to these options is either the full text of log file comments (markers), or a floating point number that is interpreted as the time in seconds during the run. For instance:
C:\CLRProfiler>CLRProfiler -a -b "Entering loop" -e 0.6 Demo2.logAllocation summary for Demo2.log between Entering loop (0.546 secs) and 0.6 (0.6 secs)Typename,Size(),#Instances()Grand total,139928,1659System.String,74480,1292System.Int32 [],52864,118System.String [],6552,117System.Byte [],4376,2System.Char [],1416,118System.Text.StringBuilder,240,12
Note how the title line reflects the additional arguments in this case. In case the -b argument is omitted, it defaults to the beginning of the run, and similarly the -e argument defaults to the end of the run.
Other kinds of reports include: -r Relocation report: see which kinds of objects got moved by the garbage collector.
Again, you can pass -b and -e arguments to restrict the report to a time interval. -s Surviving objects report. This reports the objects on the heap at a point in time
(passed in with the optional -t option which defaults to the end of the program run). This includes both live objects (still referenced) and dead objects the garbage collector has not cleaned up yet. You can also pass in -b and -e options which restrict the report to the objects allocated in the given time interval.
-f Finalizer report: See which objects got queued to the finalizer thread. Again, you can restrict this to a time interval by passing -b and -e.
-cf Critical finalizer report: See only critical finalizers queued. -sd Survivor difference report: See the difference between the objects on the heap at
two points in time (passed in via -b and -e). -h Heap Dump report: See which objects got reported by heap dumps recorded in the
log file. The difference to the surviving objects report is that the heap dumps report will only record live objects, i.e. those still referenced. The downside is obviously that it depends on heap dumps being present in the log file - they must have been triggered either manually by click on the Show Heap now button in CLRProfiler, or by calling the DumpHeap() method in the CLRProfiler API from the application. Similarly to the other kinds of reports, the -b and -e options allow you to restrict the report to heap dumps in a particular time interval.
-c Comments report: This just lists all the comments (time markers) in the log file together with their times. Useful if you used the comments to record information about the particular test run.
102
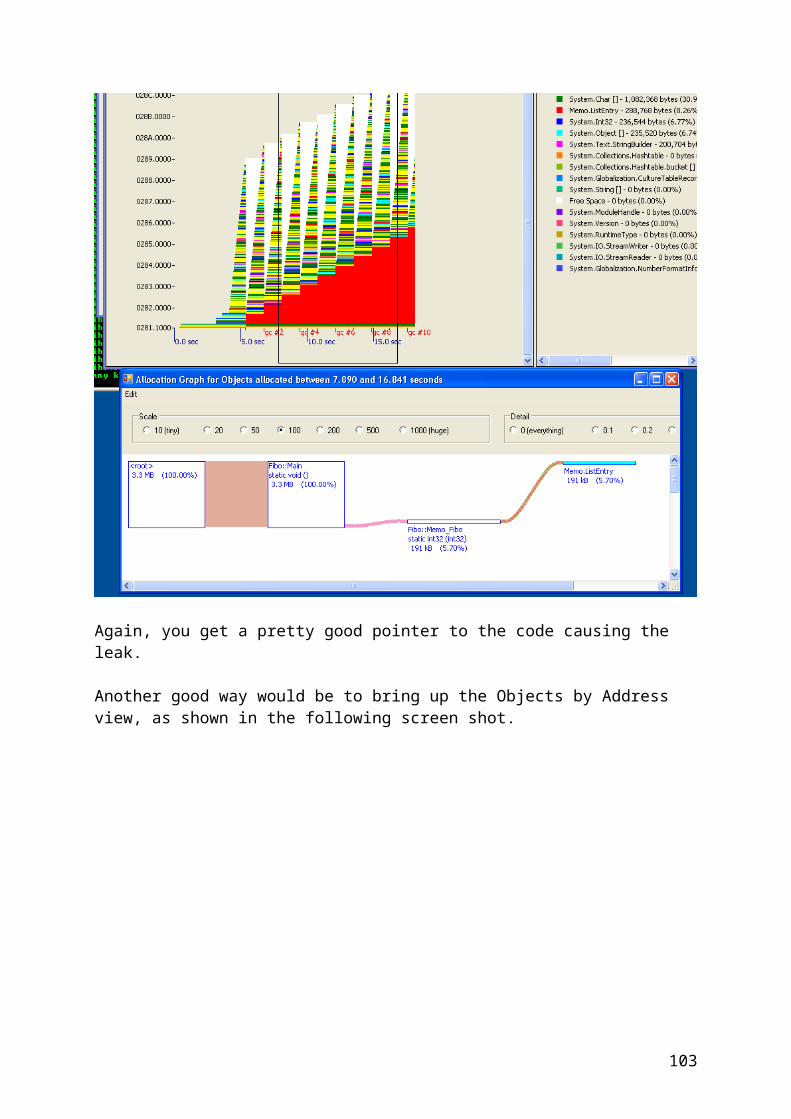
Some CLRProfiler Internals
Environment variablesIn order to trigger and control profiling, CLRProfiler passes some environment variables to the profiled process. The following table lists the variables together with sample values and explanations:
Variable and value ExplanationCor_Enable_Profiling=0x1 Triggers profiling by the CLR.COR_PROFILER={8C29BC4E-1F57-461a-9B51-1200C32E6F1F}
GUID of the profiler DLL to load.
OMV_SKIP=0 Number of initial object allocations to skip.OMV_FORMAT=v2 Version of log file format to write.OMV_STACK=1 Tracks the call stack of the profiled
application.OMV_DynamicObjectTracking=0x1 Allows profiling to be switched on and off.OMV_PATH=C:\WINDOWS\Temp Indicates where to put the log file.OMV_USAGE=both Tracks both allocations and calls – other legal
values are “trace” (just calls) and “objects” (just allocations).
OMV_INITIAL_SETTING=0x3 Reflects the setting of the Profile: Allocations and Profile: Calls checkboxes.
You can actually profile an application without having CLRProfiler running by setting these environment variables (except for OMV_DynamicObjectTracking – do not set that at all in this case). You also need to run regsvr32 on ProfilerOBJ.dll.
Set OMV_PATH to a directory of your choice. The log file will be created as Pipe.log in that directory. You can later load it into CLRProfiler using the Open Log File command on the File menu.
When profiling ASP.NET applications or services, CLRProfiler puts these environment variables into the registry at the following locations in case the ASP.NET applications or services are running under the SYSTEM account:
HKLM\SYSTEM\CurrentControlSet\Services\IISADMIN (ASP.NET) HKLM\SYSTEM\CurrentControlSet\Services\W3SVC (ASP.NET) HKLM\SYSTEM\CurrentControlSet\Services\ServiceName (Services)
In each case, there is a registry value “Environment” created at the location that contains the environment variables.
If running under a different account, the environment variables are temporarily added to the user environment variables for the account, and removed as soon as the application or service has started up.
If CLRProfiler.exe crashes or was killed while it tried to start Internet Information Services (IIS) or your service, you might have to delete these environment variables.
103
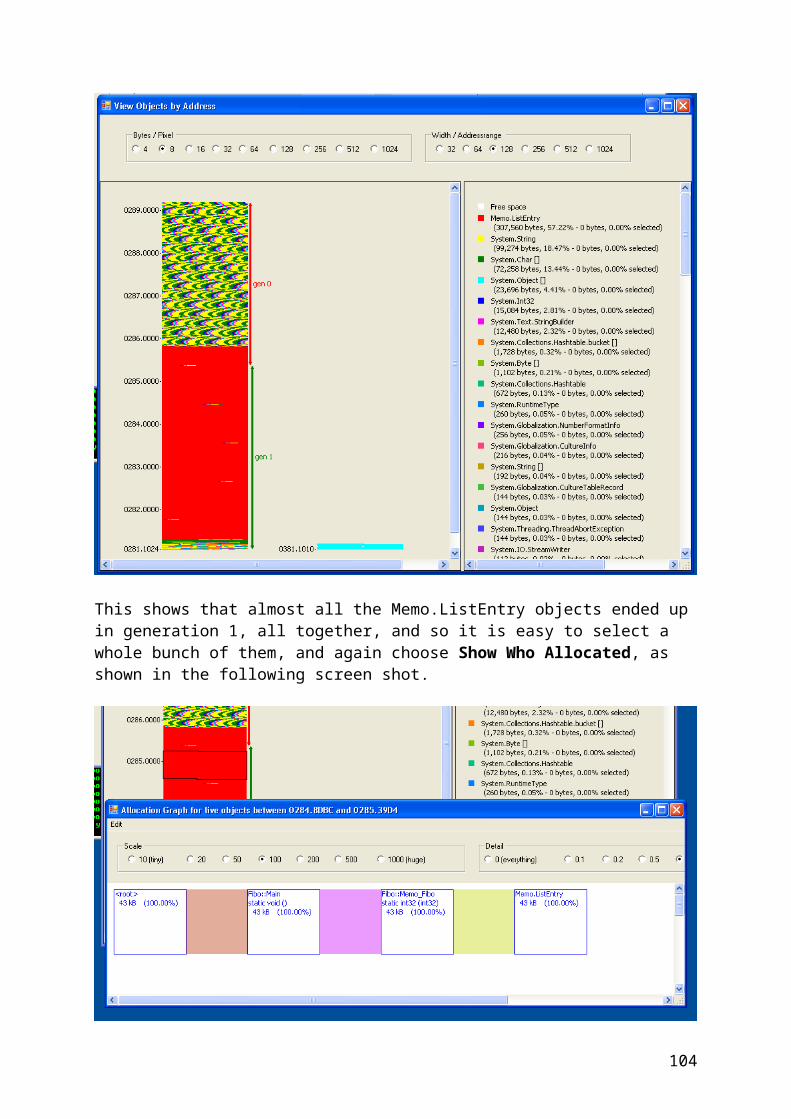
Log file formatThe log file is a simple line-oriented text file. Each line starts with a single character that gives its type – there are lines describing functions, types, allocations, calls, and so on. The following example shows snippets from a typical log file.
f 0 NATIVE FUNCTION ( UNKNOWN ARGUMENTS ) 0 0h 0 0x01BE12FC 0x00000000 0h 0 0x01BE11F8 0x00000000 0n 1 0h 1884 0x01BE12F8 0x00000000 1h 1884 0x01BE11F4 0x00000000 1...m 0 C:\WIN64\assembly\GAC_32\mscorlib\2.0.0.0__b77a5c561934e089\mscorlib.dll 0x790C0000 1y 1884 0x00243110 mscorlibh 1884 0x01BE13FC 0x03811010 1...f 2 System.Security.PermissionSet::.cctor static void () 0x027A0070 86 0 1n 2 0 2f 3 System.Security.PermissionSet::.ctor void (bool) 0x027A00D8 56 0 2n 3 4 2 3f 4 System.Security.PermissionSet::Reset void () 0x027A0120 65 0 3h 1884 0x01BE13F4 0x03812020 1f 1 System.AppDomain::SetupDomain void (bool String String) 0x027A0178 312 0 1...m 1 C:\WIN64\assembly\GAC_32\mscorlib\2.0.0.0__b77a5c561934e089\sorttbls.nlp 0x027B0000 37f 59 System.Collections.Hashtable::set_Item void (Object Object) 0x027A3128 47 0 37...i 546z Entering loopf 188 CLRProfilerControl::set_AllocationLoggingActive static void (bool) 0x027ABF40 61 3 60f 189 CLRProfilerControl::set_CallLoggingActive static void (bool) 0x027ABF90 61 3 60f 190 System.IO.StreamReader::ReadLine String () 0x027ABFE0 347 0 60n 98 4 60 190! 1884 0x28138e4 103f 195 System.IO.FileStream::ReadCore int32 (unsigned int8[] int32 int32) 0x027AC560 263 0 100n 104 16 100 195...i 570t 2 0 System.Stringn 114 13 2 236 113! 1884 0x28148f0 114n 115 14 114 10
…
Here is a brief explanation for each type of line: '!' lines describe allocations. They consist of:
o The ID of the allocating thread.o The address the object was allocated at.o The index of the call stack (the ‘n’ line) describing the type of object being
allocated, the size (in bytes), and the call stack at allocation time. 'a' lines are just like ‘!’ lines, but without the thread ID. They are obsolete.
104
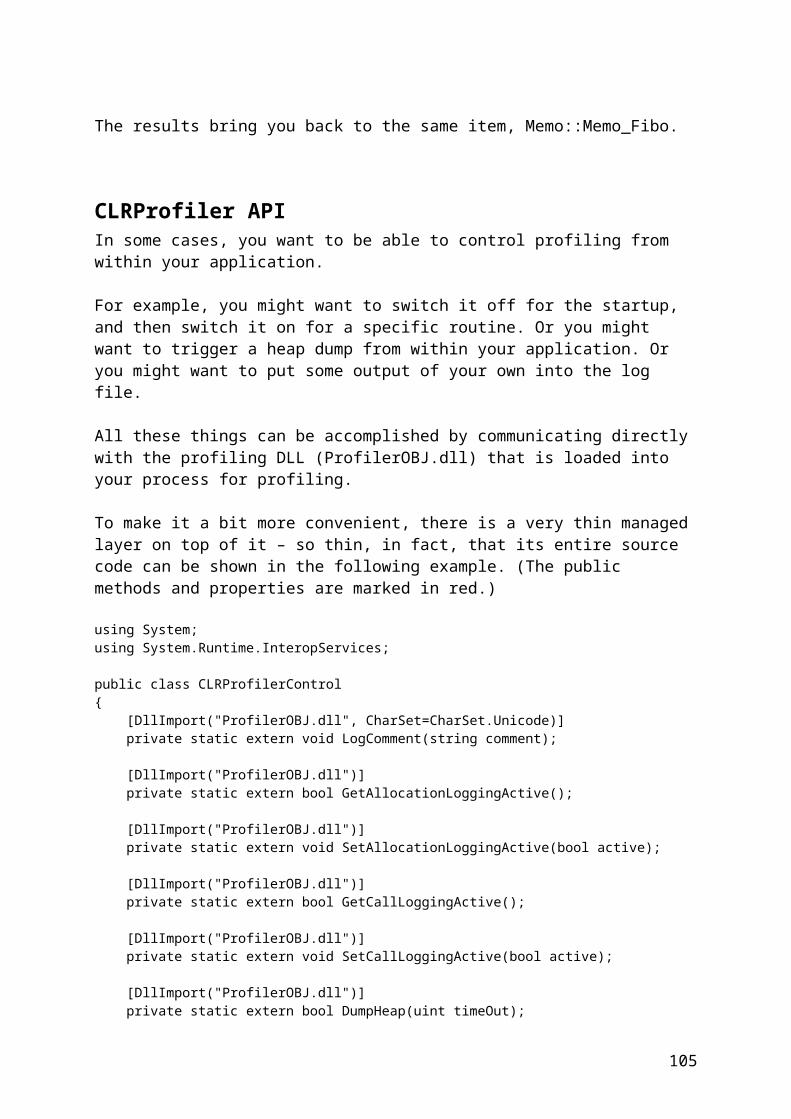
'b' lines describe the boundaries of GC generations. There is one 'b' line at the beginning and one at the end of each garbage collection. They consist of:
o An initial flag (0 or 1) indicating whether this is the start of a GC (1) or the end (0)
o A flag indicating whether this collection was triggered by the GC (0) or the application (1).
o The generation being collected (0..2)o The address ranges used by the GC are being described. For each address
range, there is the following information: The start address of the range The current length of the range The reserved length of the range The GC generation this range belongs to
'c' lines describe calls. They consist of the thread ID, and the call stack ID of the new call stack.
'e' lines provide information about GC roots. Each 'e' line consists of:o The address of the object the root refers to.o The root kind (Stack = 1, Finalizer = 2, Handle = 3, Other = 0).o A set of flags (Pinning = 1, WeakReference = 2, InteriorPointer = 4,
Refcounted = 8).o The rootID. The rootID may be a function index (i.e. refer to an 'f' line), it may
be the address of a GC handle, or it may just be 0, depending on which kind of root is being described.
'f' lines introduce functions. They consist of:o The function's ID (later used to refer to that function, that is, for call stacks).o The function's name.o The function's signature.o The function's address and length in memory.o The ID of the module containing it (see 'm' lines).o The ID of the stack trace that first touched this function (see 'n' lines).
'g' lines announce garbage collections. The numbers following the 'g' are the counts of generation 0, generation 1, and generation 2 collections so far, including this one.
'h' lines describe the allocation of GC handles. They consist of:o The thread id of the allocating threado The id of the handle being allocatedo The address of the object initially being stored in the handle (this is mostly
zero, indicating no object is stored yet).o The call stack ID of the call stack responsible for the allocation.
'i' lines announce the number of milliseconds since the program started up. 'j' lines describe the deallocation of GC handles. They consist of:
o The thread id of the deallocating threado The id of the handle being deallocatedo The call stack ID of the call stack responsible for the deallocation.
'l' lines describe objects being queued to the finalizer thread. They consist of:o A flag indicating whether this a critical finalizero The address of the object being queued
'm' lines describe modules being loaded. They consist of:o The index of the module, for later reference.o The name of the module.
105
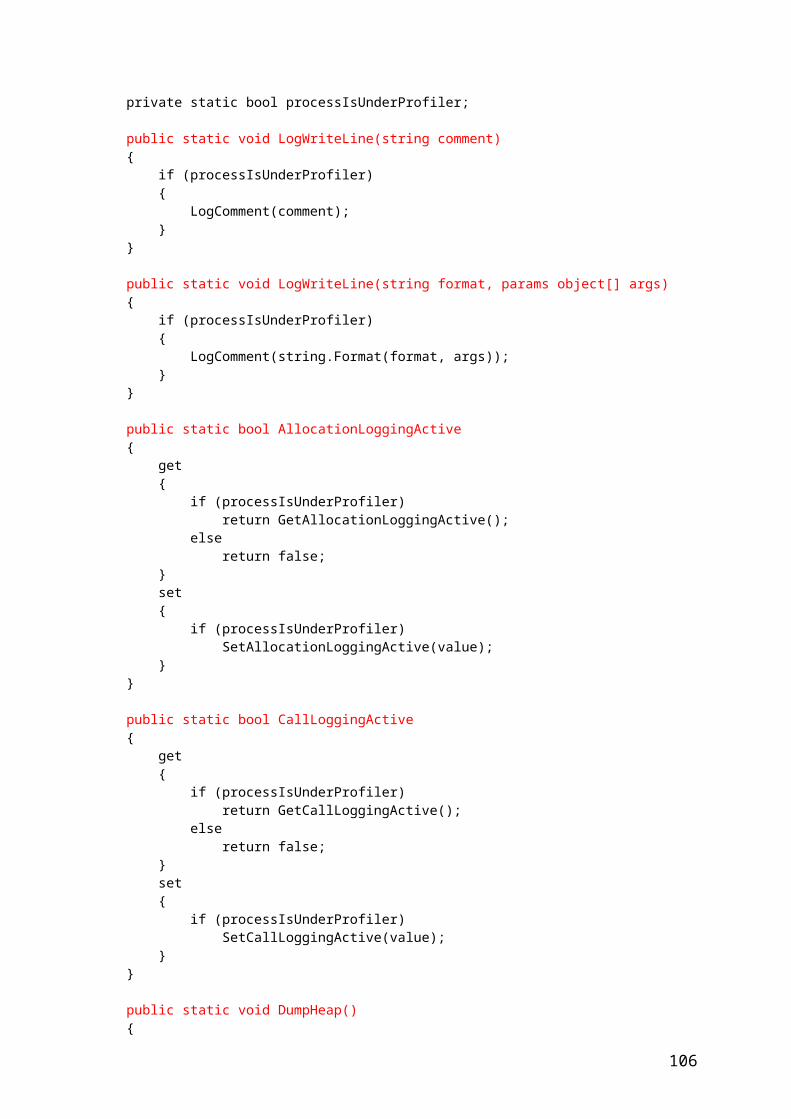
o The address it got loaded at.o The call stack that led to the module load.
'n' lines announce call stacks. The first number is an ID (later used to refer to the call stack, for example, for allocations). The second number is divided up into two flags (bit 0 and bit 1) and a count (arrived at by dividing the number by 4). If both the flags and the count are zero, the rest of the line is simply a list of function IDs, referring to 'f' lines. If the flags are zero, but the count is not, this means the current call stack has a common prefix of length 'count' with another call stack. That call stack's ID is listed next, followed by the function IDs that this stack does not share with the other one. Finally, each of the flags announces whether the current call stack or the one referred to includes a type ID and a size – these types of call stacks are used for allocations. For example:
o n 10 1 8 16 1 means call stack number 10. This includes type ID and size. Type id is 8 (this refers to a previous 't'). Size of the object allocated is 16. Actual allocation stack consists of the single function ID 1 (this refers to an 'f' line).
o n 11 7 9 72 10 means: call stack number 11. The flags indicate a count of 1 (so this is the length of a prefix this stack shares with another one). This call stack includes type ID and size, as does the other one it shares a prefix with. Type ID is, and size is 72. The other call stack it shares a prefix with is call stack 10, which (stripping its type ID and size) consists of the single function ID 1.
'o' lines describe objects. They are used for describing objects in heap dumps. They consist of:
o The address of the object described.o Its type ID (referring to a 't' line).o Its size in bytes.o A list of other objects that this object refers to.
'r' lines describe root objects. They are used for starting heap dumps. They list the addresses of root objects. Consecutive 'r' lines can appear. 'r' lines are superseded by 'e' lines which provide more information.
's' lines are another way of describing call stacks. They are obsolete, superseded by 'n' lines.
't' lines introduce types. They consist of:o The type's ID (later used to refer to the type, for example, for allocations).o A flag indicating whether the type is finalizable (1 if it is, 0 otherwise).o The type's name.
'u' lines describe relocations. This enables CLRProfiler to keep track of objects even if the garbage collector moves them. They contain the old address, the new address, and the size of the memory being moved. This always implies that all objects in the old address range have been moved to the new address range.
'v' lines describe objects that survived a garbage collection, but were not moved. They are similar to 'u' lines, except they don't contain a new address.
'y' lines describe assemblies being loaded. They consist of the current thread ID, the ID of the assembly, and the name of the assembly.
'z' lines describe user comments (logged through the CLRProfiler API). The rest of the line is the comment.
106
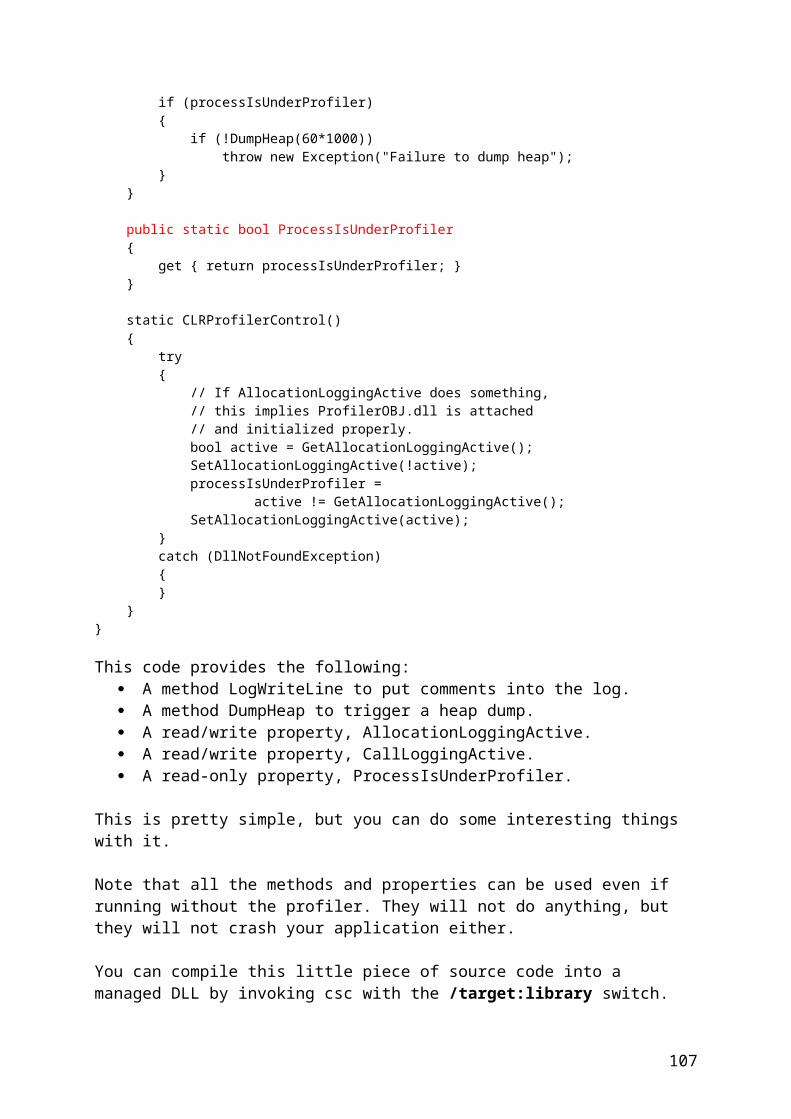
In general, the log files are not meant for human consumption – the above is only meant to give you a hint in case you ever find yourself in a situation where a question can only be answered by manually looking at the log file, or if you want to write another tool parsing a log file.
FAQHere are a few questions that are frequently asked.
Q: Can I control profiling from my application?
A: Yes, check out the CLRProfiler API.
Q: My allocation graph has edges that go backwards – in some cases vertices are shown to cause more than 100 percent allocation.
A: This is caused by recursion – a method calling itself directly or indirectly. CLRProfiler eliminates recursion in some simple cases, but not completely.
Q: My Objects by Address view shows many vertical bars, and my Time Line view shows many heaps – is this cause for concern?
A: This might indicate that your application consumes a lot of heap space, possibly due to a leak or excessive pinning. However, on computers with more than one processor there are one or two heaps per processor anyway if the application is running on server GC (say for an ASP.NET application), so in this case, it does not mean much. The precise answer is: divide the number of address regions that you see by the number of processors. If the result is one or two, it is in the normal range. Nevertheless, you might have an opportunity to reduce heap space by checking which objects survive several garbage collections in the Time Line view, or the Histogram by Age view.
Q: Can CLRProfiler attach to a running application?
A: No.
Q: I cannot profile my ASP.NET application.
A: Try running it under “SYSTEM” instead of the “machine” account. Be sure to change this setting back when you are done profiling.
Q: My ASP.NET application is slow or does not work ever since I tried profiling it with CLRProfiler.
A: Check whether the profiler’s environment variables are still set – see the Environment variables section earlier in this article for the places to check.
Q: Log files get large and my application gets very slow under the profiler.
A: Clear the Profile: Calls check box generally or selectively if you do not need the call graph and call tree features. You can also clear the Profile: Allocations check box generally
107
if you are only interested in heap dumps, or selectively if you only care about allocations at certain times. For example, when profiling ASP.NET applications, it is rarely interesting to profile the startup of ASP.NET – it is more interesting to see what happens when you request a specific page. You can also check or clear the Profiling active check box selectively.
Q: CLRProfiler does not seem to work on my 64-bit application - the form that says "Waiting for application to start common language runtime" stays up forever, even though the application has started already.
A: On a 64-bit operating system, you want to make sure you profile 64-bit applications with a version of CLRProfiler.exe and profilerOBJ.dll built for x64/IA64. Conversely, you want to make sure you profile a 32-bit application with a version of CLRProfiler.exe and profilerOBJ.dll built for Win32. Technical note: Only profilerOBJ.dll is specific to the CPU architecture - CLRProfiler.exe is not. However, when you profile an application, CLRProfiler loads profilerOBJ.dll to register it as COM component. This does not work if CLProfiler is running as a 32-bit process, but profilerOBJ.dll is compiled for x64/IA64 or vice versa. To avoid confusion, it's best to keep the different flavors in different directories. However, for analyzing log files, either flavor of CLRProfiler works fine with either flavor of log file. To change whether a managed application runs as 32-bit or 64-bit process, use "corflags /32bit+ myapp.exe" or "corflags /32bit- myapp.exe".
108