cluster analysis of the apple orchard industry in … region and apple...cluster analysis of the...
TRANSCRIPT
Cluster Analysis of the Apple Orchard Industry in
Yakima, WA Region
By:
Heidi Leonard
Raymond Leonard
Aziz Allaberganov
Faisal Alhelal
Abdullah Alnasser
BADM 585 Strategic Competitiveness & Economic Development
Professor Harm-Jan Steenhuis, Ph.D.
16 March 2014

1 Table of Contents
1. Executive Summary ............................................................................................................................................................ 3 2. Introduction ......................................................................................................................................................................... 3
3. Yakima County Regional Analysis ..................................................................................................................................... 4 3.1. Economic Conditions .................................................................................................................................................. 4
3.2. Economic Performance .............................................................................................................................................. 5
3.3. Competitive Assessment of Yakima County ............................................................................................................... 6
3.4. Socio-Economic Context ............................................................................................................................................ 6
3.4.1 Tax Rates ............................................................................................................................................................ 6 3.4.2. Role of State and Federal Laws ......................................................................................................................... 7 3.4.3. Education Systems ............................................................................................................................................. 7
3.5. Diamond Model Analysis: Determining the Quality of the Regional Business Environment ....................................... 7
3.5.1. Factor Conditions................................................................................................................................................ 7 3.5.2. Context for Firm Strategy, Structure, and Rivalry ............................................................................................... 8 3.5.4. Demand Conditions ............................................................................................................................................ 8
3.6. State of Regional Cluster Development...................................................................................................................... 9
Table 1. Traded Cluster Employment, Employment Share and Location Quotient by MSA (Select Clusters) Yakima, WA and Rochester, NY MSAs, 2010 ............................................................................................................................ 9
3.7. Sophistication of Regional Operations and Strategy ................................................................................................ 10
3.8. Key issues impacting competitiveness ..................................................................................................................... 10
3.9.1. Employment policy............................................................................................................................................ 11 3.9.2. Infrastructure..................................................................................................................................................... 11 3.9.3. Value added industry ........................................................................................................................................ 11
4. Apple Cluster Analysis ..................................................................................................................................................... 11 Diagram 1. Apple Production Value System ............................................................................................................... 13 Diagram 2. Apple Orchard Industry Relationships ...................................................................................................... 13
4.1. History of the Yakima Apple Cluster ......................................................................................................................... 13
Diagram 3. Traded Cluster Relationships ................................................................................................................... 14
4.2. Apple Cluster Performance ...................................................................................................................................... 14
4.2.1. Global Demand and Production ........................................................................................................................ 14 4.2.2. Domestic Demand and Production ................................................................................................................... 15 4.2.3. Direct Employment ........................................................................................................................................... 15 Table 3. Calculated Estimated Washington Supported/Generated Employment in other Industries as a result of Annual Median and Average Seasonal Apple Orchard Workers 2011-2013 (Top Ten) ............................................. 17 Table 4. Calculated Estimated Washington Supported/Generated Employment in other Industries as a result of Annual Median and Average Seasonal Apple Orchard Workers 2011-2013 (Bottom Ten) ........................................ 17
4.3. Mapping the Yakima Apple Cluster .......................................................................................................................... 18
Diagram 4. Yakima Apple Cluster ............................................................................................................................... 19
4.4. Apple Cluster Analysis (Diamond Model) ................................................................................................................. 19
4.4.1. Factor Conditions.............................................................................................................................................. 19 Table 1. Apple Cluster Harvest Median Wages 2007-2011 ........................................................................................ 20 4.4.2. Context for Firm Strategy and Rivalry ............................................................................................................... 22 Chart 1. Orchard Category/Service, Employee Size and Revenue Profiles 2014 ...................................................... 23 4.4.3. Related and Supporting Industries ................................................................................................................... 23 Table 2. Apple Orchard Related and Supporting Industry Jobs in Yakima, WA MSA ................................................ 23 4.4.4. Demand Conditions .......................................................................................................................................... 24
4.5. Key issues impacting Competitiveness .................................................................................................................... 24

2
4.6. Policy Recommendations ......................................................................................................................................... 25
4.6.1. Maintain R&D.................................................................................................................................................... 25 4.6.2. Focused Marketing on the Industry, not the Fruit ............................................................................................. 25 4.6.3. Business Education for Apple Orchard Farmers .............................................................................................. 25
5. Exhibits. ........................................................................................................................................................................... 26 Exhibit 1. Major Employers in the Yakima Area, 2012 ................................................................................................ 26 Exhibit 2. Yakima, WA MSA Employment by Traded Cluster, 2010 ........................................................................... 26 Exhibit 3. Utilized Non-citrus Fruit Production in the U.S. 2012 .................................................................................. 27 Exhibit 4. U.S. Domestic and Internationally Traded Share of Utilized Apple Production 2000-2012 ........................ 27 Exhibit 5. WA and NY, Bearing, Yield and Value 2010-2012 ..................................................................................... 27 Exhibit 6. Yakima, WA and Rochester, NY MSA Clusters: Overall Composition and Wages 2010 .......................... 28 Exhibit 7. Yakima, WA and Rochester MSA Employment by Traded Agriculture Subcluster, 2010 ........................... 28 Exhibit 8. Yakima, WA and Rochester, NY MSA Wages by Agricultural Products Subcluster, 2010 ......................... 28 Exhibit 9. Yakima, WA and Rochester, NY MSA, Share of National Employment by Selected Cluster and Subcluster 1998-2010. ................................................................................................................................................................. 29 Exhibit 10. Region 2 (Yakima and Kittitas Counties) Apple Orchard Workers as a Percentage of Regional and WA State Seasonal Labor 2011-2013 ............................................................................................................................... 30
6. References ...................................................................................................................................................................... 32
1. Executive Summary
Apples are the biggest cash crop for Washington State, with the Yakima Valley dominating both production and exports locally and
nationally. Acknowledging the inherent limitations of a commodity based economy, it would still be foolish to disregard the importance (and
development) of this traded commodity cluster to this state’s budget. This paper utilizes Dr. Michael Porter’s cluster theory and principles to
analyze the apple orchards regional affect in the agricultural cluster, identify its problem areas and opportunities for growth. A comparison
with Wayne County, NY (the second largest apple producing U.S. county) is made in order to contrast important cluster dimensions, and
reveals that Washington has done well in capitalizing on its natural endowments but runs the risk of repeating the mistakes made by the
historically established apple cluster. The paper’s recommendations are aimed towards the Yakima County Development Association and the
WA Apple Commission and explore added universal value through continued infrastructure development, better employment practices, value-
added food processing/manufacturing and targeted marketing efforts. Implementing these concepts would greatly enhance not only the apple
industry but strengthen all industries in the cluster and foster an environment where other clusters could be developed.
2. Introduction
Anybody familiar with basic principles of business can attest to the continued critical importance of the three “L’s” for any particular
enterprise or industry: Location, Location, Location. Traditional economic theory frequently uses “inherited” factors like location (as well as
quantity and quality of land, natural resources, labor pool, population, etc.) as a measurement for the potential comparative advantage of a
particular region. Yakima has all those important things in abundance to support a thriving apple production industry. Yet when we begin to
talk about more than just a single enterprise a different perspective is required. When the complex interactions between businesses in an
industry or between industries together in a region are added to the conversation, we begin to talk about “clusters”. Although “clusters” will
be looked at in depth later in this document it is important for now to know that a key aspect of cluster theory is that prosperity is created not
“inherited” (Porter, 2008). It is the capacity for innovation and improvement that drive the prosperity of a region, not simply fertile fields or rich
mines. More than growing a delicious apple, it is the interaction between growers, processors, transporters, sellers, and the government that
generates real wealth. Consider the poverty of many of the diamond producing countries in Africa versus the wealth of resource-poor
Singapore for a stark example of this principle at work. Therefore if prosperity is found through innovation and upgrade, then the obvious
question is one of how to improve.
The PDCA (Plan, Act, Check, Do) cycle is an established method for change (improvement) that is often used with “lean principles”
(Tague, 2004). Appropriately it all starts with a plan which is developed after data analysis. It is data analysis where this paper starts and it
will conclude with a plan. Apples are the biggest cash crop for Washington State and Yakima is the largest producer of apples in the state
(and in the nation) and therefore apples and Yakima are the specific focus below. This paper concludes with innovative suggestions for
improvement influenced by application of cluster theory. It remains for the participants in the cluster to decide if they will “Act”, “Check”, and
ultimately “Do”. Like the above introduction, the analysis below begins with “location, location, location”.
4 In order to build context in the data Wayne County, NY is juxtaposed with Yakima Valley in Washington. Wayne County was
chosen specifically because it the second largest apple producing region in the nation with almost 100 more years of development than
Yakima. Periodically comparison is additionally made between Yakima, the state and the national average in order to further establish
context and theoretical potential.
3. Yakima County Regional Analysis
Yakima County is located in the central region of Washington State. Seattle (15th largest MSA in the nation), Portland (104th largest
MSA in the nation) and Spokane (100th largest MSA in the nation) are all within a three hour drive from the heart of Yakima County. The
second largest county (by land area) in Washington at 4,296mi2, Yakima County’s current population is estimated at just over 245,000 people,
with a varied history of growth spurts since 1970, alternating between 18-19% and just over 9% population increase every other decade
(Census, 1960-2010). With a population density of only 56 people per square mile there is plenty of space for development, even though
35% of the county is dedicated to tribal lands. Washington State Office of Financial Management projects growth to increase to 363,341
persons by 2030 (WA OFM, 2012), almost half again the population from the 2010 census. Serious development in Yakima began relatively
recently when federal funds were allocated to begin irrigation projects in the early 1900s. Unsurprisingly given the vast land area and fertile
ground, initial development and population growth centered on agriculture. While the Yakima County Development Association lists current
key industries as Logistics and Distribution, Food Processing, Industrial Machinery and Supplies, Business and Professional Services Health
and Medical Industry and Aerospace (YCDA, 2014), the region’s performance cannot be separated from its agricultural base or significant
government presence in the area.
In contrast to Washington, New York agriculture began sinking its roots nearly a century prior to Yakima beginning in the early
1800s. Wayne County is approximately 1/7th the size (in square miles) of Yakima county with three times the population density. Located on
the NW border of New York on Lake Ontario, it is considered part of the Rochester area, the 51st largest MSA in the nation. It is within two
hour drive of Buffalo, NY (49th largest MSA in the nation) three hour drive of Albany, NY (61st largest MSA in the nation) and five hours of New
York, NY (the largest MSA in the nation). Its overall land area is 1,384 mi2 with a population density of 155 people per square mile. The
population is currently estimated to be 93,284. While the population had a positive growth rate of almost 17% from 1970-80, growth has
stalled in 2010 and is projected to be negative through 2040, with a forecasted population of 84,638 people.
3.1. Economic Conditions
With a very similar development path to Wayne County, Yakima County’s economy has always been tied closely to its agricultural
commodities. The obvious difference is the requirement for irrigation in Washington (Wayne has little to no irrigation industry). It was the
introduction of irrigation techniques to the Yakama Indians in 1853 near Wapato and follow-on federal initiatives to increase the irrigation in
the early 20th century that allowed farmers and businessmen to exploit its primary natural endowments: fertile soil and favorable growing

5 climate. Wayne County always had easy access to water and close proximately to transportation. The establishment of the Northern Pacific
Railroad in 1888 opened up the markets further to domestic and international market access via the Puget Sound Ports. From 1910 to 1960,
Yakima population increased 247% (WSDA, 1964) as the railway and road systems improved and expanded. Yakima has dominated the
production of tree fruits, grapes, sugar beets, vegetables, cattle sheep and turkeys through 1959 and has ranked as the highest producer of
apples, hops and mint in the state and nation since 1964 (WSDA, 1964).
Again easy parallels are drawn with the path taken in New York as several grower associations and government commissions were
established in Yakima during the 1940’s-60’s, including the Washington State Horticultural Association, Yakima County Cattlemen’s
Association, the Hop Growers of Washington, and the Yakima County Horticultural Union to name a few. Within the Yakima Valley several
food processing plans were also established to can, freeze, dehydrate juice and concentrate fruit, vegetables and berries.
Today, Yakima County’s economy is also bolstered significantly by the developing wine industry which is an advantage not shared
by New York. With over fifty wineries disbursed throughout the Yakima Valley it is the second largest producer of wine in the state, with one
major American Viticultural Area (AVA) divided into three smaller regions: Red Mountain, Snipes Mountain and Rattlesnake Hills.
Unsurprisingly the largest non-agricultural contributor to the economy is the government. County, State, Federal and Tribal
governments are six of the top 15 largest employers in the area, employing almost 6,500 people (See Exhibit 1).
3.2. Economic Performance
A more comprehensive view of the local, traded and natural endowment clusters is also warranted to achieve a holistic view of
Yakima County’s economic profile. The cluster make-up is 29.15% traded clusters (19,227 workers), 70.51% local cluster (46,514 workers)
and 0.35% natural endowments (228 workers). Local health services, hospitality, real estate construction, development and other retail
activity clusters employ the most workers (see Exhibit 2), though rank very low when compared nationally (low to mid-200 range of MSAs).
The top traded clusters by employment include agricultural products (ranked 19th nationally), distribution services, processed food,
transportation and logistics and entertainment (U.S. EDA, 2010).
The gross domestic product for the county has increased 59.7% from $5,077M to $8,108M between 2001 and 2012, with the
leading industries being government, crop and animal production, education and health services, healthcare and social assistance and
financial activities (U.S. Economic Development Administration, 2010). The real GDP per capita for Yakima has been between 58% and 64%
of the national average for the same time frame. In 2011, Real GDP per capita was just shy of 60% (U.S. BEA, 2011) of the national average.
The GDP growth trend has generally been positive over the last ten years, showing steady increase and future potential. The unemployment
rate varies widely throughout the year as a result of the agricultural-based economy, but hovers around 9.1% for Yakima and 8.7% for Wayne
during non-harvest months. One employment aspect that greatly impacts the local economy is the influx of documented and undocumented
workers who support agricultural industry.

6 3.3. Competitive Assessment of Yakima County
Overall Yakima has the potential to build a strong competitive position. Yakima County is ideally located for regional, domestic and
international market access. Yakima has a municipal airport with four primary carriers. The road system (I-82, U.S. Routes 12 and 97), well
established rail system, and port access make transportation of commodities inexpensive and easy to nearby Seattle, Portland and Spokane.
As of 2011, 69,410 people are employed and living locally in Yakima County, indicating a strong local workforce. The outflow trend has
decreased in the last five years while the inflow trend has increased over the last decade to overtake the outflow (Census, 2002-11). This
indicates that more people are commuting to work in Yakima as its economy and industries develop, rather than leaving for other
opportunities outside of the county.
One significant concern is the presence of illegal workers, which have been estimated to add between 40-60,000 to the population
and employment. Better data is needed to determine how much of paid wages are being funneled out of the region and the impact of
potentially “cheaper” labor on the employment/ unemployment and wage level picture.
Wayne County’s inflow of workers has increased 10.49% between 2002 and 2011, even though the census population is roughly
half of Yakima’s. Wayne County’s local and outflow populations have decreased 6.6% and 3.8% respectively. The outflow population is the
dominant portion of workers in contrast to Yakima, likely because there are no major metropolitan areas in Wayne County; the closest MSA is
Rochester, NY to the west.
3.4. Socio-Economic Context
Over all Yakima County has lower GDP than the average for the nation while also having a low cost of living and access to most
modern services. It is close enough to several large metropolitan areas to have the potential to attract tourism but separated enough to avoid
becoming a suburb of a larger city, unlike several areas of Wayne County which are being slowly converted into a Rochester suburb. The
commodity-based economy brings in outside cash and but suffers from key vulnerabilities that all commodities share: weather and seasonal
variation. Other key expenses and regulations that influence Yakima’s socio-economic dynamic include taxes and laws.
3.4.1 Tax Rates
Yakima City sales tax is 1.70% in addition to the State Sales Tax of 6.5%., and is lower than 52.7% of other cities and counties.
Special taxes focus on the retail and food consumer industries, particularly clothing at 8.2% and prepared food at 11.7%. Since the State has
no personal income, corporate or franchise taxes this is a major concern when 60,000 workers may be taking the wages and repatriating
them instead of spending in the local area.
Yakima County does not levy additional sales or income tax, but has a property tax rate that hovers generally around 1% of the
property’s assessed fair market value (Taxfinder.org, 2014). Combined property taxes supporting school districts, cities and bonds however
increase the property taxes close to 13% in some tax districts (Yakima County Tax Assessor, 2013).

7
Wayne County in contrast maintains combined property tax rates ranging from 10.4% to 14.42% outside of its towns in addition to a
marginal state income tax of 4-8.82%.
3.4.2. Role of State and Federal Laws
The agricultural industry (and therefore Yakima’s economy base) is generally heavily subsidized by both the state and federal
government. Historically the government has focused on income support payments (“direct payment program”), new federal assistance is
migrating to government crop insurance subsidies (USDA, 2014). The Farm Bill passed into law on 7 February 2013 however does not have
a means-testing provision to limit received subsidies, while it cut conservation and nutrition assistance and eliminated transparency by not
requiring disclosure of subsidy recipients (Faber, 2014).
3.4.3. Education Systems
In Yakima County there are 15 school districts and 11 private schools with a 15-20 teacher-to-pupil ratio and six regional higher-
level education institutions. The largest enrollment by far is at Yakima Community College, followed by Central Washington University
Heritage University and Perry Technical Institute. Washington State University Learning Center is also a critical player in regional
development, as will be discussed further. The majority of the schools have a vocational focus to match the current local workforce needs. It
is also important to note that most high schools east of the Cascades have strong Agricultural Education Programs and many students do not
pursue education beyond 12th grade, favoring instead to join the workforce after graduation.
3.5. Diamond Model Analysis: Determining the Quality of the Regional Business Environment
The diamond model is a useful tool to organize the data into contextually relevant information. Dr. Porter’s methodology for
determining the quality of the business environment will be employed here, using factor conditions, context for firm strategy structure and
rivalry, related and supporting industry and demand conditions (Porter, 2008). As previously discussed it is clear that Yakima is generally
dependent on its agricultural commodities and other factor conditions, which is reflected in the regional diamond model analysis.
3.5.1. Factor Conditions
The following factor conditions cover regional access to high quality business inputs such as human resources, capital availability,
physical infrastructure, administrative and information infrastructure and efficient access to natural endowments.
3.5.1.2. Natural Endowments
Although ultimately prosperity is not a result of simply having rich natural endowments it is clear that it formed the foundation upon
which Yakima’s present business environment has been built. This is certainly true of Yakima valley and the fertile land has led to nearly 100
years of investment in the agricultural and transportation infrastructure of the region.
Although the environment in the Yakima Valley is almost perfect for cultivation there was one major limitation: the lack of available
water. The federal government made funds available through the Reclamation Act of 1902 to develop irrigation systems specifically in

8 Sunnyside, Tieton and Roza. As a result more than 29,800 acres of apple orchards and tree fruits, 72,000 acres of cropland and an
additional 90,000 of irrigated acres were added by 1920 (Census, 1964). Today, the Yakima Irrigation Project delivers water to approximately
460,000 acres in central Washington which provided the missing element to turn the fertile soil and dry sunny weather into an almost perfect
cultivation combination.
The Yakima Valley is centrally located in the state of Washington but close to major river and rail transportation networks including
BNSF and Port of Grandview. McAllister Field provides regional air transport to the area and the irrigation network is serviced by snowpack
and five nearby reservoirs and plentiful, cheap power is available from wind, hydro, and conventional generation plants.
3.5.1.3. Social Infrastructure and Political Institutions
Politically Yakima County is a participant in the Washington state government system. In common with many agricultural districts it
is typically fairly conservative in policies. Frequent issues with State Policy being dictated by generally more liberal population centers on the
west coast of the state do impact the local business environment. Particularly when initiatives such as age requirements and mandated
wage/benefit packages designed around Seattle cost of living and industry are forced on farming communities. As previously mentioned the
government is one of the largest employers in the region. A large military training facility forms the other major political institutions.
Agricultural associations and economic development committees are frequently the originator of public initiatives.
3.5.2. Context for Firm Strategy, Structure, and Rivalry
Local competition is open in Yakima County. Most organizations of small to medium size serve the local community. The
agricultural sector is one of the top in the nation for productivity and quality. As previously mentioned Yakima, like many small communities
and agriculture areas, can be seriously impacted by heavy handed government policy. The Yakima Indian reservation has an adverse effect
in some areas as it is provided competitive advantage via tax immunities.
3.5.3. Related and Supporting Industry
The regional economy is primarily based on local clusters (another reason to be concerned with the amount of wages being
repatriated by undocumented workers). Approximately 70% of the regional economy is internal (exhibit 6) while 29% of employment is in
traded clusters. The major classifications (using the NAICS system) in Yakima County are healthcare making up twice the employment of the
next classification of local hospitality followed closely by real estate. Agriculture and agricultural support fall in around 6th and 7th respectively.
3.5.4. Demand Conditions
Depending on the industry or sector requirements, there are varying levels of sophisticated customer requirements. It is clear that
Washington State foster strong environmental, safety and other protection laws which will be discussed further on. The concentration of
cluster types discussed in the next section more adequately explains the type of customer that Yakima industries and business are tailored
towards.

9 3.6. State of Regional Cluster Development
The state of the traded regional cluster development should be discussed in order to identify and quantify how concentrated the
region’s industry is, its export areas and potential to build monetary inflow to the economy. The higher the location quotient is in the below
table, the more potential that cluster concentration has likelihood for export potential (Porter, 2008). Employment and employment share are
also strong reference indicators. Employment is simply the number of jobs in the regional cluster while employment share is a calculation of
the employment compared to other clusters in the same specialization nationally. A high employment share indicates competitiveness with
other clusters nationally and may infer higher cluster specialization.
For the purposes of this discussion, Yakima, WA MSA and Rochester, WA MSA traded clusters were used as the closest regional
information match for statistical comparison. Yakima, WA MSA had 19,227 employees in its traded clusters while Rochester, NY MSA had
122,423. While the number of employees is different, the composition of traded vs. local and natural endowment clusters is similar.
Table 1. Traded Cluster Employment, Employment Share and Location Quotient by MSA (Select Clusters) Yakima, WA and
Rochester, NY MSAs, 2010
Yakima, WA Employ-
ment
Employ-ment Share
Location Quotient
Rochester, NY Employ-
ment
Employ-ment Share
Location Quotient
Agricultural Products 3219 1.13 20 Publishing and Printing 11797 1.17 3.048
Distribution Services 3089 0.18 3.18 Medical Devices 4024 1.11 2.88
Entertainment 1443 0.16 2.85 Ed&Knowledge Creation 22366 1.087 2.83
Trans. & Logistics 1622 0.12 2.14 Agricultural Products 2651 0.93 2.43
Processed Food 1633 0.12 2.017 Aerospace Engines 750 0.79 2.05
Forest Products 448 0.1 1.81 Aerospace Engines 750 0.79 2.05
Heavy Machinery 379 0.1 1.75 Comm.Equipment 2775 0.66 1.71
Construction Materials 196 0.097 1.69 Analytical Instruments 3827 0.51 1.34
Production Technology 695 0.096 1.67 Production Technology 3633 0.5 1.31
Plastics 744 0.087 1.5 Business Services 19193 0.48 1.26
Prefabricated Enclosures 190 0.071 1.23 Plastics 3585 0.42 1.086
Heavy Const.Services 896 0.062 1.065 Information Technology 3390 0.36 0.95
Furniture 205 0.053 0.92 Distribution Services 5795 0.34 0.9
Sport, Rec.&Child Goods 60 0.051 0.88 Processed Food 4579 0.33 0.85
Hospitality and Tourism 936 0.045 0.78 Entertainment 2771 0.32 0.82
Ed&Knowledge Creation 798 0.039 0.67 Trans.& Logistics 3719 0.28 0.74
Source: U.S. Economic Development Administration, Institute for Strategy and Competitiveness, http://clustermapping.us (2010)
Yakima, WA MSA has more concentrated clusters compared to Rochester, but holds a lower employment share nationally. While
Rochester’s cluster specializations tend to indicate an innovation-based economy (education and knowledge creation, medical, devices and
publishing and printing), Yakima seems to be generally factor-based, enterprising from natural endowments and inexpensive (and relatively
unskilled) labor (agricultural, forest products, distribution and transportation). Rochester’s clusters also indicate a non-commodity based

10 economy in contrast to Yakima, whose distribution services and transportation and logistics concentrations have a stronger comparative
presence.
3.7. Sophistication of Regional Operations and Strategy
The current level of Yakima regional operations and strategy is generally low. Heavy governmental presence and subsidies from
the federal, tribal, state and county do not provide incentive enough to significantly change or develop new strategies or methodology for
regional business and industry development and growth. Though there are clearly some pockets of excellence such as firms and farms
taking advantage of emerging technology, most market and company activity remains in the “blue collar” realm. The overarching effect of the
current strategy seems to be one of the status quo maintenance – if it’s working (generating acceptable profit), don’t change it, i.e. if it’s not
broken, don’t fix it. The lack of innovation in the area might also just be a product of unfocused (or incorrectly focused) community and
governmental development efforts, not necessarily a lackadaisical approach to regional operations and strategy.
3.8. Key issues impacting competitiveness
There are several issues that affect the regional competitiveness of the Yakima area. First, Yakima County nor its industry leaders
have participated in, or cannot qualify to participate in, the state’s Dept. of Commerce Innovation Partnership Zones (IPZ) initiative
established in 2007 to stimulate “a decade of innovation” (WEDC, 2011). By comparison, its regional neighbors Walla Walla and Tri-Cities
have received over $1.5M in cluster and innovation grants to develop key efforts to improve their business environment, such as sustainable
development, alternate energy and bio-based product manufacturing in addition to water conservation and management efforts. While the
area’s primary economic development entity, the Yakima County Development Association’s mission is to “enhance the income quality of life
and employment stability” (YCDA, 2014), its primary strategies are to build local business (training, seminars, recruitment), recruit divers new
businesses (marketing, website and relationships with developers) and provide workforce and community leadership (YCDA, 2014). Its
measurable outcomes are not focused on research, building local education, innovation or fostering industry relationships, i.e. it’s not focused
on the right measurable outcomes to build their clusters and foster prosperity growth in the region. Furthermore, its current strategies may
only continue to foster Yakima’s current factor-based economy rather than making progress towards an efficient or innovative one. The
continuing improvement of the physical and educational infrastructure is an expensive activity but necessary for the continued profitability of
the traded clusters as well as attracting potentially new industries
3.9. Policy recommendations
The following policy recommendations are geared to the Yakima County Development Association. They include comments for
improvement in three areas: employment tracking and policy, infrastructure and focus on value-added industries. By focusing on these three
areas, the economy may perhaps be able to spark evolution from a factor-based economy to an efficiency-based economy.

11 3.9.1. Employment policy
This is an extremely sensitive topic that few people want to face head on. It is placed as the number one recommendation for the
simple reason that an honest look at this issue is required to clean up the data analysis. 30% of the industry in this region is considered a
traded. Phrased differently: 30% of the industry (economic activities) in the region brings in 100% of the dollars being used to support all the
rest of the local clusters such as healthcare, eateries, construction, etc. (we recognize that this is somewhat of an oversimplification but none
the less useful for illustration). If just 25% of wages from traded clusters are being drained out of the region by sending cash away instead of
spent in the local area it represents a huge economic loss to the local cluster. If politics can be set aside long enough to find the true
numbers then a real assessment can be made and this item can either be invalidated or corrected as a policy change requirement.
3.9.2. Infrastructure
Infrastructure not only supports the commodities based traded cluster (and thus the region) but it also becomes the anchor on which
other industry is attracted to the area. Primary concern is the immense irrigation efforts. Refining and advancing this system while also
developing techniques to protect water quality and support nature will pay dividends in several local industries. Changing irrigation from
simple trenches into something that also contributes to tourism attraction could be a huge plus. The Dutch systems and even the ancient
roman aqueducts are examples that STILL attract tourists. The large available land area combined with central location provides plenty of
room establish a satellite shipping hub safe from the geographic vulnerabilities such as major earthquake, Volcano, and flooding that the
Puget Sound ports are vulnerable to. Large open spaces close enough to sea ports, airports, highway and river ports provide the ultimate
stable staging area.
3.9.3. Value added industry
The region would benefit strongly from increasing its proportion of traded commodities from local commodities. We believe that the
best method of this would be bringing more of the value added processes closer to the commodities while leveraging the existing cluster
concentrations. For example the wine industry already attracts “foodies”. Fresh local agriculture is the ultimate source for gourmet food.
Apples become crisp cider sold for far more than the price of an apple. Hops for beer grown locally and wheat from nearby counties quickly
becomes local sourced beer.
4. Apple Cluster Analysis
Many challenges are inherent in trying to separate the apple cluster analysis from the regional analysis due to the Yakima area’s
heavy reliance on agriculture as the basis of its economy. Additionally, open source data sets are not necessarily limited to the same
geographic area, nor provide the specificity required in most instances to determine direct effects (and therefore performance) of the cluster.
Apple orchards cluster research also does not appear to have been a popular project; there are no existing cluster model samples that we
discovered during our research. Other clusters such as wine cluster (in WA and CA) have over 15 samples from the Harvard Business site, in
12 addition to several available professional reports from paid researchers with specially designed economic modeling software and closed-
source national data sets. The largest challenge encountered during this project however, is capturing the effects (or attempting to quantify or
qualify) of non-reported agricultural labor sources. This will serve as an introduction and brief history of the apple, the orchard value chain and
industry relationships and lead to an in-depth discussion on the Yakima apple orchard cluster (diamond model analysis), its performance and
recommendations for its future.
The apple as we know it is not native to North America, but rather came over with early European colonists. Although the apple is
just one of many things that made the same voyage to the “New World” it has played an important part in the development of the modern U.S.
and agriculture. When the frontier moved west, so too did Johnny Appleseed, planting, tending, and selling orchards along the way. The
orchards were frequently planted even before a proper house was built, and beyond providing the “proof” of land ownership the apple trees
were a form of insurance.
Many things have changed in the last hundred years but the apple continues to enjoy immense popularity and a steadily increasing
demand worldwide. The market viability of apples is demonstrated clearly at the grocery store where they are one of the top volume items. A
beautiful splash of color and variety is often the first greeting the market consumer receives entering a store, with more than 100 apple
varieties produced and sold commercially (a small fraction of the 2,500 varieties cultivated domestically, and approximately 7,500 varieties
globally) (Washington Apple Commision, 2010). In the U.S. the average consumer purchases about 40 pounds of apples and apple products
a year. There is no doubt that apples are a commodity in demand.
Apple harvest is primarily dependent on the natural endowments; the weather, environmental and soil conditions. Apples need a
good balance of sunny dry weather and cold periods to develop properly. The soil must provide the right structure and nutrients; Yakima has
an advantage in this area due to the loamy soil deposited by glacial activity and formed by Miocene Columbia River basalt flows. Additionally
there are many factors that affect the size of harvest and successful production, including: the quality of the stock, orchard inputs, proximity of
processing and speed of shipping. Beside climate, the most important factor contributing to harvest size is the availability of water while labor
and land management contribute the highest costs. The apple production value system diagram below depicts the inputs and processes from
orchard to consumer in addition to apple orchard industry relationships. Further on the relationships will be organized and specifically tied in
a Yakima apple orchard cluster map.

13 Diagram 1. Apple Production Value System
Diagram 2. Apple Orchard Industry Relationships
Source: Student Analysis
4.1. History of the Yakima Apple Cluster
The first orchard that was planted in the Yakima Valley
in 1870 consisted of 100 apple and pear trees. The gateway to a
regional agricultural market opened in 1886-88 with the
establishment of the Northern Pacific Railroad’s transcontinental
line and encouraged growth with new access to the Puget Sound.
Several grower associations and government
commissions were established in the 1940’s-60’s, including the
Washington State Horticultural Association, Yakima County
Cattlemen’s Association, the Hop Growers of Washington, and
the Yakima County Horticultural Union to name a few. Within the
Yakima Valley several food processing plans were also
established to can, freeze, dehydrate, juice and concentrate fruit,
vegetables and berries. By 1964, Yakima County ranked first
locally and nationally in the production of apples, hops and mint, a
trend that continues today over half a century later.
Source: Student Analysis
Source: Student Analysis

14 Diagram 3. Traded Cluster Relationships
Source: Student Analysis
Today’s apple cluster sits snugly in the nexus of the
agricultural, processed food and transportation, warehouse and
distribution clusters as indicated in Diagram 3.
4.2. Apple Cluster Performance
Performance of the Yakima cluster focuses on two areas: production value (domestic and global markets) as well as economic
impact of the apple orchard cluster on the regional and WA economy in terms of jobs and labor wages.
Fresh apple export from Washington State has been steadily increasing with approximately $569M in 2009, to $825M in 2012. The
top three exporting destinations were China, Japan and Canada. Approximately 78% of Washington apples are sold fresh with the remaining
22% sold processed. The top nine varieties of apples grown in WA are the Red Delicious, Golden Delicious, Gala, Fuji, Granny Smith,
Braeburn, Honeycrisp, Cripps Pink and Cameo. About 30% of the apples grown in WA are Red Delicious apples. They also account for over
48% of WA apples exported globally. (Exhibit 4) Comparison of apple production, yield and value are also in Exhibit 5.
No apple export info was found on New York State. Approximately 50% of NY apples are sold fresh with the remaining sold
processed.
Washington State has emerged as the main strategic competitor in the U.S. with New York a distant second place. Yakima County
leads the Washington State and U.S. market with nine times the apple production of its closest competitor, Wayne County, New York (Exhibit
5). Of the U.S. states Washington has both the highest yielding crops per acre at 45,000 lbs./acre and by far the largest amount of acreage
with 146,000 acres of apple orchards.
It is an important item to note that 100% of production is utilized. The overall market is not saturated and the supporting industry
provides significant buffer capacity. The best apples go to market to be sold crisp and fresh. The remaining apples are turned into apple
products such as sauce, juice, or cider.
4.2.1. Global Demand and Production
According to U.N. figures the top five apple-producing countries currently are China, U.S., India, Turkey and Poland (Food and
Agriculture Organization of the U.N., 2007 - 2011). With exports of approximately $1.8B the U.S. is the second largest exporter of apple

15 products and Yakima County is the single biggest apple producing county in the nation. Competing effectively in the global market may be
one key to growing the apple orchard cluster in Washington.
In terms of dollars, U.S. apple exports increased from $368M to $826M with dollars generally corresponding volume; Mexico $217M,
Canada $146M, Taiwan $50M, Indonesia $54M and Hong Kong $53M. The bulk of U.S. exports go to our closest neighbors whose climates
are not as favorable for growing this fruit and thus quick transportation remains a key factor. Though the percentage of the crop that we
export is small it will remain an important piece of the cluster to nurture this cash infusing endeavor (Exhibit 2, 3).
4.2.2. Domestic Demand and Production
In the non-citrus fruit category, U.S. production of apples is second only to grape production in both volume and value. (National
Agricultural Statistics Service, 2012). In 2011, the U.S. produced 4.2 M metric tons of apples with a deviation of only 1% over the previous
five years (Food and Agriculture Organization of the UN, 2007 - 2011).
Washington State has emerged as the main strategic competitor in the U.S. with New York a distant second place. Yakima County
leads the Washington State and U.S. market with nine times the apple production of its closest competitor, Wayne County, New York (Exhibit
4). Of the U.S. states Washington has both the highest yielding crops per acre at 45,000 lbs/acre and by far the largest amount of acreage
with 146,000 acres of apple orchards.
It is an important item to note that 100% of production is utilized. The overall market is not saturated and the supporting industry
provides significant buffer capacity. The best apples go to market to be sold crisp and fresh. The remaining apples are turned into apple
products such as sauce, juice, or cider. Fresh apples not sold at market return to the pipeline for processing (Exhibit 5).
One recent concern is that the consumption rate of apples has plateaued. Currently the consumption rates tend to be consistent
with population growth rates. Without looking more towards global markets or value-added industry, apple orchard farmers may face an over-
supply of apples in WA. To combat this, the WAC has developed special international relationships with Russia and Canada, and currently
hosts a marketing and information website in both countries.
4.2.3. Direct Employment
While the NAICS has assigned codes for Apple orchards (111331), and Pruning of orchard trees and vines, in addition to orchard
cultivation services (115112), these codes are not tracked locally or nationally to determine employment effects via traditional means.
Additionally, seasonal and undocumented workers provide challenges to determine effectiveness of the Apple orchard cluster in Yakima.
Fortunately, WA State provides two key data tools to extrapolate the direct and indirect effect of apple orchard wages and employment
regionally and in WA: Employment Security Department’s Seasonal Agricultural Employment Wage Data and the Office of Financial
Management 2007 Washington Input-Output Model (I-O 2007).
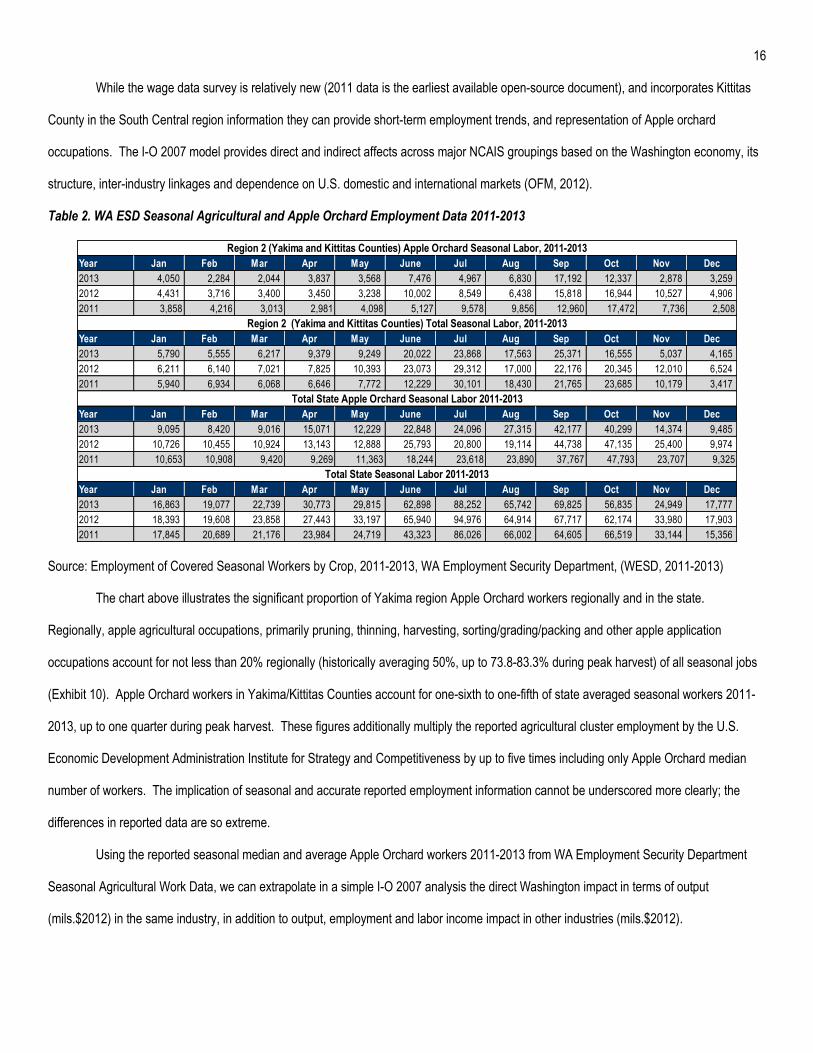
16 While the wage data survey is relatively new (2011 data is the earliest available open-source document), and incorporates Kittitas
County in the South Central region information they can provide short-term employment trends, and representation of Apple orchard
occupations. The I-O 2007 model provides direct and indirect affects across major NCAIS groupings based on the Washington economy, its
structure, inter-industry linkages and dependence on U.S. domestic and international markets (OFM, 2012).
Table 2. WA ESD Seasonal Agricultural and Apple Orchard Employment Data 2011-2013
Year Jan Feb Mar Apr May June Jul Aug Sep Oct Nov Dec
2013 4,050 2,284 2,044 3,837 3,568 7,476 4,967 6,830 17,192 12,337 2,878 3,259
2012 4,431 3,716 3,400 3,450 3,238 10,002 8,549 6,438 15,818 16,944 10,527 4,906
2011 3,858 4,216 3,013 2,981 4,098 5,127 9,578 9,856 12,960 17,472 7,736 2,508
Year Jan Feb Mar Apr May June Jul Aug Sep Oct Nov Dec
2013 5,790 5,555 6,217 9,379 9,249 20,022 23,868 17,563 25,371 16,555 5,037 4,165
2012 6,211 6,140 7,021 7,825 10,393 23,073 29,312 17,000 22,176 20,345 12,010 6,524
2011 5,940 6,934 6,068 6,646 7,772 12,229 30,101 18,430 21,765 23,685 10,179 3,417
Year Jan Feb Mar Apr May June Jul Aug Sep Oct Nov Dec
2013 9,095 8,420 9,016 15,071 12,229 22,848 24,096 27,315 42,177 40,299 14,374 9,485
2012 10,726 10,455 10,924 13,143 12,888 25,793 20,800 19,114 44,738 47,135 25,400 9,974
2011 10,653 10,908 9,420 9,269 11,363 18,244 23,618 23,890 37,767 47,793 23,707 9,325
Year Jan Feb Mar Apr May June Jul Aug Sep Oct Nov Dec
2013 16,863 19,077 22,739 30,773 29,815 62,898 88,252 65,742 69,825 56,835 24,949 17,777
2012 18,393 19,608 23,858 27,443 33,197 65,940 94,976 64,914 67,717 62,174 33,980 17,903
2011 17,845 20,689 21,176 23,984 24,719 43,323 86,026 66,002 64,605 66,519 33,144 15,356
Region 2 (Yakima and Kittitas Counties) Apple Orchard Seasonal Labor, 2011-2013
Region 2 (Yakima and Kittitas Counties) Total Seasonal Labor, 2011-2013
Total State Apple Orchard Seasonal Labor 2011-2013
Total State Seasonal Labor 2011-2013
Source: Employment of Covered Seasonal Workers by Crop, 2011-2013, WA Employment Security Department, (WESD, 2011-2013)
The chart above illustrates the significant proportion of Yakima region Apple Orchard workers regionally and in the state.
Regionally, apple agricultural occupations, primarily pruning, thinning, harvesting, sorting/grading/packing and other apple application
occupations account for not less than 20% regionally (historically averaging 50%, up to 73.8-83.3% during peak harvest) of all seasonal jobs
(Exhibit 10). Apple Orchard workers in Yakima/Kittitas Counties account for one-sixth to one-fifth of state averaged seasonal workers 2011-
2013, up to one quarter during peak harvest. These figures additionally multiply the reported agricultural cluster employment by the U.S.
Economic Development Administration Institute for Strategy and Competitiveness by up to five times including only Apple Orchard median
number of workers. The implication of seasonal and accurate reported employment information cannot be underscored more clearly; the
differences in reported data are so extreme.
Using the reported seasonal median and average Apple Orchard workers 2011-2013 from WA Employment Security Department
Seasonal Agricultural Work Data, we can extrapolate in a simple I-O 2007 analysis the direct Washington impact in terms of output
(mils.$2012) in the same industry, in addition to output, employment and labor income impact in other industries (mils.$2012).

17 Table 3. Calculated Estimated Washington Supported/Generated Employment in other Industries as a result of Annual Median and
Average Seasonal Apple Orchard Workers 2011-2013 (Top Ten)
0 1-19 20-99 100-249 250-499 500-999 Number of Workers
Source: Calculated using WA ESD Apple Orchard Seasonal Employment Data and WA OMF I-O 2007 Economic Impact Worksheet
Table 4. Calculated Estimated Washington Supported/Generated Employment in other Industries as a result of Annual Median and
Average Seasonal Apple Orchard Workers 2011-2013 (Bottom Ten)
RANK NAICS Title NAICS Code 2011 2012 2013 2011 2012 2013
42 Machinery Manufacturing 333 2 2 2 3 3 3
43 Other Manufacturing 316, 326, 339 2 2 1 2 3 2
44 Chemical Manufacturing 325 2 2 1 2 3 2
45 Forestry and Logging 113 (Incl. state forests, etc.) 2 2 1 2 3 2
46 Highway, Street, and Bridge Construction 2373 1 2 1 2 2 2
47 Computer and Electronic Product Manufacturing 334 1 1 0 1 1 1
48 Other Transportation Equipment Manufacturing 3361, 3362, 3363, 3365, 3369 0 1 0 1 1 1
49 Ship and Boat Building 3366 (Incl. federal/PSNS) 0 1 0 1 1 1
50 Electrical Equipment Manufacturing 335 0 0 0 0 0 0
51 Primary Metal Manufacturing 331 0 0 0 0 0 0
52 Aircraft and Parts Manufacturing 3364 0 0 0 0 0 0
Median Average
Washington Employment Impact from Reg. 2 (Yakima and Kittitas Counties) Apple Orchards Median and Average Seasonal Employment 2011-2013
0 1-19 20-99 100-249 250-499 500-999 Number of Workers
Source: Calculated using WA ESD Apple Orchard Seasonal Employment Data and WA OMF I-O 2007 Economic Impact Worksheet, (WA OMF, 2012)
The preceding tables outline the direct annual impact of seasonal Apple Orchard workers in terms of employment in other
Washington industries. It is unsurprising that several of the industries in the top ten mirrors the top employment clusters in Yakima (primarily
local) as discussed in the regional cluster related and supporting industries portion 3.5.3. In terms of labor income impact in other areas, the
median employment affect in 2013 calculated to $217.7M, with the top five labor-income affected NAICS categories being: Waste
Management/Other, and Agricultural Services ($36.4M), Credit Intermediation and Related Activities ($35.4M), Other Construction($27.7m),
Petroleum and Coal Products Manufacturing ($26.6M) and Other Retail ($28.3M) (See Exhibit 11). The bottom ten employment impact
outline the non-interrelated nature of the apple orchard cluster with its and least impacted industries, one of which is a fairly concentrated LQ
in the Yakima, WA MSA (forestry products). It is unclear in the I-O 2007 Simple Analysis Worksheet however if the employment in other
industries is restricted to the region, or is/can be disbursed across the state. Regardless, it cannot be denied that Apple Orchard has a

18 significant impact to both the regional and state economic performance, and clearly supports primarily local cluster industry activities, not
traded cluster industry activities.
4.3. Mapping the Yakima Apple Cluster
The apple orchard industry today bears little resemblance to the orchards of Johnny Appleseed’s day. Automation in the fields and
irrigation has generally increased the scale of every operation. Technology has allowed for greatly increased density of crop on any given
acre while science appears to allow the modification and repair of deficiencies in the basic natural endowment. In the industries that support
agriculture perhaps the greatest impact has been in the logistics of travel. Apples grown in Washington can reach the other side while still
crisp and juicy in refrigerated containers by land, sea, or air. Harvest remains a largely tied to manual labor but processing, sorting and
storing of produce is streamlined by automation.
Every orchard starts with tree, underlying the importance of nurseries as an orchard support activity. Universities and grows have
developed and cultivate dwarf varieties of trees that have doubled the production of each acre of land; the competitive advantage this has
given Yakima orchard farmers can be seen in exhibit 5. The agricultural schools continue to play major roles in the improvement and even
development of new species of apples, with WSU leading the way providing resources to local and regional orchard farmers. It takes
specialized equipment to maneuver between the now densely packed trees and specialized knowledge to repair and run these machines.
Chemical development and supply is needed to produce the fertilizers, pesticides, and many other chemicals that are used to increase growth
and prevent damage to crops. Hundreds of miles of irrigation channels are dug and maintained. Thousands of miles of irrigation pipe gets
installed and maintained. All these things happen prior to an apple ever getting picked.
Harvest is done primarily by hand in order to avoid damage to the trees and fruit, but alternate harvesting and collecting equipment
are also used, regionally mechanical harvesting machine operators were added to the orchard occupations tracked by Washington’s
Employment Security Department in 2013 (WA ESD, 2013). Legions of trained workers are used to pick the apples off the trees and move
them out of the orchard. Then the apples must get processed either for market sale or to become any one of several value added products.
Fresh apples must get washed to remove any chemical residue and then waxed to protect the fruit for its trip to market. The rest must be
washed and then sent to the processing plant for conversion to apple juice, apple butter, apple sauce, etc.
All these apples and apple products must get moved somehow. Last year 6.5M pounds of apples were shipped out of Washington
orchards. That volume of shipping implies a robust logistics industry able to move freight quickly and precisely to right locations. The figure
below depicts the interconnection between the agricultural, processed food and transportation cluster, and where the apple orchard cluster
exists relative to the overlapping clusters. Loss or migration of these clusters in Washington will negatively affect the continued growth of the
apple orchard cluster in Yakima County.

19 The graphic below depicts the weak, moderate and strong links between the Yakima orchards, input and supporting industries,
outputs, related clusters and products. Some weak links which may become stronger in the future include hard cider production (increasing
popularity of local and WA-brewed products, and Washington Beer Commission focus and support support) and its associated equipment, in
addition to the Yakima tourism cluster which currently is an underdeveloped area with only a .78 LQ.
Diagram 4. Yakima Apple Cluster
Source: Student Analysis
4.4. Apple Cluster Analysis (Diamond Model)
As in the regional analysis, the diamond model will be utilized to determine the quality of the business environment supporting the
Apple Cluster. Again factor conditions, context for firm strategy structure and rivalry, related and supporting industry and demand conditions
will be visited in context specific to the apple orchard industry.
4.4.1. Factor Conditions
The following factor conditions cover apple orchard farmer access to high quality business inputs such as human resources, capital
availability, physical infrastructure, scientific and technologic infrastructure and efficient access to natural endowments.
4.4.1.1. Factor Conditions: Employment and Wages
In Yakima, there were approximately 3,219 employees (Exhibit 7) in the agricultural cluster in 2010 as reported by the U.S. Bureau
of Economic Development, though there was significant discussion regarding number of employed Apple Orchard workers in 4.2.3. Average
wages for agricultural workers in the area are just over $33,000 (Exhibit 8). It is worth noting that there is a significant seasonal variation to
the employment requirements of an apple orchard, and wages are not necessarily based on hourly, but by the bin (see table below). Harvest

20 of different apple varieties is varied throughout the year to maximize production and offset increases in labor requirements for harvest.
Supporting industries are slightly buffered from the seasonal surge since repair and maintenance activities are year round and processing
other than fresh sale is accomplished incrementally on the harvest.
Table 1. Apple Cluster Harvest Median Wages 2007-2011
Source: Survey of Washington Fruit Growers, WA State Employment Security Dept., 2011
Yakima County is ranked 19th in the nation by both numbers of agricultural workers and annual income. Agriculture is the number
one source of employment in Yakima, WA MSA traded clusters. It should be noted that while annual income is below the national average,
apple orchard workers on average make 17% more than the real GDP per capita rate, which sits at 60% of national average, or just under
$27,000 in 2012 (U.S. BEA, 2012). The low income wage however reflects the relative-low skill requirement of orchard apple occupations.
Census information for Rochester, NY (major metropolitan area near Wayne County) shows that there are approximately 2,600
agricultural workers. It is ranked 23rd nationally in traded agricultural clusters.
4.4.1.1.1. Treetop
Treetop is a primary influence in the Yakima Apple Cluster because it is a cooperative of over 1,000 local apple and pear growers,
and focuses primarily on apples, apple sauce and apple juice. It’s re-formation from a privately owned company in 1960 contributed to the
establishment of the cluster. Employing over 1,000 people in the Yakima Valley, Treetop is one of the biggest single employers in the area.
Treetop was started by Bill Charbonneau with a single apple processing plant. The company is named after the belief of the time that the
best fruit grew at the top of the tree and continues to hold the ideal of using only the “best fruit”. Seneca and Del Monte fresh fruit processing
companies also have a significant presence, driving the local food processing concentration in the Yakima area.
4.4.1.1.2. Mott’s
Making apple products since 1842, Mott’s is a pioneer in the field of fruit processing. Focusing on apple sauce and juices, it has led
the field in packaging innovation, offering the first single-serve plastic cups in 1985. Mott’s fruit flavored apple sauces, reduced sugar and
21 fortified products have exploited new advances and trends in healthier, less processed food. Mott’s remains a major employer in the area and
primary driver of the developing apple cluster in Wayne County.
4.4.1.2. Factor Conditions: Capital Availability
A variety of loans are available to farmers from local, private, state and federal programs. It is more of a matter of educating orchard
farmers about available loans and financial resources, rather than a lack of capital availability. Some examples of loans from Washington
State include the Beginner Farmer/Rancher Loan Program (WA Housing Finance Committee), the Rural Washington Loan Fund (WA
Department of Commerce), USDA and UDSA Rural Development Program Loans and AgVision loans from Northwest Farm credit services.
4.4.1.3. Factor Conditions: Access to Natural Endowments
Although the environment in the Yakima Valley is ideal for growing apples, the area must be extensively irrigated. As a result of the
Reclamation Act of 1902, irrigation systems were developed in Sunnyside, Tieton and Roza. This alone increased acres of apple orchards
and tree fruits to more than 29,800 acres (Census, 1964). Today the Yakima Irrigation Project delivers water to approximately 460,000 acres
in central Washington, 95,351 of which was reported as bearing orchards in Yakima County in 2007 (USDA Census of Agriculture, 2007)
consisting of 1,470 farms.
The Yakima Valley is centrally located in the state of Washington but close to major river and rail transportation networks including
BNSF and Port of Grandview. McAllister Field provides regional air transport to the area and the irrigation network is serviced by snowpack
and five nearby reservoirs and plentiful and cheap power is available from wind, hydro, and conventional generation plants.
4.4.1.4. Factor Conditions: Scientific and Technical Infrastructure
The state and federal government are very involved in tree research, including orchard systems and establishment, fruit quality
improvement, pest management, genomics, tree fruit physiology, irrigation and pathology. Significant regional research facilities and
resources are the Washington Tree Fruit Commission, the USDA-ARS Yakima Agricultural Research Laboratory, Northwest Horticultural
Council. Additionally several major agricultural universities make their home in Washington and continue to support advanced studies in
agriculture and apples specifically. Washington State University is has extension campuses located throughout the state and provide
extensive horticultural and fruit tree support services.
4.4.1.4.1. WSU
WSU currently holds three patents in their apple breeding program. It is by far the most accessible resource for farmers to improve
harvest quality, produce longevity and production methodology. Washington State University Research and development has been focusing
on genetic solutions primarily to increase efficiency and production. In 2014, the WSU fruit breeding program announced that it is releasing
WA-38, large and dark red Crossbreed of Enterprise and Honeycrisp apples. WA-38 is slow to brown when it is cut and should hold its flavor
for more than a year. WA-38 is scheduled to be released in 2017. Previously WSU developed and launched WA-2 and WA-5. Both hybrids

22 with outstanding quality and productivity and bred for excellent structure, firm, and crisp, with a very balanced combination of acid and sugar.
WA-2 and WA-5 were successfully launched in 2009 and 2011 respectively. (WSU Apple Breeding Program, 2011)
WSU’s presence across the state, and superior accessibility to subject matter expertise in apple orchard cultivation is absolutely
critical in the improvement and continued innovation that Washington, particularly Yakima County, exploits to maintain and expand its market
dominance.
4.4.1.4.2. Cornell
New York focused late in the 19th century on agricultural science research by establishing the New York State Agricultural
Experiment Station. While early efforts included focuses on dairy, horticulture and an evaluation of field crops, it later expanded to fruit
horticulture, chemistry, plant diseases and pest species, among other fields. Cornell University assumed control of the state-run organization
in 1924, and continues to operate and expand the facility. In 2006, several agricultural innovations were introduced, including the breeding of
Cortland, Empire, Jonagold, Jonamac and Macoun apples and three new wine grapes. Cornell in many instances acts as a de-facto
government agency regarding many fields of research, including agricultural innovation and other areas of statistical study.
4.4.2. Context for Firm Strategy and Rivalry
Local competition is vigorous in the Yakima apple cluster, with up to 161 reporting orchard organizations (Manta, 2014). Local
information is used other than census data in the interest of the most up-to-date information. While the 2012 USDA Census of Agriculture has
been completed, the detailed reports per county will not be released until May 2014 (USDA NASS, 2014). Local orchards generally fall into
four combined production and service categories: “orchards, tree service”, “orchards, farms, tree service,” “orchards, fruit & vegetable
growers, shippers”, and “orchards, tree service, fruit & vegetable markets” (Yellow Pages, 2013). 75% of the reporting orchards fall into the
third category, implying integrated shipping activities in their operations. While there are some major farms in the area, with between 100 and
4,999 employees, the majority of orchards report 1-4 employees (69%), followed by 5-9 employees (12%). Just fewer than 80% of the
orchards report annual revenue of under $500K. 30 growers in the area report more than $500K annual revenue, up to $10M, see below
charts.
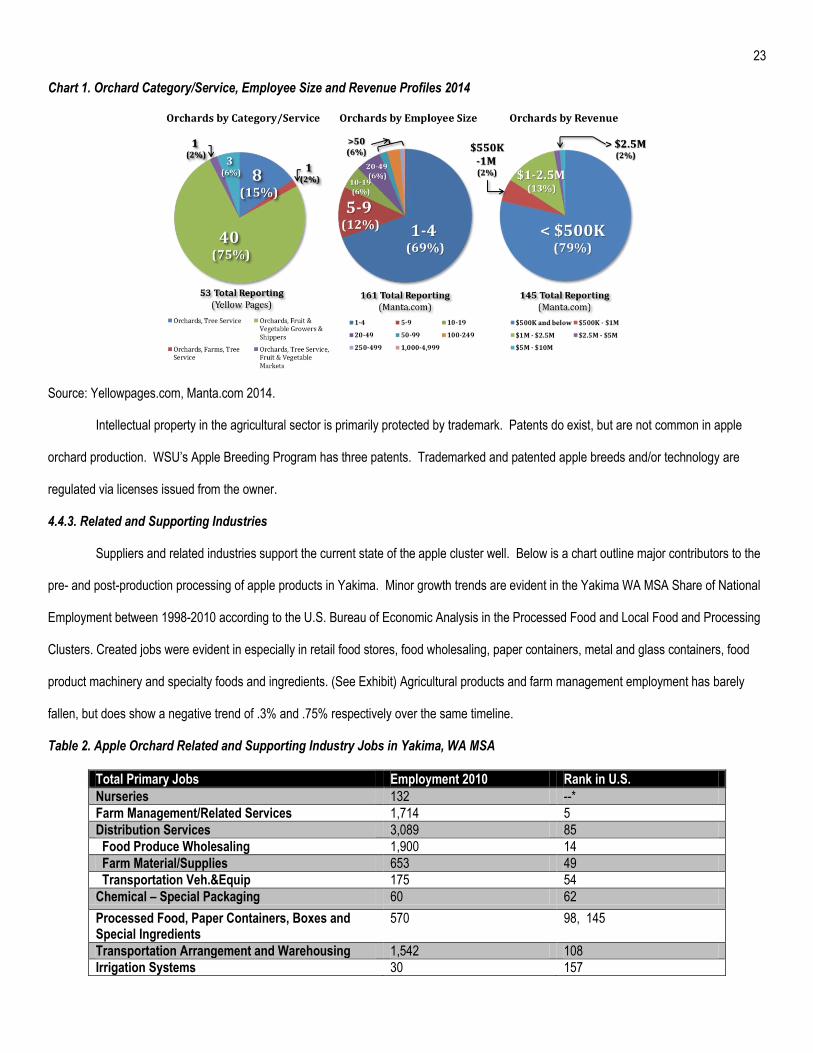
23 Chart 1. Orchard Category/Service, Employee Size and Revenue Profiles 2014
Source: Yellowpages.com, Manta.com 2014.
Intellectual property in the agricultural sector is primarily protected by trademark. Patents do exist, but are not common in apple
orchard production. WSU’s Apple Breeding Program has three patents. Trademarked and patented apple breeds and/or technology are
regulated via licenses issued from the owner.
4.4.3. Related and Supporting Industries
Suppliers and related industries support the current state of the apple cluster well. Below is a chart outline major contributors to the
pre- and post-production processing of apple products in Yakima. Minor growth trends are evident in the Yakima WA MSA Share of National
Employment between 1998-2010 according to the U.S. Bureau of Economic Analysis in the Processed Food and Local Food and Processing
Clusters. Created jobs were evident in especially in retail food stores, food wholesaling, paper containers, metal and glass containers, food
product machinery and specialty foods and ingredients. (See Exhibit) Agricultural products and farm management employment has barely
fallen, but does show a negative trend of .3% and .75% respectively over the same timeline.
Table 2. Apple Orchard Related and Supporting Industry Jobs in Yakima, WA MSA
Total Primary Jobs Employment 2010 Rank in U.S.
Nurseries 132 --*
Farm Management/Related Services 1,714 5
Distribution Services 3,089 85
Food Produce Wholesaling 1,900 14
Farm Material/Supplies 653 49
Transportation Veh.&Equip 175 54
Chemical – Special Packaging 60 62
Processed Food, Paper Containers, Boxes and Special Ingredients
570 98, 145
Transportation Arrangement and Warehousing 1,542 108
Irrigation Systems 30 157

24 Source: U.S. Economic Development Administration, Institute for Strategy and Competitiveness, http://clustermapping.us (2010), *Manta.com (2014)
4.4.4. Demand Conditions
Washington has strict quality, safely and environmental standards, primarily encapsulated in Title 15 of the RCW, Agriculture and
Marketing. It addresses standards of grades and packs (15.17 RCW), controlled atmospheric storage of fruits and vegetables (15.30) and
sales limitations (15.21) to name a few. Yakima County does not have codes that directly affect the agricultural cluster, outside of tertiary
effects of urban growth development, but most are captured in 15th Chapter of the Revised Code of Washington (RCW); Agriculture and
Marketing. The law addresses multiple facets of quality, growth and production, environmental standards, contracts and fair market
standards. The code further establishes several commissions, including the Washington Apple Commission, Dairy Products Commission,
Honey Bee Commission, Hardwoods Commission, Wine Commission, Washington Beer Commission, Forest Products Commission and
Washington Grain Commission (WA State Legislature, 2013).
The county is very proactive in the State Environmental Policy Act (under Chapter 16, Environment), and protection of critical water
areas (Chapter 16A, C) and wildlife habitat conservation (Chapter 16D)(Yakima County, 2013), which support or mirror the requirements of
state law, Chapter 90 of the RCW. These water control, protection and conservation laws compliment environmental regulations published by
other government departments and agencies, such as the USDA, EPA, and DNR. Consumer protection laws pertaining to agriculture are
addressed in 15.83 RCW, Agricultural Marketing and Fair Practices.
4.5. Key Issues Impacting Competitiveness
The primary issues impacting competitiveness in the Yakima apple cluster are its lack of real domestic competition, general low
awareness of apples as a traded cluster generator and the general deficit of business education amongst orchard farmers (and in agriculture
in general). Washington has been the number one producer of apples in the nation since the mid-sixties. While research and development is
still on-going and new cultivation and horticultural development techniques are being explored, where does one go when they are at the top?
This report used Wayne County, NY and its outlying MSA of Rochester, NY to generate recommendations of what not to do, but the lack of
available specific data is likely evident. Frankly Wayne County seems in decline and is not a realistic guide for what Yakima orchard farmers
and cluster leaders should do next to increase their competitive advantage, only what actions to avoid and issues/threats to be aware of.
Another key issue is the general low awareness of apples as a cluster-generator. Everyone knows that apples generally make a lot
of money for Washington and contribute to the economy, but it’s not a particularly sexy fruit. It is not a grape; it does not make wine. This low
awareness is also likely influenced by the region’s development strategies discussed previously. The region does not participate in IPZ, nor
promote the benefits of industry relationships and cluster-development unlike the Walla Walla Region and Tri-Cities area. Available specific
data, and sensitive subjects that would need to be explored (illegal labor) may also keep a damper on truly developing products for public
consumption and cluster development.

25 4.6. Policy Recommendations
The following policy recommendations are geared to the Washington Apple Commission. They include comments for improvement
in three areas: investment in research and development, specific marketing and promoting business education for apple orchard farmers. By
placing emphasis on these three areas, a higher level of awareness and interest in the well-being (investment, research and development) of
the apple orchard industry may develop in order to take this traded cluster to the next level. As it is already the first apple producer in the
nation, it is currently considered to be the most competitive.
4.6.1. Maintain R&D
Almost without exception investment in Research and Development pays off in the long run. Investment as simple as grants to
community colleges (Walla Walla wine industry which has funded several local schools) to something as complex as a regional center of
excellence, the ROI goes beyond simple product development and drives process, value, and innovation. The existing levels of funding
appear to have kept WA in the top producing regions but continued investment and awareness of competing factors will keep the apple cart
rolling. Specific premium fruit has demonstrated a particular success in the marketplace and the population looks forward to new offerings.
4.6.2. Focused Marketing on the Industry, not the Fruit
One area that could be beneficial to the apple cluster is to market the industry not the fruit. The dairy industry has done an
outstanding job in this recently. Every dairy farmer is an environmental steward, educator, and animal rights activist…potentially a model,
great singer, and an actor and feeds the homeless. It is only infrequently that we hear anything about “milk does the body good” anymore
(also consider the “Got Milk” campaign). The value of this “goodwill” marketing cannot be overstated particularly in the premium markets.
One particularly easy suggestion is that every apple farmer is a steward of the trees. Sure you could be a Subaru and have a tree planted but
when you buy an apple you support an entire forest of trees. The apple industry plants more trees than the forest service and those trees all
have flowers. The apple flowers are doing full time duty to keep the nation’s bees flying and making honey. The plight of the bees is not just
a marketing opportunity but is a very real issue that can be partially addressed for profit.
4.6.3. Business Education for Apple Orchard Farmers
Business education should be a top priority for orchard farmers in the Yakima cluster, primarily because of the relative market
position of the cluster. Without close domestic competition driving improvement in the cluster, one must drive industry forward using available
tools; particularly as WA apples are pushed more and more to international markets. Sound business practices, training in entrepreneurial
development and networking are just some of the positive benefits orchard farmers would receive. Another tangible benefit is access to a
wider array of ideas, and different perspectives to grow future opportunities in the Yakima apple cluster.

26 5. Exhibits.
Exhibit 1. Major Employers in the Yakima Area, 2012
Employer Type Persons employed
1. Yakima Valley Memorial Hospital Hospital 2,200
2. Yakima School District School district 1,736
(Education)
3. Walmart Department store 1,587
4. Washington State Department of Social and Health Services State government 1,400
(Social services)
5. Yakima County County government 1,213
6. Del Monte Foods Fruit processing 1,200
7. Yakima Valley Farm Workers Clinic Hospital 1,181
8. Yakima Regional Medical & Cardiac Center Hospital 942
9. Yakima Training Center United States Army 850
(Military)
10. AB Foods Beef processing 850
11. Yakima Valley Community College Education 761
12. City of Yakima City government 711
13. Yakama Legends Casino Casino 634
14. Washington State Department of Transportation State government 555
15. Tree Top, Inc. Fruit processing 540
Total 6,465
Source: "Yakima Valley Major Employers". Greater Yakima Chamber of Commerce. Retrieved from http://www.yakima.org/yakima/demo.html
Exhibit 2. Yakima, WA MSA Employment by Traded Cluster, 2010
Source: U.S. Economic Development Administration, Institute for Strategy and Competitiveness, http://clustermapping.us

27 Exhibit 3. Utilized Non-citrus Fruit Production in the U.S. 2012
Source: USDA, http://quickstats.nass.usda.gov/ Exhibit 4. U.S. Domestic and Internationally Traded Share of Utilized Apple Production 2000-2012
Exhibit 5. WA and NY, Bearing, Yield and Value 2010-2012
Source: USDA, http://quickstats.nass.usda.gov/
Source: USDA, http://quickstats.nass.usda.gov/

28 Exhibit 6. Yakima, WA and Rochester, NY MSA Clusters: Overall Composition and Wages 2010
Source: U.S. Economic Development Administration, Institute for Strategy and Competitiveness, http://clustermapping.us Exhibit 7. Yakima, WA and Rochester MSA Employment by Traded Agriculture Subcluster, 2010
Source: U.S. Economic Development Administration, Institute for Strategy and Competitiveness, http://clustermapping.us Exhibit 8. Yakima, WA and Rochester, NY MSA Wages by Agricultural Products Subcluster, 2010

29
Source: U.S. Economic Development Administration, Institute for Strategy and Competitiveness, http://clustermapping.us Exhibit 9. Yakima, WA and Rochester, NY MSA, Share of National Employment by Selected Cluster and Subcluster 1998-2010.

30
Source: U.S. Economic Development Administration, Institute for Strategy and Competitiveness, http://clustermapping.us Exhibit 10. Region 2 (Yakima and Kittitas Counties) Apple Orchard Workers as a Percentage of Regional and WA State Seasonal
Labor 2011-2013
Year Jan Feb Mar Apr May June Jul Aug Sep Oct Nov Dec
2013 69.9% 41.1% 32.9% 40.9% 38.6% 37.3% 20.8% 38.9% 67.8% 74.5% 57.1% 78.2%
2012 71.3% 60.5% 48.4% 44.1% 31.2% 43.3% 29.2% 37.9% 71.3% 83.3% 87.7% 75.2%
2011 64.9% 60.8% 49.7% 44.9% 52.7% 41.9% 31.8% 53.5% 59.5% 73.8% 76.0% 73.4%
Year Jan Feb Mar Apr May June Jul Aug Sep Oct Nov Dec
2013 53.9% 44.1% 39.6% 49.0% 41.0% 36.3% 27.3% 41.5% 60.4% 70.9% 57.6% 53.4%
2012 58.3% 53.3% 45.8% 47.9% 38.8% 39.1% 21.9% 29.4% 66.1% 75.8% 74.7% 55.7%
2011 59.7% 52.7% 44.5% 38.6% 46.0% 42.1% 27.5% 36.2% 58.5% 71.8% 71.5% 60.7%
Year Jan Feb Mar Apr May June Jul Aug Sep Oct Nov Dec
2013 44.5% 27.1% 22.7% 25.5% 29.2% 32.7% 20.6% 25.0% 40.8% 30.6% 20.0% 34.4%
2012 41.3% 35.5% 31.1% 26.2% 25.1% 38.8% 41.1% 33.7% 35.4% 35.9% 41.4% 49.2%
2011 36.2% 38.7% 32.0% 32.2% 36.1% 28.1% 40.6% 41.3% 34.3% 36.6% 32.6% 26.9%
Year Jan Feb Mar Apr May June Jul Aug Sep Oct Nov Dec
2013 24.0% 12.0% 9.0% 12.5% 12.0% 11.9% 5.6% 10.4% 24.6% 21.7% 11.5% 18.3%
2012 24.1% 19.0% 14.3% 12.6% 9.8% 15.2% 9.0% 9.9% 23.4% 27.3% 31.0% 27.4%
2011 21.6% 20.4% 14.2% 12.4% 16.6% 11.8% 11.1% 14.9% 20.1% 26.3% 23.3% 16.3%
Region 2 (Yakima and Kittitas County) Apple Orchard Workers as a Percentage of State Total Apple Orchard Seasonal Labor 2011-2013
Region 2 (Yakima and Kittitas County) Apple Orchard Workers as a Percentage of State Seasonal Labor 2011-2013
Apple Orchard Workers as a Percentage of Region 2 (Yakima and Kittitas Counties) Seasonal Labor 2011-2013
Region 2 (Yakima and Kittitas County) Apple Orchard Workers as a Percentage of State Total Seasonal Labor 2011-2013
Source: WA ESD Seasonal Agricultural Employment Data 2011-2013,
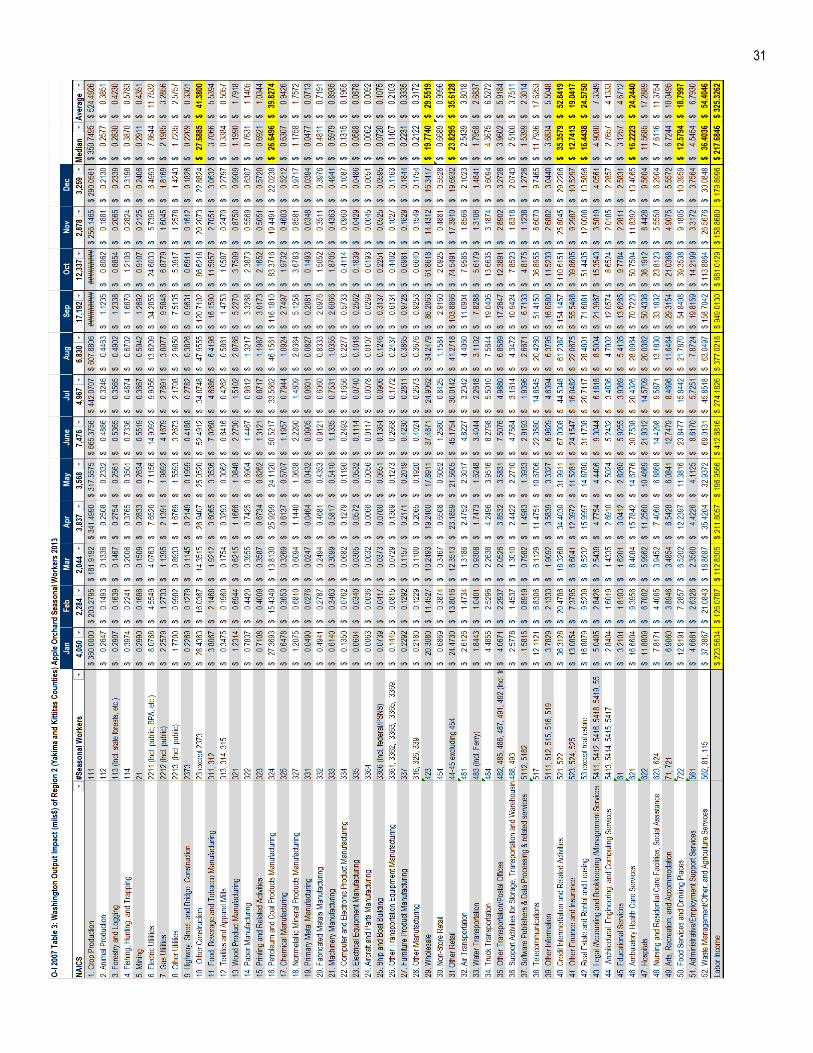
31

32 6. References
2007 Census Volume 1, Chapter 2: County Level Data, Washington, All Tables, USDA Census of Agriculture Retrieved from
http://www.agcensus.usda.gov/Publications/2007/Full_Report/Volume_1,_Chapter_2_County_Level/Washington/
2007 Census of Agriculture Wayne County New York County Profile, USDA NASS Retrieved from
http://www.agcensus.usda.gov/Publications/2007/Online_Highlights/County_Profiles/New_York/cp36117.pdf
2007 Census Volume 1, Chapter 2: County Level Data, New York, All Tables, USDA Census of Agriculture Retrieved from
http://www.agcensus.usda.gov/Publications/2007/Full_Report/Volume_1,_Chapter_2_County_Level/New_York/
2007 Impact Work Sheets, Chapter 3: The Washington Input-Output Models for Impact Analysis, WA Office of Financial Management
Retrieved from http://www.ofm.wa.gov/economy/io/2007/I-O_2007_impact_worksheets.xls
2012 Agricultural Workforce Report, Washington State Employment Security Department Labor Market and
Performance Analysis (December 2013) Retrieved from https://fortress.wa.gov/esd/employmentdata/docs/industry-
reports/ag-annual-2012.pdf
2011 Agricultural Workforce Report, Washington State Employment Security Department Labor Market and
Performance Analysis (December 2012) Retrieved from https://fortress.wa.gov/esd/employmentdata/docs/industry-
reports/ag-annual-2011.pdf
2010 Agricultural Workforce Report, Washington State Employment Security Department Labor Market and
Performance Analysis (December 2012) Retrieved from https://fortress.wa.gov/esd/employmentdata/docs/industry-
reports/ag-annual-2010.pdf
2011 Survey of Washington Fruit Growers, Washington State Employment Security Department Labor Market and
Performance Analysis (April 2012) Retrieved from https://fortress.wa.gov/esd/employmentdata/docs/industry-
reports/fruit-growers-wage-survey-results-2011.pdf
About Us, New Vision Yakima County Development Association, 2014 New Vision & Yakima County Development
Association Retrieved from http://www.ycda.com/about/
Agricultural Labor Employment and Wages Data (January 2011-December 2013) Washington State Employment Security Department Labor
Market and Performance Analysis, Retrieved from https://fortress.wa.gov/esd/employmentdata/docs/industry-reports/
Apple Varities, Washington Apple Commission (2013), Retrieved from http://www.bestapples.com/varieties/index.aspx
Becker, P. (2006). Yakima County: Thumbnail History. Retrieved from http://www.historylink.org
Beyers, Lin (2012), The 2007 Washington Input-Output Study (2007 WA I-O), WA Office of Financial Management Retrieved from
http://www.ofm.wa.gov/economy/io/2007/I-O_2007_report.pdf
The Budget for Fiscal Year 2014, United States Department of Agriculture p59-63, White House Office of Management and Budget, Retrieved
from http://www.whitehouse.gov/sites/default/files/omb/budget/fy2014/assets/agriculture.pdf
Business Climate - Site Location, Top Industries & Quality of Place Insights. Washington State Department of Commerce Retrieved from
http://businessclimate.com/washington-economic-development
Choose Washington Online Magazine, Choose Washington - Building Business Legends, Washington State Department of Commerce
(2014), 2014 Journal Communications Inc. Retrieved from http://choosewashington.com/
Core Facts, Washington Apple Commission (2013), Retrieved from http://www.bestapples.com/facts/index.aspx
Crop and Livestock Survey Reports, Agricultural Online Wage Library, United States Department of Labor
Employment & Training Administration (March 2010) Retrieved from http://www.foreignlaborcert.doleta.gov/aowl.cfm
Crops: Fruit & Tree Nuts: Apples: By County, Quick Stats (2007), USDA NASS, Retrieved from http://quickstats.nass.usda.gov/
Data Center, New Vision & Yakima County Development Association Retrieved from http://www.ycda.com/data-
center/index.html
DiNapoli,Thomas P. (2012). “Agriculture By the Numbers: New York Farming is Big Business.” New York, NY: New York City Public
Information Office. Retrieved from: http://www.osc.state.ny.us/osdc/rpt7-2013.pdf
Employment of Covered Seasonal Workers by Crop in Washington State, 2011-2013 Washington State Employment Security Department
Labor Market and Performance Analysis, Retrieved from https://fortress.wa.gov/esd/employmentdata/docs/industry-reports/
International, Washington Apple Commission (2013), Retrieved from http://www.bestapples.com/international/index.aspx
IPZ Facts Washington State Department of Commerce (March 2013)Retrieved from http://choosewashingtonstate.com/wp-
content/uploads/2013/03/IPZ-Presentation_Facts-Table.pdf

33 Key Industries, New Vision & Yakima County Development Association Retrieved from http://www.ycda.com/key-
industries/index.html
Labor Statistics for the Finger Lakes Region, New York State Department of Labor Retrieved from
http://www.labor.ny.gov/stats/fin/default.asp
Manta (2013). Yakima County, WA Orchards. Retrieved from http://www.manta.com
NAICS, retrieved from https://www.census.gov/cgi-bin/sssd/naics/naicsrch
National Agricultural Statistics Service, United States Department of Agriculture (2012). Retrieved from http://quickstats.nass.usda.gov/
New York State Projection Data by County, Wayne County, Cornell University (September 2011) Retrieved from
http://pad.human.cornell.edu/counties/projections.cfm
Nickel, A.. et al (2011). What Makes IPZs Click? The Success and Developmental Challenges of Three Innovation Partnership Zones,
Commerce Research Institute, Washington Economic Development Commission, Retrieved from
http://choosewashingtonstate.com/wp-content/uploads/2013/02/2011_WhatMakesAnIPZClick.pdf
Occupational Wages, New York State Department of Labor Retrieved from http://www.labor.ny.gov/stats/lswage2.asp#45-0000
Office of Financial Management (2012). Population of Cities, Towns and Counties: State of Washington. Retrieved from:
http://www.ofm.wa.gov.pop/april1/ofm_april1_population_final.pdf
Office of Industries Publication ITS-04 (2010). “Apples, Industry & Trade Summary.” Washington D.C.: United States International Trade
Commission.
Porter, M. (2008). On Competition. Boston: Harvard Business Press.
Personal Interview, WSU Apple Breeding Program, February 19, 2014
Unemployment Rate Rankings by Region, MSA and County Jan 2014, New York State Department of Labor Labor Statistics Retrieved from
http://www.labor.ny.gov/stats/lslaus.shtm
United States Census (2013). Retrieved from http://onthemap.ces.census.gov.
United States Census (2013). Retrieved from http://quickfacts.census.gov
Top Production – Apples (Countries by Commodity), FAOSTAT (2007-2011), Food and Agriculture Organization of the United Nations.
Retrieved from: http://faostat.fao.org/site/339/default.aspx
Tague, N. (2004) The Quality Toolbox, Second Edition, ASQ Quality Press Retrieved from http://asq.org/learn-about-quality/project-planning-
tools/overview/pdca-cycle.html
The 2007 Washington Input-Output Model, WA Office of Financial Management October 2012 Retrieved from
http://www.ofm.wa.gov/economy/io/2007/
Transportation Research Group (2008). “Washington State Industry Outlook and Freight Transportation Forecast: Apple Industry.” Pullman,
WA: Washington State University School of Economic Sciences.
Washington Apple Commission, (2010). Retrieved from: http://www.bestapples.com
YCDA Five Year Plan (2014-2018), New Vision & Yakima County Development Association Retrieved from
http://www.ycda.com/cabinet/data/nv-logic-model-five-year-plan1.pdf
Washington State Economic Development, Washington, Washington State Department of Commerce, (2014) Retrieved from
http://www.economicmodeling.com/wp-content/uploads/2007/10/emsi_understandinglq.pdf
Wayne County Agricultural Development Board, (2011). “Wayne County Agricultural and Farmland Protection Plan.” Wayne County, NY:
Wayne County Board of Supervisors. Retrieved from: http://www.co.wayne.ny.us
Wayne County 2014 Tax Rates, Tax Assessor http://www.co.wayne.ny.us/Departments/realproptax/TaxRates.htm
Welcome to Wayne County, Wayne County New York 2001-2009 Wayne County Government (March 2014) Retrieved from
http://www.co.wayne.ny.us/index.htm
Yakima County Code, A Codification of the General Ordinances of Yakima County, Washington, CODE PUBLISHING COMPANY, Seattle,
Washington, 2014 Retrieved from http://www.codepublishing.com/WA/yakimacounty/
Yakima County Development Association Economic Data Profile, New Vision & Yakima County Development
Association, June 2012 Retrieved from http://www.ycda.com/cabinet/data/ycda-economic-data-profile-2012.pdf
Yakima County Treasurer's Office Reports 2012-14, Yakima County Treasurer's Office, Treasurer Retrieved from
http://www.yakimacounty.us/treasurer/Treasurers%20Reports%20rev.pdf
Yakima Valley High Yield Growth, (2013). “Yakima County, Washington Offers Food Processors a Recipe for Growth.” Yakima, WA: Yakima
County Development Association. Retrieved from: http://www.ycda.com/