cluster analysis of time series data - univerzita karlovaai.ms.mff.cuni.cz/~sui/barton.pdf ·...
TRANSCRIPT

logocvut
Cluster analysis of time series data
Tomas Barton
Supervisor: Ing. Pavel Kordık, Ph.D.
Department of Theoretical Computer ScienceFaculty of Information Technology
Czech Technical University in Prague
January 5, 2012
Tomas Barton

logocvut
The Problem
The Problem
find suitable method for identification of patternsassign samples into (unknown) groups
Tomas Barton

logocvut
The Problem Expected results
Tomas Barton

logocvut
The Problem Goals
Goals
capture global trends
absolute values (sometimes) doesn’t matter
signals are not periodical
discover unknown patterns
Tomas Barton

logocvut
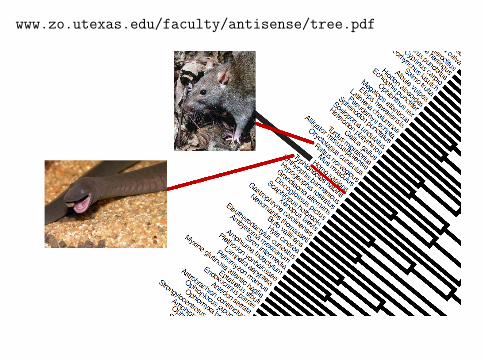
The Problem Biological background
Tomas Barton

logocvut
Data mining
Phases of clustering process
1 data cleaning
2 data integration
3 data selection
4 data transformation
5 clustering
6 pattern evaluation
7 knowledge representation
Tomas Barton

logocvut
Data mining Clustering
Clustering
Tomas Barton
logocvut
Data mining Clustering
No “correct” clustering exists
Tomas Barton

logocvut
Data mining Clustering
Definition
“Those methods concerned in some way with theidentification of homogeneous groups of objects”
[Arabie et al., 1996]
Definition
“A cluster is a set of entities that are alike, and entitiesfrom different clusters are not alike” [Everitt, 1993]
Tomas Barton

logocvut
Data mining Clustering
clustering can be used for understanding data
to perform clustering you need to understand data
Tomas Barton

logocvut
Data mining Clustering
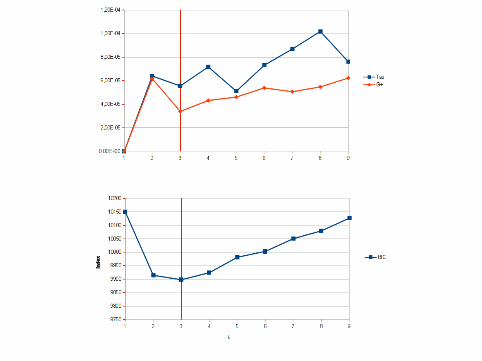
Determine number of clusters
Tomas Barton

logocvut
Data mining Clustering
k = 3
Tomas Barton

logocvut
Data mining Clustering
k = 6
Tomas Barton

logocvut
Data mining Clustering
k = 9
Tomas Barton

logocvut
Data mining Clustering
k = 14
Tomas Barton

logocvut
Data mining Clustering
Determining the number of clusters in a dataset is challenging [Mufti et al., 2005]
Tomas Barton


logocvut
Data mining Clustering
from Chinese encyklopedia Heavenly Emporium of BenevolentKnowledge. Animals are divided into [Borges, 1952]:
those that belong to the emperorembalmed onesthose that are trainedsuckling pigsmermaidsfabulous onesthose that are included in this classificationinnumerable onesetcetera
Tomas Barton

logocvut
Data mining Clustering
Clustering is ill-defined [Caruana et al., 2006]
All we care about is the “usefulness” of theclustering for achieving our final goal [Guyonet al., 2009]
Tomas Barton

logocvut
Time series
Time series
Tomas Barton

logocvut
Time series
Problem
sensitive to small changes
sum of distance does not capture shape of curve
computationally expensive
redundant information
Tomas Barton

logocvut
Time series
Autoregressive model
predict an output of a system based on the previous outputs
Xt = c +p∑
i=1ϕi · Xt−i + εt
ϕi – parameters of the AR modelXt – amplitude of the signalεt – white noises
Tomas Barton

logocvut
Time series
Moving average
Xt = µ+ εt +q∑
i=1φi · εt−i
φi – parameters of the AR modelµ – expectations of Xt (often assumed to equal 0)εt – white noises
Tomas Barton

logocvut
Time series
Autoregressive–moving-average model
putting all together:
Xt = c + εt +p∑
i=1ϕi · Xt−i + εt +
q∑i=1
φi · εt−i
ARMA(p, q) refers to the model with p autoregressive termsand q moving-average termsin Matlab function armax[Time-domain, data object]
Tomas Barton


logocvut
Time series Fitting
Exponential Polynomial
Tomas Barton

logocvut
Time series Fitting
Representation of inputsMeasured values
too many inputsdoes not represent patterns
Approximated model
only 5 parametersdescribing whole curverepresent patterns
Tomas Barton

logocvut
Time series Fitting
How many parameters do we need?
2 parameters 5 parameters
Tomas Barton
logocvut
Time series Fitting
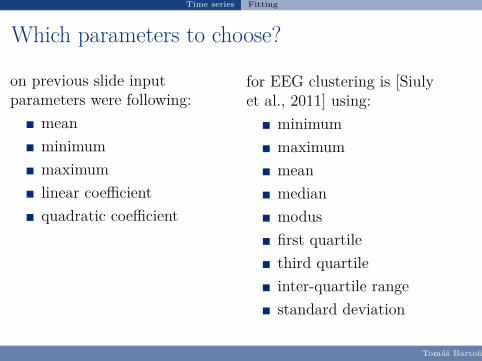
Which parameters to choose?
on previous slide inputparameters were following:
meanminimummaximumlinear coefficientquadratic coefficient
for EEG clustering is [Siulyet al., 2011] using:
minimummaximummeanmedianmodusfirst quartilethird quartileinter-quartile rangestandard deviation
Tomas Barton

logocvut
Time series Visualizations
Dendrogram
Tomas Barton


logocvut
Comparing clusterings
C-IndexThe C-index was reviewed in Hubert and Levin [1976]
pc−index = dw − min(dw)max(dw) − min(dw)
where dw is the sum of the within cluster distances.
Gamma
pgamma = s(+) + s(−)s(+) − s(−)
where s(+) represents the number of consistent comparisonsinvolving between and within cluster distances, and s(−)represents the number of inconsistent outcomes Milligan andCooper [1985]
Tomas Barton


logocvut
Comparing clusterings
The strive for objectivity, repeatability, testability etc. isperfectly right attitude as long as their proper place inthe “hierarchy of aims” is maintained, but becomes veryharmful if these tools dominate over the purpose ofscientific research. [Holynski, 2005, p. 487]
Tomas Barton


logocvut
Comparing clusterings
References I
P. Arabie, L. J. Hubert, and G. D. Soete. Clustering andclassification. World Scientific, 1996.
J.L. Borges. El idioma analıtico de john wilkins. Obrascompletas, 1952.
Rich Caruana, Mohamed Elhawary, Nam Nguyen, and CaseySmith. Meta clustering. In Proceedings of the SixthInternational Conference on Data Mining, ICDM ’06, pages107–118, Washington, DC, USA, 2006. IEEE Computer Society.ISBN 0-7695-2701-9. doi: 10.1109/ICDM.2006.103. URLhttp://dx.doi.org/10.1109/ICDM.2006.103.
B. S. Everitt. Cluster Analysis. Edward Arnold, 1993.
Tomas Barton

logocvut
Comparing clusterings
References II
I. Guyon, U. Von Luxburg, and R.C. Williamson. Clustering:Science or art. In NIPS 2009 Workshop on Clustering Theory,2009.
Roman B. Holynski. Philosophy of science from a taxonomist’sperspective. Genus, 16(4):469–502, 2005.
L.J. Hubert and J.R. Levin. A general statistical framework forassessing categorical clustering in free recall. PsychologicalBulletin, 83(6):1072, 1976.
Glenn W. Milligan and Martha C. Cooper. An examination ofprocedures for determining the number of clusters in a dataset.Psychometrika, 50(2):159–179, June 1985.
Tomas Barton

logocvut
Comparing clusterings
References III
G. Bel Mufti, P. Bertrand, and L. El Moubarki. Determining thenumber of groups from measures of cluster stability. InProceedings of International Symposium on Applied StochasticModels and Data Analysi, pages 404–412, 2005.
Siuly, Yan Li, and Peng (Paul) Wen. Clustering technique-basedleast square support vector machine for eeg signal classification.Computer Methods and Programs in Biomedicine, 104(3):358–372, 2011. URL http://dblp.uni-trier.de/db/journals/cmpb/cmpb104.html#SiulyLW11;http://dx.doi.org/10.1016/j.cmpb.2010.11.014;http://www.bibsonomy.org/bibtex/2976ac83c8e51dd3ff108ee52da22902d/dblp.
Tomas Barton