cluster science with sze and multi-wavelength observations
TRANSCRIPT

Cluster Science with SZE and
Multi-wavelength Observations
Keiichi Umetsu (梅津敬一), ASIAAIn collaboration with J. Sayers, S. Golwala, N. Czakon, T. Mroczkowski,
B. Mason, M. Sereno, S.M. Molnar, N. Okabe, T. Broadhurst, E.
Medezinski, A. Zitrin, M. Nonino, M. Donahue, M. Postman, et al.

DM distribution
Gas peculiar motions
Pressure tracing DM potential
Gas temperature
Shocks due to interaction
Gas density
Importance of Multi-wavelength, Multi-probe Cluster Studies
Simulations by V. Springel

Contents
1. Cluster Peculiar Velocities from kSZE and Moving-lens-effect Measurements
2. Mass, Shape, and Thermal Properties of Clusters from SZ+Xray+Lensing Data
3. Ensemble-averaged Pressure vs. Mass Profiles from Stacked SZE and Lensing Analyses

(1) Cluster Peculiar Velocities from kSZE and Moving-Lens Effect (Lensing-analog of the Rees-Sciama Effect) Measurements

MACS0717: Complex Merging Cluster at z=0.55 (a pink elephant?)
Multiple cores revealed by optical imaging/spectrcoospy, X-ray, and SL data
• Lensing-selected CLASH cluster (one of the HST-FF clusters)
• Largest known Einstein radius, RE=60” • @z=3 (Zitrin+09)• Multiple clumps with high relative
velocities (Ma+09; Mroczkowski+12)• Most massive cluster known at z>0.5
(Medezinski, KU+13): Mvir=3x10¹⁵ MsunCircle: Rvir=2Mpc/h (7.5 acmin)
SUBARU WL mass map (Medezinski, Umetsu+13)

HST Weak vs. Strong Lensing Analysis
Nonparametric HST-WL mass reconstruction with Umetsu+Broadhurst08 MEM method
Parametric HST-SL mass reconstruction with Light-Traces-Mass (LTM) Zitrin+09 method
Overall, the galaxies trace the lensing mass distribution.Deeper HST-FF imaging will improve WL constraints on the possible DM-galaxy offsets.
Medezinski, Umetsu+CLASH 2013, ApJ, 777, 43
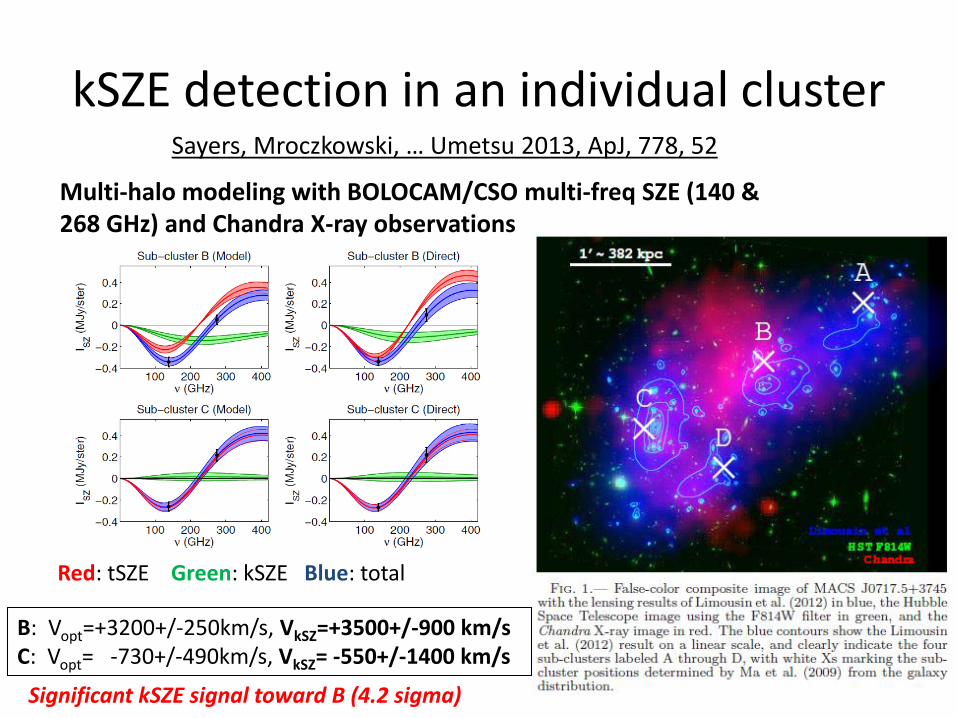
kSZE detection in an individual clusterSayers, Mroczkowski, … Umetsu 2013, ApJ, 778, 52
Multi-halo modeling with BOLOCAM/CSO multi-freq SZE (140 & 268 GHz) and Chandra X-ray observations
Red: tSZE Green: kSZE Blue: total
B: Vopt=+3200+/-250km/s, VkSZ=+3500+/-900 km/sC: Vopt= -730+/-490km/s, VkSZ= -550+/-1400 km/s
Significant kSZE signal toward B (4.2 sigma)

Moving Lens (Birkinshaw-Gull) Effect
dt2
αvv ˆ2
dt
BG
Change of potential along photon path due to lens motion
"30km/s2000
1022 6
pair
EE
vv
~ (sub) 1km/s velocity shift
Observable pairwise frequency shift between multiply-lensed images
Lensing-analog of the Rees-Schiama effect

Simulated DM flow centered on the Bullet
αv ˆ
BG
Molnar, Broadhurst, Umetsu+13, ApJ, 774, 70
AMR FLASH (DM+gas) simulation of the Bullet Cluster

(2) Mass, Shape, and Thermal Properties of Galaxy Clusters from Multi-probe Observations
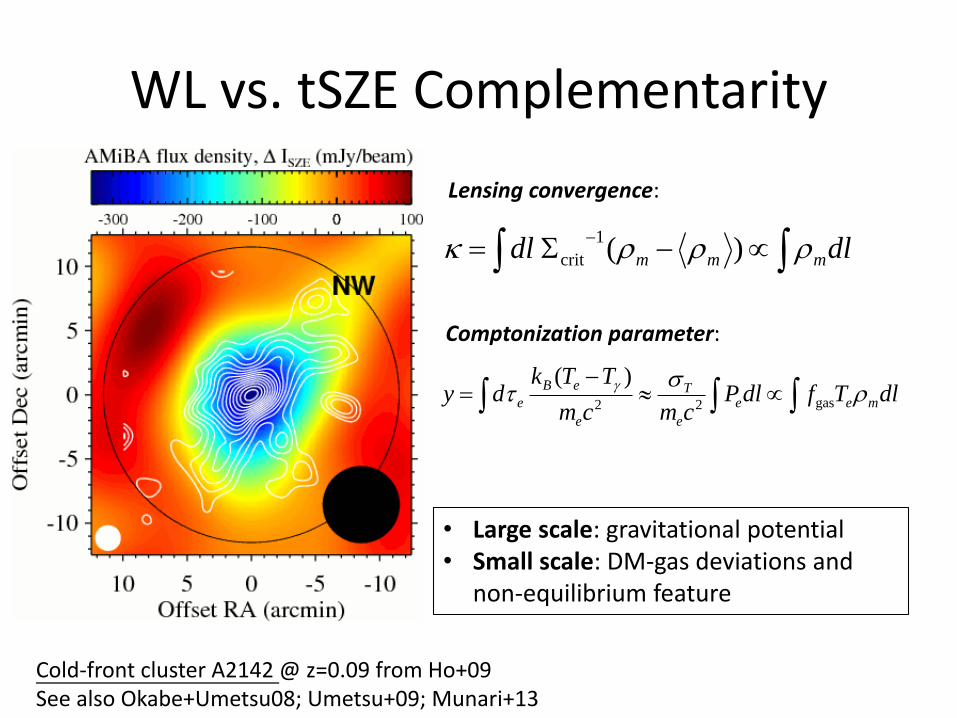
WL vs. tSZE Complementarity
• Large scale: gravitational potential• Small scale: DM-gas deviations and
non-equilibrium feature
Cold-front cluster A2142 @ z=0.09 from Ho+09See also Okabe+Umetsu08; Umetsu+09; Munari+13
dlTfdlPcmcm
TTkdy mee
e
T
e
eB
e
gas22
)(
dldl mmm )(1
crit
Lensing convergence:
Comptonization parameter:

DM vs. ICM structure in an X-ray-selected relaxed cluster
Relaxed CLASH cluster: MACS1206 at z=0.44 (Umetsu+12, ApJ, 755, 56)
SL+WL mass map from HST+SUBARU data tSZE map from Bolocam@150GHz data
HSE gas follows potential that is rounder than matter density (X-ray shape theorem by Buote & Canizares 94): eICM ~ 0.7 eDM (Lee & Suto 03)
2
2
)/(1
)/(1
cb
ca
b
a
e
e

DM vs. ICM structure in an X-ray-selected relaxed cluster (contd)
• For MACS1206, lensing, X-ray-HSE, and SZE-HSE spherical mass estimates (>r2500) agree (Umetsu+12).
• Biviano+CLASH (2013) showed that the pseudo phase-space density /v3 of
member galaxies follow power-law r-1.9 (Taylor & Navarro 01).• Indicating that MACS1206 is close to HSE AND effectively spherical:
line-of-sight sizescale ~ geometric-mean sizescale in projection space
Umetsu+12

Triaxiality and Projection Effects
:
losgeo
gasgeo
mattergeo
P
P
P
gg
mm
e
ll
l
l
e
ef
fldl
fldl
Geometric-mean sizescale in projection
O
losl
Projected density measurements scale with the ratio of LOS-to-projected sizescale
See Sereno & Umetsu (2011);Stark (1977); Oguri et al. (2003); Sereno (2007)
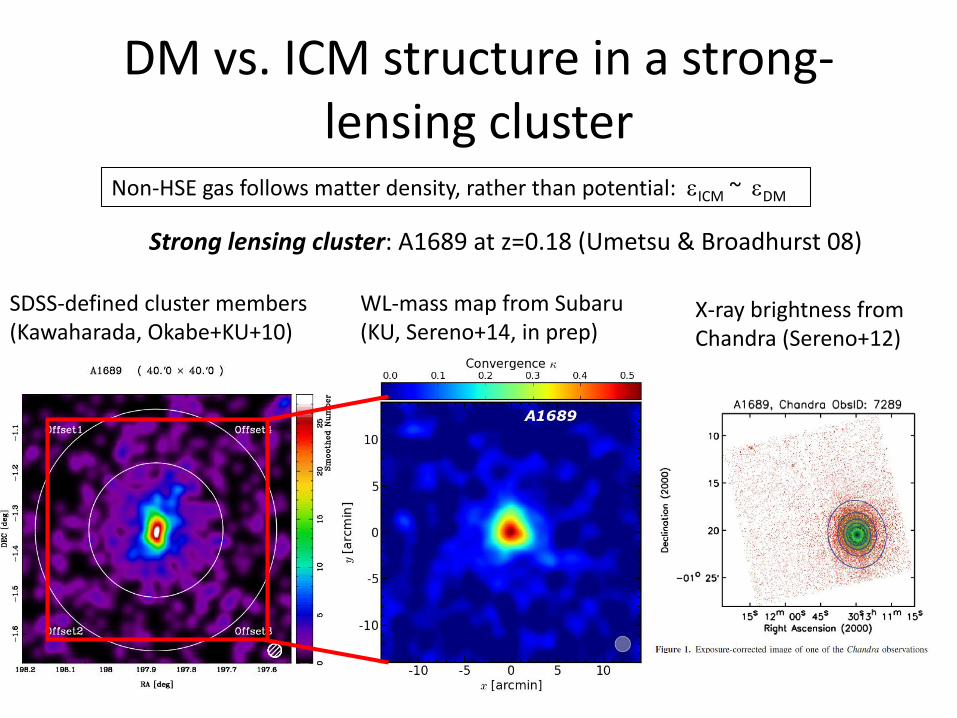
DM vs. ICM structure in a strong-lensing cluster
Strong lensing cluster: A1689 at z=0.18 (Umetsu & Broadhurst 08)
WL-mass map from Subaru (KU, Sereno+14, in prep)
X-ray brightness from Chandra (Sereno+12)
Non-HSE gas follows matter density, rather than potential: eICM ~ eDM
SDSS-defined cluster members (Kawaharada, Okabe+KU+10)

Discrepant HSE and Lensing Masses?SUZAKU HSE vs. lensing M3D(<r) of A1689 (Kawaharada, Okabe, Umetsu+10)
Marginalizing over intrinsic triaxial shape parameters increases the lensing errors in M3D(r), reflecting the lack of line-of-sight information (Oguri, Takada, Umetsu, Broadhurst 05).
M200c= 1.3 (+0.2, -0.2) 1015 Msun/h, c200c=9.0 (+1.5, -1.5) by Umetsu & Broadhurst 08 NFWM200c= 0.9 (+0.1, -0.1) 1015 Msun/h, c200c=6.6 (+0.4, -0.4) by Peng+09 NFWM200c= 1.1 (+0.3, -0.5) 1015 Msun/h, c200c=14 (+2, -11) by Oguri+05 triaxial-NFW
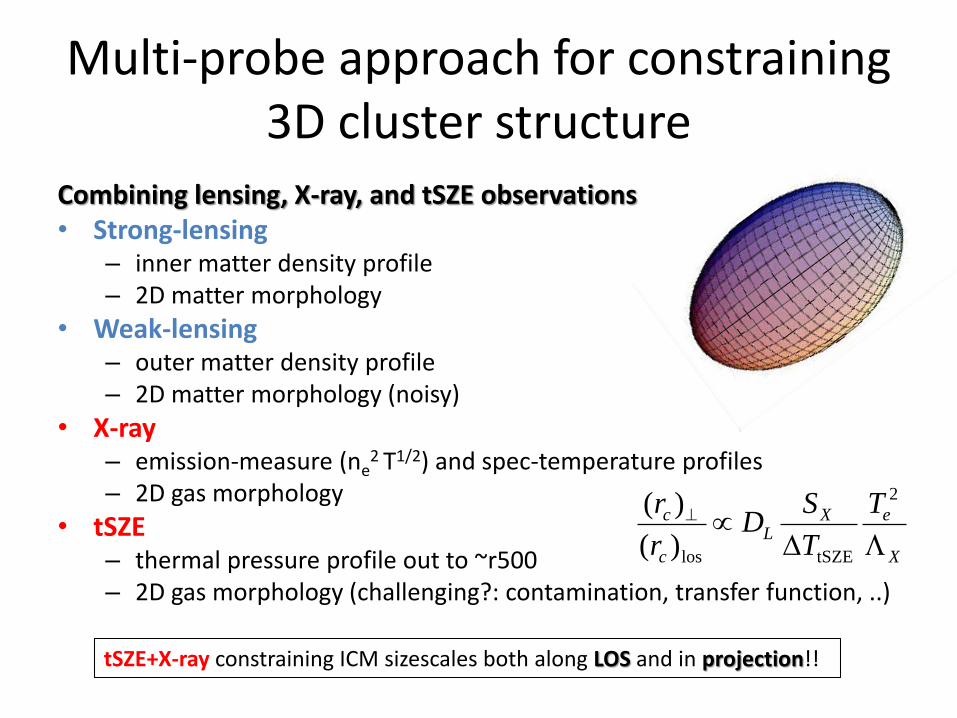
Multi-probe approach for constraining 3D cluster structure
Combining lensing, X-ray, and tSZE observations• Strong-lensing
– inner matter density profile– 2D matter morphology
• Weak-lensing– outer matter density profile– 2D matter morphology (noisy)
• X-ray– emission-measure (ne
2 T1/2) and spec-temperature profiles – 2D gas morphology
• tSZE– thermal pressure profile out to ~r500– 2D gas morphology (challenging?: contamination, transfer function, ..)
tSZE+X-ray constraining ICM sizescales both along LOS and in projection!!
X
eXL
c
c T
T
SD
r
r
2
tSZElos)(
)(

Methodology
• Morandi method (Morandi, Limousin, Rephaeli, Umetsu+11; Morandi+12)– Total matter
• triaxial generalization of NFW
– ICM• Ptot = Pth + Pnth follows gravitational potential, with Pnth(R)/ Ptot(R) = x (R/R200)n
• Small-eccentricity approximation for gravitational potential (Lee & Suto 03)
– Couple total-matter and ICM distributions by using generalized HSE
• Sereno method (Sereno & Umetsu 11; Sereno, Ettori, Umetsu+13)– Total matter
• Triaxial generalization of NFW
– ICM• Triaxial matter and ICM halos coaligned with the same degree of triaxiality ,
T=(e_b/e_a)^2 < 1
– Couple total-matter and ICM distributions by much less informative priors on geometric shape, without making equilibrium assumptions
)()()()()()( SZSLWL pppppp LLLLLLXX ST
Total matter ICM

Applications to A1689 (z=0.18)Revisiting multi-probe analysis of A1689 with new WL (Subaru BVRIz) and tSZE(SZA/BIMA/OVRO) observations: Umetsu, Sereno+14 in prep.
2D strong lensing (HST/ACS) 2D WL shear + magnif (Subaru)2D X-ray (Chandra/XMM)
• WL: 2D mass reconstruction from Subaru 2D-shear + magnification (KU)• SL: 2D mass reconstruction from HST/ACS/WFC3 data (Sereno)• X-ray: 2D morphology and brightness profile from Chandra@R<1200kpc (Ettori)• X-ray: temperature profile from XMM data@R<900kpc (Ettori)• tSZE: joint Y(R) modeling of BIMA+OVR+SZA data (Mroczkowski)
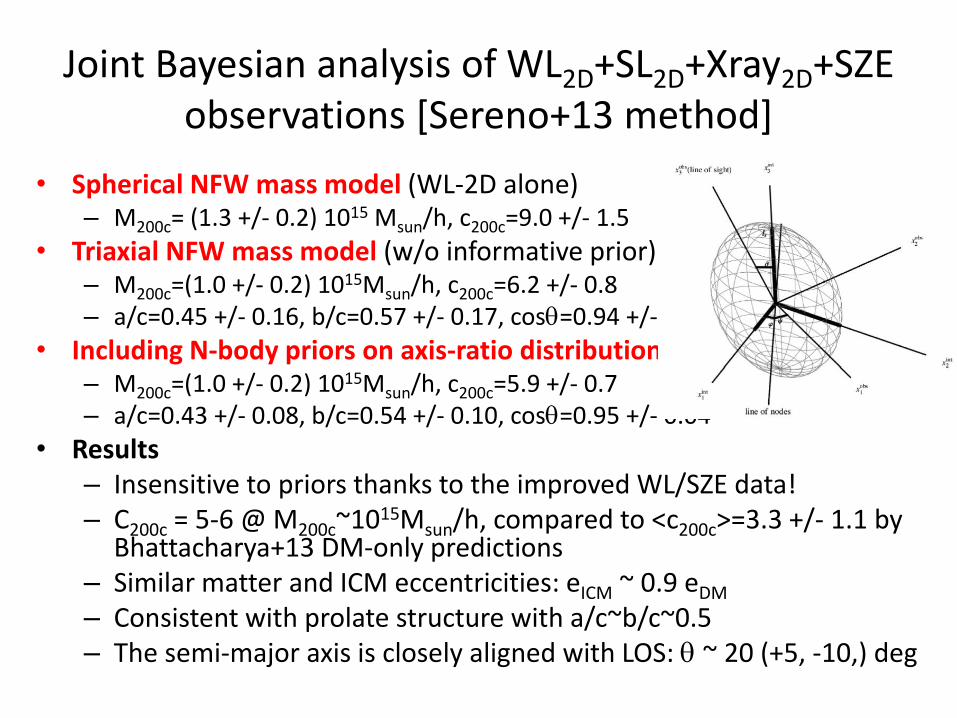
Joint Bayesian analysis of WL2D+SL2D+Xray2D+SZE observations [Sereno+13 method]
• Spherical NFW mass model (WL-2D alone)– M200c= (1.3 +/- 0.2) 1015 Msun/h, c200c=9.0 +/- 1.5
• Triaxial NFW mass model (w/o informative prior)– M200c=(1.0 +/- 0.2) 1015Msun/h, c200c=6.2 +/- 0.8– a/c=0.45 +/- 0.16, b/c=0.57 +/- 0.17, cos=0.94 +/- 0.04
• Including N-body priors on axis-ratio distribution:– M200c=(1.0 +/- 0.2) 1015Msun/h, c200c=5.9 +/- 0.7– a/c=0.43 +/- 0.08, b/c=0.54 +/- 0.10, cos=0.95 +/- 0.04
• Results– Insensitive to priors thanks to the improved WL/SZE data!– C200c = 5-6 @ M200c~1015Msun/h, compared to <c200c>=3.3 +/- 1.1 by
Bhattacharya+13 DM-only predictions– Similar matter and ICM eccentricities: eICM ~ 0.9 eDM
– Consistent with prolate structure with a/c~b/c~0.5– The semi-major axis is closely aligned with LOS: ~ 20 (+5, -10,) deg

Reconstructed fgas=Mgas/Mtot
1 and 3 bounds
Spherical radius, r [Kpc]
fgas ~ 10% at r=1Mpc from multi-probe triaxial analysis
Umetsu, Sereno+14 (WL+SL+Xray+SZE) Kawaharada, Okabe, KU+10
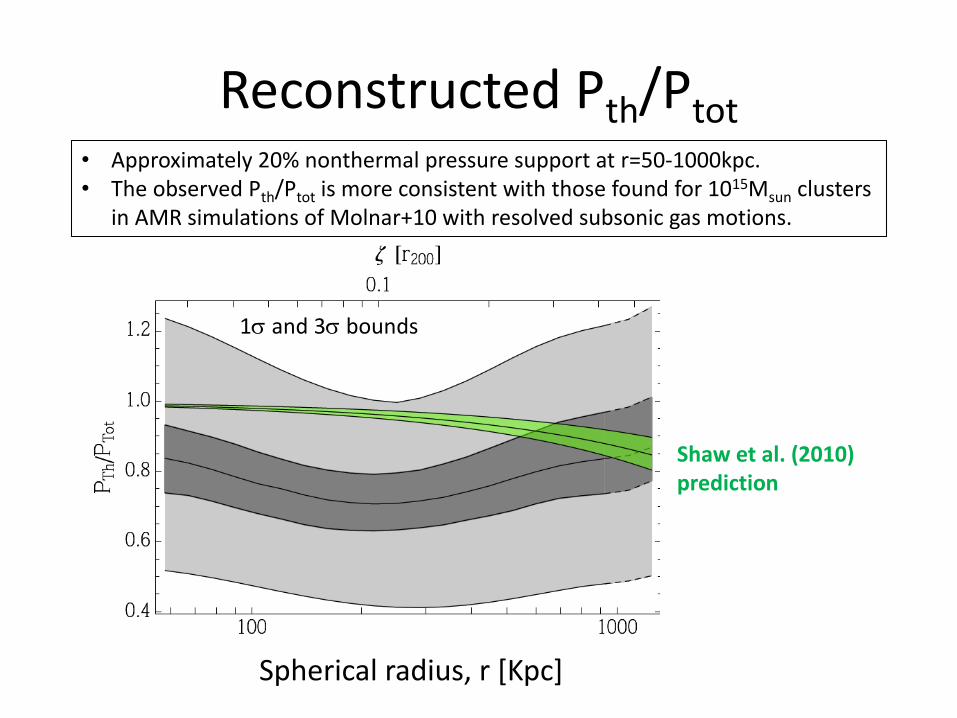
Reconstructed Pth/Ptot
Spherical radius, r [Kpc]
• Approximately 20% nonthermal pressure support at r=50-1000kpc.• The observed Pth/Ptot is more consistent with those found for 1015Msun clusters
in AMR simulations of Molnar+10 with resolved subsonic gas motions.
Shaw et al. (2010) prediction
1 and 3 bounds

Future prospects / ongoing projects
BOXSZ sample of 45 clusters (Sayers+13) Wide-field SZE imaging with sub-arcminresolution is ALSO sensitive to 2D gas-halo morphology: • Bolocam/CSO with 58” (30”) PSF @ 150
(248) GHz, 14-arcmin map FoV• MUSIC/CSO (2014~) will have about x2
wider effective FoV• Multiscale synthesis of interferometric
data with ALMA+ACA and CARMA will also be promising.
Consistent joint SZ+X modeling of 3D ICM structure is in progress by integrating Bolocam data into JACO by CLASH+ collaboration (Mahdavi, Sieagel, Sayers, Donahue+)
(3) Ensemble-averaged thermal pressure vs. total mass profiles from stacked SZE and lensing analyses

Ensemble-averaged Pressure Profile around Clusters
• Testing self-similarity (scalability) and predicted radial profile shape P(r) of the averaged pressure profile (Suto, Sasaki, & Makino 98; Komatsu & Seljak 01; Nagai+07; Arnaud+10; Cavaliere, Lapi & Fusco-Femiano 11)– Empirical tests of ICM morphology dependence
– Empirical tests of non-gravitational processes in cluster cores and outskirts (>r500)
– Comparison with the lensing-derived averaged mass profile for examining the degree of HSE
• Warm gas in cluster filaments and LSS, or 2-halo term (Fang, Kadota, & Takada 12)

Stacked Pressure Profile of BOXSZ Sample (Sayers+13)
BOXSZ (Bolocam SZ/X-ray) sample tSZE analysis:• 45 high-mass clusters @ 0.15<z<0.89 with <M500c>=9x10¹⁴Msun including 25
CLASH clusters.• X-ray Chandra data for determining r500 and P500
• X-ray Chandra data for morphology classification• 17 cool-core and 16 disturbed clusters (2 CC-disturbed)• Arnaud+10: 33 clusters at z<0.2, XMM (inner), simulations (outer)• Planck12: 62 clusters at <z> = 0.15, XMM (inner), Planck SZE (outer)
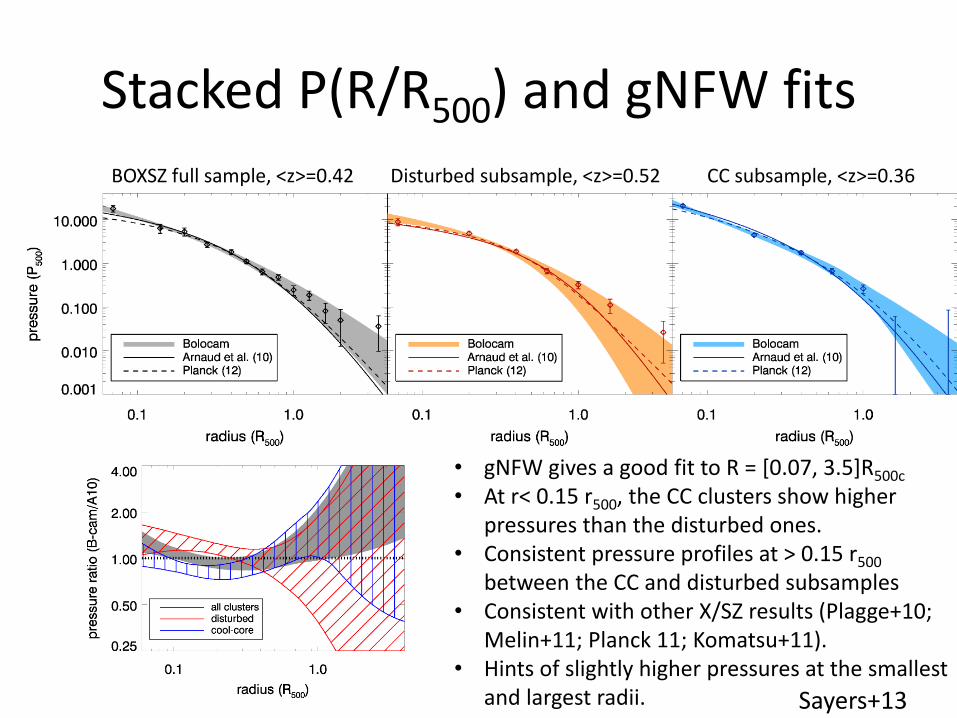
Stacked P(R/R500) and gNFW fits
BOXSZ full sample, <z>=0.42 Disturbed subsample, <z>=0.52 CC subsample, <z>=0.36
• gNFW gives a good fit to R = [0.07, 3.5]R500c
• At r< 0.15 r500, the CC clusters show higher pressures than the disturbed ones.
• Consistent pressure profiles at > 0.15 r500
between the CC and disturbed subsamples• Consistent with other X/SZ results (Plagge+10;
Melin+11; Planck 11; Komatsu+11).• Hints of slightly higher pressures at the smallest
and largest radii. Sayers+13

Mean Pressure Profile and Intrinsic Scatter from Gaussian-Process Modeling
• Model individual cluster profiles as Gaussian process simultaneously constrain mean
profile, mass scaling, and intrinsic scatter
• Find mass scaling shallower than self-similar one 0.49 compared to 2/3
• Intrinsic scatter minimized to ~20% at intermediate radii, ~0.5 R500c
Sayers+13

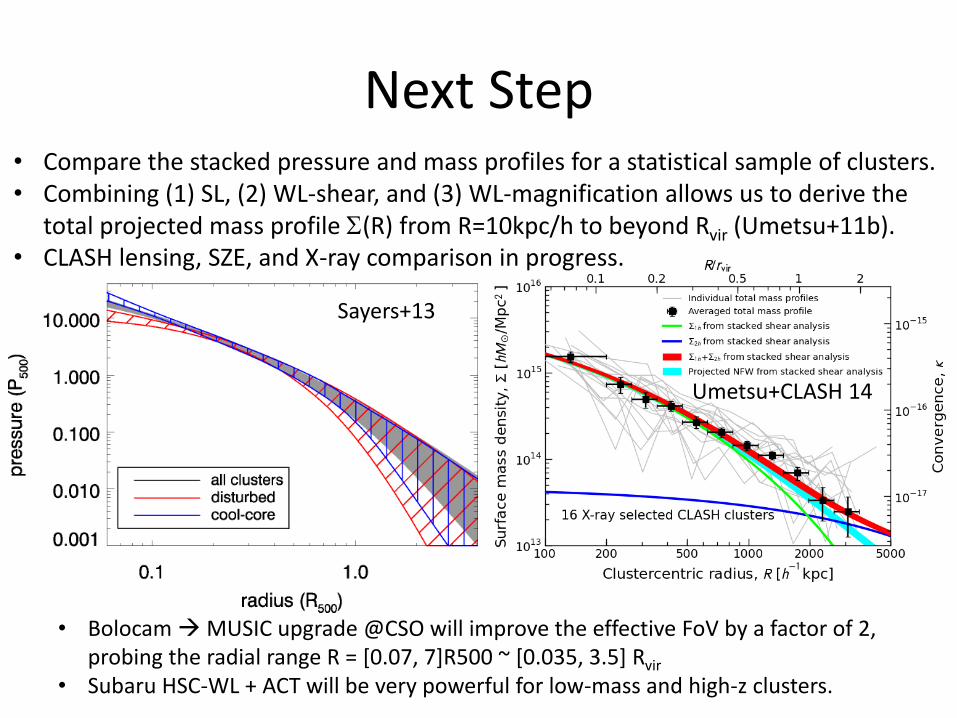
Next Step• Compare the stacked pressure and mass profiles for a statistical sample of clusters.• Combining (1) SL, (2) WL-shear, and (3) WL-magnification allows us to derive the
total projected mass profile (R) from R=10kpc/h to beyond Rvir (Umetsu+11b).• CLASH lensing, SZE, and X-ray comparison in progress.
• BolocamMUSIC upgrade @CSO will improve the effective FoV by a factor of 2, probing the radial range R = [0.07, 7]R500 ~ [0.035, 3.5] Rvir
• Subaru HSC-WL + ACT will be very powerful for low-mass and high-z clusters.
Sayers+13
Next Step• Compare the stacked pressure and mass profiles for a statistical sample of clusters.• Combining (1) SL, (2) WL-shear, and (3) WL-magnification allows us to derive the
total projected mass profile (R) from R=10kpc/h to beyond Rvir (Umetsu+11b).• CLASH lensing, SZE, and X-ray comparison in progress.
• BolocamMUSIC upgrade @CSO will improve the effective FoV by a factor of 2, probing the radial range R = [0.07, 7]R500 ~ [0.035, 3.5] Rvir
• Subaru HSC-WL + ACT will be very powerful for low-mass and high-z clusters.
Umetsu+CLASH 14
Sayers+13

Summary• Multi-frequency high-resolution SZE + X-ray observations of moving
substructures for LoS gas peculiar velocity measurements.• ALMA and NIR (e.g., XSHOOTER on VLT) spectroscopy of multiply-
lensed images in Bullet-like colliding clusters for tangential DM-peculiar-velocity measurements:– Large-separation multiply-lensed QSOs with many absorption feature (if
any) are very useful because the errors get reduced by 1/sqrt[N]– For lensed galaxy images, once the source redshift is known, ALMA with
high resolution is very powerful for measuring (narrow) molecular emission
• Spatially-resolved tSZE imaging with subarcmin-resolution and >10-arcmin-FoV can be used for multi-probe 3D cluster modeling of high-mass clusters (M500c>5x10¹⁴Msun): Bolocam/MUSIC@CSO, ALMA+ACA, etc.
• Improved transfer function with CSO-to-MUSIC upgrade at CSO probing the stacked pressure profile out to 7R500c ~ 3.5Rvir (?)– Still useful before CCAT replacement?


SZE instruments for pointed (targeted) observations
• Bolocam at CSO 10m– 140 GHz -> 8' FOV, 58” PSF, ~22μKCMB-arcmin sensitivity– 268 GHz -> 31” PSF – MACS0717 at z=0.55: 3.3 mJy/beam@140 GHz, 1.8 mJy/beam@268 GHz
(Sayers et al. 2013)
• MUSTANG at GBT 100m– 90 GHz -> 42” FOV, 10”-18” PSF– MACS0717 at z=0.55: 34 uJy/beam (Mroczkowski et al. 2012)
• CARMA/SZA interferometer array at Cedar Flat– An array of six 10m, nine 6m, eight 3.5m antennas at 30GHz and 90GHz– 12’ FOV, 0.3’ PSF (depending on config)– Follow up observations for SPT, XXM-XXL
• NIKA (KIDs based instrument) at IRAM 30m – 140 GHz, 132 pixels -> 1.8’ FOV, 18.5” PSF (see Adam+13, arXiv:1310.6237)– 240 GHz, 224 pixels -> 1.0’ FOV, 12.5” PSF – NIKA2 with 1000 and 4000 detectors at 140 and 240GHz (2015-)
• MUSIC at CSO 10m– 14’ FOV, 2304 detectors/ 576 spatial pixels– 0.86,1.0,1.3, & 2.0mm
Blue = under commissioning

WL vs. SZE morphology in A383
Subaru WL mass map (Umetsu+CLASH 14, in prep)
Bolocam SZE map@150GHz (Zitrin et al. 2012)

Averaged Lensing Profiles of LCDM Halos
Shear Doesn’t See Mass Sheet
crit/ crit/T
• Tangential shear is a powerful probe of 1-halo term, or internal halo structure.
• Shear alone cannot recover absolute mass, known as mass-sheet degeneracy. Figures from Oguri & Hamana 11
)()()( RRR

X-ray maps: 20 CLASH clusters are purely X-ray selected to be massive and relaxed
Umetsu+CLASH 14, in prep (Subaru, 24’x24’) Postman+CLASH 12, ApJS
WL mass maps: 16 clusters completed
CLASH X-ray-selected subsample

CLASH-WL: Stacked shear profile Ensemble-averaged internal halo structure of X-ray-selected relaxed CLASH clusters with <M200c>=1015Msun/h at <z>=0.35
Umetsu+CLASH 14, in prep
Consistent with a family of density profiles for collisionless-DM halos in gravitational equilibrium (NFW, BMO, Einasto)

CLASH-WL: Stacked total mass profile from combined shear + magnification
2D halo model decomposition: smoothly-truncated NFW (BMO) + LCDM 2h-term
• Measuring 1h+2h term out to R=2rvir around 16 X-ray clusters with <Mvir>=10e14Msun/h at <z>=0.35 linear halo bias bh= 9 (Tinker+10)
• Testing shear vs. magnification consistency in the context of LCDM
Umetsu+CLASH14 in prep

Strong-lensing, weak-lensing shear+magnifcation constraints on A1689
WL shear-magnification consistency (Umetsu+11a Bayesian method)
Strong-lensing vs. weak-lensing projected mass profiles
Projected total mass profile well described by the steepening NFW form