cluster study ceramics sanitary ware gujranwala · cluster study ceramics sanitary ware gujranwala...
TRANSCRIPT

Cluster Study
Ceramics sanitary Ware Gujranwala
Research and Development Cell
Gujranwala Chamber of Commerce and Industry
Aiwan-e-Tijarat Road, Gujranwala. Phones:055-3256701-4 (4 lines), Fax:055-3254440
E-mail: [email protected], [email protected] http://www.gcci.org.pk

Ceramic Cluster Study
R&D Cell (File no. cs-0-rd-08) Gujranwala Chamber of Commerce and Industry - -
2
Table of Contents 1. Executive Summary 04
2. History and Back Ground 06
a. Ceramic Sanitary Ware 06
b. Geographical Location 07
c. Raw Material Suppliers 07
d. Raw Material Availability 08
e. Manufacturing 08
f. Quality Assurance 09
g. Machinery Suppliers 10
h. Technology Status 10
i. Marketing and Sales 10
j. Financing 11
k. Human Resource 11
3. Purpose of Study 12
4. Research Methodology 12
5. Questionnaire 12
6. Sampling Methodology and Sample Size 13
7. Respondents 13
8. Research Results 14
a. Current Export Trend 14
b. Installed Machinery 17
c. Capacity utilization 18
d. Establishment of Units 20

Ceramic Cluster Study
R&D Cell (File no. cs-0-rd-08) Gujranwala Chamber of Commerce and Industry - -
3
e. Legal Status of Organization 22
f. Ratio of Male and Female Workers 25
g. Products Manufactured and Sold 25
h. Distribution Channel 27
i. Supplier Of Raw Materials 29
9. Analysis 30
a. SWOT Analysis 30
b. Internal External (IE) Matrix 32
c. Strategic Position and Action Evaluation (SPACE) Matrix 33
d. TOWS Matrix 35
e. Quantitative strategic Profiling Matrix (QSPM) 39
10. Suggestions and Recommendations 40
11. Limitations and Assumptions 42
12. Appendix-A 43
13. Appendix-B 48
14. References 49
Ceramic Cluster Study
R&D Cell (File no. cs-0-rd-08) Gujranwala Chamber of Commerce and Industry - -
4
Executive Summary
The purpose of this study is to analyze the ceramic cluster from a perspective that gives
information about the current industry problems and gives an insight toward the strategic
direction of the industry as well. Our analysis shows that the industry is approaching
towards maturity and unless we don’t define a strategic direction, the industry life cycle
may lead to decline. This study takes into account the proper SWOT analysis done on the
basis of our research study conducted in person by visiting different factories and
interviews with the industry people. Although government has taken numerous steps to
support this industry and build capacity yet the question which this research study
answers is what should be the strategic direction for the industry players. Only building
capacity and upgrading technology is not the answer but theses efforts should be
canalized in a certain way.
By building capacity we can make more and sell more but do we still have to pursue with
the existing products or within existing markets. Secondly, capacity building requires
financial resources but the industry is totally relying on self generated finances and equity
and since the industry is very low in financial strength as compared to other industries,
the diffusion and adaptation of modern technology becomes a question.
This study has taken this perspective into consideration and suggested two strategies,
market development and product development for the industrial owners who don’t have
enough equity to finance the technological upgrading or they are reluctant to invest
further into assets by realizing the fact that the industry is getting stagnant unless new
markets are explored.
It is also very necessary that awareness programs should be launched for the industry
owners so that they can get finances from banks and use them for implementing changes
in the manufacturing process and other operations.
Industry owners should also initiate consumer awareness program to reduce their
dependencies from the retailers and dealers and create a pull for their products so that the

Ceramic Cluster Study
R&D Cell (File no. cs-0-rd-08) Gujranwala Chamber of Commerce and Industry - -
5
distribution channel partners don’t influence the purchase decision of the final
consumers.
Cluster, no doubt, brings several economies for the players but it may prove to be very
sensitive and turn into red-ocean if the players of this cluster start competing with each
other rather than the player of another region or cluster. This study is an effort to
understand the current stage of the industry lifecycle, sources of contention and areas that
can help the players to stand out of the crowd.

Ceramic Cluster Study
R&D Cell (File no. cs-0-rd-08) Gujranwala Chamber of Commerce and Industry - -
6
History & background of cluster:
Gujranwala is quite known for its quality ceramics products. This industry not only caters
the local market demand, but also contributes in exports to international markets. For
years the manufacturers of this area have built their un-matched skills in design,
aesthetics and quality. Their products speak for themselves and set higher standards of
quality and excellence. The know-how about this industry is a result of technology and
skill transfer from ICL, which was a result of collaboration with Belgium, but now the
ceramic industry of Gujranwala is far ahead in quality and price as compared to ICL.
Over the years this industry has expanded and resulted in a long chain of ceramics
factories in this area and still they are growing.
Ceramics Sanitary Ware:
Gujranwala ceramic industry can be divided into following five categories. Presently
there are about 79 units in this sector, 60 are ceramic sanitary units, 11 are engaged in
pottery (table ware) and there are about 8 refractories.
1. Electric Insulators
2. Sanitary Ware
3. Tiles
4. Tableware
5. Refractory (Fire bricks, Alumina bricks & Insulation bricks)
Amongst these categories, sanitary ware is a major sector. All these segments have
approximately same raw material needs and in fact their suppliers are same too. Ceramics
sanitary ware has great potential in local as well as in export market, therefore a large
number of pottery units have shifted towards this industry. Currently the Ceramic
sanitary ware industry of Gujranwala is manufacturing the following products in various
designs, sizes and specifications:
• Washbasin
• Wash stand (Pedestal)
Ceramic Cluster Study
R&D Cell (File no. cs-0-rd-08) Gujranwala Chamber of Commerce and Industry - -
7
• Toilet combination
• Wall toilet
• Commode Set
• Bidet
• Urinal
• One-piece toilet
• Water Tank
• Vanity (Table tok)
Geographical Location
Ceramics products are manufactured in many areas of Gujranwala. However the major
cluster of sanitary ware products is on G.T. road towards Lahore, from Kamonke to
Kangniwala. The biggest cluster of ceramics is G.T Road. Other major concentrations of
ceramics sanitary ware are on Sheikhu-Pura road.
Raw Material Suppliers:
Raw material is the most important factor in the growth of this industry and without
proper raw materials supply these units cannot keep up with the production. There are
about 4 to 5 companies supplying raw material to ceramics industry in Gujranwala. These
suppliers procure clay from mine owners1 and import barium carbonate and china clay
from china and zirconium from England, USA, Italy, and Malaysia for fulfilling the raw
material requirement of Ceramics Sanitary ware industry. However raw material supply
is irregular and manufacturers have to face late delivery of raw material or shortage of
raw material.

Ceramic Cluster Study
R&D Cell (File no. cs-0-rd-08) Gujranwala Chamber of Commerce and Industry - -
8
Raw Materials Availability
Raw material used in sanitary ware manufacturing is quite cheap. Raw materials are used
in huge volumes and this makes their supply-chain an important factor. Majority of the
raw materials are imported and are supplied by the few raw material suppliers based in
the local market.
• Zirconium is one of the costly raw materials used in glazing of ceramics sanitary
ware products and is imported from England, U.S.A., Italy and Malaysia.
Zirconium from England and U.S.A is considered of High Quality and also more
costly than zirconium from Italy and Malaysia.
• K.D 7 clay, K.D. 10 clay and Mianwali clay (Poocha) are available in Mianwali.
Only Mianwali residents can lease these mines. These clays are pure mineral and
their quality varies that cause a bad impact on product quality.
• Mines of Sindhi clay are in Sindh area.
• Berfab clay is available from Swat.
Distributors/dealers are importing China clay, Ball clay, Zinc Oxide and Barium
Carbonate from China, U.S.A and England.
Some stone are available in country that includes
Feldsfar found abundantly from Mansehra and its quality is acceptable.
Quartz is found from Peshawar and Swat.
Manufacturing:
The manufacturing flow chart is given below. An important thing to note is the lack of
modern manufacturing techniques in the ceramic sanitary ware. Government has taken
certain initiatives to upgrade the technology and develop skilled ma power in this sector
in this sector but a lot depends upon the prospective entrepreneur as well. Our research
study indicates that most of the owners are complacent and don’t want to change. The
reason can be attributed to the fact that what ever they are manufacturing is sold out

Ceramic Cluster Study
R&D Cell (File no. cs-0-rd-08) Gujranwala Chamber of Commerce and Industry - -
9
either on cash or credit and therefore they don’t bother about improving quality or
upgrading technology because of the risk factors, which includes uncertainty about
financial costs and paybacks and their compatibility with locally available raw material.
Demand exceeds supply but the actual quantity of demand is still vague.
QUALITY ASSURANCE:
Quality assurance is a problem faced by the industry and the most common reason
attributed is absences of clay processing plants that remove impurities from the raw
material. The manufacturers don’t have enough resources to establish individual
processing plants because the cost will increase significantly. The second aspect of
quality assurance is an internal factor and depends upon the way manufacturing process

Ceramic Cluster Study
R&D Cell (File no. cs-0-rd-08) Gujranwala Chamber of Commerce and Industry - -
10
is handled and quality is maintained. If manufacturers cover only the internal factor
effecting quality then they can not only improve quality but also reduce wastage of
products.
Machinery Suppliers:
Spray booth, Glaze Containers, drums and kilns are the machinery used for ceramics
sanitary ware factory. Kilns are designed by ceramics engineers and manufactured by the
kiln makers. There are about 12 kiln makers, which are experts and fulfilling the need of
industry. Glaze containers, spray both and drums are prepared by the engineering sector
of the Gujranwala. Other machinery used is following.
• Ball mill (for blending of clay) • Ceramic kiln
• Multiple glazer
This sector is using locally manufactured machinery (LMM) that is beneficial in terms of
its ability to save foreign exchange.
Technology Status:
The technology employed by this cluster is traditional and old. In sanitary ware products
SUI Gas cost makes up of 40% of the total manufacturing cost, due to the inappropriate
design of Kiln and kiln furniture. As per one of the survey conducted on energy audit of
kiln, industry average is 4 BTU of heat per kg as compared to international standard of
1.6 BTU per kg. Following are the common flaws in locally manufactured kiln:
i- Excessive heat leakage from the walls and ceilings
iii- Incomplete combustion due to flaws in burner design.
iv- Presence of excess/low level of air than required from optimum combustion of the
kiln.
By modifying kiln in order to achieve more gas efficiency the cost and consumption of
Gas can be reduced.

Ceramic Cluster Study
R&D Cell (File no. cs-0-rd-08) Gujranwala Chamber of Commerce and Industry - -
11
Marketing & Sales
Manufacturers have developed contacts with the distributors in all over the country and
place their product on the market through these outlets. There is neither any proper
marketing department in most of the factories nor any product development department
and the product designs are copied. Major distributors of Ceramics sanitary ware
products are in three cities Karachi, Lahore and Rawalpindi. In Balochistan area, dealers
are only operating in Quetta. The distribution channel moves goods from producer to
consumer.
Financing:
Almost all the registered commercial and industrial development banks of Pakistan have
their branches in the cluster and are providing finances at competitive rates. But most of
stakeholders depend upon their own financial equity based resources. These
entrepreneurs are reluctant to go to the financial institutions due to unawareness,
ineffective information flow and paper work.
Human Resources:
Human resource side of the industry is facing acute shortage. Skills are traditionally
inherited and there are no center for the skill development and training. Most of the labor
is semi skilled and are trained on job. There is no specialized marketing or accounts
department. They facilitate their sales only on the basis of personal contacts and no
proper accounts are maintained therefore certain problems related to tax return,
monitoring and evaluation are faced. The owner usually deals with management issues
and marketing related activities. Only primary or intermediate level employees are
Manufacturer
Distributors
Retailers
Dealers
Consumers

Ceramic Cluster Study
R&D Cell (File no. cs-0-rd-08) Gujranwala Chamber of Commerce and Industry - -
12
handling accounts. Glazing supervisor, Body supervisor, Kiln supervisor, Designing or
molding in-charge are considered skilled man power that are ceramics diploma holders or
experienced persons and currently the industry is facing shortage of this human capital.
Purpose of the study:
The purpose of this study is to analyze the ceramic cluster from a marketing perspective. Previous
studies on this sector were based either on the technological shortfall in the cluster or boosting
exports through attracting investment in this sector by highlighting demand and inflating profits
of this sector with out taking marketing ground realities into consideration. Cluster may prove to
be beneficial for the region, country or for the players but it may prove to be very fatal and turn
into red-ocean if the players of this cluster start competing with each other rather then the player
of another region or cluster. The previous studies were not only ignoring this fact but also
unknowingly drawing the players deeper into the red-ocean. This study is an effort to understand
the current stage of the industry lifecycle, sources of contention and areas that can help the
players to stand out of the crowd. This study also suggests some generic strategies.
Research Methodology:
Our research methodology is based on primary research except for the data about manufacturing
cycle that was already available and beyond the scope of research. A questionnaire was designed
comprising of 16 question fields to be filled in by the respondent. These questionnaires were sent
through mail on the addresses available but the response rate was very low despite two reminders
through phone calls. In view of the low response rate i.e. 8% it was decided to fill the
questionnaire in person by going at the premises of the respondents but due to shortage of
resources and time constraints the research model was changed from “Every Unit Survey” to
sample based research. In this regard one visit was conducted and 26 factories were visited out of
the sample size of 43. The remaining data was collected from the ceramic association.
Questionnaire:
The questionnaire comprises of 16 questions and constitutes five pages. The surveyor himself
filled in the data by asking questions and filing the responses. A copy of questionnaire is attached
in appendix A.
Ceramic Cluster Study
R&D Cell (File no. cs-0-rd-08) Gujranwala Chamber of Commerce and Industry - -
13
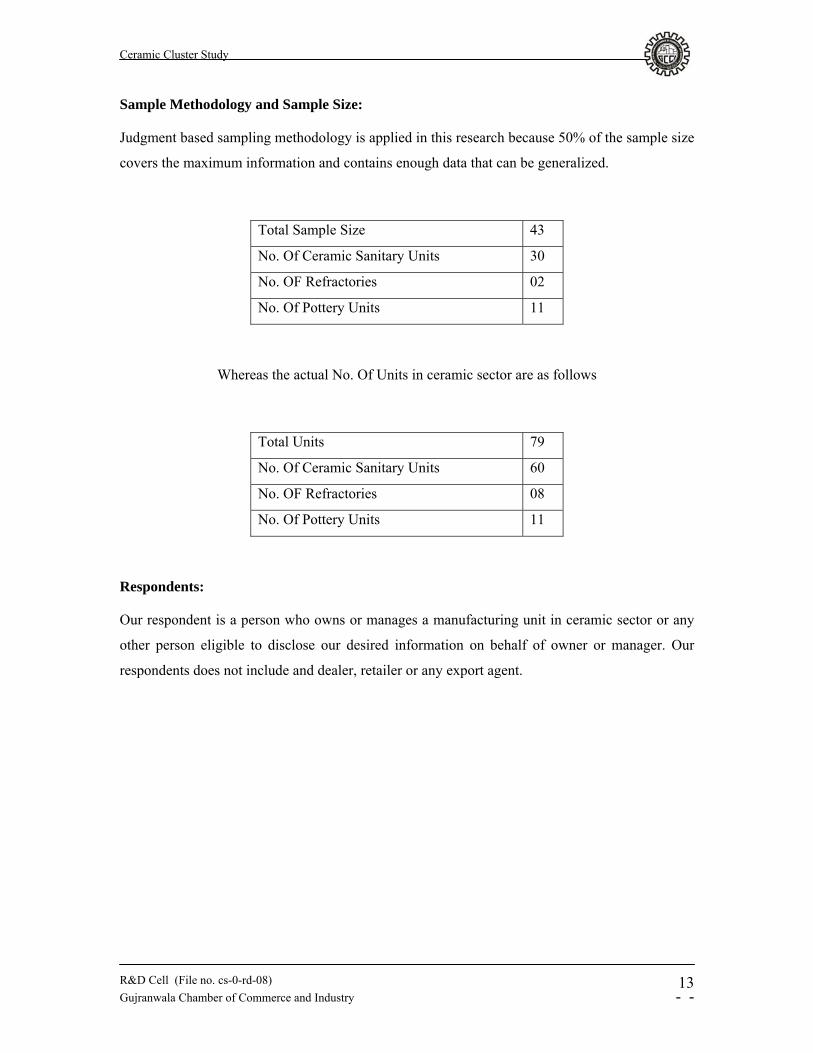
Sample Methodology and Sample Size:
Judgment based sampling methodology is applied in this research because 50% of the sample size
covers the maximum information and contains enough data that can be generalized.
Total Sample Size 43
No. Of Ceramic Sanitary Units 30
No. OF Refractories 02
No. Of Pottery Units 11
Whereas the actual No. Of Units in ceramic sector are as follows
Total Units 79
No. Of Ceramic Sanitary Units 60
No. OF Refractories 08
No. Of Pottery Units 11
Respondents:
Our respondent is a person who owns or manages a manufacturing unit in ceramic sector or any
other person eligible to disclose our desired information on behalf of owner or manager. Our
respondents does not include and dealer, retailer or any export agent.

Ceramic Cluster Study
R&D Cell (File no. cs-0-rd-08) Gujranwala Chamber of Commerce and Industry - -
14
Research Results
Current Export Trend:
The results indicate the tendency of the exporters toward Middle East and U.A.E that can
be attributed mainly to the presence of local export consultant in these regions or dealers
that prefer import from Pakistan and other developing countries because of their cost
competitive products. The table below shows that only 35 percent of the respondents are
engaged in exports.
Region where products are exported
Percent
Valid
Percent
Cumulative
Percent
U.A.E 18.6 53.3 53.3
Other then U.A.E 2.3 6.7 60.0
U.A.E & Arab countries 11.6 33.3 93.3
Afghanistan 2.3 6.7 100.0
Total 34.9 100.0

Ceramic Cluster Study
R&D Cell (File no. cs-0-rd-08) Gujranwala Chamber of Commerce and Industry - -
15
As per our analysis 90% of the exports from Ceramic sanitary sector are made to U.A.E
and Arab Countries while the remaining 10% exports are made to countries other then
these regions. Comparatively the Pottery sector make 80% of the exports to U.A.E while
the remaining 20% are concentrated to Afghanistan. The reason for not exporting other
regions can be attributed to multiple factors, namely huge demand in domestic market,
lack of skilled labor to setup new units and complacent attitude of industrialists toward
capacity building.
pottery ceramic sanitary
Industrial Sector
0
20
40
60
80
100
Percent
Region where products are
exportedU.A.EOther then U.A.EU.A.E & Arab countriesAfghanistan

Ceramic Cluster Study
R&D Cell (File no. cs-0-rd-08) Gujranwala Chamber of Commerce and Industry - -
16
Region where products are exported * Industrial Sector Cross tabulation
Industrial Sector Total
Pottery
Ceramic
sanitary
U.A.E
Count 4 4 8
% Within Region where products are
exported 50.0% 50.0% 100.0%
% Within Industrial Sector 80.0% 40.0% 53.3%
% Of Total 26.7% 26.7% 53.3%
Other then U.A.E
Count 0 1 1
% Within Region where products are
exported .0% 100.0% 100.0%
% Within Industrial Sector .0% 10.0% 6.7%
% Of Total .0% 6.7% 6.7%
U.A.E & Arab
countries
Count 0 5 5
% Within Region where products are
exported .0% 100.0% 100.0%
% Within Industrial Sector .0% 50.0% 33.3%
% Of Total .0% 33.3% 33.3%
Afghanistan
Count 1 0 1
% Within Region where products are
exported 100.0% .0% 100.0%
% Within Industrial Sector 20.0% .0% 6.7%
% Of Total 6.7% .0% 6.7%
Total Count 5 10 15
% Within Region where products are
exported 33.3% 66.7% 100.0%
% Within Industrial Sector 100.0% 100.0% 100.0%
% Of Total 33.3% 66.7% 100.0%

Ceramic Cluster Study
R&D Cell (File no. cs-0-rd-08) Gujranwala Chamber of Commerce and Industry - -
17
Installed Machinery:
Almost 90% of the firms are using local machinery with extremely low efficiency while
only a small percentage, 2% uses imported machinery but it is also not exclusive while
9% uses both local and imported machinery. The reason can be attributed to the low cost
of local and traditional machinery and lack of technological diffusion or technology
transfer.
Type of Installed Machinery
Percent
Valid
Percent
Cumulative
Percent
Local 88.4 88.4 88.4
Imported 2.3 2.3 90.7
Both 9.3 9.3 100.0
Total 100.0 100.0

Ceramic Cluster Study
R&D Cell (File no. cs-0-rd-08) Gujranwala Chamber of Commerce and Industry - -
18
100% 50% below 80% 80% 90%
Capacity Utilization in Percentage
0
20
40
60
80
Percent
Industrial Sectorpotteryrefractoriesceramic sanitary
Capacity Utilization:
Overall 61% of the ceramic industry is utilizing 100% of installed capacity and the
percentage of units utilizing 80%-100% of the capacity is 37%. These figures collectively
show the efficiency level of the ceramic sector that includes pottery and refractories as
well in our research. The ceramic sector stands at a high utilization level where 96% of
the units are utilizing capacity ranging 80% to 100%.
The average number of units produced by a unit is 500 pieces per day and if we multiply
the average figure with the total No. Of factories then the combined capacity of
Gujranwala’s ceramic sanitary industry is producing 30000 thousand pieces daily and the
annual figure turns out to be 10800000 pieces.
Pottery industry is also running at a higher efficiency level and 78% units are running at
100% capacity utilization level and the remaining 30% of pottery unit account for the
efficiency level of 80%-100%. See total capacity in appendix-B.

Ceramic Cluster Study
R&D Cell (File no. cs-0-rd-08) Gujranwala Chamber of Commerce and Industry - -
19
Industrial Sector * Capacity Utilization in Percentage Cross tabulation
Capacity Utilization in Percentage
Total
100% 50%
Below
80% 80% 90%
Pottery
Count 11 0 1 1 1 14
% Within Industrial Sector 78.6% .0% 7.1% 7.1% 7.1%
100.0
%
% Within Capacity
Utilization in Percentage 42.3% .0% 9.1%
33.3
% 50.0% 32.6%
% Of Total 25.6% .0% 2.3% 2.3% 2.3% 32.6%
Refractories
Count 1 0 0 0 1 2
% Within Industrial Sector 50.0% .0% .0% .0% 50.0%
100.0
%
% Within Capacity
Utilization in Percentage 3.8% .0% .0% .0% 50.0% 4.7%
% Of Total 2.3% .0% .0% .0% 2.3% 4.7%
Ceramic
sanitary
Count 14 1 10 2 0 27
% Within Industrial Sector 51.9% 3.7% 37.0% 7.4% .0%
100.0
%
% Within Capacity
Utilization in Percentage 53.8%
100.
0% 90.9%
66.7
% .0% 62.8%
% Of Total 32.6% 2.3% 23.3% 4.7% .0% 62.8%
Total
Count 26 1 11 3 2 43
% Within Industrial Sector 60.5% 2.3% 25.6% 7.0% 4.7%
100.0
%
% Within Capacity
Utilization in Percentage
100.0
%
100.
0% 100.0%
100.
0%
100.0
%
100.0
%
% Of Total 60.5% 2.3% 25.6% 7.0% 4.7%
100.0
%

Ceramic Cluster Study
R&D Cell (File no. cs-0-rd-08) Gujranwala Chamber of Commerce and Industry - -
20
Establishment of Units:
Certain peaks were observed while analyzing the number of units established in previous
years. In 1980there were only 12% of the current units but another peak is observed
during 1992 and 1995 where 28% of the total no. Of units were established. Number of
new units establishing every year is decreasing as a result of acute shortage of skilled
labor. There is a need to observe the factors that played an important role in the
formation of peaks in the establishment. The table and graph below illustrate the
situation.
pottery refractories ceramic sanitary
Industrial Sector
0
20
40
60
80
100
Percent
Capacity Utilization in Percentage
100%50%below 80%80%90%

Ceramic Cluster Study
R&D Cell (File no. cs-0-rd-08) Gujranwala Chamber of Commerce and Industry - -
21
19601980
19831985
19881990
19911992
19951999
20002002
20032005
20062007
2008
Year of Establishment
0
5
10
15
20
Percent
Year of Establishment

Ceramic Cluster Study
R&D Cell (File no. cs-0-rd-08) Gujranwala Chamber of Commerce and Industry - -
22
Valid Percent
Cumulative Percent
1960 2.3 2.3 1980 11.6 14.0 1983 2.3 16.3 1985 2.3 18.6 1988 2.3 20.9 1990 2.3 23.3 1991 2.3 25.6 1992 11.6 37.2 1995 16.3 53.5 1999 4.7 58.1 2000 11.6 69.8 2002 2.3 72.1 2003 2.3 74.4 2005 9.3 83.7 2006 7.0 90.7 2007 7.0 97.7 2008 2.3 100.0 Total 100.0
Legal status of organization
60% of industries are registered as sole proprietors; remaining 35% are working on
Partnership basis while only 4 manufacturing units are registered as companies. If we
look at the results sector wise in Exhibit B we find that in Pottery sector no unit is
registered as company but 36% of the units are registered as Partnership firms and
remaining 64% are working as sole proprietors. In Refractories sector 50% units are
registered as Pvt. Ltd. Companies while the remaining 50% are working as sole
proprietors. If we look at the ceramics sanitary sector, only 4% units are companies while
37% are working on Partnership basis and the remaining 59% established and operational
as sole proprietors.

Ceramic Cluster Study
R&D Cell (File no. cs-0-rd-08) Gujranwala Chamber of Commerce and Industry - -
23
pottery refractories ceramic sanitary
Industrial Sector
0
10
20
30
40
50
60
70
Percent
Legal status of orzanizationCompanyPartnershipSole proprietorship
Valid
Percent
Cumulative
Percent
Company 4.7 4.7
Partnership 34.9 39.5
Sole proprietorship 60.5 100.0
Total 100.0

Ceramic Cluster Study
R&D Cell (File no. cs-0-rd-08) Gujranwala Chamber of Commerce and Industry - -
24
Cross Tabulation: Legal status vs. Industrial Sector
Industrial Sector Total
Pottery Refractories Ceramic
sanitary
Company
Count 0 1 1 2
% Within Legal status of organization .0% 50.0% 50.0% 100.0%
% Within Industrial Sector .0% 50.0% 3.7% 4.7%
% Of Total .0% 2.3% 2.3% 4.7%
Partnership
Count 5 0 10 15
% Within Legal status of organization 33.3% .0% 66.7% 100.0%
% Within Industrial Sector 35.7% .0% 37.0% 34.9%
% Of Total 11.6% .0% 23.3% 34.9%
Sole
proprietorship
Count 9 1 16 26
% Within Legal status of organization 34.6% 3.8% 61.5% 100.0%
% Within Industrial Sector 64.3% 50.0% 59.3% 60.5%
% Of Total 20.9% 2.3% 37.2% 60.5%
Total Count 14 2 27 43
% Within Legal status of organization 32.6% 4.7% 62.8% 100.0%
% Within Industrial Sector 100.0% 100.0% 100.0% 100.0%
% Of Total 32.6% 4.7% 62.8% 100.0%

Ceramic Cluster Study
R&D Cell (File no. cs-0-rd-08) Gujranwala Chamber of Commerce and Industry - -
25
Ratio of Male and Female Workers:
As per the results of survey the ratio male and female workers is 90:10. We visited 40
units where 1424 workers were working and out of them 1287 are males whereas 137 are
females. The range of workers in these units is from 5 to 100 per unit.
Proportion of Direct and Indirect Labor
Products being manufactured and sold:
Our analysis shows that 82% of the industrial units have concentrated their production on
7 product categories that are made and sold by every ceramic sanitary manufacturer these
products have become commodities and the prices of theses 7 product categories are very
competitive. These 7 products include following:
1. Commode Tank
2. Wash Basin and wash stand
3. Pedestal
4. P trap
Direct Labor 12000
Indirect Labor 20000

Ceramic Cluster Study
R&D Cell (File no. cs-0-rd-08) Gujranwala Chamber of Commerce and Industry - -
26
5. Toilet Combination
6. One piece Toilet
Products Frequency Percent Valid
Percent
Cumulative
Percent
4 2 4.7 4.7 4.7
5 14 32.6 32.6 37.2
6 14 32.6 32.6 69.8
7 9 20.9 20.9 90.7
8 2 4.7 4.7 95.3
10 1 2.3 2.3 97.7
20 1 2.3 2.3 100.0
Total 43 100.0 100.0

Ceramic Cluster Study
R&D Cell (File no. cs-0-rd-08) Gujranwala Chamber of Commerce and Industry - -
27
Distribution Channel:
The distribution channel in ceramic industry is composed of dealers and retailers. In
ceramic sanitary 78% firms are selling their products to dealers and retailers while 22%
are selling only to retailers and don’t have any dealer in their distribution channel. In
pottery sector 64% firms have a combination of dealers and retailers while 36% comprise
only retailers and shopkeepers. In refractories the distribution channel is composed of
dealers and contractors and the sales depend upon personal links with contractors.
Individual firms that require firebricks in large quantities contact with manufacturers
directly.

Ceramic Cluster Study
R&D Cell (File no. cs-0-rd-08) Gujranwala Chamber of Commerce and Industry - -
28
Cross Tabulation: Industrial Sector and Distribution
Industrial Sector Total
Pottery Refractories Ceramic
sanitary
Dealers and
Retailers
Count 9 2 21 32
% Within Customers 28.1% 6.3% 65.6% 100.0%
% Within Industrial Sector 64.3% 100.0% 77.8% 74.4%
% Of Total 20.9% 4.7% 48.8% 74.4%
Retailers
Count 5 0 6 11
% Within Customers 45.5% .0% 54.5% 100.0%
% Within Industrial Sector 35.7% .0% 22.2% 25.6%
% Of Total 11.6% .0% 14.0% 25.6%
Total Count 14 2 27 43
% Within Customers 32.6% 4.7% 62.8% 100.0%
% Within Industrial Sector 100.0% 100.0% 100.0% 100.0%
% Of Total 32.6% 4.7% 62.8% 100.0%

Ceramic Cluster Study
R&D Cell (File no. cs-0-rd-08) Gujranwala Chamber of Commerce and Industry - -
29
Suppliers of Raw Material:
Our analysis shows that 81% of the manufacturers buy domestic raw material. These
come from areas like Mianwali, Attock, Mansehra, Swat, Jackobabad and different areas
of southern Punjab and Sindh. 11% manufacturers directly import some of the materials
from china whereas where as 7% manufacturers buy imported raw material from dealers.
Frequenc
y Percent
Valid
Percent
Cumulative
Percent
Valid Imported
via Dealer 3 7.0 7.0 7.0
Imported
directly 5 11.6 11.6 18.6
With in
Pakistan 35 81.4 81.4 100.0
Total 43 100.0 100.0

Ceramic Cluster Study
R&D Cell (File no. cs-0-rd-08) Gujranwala Chamber of Commerce and Industry - -
30
On the basis of our research study we have done the following SWOT analysis.
SWOT Analysis
The following SWOT analysis captures the key strengths and weaknesses within the
Industry, and describes the opportunities and threats being faced.
Strengths
• High Demand.
• Low cost labor.
• High capacity Utilization
• No. Entry Barriers.
• Competitive Product prices.
• Local Raw Material.
• LMM (Local Manufactured Machinery).
Weaknesses
• Low Brand Awareness.
• Old Technology.
• No R&D for product development.
• A limited marketing budget.
• Limited Distribution.
• Lack of skilled labor and human resources.
Opportunities
• Large Export Potential in foreign markets.
• New product development.

Ceramic Cluster Study
R&D Cell (File no. cs-0-rd-08) Gujranwala Chamber of Commerce and Industry - -
31
• Capacity building.
• Participating in a market niche that is growing at a faster rate than the larger
general ceramics market.
• The ability to increase operating efficiencies.
Threats
• Quality control problems with the raw materials that affect the final product.
• Low price Import from China.
• Large surplus capacity in international market.
• Changing consumer preferences.

Ceramic Cluster Study
R&D Cell (File no. cs-0-rd-08) Gujranwala Chamber of Commerce and Industry - -
32
External Factor Evaluation (EFE)
Opportunities & Threats Weights Rank Weighted Score
Opportunities: Large Export Potential in foreign markets 0.15 2 0.3 New product development. 0.12 2 0.24 Capacity building 0.15 3 0.45 Participation in untapped market 0.05 2 0.1 The ability to increase operating efficiencies 0.1 2 0.2 Threats: Quality control problems with the raw materials 0.05 1 0.05 Import from China 0.15 2 0.3 Large surplus capacity in international market 0.15 1 0.15 Changing consumer preferences 0.08 2 0.16 1 1.96
Internal Factor Evaluation (IFE)
Strengths & Weaknesses Weights Rank Weighted Score
Strengths: High Demand 0.1 4 0.4 Low cost labor 0.08 4 0.32 High capacity Utilization 0.05 4 0.2 No. Entry Barriers 0.05 3 0.15 Competitive Product prices 0.08 4 0.32 Weaknesses: Low Brand Awareness 0.1 2 0.2 Old Technology 0.1 2 0.2 No R&D for product development 0.15 2 0.3 A limited marketing budget 0.1 2 0.2 Limited Distribution 0.09 3 0.27 Lack of skilled labor and human resources 0.1 2 0.2 1 2.76

Ceramic Cluster Study
R&D Cell (File no. cs-0-rd-08) Gujranwala Chamber of Commerce and Industry - -
33
SPACE Matrix:
Internal Strategic Position Ratings Financial Strengths (FS) Return on Investment 4 Liquidity 2 Working Capital 5 Cash Flow 4 Risk involved in the business 3 18 Competitive Analysis (CA) Market share -1 Product quality -3 Product life cycle -2 Customer loyalty -4 Competitors capacity utilization -2 Technological know how -4 Control over suppliers & distributors -5 -21
External Strategic Position Ratings Environmental Stability (ES) Technological changes -4 Rate of Inflation -5 Demand variability -1 Price range of competing products -2 Barriers to entry into market -2 Competitive pressure -5 Price elasticity of demand -2 -21 Industry strengths (IS) Growth potential 5 Profit potential 4 Financial stability 4 Technological know-how 2 Resources utilization 4 Capital Inventory 4 Ease of entry into market 5 Productivity, capacity utilization 5 33

Ceramic Cluster Study
R&D Cell (File no. cs-0-rd-08) Gujranwala Chamber of Commerce and Industry - -
34
The IE Matrix
1
2
3
4
1234
Total weighted IFE score
Tota
l wei
ghte
d EF
E sc
ore
company 1
Space matrix
0.6
-6-5-4-3-2-10123456
-6 -5 -4 -3 -2 -1 0 1 2 3 4 5 6
IS CA
ES
F
S
point

Ceramic Cluster Study
R&D Cell (File no. cs-0-rd-08) Gujranwala Chamber of Commerce and Industry - -
35

Ceramic Cluster Study
R&D Cell (File no. cs-0-rd-08) Gujranwala Chamber of Commerce and Industry - -
36
QSPM
Market Development Product
Development
Opportunities & Threats Weights
AS TAS AS TAS Opportunities:
Large Export Potential in foreign markets 0.15 4 0.6 2 0.3
New product development. 0.12 2 0.24 4 0.48
Capacity building 0.15 3 0.45 3 0.45
Participation in a untapped market 0.05 4 0.2 2 0.1
The ability to increase operating efficiencies 0.1 3 0.3 3 0.3 0 0 Threats: Quality control problems with the raw materials 0.05 2 0.1 2 0.1
Import from China 0.15 2 0.3 3 0.45
Large surplus capacity in international market 0.15 1 0.15 2 0.3
Changing consumer preferences 0.08 2 0.16 3 0.24 0 0
Strengths & Weaknesses Weights AS TAS AS TAS
Strengths: High Demand 0.1 4 0.4 4 0.4 Low cost labor 0.08 3 0.24 3 0.24 High capacity Utilization 0.05 2 0.1 2 0.1 No. Entry Barriers 0.05 4 0.2 3 0.15 Competitive Product prices 0.08 4 0.32 4 0.32 Weaknesses: Low Brand Awareness 0.1 2 0.2 3 0.3 Old Technology 0.1 2 0.2 1 0.1 No R&D for product development 0.15 2 0.3 2 0.3 A limited marketing budget 0.1 2 0.2 1 0.1 Limited Distribution 0.09 4 0.36 3 0.27 Lack of skilled labor and human resources 0.1 2 0.2 2 0.2 0 0 1 5.22 5.20

Ceramic Cluster Study
R&D Cell (File no. cs-0-rd-08) Gujranwala Chamber of Commerce and Industry - -
37
The EFE score of 1.96 indicates that the industry is not equipped to response the
challenges of external environment i.e. the opportunities and threats. The average score
should be not less then 2.50 for a company that is performing well respect to external
environmental factors.
On the other hand the IFE score of 2.76 depicts that the industry is slightly above average
with respect to utilizing its strengths and covering its weaknesses. Although there are
areas that need improvement but with respect to external position of the industry the
internal position is more focused by the industry.
The IE Matrix results indicate that the industry falls in the 5th quadrant that constitutes the
position indicating industry to hold and maintain their business. Such business units will
beat their profit targets easily; their management has an easy job and is often praised
anyhow.
The current industry is on maturity stage and is characterized by saturated market, large
number of competitors, there’s a well-established customer base, market share is stable,
and energy is being put toward differentiating from competitors.
Industry Lifecycle Stage
Ceramic Cluster Study
R&D Cell (File no. cs-0-rd-08) Gujranwala Chamber of Commerce and Industry - -
38
The current situation as appears from the above graph indicates that the market is mature
and the competition is high and in order to avoid competition from getting worse the
industry has to adopt the strategy of either market development or product development.
Strategic Position & Action Evaluation (SPACE) Matrix is another management tool
used to help analyze this industry. The SPACE Matrix is broken down into four
quadrants as being aggressive, conservative, defensive, and competitive. Additionally, the
SPACE Matrix analysis functions upon two internal strategic dimensions that are
financial strength (FS) and competitive advantage (CA). Besides, the SPACE Matrix
methodology also studies two business’ external strategic dimensions such as
environmental stability (ES) and industry strength (IS). The CA (values from -1 to -6)
and IS (values from +1 to +6) are representing by the X-axis of the Cartesian graph
whereas the FS (values from +1 to +6) and ES (values from -1 to -6) are representing by
Y-axis. After drawing these SPACE matrix graph, the overall strategic positioning of a
company can be determined.
According to the graph above, we noticed that ceramic sanitary industry falls into
aggressive quadrant of the SPACE Matrix. It is located at the coordinates of 1.125 for x-
component and a y –component of 0.06. It shows that ceramic sanitary has a strong
competitive position in the market with rapid growth. It also indicates that ceramic
sanitary should adopt an aggressive strategy. It needs to use its internal strengths to
develop a market development strategy. Other possible strategies include product
development, integration with other ceramic units to achieve economies of scale and
eradicate local competition so that they can focus on market development.

Ceramic Cluster Study
R&D Cell (File no. cs-0-rd-08) Gujranwala Chamber of Commerce and Industry - -
39
QSPM Score:
In order to evaluate the strategy best suited for the industry we used quantitative strategy
profiling matrix. The two narrowed down strategies we suggested for the industry are
1. Market Development.
2. Product Development.
We evaluated both of these strategies by assigning them an attractiveness score on the
basis of their ability to help utilize existing strengths, capitalize on opportunities and
deter the threats that the industry is facing. The total attractiveness score for market
development and product development is close i.e. 5.22 & 5.20 respectively but e suggest
and prefer the market development strategy because it is more inline with the current
resources of the company and will require less investment in terms of technological up
gradation and investment in assets require for product development. Although product
development is also a lucrative strategy in long run and can provide a company a critical
competitive advantage in terms of its ability for new product development. Market
development can provide more sales and strong foothold for future in new markets.
The individual industrial units can adopt these suggested strategies by keeping in view
their own resources and capabilities. The industrial units having good marketing
capabilities and can explore new frontiers should definitely go for market development
with existing product lines. The industrial units that have the ability to invest further into
assets and operations should go for product development because this will provide them
access to untapped segments in the existing markets, give them an early mover advantage
and will provide a strong base for future growth.

Ceramic Cluster Study
R&D Cell (File no. cs-0-rd-08) Gujranwala Chamber of Commerce and Industry - -
40
Suggestions and Recommendations:
Gujranwala ceramic sanitary ‘s high reputation helps in attracting customers.
The industry should develop new markets, currently they are targeting Middle
East and Eastern Europe but other overseas markets are yet to be explored e.g.
Africa.
They should expand their products.
Eliminate inefficiencies and improve quality.
Seek Integration Opportunities such as merger and acquiring other existing
ceramic units in different areas
Seek new and good management staff to get a better company direction
Banks should give loans for the installation of new plants at low rates of interests.
Ministry of industry should give importance to this sector because the largest
cluster of ceramic industry is in Gujranwala and not only catering the demand of
country but also export the items to different countries and earns valuable foreign
exchange.
Training institutions should be established to give training about state of the art
technology and so that new skilled workforce can be produced.
Brand awareness programs should be started to give awareness to the consumers
about quality products. Currently the consumer is unaware of the brands and their
quality and relies totally on the suggestions of dealers or shopkeepers who
manipulates the buying decision of the consumer in their favor. If any industrial
unit launches brand awareness program then it can create a pull from consumers
and reduce dependency on the retailer.
TDAP should arrange expos for sanitary ceramic manufacturers and they should
be helped to explore new markets. Currently this sector is not receiving enough
attention from TDAP. If provided support from the government on the marketing
side, the export will increase manifold from this sector.

Ceramic Cluster Study
R&D Cell (File no. cs-0-rd-08) Gujranwala Chamber of Commerce and Industry - -
41
Lack of reliance on banks or financial institutions by this sector the investment
required for technology up gradation will be a bottle neck and may jeopardize the
technology transfer process. Therefore it is necessary that incentives should be
given to industry that will help in rapid technology up gradation. Such incentives
may include reduction in the duty of imported machinery for ceramic sanitary
ware and financial assistance in the form of soft loans for machinery up gradation
and capacity building.
This sector needs government support especially on the financial side and
therefore we request that state bank should take initiative and develop such
policies that can help the industry grow and expand. We urge for special soft
loans for technology up gradation, new machinery installation, infrastructure
development and marketing for the ceramic sanitary ware manufacturers so that
they can meet the requirements of changing competitive landscape in foreign
markets and export their products successfully.
Cooperation should be developed between NPO and ceramic industry backed by
Ministry of Commerce and Industry so that areas of productivity deficiencies can
be identified and consultants should be provided by the NPO so that they can help
in identifying the technology requirements of interested industry holders on
customized basis.
Regular Supply of Gas is yet another major issue faced by the industry. Long
interruptions especially during winter season not only interrupts production but
also affect the product quality of the batch that is in the kiln. So it is urged that the
supply of Gas be insured. One suggestion in this regard is that SNGPL provide
regular supply as it is providing to Textile and Tiles sector, similar arrangements
can be made with ceramic sanitary sector as well.

Ceramic Cluster Study
R&D Cell (File no. cs-0-rd-08) Gujranwala Chamber of Commerce and Industry - -
42
Limitations: There were certain limitations in the research.
Poor response rate of the respondents. Reluctance to disclose financial information. Some of the owners and managers had no proper idea of installed capacity and
they considered their actual production as their installed capacity. Although the ceramic sector comprises of 5 categories or segment but due to
resource constraint this research cover only ceramic sanitary ware. Assumptions: Following assumptions made in this research before deciding the sampling method.
All the factories are employing similar technology and manufacturing procedures are also same*.
It is assumed that all the factories that are not covered in this survey have similar capacity as that of the factories covered.
*We have not challenged the resource-based view by stating that all firms in this sector
are same, they may be same in technology and manufacturing but yet they may differ in
human capital, marketing or other business operations.

Ceramic Cluster Study
R&D Cell (File no. cs-0-rd-08) Gujranwala Chamber of Commerce and Industry - -
43
Appendix-A
Organization’s Profile
Industry
Name of organization
Address
Contact no. Fax
Website E-mail
Legal Status Sole proprietorship Partnership firm Company
In case of partnership, no. of partners
Year of Establishment
Initial Investment (Rs)
Member of GCCI Yes No
Product Mix
1. 2. 3. 4.
5. 6. 7. 8.
Installed capacity in Units
Capacity Utilization in Units
Machinery
Local Imported

Ceramic Cluster Study
R&D Cell (File no. cs-0-rd-08) Gujranwala Chamber of Commerce and Industry - -
44
Production per year in units
2002 2003 2004 2005 2006 2007
Sales per Year in % of Production.
2002 2003 2004 2005 2006 2007
Please specify your area of distribution (no. of cities/provinces/countries)*
Cities Provinces Countries
* Please write their names on page no. 4
No. Of Employees
Male
Female
Suppliers of Raw Material
Local (within GRW) Local (from other cities) International
End users
Individuals Firms
ISO Certified Yes No

Ceramic Cluster Study
R&D Cell (File no. cs-0-rd-08) Gujranwala Chamber of Commerce and Industry - -
45
Contact Person
Name
Status/Designation
Phone No. Mobile
E-mail Fax

Ceramic Cluster Study
R&D Cell (File no. cs-0-rd-08) Gujranwala Chamber of Commerce and Industry - -
46
Serial No. City Province Country
1
2
3
4
5
6
7
8
9
10
11
12
13
14
15
16
17
18
19
20

Ceramic Cluster Study
R&D Cell (File no. cs-0-rd-08) Gujranwala Chamber of Commerce and Industry - -
47
Serial No. Product Name
1
2
3
4
5
6
7
8
9
10
11
12
13
14
15
16
17
18
19
20

Ceramic Cluster Study
R&D Cell (File no. cs-0-rd-08) Gujranwala Chamber of Commerce and Industry - -
48
Appendix-B
Total production capacity of 27 factories of sanitary ceramics is 16550 units per day whereas the capacity utilization of these units is 13750 units per day. It means that the ceramic sanitary units achieve 83% capacity utilization.
Total capacity of units
surveyed
Capacity Utilization
of units surveyed
% Of capacity
utilization
Per unit capacity/day
Per unit production
capacity/day
16550 13750 83% 613 509
As per our analysis every manufacturing unit can produce 613 units per day on average basis whereas 509 units are produced in each manufacturing unit. On the basis of this data we can calculate the per year production of all the ceramic units in Gujranwala. There are 60 manufacturing units of sanitary ceramics and if we take their average production as 500 pieces per day, it means that 30000 pieces are produced daily and the annual production turns out to be 10.8 million per year (360 days). This gives us a considerable idea of the production of Gujranwala ceramic sanitary sector and since there are very low finished good inventory, it is assumed that all the manufactured pieces are sold which in turn gives the figure of annual demand met by this city.

Ceramic Cluster Study
R&D Cell (File no. cs-0-rd-08) Gujranwala Chamber of Commerce and Industry - -
49
References: Cluster profile ceramics (SMEDA) www.smeda.org.pk All Pakistan Ceramic Manufacturers Association