clustering visualization filemaking sense of gene expression data clustering visualization!...
TRANSCRIPT

Making sense of gene expression data
Clustering
Visualization
→ Discrimination
Dirk HusmeierBiomathematics & Statistics Scotland (BioSS)
JCMB, The King’s Buildings, Edinburgh EH9 3JZ, UKhttp://www.bioss.ac.uk/∼dirk

Typical application:
• Predict tumour type or survivial time for agiven gene expression profile.
• Learn a predictive model from a training setof gene expression profiles plus target values(tumour class or survival time).

Linear models
Examples:
• Fisher linear discriminant analysis
• Linear maximum likelihood models
• Linear perceptrons

Non-linear models
Examples:
• Classification and regression trees (CART)
• Support vector machines
• Neural networks

Linear versus non-linear models
Linear models Non-linear models
Advantage ? ?Shortcoming ? ?

Linear versus non-linear models
Linear models Non-linear models
Advantage Training simple
and robust
Shortcoming biased

Linear versus non-linear models
Linear models Non-linear models
Advantage Training simple unbiased
and robust
Training complex:
Shortcoming biased heuristic tuning parameters,
risk of over-fitting

..
..

..
..

..
..

..
..

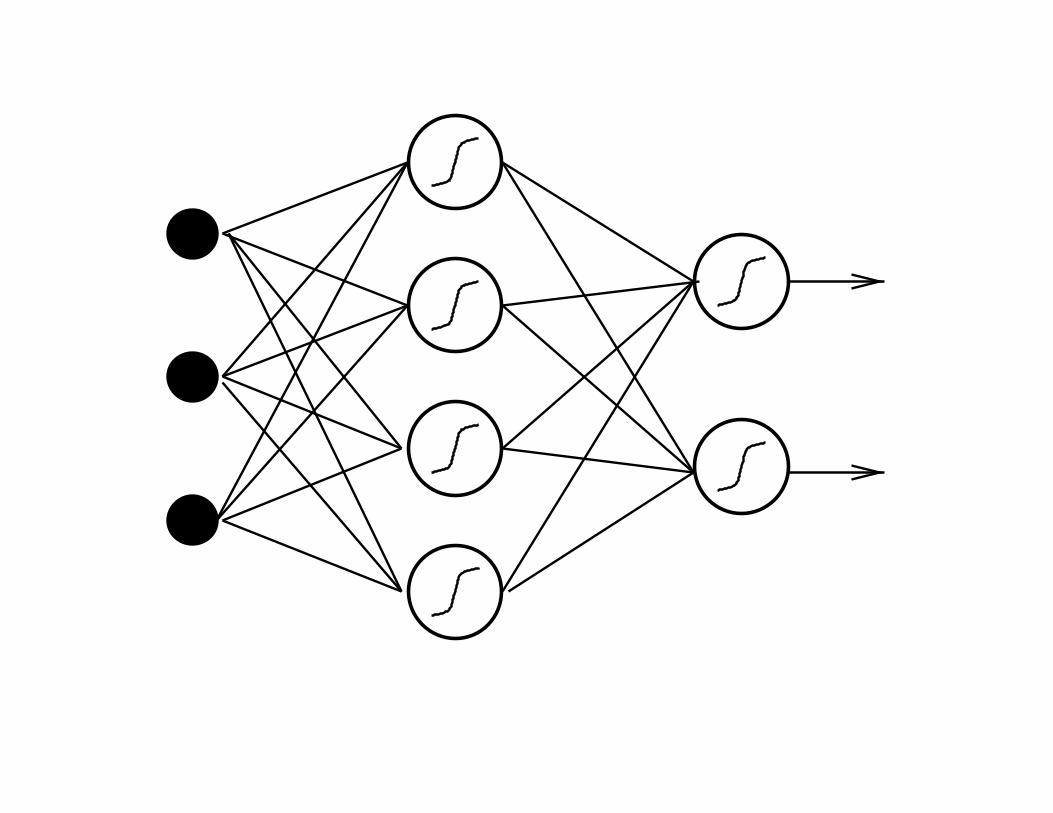
Example of training non-linear models:
Neural networks

Intron
Exon
DNA
SEQU
CE
EN

SEQU
CE
EN
PROTE
NI
Helix
Sheet
Coil

ROAR
Y
RA
CIM Tumour
benign
Tumourmalignant


RED
CT
ON
P
I
I

E
R
R
O
R

• The “knowledge” of a neural networks resides in the
weights.
• Training: gradient descent on the error surface.

• The “knowledge” of a neural networks resides in the
weights.
• Training: gradient descent on the error surface.
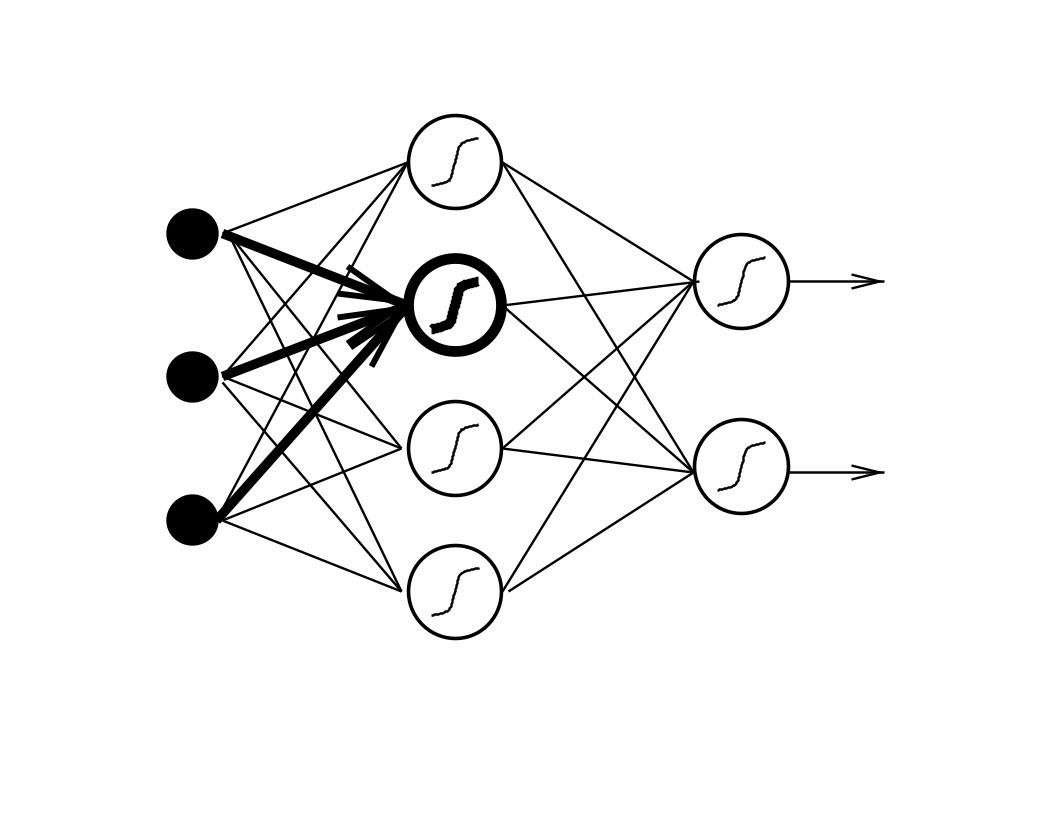
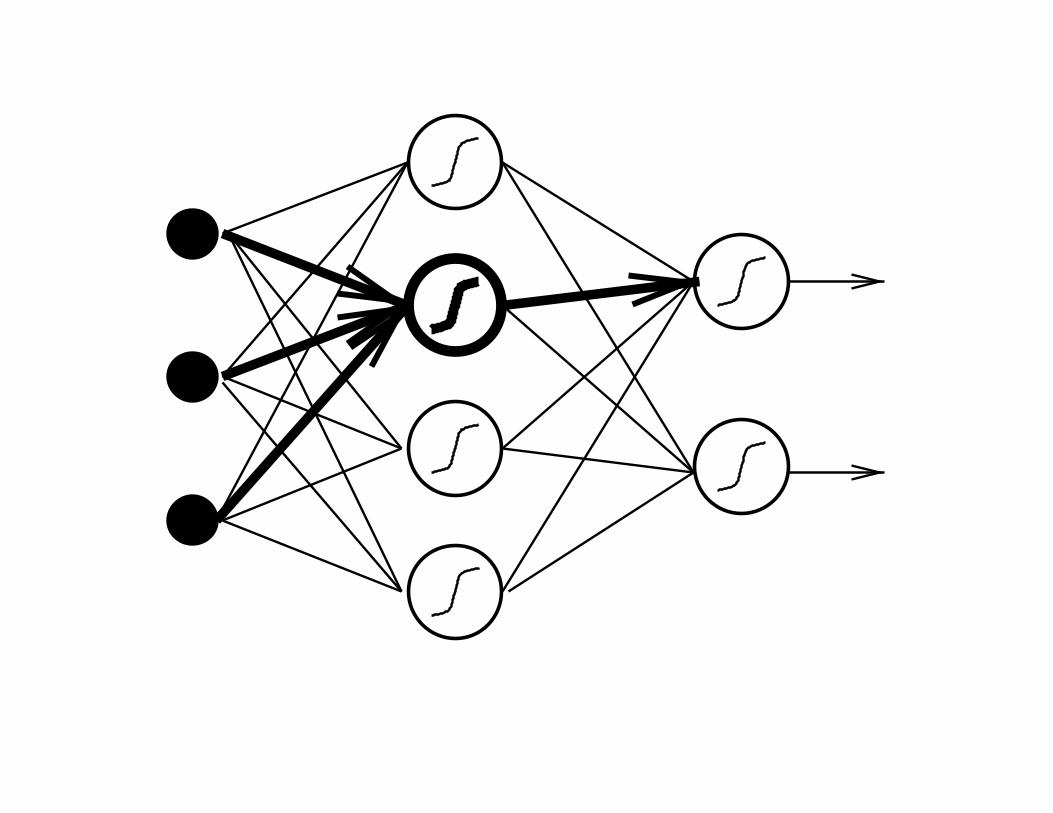
• This leads to the generalized Hebb rule for adapting the
weights:
• Weight change = learning rate * activity of parent node
* error of child node.
• Errors of internal nodes are obtained by
backpropagation.

E
R
R
O
R

E
R
R
O
R

Weight change=
learning rate×
activity of parent node×
error of child node


Before training


After training


Training steps
Error

Training steps
Error
Training error

Training steps
Error
Training error
Test error

Error
Training error
Test error
Training steps

..
..

Error
Training error
Test error
Training steps

..
..

Training steps
Error
Training error
Test error

..
..

Training steps
Error
Training error
Test error

..
..

How can we guard against overfitting?

How can we guard against overfitting?
Split the data into a training set and acrossvalidation set. Use the latter for monitoringthe generalization performance. When over-fitting sets in, stop the training process.

How can we guard against overfitting?
Split the data into a training set and acrossvalidation set. Use the latter for monitoringthe generalization performance. When over-fitting sets in, stop the training process.
What is the shortcoming of this approach?

How can we guard against overfitting?
Split the data into a training set and acrossvalidation set. Use the latter for monitoringthe generalization performance. When over-fitting sets in, stop the training process.
What is the shortcoming of this approach?
Crossvalidation sacrifices a large proportion ofdata, which are no longer available for training.This deteriorates the training efficiency.

N-fold crossvalidation

Training set Monitoring set.
.
.
.

.
.
.
.
Monitoring setTraining set
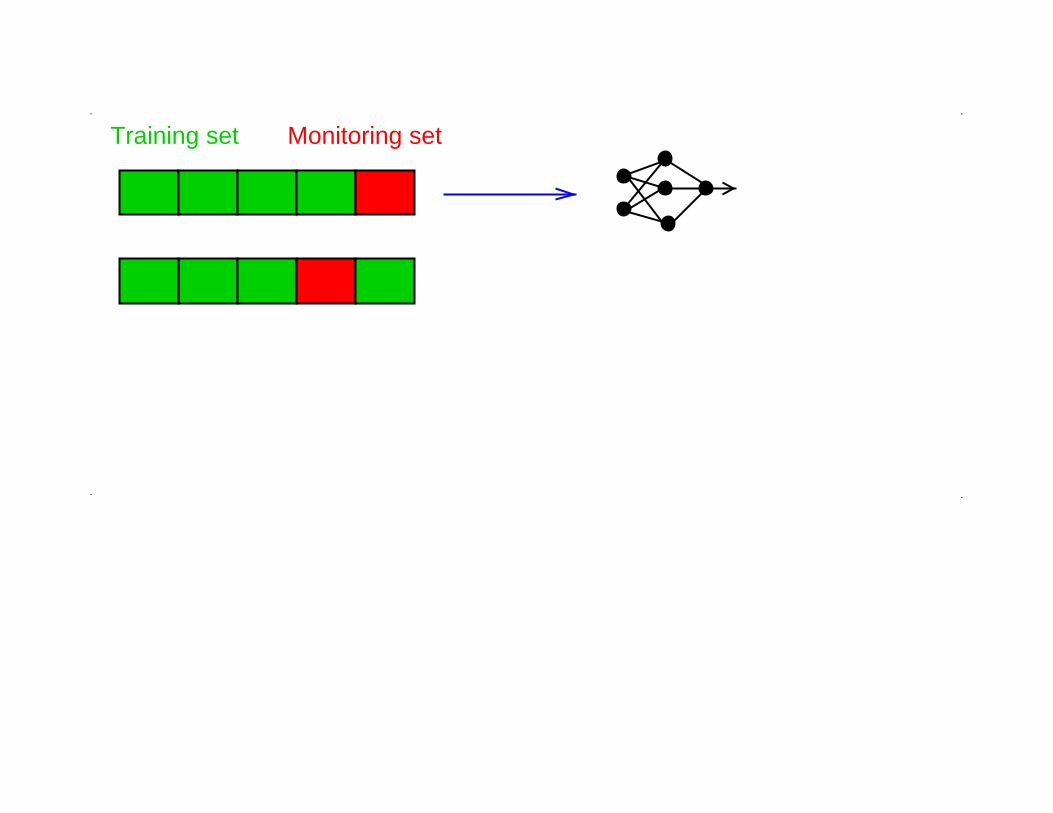
Training set Monitoring set.
.
.
.

Training set Monitoring set.
.
.
.

.
.
.
.
Monitoring setTraining set
..
.

.
.
.
.
Monitoring setTraining set
or votepredictionAveraged
..
.

Classification and diagnostic prediction ofcancer using gene expression profiling and
artificial neural networks
Khan et al. (2001)
Nature Medicine 7(6), 673-679

• Small, round blue cell tumours (SRBCT)
• Four sub-classes:
– Neuroblastoma (NB)
– Rhabdomyosarcoma (RMS)
– Non-Hodkin lymphoma (NHL)
– Ewing family of tumours (EWS)

• Small, round blue cell tumours (SRBCT)
• Four sub-classes:
– Neuroblastoma (NB)
– Rhabdomyosarcoma (RMS)
– Non-Hodkin lymphoma (NHL)
– Ewing family of tumours (EWS)
• Accurate diagnostic essential → Treatment options, responses to
therapy and prognoses vary widely.
• Currently, no single test (light microscopy, immunohistochemistry,
etc.) can precisely distinguish these cancers.

• Khan et al. discuss the classification of these tumours with neural
networks on the basis of gene-expression profiling using cDNA
microarrays.
• 2308 genes, 63 training examples, 25 test cases.

• Khan et al. discuss the classification of these tumours with neural
networks on the basis of gene-expression profiling using cDNA
microarrays.
• 2308 genes, 63 training examples, 25 test cases.
• How can you reduce the complexity of the input space?

• Khan et al. discuss the classification of these tumours with neural
networks on the basis of gene-expression profiling using cDNA
microarrays.
• 2308 genes, 63 training examples, 25 test cases.
• How can you reduce the complexity of the input space?
• PCA: 10 leading principal components.

• Khan et al. discuss the classification of these tumours with neural
networks on the basis of gene-expression profiling using cDNA
microarrays.
• 2308 genes, 63 training examples, 25 test cases.
• How can you reduce the complexity of the input space?
• PCA: 10 leading principal components.
• Correct classification of all samples in the test set.
• Identification of genes most relevant to the classification.

Summary

Machine learning.
.
.
.

Supervised
Machine learning
Unsupervised
.
.
.
.

.
.
.
.
Unsupervised
Machine learning
Linear
discriminant analysis)(e.g. Fisher linear
networks)
(e.g. neural Non-linear
Supervised

.
.
.
.
ClusteringVisualization
Supervised
Non-linear(e.g. neural
networks)(e.g. Fisher lineardiscriminant analysis)
Linear
Machine learning
Unsupervised

Clustering
.
Non-linear
(e.g. SOM, GTM)
.
.
.
(e.g. PCA)
Supervised
Non-linear(e.g. neural
networks)(e.g. Fisher lineardiscriminant analysis)
Linear
Machine learning
Unsupervised
Visualization
Linear

Partitive(e.g. K-means)
Hierarchical
.
Non-linear
(e.g. SOM, GTM)
.
.
.
Supervised
Non-linear(e.g. neural
networks)(e.g. Fisher lineardiscriminant analysis)
Linear
Machine learning
Unsupervised
Visualization
Linear
(e.g. PCA)
Clustering

(e.g. BTSVQ)
Visualization
Linear
(e.g. PCA)
.
Non-linear
(e.g. SOM, GTM)
.
.
.
top-down
Supervised
Non-linear(e.g. neural
networks)(e.g. Fisher lineardiscriminant analysis)
Linear
Machine learning
Unsupervised
Clustering
Partitive(e.g. K-means)
Hierarchical
agglomerativeor bottom-up
(e.g. UPGMA)
divisive or